the Creative Commons Attribution 4.0 License.
the Creative Commons Attribution 4.0 License.
Influence of emission size distribution and nucleation on number concentrations over Greater Paris
Youngseob Kim
Florian Couvidat
Maik Merkel
Tuukka Petäjä
Jean Sciare
Alfred Wiedensohler
With the growing evidence that high particle number concentrations may impact health, modelling their emissions and understanding formation processes is necessary, especially in cities where many people are exposed. As emission inventories of particle numbers and size distribution over cities are usually not available, a methodology is defined to estimate them from PM2.5 emissions and ratios of PM1 PM2.5 and PM0.1 PM2.5 by activity sector. In this methodology, a fitting parameter αem is used to redistribute the number concentrations in the lowest emission diameter range. This parameter is chosen by comparing measured and simulated number concentrations during non-nucleation days. The emission size distribution is then finely discretised by conserving both mass and number in each of the size ranges where emissions are specified. The methodology is applied over Greater Paris during the MEGAPOLI campaign (July 2009). Three-dimensional simulations are performed using the chemistry transport model Polair3D/Polyphemus coupled to the aerosol module SSH-aerosol to represent the evolution of particles by condensation, evaporation, coagulation, and nucleation, with a sectional approach for the size distribution. The model is first compared to measurements during non-nucleation days, and the influence over the month of July 2009 of three different nucleation parameterisations is assessed, i.e. binary (sulfuric acid, water), ternary (sulfuric acid, ammonia, water), and heteromolecular (extremely low-volatility organic compounds (ELVOCs) from monoterpenes and sulfuric acid). The modelled number concentrations compare very well to measurements, with an average normalised mean error of 42 % for the daily number concentrations of particles larger than 10 nm and 37 % for the number concentrations of particles larger than 100 nm. The influence of the binary nucleation is low, and the ternary nucleation scheme leads to better simulated number concentrations (in terms of bias and error) at only one site out of three, but it systematically reduces the model to measurement correlation, suggesting that ternary nucleation may not be the dominant process in new particle formation. However, the relative bias and error, as well as the correlation at suburban sites, are systematically improved using the heteromolecular nucleation scheme involving sulfuric acid and ELVOCs from monoterpenes. This suggests that heteromolecular nucleation may be important in cities, especially at suburban sites in summer, and that a better characterisation of the emissions of ELVOC precursors from traffic is needed.
- Article
(3253 KB) - Full-text XML
- BibTeX
- EndNote
Although ongoing air quality regulations only apply to particle mass, the number of particles may also be a hazard to human health (Win-Shwe and Fujimaki, 2011; Kelly et al., 2011; Pascal et al., 2013; Downward et al., 2018; Rivas et al., 2021). For example, Oberdörster et al. (2005); Schraufnagel (2020) showed that particulate matter (PM) of diameters lower than 100 nm (PM0.1, also called ultra-fine particles, UFPs) are responsible for pulmonary inflammation. Because of their small sizes, they can translocate to all organs (Schraufnagel, 2020). Because the mass of UFPs is negligible, they contribute little to the total mass concentration of particles, but the number concentration of UFPs is high. Because current regulations govern the mass of particles of aerodynamic diameters lower than or equal to 10 µm (PM10) and 2.5 µm (PM2.5), UFPs are not regulated by those, and differences in maps of high mass and number concentrations have been reported (Ye et al., 2020).
Although most computational fluid dynamics and chemistry transport models have focused until very recently on accurately representing the mass of particles, modelling the number of particles has increasingly become the subject of these studies. At the local scale, the number of particles was modelled at the local exhaust outlet (Albriet et al., 2010; Xu et al., 2021) and in the plumes of ships (Karl et al., 2020), and at the neighbouring scale (Karl et al., 2016; Kurppa et al., 2020; Ketzel et al., 2021; Kumar et al., 2022) the large influence of nucleation and primary emissions from traffic was stressed. At the regional and global scales, chemistry transport models with model-to-measurement comparisons of number concentrations were performed in the United States (Jung et al., 2010; Zhang et al., 2010a; Kelly et al., 2011) and (more recently) in Europe (Kukkonen et al., 2016; Fountoukis et al., 2012; Patoulias et al., 2018; Fanourgakis et al., 2019; Olin et al., 2022; Patoulias and Pandis, 2022; Frohn et al., 2021). Only a few studies performed simulations over cities (Kukkonen et al., 2016; Frohn et al., 2021) and had poorer statistics than at the regional or global scale (Frohn et al., 2021).
The high number concentrations are largely due to UFPs (de Jesus et al., 2019). Although UFPs may undergo transport and may be formed away from the observation site (Cai et al., 2018), in cities the high particle number concentrations are thought to mostly originate from nucleation and traffic emissions in summer (Rivas et al., 2020; Casquero-Vera et al., 2022). These particles are difficult to represent because of uncertainties in their emission and in the nucleation process but also difficulties in modelling their growth mechanisms (Yu et al., 2019). Indeed, many of the modelling studies listed previously represent the size distribution using a log-normal approach with three to four modes (Zhang et al., 2010a; Kelly et al., 2011; Kukkonen et al., 2016; Fanourgakis et al., 2019). However, such a coarse discretisation of low-diameter particles induces large uncertainties in number concentrations (Sartelet et al., 2006; Blichner et al., 2021). Furthermore, Blichner et al. (2021) found that the aerosol number concentrations are better modelled compared to observations if a sectional scheme is used for low-diameter particles.
The emissions of particle numbers are highly uncertain, and they are usually not reported in emission inventories, such as the European emission inventory (EMEP/EEA, 2019) or city inventories. In the framework of the EUCAARI project, a number emission inventory was built over Europe by size-segregating PM mass emission for the different sectors (Kulmala et al., 2011). Most of the regional-scale studies presented above used this emission inventory (Fountoukis et al., 2012; Patoulias et al., 2018; Patoulias and Pandis, 2022) or an updated version (Olin et al., 2022). Although the number concentrations may be particularly high in cities, number emissions are difficult to estimate. Kukkonen et al. (2016) and Frohn et al. (2021) estimated number emissions from particle mass emissions for different anthropogenic sectors. These number emissions were then assigned to the Aitken mode of a modal size representation for 3D modelling. Such an approach is not appropriate for a sectional size representation where the aerosol dynamics are finely modelled. A methodology is needed to estimate particle number emissions and the size distribution at emission for city-scale inventories.
Not only are the primary emissions and size distributions at emission of UFPs highly uncertain, but their formation from gas-phase precursors (nucleation) and the emissions of low-volatility organic vapour, which may strongly influence the growth of UFPs (Patoulias and Pandis, 2022), is also uncertain. Okuljar et al. (2021) showed that particles smaller than 3 nm may largely be directly emitted by traffic, but this contribution may be low during nucleation episodes. Low-volatility organic vapours are also emitted by traffic, and depending on the distance from the source, they may be in the gas phase (at high temperature) or the condensed phase (after cooling to ambient temperature). The difficulty in accounting for the organic vapours in the emission inventory arises from the fact that they might already be partly included in PM2.5 (as organic carbon, Kim et al., 2016).
Nucleation is uncertain both in terms of the gas involved and their representation. Several parameterisations of binary nucleation (involving sulfuric acid and water) or ternary nucleation (involving sulfuric acid, ammonia, and water) exist. Zhang et al. (2010b) compared binary and ternary nucleation parameterisations and found differences of several orders of magnitude among the parameterised nucleation rates. Among the parameterisations tested, those with a simple power law to describe the binary nucleation of sulfuric acid (Sihto et al., 2006; Kuang et al., 2008) compared best to observed nucleation rates. Zhang et al. (2010b) reported that the commonly used binary parameterisations of Kulmala et al. (1998) and Vehkamäki et al. (2002) or the ternary parameterisations of Napari et al. (2002) and Merikanto et al. (2007), which are based on classical homogeneous nucleation models, overestimate the nucleation rate. Organic vapours, such as highly oxygenated organic molecules (HOMs), may also be involved in nucleation (Tröstl et al., 2016; Sulo et al., 2021). The large influence of the heteromolecular nucleation of sulfuric acid and organics has been underlined in a global modelling study (Zhu and Penner, 2019). However, the influence of heteromolecular nucleation was not assessed at the regional or city scale, where HOMs are believed to mostly contribute to the growth of nanoparticles (Patoulias and Pandis, 2022).
This paper aims to model the number of particles over Greater Paris during summer, first by defining a methodology to estimate primary number emissions, and second by estimating nucleation parameterisations that best represent measurements. The simulations are performed during the summer MEGAPOLI campaign. Section 2 presents the model and the measurement data. Section 3 defines a methodology to estimate the number emissions from the different emission sectors. Section 4 studies the influence of nucleation (binary, ternary and heteromolecular with organics) on the number concentration. The model with the different nucleation parameterisations is evaluated in Sect. 5 at several measurement sites for mass and number concentrations and size distribution. The conclusions are presented in Sect. 6.
2.1 The model
Simulations are performed with the three-dimensional (3D) chemistry transport model Polair3D (Sartelet et al., 2007) of the Polyphemus platform, which is coupled to the aerosol module SSH-aerosol (Sartelet et al., 2020). The gas-phase chemistry model is CB05, modified to represent the formation of semi-volatile organic compounds that may condense onto particles and form secondary organic aerosols (SOAs) (Kim et al., 2011; Chrit et al., 2017). The considered SOA precursors are anthropogenic (toluene, xylenes, intermediate and semi-volatile organic compounds) and biogenic (monoterpenes, sesquiterpenes, isoprene). The myriad of SOA species formed during the oxidation of those precursors is modelled with surrogate organic molecules of representative physico-chemical properties (Couvidat et al., 2012; Sartelet et al., 2020). Some of the surrogates may be considered non-volatile: the surrogate BiA3D (3-methyl-1,2,3-butane tricarboxylic acid) from the monoterpene oxidation, the surrogates monomer (C10H14O9) and dimer (C19H28O11) from the monoterpene autoxidation, the surrogate AnClP from the xylenes and low nitrous oxide toluene oxidation, and the surrogate SOAlP (secondary organic aerosol of low volatility) from the oxidation of anthropogenic semi-volatile organic compounds. The growth of UFPs is strongly impacted by the condensation of these low-volatility compounds and coagulation. Therefore, numerically the condensation of non-volatile compounds is solved dynamically with nucleation and coagulation processes using the ETR (explicit trapezoidal rule) numerical scheme. In each section, particles grow because of condensation, leading to variations in the section diameters. Because the bound diameters of each section should remain fixed to ensure numerical consistency with coagulation and 3D transport, the number and mass concentrations are redistributed at each time step on the fixed-size (diameter) sections using the Euler-coupled approach (Devilliers et al., 2013). The condensation and evaporation of semi-volatile compounds is computed by assuming bulk thermodynamic equilibrium between the gas and the particle phases. The condensing matter estimated from bulk equilibrium is distributed over the aerosol size distribution by using weighting factors for each size section based on the condensation and evaporation kernel of the condensation and evaporation rate.
Different parameterisations of nucleations are implemented: the binary parameterisation of Kuang et al. (2008) involving sulfuric acid and water; the ternary parameterisation of Napari et al. (2002) involving sulfuric acid, water, and ammonium; and the heteromolecular parameterisation of Riccobono et al. (2014) involving sulfuric acid and oxidised monoterpene compounds. Concerning this heteromolecular nucleation, Schobesberger et al. (2013) argued that stable clusters with sulfuric acid molecules may be effectively formed from highly oxidised extremely low-volatility organic compounds (ELVOCs). The less oxidised but more abundant oxidation products may instead drive the initial growth of the clusters. Hence, the concentration of the oxidised biogenic compounds is assumed to be equal to the concentration of ELVOCs, which are formed in the model from the autoxidation of monoterpenes (Ehn et al., 2014; Chrit et al., 2017). Several studies rescaled the ternary parameterisation of Napari et al. (2002) using scaling factors on the order of 10−5-10−6 because of nucleation rates that are too high (Fountoukis et al., 2012; Patoulias et al., 2018). A scaling factor of 0.001 is used here. As the heteromolecular parameterisation of Riccobono et al. (2014) also led to number concentrations that were too high, it is rescaled by a factor 0.1.
2.2 Simulation setup
The simulation domain (see Fig. 4) and the model input data (meteorology and boundary conditions) are the same as in Royer et al. (2011); Couvidat et al. (2013). Only five size sections between 0.01 and 10 µm were used in these studies. To represent the aerosol dynamics, including the nucleation process, the discretisation of particle diameters starts at 1 nm here, and the number of sections is increased to 25. The bound diameters of the sections used in the modelling are (in µm) 0.001, 0.00133,0.00177, 0.00237, 0.00316, 0.00421, 0.00562, 0.00750, 0.01, 0.0141,0.0199 0.0282 0.0398,0.0562, 0.0794, 0.112, 0.1585, 0.224, 0.316, 0.447, 0.631, 0.891, 1.26, 2.5, 5.0, and 10. The distribution of boundary conditions and emissions into 25 size sections is done offline prior to the simulation using the algorithm detailed in Appendix A. Because the larger-scale simulations from the nesting domain presented in Royer et al. (2011); Couvidat et al. (2013) did not include particles of diameters lower than 0.01 µm, the boundary conditions for particles between 0.001 and 0.01 µm are fixed to 0. The allocation of emissions to the different sections is detailed in the following section.
2.3 Size distribution at emission
Anthropogenic emissions are obtained from the Airparif 2005 inventory, which provides emissions for the different category sectors defined by Selected Nomenclature for Air Pollution (SNAP). For particulate emissions, only PM10 and PM2.5 emissions are available. Emissions of PM from traffic are assumed to be made of 50 % elementary carbon, 40 % organics, and 10 % non-volatile non-carbonaceous PM (Couvidat et al., 2013). Emissions of intermediate-, semi-, and low-volatility organic compounds (IVOC, SVOC, LVOC, respectively) are estimated from the organic mass of PM2.5 as detailed in Sartelet et al. (2018): the mass of organic vapours is estimated by multiplying by 1.5 the organic mass (Kim et al., 2016). The emitted organics are then divided into volatility classes: 25 % is assigned to LVOC, 32 % to SVOC, and 43 % to IVOC (Couvidat et al., 2012). To determine number emissions, the size distribution of PM2.5 is estimated using ratios of PM1 PM2.5 and PM1 PM0.1 from the UK National Atmospheric Emissions Inventory (NAEI) for each activity sector. These factors are presented in Table A2 of Appendix A. To represent PM0.1, PM1, and PM2.5 emissions, the size range of diameters between 0.01 and 10 µm is divided into five sections regularly distributed in log space and using bound diameters (in µm) of 0.01, 0.0398, 0.1585, 0.631, 2.11, and 10. Emissions of coarse particles (PM10–PM2.5) are assigned to the section of diameters between 2.11 and 10 µm. Emissions of fine particles (PM2.5–PM1) are assigned to the section of diameters between 0.631 and 2.11 µm. Note that 0.631 and 2.11 µm are used as bound diameters for PM1 and PM2.5 because PM is defined for aerodynamic diameters, whereas the model uses the diameter of spherical particles. Aerodynamic diameters of 1 and 2.5 µm correspond to diameters of 0.631 and 2.11, assuming a particle density of 1.58 g cm−3 and approximating the Cunningham correction factor following DeCarlo et al. (2004); Jung et al. (2020). Emissions of PM0.1 are assigned in the size range of diameters between 0.01 and 0.1585 µm. The bound diameter of 0.1585 µm is reasonable for PM0.1 at emission because particles may then be irregular with a diameter larger than the aerodynamic diameter (DeCarlo et al., 2004). However, the mass of UFP particles PM0.1 is redistributed arbitrarily between the low range (between 0.01 and 0.0398 µm) and the high range (above 0.0398 µm) of UFP diameters using a distribution coefficient αem; i.e. an emission ratio (αem, (1αem)) distributes PM0.1 in two size ranges. To determine this arbitrary distribution coefficient, simulations are compared to measurements during non-nucleation days using three different values of αem: 10 %, 15 %, and 25 % (Sect. 3). The mass allocated to the section between 0.01 µm and 0.0398 µ corresponds to αem times the mass of PM0.1, and the mass allocated to the section between 0.0398 µ and 0.1 µm corresponds to (1αem) times the mass of PM0.1. Note that particles with diameters lower than 0.01 µm are not emitted here, although diesel vehicles may emit such small particles (Kuuluvainen et al., 2020). However, the work of Olin et al. (2022) suggests that these emissions may not strongly affect the number concentrations at background sites because of the coagulation of emitted particles.
Although five size sections are defined for emissions, as many as 25 size sections are used in the model to represent the aerosol dynamics. To specify emissions in the range of the size sections of the model, the size distribution at emission is progressively refined by dividing each of the size sections at emission into two smaller size sections, keeping both the emitted mass and number concentrations constant during each division. The algorithm used for this division is detailed in Appendix A.
2.4 Measurements
Concerning number concentrations, measurements were performed between 1 and 31 July 2009 at three sites: the LHVP site, a background urban site in the centre of Paris; the SIRTA site, a background suburban site in the southwestern part of Paris; and the GOLF site, a background suburban site close to a golf course in the northeastern part of Paris (see Fig. 4). At the LHVP site, the number concentrations were monitored using a twin differential mobility particle sizer (TDMPS) for diameters between 3 and 635 nm. An air ion spectrometer (AIS) monitored the size distribution of ambient (not dried) positive and negative air ions of mobility diameters ranging from 0.8 to 40 nm. At the GOLF site, number concentrations were monitored using an electrical aerosol spectrometer (EAS) for diameters between 3 and 10 000 nm. At the SIRTA site, number concentrations were monitored using a scanning mobility particle sizer (SMPS) for diameters between 10 and 500 nm. The monthly average size distribution is plotted in Figs. 7, 8, and 9 at the SIRTA, LHVP, and GOLF sites, respectively. The lowest number concentrations are measured at the suburban SIRTA site. The highest number concentrations are measured at the suburban GOLF site. Further details about the measurements performed may be found in Pikridas et al. (2015). Mass concentrations were also monitored, allowing for the validation of the modelled particle mass concentrations. The mass concentrations of sulfate, nitrate, ammonium, and organics in PM1 were monitored with aerosol mass spectrometers (Freutel et al., 2013).
The undetermined number distribution coefficient αem at emission, defined in Sect. 2.3, is estimated by comparing the model to the measurements during non-nucleation days at LHVP, where measurements of UFPs from diameters as low as 0.8 nm are available from the AIS.
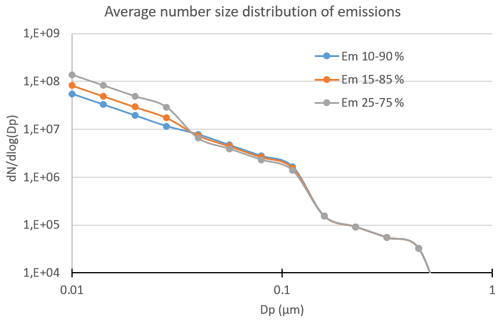
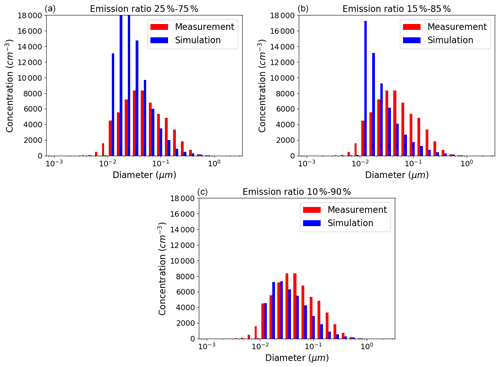
Three distribution coefficients αem are tested, 10 %, 15 %, and 25 %, corresponding to three sets of emission ratios, i.e. 10 %–90 %, 15 %–85 %, and 25 %–75 %, respectively. The differences between the size distribution at emission for these sets are shown in Fig. 1. The number of UFPs at emission is smaller in the set 10 %–90 % than in the set 15 %–85 %, which is itself smaller than in the set 25 %–75 %. The number of particles of diameters lower than 5 nm, as measured with the AIS and TDMPS, is shown in Fig. 2. It is the lowest at the beginning of July: it is lower than 20 cm−3 on 2 and 3 July and for the first 6 h of 4 July. This period is then selected to determine the number distribution coefficient at emission. Over that period, the averaged number concentration measured with the TDMPS consists mostly of particles with a diameter larger than 10 nm (N>10). Figure 3 compares the average number concentrations simulated over that period to the TDMPS measurements using the different emission distribution coefficients αem: 10 %, 15 %, and 25 %. The measured N>10 is 8216 cm−3, while the averaged simulated N>10 is 6172 cm−3 for αem=10 %, 8152 cm−3 for αem=15 %, and 12 883 cm−3 for αem=25 %. Clearly, the number of UFPs is too high using αem=25 %. Particles with diameters below 0.03µm are also overestimated using αem=15 %, while they are well modelled using αem=10 %.
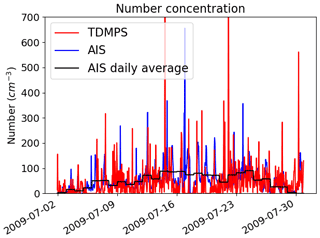
Figure 2Number of particles with diameters lower than 5 nm, as measured with the AIS (in blue) and TDMPS (in red). The black lines represent the average daily number concentrations measured with the AIS.
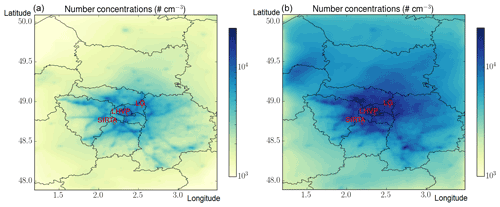
Although nucleation has a low influence on the mass concentrations of PM1, PM2.5, and PM10, it has a major influence on the number concentration during July. As shown in Fig. 4a, if nucleation is not taken into account, high number concentrations are observed along the main roads and motorways and concentrations are higher near the central part of the city than in the suburbs. The main roads are clearly distinguishable on the map of number concentrations, highlighting the strong impact of traffic emissions on the simulated concentrations.
To assess the influence of nucleation, simulations are performed with different nucleation parameterisations and compared to the simulation where nucleation is ignored. The nucleation parameterisations are those detailed in Sect. 2.1: the binary nucleation parameterisation of Kuang et al. (2008) involving sulfuric acid and water; the ternary nucleation parameterisation of Napari et al. (2002) involving ammonia, sulfuric acid, and water; and the heteromolecular nucleation parameterisation involving organic and sulfuric acid of Riccobono et al. (2014).
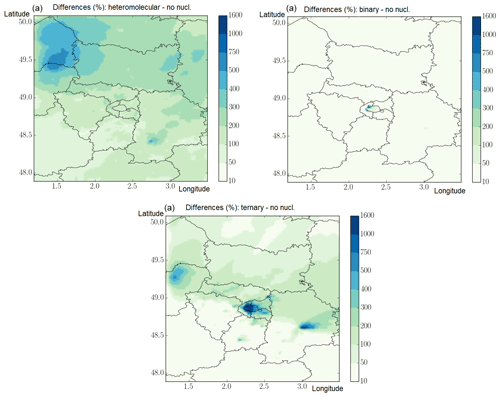
Nucleation leads to a large increase in number concentrations. On average over the whole domain and over the month of July, the binary, ternary, and heteromolecular nucleation parameterisations lead to an increase by a factor 1.1, 2.1, and 2.8, respectively.
Figure 5 shows the relative differences between simulations taking into account one nucleation scheme and the simulation without nucleation. The increase in the number concentration using the binary parameterisation is very localised (mostly near central Paris). The increase in the number concentration using the ternary parameterisation is larger than with the binary, but it is also very localised near Paris and its suburbs and near large factories. The increase in the number concentration using the heteromolecular parameterisation is the largest of the three parameterisations. Although the average increase over the domain is of the same order of magnitude as the increase due to ternary nucleation, it is less localised and more homogeneously distributed. However, as shown in Fig. 4b, the highest number concentrations are simulated near the central part of Paris and along the main roads and motorways, even when the heteromolecular nucleation parameterisation is used.
The simulated concentrations are evaluated using the measurements performed at the SIRTA, LHVP, and GOLF sites.
5.1 Statistics
5.1.1 Mass concentration
The mass concentration of the particles and of the different compounds of particles are fairly well modelled, as shown in Table 1. Modelled PM2.5 and NO2 concentrations are compared to measurements routinely carried out at background sites by the air quality agency Airparif. For PM2.5 and sulfate, ammonium, and organics in PM1, the simulated concentrations satisfy the most strict performance criteria of Boylan and Russell (2006) (mean fractional error, MFE, below 50 % and mean fractional bias, MFB, below 30 %). The MFE for nitrate concentration is higher (88 %), but the nitrate concentrations are very low (0.2 µg m−3) in both the measurements and the simulation. Except for nitrate, the correlations R between the simulations and measurements are also high (between 57 % and 76 %).
Note that the statistics shown in Table 1 are not influenced by the nucleation scheme.
No measurement of NH3 concentration was available in 2009. However, the simulated concentration range is realistic (see Fig. 6) considering that measurements of NH3 performed recently in the Paris city centre with a mini-DOAS (differential optical absorption spectroscopy) indicate a mean concentration of 2 µg m−3 (Viatte et al., 2021).
5.1.2 Number concentration
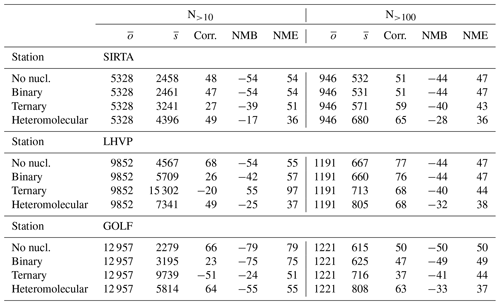
The simulated number concentrations of particles with diameters larger than 10 nm (N>10) and 100 nm (N>100) are compared to the observations at SIRTA, LHVP, and GOLF in Table 2. The simulation without nucleation strongly underestimates the number concentrations N>10 and N>100 in July 2009 at all sites (SIRTA, LHVP, and GOLF). There are no established criteria for determining how well a simulation performs against the measurement. The normalised mean bias (NMB) and the normalised mean error (NME) are often used (Fanourgakis et al., 2019; Olin et al., 2022; Patoulias and Pandis, 2022; Frohn et al., 2021). For a month of spring or summer over Europe, in Olin et al. (2022) the NME was 94 % for N>10 and 49 % for N>100 on average over 6 stations and in Patoulias and Pandis (2022) the NME was 63 % for N>10 and 45 % for N>100 on average over 26 stations. The NMB of N>30 ranged between 117 % and 161 % in Frohn et al. (2021), who used a modal approach for the size distribution. Simulations over cities led to higher errors: only monthly means are compared in Kukkonen et al. (2016), and the NMB ranges between 218 % and 285 % for N>30 in Frohn et al. (2021). The simulations without nucleation presented here lie in the range of errors obtained in previous studies at the European scale, with NMEs between 36 % and 79 % for N>10 and between 47 % and 50 % for N>100. These statistics are improved when nucleation is used, depending on the nucleation scheme used. Using the heteromolecular scheme for nucleation leads to very good model-to-measurement comparisons: the NME is 42 % on average for N>10 and 37 % for N>100.
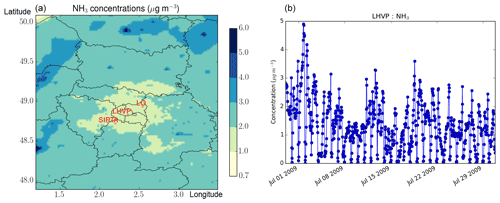
Figure 6Monthly average NH3 concentration (a) and hourly evolution of the NH3 concentrations (in µg m−3) at the LHVP site (b).
The effect of the binary nucleation is very low at all sites, especially for N>100. There is almost no change in the statistics at the SIRTA suburban site for both N>100 and N>10. The effect of nucleation is the largest at the site in the centre of Paris (LHVP), where it leads to an increase of the number of particles and reduces the bias from −54 % to −42 %. However, the error slightly increases and the correlation strongly decreases (from 68 % to 26 %), suggesting that the binary nucleation scheme does not improve the model-to-measurement comparisons overall. At all sites, the number concentration is strongly underestimated if only binary nucleation is taken into account.
The effect of the ternary nucleation is higher than the effect of the binary one. For N>100, the number concentration increases, leading to a decrease in the bias and a decrease in the error. This decrease is the strongest at the GOLF site, reducing the bias from −50 % to −41 % and the error from 50 % to 44 %. However, the model-to-measurement correlation decreases strongly at the GOLF site from 50 % to 37 %. Although the correlation also decreases because of ternary nucleation at the LHVP site, it increases from 51 % to 59 % at the SIRTA site. For N>10, The increase in number concentration leads to a decrease in the bias and error at both the SIRTA and GOLF sites. As for N>100, this decrease is the strongest at the GOLF site, where the bias is reduced from −79 % to −24 % and the error is reduced from 79 % to 51 %. At the LHVP site in central Paris, the increase in N>10 is too strong and the absolute value of the bias is not modified much, as it varies from −54 % to 55 %, but the error increases from 55 % to 97 %. At all three sites, the correlation strongly decreases. The effect of the parameterisation is not completely satisfactory because although the measurement–model bias decreases at most sites, the nucleation is too strong at the site located in the centre of Paris, where the measurement–model correlations also decrease strongly.
The effect of the heteromolecular nucleation strongly improves the bias and error of N>100 and N>10 at all sites. For example, at the SIRTA site, for N>10 the bias is reduced from −54 % to −17 % and the error is reduced from 54 % to 36 %, while for N>100 the bias is reduced from −44 % to −28 % and the error is reduced from 47 % to 36 %. For N>10, the correlation is not modified much, except at the LHVP site, where it is reduced from 68 % to 49 %. However the correlation decreases less than with the other nucleation schemes (it decreases to 26 % for the binary nucleation and to −20 % for the ternary nucleation). For N>100, the correlation also slightly decreases at the LHVP site, from 77 % to 68 %, but it is greatly improved at both the SIRTA site (from 50 % to 65 %) and the GOLF site (from 51 % to 63 %). These comparisons suggest that the heteromolecular nucleation improves the modelling of N>10 and N>100 at the suburban sites. Even though the bias and error are also improved at the city centre site, the decrease in correlation when the nucleation parameterisations are used may indicate the need to better characterise new particle formation in cities and close to traffic sites.
Table 2Model-to-measurement comparisons of daily number concentrations of particles with a diameter higher than 10 nm in July 2009 at LHVP, SIRTA, and GOLF. and stand for mean observation and simulated concentrations, respectively. Corr. stands for correlation. NMB and NME stand for normalised mean bias and normalised mean error, respectively.
5.2 Size distribution and hourly evolution
The strong influence of nucleation is also evident when looking at the particle size distributions averaged over the month of July in Fig. 7 at the SIRTA site, Fig. 8 at the LHVP site, and Fig. 9 at the GOLF site. The influence of the different nucleation parameterisations is now compared. To gain more insights into the influence of the nucleation parameterisation on the size distribution and on the number formation rate, the simulated hourly evolution of the number of particles of diameters between 10 and 100 µm (N10−100) is plotted in Fig. 10 and compared to measurements. At all sites, the number concentration is strongly underestimated if only binary nucleation is taken into account, as shown by the hourly evolution of N10−100 (Fig. 10). Although a few nucleation peaks, associated with a sudden increase in N10−100 concentrations, are sometimes simulated, they do not appear to be temporally related to those observed.
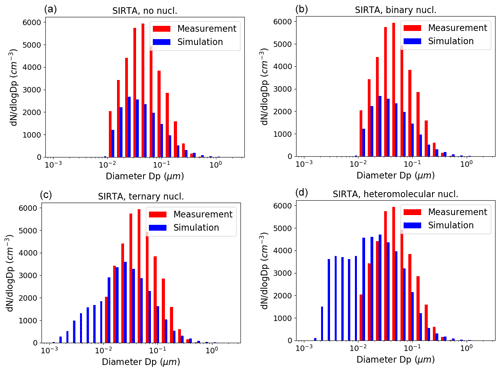
Figure 7Size distribution of the number concentrations (in cm−3) at the SIRTA site for the simulation without nucleation (a), with binary nucleation (b), with ternary nucleation (c), and with heteromolecular nucleation (d).
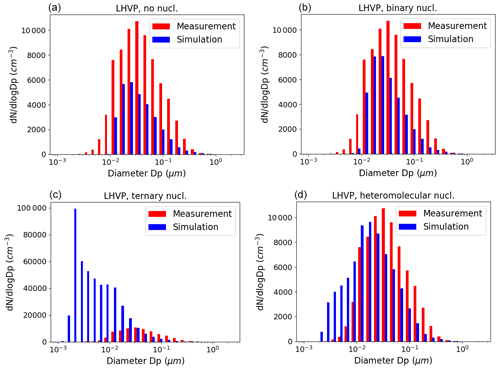
Figure 8Size distribution of the number concentrations (in cm−3) at the LHVP site for the simulation without nucleation (a), with binary nucleation (b), with ternary nucleation (c), and with heteromolecular nucleation (d).
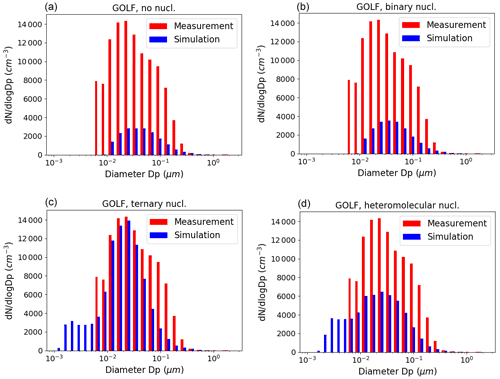
Figure 9Size distribution of the number concentrations (in cm−3) at the GOLF site for the simulation without nucleation (a), with binary nucleation (b), with ternary nucleation (c), and with heteromolecular nucleation (d).
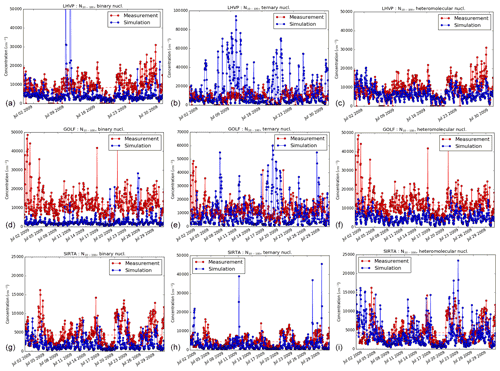
Figure 10Hourly evolution of the number concentrations N10−100 (in cm−3) at the LHVP (a, b, c), GOLF (d, e, f), and SIRTA (g, h, i) sites for the simulation with binary nucleation (a, d, g), ternary nucleation (b, e, h), and heteromolecular nucleation (c, f, i). Note that the maximum concentration is higher in the graphs with the ternary nucleation parameterisation than in those with the binary or heteromolecular nucleation parameterisations.
At the SIRTA site, Fig. 7 shows that the influence of binary nucleation is very low. The influence of ternary nucleation is higher, but the number of particles with diameters between 20 and 200 nm is strongly underestimated. This number is better modelled using the heteromolecular nucleation parameterisation, although this parameterisation seems to slightly overestimate the number of particles between 10 and 20 nm. However, Fig. 10 shows that the heteromolecular nucleation allows a fairly good representation of the nucleation events associated with the different high N10−100 concentrations, such as between 23 and 30 July.
At the LHVP site, Fig. 8 shows that the influence of the binary nucleation is higher than at the SIRTA site and leads to good model-to-measurement comparisons, although the number of particles of diameters between 20 and 200 nm is underestimated. This underestimation is less important using the heteromolecular parameterisation, which overestimates the number of particles between 3 and 10 nm. However, the hourly variations of N10−100 concentrations are underestimated between 9 and 16 July and between 23 and 30 July when nucleation is the strongest at the LHVP site (Fig. 10). This could be due to condensable vapours being too low.
The ternary nucleation parameterisation performs well for number of particles with diameters above 20 nm, but the number of particles with diameters below 20 nm is strongly overestimated (by a factor larger than 100). At the LHVP site, NH3 concentrations vary between 0 and 3 µg m−3 during most of July. As traffic is the main source of NH3 in the centre of Paris in July, the peaks of NH3 concentrations are strongly related to the traffic peaks (Fig. 6). When ternary nucleation is taken into account, peaks of particle number concentrations are simulated when NH3 concentrations are high and number concentrations are very low when NH3 concentrations are low (Fig. 10). These high peaks and variations of number concentrations are not observed in the measurements, suggesting that the ternary nucleation parameterisation does not perform well at the LHVP urban site.
At the GOLF site, Fig. 8 shows that the number concentration is strongly underestimated if nucleation is not taken into account for particles of all diameters. The effect of binary nucleation is very small. The heteromolecular nucleation parameterisation performs better. Although it leads to acceptable statistics, the number concentration is still underestimated for particles of all diameters. A good representation of the size distribution is obtained using the ternary nucleation parameterisation. However, Fig. 10 shows that large nucleation peaks, associated with a sudden increase in N10−100 concentrations, are erroneously simulated with the ternary nucleation parameterisation, particularly between 17 and 20 July.
This paper illustrates a method for estimating the number emission factors and size distributions for different activity sectors from the emissions of PM2.5. The estimated size distribution at emission is discretised using a sectional approach, and it is refined to ensure consistency regarding both mass and number concentrations. This method is applied over Greater Paris and calibrated using days when nucleation was low.
PM1, PM2.5, and PM10 concentrations are not influenced by nucleation. However, nucleation has a strong influence on number concentrations in July 2009. The influence of binary nucleation, which involves sulfuric acid and water, is low over Paris. The influence of ternary nucleation, which involves sulfuric acid, ammonia, and water, can be very high, but this high influence may not be realistic. It leads to very good model-to-measurement comparison at one suburban site in terms of size distribution, but it systematically deteriorates the correlation between simulated and measured number concentrations. Furthermore, it strongly overestimates the number concentrations at the central site and slightly underestimates it at the other suburban site. Co-located measurements of ammonia and number concentrations are required to conclude on the role of ammonia in nucleation in urban areas. The best model-to-measurement comparisons for N>10, N>100, and the size distributions are obtained using the heteromolecular nucleation parameterisation, which involves sulfuric acid and extremely low-volatility organic compounds from monoterpenes, emphasising the realistic importance of this process.
The correlation between measured and simulated number concentrations is high for the simulation without nucleation (higher than 48 %), stressing the strong influence of primary emissions and organic vapours from traffic on the growth of the emitted UFPs. At the two suburban sites, the heteromolecular nucleation parameterisation clearly leads to improved simulated number concentrations compared to measurements, with lower error and bias and higher correlation. The correlation is systematically deteriorated at the central site (LHVP) if nucleation is taken into account, suggesting that nucleation may involve other species than those used here or that monoterpene emissions from traffic could be underestimated. Guo et al. (2020) suggested that extremely low-volatility compounds (ELVOCs) formed from traffic emissions or emitted by traffic could nucleate. Recent studies suggested that traffic may emit monoterpenes, such as α-pinene (Panopoulou et al., 2020), which could then form ELVOC rapidly and be involved in nucleation.
Table A1Diameters (in µm) of the different sections both initially and after the first refinement step.

Table A2Estimation of the size distribution of emissions by estimating the ratios of PM1 PM2.5 and PM0.1 PM1 for each activity sector.
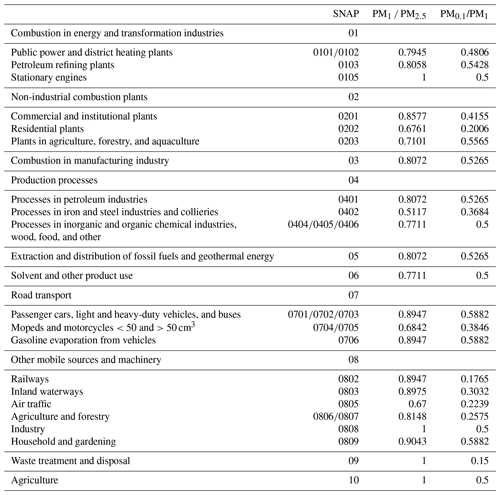
To estimate the size distribution of emissions, emissions of PM1 and PM0.1 are deduced from emissions of PM2.5 using the ratios of Table A2. Following this, the discretisation of the size sections of the emitted particles is refined by assuming that both mass and number are kept constant in each diameter range. As an illustration, let us consider one section of bound diameters d− and d+, i.e. all particles in that section have diameters between d− and d+ (for example, µm and µm). These particles of diameters between d− and d+ are assumed to have a mass M and a number of particles N. To refine the section discretisation into two sections rather than one, a bound diameter dm is added between d− and d+. This allows us to define two sections: section one for particles of diameters between d− and dm and section two for particles between dm and d+. The particles of section one have diameters between d− and dm, and they are assumed to have a mass M1 and a number of particles N1. The particles of section two have diameters between dm and d+, and they are assumed to have a mass M2 and a number of particles N2. We assume that refining the discretisation conserves both mass and number (; ) and that the mean diameter of each section is the geometrical mean of the section. To summarise, a section of mass M and mean diameter is divided into two sections of mass and number (M1, N1) and (M2, N2). The mean diameters of these sections are and . The conservation of the number is written as follows:
Taking into account the conservation of mass, we have
Therefore,
Thus, the mass M1 and M2 may be written as
The number of particles in each section is then deduced from the mass, the density, and the geometric mean diameter of the section by assuming that particles are spherical:
Using this algorithm, the number of section is progressively refined. An example of initial diameters and the diameters after the first refinement step is shown in Table A1.
The measurement data are available through the following web site: http://cds-espri.ipsl.upmc.fr/megapoli/index.jsp (Ether, MEGAPOLI database, 2011, Last access: 29 June 2022). The SSH-aerosol model can be downloaded from https://github.com/sshaerosol/ssh-aerosol/tree/v1.3 (sshaerosol, 2022, SSH-aerosol v1.3, last access: 27 June 2022). The chemistry transport model Polair3D/Polyphemus coupled to the aerosol module SSH-aerosol and the simulated concentrations is available from the corresponding author upon request.
KS was responsible for the conceptualisation of the study, conducting the visualisation, validation, and analysis. KS and YK developed the software. KS, YK, and FC participated in the development of the aerosol model SSH-aerosol. KS, JS, MM, TP, and AW acquired resources. KS wrote a first draft of the paper, which was reviewed by all co-authors.
At least one of the (co-)authors is a member of the editorial board of Atmospheric Chemistry and Physics. The peer-review process was guided by an independent editor, and the authors also have no other competing interests to declare.
Publisher's note: Copernicus Publications remains neutral with regard to jurisdictional claims in published maps and institutional affiliations.
The emission data used to estimate the size distribution of particles at emission were obtained from the web site https://naei.beis.gov.uk (last access: 29 June 2022) (© Crown 2021 copyright Defra & BEIS via https://naei.beis.gov.uk, licensed under the Open Government Licence (OGL)). Thanks are due to Airparif, the Paris region air quality agency, for providing us with their air pollutant emission inventory, Evangelia Kostenidou for the SMPS measurements at the SIRTA site, and Friederike Fachinger and Johannes Schneider (Max Planck Institute for Chemistry, Germany) for the measurements at the GOLF site.
This research has been supported by the European Union's Horizon 2020 research and innovation programme (RI-URBANS (grant no. 101036245)), the ERA-PLANET (http://www.era-planet.eu, last access: 29 June 2022) and the trans-national project SMURBS (http://www.smurbs.eu, last access: 29 June 2022 (grant no. 689443)).
This paper was edited by Lynn M. Russell and reviewed by two anonymous referees.
Albriet, A., Sartelet, K., Lacour, S., Carissimo, B., and Seigneur, C.: Modelling aerosol number distributions from a vehicle exhaust with an aerosol CFD model, Atmos. Environ., 44, 1126–1136, https://doi.org/10.1016/j.atmosenv.2009.11.025, 2010. a
Blichner, S. M., Sporre, M. K., Makkonen, R., and Berntsen, T. K.: Implementing a sectional scheme for early aerosol growth from new particle formation in the Norwegian Earth System Model v2: comparison to observations and climate impacts, Geosci. Model Dev., 14, 3335–3359, https://doi.org/10.5194/gmd-14-3335-2021, 2021. a, b
Boylan, J. and Russell, A.: PM and light extinction model performance metrics, goals, and criteria for three-dimensional air quality models, Atmos. Environ., 40, 4946–4959, https://doi.org/10.1016/j.atmosenv.2005.09.087, 2006. a
Cai, R., Chandra, I., Yang, D., Yao, L., Fu, Y., Li, X., Lu, Y., Luo, L., Hao, J., Ma, Y., Wang, L., Zheng, J., Seto, T., and Jiang, J.: Estimating the influence of transport on aerosol size distributions during new particle formation events, Atmos. Chem. Phys., 18, 16587–16599, https://doi.org/10.5194/acp-18-16587-2018, 2018. a
Casquero-Vera, J., Lyamani, H., Titos, G., de A. Moreira, G., Benavent-Oltra, J., Conte, M., Contini, D., Järvi, L., Olmo-Reyes, F., and Alados-Arboledas, L.: Aerosol number fluxes and concentrations over a southern European urban area, Atmos. Environ., 269, 118849, https://doi.org/10.1016/j.atmosenv.2021.118849, 2022. a
Chrit, M., Sartelet, K., Sciare, J., Pey, J., Marchand, N., Couvidat, F., Sellegri, K., and Beekmann, M.: Modelling organic aerosol concentrations and properties during ChArMEx summer campaigns of 2012 and 2013 in the western Mediterranean region, Atmos. Chem. Phys., 17, 12509–12531, https://doi.org/10.5194/acp-17-12509-2017, 2017. a, b
Couvidat, F., Debry, É., Sartelet, K., and Seigneur, C.: A hydrophilic/hydrophobic organic (H2O) aerosol model: Development, evaluation and sensitivity analysis, J. Geophys. Res., 117, D10304, https://doi.org/10.1029/2011JD017214, 2012. a, b
Couvidat, F., Kim, Y., Sartelet, K., Seigneur, C., Marchand, N., and Sciare, J.: Modeling secondary organic aerosol in an urban area: application to Paris, Atmos. Chem. Phys., 13, 983–996, https://doi.org/10.5194/acp-13-983-2013, 2013. a, b, c
de Jesus, A., Rahman, M., Mazaheri, M., Thompson, H., Knibbs, L., Jeong, C., Evans, G., Nei, W., Ding, A., Qiao, L., Li, L., Portin, H., Niemi, J., Timonen, H., Luoma, K., Petäjä, T., Kulmala, M., Kowalski, M., Peters, A., Cyrys, J., Ferrero, L., Manigrasso, M., Avino, P., Buonano, G., Reche, C., Querol, X., Beddows, D., Harrison, R., Sowlat, M., Sioutas, C., and L., M.: Ultrafine particles and PM2.5 in the air of cities around the world: Are they representative of each other?, Environ. Int., 129, 118–135, https://doi.org/10.1016/j.envint.2019.05.021, 2019. a
DeCarlo, P., Slowik, J., Worsnop, D., Davidovits, P., and Jimenez, J.: Particle Morphology and Density Characterization by Combined Mobility and Aerodynamic Diameter Measurements, Part 1: Theory, Aerosol. Sci. Technol., 38, 1185–1205, https://doi.org/10.1080/027868290903907, 2004. a, b
Devilliers, M., Debry, E., Sartelet, K., and Seigneur, C.: A new algorithm to solve condensation/evaporation for ultra fine, fine, and coarse particles, J. Atmos. Sci., 55, 116–136, https://doi.org/10.1016/j.jaerosci.2012.08.005, 2013. a
Downward, G., van Nunen, E., Kerckhoffs, J., Vineis, P., Brunekreef, B., Boer, J., Messier, K., Roy, A., Verschuren, W., van der Schouw, Y., Sluijs, I., Gulliver, J., Hoek, G., and Vermeulen, R.: Long-Term Exposure to Ultrafine Particles and Incidence of Cardiovascular and Cerebrovascular Disease in a Prospective Study of a Dutch Cohort, Environ. Health Perspect., 126, 127 007, https://doi.org/10.1289/EHP3047, 2018. a
Ehn, M., Thornton, J., Kleist, E., Sipilä, M., Junninen, H., Pullinen, I., Springer, M., Rubach, F., Tillmann, R., Lee, B., Lopez-Hilfiker, F., Andres, S., Acir, I., Rissanen, M., Jokinen, T., Schobesberger, S., Kangasluoma, J., Kontkanen, J., Nieminen, T., Kurtén, T., Nielsen, L. B., Jørgensen, S., Kjaergaard, H. G., Canagaratna, M., Dal Maso, M., Berndt, T., Petäjä, T., Wahner, A., Kerminen, V., Kulmala, M., Worsnop, D. R., Wildt, J., and Mentel, T. F.: A large source of low-volatility secondary organic aerosol, Nature, 506, 476–479, https://doi.org/10.1038/nature13032, 2014. a
EMEP/EEA: EMEP/EEA air pollutant emission inventory guidebook 2019, EEA Report No 13/2019, European Environment Agency, https://www.eea.europa.eu/publications/emep-eea-guidebook-2019 (last access: 18 June 2021), 2019. a
Fanourgakis, G., Kanakidou, M., Nenes, A., Bauer, S., Bergman, T., Carslaw, K., Grini, A., Hamilton, D., Johnson, J., Karydis, V., Kirkevag, A., Kodros, J., Lohmann, U., Luo, G., Makkonen, R., Matsui, H., Neubauer, D., Pierce, J., Schmale, J., Stier, P., Tsigaridis, K., van Noije, T., Wang, H., Watson-Parris, D., Westervelt, D., Yang, Y., Yoshioka, M., Daskalakis, N., Decesari, S., Gysel-Beer, M., Kalivitis, N., Liu, X., Mahowald, N., Myriokefalitakis, S., Schrödner, R., Sfakianaki, M., Tsimpidi, A., Wu, M., and Yu, F.: Evaluation of global simulations of aerosol particle and cloud condensation nuclei number, with implications for cloud droplet formation, Atmos. Chem. Phys., 19, 8591–8617, https://doi.org/10.5194/acp-19-8591-2019, 2019. a, b, c
Fountoukis, C., Riipinen, I., Denier van der Gon, H., Charalampidis, P., Pilinis, C., and Pandis, S.: Simulating ultrafine particle formation in Europe using a regional CTM: Contribution of primary emissions versus secondary formation to aerosol number concentrations, Atmos. Chem. Phys., 12, 8663–8677, https://doi.org/10.5194/acp-12-8663-2012, 2012. a, b, c
Freutel, F., Schneider, J., Drewnick, F., von der Weiden-Reinmüller, S.-L., Crippa, M., Prévôt, A. S. H., Baltensperger, U., Poulain, L., Wiedensohler, A., Sciare, J., Sarda-Estève, R., Burkhart, J. F., Eckhardt, S., Stohl, A., Gros, V., Colomb, A., Michoud, V., Doussin, J. F., Borbon, A., Haeffelin, M., Morille, Y., Beekmann, M., and Borrmann, S.: Aerosol particle measurements at three stationary sites in the megacity of Paris during summer 2009: meteorology and air mass origin dominate aerosol particle composition and size distribution, Atmos. Chem. Phys., 13, 933–959, https://doi.org/10.5194/acp-13-933-2013, 2013. a
Frohn, L. M., Ketzel, M., Christensen, J. H., Brandt, J., Im, U., Massling, A., Andersen, C., Plejdrup, M. S., Nielsen, O.-K., van der Gon, H. D., Manders-Groot, A., and Raaschou-Nielsen, O.: Modelling ultrafine particle number concentrations at address resolution in Denmark from 1979–2018, Part 1: Regional and urban scale modelling and evaluation, Atmos. Environ., 264, 118631, https://doi.org/10.1016/j.atmosenv.2021.118631, 2021. a, b, c, d, e, f, g
Guo, S., Hu, M., Peng, J., Wu, Z., Zamora, M. L., Shang, D., Du, Z., Zheng, J., Fang, X., Tang, R., Wu, Y., Zeng, L., Shuai, S., Zhang, W., Wang, Y., Ji, Y., Li, Y., Zhang, A. L., Wang, W., Zhang, F., Zhao, J., Gong, X., Wang, C., Molina, M. J., and Zhang, R.: Remarkable nucleation and growth of ultrafine particles from vehicular exhaust, P. Natl. Acad. Sci. USA, 117, 3427–3432, https://doi.org/10.1073/pnas.1916366117, 2020. a
Jung, C., Yoon, Y., Um, J., Lee, S., Lee, J., Chiao, S., and Kim, Y.: Approximation of most penetrating particle size for fibrous filters considering Cunningham slip correction factor, Env. Eng. Res., 25, 439–445, https://doi.org/10.4491/eer.2019.058, 2020. a
Jung, J., Fountoukis, C., Adams, P. J., and Pandis, S. N.: Simulation of in situ ultrafine particle formation in the eastern United States using PMCAMx-UF, J. Geophys. Res., 115, D03203, https://doi.org/10.1029/2009JD012313, 2010. a
Karl, M., Kukkonen, J., Keuken, M. P., Lützenkirchen, S., Pirjola, L., and Hussein, T.: Modeling and measurements of urban aerosol processes on the neighborhood scale in Rotterdam, Oslo and Helsinki, Atmos. Chem. Phys., 16, 4817–4835, https://doi.org/10.5194/acp-16-4817-2016, 2016. a
Karl, M., Pirjola, L., Karppinen, A., Jalkanen, J.-P., Ramacher, M. O. P., and Kukkonen, J.: Modeling of the Concentrations of Ultrafine Particles in the Plumes of Ships in the Vicinity of Major Harbors, Int. J. Environ. Res. Public Health, 17, 777, https://doi.org/10.3390/ijerph17030777, 2020. a
Kelly, J., Avise, J., Cai, C., and Kaduwela, A.: Simulationg particle size distributions over California and impact on lung deposition fraction, Aerosol. Sci. Technol., 45, 148–162, https://doi.org/10.1080/02786826.2010.528078, 2011. a, b, c
Ketzel, M., Frohn, L. M., Christensen, J. H., Brandt, J., Massling, A., Andersen, C., Im, U., Jensen, S. S., Khan, J., Nielsen, O.-K., Plejdrup, M. S., Manders, A., Denier van der Gon, H., Kumar, P., and Raaschou-Nielsen, O.: Modelling ultrafine particle number concentrations at address resolution in Denmark from 1979 to 2018 – Part 2: Local and street scale modelling and evaluation, Atmos. Environ., 264, 118633, https://doi.org/10.1016/j.atmosenv.2021.118633, 2021. a
Kim, Y., Couvidat, F., Sartelet, K., and Seigneur, C.: Comparison of different gas-phase mechanisms and aerosol modules for simulating particulate matter formation, J. Air Waste Manage. Assoc., 61, 1218–1226, https://doi.org/10.1080/10473289.2011.603999, 2011. a
Kim, Y., Sartelet, K., Seigneur, C., Charron, A., Besombes, J.-L., Jaffrezo, J.-L., Marchand, N., and Polo, L.: Effect of measurement protocol on organic aerosol measurements of exhaust emissions from gasoline and diesel vehicles, Atmos. Environ., 140, 176–187, https://doi.org/10.1016/j.atmosenv.2016.05.045, 2016. a, b
Kuang, C., McMurry, P., McCormick, A., and Eisele, F.: Dependence of nucleation rates on sulfuric acid vapor concentration in diverse atmospheric locations, J. Geophys. Res., 113, D10209, https://doi.org/10.1029/2007JD009253, 2008. a, b, c
Kukkonen, J., Karl, M., Keuken, M. P., Denier van der Gon, H. A. C., Denby, B. R., Singh, V., Douros, J., Manders, A., Samaras, Z., Moussiopoulos, N., Jonkers, S., Aarnio, M., Karppinen, A., Kangas, L., Lützenkirchen, S., Petäjä, T., Vouitsis, I., and Sokhi, R. S.: Modelling the dispersion of particle numbers in five European cities, Geosci. Model Dev., 9, 451–478, https://doi.org/10.5194/gmd-9-451-2016, 2016. a, b, c, d, e
Kulmala, M., Laaksonen, A., and Pirjola, L.: Parameterizations for sulfuric acid/water nucleation rates, J. Geophys. Res., 103, 8301–8307, https://doi.org/10.1029/97JD03718, 1998. a
Kulmala, M., Asmi, A., Lappalainen, H., Baltensperger, U., Brenguier, J.-L., Facchini, M., Hansson, H.-C., Hov, o., O'Dowd, C., Pöschl, U., Wiedensohler, A., Boers, R., Boucher, O., de Leeuw, G., Denier van der Gon, H., Feichter, J., Krejci, R., Laj, P., Lihavainen, H., Lohmann, U., McFiggans, G., Mentel, T., Pilinis, C., Riipinen, I., Schulz, M., Stohl, A., Swietlicki, E., Vignati, E., Alves, C., Amann, M., Ammann, M., Arabas, S., Artaxo, P., Baars, H., Beddows, D., Bergström, R., Beukes, J., Bilde, M., Burkhart, J., Canonaco, F., Clegg, S., Coe, H., Crumeyrolle, S., D'Anna, B., Decesari, S., Gilardoni, S., Fischer, M., Fjaeraa, A., Fountoukis, C., George, C., Gomes, L., Halloran, P., Hamburger, T., Harrison, R., Herrmann, H., Hoffmann, T., Hoose, C., Hu, M., Hyvärinen, A., Hõrrak, U., Iinuma, Y., Iversen, T., Josipovic, M., Kanakidou, M., Kiendler-Scharr, A., Kirkevåg, A., Kiss, G., Klimont, Z., Kolmonen, P., Komppula, M., Kristjánsson, J.-E., Laakso, L., Laaksonen, A., Labonnote, L., Lanz, V., Lehtinen, K., Rizzo, L., Makkonen, R., Manninen, H., McMeeking, G., Merikanto, J., Minikin, A., Mirme, S., Morgan, W., Nemitz, E., O'Donnell, D., Panwar, T. S., Pawlowska, H., Petzold, A., Pienaar, J., Pio, C., Plass-Duelmer, C., Prévôt, A., Pryor, S., Reddington, C., Roberts, G., Rosenfeld, D., Schwarz, J., Seland, o., Sellegri, K., Shen, X., Shiraiwa, M., Siebert, H., Sierau, B., Simpson, D., Sun, J., Topping, D., Tunved, P., Vaattovaara, P., Vakkari, V., Veefkind, J., Visschedijk, A., Vuollekoski, H., Vuolo, R., Wehner, B., Wildt, J., Woodward, S., Worsnop, D., van Zadelhoff, G.-J., Zardini, A., Zhang, K., van Zyl, P., Kerminen, V.-M., Carslaw, K., and Pandis, S.: General overview: European Integrated project on Aerosol Cloud Climate and Air Quality interactions (EUCAARI) – integrating aerosol research from nano to global scales, Atmos. Chem. Phys., 11, 13061–13143, https://doi.org/10.5194/acp-11-13061-2011, 2011. a
Kumar, P., Zavala-Reyes, J., Tomson, M., and Kalaiarasan, G.: Understanding the effects of roadside hedges on the horizontal and vertical distributions of air pollutants in street canyons, Environ. Int., 158, 106883, https://doi.org/10.1016/j.envint.2021.106883, 2022. a
Kurppa, M., Roldin, P., Strömberg, J., Balling, A., Karttunen, S., Kuuluvainen, H., Niemi, J. V., Pirjola, L., Rönkkö, T., Timonen, H., Hellsten, A., and Järvi, L.: Sensitivity of spatial aerosol particle distributions to the boundary conditions in the PALM model system 6.0, Geosci. Model Dev., 13, 5663–5685, https://doi.org/10.5194/gmd-13-5663-2020, 2020. a
Kuuluvainen, H., Karjalainen, P., Saukko, E., Ovaska, T., Sirviö, K., Honkanen, M., Olin, M., Niemi, S., Keskinen, J., and Rökkö, T.: Nonvolatile ultrafine particles observed to form trimodal size distributions in non-road diesel engine exhaust, Aerosol. Sci. Technol., 54, 1345–1358, https://doi.org/10.1080/02786826.2020.1783432, 2020. a
Merikanto, J., Napari, I., Vehkamäki, H., Anttila, T., and Kulmala, M.: New parameterization of sulfuric acid-ammonia-water ternary nucleation rates at tropospheric conditions, J. Geophys. Res., 112, D15207, https://doi.org/10.1029/2006JD007977, 2007. a
Napari, I., Noppel, M., Vehkamaki, H., and Kulmala, M.: Parametrization of ternary nucleation rates for H2SO4-NH3-H2O vapors, J. Geophys. Res., 107, 4381, https://doi.org/10.1029/2002JD002132, 2002. a, b, c, d
Oberdörster, G., Oberdörster, E., and Oberdörster, J.: Nanotoxicology: An emerging discipline evolving from studies of ultrafine particles, Environ. Health Perspect., 113, 823–839, https://doi.org/10.1289/ehp.7339, 2005. a
Okuljar, M., Kuuluvainen, H., Kontkanen, J., Garmash, O., Olin, M., Niemi, J., Timonen, H., Kangasluoma, J., Tham, Y., Baalbaki, R., Sipilä, M., Salo, L., Lintusaari, H., Portin, H., Teinilä, K., Aurela, M., Dal Maso, M., Rönkkö, T., Petäjä, T., and Paasonen, P.: Measurement report: The influence of traffic and new particle formation on the size distribution of 1–800 nm particles in Helsinki – a street canyon and an urban background station comparison, Atmos. Chem. Phys., 21, 9931–9953, https://doi.org/10.5194/acp-21-9931-2021, 2021. a
Olin, M., Patoulias, D., Kuuluvainen, H., Niemi, J. V., Rönkkö, T., Pandis, S. N., Riipinen, I., and Dal Maso, M.: Contribution of traffic-originated nanoparticle emissions to regional and local aerosol levels, Atmos. Chem. Phys., 22, 1131–1148, https://doi.org/10.5194/acp-22-1131-2022, 2022. a, b, c, d, e
Panopoulou, A., Liakakou, E., Sauvage, S., Gros, V., Locoge, N., Stavroulas, I., Bonsang, B., Gerasopoulos, E., and Mihalopoulos, N.: Yearlong measurements of monoterpenes and isoprene in a Mediterranean city (Athens): Natural vs anthropogenic origin, Atmos. Environ., 243, 117803, https://doi.org/10.1016/j.atmosenv.2020.117803, 2020. a
Pascal, M., Corso, M., Chanel, O., Declercq, C., Badaloni, C., Cesaroni, G., Henschel, S., Meister, K., Haluza, D., Martin-Olmedo, P., and Medina, S.: Assessing the public health impacts of urban air pollution in 25 European cities: Results of the Aphekom project, Sci. Total Environ., 449, 390–400, https://doi.org/10.1016/j.scitotenv.2013.01.077, 2013. a
Patoulias, D. and Pandis, S.: Simulation of the effects of low volatility organic compounds on aerosol number concentrations in Europe, Atmos. Chem. Phys., 22, 1689–1706, https://doi.org/10.5194/acp-22-1689-2022, 2022. a, b, c, d, e, f
Patoulias, D., Fountoukis, C., Riipinen, I., Asmi, A., Kulmala, M., and Pandis, S.: Simulation of the size-composition distribution of atmospheric nanoparticles over Europe, Atmos. Chem. Phys., 18, 13639–13654, https://doi.org/10.5194/acp-18-13639-2018, 2018. a, b, c
Pikridas, M., Sciare, J., Freutel, F., Crumeyrolle, S., von der Weiden-Reinmüller, S.-L., Borbon, A., Schwarzenboeck, A., Merkel, M., Crippa, M., Kostenidou, E., Psichoudaki, M., Hildebrandt, L., Engelhart, G. J., Petäjä, T., Prévôt, A. S. H., Drewnick, F., Baltensperger, U., Wiedensohler, A., Kulmala, M., Beekmann, M., and Pandis, S. N.: In situ formation and spatial variability of particle number concentration in a European megacity, Atmos. Chem. Phys., 15, 10219–10237, https://doi.org/10.5194/acp-15-10219-2015, 2015. a
Riccobono, F., Schobesberger, S., Scott, C., Dommen, J., Ortega, I., Rondo, L., Almeida, J., Amorim, A., Bianchi, F., Breitenlechner, M., David, A., Downard, A., Dunne, E., Duplissy, J., Ehrhart, S., Flagan, R., Franchin, A., Hansel, A., Junninen, H., Kajos, M., Keskinen, H., Kupc, A., Kürten, A., Kvashin, A., Laaksonen, A., Lehtipalo, K., Makhmutov, V., Mathot, S., Nieminen, T., Onnela, A., Petäjä, T., Praplan, A., Santos, F., Schallhart, S., Seinfeld, J., Sipilä, M., Spracklen, D., Stozhkov, Y., Stratmann, F., Tomé, A., Tsagkogeorgas, G., Vaattovaara, P., Viisanen, Y., Vrtala, A., Wagner, P., Weingartner, E., Wex, H., Wimmer, D., Carslaw, K., Curtius, J., Donahue, N., Kirkby, J., Kulmala, M., Worsnop, D., and Baltensperger, U.: Oxidation products of biogenic emissions contribute to nucleation of atmospheric particles, Science, 16, 717–721, https://doi.org/10.1126/science.1243527, 2014. a, b, c
Rivas, I., Beddows, D. C., Amato, F., Green, D. C., Järvi, L., Hueglin, C., Reche, C., Timonen, H., Fuller, G. W., Niemi, J. V., Pérez, N., Aurela, M., Hopke, P. K., Alastuey, A., Kulmala, M., Harrison, R. M., Querol, X., and Kelly, F. J.: Source apportionment of particle number size distribution in urban background and traffic stations in four European cities, Environ. Int., 135, 105345, https://doi.org/10.1016/j.envint.2019.105345, 2020. a
Rivas, I., Vicens, L., Basagaña, X., Tobias, A., Katsouyanni, K., Walton, H., Hüglin, C., Alastuey, A., Kulmala, M., Harrison, R., Pekkanen, J., Querol, X., Sunyer, J., and Kelly, F.: Associations between sources of particle number and mortality in four European cities, Environ. Int., 155, 106662, https://doi.org/10.1016/j.envint.2021.106662, 2021. a
Royer, P., Chazette, P., Sartelet, K., Zhang, Q., Beekmann, M., and Raut, J.-C.: Comparison of lidar-derived PM10 with regional modeling and ground-based observations in the frame of MEGAPOLI experiment, Atmos. Chem. Phys., 11, 10705–10726, https://doi.org/10.5194/acp-11-10705-2011, 2011. a, b
Sartelet, K., Hayami, H., Albriet, B., and Sportisse, B.: Development and preliminary validation of a modal aerosol model for tropospheric chemistry: MAM, Aerosol. Sci. Technol., 40, 118–127, https://doi.org/10.1080/02786820500485948, 2006. a
Sartelet, K., Debry, E., Fahey, K., Roustan, Y., Tombette, M., and Sportisse, B.: Simulation of aerosols and gas-phase species over Europe with the Polyphemus system, Part I: model-to-data comparison for 2001, Atmos. Environ., 41, 6116–6131, https://doi.org/10.1016/j.atmosenv.2007.04.024, 2007. a
Sartelet, K., Zhu, S., Moukhtar, S., André, M., André, J., Gros, V., Favez, O., Brasseur, A., and Redaelli, M.: Emission of intermediate, semi and low volatile organic compounds from traffic and their impact on secondary organic aerosol concentrations over Greater Paris, Atmos. Environ., 180, 126–137, https://doi.org/10.1016/j.atmosenv.2018.02.031, 2018. a
Sartelet, K., Couvidat, F., Wang, Z., Flageul, C., and Kim, Y.: SSH-Aerosol v1.1: A Modular Box Model to Simulate the Evolution of Primary and Secondary Aerosols, Atmosphere, 11, 525, https://doi.org/10.3390/atmos11050525, 2020. a, b
Schobesberger, S., Junninen, H., Bianchi, F., Lönn, G., Ehn, M., Lehtipalo, K., Dommen, J., Ehrhart, S., Ortega, I. K., Franchin, A., Nieminen, T., Riccobono, F., Hutterli, M., Duplissy, J., Almeida, J., Amorim, A., Breitenlechner, M., Downard, A. J., Dunne, E. M., Flagan, R. C., Kajos, M., Keskinen, H., Kirkby, J., Kupc, A., Kürten, A., Kurtén, T., Laaksonen, A., Mathot, S., Onnela, A., Praplan, A. P., Rondo, L., Santos, F. D., Schallhart, S., Schnitzhofer, R., Sipilä, M., Tomé, A., Tsagkogeorgas, G., Vehkamäki, H., Wimmer, D., Baltensperger, U., Carslaw, K. S., Curtius, J., Hansel, A., Petäjä, T., Kulmala, M., Donahue, N. M., and Worsnop, D. R.: Molecular understanding of atmospheric particle formation from sulfuric acid and large oxidized organic molecules, P. Natl. Acad. Sci. USA, 110, 17223–17228, https://doi.org/10.1073/pnas.1306973110, 2013. a
Schraufnagel, D. E.: The health effects of ultrafine particles, Exp. Mol. Med., 52, 311–317, https://doi.org/10.1038/s12276-020-0403-3, 2020. a, b
sshaerosol: SSH-aerosol v1.3, https://github.com/sshaerosol/ssh-aerosol/tree/v1.3, last access: 27 June 2022. a
Sihto, S.-L., Kulmala, M., Kerminen, V.-M., Dal Maso, M., Petäjä, T., Riipinen, I., Korhonen, H., Arnold, F., Janson, R., Boy, M., Laaksonen, A., and Lehtinen, K.: Atmospheric sulphuric acid and aerosol formation: implications from atmospheric measurements for nucleation and early growth mechanisms, Atmos. Chem. Phys., 6, 4079–4091, https://doi.org/10.5194/acp-6-4079-2006, 2006. a
Sulo, J., Sarnela, N., Kontkanen, J., Ahonen, L., Paasonen, P., Laurila, T., Jokinen, T., Kangasluoma, J., Junninen, H., Sipilä, M., Petäjä, T., Kulmala, M., and Lehtipalo, K.: Long-term measurement of sub-3 nm particles and their precursor gases in the boreal forest, Atmos. Chem. Phys., 21, 695–715, https://doi.org/10.5194/acp-21-695-2021, 2021. a
Tröstl, J., Chuang, W., Gordon, H., Heinritzi, M., Yan, C., Molteni, U., Ahlm, L., Bianchi, F., Wagner, R., Simon, M., Lehtipalo, K., Williamson, C., Craven, J., Duplissy, J., Adamov, A., Almeida, J., Bernhammer, A.-K. Breitenlechner, M., Brilke, S., Dias, A., Ehrhart, S., Flagan, R., Franchin, A., Fuchs, C., Guida, R., Gysel, M., Hansel, A., Hoyle, C., Jokinen, T., Junninen, H., Kangasluoma, J., Keskinen, H., Kim, J., Krapf, M., Kürten, A., Laaksonen, A., Lawler, M., Leiminger, M., Mathot, S., Möhler, O., Nieminen, T., Onnela, A., Petäjä, T., Piel, F., Miettinen, P., Rissanen, M., Rondo, L., Sarnela, N., Schobesberger, S., Sengupta, K., Sipilä, M., Smith, J., Steiner, G., Tomè, A., Virtanen, A., Wagner, A., Weingartner, E., Wimmer, D., Winkler, P., Ye, P., Carslaw, K., Curtius, J., Dommen, J., Kirkby, J., Kulmala, M., Riipinen, I., Worsnop, D., Donahue, N., and Baltensperger, U.: The role of low-volatility organic compounds in initial particle growth in the atmosphere, Nature, 533, 527–531, https://doi.org/10.1038/nature18271, 2016. a
Vehkamäki, H., Kulmala, M., Napari, I., Lehtinen, K., Timmreck, C., Noppel, M., and Laaksonen, A.: An improved parameterization for sulfuric acid-water nucleation rates for tropospheric and stratospheric conditions, J. Geophys. Res., 107, 4622, https://doi.org/10.1029/2002JD002184, 2002. a
Viatte, C., Petit, J.-E., Yamanouchi, S., Van Damme, M., Doucerain, C., Germain-Piaulenne, E., Gros, V., Favez, O., Clarisse, L., Coheur, P.-F., Strong, K., and Clerbaux, C.: Ammonia and PM2.5 Air Pollution in Paris during the 2020 COVID Lockdown, Atmosphere, 12, 160, https://doi.org/10.3390/atmos12020160, 2021. a
Win-Shwe, T.-T. and Fujimaki, H.: Nanoparticles and Neurotoxicity, Int. J. Mol. Sci., 12, 6267–6280, https://doi.org/10.3390/ijms12096267, 2011. a
Xu, G., Wang, J., and Qiao, X.: Numerical study on evolution of ultrafine particles emitted from vehicle exhaust with multi-dynamical behaviors, Atmos. Environ., 24, 117916, https://doi.org/10.1016/j.atmosenv.2020.117916, 2021. a
Ye, Q., Li, H. Z., Gu, P., Robinson, E. S., Apte, J. S., Sullivan, R. C., Robinson, A. L., Donahue, N. M., and Presto, A. A.: Moving beyond Fine Particle Mass: High-Spatial Resolution Exposure to Source-Resolved Atmospheric Particle Number and Chemical Mixing State, Environ. Health Perspect., 128, 017009, https://doi.org/10.1289/EHP5311, 2020. a
Yu, X., Venecek, M., Kumar, A., Hu, J., Tanrikulu, S., Soon, S.-T., Tran, C., Fairley, D., and Kleeman, M.: Regional sources of airborne ultrafine particle number and mass concentrations in California, Atmos. Chem. Phys., 19, 14677–14702, https://doi.org/10.5194/acp-19-14677-2019, 2019. a
Zhang, Y., Liu, P., Liu, X.-H., Jacobson, M., McMurry, P., Yu, F., Yu, S., and Schere, K.: A comparative study of nucleation parameterizations: 2. Three-dimensional model applications and evaluation, J. Geophys. Res., 115, D20213, https://doi.org/10.1029/2010JD014151, 2010a. a, b
Zhang, Y., McMurry, P., Yu, F., and Jacobson, M.: A comparative study of nucleation parameterizations: 1. Examination and evaluation of the formulations, J. Geophys. Res., 115, D20212, https://doi.org/10.1029/2010JD014150, 2010b. a, b
Zhu, J. and Penner, J.: Global Modeling of Secondary Organic Aerosol With Organic Nucleation, J. Geophys. Res.-Atmos., 124, 8260–8286, https://doi.org/10.1029/2019JD030414, 2019. a
- Abstract
- Introduction
- Presentation of the model and data
- Selection of non-nucleation days to determine the size distribution at emission
- Influence of nucleation
- Model evaluation
- Conclusions
- Appendix A: Size distribution of emissions
- Code and data availability
- Author contributions
- Competing interests
- Disclaimer
- Acknowledgements
- Financial support
- Review statement
- References


