the Creative Commons Attribution 4.0 License.
the Creative Commons Attribution 4.0 License.
 | 28 Jun 2022
Temporal and vertical distributions of the occurrence of cirrus clouds over a coastal station in the Indian monsoon region
Saleem Ali
Sanjay Kumar Mehta
Aravindhavel Ananthavel
Tondapu Venkata Ramesh Reddy
Knowledge of the spatiotemporal coverage of cirrus clouds is vital in quantifying the radiation budget of the Earth–atmosphere system. In this paper, we present the diurnal and vertical distributions of the occurrence of cirrus clouds during different seasons as well as the interannual variation in the occurrence of cirrus over Kattankulathur (12.82∘ N, 80.04∘ E) on the west coast of the Bay of Bengal. Long-term (2016–2018) continuous micropulse lidar (MPL) observations demonstrate laminar and descending cirrus clouds that occur either as single or multiple layers. The single-layer cirrus occurrence shows a diurnal pattern with frequent occurrence in the late evening (∼ 30 %–40 %), whereas multilayer cirrus clouds occur in the early morning (∼ 10 %–20 %). For the diurnal pattern in single-layer cirrus cloud occurrences, convective processes dominate during the pre-monsoon, southwest (SW) monsoon, and northeast (NE) monsoon seasons, while the freeze-drying process is favorable during the winter season. However, both convective and freeze-drying processes are dominant in the diurnal pattern of the multilayer cirrus occurrences. The occurrence reaches a maximum (∼ 40 %) during the SW and NE monsoon seasons, and it shows a minimum (∼ 25 %) during the winter season. The vertical distributions indicate that the maximum occurrence is confined within the tropical tropopause layer (TTL) during all seasons. Cirrus cloud rarely occurs above the tropopause; however, it frequently occurs below the TTL during all seasons. The vertical extent of the occurrence has a broader altitudinal coverage (∼ 8–17 km) during December–March and June–September, while the altitudinal coverage is narrower during April–May (∼ 10–17 km) and October–November (∼ 9–15 km). Cirrus cloud occurrence also exhibits interannual variations, with higher occurrence during 2016 compared with 2017 and 2018, in association with the El Niño–Southern Oscillation (ENSO).
- Article
(3089 KB) - Full-text XML
-
Supplement
(968 KB) - BibTeX
- EndNote


Cirrus clouds are the first clouds to interact with solar radiation. They modify the Earth's radiation budget by reflecting the incoming solar radiation (albedo effect) and trapping the outgoing longwave radiation (greenhouse effect). Therefore, the net radiative effects depend on the macrophysical, microphysical, and optical properties of cirrus clouds (Lynch, 2002). Tropical deep convective areas are generally capped by cirrus clouds (Sassen et al., 2009), with the highest fraction of optically thin cirrus (0.03<τ≤0.3) followed by optically thick (τ>0.3) and subvisible (τ≤0.3) cirrus. Optically thin cirrus clouds cause a net positive radiative forcing in the upper troposphere; however, thick clouds may produce cooling (Stephens and Webster, 1981; Fu and Liou, 1993). Overall, when the greenhouse effect dominates, there will be net warming in the tropical atmosphere, whereas there will be net cooling when albedo (scattering) dominates. However, knowledge of scattering by nonspherical ice crystals is highly limited (Liou et al., 1986), and the quantification of the net radiative effect of cirrus clouds on the atmosphere is highly uncertain. Although cirrus clouds affect the whole column (Fleming and Cox, 1974), their effect is most pronounced in the tropical tropopause layer (TTL). Yang et al. (2010) quantified the radiative impacts of cirrus clouds on the TTL and observed net cloud radiative heating below ∼ 16 km and mostly cooling above ∼ 17 km. Thus, net heating due to cirrus clouds can strengthen upwelling and provide an alternative mechanism for troposphere–stratosphere exchange process (Corti et al., 2006). Randel and Jensen (2013) reported that the occurrence of TTL cirrus clouds leads to a significant increase in stratospheric water vapor. Recent studies have suggested that changes in stratospheric humidity due to cirrus clouds will substantially impact climate variability compared with those associated with decadal increases in greenhouse gases (Riese et al., 2012). A warming anomaly in the vertical temperature gradient can significantly decrease the cirrus fraction in the TTL, whereas a cooling anomaly increases it (Tseng and Fu, 2017).
Cirrus clouds over tropical latitudes exhibit a variety of natures. Broadly, cirrus clouds are observed as laminar or horizontally lying (Jensen et al., 1996), descending, and ascending (Nair et al., 2012). These clouds can appear as either single-layer or multilayer cirrus (Li et al., 2011). The laminar cirrus clouds very close to the cold-point tropopause (CPT) are generally referred to as “tropopause” or “cold-trap” cirrus (Winker and Trepte, 1998). They occur as thin–subvisible forms under cold (−70 to −90 ∘C) and high (15–20 km) tropopause conditions, which are rarely encountered outside of the tropics. Tropopause cirrus is composed of relatively small ice crystals (Heymsfield, 1986) due to the abundant moisture deposited by deep convection near the tropopause. Various dynamical processes control the generation, growth, maintenance, and decay of tropopause cirrus clouds (Liou, 1986; Fujiwara et al., 2009). The descending cirrus cloud layer results from the transport of condensate from the upper- to mid-tropospheric levels, either due to gravitational settlement or atmospheric wave propagation (Heymsfield and Iaquinta, 2000; Mitchell et al., 2008). Over the tropics, the occurrence of multilayer cirrus clouds is the highest (Nazaryan et al., 2008). These multilayer cirrus clouds represent breaks in a vertically continuous cirrus layer due to wind shear (Jakob, 2002).
Globally, cirrus clouds cover about 50 % of the Earth's surface, with a maximum fraction of coverage over the tropics (Liou, 1986), mainly within the TTL (Wang et al., 2012). The TTL is a region between convective outflow (∼ 12 km) and the CPT (∼ 17 km). Studies indicate that cirrus clouds occur more than ∼ 80 % of the time over the tropics (e.g., Nazaryan et al., 2008). Cirrus clouds have also been found to occur above the CPT in the lower stratosphere (Winker and Trepte, 1998; Pan and Munchak, 2011; Sandhya et al., 2015) as well as below the TTL (Dowling and Radke, 1990; Nazaryan et al., 2008). The major processes responsible for the formation of cirrus clouds are due to the convectively generated remnants of cumulonimbus outflow anvils and are formed in situ by the condensation and nucleation of aerosols and water vapors (Jensen et al., 1996; Lynch, 2002). Cirrus clouds generated in situ form preferably due to inhomogeneous nucleation, including aerosols acting as ice crystal nuclei and the homogeneous nucleation of water vapor at an extremely cold temperature of between −70 and −90 ∘C near the CPT (Cziczo and Froyd, 2014; Annamalai and Mehta, 2022). Recent studies have suggested that increasing aerosol concentrations in the tropopause region may significantly affect the cirrus cloud distribution (Massie et al., 2013; Vernier et al., 2015).
The occurrence of cirrus clouds maximizes around regions of intense convective activities (Spinhirne et al., 2005). Cirrus clouds frequently occur over the convectively active areas primarily associated with oceanic convection, such as equatorial Africa, South America, and southern Asia (Dessler et al., 2006). The cirrus cloud occurrence over these convective regions shows a large seasonal variation which is found to be associated with the seasonal shift in the Intertropical Convergence Zone (ITCZ) and midlatitude storm belts (Wylie et al., 2005; Nazaryan et al., 2008). Large-scale circulation patterns, like the El Niño–Southern Oscillation (ENSO), the quasi-biennial oscillation (QBO), and the Brewer–Dobson circulation (BDC), also significantly affect the temporal variability in the occurrence of cirrus clouds (Davis et al., 2013; Tseng and Fu, 2017). For example, the occurrence of cirrus clouds over a tropical station, Gadanki, was found to be ∼ 44 % (Pandit et al., 2015) and ∼ 51 % (Sunil Kumar et al., 2003) using 16 years (1998–2013) and 3 years (1998–2001) of ground-based lidar observations, respectively, whereas it was found to be ∼ 30 %–40 % using the analysis of 2 years of spaceborne lidar data (Sassen et al., 2008). Such a difference in the occurrence percentage could be due to interannual variation.
The tropical convection or cloudiness shows a diurnal pattern, with a peak in the afternoon to early evening over the continents and midnight to early morning over the oceanic regions (Chen and Houze, 1997; Liu et al., 2008). Recently, Kottayil et al. (2021) also found deep convection peaks in the late evening hours over land. In contrast, it peaks in the afternoon hours over the majority of the oceanic regions. Such a diurnal cycle is attributed to the diurnal cycle of the net radiative forcing due to radiative heating and infrared cooling. In addition, the thermal properties of the land and ocean surfaces also play a significant role in the diurnal cycle of convective activities. Eriksson et al. (2010) observed substantial diurnal variation in the upper-tropospheric humidity and ice water content over tropical land regions. Gupta et al. (2017) investigated the day–night changes in the vertical distribution of tropical clouds. They reported an enhancement in the cloud occurrence during nighttime throughout the middle and upper troposphere.
The diurnal pattern in tropical convection, upper-tropospheric humidity, and ice water indicates that diurnal variation in cirrus clouds exists. However, the complete diurnal variation in cirrus clouds is not yet known. Thus, in the present study, we aim to make use of the continuous micropulse lidar (MPL) observations over the period from 2016 to 2018 in order to disentangle the vertical distribution and diurnal variation of cirrus cloud occurrence during different seasons as well as the interannual variations in cirrus cloud occurrence over a tropical coastal region, Kattankulathur (12.82∘ N, 80.04∘ E). MPL observations indicate that laminar and descending types of cirrus clouds, either in the form of a single layer or multiple layers, occur throughout the year over Kattankulathur. Here, our main focus is to examine the occurrence of the single- and multilayer cirrus clouds over different timescales. Our analysis also reveals that the seasonal patterns in the percentage occurrence of cirrus clouds over the NE monsoon region are different from the SW monsoon region. The main objectives of the present study are to (i) identify cirrus cloud occurrence and study the diurnal pattern in the occurrence of the single-layer and multilayer cirrus clouds, (ii) understand the role of convection and the TTL temperature in diurnal variations of cirrus cloud occurrence, and (iii) examine the vertical distributions of cirrus clouds during different seasons and different years. Details about the MPL data and cirrus cloud identification are described in Sect. 2. The results and discussions are illustrated in Sect. 3 followed by a list of conclusions summarized in Sect. 4.
2.1 Micropulse lidar (MPL)
The MPL is an elastic backscatter, dual-polarization compact lidar system (miniMPL5231, Sigma Space Corporation, USA) that was installed on the premises of the SRM Institute of Science and Technology (SRMIST), Kattankulathur (12.82∘ N, 80.04∘ E; 45 m a.m.s.l., where “a.m.s.l.” denotes meters above mean sea level) on January 2016. The MPL is set up on the roof of the university building, 60 m above ground level (i.e., 105 m a.m.s.l). We operated the MPL regularly from 15:00 IST on the first day to 11:00 IST on the second day. Operation was stopped from 11:00 to 15:00 IST in order to avoid exposing the receiver to direct solar radiation. The MPL is a diode-pumped frequency-doubled solid-state Nd:YAG laser transmitter at a wavelength of 532 nm with low pulse energy (3–4 µJ) and a high repletion rate (2500 Hz). The pulse width is set to 200 ns, which corresponds to a range resolution of 30 m. The telescope is a Galilean-type instrument, and its diameter is 80 mm. We collected lidar data at a 1 min interval. The MPL provides measurements of the vertical and temporal distributions of aerosols and clouds in the troposphere, which are helpful to study the atmospheric boundary layer, properties of aerosols, the occurrence of clouds, and cloud radiative effects on the atmosphere (Campbell et al., 2003; Welton and Campbell, 2002). The detailed specifications of the MPL can be found in Ananthavel et al. (2021a).
A lidar transmits short pulses of laser light into the atmosphere. The received signals, due to scattering from air molecules and particles as well as additional signal due to instrumental effects, are expressed as follows:
where P(r) is the instantaneously received power (raw signal) at time t, Po is the transmitted power at the time to, c is the velocity of light, τ is the pulse duration, and A is the area of the receiver. β(r) and α(r) are the volume backscatter and extinction coefficients, respectively. The received signal is corrected using system-dependent parameters such as dead time, after pulse, overlap corrections, and background noise corrections. The normalized relative backscatter (NRB) signal is obtained as follows:
Dead time correction is applied to remove the saturation effect due to the high-count rate. After-pulse correction is required to eliminate the signal due to the internally scattered light that saturates the detector at the beginning of each sampling interval, creating a blind zone in the near field. The overlap correction occurs when the receiver field of view is inside the transmitter, causing an over-attenuated near-field signal. For our MPL system, the average overlap range is found to be ∼ 1.1 km. More details about the calculation of the overlap factor can be found in Ananthavel et al. (2021b). In the present study, we have used the NRB coefficients, the signal-to-noise ratio (SNR), and the linear depolarization ratio (LDR) during 2016–2018. The LDR is calculated as follows (Flynn et al., 2007):
where NRBco and NRBcross are the parallel and perpendicular components measured with linearly polarized and circularly polarized beams, respectively. The linearly (parallel) and circularly (perpendicular) polarized components of the backscattered signals are achieved by means of an actively controlled liquid crystal retarder. The polarizing beam splitter finally directs the co-polarized and depolarized signals to the detector. More details about the estimation of the LDR can be found in Flynn et al. (2007).
2.2 Radiosonde
This study used upper-air data observed with radiosonde from the Indian Meteorological Department (IMD) Chennai at Meenambakkam (13.0∘ N, 80.18∘ E; 16 m a.m.s.l.) over the period from 2016 to 2018. IMD Chennai is located approximately 20.13 km northeast of SRM IST, Kattankulathur. The daily average data from radiosonde observations at 05:30 and 17:30 IST are used to gather background meteorological information and identify the TTL. Knowledge of the TTL width is important to understand the occurrence of cirrus clouds.
2.3 Infrared brightness temperature (IRBT) data
To investigate the role of deep convection in the diurnal variations of cirrus clouds, we used globally merged infrared brightness temperature (IRBT) data obtained from the National Weather Service Climate Prediction Center of the National Oceanic and Atmospheric Administration (NOAA). IRBT data are a globally merged, full-resolution (up to ∼ 4 km) IR dataset formed from the ∼ 11 µm IR channels aboard the GMS-5, GOES-8, GOES-10, Meteosat-7, and Meteosat-5 geostationary satellites. The IRBT data are available with a time resolution of 1 h and a spatial resolution of (latitude × longitude). In this study, we have averaged the IRBT data over a (latitude × longitude) grid centered on Kattankulathur.
2.4 Methodology
2.4.1 Cloud-base and cloud-top altitudes
NRB profiles from the MPL observations are used to identify cirrus cloud layers based on the differential zero-crossing method (Pal et al., 1992). This method is based on the fact that the NRB signal intensity generally decreases monotonically with altitude until a cloud appears. When the signal encounters a cloud, the NRB signal level begins to increase significantly due to the larger droplets in clouds compared with ambient air. As a result, using MPL observations, the cloud-base height of the lowest cloud is directly identified as the change in the slope or gradient (the first derivative) of the NRB (i.e., , referred to as the differential zero-crossing method (Dai et al., 2019; Nair et al., 2012; Platt et al., 1994; Wu et al., 2015). To identify the base of cirrus clouds over the tropics, we limit the lowest altitude to 8 km; over this region, cirrus clouds usually occur at a temperature below −20 ∘C, corresponding to an altitude above 8 km (Liou, 1986; Lynch, 2002; Pandit et al., 2014).
We have sampled the NRB profiles at a resolution of 30 m, which includes several random variations arising due to background noise. These small-scale fluctuations are smoothed by employing a 10-point (width 300 m) running mean filter to the first derivative of the NRB signal. The 10-point running mean filter improves the detection of the robust cloud layer and reduces computation time. The base, top, and peak of cirrus clouds are identified from the smoothed NRB signals by the differential zero-crossing method. The NRB signal starts to increase relative to the threshold value at the cloud base, whereas the NRB signal comes down to the threshold level at the apparent cloud top. The cloud-base and cloud-top altitudes are only identified when the NRB gradient increases or decreases, respectively, relative to the threshold value for at least three consecutive range bins (90 m). The threshold value is taken as the mean plus 2 standard deviations of the background NRB signal from ambient air over the altitude from 25 to 30 km (see Fig. S1 in the Supplement). To avoid detecting any spurious layer, we make sure that the NRB signals possess a good SNR value. The level up to which the NRB signals are more than the 1 standard deviation of the column-integrated signal is considered a good SNR. In general, a good SNR is found up to ∼ 15–20 km at nighttime (Ananthavel et al., 2021a). However, at daytime, a good SNR is only found up to ∼ 4–6 km due to the high solar irradiance, except if cirrus clouds occur (Fig. S1 in the Supplement). Whenever cirrus clouds occur during the daytime, the SNR value increases within the cloud boundaries and satisfies the criteria of a good SNR.
The apparent cloud-top height is detected by searching the first level where the NRB value is just less than or equal to the NRB value at the cloud base. In the cases of multiple cirrus clouds, the NRB profile may reveal several peaks. However, each of these peaks may not really be associated with separate cloud layers. The distinct multiple cirrus cloud layers are detected only when they are separated by a clear-air region, i.e., the NRB signal must drop to the background level. Finally, LDR values were checked for each cloud layer identified using the differential zero-crossing method and the criteria that the LDR within the cirrus layer should be at least 0.05 greater than the LDR from the ambient air outside of the cloud boundaries, with a minimum absolute value of 0.08 (Sassen and Cho, 1992; Nair et al., 2012).
2.4.2 Cloud optical thickness
Once the cirrus cloud-base and cloud-top altitudes are identified, the cirrus cloud optical thickness is derived using the two-way transmittance method (Young, 1995). The optical thickness is half of the logarithm of the ratio of the NRB signals just below the cloud base to those immediately above the cloud top. Note that the NRB is the range-corrected signal that has passed through the system and overlap corrections. The molecular and aerosol contributions to the altitudinal variation in the NRB are also removed before calculating the optical thickness. Thus, using the transmittance method, optical thickness is obtained without inverting the lidar signals and without the requirement for knowledge of the lidar ratio. We have obtained the altitude profiles of the molecular coefficient using the monthly mean temperature and pressure profiles. For the aerosol contribution to the NRB signal, we used the seasonal mean altitude profiles of the aerosol extinction coefficient derived from MPL observations over the site during the period from 2016 to 2018. The details of deriving the extinction coefficients are provided in Ananthavel et al. (2021a) and Ananthavel et al. (2021b). However, it is to be noted that the molecular and aerosol contributions to the NRB signal are very small compared with cirrus clouds occurring above 8 km (Young, 1995; Nair et al., 2012). We have employed only nighttime profiles with a very good SNR to determine the optical thickness. Whenever a low SNR is observed, time averaging of the NRB signals is done to reduce the noise level and improve the SNR before calculating the optical thickness (Nair et al., 2012).
2.4.3 Percentage of cirrus cloud occurrence
Once the cirrus cloud-base and cloud-top altitudes are identified, the height and time functions of the monthly percentage occurrence (POC) of cirrus clouds are calculated. For this, we have segregated the total hours of MPL and cirrus cloud observations between 14:00 IST on the first day and 11:00 IST on the second day for each month during 2016–2018. We obtained 665 d of MPL data that were continuously measured for 1 h, i.e., 11 778 h of MPL observations were collected in total. Of the abovementioned 665 d of data, 496 d contained observed cirrus cloud durations longer than 30 min, i.e., 5002 h of cirrus cloud observations are found in total. The POC is the ratio of the total hours of cirrus cloud to the total hours of MPL operation multiplied by 100. We have counted the total hours of cirrus clouds in 30 m altitude bins from cloud base to cloud top that occur between 8 and 20 km at a 5 min time interval between 14:00 IST on the first day and 11:00 IST on the second day.
2.4.4 Tropopause parameters
The tropopause parameters, such as the CPT, convective tropopause (COT), and TTL, are obtained using radiosonde temperature profiles at 05:30 and 17:30 IST over the period from 2016 to 2018. The CPT is defined as the minimum temperature level in the troposphere (Selkirk et al., 1993), and the COT is defined as the minimum potential temperature gradient (Mehta et al., 2011). The region between the COT and CPT levels is called the tropical tropopause layer (TTL).
3.1 Background meteorological information
Figure 1 shows the monthly mean variation in the temperature, relative humidity (RH), zonal wind, meridional wind, potential temperature gradient from the surface to an altitude of 25 km, rainfall, outgoing longwave radiation (OLR), and the CPT and COT altitudes over IMD Chennai. The monthly mean CPT and COT altitudes are obtained by averaging the daily data. Kattankulathur (Chennai) is a coastal station that experiences rainfall both from the southwest (SW) monsoon during June–July–August–September (JJAS) and the northeast (NE) monsoon during October–November–December (OND). Thus, the influence of both of the monsoons results in an abundant supply of moisture into the upper troposphere, which is favorable for cirrus cloud formation. The study region is also influenced by the sea breeze that triggers local convective rainfall (Reddy et al., 2020; Simpson et al., 2007) over Kattankulathur. The temperature shows substantial seasonal variation at the surface, within the atmospheric boundary layer (ABL ∼ 2.0 km), and within the TTL. In the mid-troposphere, seasonal variation in temperature is very weak (Ananthavel et al., 2021a, b). The surface temperature reaches a minimum (∼ 298.9 ± 0.3 K) during December–January and a maximum (∼ 304.6 ± 0.6 K) during April–May–June. May is the hottest month over Kattankulathur. The frequent sea breeze during pre-monsoon seasons (March–April–May; MAM) decreases the temperature around 0.6 km (the average height of the thermal internal boundary layer – TIBL; Reddy et al., 2020). The monthly mean temperature in the TTL shows marked seasonal variation with the minimum CPT temperature (∼ 190 ± 2 K) during October–May, covering the NE monsoon, winter (January–February), and pre-monsoon seasons and the maximum CPT temperature (∼ 192 ± 2 K) during June–September covering the SW monsoon season. The monthly mean temperature shows a marked wider cold-point region between ∼ 16.1 and 18.7 km during October–May, which becomes a narrow region between 16.4 and 16.9 km during June–September. The CPT altitude is higher (∼ 17.5 ± 0.5 km) during the winter season and lower (16.7 ± 0.4 km) during the SW monsoon season. The COT altitude also shows a strong seasonal variation with the minimum altitude (∼ 11.2 ± 1.4 km) from December to April and the maximum altitude (12.2 ± 1.6 km) from May to December. The COT altitude starts to increase in May, during which rainfall is observed due to isolated convection, mainly thunderstorms. The RH is found to be greater than 70 % within the TIBL throughout the year. Above the ABL, the mid-troposphere is almost dry, with RH < 20 % from December to April. The atmosphere is moist from May to mid-November, with RH > 50 %, due to strong convection during the SW monsoon and NE monsoon seasons. The RH is found to be lowest within the TTL. However, the RH is relatively higher (∼ 60 %) near the CPT, indicating the uplift of moist air near the CPT due to convection during the SW monsoon season. Humid air can also be advected to near the CPT due to the tropical easterly jet (TEJ) during the SW monsoon season. The TEJ core (zonal wind speed ≤30 m s−1) is located near the CPT during the abovementioned season (Ratnam et al., 2011; Ramakumar et al., 2010). Over Chennai, northwesterly winds prevail up to 10 km throughout the year, except near the surface, with a maximum speed during the SW monsoon season. During the pre-monsoon season, the wind near the surface is southwesterly due to the frequent occurrence of the sea breeze (Reddy et al., 2020). Westerly/southwesterly (easterly/northeasterly) winds prevail during November–April (June–September) above 10 km. During the SW monsoon season, the low-level jet (LLJ) stream in the lower troposphere and the TEJ stream in the upper troposphere dominate. The monthly mean of the potential temperature gradient shows distinct minima around the convective tropopause. The temperature gradient starts to increase above the CPT. The CPT altitude marks the location where the potential temperature gradient drastically changes from a low to a high value.
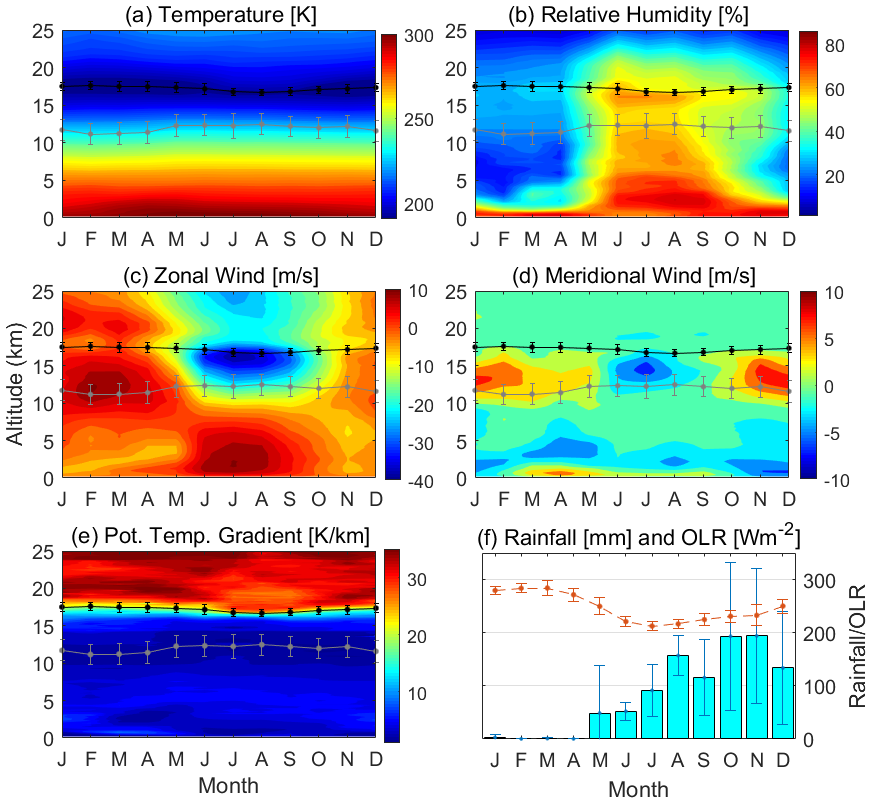
Figure 1Time–height sections of the composite monthly mean (a) temperature, (b) relative humidity, (c) zonal wind, (d) meridional wind, and (e) potential temperature gradient superimposed with the monthly mean and standard deviation of the CPT (black line) and COT (gray line) heights. The monthly means of the (f) rainfall (cyan) and outgoing longwave radiation (OLR) (magenta) with their standard deviations are also shown.
3.2 Detection of cirrus cloud layers from NRB signals
The identification of cirrus cloud layers is illustrated for different types of cirrus cloud cases, such as laminar cirrus, descending cirrus, broad cirrus, and multilayer cirrus, observed on 12 February 2018, 27 May 2016, 3 August 2017, and 26 July 2016, respectively, as shown in Fig. 2. Figure 2 presents the time–height section of the NRB signals over the altitude from 0.3 to 22 km observed on 14:00 IST on the first day to 11:00 IST on the second day; vertical profiles of the NRB signal, , and the SNR at 01:30 IST using MPL observations; and the daily mean temperature, potential temperature, and potential temperature gradient. Note that the NRB gradient and potential temperature gradient profiles are smoothed by the 10-point running mean to avoid short-scale fluctuations.

Figure 2Time–height sections of the normalized backscatter (NRB) signals over the altitude from 0.3 to 22 km observed from 15:00 IST on the first day to 11:00 IST on the second day. The panels show the vertical profiles of the NRB; the gradient of NRB and SNR signals at 01:30 IST using MPL over Kattankulathur; and the daily mean temperature, potential temperature, and potential temperature gradient using radiosonde observation over Meenambakkam for different types of cirrus cloud cases: (a) laminar cirrus (12 February 2018), (b) descending cirrus (27 May 2016), (c) broad cirrus (3 August 2017), and (d) multilayer cirrus (26 July 2016). Red and black dots denote the cirrus cloud top and base of the cloud layers, respectively. Dashed lines indicate the peak altitudes of cirrus layers. Dotted horizontal lines indicate the secondary peak associated with the main peak. The cold-point tropopause (CPT) and convective tropopause (COT) are also shown. Note that a 10-point running mean has been applied to the NRB gradient and temperature gradient profiles to smooth out the small-scale fluctuations.
On 12 February 2018 (Fig. 2a), we observed a laminar cirrus cloud layer between the altitudes of ∼ 11.0 km (cloud base) and 13.5 km (cloud top) from 18:00 to 08:00 IST. During this day, a typical case for the winter season, relatively higher aerosol concentrations dominated within the ABL (∼ 2.0 km). Above it, up to ∼ 3–4 km, a diffuse regime of more aged aerosols (Jacob et al., 2002) dominated. Above 4 km, aerosol concentrations were extremely low, and the signal was mainly dominated by molecular scattering and the presence of clouds. The NRB profile observed at 01:30 IST shows a monotonic decrease in the signal above the ABL (∼ 2.0 km) to the cloud-base height (∼ 11.6 km). The first derivative of the NRB begins to increase at the cloud base. At the cloud peak, shows zero crossing, i.e., a change in sign from positive to negative. One can notice that several zero crossings are present below the cloud base that arise from inhomogeneity in the background aerosols; however, these insignificant zero crossings are below the level of the threshold value and are rejected. Note that the threshold value is taken as the mean plus 2 standard deviations of the background NRB signal from ambient air, as mentioned earlier, and it is calculated for each profile. The cloud peak at ∼ 12.8 km is identified as the level of zero crossings of (where it changes sign from positive to negative). The apparent cloud-top height is identified at 13.6 km. At the cloud-top height, the NRB value was found to be ∼ 0.12 counts km2 µs−1 µJ−1, which is much less than the NRB value of ∼ 0.85 counts km2 µs−1 µJ−1 at the cloud base. The detected cloud-base and cloud-top heights from 18:00 to 08:00 IST are superimposed on the contour plot shown in Fig. 2a. On this day, both subvisible (τ≤0.03) and optically thin (0.03<τ≤0.3) cirrus clouds are present, with a mean optical thickness of ∼ 0.05 ± 0.04. Cirrus cloud is observed near the convective tropopause (COT altitude ∼ 11.7 km). The temperature and potential temperature of the cloud layer are ∼ 216 and 347 K, respectively. The cold-point tropopause (CPT altitude ∼ 17.3 km) lies much above the cirrus cloud top.
On 27 May 2016 (Fig. 2b), we observed the descending type of cirrus cloud layer, which descended from an altitude with a cloud base at ∼ 13.5 km and cloud top at ∼ 15.0 km at 16:00 IST to an altitude with a cloud base at ∼ 11.0 km and cloud top at ∼ 12.0 km at 08:00 IST. Cirrus clouds, while descending, change their vertical structure and optical thickness. The NRB profile observed at 01:30 IST shows high aerosol concentrations up to about 6 km, which is a typical feature during monsoon seasons over Kattankulathur. During this season, strong convection and strong southwesterly winds prevail, bringing enormous amounts of moisture-laden coarse particles from the Arabian Sea and the Bay of Bengal (Ananthavel et al., 2021a, b). Above about 6 km, the NRB signal decreases until it encounters the cloud. The identification of the cirrus cloud layer is similar to that mentioned in the previous case. The heights of the cloud base, cloud peak, and cloud top are at ∼ 12.2, 12.9, and ∼ 13.9 km, respectively. In this case, the NRB value at the cloud top is ∼ 0.15 counts km2 µs−1 µJ−1 less than at cloud base ∼ 0.21 km2 µs−1 µJ−1. The detected cloud-base and cloud-top altitudes from 16:00 to 08:00 IST are superimposed over the contour plot shown in Fig. 2b. We observed mostly optically thin (0.03<τ≤0.3) and thick clouds (τ>0.3) with a mean cloud optical thickness of ∼ 0.13 ± 0.07. In the beginning, cirrus clouds lie within the TTL (COT altitude ∼ 11.9 km, CPT altitude ∼ 17.1 km); however, while descending, they fall below the TTL base at ∼ 02:00 IST, and the layer reaches just below the TTL at 08:00 IST. The mean cloud temperature before descent is 209 K, whereas it is 232 K after descent.
On 3 August 2017 (Fig. 2c), a broad layer of cirrus clouds was observed with a cloud base at ∼ 10.5 km and cloud top at ∼ 12.5 km at 15:00 IST and at ∼ 17.0 km at 01:00 IST. On this day, cirrus clouds appear to present even before 14:00 IST; however, the MPL was not operating during this time due to high solar radiation, as mentioned earlier. The subvisible cirrus clouds above 13 km from midnight to early morning may have formed either due to a decrease in the ambient air temperature or the reappearance of the existing cirrus with a decrease in the optical thickness of the lower-level cirrus clouds. It is to be noted that the MPL signal is unable to penetrate deep enough in the presence of optically thick cirrus clouds. This is the limitation of the up-looking lidar and results in the ambiguous detection of the cirrus top, which is then generally referred to as the “apparent cirrus top” (Pal et al., 1992). However, in cases of subvisible-cirrus clouds and thin-cirrus clouds, the actual cloud top can be detected, as observed on 12 February 2018 (Fig. 2a). From the surface to ∼ 3 km, high aerosol concentrations are observed. As this typical case is observed in the SW monsoon season, increased water vapor and aerosols are transported to this region due to prevailing strong southwesterly winds and strong convection, as mentioned in the previous case. Mid-tropospheric thick clouds and boundary layer clouds substantially attenuate the lidar signal. The NRB profile observed at 01:30 IST monotonically decreases above the boundary layer until it encounters cirrus cloud with a base at ∼ 10.5 km. Unlike previous cases, in this case, two respective peaks at ∼ 12.0 and ∼ 16.0 km are discernible; however, they do not represent the multiple cirrus layer. Because there is no clear-sky region between these peaks, the signal never reaches the background value. The NRB value between these peaks never became less than the NRB value at the cloud base. Hence, the cloud-top height is identified at 16.95 km. The value of the NRB at the cloud top is 0.05 counts km2 µs−1 µJ−1, which is much less than the value of 0.15 counts km2 µs−1 µJ−1 at cloud base. The detected cloud layers are shown in the contour plot shown in Fig. 2c. Mostly, optically thin and thick clouds with a mean cloud optical thickness of ∼ 0.12 ± 0.07 are observed in this case (similar to the previous case). Similar to the previous case, the cirrus cloud layer was found within the TTL (COT altitude ∼ 10.8 km, CPT altitude ∼ 16.8 km) with the cirrus top during the period from midnight to early morning nearly coinciding with the CPT. In this case, the CPT is found to be sharper and colder than the previous cases, with cirrus clouds occurring below the CPT. The mean temperature of the cloud layer is found to be ∼ 213 K.
On 26 July 2016 (Fig. 2d), multiple cirrus layers were observed from 22:00 to 06:00 IST. In this case, the cirrus layers appear to present before 15:00 IST on the first day and after 11:00 IST on the second day; however, the lidar was switched off due to high solar radiation, missing the complete diurnal feature. The cirrus cloud-base and cloud-top heights are at ∼ 10 and ∼ 12 km, respectively, at 15:00 IST; increase to ∼ 14 km (cloud base) and ∼ 16 km (cloud top) at 20:00 IST; and remain laminar until morning (8:00 IST). During 22:00–06:00 IST, another cirrus layer with a cloud base at ∼ 10.0 km and cloud top at ∼ 13.5 km appeared. About 06:00–08:00 IST, a convective cloud is observed at an altitude of about 4–6 km. From 08:00 to 11:00 IST, a cirrus layer appears whose cloud base increases from 8.0 to 11.0 km, and the cloud top increases from 10.0 to 14.0 km. The cirrus clouds observed show a significant variation in the optical and geometrical thickness related to temperature, moisture, and convective strength. In this case, we observed a disturbed boundary layer feature with highly variable aerosol concentrations. The NRB profile observed at 01:30 IST shows high aerosol concentrations up to ∼ 3.0 km that decrease monotonically above this altitude until encountering the cirrus cloud base at ∼ 11.0 km. We observed the two respective peaks at ∼ 11.6 and ∼ 12.8 km for the lower cirrus layer, similar to the previous case. However, as mentioned previously, it represents a single cirrus layer. Similarly, the upper cirrus layer also contains two respective peaks at ∼ 16.0 and 16.8 km; however, it also represents a single cloud layer. Between the cloud top of the lower cirrus layer and the cloud base of upper cirrus layer, clear sky is observed, with signal from ambient air. Thus, these two layers are multiple cirrus layers, and the detected cloud-base and cloud-top heights are shown in contour plots shown in Fig. 2d. In this case, optically thin and thick clouds with a mean optical thickness of ∼ 0.17 ± 0.31 are also observed. Interestingly, both cirrus layers occur mainly within the TTL (COT altitude ∼ 12.0 km, CPT altitude ∼ 17.1 km). However, part of the top of the upper cirrus layer appears just above the CPT, and part of the lower cirrus layer appears below the COT. In this case, the temperature profile shows a relatively broader tropopause. Within the TTL, the potential temperature gradient shows significant enhancement. The average temperature of the lower and upper cirrus layers is ∼ 226 and 197 K, respectively. The upper layer occurs near the tropopause and is generally referred to as the tropopause cirrus.
3.3 Diurnal and day-to-day patterns of cirrus cloud occurrence
We applied the abovementioned zero-crossing method to detect the cirrus cloud layers for all of the observations over the period from 2016 to 2018. Figure 3 shows the day-to-day variation in the total duration of the first-layer or single-layer cirrus cloud observations and the total duration of the MPL observations during 2016–2018. The MPL is operated between 14:00 IST on the first day and 11:00 IST on the second day under clear-sky conditions. The maximum duration of MPL operation is 20 h; however, on several occasions, MPL operation was stopped due to technical issues or bad weather conditions. The major data gaps are during February, June, and December 2016; July, October, and November 2017; and April and September 2018. Note that we have plotted only those days with more than 1 h of lidar operation and more than 30 min of cirrus cloud observations. Some noticeable differences can be seen in cirrus cloud occurrence among 2016, 2017, and 2018, indicating robust interannual variation. Cirrus clouds frequently occur during January–February of 2016 and 2018 compared with 2017. While cirrus cloud occurrence and duration is higher during March–April in 2016 and 2017 compared with 2018. During May–June, all of the years show a relatively long duration of cirrus cloud occurrence. We also checked the occurrence of cirrus clouds persisting for more than 1 d. In total, cirrus clouds were observed on 665 d during 2016–2018. Of these 665 d, cirrus clouds persist for more than 1 d on 93 of the observed days (i.e., 14 %). The persistence of cirrus clouds for longer than 1 d frequently occurs from May to August (covering the SW monsoon) and from October to November (covering the NE monsoon). It is to be noted that cirrus persistence for a longer duration may have large implications for the TTL region; this will likely be explored in a future study.

Figure 3The day-to-day total duration of cirrus cloud (single-layer) occurrence and the total duration of MPL observations during (a) 2016, (b) 2017, and (c) 2018.
Figure 4 shows the timing of the occurrence of single and multiple layers of cirrus cloud as well as the day-to-day variations in cirrus cloud during 2016–2018. We use the term “single” for single-layer clouds and the first layer in the case of multilayer cirrus clouds. At the same time, “multi” is used to refer to the second layer of cirrus clouds in the case of multilayer cirrus. The occurrence of a third layer was rare and is not considered in this study. The purpose of showing different colors on the left side of the panels in Fig. 4 is to distinguish the day-to-day occurrence of cirrus clouds. Single-layer cirrus clouds appear to occur throughout the year. However, multilayer cirrus clouds occur mainly from May to August, followed by occurrence in October–November. It can be seen that cirrus clouds sometimes occur throughout the night and sometimes during the early evening and the early morning. To understand the overall occurrence frequency, we have calculated the percentage of occurrence between 14:00 IST on the first day and 12:00 IST on the second day at a 2 h interval. On the right side in the panels of Fig. 4, the occurrence frequency is displayed at 15:00, 17:00, 19:00 IST, and so on. It should be noted that the occurrence of cirrus clouds during the daytime is affected by the high solar noise, which significantly reduces the MPL detection capability with respect to cirrus clouds, especially the thin and subvisible types. Thus, the occurrence of cirrus clouds presented from sunrise to 11:00 IST and from 15:00 IST to sunset may not represent accurate statistics. The overall occurrence of single-layer cirrus clouds reveals that they occur more frequently during the evening hours (18:00–20:00 IST). At the same time, multilayer cirrus clouds occur more frequently during the early morning hours (04:00–06:00 IST). The diurnal occurrence of cirrus clouds shows variation in terms of the amount and pattern among the years (2016–2018). The occurrence of both single- and multilayer cirrus clouds was higher during 2016 compared with 2017 and 2018. It should be noted that, to our best knowledge, the diurnal structure of single- and multilayer cirrus cloud occurrence is being reported here for the first time: we have not come across any such existing work. Earlier studies have reported the diurnal cycle of the total cloud fractions using spaceborne observations, which do not provide information on multilayer cirrus clouds (Noel et al., 2018; Feofilov Stubenrauch, 2019).

Figure 4The day-to-day occurrence of cirrus clouds from 14:00 IST on the first day to 11:00 IST on the second day as well as the overall percentage occurrence for (a) single-layer and (b) multilayer cirrus clouds during 2016. Panels (c) and (d) and panels (e) and (f) are the same as panels (a) and (b) but were observed during 2017 and 2018, respectively. We use “single” to refer to the single-layer clouds and the first layer in the case of multilayer cirrus clouds; “multi” is used to refer to the second layer of cirrus clouds in the case of multilayer cirrus. Note that the colors used here have no specific meaning but are simply used to make it easier to distinguish between different days.
As mentioned in Sect. 1, cirrus clouds are either convectively generated or formed in situ. Convectively generated cirrus develops mainly due to the remnants of anvil clouds following deep convection, whereas cirrus formed in situ originates due to an extremely cold TTL temperature. In this section, we examine the possible roles of convection and TTL temperatures on the diurnal variation in cirrus cloud occurrence during different seasons. The diurnal variation in the occurrence of single- and multilayer cirrus clouds, the occurrence of an IRBT of less than 240 and 220 K during different seasons, and the monthly occurrence of a CPT temperature less than 191 K at 05:30 and 17:30 IST (evening) are calculated, as shown in Fig. 5. During the winter and SW monsoon seasons, cirrus clouds occur more frequently in the late evening (∼ 18:00–20:00 IST). In contrast, cirrus clouds uniformly occur throughout the night during the pre-monsoon season. For the NE monsoon season, cirrus clouds occur more frequently during the late evening and early morning (04:00–06:00 IST). The SW monsoon season also shows a relatively enhanced occurrence during the early morning hours, similar to the NE monsoon. Multilayer cirrus clouds occur more frequently during the SW monsoon compared with other seasons, which have similar frequencies. The diurnal variation in the occurrence of multilayer cirrus shows pronounced maxima in the early morning hours. Feofilov and Stubenrauch (2019) retrieved the diurnal pattern of cirrus clouds from two spaceborne infrared sounders: the Atmospheric Infrared Sounder (AIRS) and the Infrared Atmospheric Sounding Interferometer (IASI). Over our location, they observed that the diurnal cycle is not pronounced. We have compared our results with the cirrus clouds closest to 12.82∘ N, 80.04∘ E from the publicly available dataset (https://doi.org/10.13140/RG.2.2.13038.15681), as shown in the Supplement (Fig. S2). It indicates that the diurnal cycle of the total occurrence is less pronounced, which is consistent with Feofilov and Stubenrauch (2019). The diurnal cycle is discernible only when the single- and multilayer cirrus are separately analyzed.
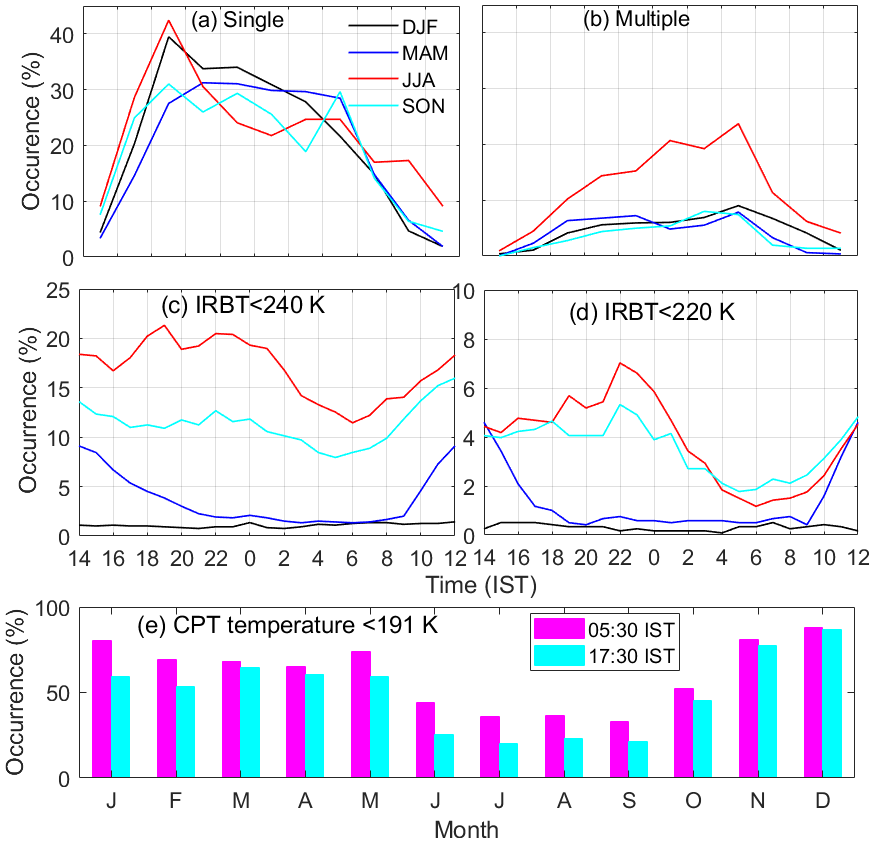
Figure 5Diurnal variation in the percentage occurrence of (a) single-layer and (b) multilayer cirrus clouds, (c) an IRBT less than 240 K, and (d) an IRBT less than 220 K during different seasons over the period from 2016 to 2018. (e) The monthly percentage occurrence of a CPT temperature less than 191 K at 05:30 and 17:30 IST over the 2016–2018 period.
To understand the role of convection in the occurrence of cirrus clouds, we obtained the occurrence of an IRBT of less than 240 K, representing convective clouds with a cloud top above 8 km, and an IRBT of less than 220 K, representing deep convection with a cloud top above 12 km (Ali et al., 2020). Convective clouds and deep convection frequently occur during the SW monsoon season, followed by the NE monsoon and pre-monsoon seasons. During the winter seasons, convection is rare. During the SW and NE monsoon seasons, the diurnal pattern of convection is similar. In these seasons, convection frequently starts in the late morning and remains prevalent until midnight, with the maximum occurrence from late evening to midnight. Daytime convection during the SW and NE monsoons can be related to the higher occurrence of cirrus clouds in the late evening hours. At the same time, the maximum occurrence of deep convection at midnight may be related to the cirrus occurrence during the early morning hours. During the pre-monsoon season, convection mainly occurs in the daytime, resulting in uniform cirrus occurrence throughout the night. However, although there is no convection during the winter season, cirrus clouds frequently occur during the late evening, similar to the SW and NE monsoon seasons. To understand this, we examined the role of freeze-drying processes in the formation of cirrus clouds formed in situ by calculating the occurrence frequency of a cold-point tropopause (CPT) temperature less than 191 K during the morning and evening hours. This CPT temperature (<191 K) is believed to be the threshold value for the freeze-drying of water vapor that can lead to the formation of cirrus clouds. We observed that the CPT temperature more frequently becomes colder (than 191 K) from November to May than during the period from June to October, which may be conducive for the formation of cirrus clouds generated in situ. Note that a CPT temperature of <191 K more frequently occurs in the morning than in the evening hours during all seasons. The frequent occurrence of multilayer cirrus clouds during morning hours can also be partly related to a CPT temperature <191 K. Thus, the clouds formed in situ (due to a CPT temperature <191 K) may result in multilayer cirrus at a higher altitude during the SW monsoon season. Additionally, it is well known that cirrus clouds are closely associated with turbulence, and turbulence generally becomes stronger during the afternoon and evening hours (Parameswaran et al., 2004; Mushin et al., 2017). Thus, strong turbulent transport of aerosols and water vapor near the CPT may result in the higher occurrence of single-layer cirrus clouds during afternoon or evening hours. Such cirrus clouds are known to persist for a longer duration.
To understand the altitudinal distribution of the diurnal variation in cirrus cloud occurrence during different seasons, we calculated its percentage occurrence for each month from January to December over the period from 2016 to 2018, as shown in Fig. 6. We calculated the monthly POC from 14:00 IST on the first day to 11:00 IST on the second day, covering the entire night above 8 km. Note that we have shown the plot from 5 to 20 km (Fig. 6). Monthly mean CPT and COT heights and standard deviations obtained using daily average IMD radiosonde data are also embedded in Fig. 6. As mentioned earlier, the vertical and diurnal structure of the occurrence is calculated by taking the ratio of the total number of cirrus clouds observed to the total number of observations for every 5 min at 30 m altitude intervals in a given month for the period from 2016 to 2018. Note that the occurrence is only calculated for MPL operational periods longer than 1 h and cirrus presence longer than 30 min. The POC shows high temporal and vertical structures of occurrence during each month. In general, it is found to be between ∼ 10 % and 30 %, with the highest occurrence during May–June and the lowest occurrence during February–March.
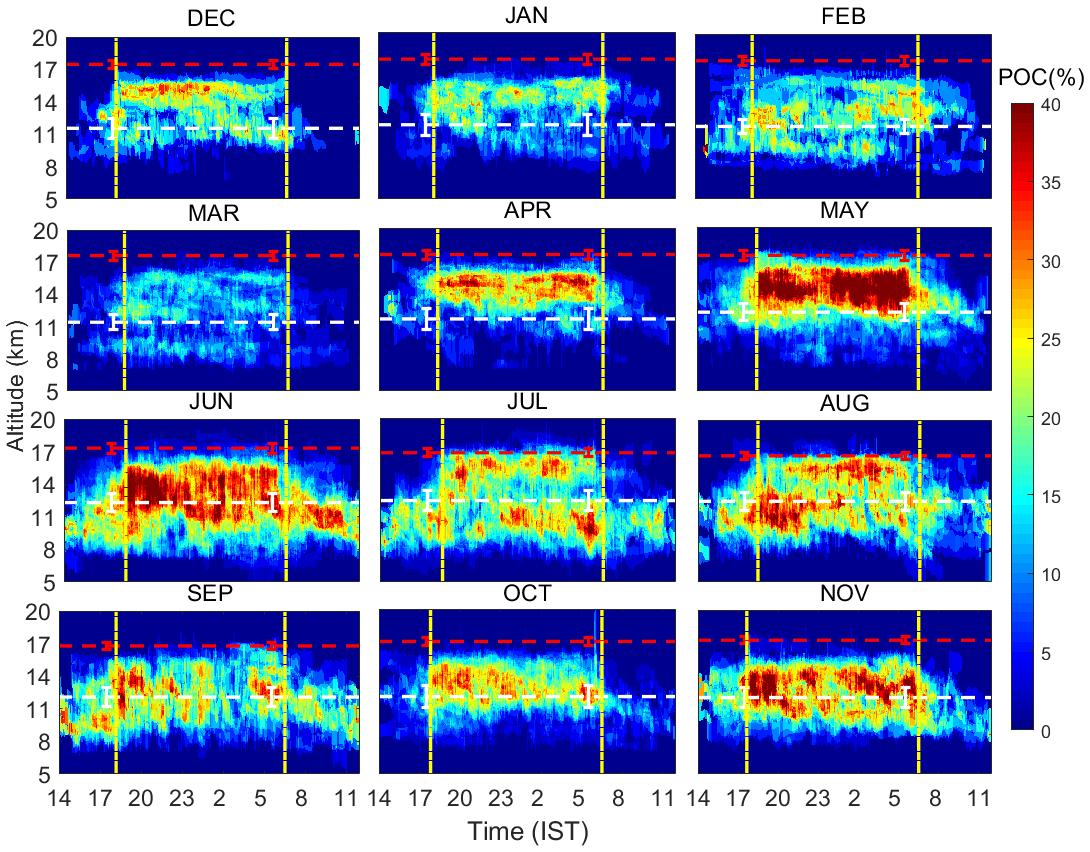
Figure 6Monthly occurrence of cirrus clouds as a function of time and altitude from 2016 to 2018. The mean CPT (red line) and COT (white line) altitudes for the corresponding months are also embedded. The standard deviation of the CPT altitude at 17:30 and 05:30 IST is also shown. Vertical dashed lines indicate the sunset and sunrise times.
During the winter season (December–February, DJF), the POC is observed from the evening (∼ 17:00 IST) of the first day to the morning (∼ 08:00 IST) of the following day over the altitude range of ∼ 8–17 km. Noel et al. (2018) also observed diurnal variation in the POC over the Northern Hemisphere (NH) tropical region during DJF using the Cloud–Aerosol Transport System (CATS). We have compared the POC obtained using the MPL with Noel et al. (2018), as shown in the Supplement (Fig. S3). The comparison from both ground-based and spaceborne observations appears consistent. However, the POC value from the point observation may differ from the POC calculated over the entire NH tropical region (Fig. S2a, c). It is found to be ∼ 10 %–25 %, with the highest POC over the altitude of ∼ 14–16 km, just below the mean CPT altitude (17.2 km), throughout the night (18:00–06:00 IST). The presence of the highest POC value over such a narrow region indicates the frequent occurrence of optically thin laminar cirrus (Sivakumar et al., 2003) due to an increase in sedimentation with a decrease in the CPT temperature. It can be seen that a POC very close to the CPT does not occur before the evening hours and after the morning hours. This could be due to either the dissipation of the optically very thin cirrus clouds with sunrise or the limited detection capability of the MPL under solar noise conditions. The decrease in the POC just below the CPT during the early morning hours supports this contention. It also indicates that cirrus clouds closer to the CPT are generally optically thin and do not descend but last longer. Furthermore, a higher POC is also noticed at altitudes between ∼ 8 and 12 km from ∼ 16:00 to 19:00 and from ∼ 02:00 to 07:00 IST. Although cirrus clouds are mainly optically thin during the winter season, cirrus sometimes appears to be descending due to an increase in the sedimentation load that gets deposited at the COT altitude and dissipated at lower altitudes due to an increase in temperature (Nair et al., 2012). Generally, cirrus clouds are either thin or subvisible during the winter season (Sivakumar et al., 2003), as this season is free from any deep convection. Sedimentation occurs due to a decrease in the temperature close to the tropopause. Our observation indicates that cirrus clouds are not always laminar and descend even in winter. Such descending cirrus during the winter season could be due to increases in sedimentation (Nair et al., 2012). However, the different types of cirrus clouds, such as descending and laminar cirrus clouds, are outside the scope of this study and will be reported in a separate study. At the same time, higher POC values near the COT during the evening and early night hours that last for a shorter duration appear to be locally generated due to turbulence (Satheesan and Krishna Murthy, 2002; Mushin et al., 2016), as it is known that turbulence frequently occurs during nighttime when compared with daytime over Gadanki (13.45∘ N, 79.2∘ E) close to our station (Chennai) (Mushin et al., 2016).
The POC during March is minimal (10 %–15 %); however, it extends from 8 to 16 km, similar to all of the other months. The POC during March shows two distinct layers: the first one within the TTL and the second one just below the TTL base. As mentioned earlier, the second peak in the occurrence of cirrus clouds could be remnants of the deep convective outflows. Compared with previous months, the POC significantly improved from April to May, with the maximum occurrence confined within the TTL.
During June–September, cirrus clouds frequently occur between 14:00 IST on the first day and 11:00 IST on the second day compared with the rest of the months. The POC varies between 10 % and 30 % during June, with the highest occurrence observed at night. The POC is limited to a height of 8–14 km during the daytime; however, it is in the altitude range of 8–17 km during nighttime. Note that cirrus clouds at higher altitudes (generally the thin and subvisible types) may remain undetected due to high solar noise during daytime. The POC during June–July–August (JJA) over Kattankulathur is found to be consistent with CATS observations over the NH tropical region (Noel et al., 2018); however, the magnitude differs, as mentioned earlier (Fig. S2b and d in the Supplement) The diurnal variation in the temperature in the upper troposphere (Mushin et al., 2017) seems to be the controlling factor of the higher occurrence and greater extent of cirrus clouds during nighttime compared with daytime. The limited vertical extent of the daytime cirrus cloud occurrence could be due to the limitation of the lidar with respect to detecting cirrus (due to high solar noise). Note that, during the SW monsoon season, deep convective clouds such as cumulonimbus clouds frequently occur at the same height (∼ 8–10 km) (Subrahmanyam and Kumar, 2013) at which cirrus clouds also occur. We have carefully examined the LDR to distinguish cirrus clouds from the cumulonimbus clouds (that have a high optical thickness) to avoid including such clouds. Cirrus clouds occur (i) sometimes above the CPT, (ii) several times below the mean TTL, and (iii) frequently as multilayer cirrus clouds during the SW monsoon season. Multilayer cirrus clouds occur with the upper layer close to the CPT and the lower layer close to the COT. During JJA, the upper layer of cirrus clouds mainly occurs after the sunset and before the sunrise (∼ 17:00–05:00 IST). As mentioned earlier, the cirrus layer close to the CPT could be generated in situ due to cold temperatures and the abundance of moisture transported from deep convection. At the same time, cirrus clouds close to the COT could be due to remnants of clouds from deep convective outflows.
In contrast, the lower layer of cirrus clouds occurs even before sunset and after sunrise. This indicates that the upper layer of cirrus clouds or multiple cirrus clouds would have disappeared after sunrise due to dissipation by solar heating or would have remained undetected due to high solar noise. However, the lower-layer cirrus clouds occur throughout the day and night, indicating the role of high moisture availability during the SW monsoon season. Compared with the rest of the seasons, the higher POC during the SW monsoon season mainly appears due to large-scale convection and the upper-tropospheric anticyclonic circulation (Parameswaran et al., 2003; Satheesan and Murthy, 2002).
The vertical structure of the POC has a lesser extent during the transition (October) from the SW monsoon season to the NE monsoon season. It is generally confined within the TTL, with fewer or no cirrus clouds above the CPT. During October, zonal wind in the upper troposphere changes to weak easterlies (Sunilkumar et al., 2010), decreasing the moisture due to horizontal transport from the Bay of Bengal and, thus, significantly reducing the POC. The inadequate supply of moisture due to the weakening of local convection reduces the sustenance of cirrus clouds. However, a relatively higher POC during November appears due to the prevalence of the NE monsoon over Kattankulathur. The convection during the NE monsoon is not as strong as during the SW monsoon, leading to the formation of cirrus clouds at relatively lower heights during November.
Overall, the POC varies from 20 % to 40 %, except during the March and October months with low occurrence. It is worth mentioning here that the lower POC value is found during the months when the zonal wind pattern transits from westerly to easterly (easterly to westerly) in the upper troposphere during March (October) over the Indian monsoon region (Goswami, 2005). It is well known that the zonal wind shear significantly changes the TTL temperature and, hence, cirrus cloud occurrence (Randel et al., 2002) by uplifting the humidity to the upper troposphere, which provides favorable conditions for the in situ formation of cirrus clouds (Das et al., 2011). We also examined the zonal wind shear using radiosonde observations at IMD Chennai (13.0∘ N, 80.18∘ E). Figure S4 in the Supplement indicates maximum shear within the 8–16 km altitude range from May–September, which is consistent with the POC. However, it should be noted that large-scale circulations and wave activities can also modulate TTL clouds (Held and Hoskins, 1985; Kim et al., 2013). Podglajen et al. (2018) observed that gravity waves affect the distribution of ice particles and that cirrus clouds are primarily confined to the altitude region where water vapor is saturated in association with positive zonal wind anomalies.
The top of cirrus clouds is observed at and above the CPT, especially during July and August. The occurrence of cirrus in the vicinity of and above the CPT has significant implications for the vertical and poleward transport of water vapor, resulting in a change in stratospheric ozone chemistry. Thus, we have segregated cirrus clouds occurring above the CPT and their corresponding altitude. It is observed that cirrus clouds frequently occur above the CPT during May (∼ 7 %), July (∼ 10 %), and August (∼ 9 %), as shown in the Supplement (Fig. S5). Only 2 %–3 % of cirrus clouds occur above the CPT during the rest of the months. We also calculated the altitudinal separation between the CPT and the cirrus cloud top occurring above the CPT for months with occurrences greater than 5 %. It is observed that the difference between the cirrus top and CPT altitudes is ∼ 0.35 ± 0.22, 0.28 ± 0.20, and 0.43 ± 0.35 km during May, July, and August, respectively. The occurrence of the cirrus top above the CPT indicates the transport of water vapor into the lower stratosphere. Such water vapor transport by means of the formation of cirrus clouds can radiatively affect stratospheric chemistry. Our observations indicate that the cirrus top occurring above the CPT varies between ∼ 0.1 and 0.7 km. It should be noted that the occurrence of the cirrus top above the CPT is calculated relative to the mean CPT altitude at 05:30 and 17:30 IST. However, the CPT shows significant diurnal variation, with amplitude ranging between 0.2 and 0.5 km (Mushin et al., 2017).
3.4 Vertical structure of the POC during different seasons
Figure 7 shows the vertical extent of cirrus occurrence; the monthly means and standard deviations of the altitudes of the cloud base, cloud top, CPT and COT; monthly total observations of the MPL; and the occurrence of single- and multilayer cirrus clouds. It can be seen that the POC has a greater vertical extent during January, February, March, June–September, and December, whereas it had a relatively lesser vertical extent during April–May and October–November. The POC is lower from December to March and higher from April–November. The peak of the POC varies during different months. The monthly variation in the altitude of the POC peak shows a strong seasonal variation, with higher altitude during the winter season and lower altitude during the SW monsoon season.
Cirrus clouds occur at higher altitudes from January to April, during which time the dry season prevails over Kattankulathur. During this time, the cloud-base and cloud-top altitudes (referred to as CBH and CTH, respectively, in Fig. 7b) show nearly in-phase variation with the COT altitude. This indicates that the main convective outflow provides a conducive mechanism for the formation of cirrus clouds. However, from May to November, Kattankulathur remains wet due to the frequent rainfall from the SW and NE monsoons. The strong convection during the SW and NE monsoons pushes the COT to a relatively higher altitude (Mehta et al., 2011). During this time, the mean cloud base occurs ∼ 1–2 km lower than the COT. During the SW and NE monsoon seasons, the higher moisture availability in the mid-troposphere results in the formation of cirrus clouds at lower levels. However, during these seasons, multiple cirrus clouds frequently occur. It can be seen that, although multiple cirrus clouds occur throughout the year, their frequencies are less than 10 %, except for May–August. The POC for the multiple cirrus clouds are found to be 19 %, 17 %, 15 %, and 14 % during May, June, July, and August, respectively (Fig. 7d). In the monthly mean occurrence profiles, the double peak is only discernible during July–August. This is because both single- and multilayer cirrus clouds have the same frequency during July–August, whereas the POC values for multilayer cirrus for other months is much lower than for single-layer cirrus clouds and are not discernible in the monthly mean occurrence profiles. The peak occurrence of upper-layer cirrus clouds close to the CPT could be generated in situ due to cold temperatures and the abundance of moisture transported from deep convection, whereas the peak occurrence of lower-layer cirrus clouds close to the COT could be due to the remnants of clouds from deep convective outflows. Both single- and multilayer cirrus clouds vary in phase with the CPT height and roughly out of phase with the COT altitude during May–December. Note that, in total, the MPL is operated more than 746 h every month, with a maximum duration of ∼ 1393 h during March over the period from 2016 to 2018 (Fig. 7c).

Figure 7(a) Monthly variation in the altitudinal extent of the POC; (b) monthly mean and standard deviations of the altitudes of the cloud base (CBH), cloud top (CTH), CPT, and COT; (c) monthly total observations of MPL; and (d) the occurrence of the single- and multilayer cirrus clouds over the period from 2016 to 2018. The suffixes “s” and “m” in relation to CBH and CTH denote “single” and “multi”, respectively.
We also obtained the vertical distribution of the POC during different seasons, such as DJF, MAM, JJA, and SON, as shown in the Supplement (Fig. S6). It can be seen that the detailed vertical structure of the POC observed during different months, as shown in Fig. 7, is absent when the POC is calculated with respect to season. The overall POC profile shows that cirrus clouds occur within the 8–17 km range, with a maximum POC of about 25 % in the altitude range of 13–15 km (a broad peak). It is observed that the POC gradually increases from 8.0 km to about ∼ 13–15 km and drastically decreases above this altitude to about 17 km. The maximum POC is about 2 km below the mean CPT altitude (∼ 17 km) and 1.0 km above the mean COT altitude. The peak of the POC is generally confined to the TTL. This is because the TTL is primarily characterized by very low temperature and a trace amount of water vapor, such that the moist adiabatic lapse rate approaches the dry adiabatic lapse rate; thus, the TTL is relatively stably stratified when compared with the troposphere below it (Fueglistaler et al., 2009). According to the dehydration mechanism, during the slow ascent of the TTL air parcel, trace water vapor gets freeze-dried due to the low temperature, leading to the frequent formation of cirrus clouds in the TTL (Jensen et al., 2013; McFarquhar et al., 2000).
The vertical distribution of the POC during different seasons shows unique characteristics. First of all, the POC varies significantly among the seasons, with the minimum occurrence during the winter season and the maximum occurrence during the other seasons. The maximum POC is found to be about 19 %, 29 %, 25 %, and 26 % during DJF, MAM, JJA, and SON, respectively. Second, the peak of the POC occurs at different altitudes during different seasons. The altitude of the maximum POC is at 15.5 km during DJF, 15.0 km during MAM, 12.0 and 15.0 km during JJA, and 13.0 km during SON. Thus, the peak POC is at a higher altitude during the winter and pre-monsoon seasons and at a lower altitude during the SW and NE monsoon seasons. Finally, the vertical structures of the POC are unique during different seasons.
During the winter season, the vertical profile of the POC shows a gradual increase from 8 to 15.5 km, a drastic decrease up to 17 km, and a few occurrences above it. The vertical profile of the POC during the pre-monsoon season shows that the occurrence increases gradually from the altitude above 8 to 15 km and gradually decreases up to 18 km. Unlike the winter season, the maximum POC during the pre-monsoon season has a relatively sharper peak that is confined to a narrow altitude region between 13 and 15 km. Although frequent convection does not occur during the pre-monsoon season, deep or very deep convection even penetrates the lower stratosphere, especially during the month of May (Devasthale et al., 2010). The POC at relatively higher altitudes during the pre-monsoon season could be due to the occurrence of very deep convection. The vertical distribution of the POC during the SW monsoon season shows double peaks at altitudes of about 12 and 15 km, unlike the other seasons. Generally, frequent convection, ranging from shallow to deep convection, occurs during the SW monsoon season and spurs a large amount of water vapor into the upper troposphere, causing the frequent occurrence of multiple cirrus clouds in the altitude range between 12 and 15 km. Such multiple layers of cirrus clouds could also be due to vertically propagating gravity waves (Tsuda et al., 1994; Murthy et al., 2002). In this season, the POC gradually increases from 8 to 12 km, shows a broad maximum characterizing a double peak at 12 and 15 km, and then gradually decreases above this altitude.
The vertical profile of the POC during the post-monsoon (NE) season shows a gradual increase from 8 to 13 km (peak altitude cirrus clouds) and then a gradual decrease to about 17 km. It is interesting to find that the POC shows a substantial interannual variation, with a higher POC during the year 2016 when compared with 2017–2018. This higher occurrence of the POC during 2016 is mainly due to the higher POC observed in the winter and SW monsoon seasons in 2016. The POC during the pre-monsoon and NE monsoon seasons does not show intraseasonal variation as large as that observed during the winter and SW monsoon seasons.
3.5 Interannual variation in the POC
As mentioned earlier, the seasonal variation in the POC, with maxima during the SW monsoon season and minima during the winter season, is well known over the Asian monsoon region. The SW monsoon, which provides an enormous amount of water vapor to the upper troposphere, mainly dominates the seasonal feature of the POC. Here, we have obtained the annual cycles of the POC, the monthly duration of total hours of lidar observations and cirrus observations, and the annual cycles of the CPT and COT altitudes for three years (2016, 2017, and 2018), as shown in Fig. 8. As mentioned earlier, in total, the lidar was operated for 11 778 h; of these 11 778 h, 5002 h (about 42.5 %) contained cirrus cloud observations over the period from 2016 to 2018. The POC values for the years 2016, 2017, and 2018 are 55.9 %, 38.7 %, and 36.8 %, respectively. We have listed the POC, CPT altitude, COT altitude, and TTL thickness (TTLt) during different seasons as well as for different years (2016, 2017, and 2018), as shown in the Supplement (Table S1). The years 2017 and 2018 show about the same percentage occurrence (38 %); however, the POC during 2016 is about 56 %, indicating a large interannual variation in the POC over Kattankulathur. The POC decreases from 72 % to 46 % during the SW monsoon season from 2016 to 2018. The POC values during the pre-monsoon and post-monsoon seasons of 2016 were ∼ 55 % and ∼ 48 %, respectively, and these values decreased by ∼ 12 % and ∼ 13.5 % during 2018. It should be noted that the TTL increased during the pre-monsoon season in 2016–2018. This feature was not seen in other seasons. Interestingly, the TTL thickness decreases with increasing POC, especially during the SW monsoon season.
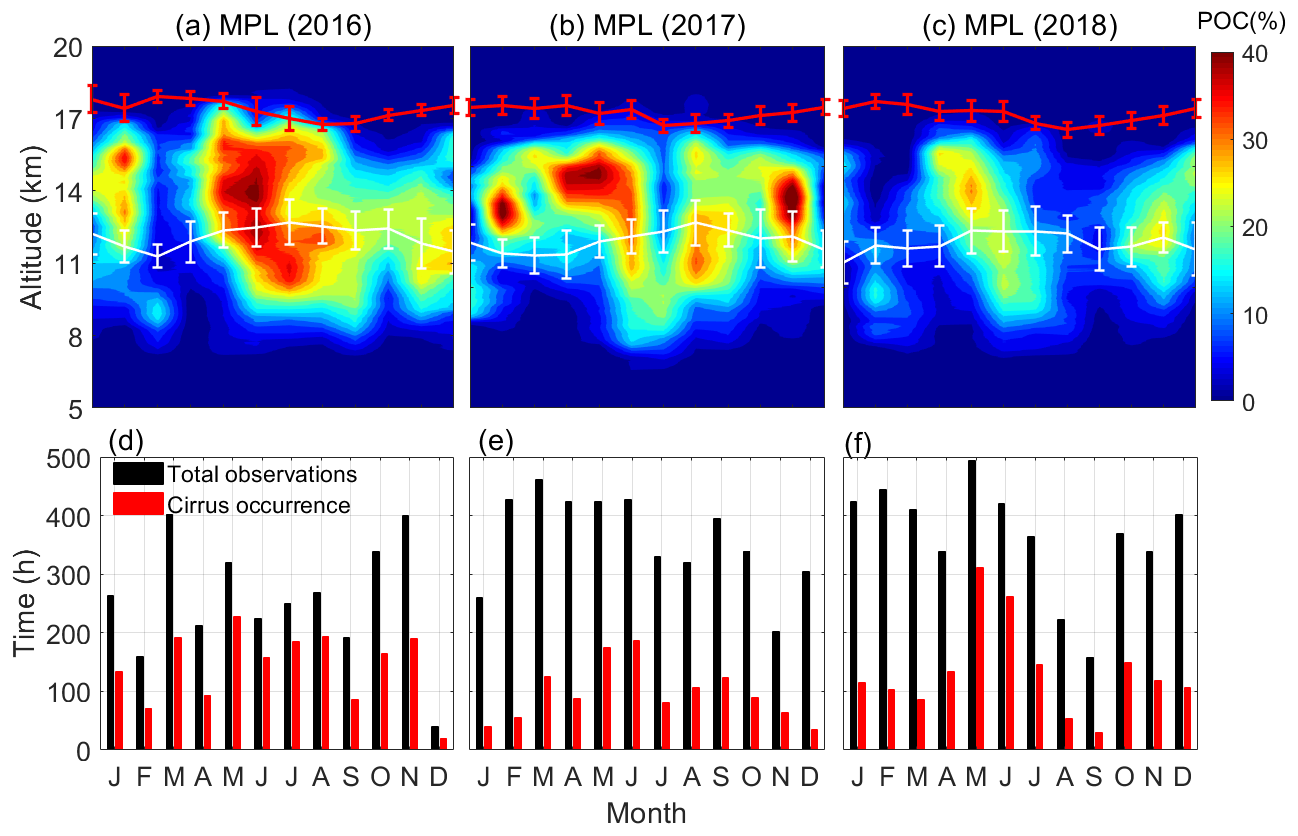
Figure 8Monthly variation in the POC as a function of altitude during (a) 2016, (b) 2017, and (c) 2018. The monthly mean CPT altitude (red line) and COT altitude (white line) with their standard deviations. (d–f) Total hours of lidar operation (black bars) and the available cirrus observations (red bars) for the corresponding year.
In general, the maximum POC is found to be during February, May–September, and November, whereas the minimum POC is during March and October. The observed higher POC during May–September and November appears to be related to the convective activities during the SW and NE monsoons, respectively. It can also be noticed that the POC is relatively higher during the SW monsoons in 2016 and 2017 compared with 2018. It is also observed that the POC during the NE monsoon, especially in November 2017, is higher than in November 2016 and 2018. We have examined the monthly mean variation in the OLR over central India, throughout Tamil Nadu, and over Kattankulathur (Chennai), as shown in the Supplement (Fig. S7). It can be seen that OLR <240 W m−2 starts to occur after May and persists until November. However, over central India, OLR < 240 W m−2 occurs only during June-September. An abundance of deep convective clouds during the SW monsoon season triggers the formation of cirrus clouds from the convective outflow anvil clouds. In addition, the TEJ advects the upper-level moisture from the South China Sea and the Bay of Bengal, while LLJ brings moisture from the Indian subcontinent that is favorable for cirrus cloud formation (Subrahmanyam et al., 2016). The higher POC observed during February may be associated with turbulence, which is prominent over the altitude range of ∼ 10–18 km during the winter season (Satheesan and Krishna Murthy, 2002).
The vertical extent of cirrus clouds is highly variable from month to month, as mentioned earlier. The cirrus cloud top is generally confined below the CPT altitude except during May–September, when the POC occurs below the COT altitude. Similar to our results, Pan and Munchak (2011) and Pandit et al. (2014) reported a POC above the CPT altitude. The layers of the maximum POC at ∼ 12 and ∼ 15 km and the minimum POC at ∼ 14 km characterize the multilayer cirrus clouds during the SW monsoon seasons. Such multiple cirrus layers are attributed to the nucleation, condensation, and subsequent freeze-drying of the moisture as a result of the slow updraft from the COT top (Meenu et al., 2011), the freeze-drying of the moisture transported at a relatively higher altitude due to TEJ (Das et al., 2011), and the cold temperature anomaly induced by wave activities near the tropopause (Kim et al., 2016). Although Kattankulathur is located in the rain shadow region of the SW monsoon season, it is located in the vicinity of the TEJ stream associated with upper-tropospheric circulations that seem to favor the frequent occurrence of cirrus clouds. The TEJ advects an enormous amount of moisture from the Bay of Bengal and a supply of moisture from convection results in the formation of cirrus clouds over a large vertical depth.
It is important to note that the enhanced occurrence of the POC from May to September was significantly reduced in the year 2017 except for the enhancement from March to April. We also observed enhancement in the POC immediately above the COT altitude to 14 km during February and November. The POC is observed to be significantly reduced above the COT altitude in July. The frequent occurrence of mid-level clouds could have prevented the lidar signals from detecting cirrus clouds. In contrast to 2016 and 2017, the POC during February, August, and September 2018 was significantly reduced.
Interestingly, the maximum POC observed at 16 km during April shifts to 9 km during July. The POC was also found to be just above the CPT altitude during 2016, which was not observed during 2017 and 2018. Such interannual variation in the POC appears to be related to the El Niño–Southern Oscillation (ENSO) and the quasi-biennial oscillation (QBO); these are the important factors influencing the interannual variation in the TTL cloud fractions (Tseng and Fu, 2017) and the TTL temperatures (Randel and Jensen, 2013). During the first half of 2016, stronger El Niño conditions were observed, whereas weak La Niña conditions prevailed for the other half of 2016 and during the second half of 2017 to the first half of 2018, as shown in the Supplement (Fig. S7). Westerly winds prevailed from January 2016 to June 2017 and from October to December 2018, whereas easterly winds prevailed from July 2017 to September 2018. These interannual components are known to modulate the TTL temperatures, thereby affecting the occurrence of cirrus clouds. In the presence of warm temperature anomalies, cirrus clouds may dissipate, whereas cirrus clouds may be generated in situ in the presence of cold temperature anomalies. It should be noted that relatively stronger convection was observed during the SW monsoons in 2016 and 2017 compared with the SW monsoon in 2018 over Chennai. In addition, relatively stronger convection was observed in association with a higher POC during November 2017 compared with November 2016 and 2018. It appears that the prevalence of convection is an important factor in such strong interannual variations in the POC over Kattankulathur (Chennai).
Figure 9 shows the relationship of the POC and convection (OLR) and the POC anomalies with the ENSO and QBO indices. We observed that the POC is negatively correlated () with OLR, indicating the higher occurrence of cirrus clouds during deeper convection. To understand the interannual variations in the POC, we have obtained the POC anomalies by subtracting the annual cycle calculated over the period from 2016 to 2018, as shown in Fig. 9b–c. Note that ENSO affects the upper-tropospheric temperature with a lag of 4 months (Mehta et al., 2015); thus, we have considered a 4-month lag in POC anomalies for ENSO (POC anomalies lagging ENSO). It is observed that the POC anomalies lagged at 4 months are positively correlated (r=0.51) with the ENSO index (significant at the 95 % confidence level). This indicates that occurrence is enhanced during El Niño years and decreases during La Niña years. The POC anomalies are also positively correlated (r=0.50) with the QBO index (significant at a 95 % confidence level). This indicates that the POC is enhanced during the westerly phases, whereas it decreases during the easterly phases. Although the POC shows a strong interannual variation in connection with the ENSO and QBO indices, we would like to investigate this aspect in more detail using longer-term data in a future study.
Cirrus clouds play an important role in the Earth–atmosphere radiation budget due to their greenhouse and albedo effects, which depend on the physical and optical properties. Therefore, a precise understanding of the physical properties (e.g., diurnal cycle and vertical extent) of cirrus cloud occurrence and cloud optical depth is a highly essential input to climate modeling and prediction. However, to the authors' knowledge, no such studies (on the diurnal variation in cirrus clouds) exist over the Indian monsoon region, mainly due to limited long-term continuous observations.
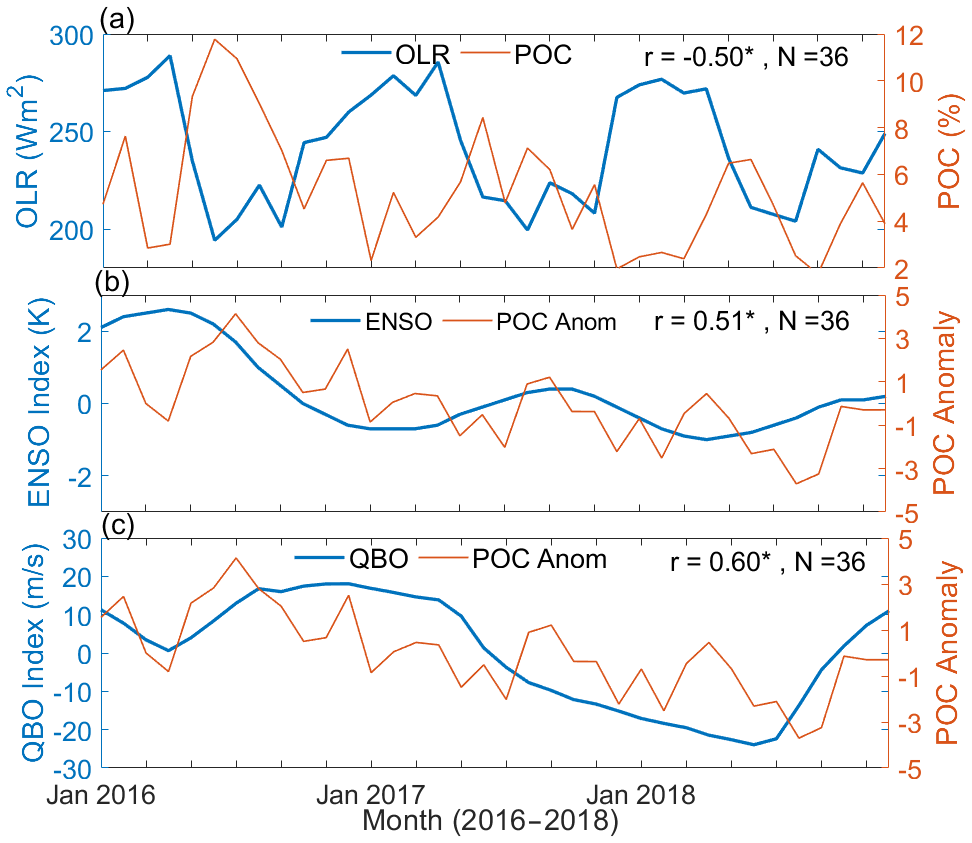
Figure 9The time series of (a) the POC and OLR, (b) a 4-month lagged ENSO index (the Niño 3.4SST anomalies) and POC anomalies, and (c) the QBO indices (the zonal wind at 50 hPa) and POC anomalies. The correlation coefficient (r) and the number of months (N) are also shown. An asterisk indicates that the correlation coefficient is significant at 95 % confidence level.
Hence, for the first time, our study presents the diurnal variation in cirrus clouds during different seasons over the NE monsoon region, Kattankulathur, located near the west coast of the Bay of Bengal. The cirrus cloud occurrence for the single and multiple layers identified by the zero-crossing method is evaluated using MPL observations between 14:00 IST on the first day and 11:00 IST on the second day over the period from 2016 to 2018. The main conclusions from this study are briefly summarized as follows:
-
Cirrus cloud occurrence shows a unique diurnal structure with a higher occurrence of single-layer cirrus in the late evening hours (18:00–21:00 IST) controlled by convective processes during the SW and NE monsoon seasons. For multilayer cirrus, in contrast, the occurrence is higher in the early morning hours (04:00–05:00 IST), subjugated by both freeze-drying and deep convection processes.
-
Deep convection and low tropopause temperatures are crucial for the enhancement of cirrus cloud occurrences. We calculated the frequency of occurrence of a brightness temperature < 240 K as a proxy for convection. The results indicate that the convection that occurs more frequently in the afternoon hours dominates the higher occurrence of evening single-layer cirrus clouds during the SW and NE monsoon seasons. We also obtained the frequency of occurrence of a CPT temperature < 191 K, which occurs more frequently during the morning hours throughout the year. This result indicates that the freeze-drying process is favorable for the higher occurrence of morning multilayer cirrus clouds at relatively higher altitudes.
-
The overall (single and multiple layers together) cirrus cloud occurrence shows a substantial seasonal variation. The occurrence is ∼ 10 %–25 % during the winter season with the highest occurrence over the altitude range of ∼ 14–16 km just below the mean CPT altitude (17.2 km). In this season, cirrus clouds are predominantly subvisible and are mostly generated in situ by the condensation of trace water vapor due to extremely cold temperatures at higher altitudes.
-
During the pre-monsoon season (March–May), cirrus cloud occurrence varies from 10 % to 30 %. The minimum occurrence is observed during March. During April–May, the occurrence shows a significant enhancement in the altitude range of 10–17 km, with peak occurrence (20 %–30 %) in the altitude range of ∼ 14–15 km, mainly confined within the TTL. The frequent thunderstorm activity during April–May appears to be the main reason for the phenomenal increase in cirrus cloud occurrence in these months.
-
During the SW monsoon season, cirrus cloud occurrence reaches a maximum (∼ 40 %), with frequent multilayer cirrus clouds. Cirrus clouds also occur more frequently below the TTL but rarely above the CPT. Although Kattankulathur is located in the rain shadow region of the SW monsoon, convection prevails. However, it is also located in the TEJ core region, which is favorable for the generation of cirrus due to wind shear (turbulence). Additionally, the TEJ advects an enormous amount of moisture from the Bay of Bengal. The supply of moisture from convection results in cirrus cloud occurrence over a large vertical extent (∼ 8–18 km).
-
During the NE monsoon seasons, cirrus occurrence has a limited vertical extent. It is generally confined within the TTL, with fewer or no occurrence of cirrus clouds above the CPT. Due to the weakening of local convection, the inadequate moisture supply reduces the sustenance of cirrus clouds during October. However, a relatively higher occurrence during November appears due to the prevalence of the NE monsoon over Kattankulathur. The convection during the NE monsoon is not as strong as that during the SW monsoon, leading to the formation of cirrus clouds at relatively lower heights during the former season.
-
The occurrence shows a distinct interannual variability, with higher occurrence during the year 2016 compared with 2017 and 2018. The occurrence during 2016, 2017, and 2018 was found to be ∼ 55.9 %, 38.7 %, and 36.8 %, respectively. We observed the role of ENSO and QBO in the interannual variations in cirrus clouds. The POC anomalies are positively correlated with the ENSO index, indicating a higher occurrence in El Niño years than in La Niña years. The POC anomalies also show a positive correlation with the QBO index, indicating a higher occurrence in westerly phases compared with easterly phases.
The present study shows the diurnal cycle of cirrus clouds, which will be helpful in the assessment of climate models. Although MPL detection is limited to mostly nocturnal cirrus clouds between 15:00 IST on the first day and 11:00 IST on the second day, it has captured the diurnal pattern in the occurrence of the single- and multilayer cirrus clouds that show augmentation during the evening and morning hours. In a future study, we are planning to explore temporally co-located satellite data simultaneous to MPL observations to unravel the day–night difference in cirrus cloud occurrence over Kattankulathur and adjoining regions.
The MPL data used in this study are not yet publicly available; however, the data can be provided upon request to the corresponding author.
The supplement related to this article is available online at: https://doi.org/10.5194/acp-22-8321-2022-supplement.
SKM was responsible for conceptualizing and supervising the study; carrying out the investigation; and writing, reviewing, and editing the paper. SA contributed to data curation, carried out the investigation, and prepared the original draft of the paper. AA was responsible for curating the data, developing software, and carrying out the investigation. TVRR contributed to data curation and carried out the investigation.
The contact author has declared that neither they nor their co-authors have any competing interests.
Publisher' note: Copernicus Publications remains neutral with regard to jurisdictional claims in published maps and institutional affiliations.
This work has been fully supported by the Department of Science and Technology, Government of India – Science and Engineering Research Board (DST-SERB) project (grant no. EMR/2015/000525). Sanjay Kumar Mehta wishes to thank the Earth Science and Technology Cell (ESTC), Ministry of Earth Sciences (MoES), for MPL observations. Saleem Ali is grateful to SERB for providing a fellowship for this study. Sanjay Kumar Mehta acknowledges MHRD, Government of India, for support within the framework of the Scheme for Promotion of Academic and Research Collaboration (SPARC) project (grant no.SPARC/2018–2019/P835/SL). The SRM HPCC facility was used to process the MPL data. The authors thank the reviewers and the handling editor, Peter Haynes, for their valuable comments and suggestions.
This research has been supported by the Science and Engineering Research Board (grant no. EMR/2015/000525).
This paper was edited by Peter Haynes and reviewed by Artem Feofilov and one anonymous referee.
Ali, S., Mehta, S. K., Annamalai, V., Ananthavel, A., and Reddy, R.: Qualitative observations of the cirrus clouds effect on the thermal structure of the tropical tropopause, J. Atmos. Sol.-Terr. Phys., 211, 105440, https://doi.org/10.1016/j.jastp.2020.105440, 2020.
Ananthavel, A., Mehta, S. K., Ali, S., Reddy, T. R., Annamalai, V., and Rao, D. N: Micro Pulse Lidar measurements in coincidence with CALIPSO overpasses: Comparison of tropospheric aerosols over Kattankulathur (12.82∘ N, 80.04∘ E), Atmos. Pollut. Res., 12, 101082, https://doi.org/10.1016/j.apr.2021.101082, 2021a.
Ananthavel, A., Mehta, S. K., Reddy, T. R., Ali, S., and Rao, D. N.: Vertical distributions and columnar properties of the aerosols during different seasons over Kattankulathur (12.82∘ N, 80.04∘ E): A semi-urban tropical coastal station, Atmos. Environ., 256, 118457, https://doi.org/10.1016/j.atmosenv.2021.118457, 2021b.
Annamalai, V. and Mehta, S. K.: Extreme variability of the tropical tropopause over the Indian monsoon region, Clim. Dynam., https://doi.org/10.1007/s00382-022-06264-7, 2022.
Campbell, J. R., Welton, E. J., Spinhirne, J. D., Ji, Q., Tsay, S. C., Piketh, S. J., and Holben, B. N.: Micropulse lidar observations of tropospheric aerosols over northeastern South Africa during the ARREX and SAFARI 2000 dry season experiments, J. Geophys. Res., 108, 8497, https://doi.org/10.1029/2002JD002563, 2003.
Chen, S. S. and Houze Jr., R. A.:Diurnal variation and life-cycle of deep convective systems over the tropical Pacific warm pool, Q. J. Roy. Meteorol. Soc., 123, 357–388, 1997.
Corti, T., Luo, B. P., Fu, Q., Vömel, H., and Peter, T.: The impact of cirrus clouds on tropical troposphere-to-stratosphere transport, Atmos. Chem. Phys., 6, 2539–2547, https://doi.org/10.5194/acp-6-2539-2006, 2006.
Cziczo, D. J. and Froyd, K. D.: Sampling the composition of cirrus ice residuals, Atmos. Res., 142, 15–31, https://doi.org/10.1016/j.atmosres.2013.06.012, 2014.
Dai, G., Wu, S., Song, X., and Liu, L.: Optical and Geometrical Properties of Cirrus Clouds over the Tibetan Plateau Measured by Lidar and Radiosonde Sounding at the Summertime in 2014, Remote Sens., 2019, 302, https://doi.org/10.1051/epjconf/201817605040, 2017.
Das, S. K., Chiang, C. W., and Nee, J. B.: Influence of tropical easterly jet on upper tropical cirrus: An observational study from CALIPSO, Aura-MLS, and NCEP/NCAR data, J. Geophys. Res.-Atmos., 116, D12, https://doi.org/10.1029/2011JD015923, 2011.
Dessler, A. E., Palm, S. P., Hart, W. D., and Spinhirne, J. D.: Tropopause-level thin cirrus coverage revealed by ICESat/Geoscience Laser Altimeter System, J. Geophys. Res.-Atmos., 111, 1–10, https://doi.org/10.1029/2005JD006586, 2006.
Devasthale, A. and Fueglistaler, S.: A climatological perspective of deep convection penetrating the TTL during the Indian summer monsoon from the AVHRR and MODIS instruments, Atmos. Chem. Phys., 10, 4573–4582, https://doi.org/10.5194/acp-10-4573-2010, 2010.
Davis, S. M., Liang, C. K., and Rosenlof, K. H.: Interannual variability of tropical tropopause layer clouds, Geophys. Res. Lett., 40, 2862–2866, 2013.
Dowling, D. R. and Radke, L. F.: A summary of the physical properties of cirrus clouds, J. Appl. Meteorol. Climatol., 29, 970–978, 1990.
Eriksson, P., Rydberg, B., Johnston, M., Murtagh, D. P., Struthers, H., Ferrachat, S., and Lohmann, U.: Diurnal variations of humidity and ice water content in the tropical upper troposphere, Atmos. Chem. Phys., 10, 11519–11533, https://doi.org/10.5194/acp-10-11519-2010, 2010.
Feofilov, A. G. and Stubenrauch, C. J.: Diurnal variation of high-level clouds from the synergy of AIRS and IASI space-borne infrared sounders, Atmos. Chem. Phys., 19, 13957–13972, https://doi.org/10.5194/acp-19-13957-2019, 2019.
Fleming, J. R. and Cox, S. K.: Radiative effects of cirrus clouds, J. Atmos. Sci., 31, 2182–2188, 1974.
Flynn, C. J., Mendoza, A., Zheng, Y., and Mathur, S.: Novel polarization-sensitive micropulse lidar measurement technique, Opt. Exp., 15, 2785–2790, 2007.
Fu, Q. and Liou, K. N.: Parameterization of the Radiative Properties of Cirrus Clouds, J. Atmos. Sci., 50, 2008–2025, https://doi.org/10.1175/1520-0469(1993)050<2008:POTRPO>2.0.CO;2, 1993.
Fueglistaler, S., Dessler, A. E., Dunkerton, T. J., Folkins, I., Fu, Q., and Mote, P. W.: Tropical tropopause layer, Rev. Geophys., 47, https://doi.org/10.1029/2008RG000267, 2009.
Fujiwara, M., Iwasaki, S., Shimizu, A., Inai, Y., Shiotani, M., Hasebe, F., Matsui, I., Sugimoto, N., Okamoto, H., Nishi, N., Hamada, A., Sakazaki, T., and Yoneyama, K.: Cirrus observations in the tropical tropopause layer over the western Pacific, J. Geophys. Res., 114, D09304, https://doi.org/10.1029/2008JD011040, 2009.
Goswami, B. N. and Xavier, P. K.: ENSO control on the south Asian monsoon through the length of the rainy season, Geophys. Res. Lett., 32, https://doi.org/10.1029/2005GL023216, 2005.
Gouveia, D. A., Barja, B., Barbosa, H. M. J., Seifert, P., Baars, H., and Pauliquevis, T.: Optical and geometrical properties of cirrus clouds in Amazonia derived from 1 year of ground-based lidar measurements, Atmos. Chem. Phys., 17, 3619–3636, https://doi.org/10.5194/acp-17-3619-2017, 2017.
Gupta, A. K., Rajeev, K., and Sijikumar, S.: Day-night changes in the altitude distribution, physical properties and radiative impact of low-altitude clouds over the stratocumulus-dominated subtropical oceans, J. Atmos. Sol.-Terr. Phys., 161, 118–126, 2017.
Haladay, T. and Stephens, G.: Characteristics of tropical thin cirrus clouds deduced from joint CloudSat and CALIPSO observations, J. Geophys. Res.-Atmos., 114, 1–13, https://doi.org/10.1029/2008JD010675, 2009.
Held, I. M. and Hoskins, B. J.: Large-scale eddies and the general circulation of the troposphere, in: Advances in geophysics, Elsevier, Vol. 28, 3–31, https://doi.org/10.1016/S0065-2687(08)60218-6, 1985
JCA Marrero, B. B.: Cirrus Clouds Optical Properties Measured With Lidar At Camagüey, Cuba, Propiedades Ópticas de Nubes Cirros Medidas con Lidar en Camagüey, Cuba, Opt. Pura Apl., 39, 11–16, 2006.
Heymsfield, A. J.: Ice particles observed in a cirriform cloud at −83 ∘C and implications for polar stratospheric clouds, J. Atmos. Sci., 43, 851–855, 1986.
Heymsfield, A. J. and Iaquinta, J.: Cirrus crystal terminal velocities, J. Atmos. Sci., 57, 914–936, 2000.
Jakob, C.: Ice clouds in numerical weather prediction models: Progress, problems, and prospects, Cirrus, Oxford University Press, https://doi.org/10.1093/oso/9780195130720.001.0001, 2002.
Jensen, E. J., Toon, O. B., Pfister, L., and Selkirk, H. B.: Dehydration of the upper troposphere and lower by subvisible cirrus clouds near the tropical tropopause, Geophys. Res. Lett., 23, 825–828, 1996.
Jensen, E. J., Diskin, G., Lawson, R. P., Lance, S., Bui, T. P., Hlavka, D., McGill, M., Pfister, L., Toon, O. B., and Gao, R.: Ice nucleation and dehydration in the Tropical Tropopause Layer, P. Natl. Acad. Sci. USA, 110, 2041–2046, https://doi.org/10.1073/pnas.1217104110, 2013.
Kim, J., Grise, K. M., and Son, S.-W.: Thermal characteristics of the cold-point tropopause region in CMIP5 models, J. Geophys. Res.-Atmos., 118, 8827–8841, https://doi.org/10.1002/jgrd.50649, 2013.
Kim, J.-E., Alexander, M. J., Bui, T. P., Dean-Day, J. M., Lawson, R. P., Woods, S., Hlavka, D., Pfister, L., and Jensen, E. J.: Ubiquitous influence of waves on tropical high cirrus clouds, Geophys. Res. Lett., 43, 5895–5901, 2016.
Kottayil, A., Satheesan, K., John, V. O., and Antony, R.: Diurnal variation of deep convective clouds over Indian monsoon region and its association with rainfall, Atmos. Res., 255, 105540, https://doi.org/10.1016/j.atmosres.2021.105540, 2021.
Kulkarni, P., Ramachandran, S., Bhavani Kumar, Y., Narayana Rao, D., and Krishnaiah, M.: Features of upper troposphere and lower stratosphere aerosols observed by lidar over Gadanki, a tropical Indian station, J. Geophys. Res., 113, D17207, https://doi.org/10.1029/2007JD009411, 2008.
Li, J., Yi, Y., Minnis, P., Huang, J., Yan, H., Ma, Y., and Ayers, J. K.: Radiative effect differences between multi-layered and single-layer clouds derived from CERES, CALIPSO, and CloudSat data, J. Quant. Spectrosc. Ra., 112, 361–375, 2011.
Liou, K. N.: Influence of cirrus clouds on weather and climate processes A global perspective, Mon. Weather Rev., 114, 1167–1199, https://doi.org/10.1175/1520-0493(1986)114<1167:IOCCOW>2.0.CO;2, 1986.
Liu, Z., Vaughan, M., Winker, D., Kittaka, C., Getzewich, B., Kuehn, R., Omar, A., Powell, K., Trepte, C., and Hostetler, C.: The CALIPSO Lidar Cloud and Aerosol Discrimination: Version 2 Algorithm and Initial Assessment of Performance, J. Atmos. Ocean. Technol., 26, 1198–1213, https://doi.org/10.1175/2009JTECHA1229.1, 2009.
Lynch, D. K.: Cirrus, Oxford University Press, https://books.google.co.in/books/about/Cirrus.html?id=58v1fg4xeo8C (last access: 25 October 2018), 2002.
Massie, S. T., Khosravi, R., and Gille, J. C.: A multidecadal study of cirrus in the tropical tropopause layer, J. Geophys. Res.-Atmos., 118, 7938–7947, https://doi.org/10.1002/jgrd.50596, 2013.
McFarquhar, G. M., Heymsfield, A. J., Spinhirne, J., and Hart, B.: Thin and Subvisual Tropopause Tropical Cirrus: Observations and Radiative Impacts, J. Atmos. Sci., 57, 1841–1853, https://doi.org/10.1175/1520-0469(2000)057<1841:TASTTC>2.0.CO;2, 2000.
Meenu, S., Rajeev, K., and Parameswaran, K.: Regional and vertical distribution of semitransparent cirrus clouds over the tropical Indian region derived from CALIPSO data, J. Atmos. Sol.-Terr. Phys., 73, 1967–1979, https://doi.org/10.1016/j.jastp.2011.06.007, 2011.
Mehta, S. K., Venkat Ratnam, M., and Krishna Murthy, B. V.: Characteristics of the tropical tropopause over different longitudes, J. Atmos. Sol.-Terr. Phys., 73, 2462–2473, 2011.
Mehta, S. K., Fujiwara, M., Tsuda, T., and Vernier, J. P: Effect of recent minor volcanic eruptions on temperatures in the upper troposphere and lower stratosphere, J. Atmos. Sol.-Terr. Phys., 129, 99–110, 2015.
Mitchell, D. L., Rasch, P., Ivanova, D., McFarquhar, G., and Nousiainen, T.: Impact of small ice crystal assumptions on ice sedimentation rates in cirrus clouds and GCM simulations, Geophys. Res. Lett., 35, https://doi.org/10.1029/2008GL033552, 2008.
Muhsin, M., Sunilkumar, S. V., Ratnam, M. V., Parameswaran, K., Murthy, B. K., Ramkumar, G., and Rajeev, K.: Diurnal variation of atmospheric stability and turbulence during different seasons in the troposphere and lower stratosphere derived from simultaneous radiosonde observations at two tropical stations, in the Indian Peninsula, Atmos. Res., 180, 12–23, 2016.
Muhsin, M., Sunilkumar, S. V., Venkat Ratnam, M., Krishna Murthy, B. V., and Parameswaran, K.: Seasonal and diurnal variations of tropical tropopause layer (TTL) over the Indian Peninsula, J. Geophys. Res.-Atmos., 122, 12–672, 2017.
Murthy, B. V. K., Satheesan, K., Parameswaran, K., Sasi, M. N., Ramkumar, G., Bhavanikumar, Y., Raghunath, K., and Krishniah, M.: Equatorial waves in temperature in the altitude range 4 to 70 km, Q. J. R. Meteorol. Soc., 128, 819–837, https://doi.org/10.1256/0035900021643700, 2002.
Nair, A. K. M., Rajeev, K., Mishra, M. K., Thampi, B. V., and Parameswaran, K.: Multiyear lidar observations of the descending nature of tropical cirrus clouds, J. Geophys. Res.-Atmos., 117, 1–9, https://doi.org/10.1029/2011JD017406, 2012.
Nazaryan, H., McCormick, M. P., and Menzel, W. P.: Global characterization of cirrus clouds using CALIPSO data, J. Geophys. Res.-Atmos., 113, 1–11, https://doi.org/10.1029/2007JD009481, 2008.
Noel, V., Chepfer, H., Chiriaco, M., and Yorks, J.: The diurnal cycle of cloud profiles over land and ocean between 51∘ S and 51∘ N, seen by the CATS spaceborne lidar from the International Space Station, Atmos. Chem. Phys., 18, 9457–9473, https://doi.org/10.5194/acp-18-9457-2018, 2018.
Pal, S. R., Steinbrecht, W., and Carswell, A. I.: Automated method for lidar determination of cloud-base height and vertical extent, Appl. Opt., 31, 1488, https://doi.org/10.1364/AO.31.001488, 1992.
Pan, L. L. and Munchak, L. A.: Relationship of cloud top to the tropopause and jet structure from CALIPSO data, J. Geophys. Res.-Atmos., 116, 1–17, https://doi.org/10.1029/2010JD015462, 2011.
Pandit, A. K., Gadhavi, H., Ratnam, M. V., Jayaraman, A., Raghunath, K., and Rao, S. V. B.: Characteristics of cirrus clouds and tropical tropopause layer: Seasonal variation and long-term trends, J. Atmos. Sol.-Terr. Phys., 121, 248–256, https://doi.org/10.1016/j.jastp.2014.07.008, 2014.
Pandit, A. K., Gadhavi, H. S., Ratnam, M. V., Raghunath, K., Rao, S. V. B., and Jayaraman, A.: Long-term trend analysis and climatology of tropical cirrus clouds using 16 years of lidar data set over Southern India, Atmos. Chem. Phys., 15, 13833–13848, https://doi.org/10.5194/acp-15-13833-2015, 2015.
Parameswaran, K., SunilKumar, S. V., Krishna Murthy, B. V., Satheesan, K., Bhavani Kumar, Y., Krishnaiah, M., and Nair, P. R.: Lidar observations of cirrus cloud near the tropical tropopause: Temporal variations and association with tropospheric turbulence, Atmos. Res., 69, 29–49, https://doi.org/10.1016/j.atmosres.2003.08.002, 2003.
Parameswaran, K., Sunilkumar, S. V., Murthy, B. K., and Satheesan, K.: Lidar observations of high altitude cirrus clouds near the tropical tropopause, Adv. Space Res., 34, 845–850, 2004.
Platt, C. M., Young, S. A., Carswell, A. I., Pal, S. R., McCormick, M. P., Winker, D. M., DelGuasta, M., Stefanutti, L., Eberhard, W. L., Hardesty, M., Flamant, P. H., Valentin, R., Forgan, B., Gimmestad, G. G., Jäger, H., Khmelevtsov, S. S., Kolev, I., Kaprieolev, B., Lu, D., Sassen, K., Shamanaev, V. S., Uchino, O., Mizuno, Y., Wandinger, U., Weitkamp, C., Ansmann, A., and Wooldridge, C.: The Experimental Cloud Lidar Pilot Study (ECLIPS) for Cloud – Radiation Research, Bull. Am. Meteorol. Soc., 75, 1635–1654, https://doi.org/10.1175/1520-0477(1994)075<1635:TECLPS>2.0.CO;2, 1994.
Podglajen, A., Plougonven, R., Hertzog, A., and Jensen, E.: Impact of gravity waves on the motion and distribution of atmospheric ice particles, Atmos. Chem. Phys., 18, 10799–10823, https://doi.org/10.5194/acp-18-10799-2018, 2018.
Ramkumar, T. K., Niranjan Kumar, K., and Mehta, S. K.: Mesosphere-stratosphere-troposphere radar observations of characteristics of lower atmospheric high-frequency gravity waves passing through the tropical easterly jet, J. Geophys. Res.-Atmos., 115, https://doi.org/10.1029/2009JD013733, 2010.
Randel, W. J. and Jensen, E. J.: Physical processes in the tropical tropopause layer and their roles in a changing climate, Nat. Geosci., 6, 169–176, 2013.
Randel, W. J., Garcia, R. R., and Wu, F.: Time-Dependent Upwelling in the Tropical Lower Stratosphere Estimated from the Zonal-Mean Momentum Budget, J. Atmos. Sci., 59, 2141–2152, https://doi.org/10.1175/1520-0469(2002)059<2141:tduitt>2.0.co;2, 2002.
Ratnam, M. V., Raman, M. R., Mehta, S. K., Nath, D., Krishnamurthy, B. V., Rajeevan, M., and Rao, D. N.: Sub-daily variations observed in Tropical Easterly Jet (TEJ) streams, J. Atmos. Sol.-Terr. Phys., 73, 731–740, 2011.
Reddy, T. R., Mehta, S. K., Ananthavel, A., Ali, S., Annamalai, V., and Rao, D. N.:Seasonal characteristics of sea breeze and thermal internal boundary layer over Indian east coast region, Meteorol. Atmos. Phys., 133, 217–232, 2020.
Riese, M., Ploeger, F., Rap, A., Vogel, B., Konopka, P., Dameris, M., and Forster, P.: Impact of uncertainties in atmospheric mixing on simulated UTLS composition and related radiative effects, J. Geophys. Res.-Atmos., 117, 1–10, https://doi.org/10.1029/2012JD017751, 2012.
Sandhya, M., Sridharan, S., Indira Devi, M., Niranjan, K., and Jayaraman, A.: A case study of formation and maintenance of a lower stratospheric cirrus cloud over the tropics, Ann. Geophys., 33, 599–608, https://doi.org/10.5194/angeo-33-599-2015, 2015.
Sassen, K. and Byung, S. C.: Subvisual-thin cirrus lidar dataset for satellite verification and climatological research, J. Appl. Meteorol. Climatol., 31, 1275–1285, 1992.
Sassen, K., Wang, Z., and Liu, D.: Global distribution of cirrus clouds from CloudSat/Cloud-Aerosol Lidar and Infrared Pathfinder Satellite Observations (CALIPSO) measurements, J. Geophys. Res., 113, D00A12, https://doi.org/10.1029/2008JD009972, 2008.
Sassen, K., Wang, Z., and Liu, D.: Cirrus clouds and deep convection in the tropics: Insights from CALIPSO and CloudSat, J. Geophys. Res.-Atmos., 114, 1–11, https://doi.org/10.1029/2009JD011916, 2009.
Satheesan, K. and Murthy, B. V. K.: Turbulence parameters in the tropical troposphere and lower stratosphere, J. Geophys. Res.-Atmos., 107, 1–13, 2002.
Selkirk, H. B.: The tropopause cold trap in the Australian monsoon during STEP/AMEX 1987, J. Geophys. Res.-Atmos., 98, 8591–8610, 1993.
Simpson, M., Warrior, H., Raman, S., Aswathanarayana, P. A., Mohanty, U. C., and Suresh, R.: Sea-breeze-initiated rainfall over the east coast of India during the Indian southwest monsoon, Nat. Hazard., 42, 401–413, 2007.
Sivakumar, V., Bhavanikumar, Y., Rao, P. B., Mizutani, K., Aoki, T., Yasui, M., and Itabe, T.: Lidar observed characteristics of the tropical cirrus clouds, Radio Sci., 38, https://doi.org/10.1029/2002RS002719, 2003.
Spinhirne, J. D., Palm, S. P., Hart, W. D., Hlavka, D. L., and Welton, E. J.: Cloud and aerosol measurements from GLAS: Overview and initial results, Geophys. Res. Lett., 32, 1–5, https://doi.org/10.1029/2005GL023507, 2005.
Stephens, G. L. and Webster, P. J.: Clouds and Climate: Sensitivity of Simple Systems, J. Atmos. Sci., 38, 235–247, https://doi.org/10.1175/1520-0469(1981)038<0235:CACSOS>2.0.CO;2, 1981.
Subrahmanyam, K. V. and Kumar, K. K.: CloudSat observations of cloud-type distribution over the Indian summer monsoon region, Ann. Geophys., 31, 1155–1162, https://doi.org/10.5194/angeo-31-1155-2013, 2013.
Sunil Kumar, S. V., Parameswaran, K., and Krishna Murthy, B. V.: Lidar observations of cirrus cloud near the tropical tropopause: General features, Atmos. Res., 66, 203–227, https://doi.org/10.1016/S0169-8095(02)00159-X, 2003.
Sunilkumar, S. V., Parameswaran, K., Rajeev, K., Krishna Murthy, B. V., Meenu, S., Mehta, S. K., and Babu, A.: Semitransparent cirrus clouds in the tropical tropopause layer during two contrasting seasons, J. Atmos. Sol.-Terr. Phys., 72, 745–762, https://doi.org/10.1016/j.jastp.2010.03.020, 2010.
Tseng, H.-H. and Fu, Q.: Tropical tropopause layer cirrus and its relation to tropopause, J. Quant. Spectrosc. Radiat. Transf., 188, 118–131, https://doi.org/10.1016/J.JQSRT.2016.05.029, 2017.
Tsuda, T., Murayama, Y., Wiryosumarto, H., Harijono, S. W. B., and Kato, S.: Equatorial waves and diurnal tides, J. Geophys. Res.-Atmos., 99, 10491–10505, https://doi.org/10.1029/94JD00355, 1994.
Vernier, J., Fairlie, T. D., Natarajan, M., Wienhold, F. G., Bian, J., Martinsson, B. G., Crumeyrolle, S., Thomason, L. W., and Bedka, K. M.: J. Geophys. Res.-Atmos., 120, 1608–1619, https://doi.org/10.1002/2014JD022372.Received, 2015.
Wang, T. and Dessler, A. E.: Analysis of cirrus in the tropical tropopause layer from CALIPSO and MLS data: A water perspective, , 117, 1–10, https://doi.org/10.1029/2011JD016442, 2012.
Welton, E. J., Voss, K. J., Quinn, P. K., Flatau, P. J., Markowicz, K., Campbell, J. R., Spinhirne, J. D., Gordon, H. R., and Johnson, J. E.: Measurements of aerosol vertical profiles and optical properties during INDOEX 1999 using micropulse lidars, J. Geophys. Res.-Atmos., 107, 1–20, https://doi.org/10.1029/2000JD000038, 2002.
Winker, D. M. and Trepte, C. R: Laminar cirrus observed near the tropical tropopause by LITE, Geophys. Res. Lett., 25, 3351–3354, 1998.
Wu, S., Song, X., Liu, B., Dai, G., Liu, J., Zhang, K., Qin, S., Hua, D., Gao, F., and Liu, L.: Mobile multi-wavelength polarization Raman lidar for water vapor, cloud and aerosol measurement, Opt. Express, 23, 33870, https://doi.org/10.1364/OE.23.033870, 2015.
Wylie, D., Jackson, D. L., Menzel, W. P., and Bates, J. J.: Trends in Global Cloud Cover in Two Decades of HIRS Observations, J. Clim., 18, 3021–3031, https://doi.org/10.1175/JCLI3461.1, 2005.
Yang, Q., Fu, Q., and Hu, Y.: Radiative impacts of clouds in the tropical tropopause layer, J. Geophys. Res.-Atmos., 115, https://doi.org/10.1029/2009JD012393, 2010.
Young, S. A.: Analysis of lidar backscatter profiles in optically thin clouds, Appl. Optics, 34, 7019–7031, 1995.