the Creative Commons Attribution 4.0 License.
the Creative Commons Attribution 4.0 License.
 | 28 Jun 2022
Seasonal updraft speeds change cloud droplet number concentrations in low-level clouds over the western North Atlantic
Christiane Voigt
Bruce Anderson
Ramon Campos Braga
Gao Chen
Andrea F. Corral
Ewan Crosbie
Hossein Dadashazar
Richard A. Ferrare
Valerian Hahn
Johannes Hendricks
Stefan Kaufmann
Richard Moore
Mira L. Pöhlker
Claire Robinson
Amy J. Scarino
Dominik Schollmayer
Michael A. Shook
K. Lee Thornhill
Edward Winstead
Luke D. Ziemba
Armin Sorooshian
To determine the impact of dynamic and aerosol processes on marine low clouds, we examine the seasonal impact of updraft speed w and cloud condensation nuclei concentration at 0.43 % supersaturation () on the cloud droplet number concentration (NC) of low-level clouds over the western North Atlantic Ocean. Aerosol and cloud properties were measured with instruments on board the NASA LaRC Falcon HU-25 during the ACTIVATE (Aerosol Cloud meTeorology Interactions oVer the western ATlantic Experiment) mission in summer (August) and winter (February–March) 2020. The data are grouped into different loadings, and the density functions of NC and w near the cloud bases are compared. For low updrafts (w < 1.3 m s−1), NC in winter is mainly limited by the updraft speed and in summer additionally by aerosols. At larger updrafts (w > 3 m s−1), NC is impacted by the aerosol population, while at clean marine conditions cloud nucleation is aerosol-limited, and for high it is influenced by aerosols and updraft. The aerosol size distribution in winter shows a bimodal distribution in clean marine environments, which transforms to a unimodal distribution in high due to chemical and physical aerosol processes, whereas unimodal distributions prevail in summer, with a significant difference in their aerosol concentration and composition. The increase of is accompanied with an increase of organic aerosol and sulfate compounds in both seasons. We demonstrate that NC can be explained by cloud condensation nuclei activation through upwards processed air masses with varying fractions of activated aerosols. The activation highly depends on w and thus supersaturation between the different seasons, while the aerosol size distribution additionally affects NC within a season. Our results quantify the seasonal influence of w and on NC and can be used to improve the representation of low marine clouds in models.
- Article
(3199 KB) - Full-text XML
- BibTeX
- EndNote


Understanding cloud formation processes and their influence on the Earth's climate system is fundamental to assessing climate model forecast quality (Zelinka et al., 2014, 2017; Seinfeld et al., 2016; IPCC, 2021). The results of the model evaluation activities of the Coupled Model Intercomparison Project Phase 6 (CMIP6) show that improvements in cloud representation result in stronger shortwave cloud feedbacks and higher effective climate sensitivity to the global mean surface air temperature of the CMIP6 model ensemble (Bock et al., 2020). In particular, regions with large multi-model mean biases in near-surface air temperature and their cloud feedback are of high interest (Andrews et al., 2015; Ceppi et al., 2017) and targeted by various field campaigns (e.g., Lu et al., 2007; Hersey et al., 2009; Wood et al., 2011; Russell et al., 2013; Knippertz et al., 2015; Wendisch et al., 2016; Flamant et al., 2018; Sorooshian et al., 2018; Formenti et al., 2019; Sorooshian et al., 2019).
Atmospheric aerosols can act as cloud condensation nuclei (CCN) and activate to cloud droplets in favorable conditions, determined by atmospheric ambient parameters such as supersaturation and aerosol size and chemical composition (Köhler, 1936; Twomey, 1959; Koehler et al., 2006; Reutter et al., 2009; Rosenfeld et al., 2014; Cecchini et al., 2017; Prabhakaran et al., 2020). This leads to an alteration of cloud droplet number concentration NC (Twomey and Warner, 1967) and consequential cloud radiative effects (Twomey, 1977; Rosenfeld et al., 2019). Higher aerosol concentrations and additional CCN activation increase cloud lifetime and thickness by suppressing precipitation (Albrecht, 1989; Freud and Rosenfeld, 2012; Braga et al., 2017b). There are several approaches to quantifying NC with satellite measurements. A direct approach utilizes the cloud optical depth, the cloud droplet effective radius and cloud top temperature (Grosvenor et al., 2018). An indirect approach exploits the aerosol–cloud interaction and uses the aerosol optical depth (AOD) as a proxy for NC (Quaas et al., 2008). (A list of symbols and abbreviations is given in Appendix A) Both approaches have high uncertainty; i.e., retrieving NC with AOD from satellites remains a challenge (Gryspeerdt et al., 2017; Painemal et al., 2020). Rosenfeld et al. (2016) have shown that based on a satellite methodology, it is possible to retrieve cloud base NC and supersaturation, which further yields the CCN concentration at a given supersaturation with an accuracy of ± 30 %. However, satellites measure bulk properties, which are limited in observing mechanisms on a microphysical scale (McComiskey and Feingold, 2012). Consequently, in situ measurements are needed to validate and enhance understanding of the respective cloud processes.
This work focuses on the western North Atlantic Ocean (WNAO) (Sorooshian et al., 2020), which provides ideal conditions for studying aerosol cloud interactions due to influence from the polluted east coast of North America. Dadashazar et al. (2021b) find an anti-correlation in the seasonal cycle of AOD and NC for this area, which is in contrast to findings in other regions (e.g., Penner et al., 2006, 2011; Quaas et al., 2008; Gryspeerdt et al., 2016). Braga et al. (2017a) use a statistical approach (Haddad and Rosenfeld, 1997) to quantify the relationship of w to NC at cloud bases of convective clouds over the Amazon basin. Braga et al. (2021) show good agreement of the derived relationship with an adiabatic parcel model. Our analysis focused on w and aerosol impact on NC in marine boundary layer stratus and stratocumulus clouds near cloud base.
Global aerosol–climate simulations still suffer from large uncertainties in the representation of aerosol–cloud–radiation interactions (e.g., Myhre et al., 2013). Particularly large model uncertainties persist with regard to aerosol effects on marine clouds (e.g, McCoy et al., 2020, 2021). Simulating aerosol–cloud interactions in such models requires the application of microphysical two-moment cloud schemes in combination with aerosol sub-models providing information about aerosol properties relevant for cloud formation (e.g., Lohmann et al., 2007; Lohmann and Hoose, 2009; Righi et al., 2020). Aerosol effects on NC are described in these models on the basis of dedicated parameterizations (e.g., Abdul-Razzak and Ghan, 2000; Ghan et al., 2011) which are driven by model information about the aerosol size distribution and composition as well as w. Comparisons with observational data are essential to evaluate the robustness of simulating these quantities as well as the resulting NC. The present study provides consistent information about all of these quantities under marine conditions for different seasons. Hence it is a valuable contribution to the database available for global aerosol–climate model evaluation and can, therefore, trigger important improvements of aerosol–climate simulations and the applied parameterizations of the cloud nucleation process.
In the following sections we show that the aerosol size distribution in combination with w determines NC near cloud base of marine clouds, regardless of thermodynamical conditions. Furthermore, the aerosol size distribution indicates the availability of CCN from the aerosol population and w with the corresponding supersaturation signifying the fraction of activated CCN over the WNAO.
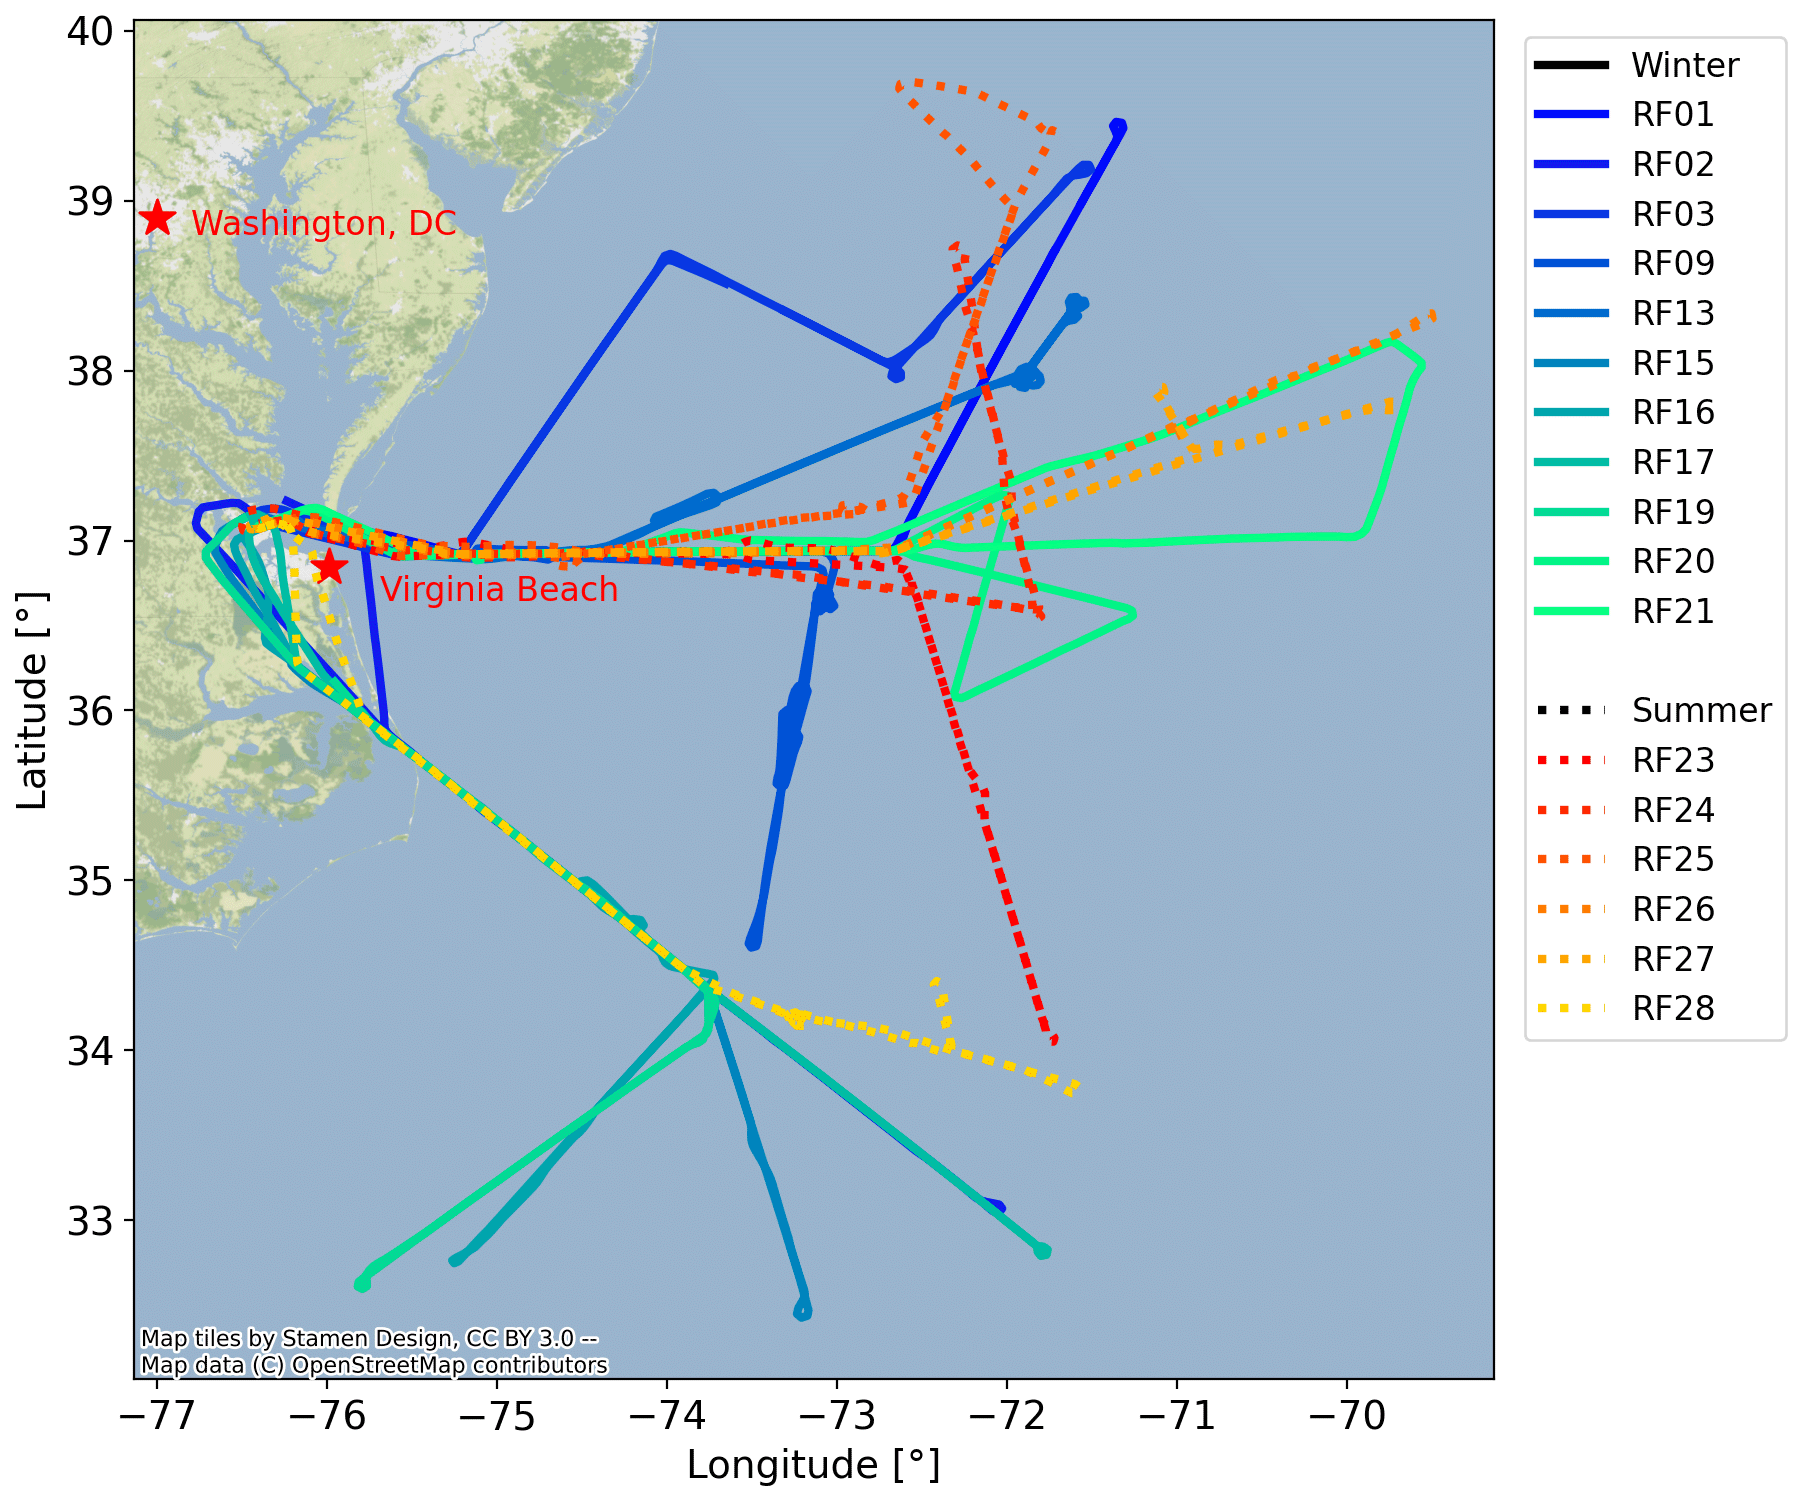
Figure 1The subset of HU-25 flight tracks used during the first year of ACTIVATE flights in 2020. Each line represents a research flight with the running number of deployment. Lines colored with shades of blue to green represent flights during winter (February–March), while dotted orange lines indicate flights during summer (August).
2.1 Region of study during the ACTIVATE campaign
The Aerosol Cloud meTeorology Interactions oVer the western ATlantic Experiment (ACTIVATE) campaign (Sorooshian et al., 2019) is focused on probing clouds between 25–50∘ N and 60–85∘ W. Clouds are characterized simultaneously by the low-flying NASA Langley Falcon HU-25 and the King Air UC-12 flying above. The Falcon HU-25 provides detailed in situ measurements of aerosol, cloud, gas and meteorological properties by sampling the marine boundary layer (MBL) at different altitudes down to 150 m above sea level, while the UC-12 probed clouds with remote-sensing instruments flying at 8–10 km. The ACTIVATE mission plans for flights in 3 consecutive years (2020–2022) with 150 joint research flights (RFs) and a total number of 600 flight hours per aircraft, where 40 RFs (35 joint, 5 alone with Falcon HU-25) with around 130 flight hours per plane were conducted in the first year, 2020. Here we use measurements from the Falcon HU-25 RF of 2020 shown in Fig. 1.
2.2 Instrumentation
2.2.1 Cloud measurements: the Fast Cloud Droplet Probe
The Fast Cloud Droplet Probe (FCDP) (O'Connor et al., 2008; Knop et al., 2021) manufactured by Stratton Park Engineering Company Incorporated (SPEC Inc.) is a forward-scattering probe which counts single particles in the diameter size range of 1.5–50 µm. In this analysis we use only particles with diameters larger than 3 µm. The FCDP uses a laser beam at 785 nm wavelength to collect light scattered by particles passing through the laser beam according to Mie theory in a 4–12∘ collection angle. A 70:30 beam splitter is used to split the collected light to a signal and qualifier detector. The signal detector has a 800 µm pinhole for coincidence reduction (Lance, 2012) and a rectangular slit aperture with 800 µm length and 200 µm width. Both detectors convert the incoming light intensity into corresponding voltages and amplify them over two stages. The beam diameter on the detectors depends on the distance of the measured particle from the focal plane of the collecting lens system. The ratio of the qualifier voltage to signal voltage is the so-called depth of field (DoF) criterion which can be used to limit the sample area of the probe because the slit aperture width restricts the intensity on the qualifier detector depending on the magnification of the beam diameter. In this analysis we use a DoF criterion > 0.6, which is equivalent to a calibrated sample area of 0.248 mm2 (Lance et al., 2010; Faber et al., 2018). With a sampling rate of 25 ns, the FCDP additionally stores the transit time, inter-arrival time and waveform of each particle. These parameters are used for data corrections; see Baumgardner et al. (1985) and SPEC inc (2012). Coincidence correction is applied by deriving a theoretical particle transit time, determined by particle air speed (PAS) and particle diameter, under consideration of a top-hat intensity along the laser beam cross section. Measured particles with transit times larger than 125 % of the theoretical transit time are deemed coincident and are thus discarded. A shattering correction is done using the adaptive method, and a waveform symmetry filter is applied; both methods are described in SPEC inc (2012).
According to Baumgardner et al. (2017), light scattering probes have a propagated uncertainty in size due to Mie ambiguity, collection angles, coincidence, nonsphericity and shattering of 10 %–50 % and a propagated uncertainty in NC due to sample area uncertainty, coincidence and shattering of 10 %–3 % (Kleine et al., 2018; Bräuer et al., 2021a, b). The FCDP, with its fast electronics, small pinhole feature for coincidence reduction and applicable filtering techniques, is estimated to be among the lower end of both propagated uncertainties in size and NC.
2.2.2 Cloud measurements: the Two-Dimensional Stereo Probe
The Two-Dimensional Stereo probe (2D-S) from SPEC Inc. is an optical array probe which generates shadow images of particles with a linear array of 128 photodiodes (Lawson et al., 2006, 2019). It measures single particles in a size range of 5.7–1465 µm with a calibrated effective pixel size of 11.4 µm for each photodiode channel. The 2D-S has two identical subsystems perpendicularly aligned with a combination of transmitting and receiving arm each. Both arms operate with a laser of 785 nm wavelength, and traversing particles generate a diffraction pattern according to diffraction theory. Similar to the FCDP, the 2D-S has an optical plane, determined by the focal points of the light collecting lens system. Each photodiode is triggered if light intensity falls below a threshold of 50 %. All shadowed photodiodes are recorded at a fast succession, specified by the sampling rate, while a particle passes the laser beam. A recorded ensemble of slices produces a two-dimensional image of the particle (Knollenberg, 1970).
The sample area of the 2D-S depends on the particle size. The diffraction pattern can be calculated analytically with angular spectrum theory or fresnel theory (Korolev et al., 1991) and depends on the particles' distance to the optical plane. With increasing distance, the diffracted light forms spots of destructive interference, and the particle is magnified. These particles are classified as out of focus. In the case of spheroidal liquid droplets, the so-called Poisson spot forms at the center of the projected circle, and a size correction can be applied by relating the radius of the Poisson spot to that of the captured particle image (Korolev, 2007). The magnification results in a decrease of the shadowing on the photodiodes until it is below the 50 % threshold and no photodiode is triggered. The size-dependent optical depth of field was verified for optical array probes according to Korolev et al. (1998). The maximum optical depth of field equals half of the 63 mm distance of the 2D-S transmitting arm to the receiving arm. The maximum is reached with a drop radius of 109 µm and the maximum sample area can be calculated by multiplying the arm distance with the array width. In this work the all-in method is used to determine the effective array width and thus the sample area. The all-in method rejects particles with occulted edge photodiodes and adjusts the sample area depending on size because the possibility of large particles rejected is higher compared to small particles (Knollenberg, 1970).
The 2D-S measures with a constant sampling rate resulting in an artificially elongated/shortened particle image if the actual PAS deviates from the PAS for which the sampling rate was computed. The PAS was measured by a pitot tube attached to a Cloud, Aerosol and Precipitation Spectrometer (Voigt et al., 2017, 2021), which was mounted on the opposite wing at the same position as the 2D-S–FCDP combination. With the PAS-to-sampling-rate ratio, the deformed images can be corrected (Weigel et al., 2016).
Sizing accuracy is affected by out-of-focus and shattered particles, the time response and discretization of the probe hardware and lies for imaging probes in a 10 %–100 % range according to Baumgardner et al. (2017). While the uncertainty of out-of-focus spheroids is reduced with Korolev's correction, it remains for ice particles. The 2D-S has a relatively fast response time of 41 ns and can be classified on the lower end of the uncertainty range for spheroids and in the middle for ice particles (Lawson and Baker, 2006; Baker and Lawson, 2006; Gurganus and Lawson, 2018). The concentration is affected by the size-dependent optical depth of field and shattering (Lawson, 2011). With shattering removal and an adjusted sample area, the 2D-S here is similarly representative of the lower range of 10 %–100 % propagated uncertainty in NC.
Measured size distributions of FCDP and 2D-S overlap in the size range of 16–51.3 µm. We perform the overlap calculation for the size range between the lower FCDP bin edge at 27 µm and the upper 2D-S bin edge of 39.9 µm. The particle distribution inside the overlap 2D-S bin is estimated with the next 2D-S bin by linear interpolation and attributed proportionally to the last FCDP bin and a new 2D-S bin.
2.2.3 Vertical velocity
The winds on the HU-25 are measured by the NASA Langley TAMMS (turbulent air motion measurement system). The primary components include fast-response flow-angle and temperature sensors to determine the wind with respect to the aircraft along with an Applanix 650 inertial navigation system (Applanix Inc.) to provide the aircraft's position, speed and altitude. The data are recorded at 200 Hz on a UEIPAC-300 real-time controller (United Electronics Industries) and then averaged down to 20 Hz for processing, analysis and data archiving. The flow-angle system includes five flush-mounted pressure ports installed in a cruciform pattern in the aircraft radome to provide angle of attack (vertically aligned ports) and side-slip (horizontally aligned ports) measurements. Corresponding fast-response high-precision pressure transducers are placed as close as possible to the pressure ports in order to minimize delays and errors. Pitch and yaw maneuvers, speed variations and reverse headings are performed periodically during deployments to verify system operation and calibration and validate derived mean horizontal-wind vectors. Three-dimensional winds are computed from the full air motion equations (Lenschow, 1986). The aircraft platform velocity components are computed internally by the Applanix by combining the GPS and inertial data via a Kalman filtering technique. Ambient air temperature measurements needed to determine true air speed are made with a Rosemount Model 102 non-deiced total air temperature sensor with a fast-response platinum sensing element (E102E4AL). This setup has been used extensively for other campaigns on the NASA P-3 aircraft. Additional details on the instrumentation, calibration and intercomparison results of the TAMMS when used on the NASA P-3 can be found in Thornhill et al. (2003). All wind measurements including horizontal and vertical winds have a 5 % uncertainty.
2.2.4 Aerosol measurements: cloud condensation nuclei
The CCN number concentrations were measured with a CCN-100 counter manufactured by Droplet Measurement Technologies, which is based on the concept of Roberts and Nenes (2005) and characterized by Lance et al. (2006). The CCN-100 was operated in two modes during ACTIVATE. The first is a continuous flow mode, where ambient air enters a column-shaped humidified chamber with a constant supersaturation of 0.43 %. Aerosols are activated depending on their size and chemical properties. The droplets are measured afterwards by an optical particle counter. The second is a scanning flow mode, where the flow rate in the chamber is changed while a constant temperature gradient is maintained (Moore and Nenes, 2009). Here an aerosol sample is exposed to a continuously changing supersaturation in the chamber, and the concentration of activated aerosols NCCN is measured depending on supersaturation. One scan is typically done in a 10–60 s time interval, and in this analysis we use the mean of NCCN in a supersaturation range of 0.40 %–0.46 % to approximate . The uncertainty in percent supersaturation is ± 0.04 and in ± 10 %.
2.2.5 Aerosol measurements: chemical composition
Submicron non-refractory aerosol chemical composition was measured by a high-resolution time-of-flight aerosol mass spectrometer (HR-ToF-AMS; Aerodyne Research Inc. DeCarlo et al., 2006; Hilario et al., 2021). Mass concentrations of sulfate, nitrate, chloride, ammonium and organic matter were recorded at 1 Hz and averaged to 30 s for all subsequent analyses. Measurements were made isokinetically using a forward-facing dual-diffuser aircraft inlet (model 1200, Brechtel Manufacturing Inc.) and were pressure-controlled at 500 Torr (equivalent to 66.7 Pa). Mass concentrations were processed using default relative ionization efficiencies for each chemical component, with a collection efficiency of unity, and are reported at standard temperature and pressure (STP; 273.15 K and 1013.25 mb).
The particle-into-liquid sampler (PILS) obtained water-soluble aerosol composition data. Sampled aerosol particles were grown into droplets that were collected via inertial impaction and transported to vials on a rotating carousel. The liquid content of the vials was analyzed post-flight via ion chromatography for water-soluble ions (Sorooshian et al., 2006). This study reports on sea salt concentrations by attributing Na+, Cl− and Mg2+ exclusively to sea salt and adding (0.25), K+ (0.036) and Ca2+ (0.039) fractions based on their ratio to Na+ in seawater (Bowen, 1979; Farren et al., 2019; Ma et al., 2021). The PILS samples particles up to roughly 4 µm in diameter (McNaughton et al., 2007; Hilario et al., 2021).
2.2.6 Aerosol measurements: size distribution
Aerosol size distributions were obtained from a combination of two particles sizers. A custom scanning mobility particle sizer (SMPS; Differential Mobility Analyzer model 3085) and condensation particle counter (model 3776, TSI, Inc., Moore et al., 2017) measured 3.2–89.1 nm diameter particle size distributions at approximately 60 s time response. A laser aerosol spectrometer (LAS; model 3340, TSI, Inc.; Moore et al., 2021) measured 100–3162 nm diameter particles at 1 Hz time response. SMPS sizing is calibrated and frequently verified using NIST-traceable polystyrene latex spheres. LAS sizing is calibrated using lab-generated monodisperse ammonium sulfate (refractive index = 1.52). Each instrument sampled dried air from the same common inlet as the HR-ToF-AMS, and data are reported at STP.
2.3 Methodology
In this study we select the data a priori into pairs of series of below-cloud-base (BCB) and above-cloud-base (ACB) legs, resulting in two pairs per ensemble (ensemble is a collection of legs below, in and above clouds) flown during ACTIVATE, shown in Fig. 2. This flight design intends for measurements to reflect the same environment. Closely spaced aerosol and cloud measurements are ensured by taking the latest full NCCN scan or 60 s of continuous measurements of the BCB leg, and the last measurement of a cloud portion in the nearest ACB leg is restricted to never exceed a horizontal distance of 40 km to the aerosol measurement. Cloud periods are defined as seconds with a threshold of liquid water content > 0.02 g m−3 and NC > 20 cm−3. We additionally excluded pairs with precipitation occurrences in the BCB leg using the 2D-S size distribution and images, since the measurements are influenced by the large particles shattering on the aerosol inlet, and precipitation indicates that the cloud is at a different point of its life cycle where agglomeration and coalescence altered NC and aerosol removal occurred below cloud. Each flight leg pair consists of a distribution taken from the pair's BCB leg either in continuous flow or scanning flow mode, a mean aerosol loading derived from the distribution, and NC and positive vertical velocity measurements (updraft speeds w) in cloud portions of the pair's ACB leg.
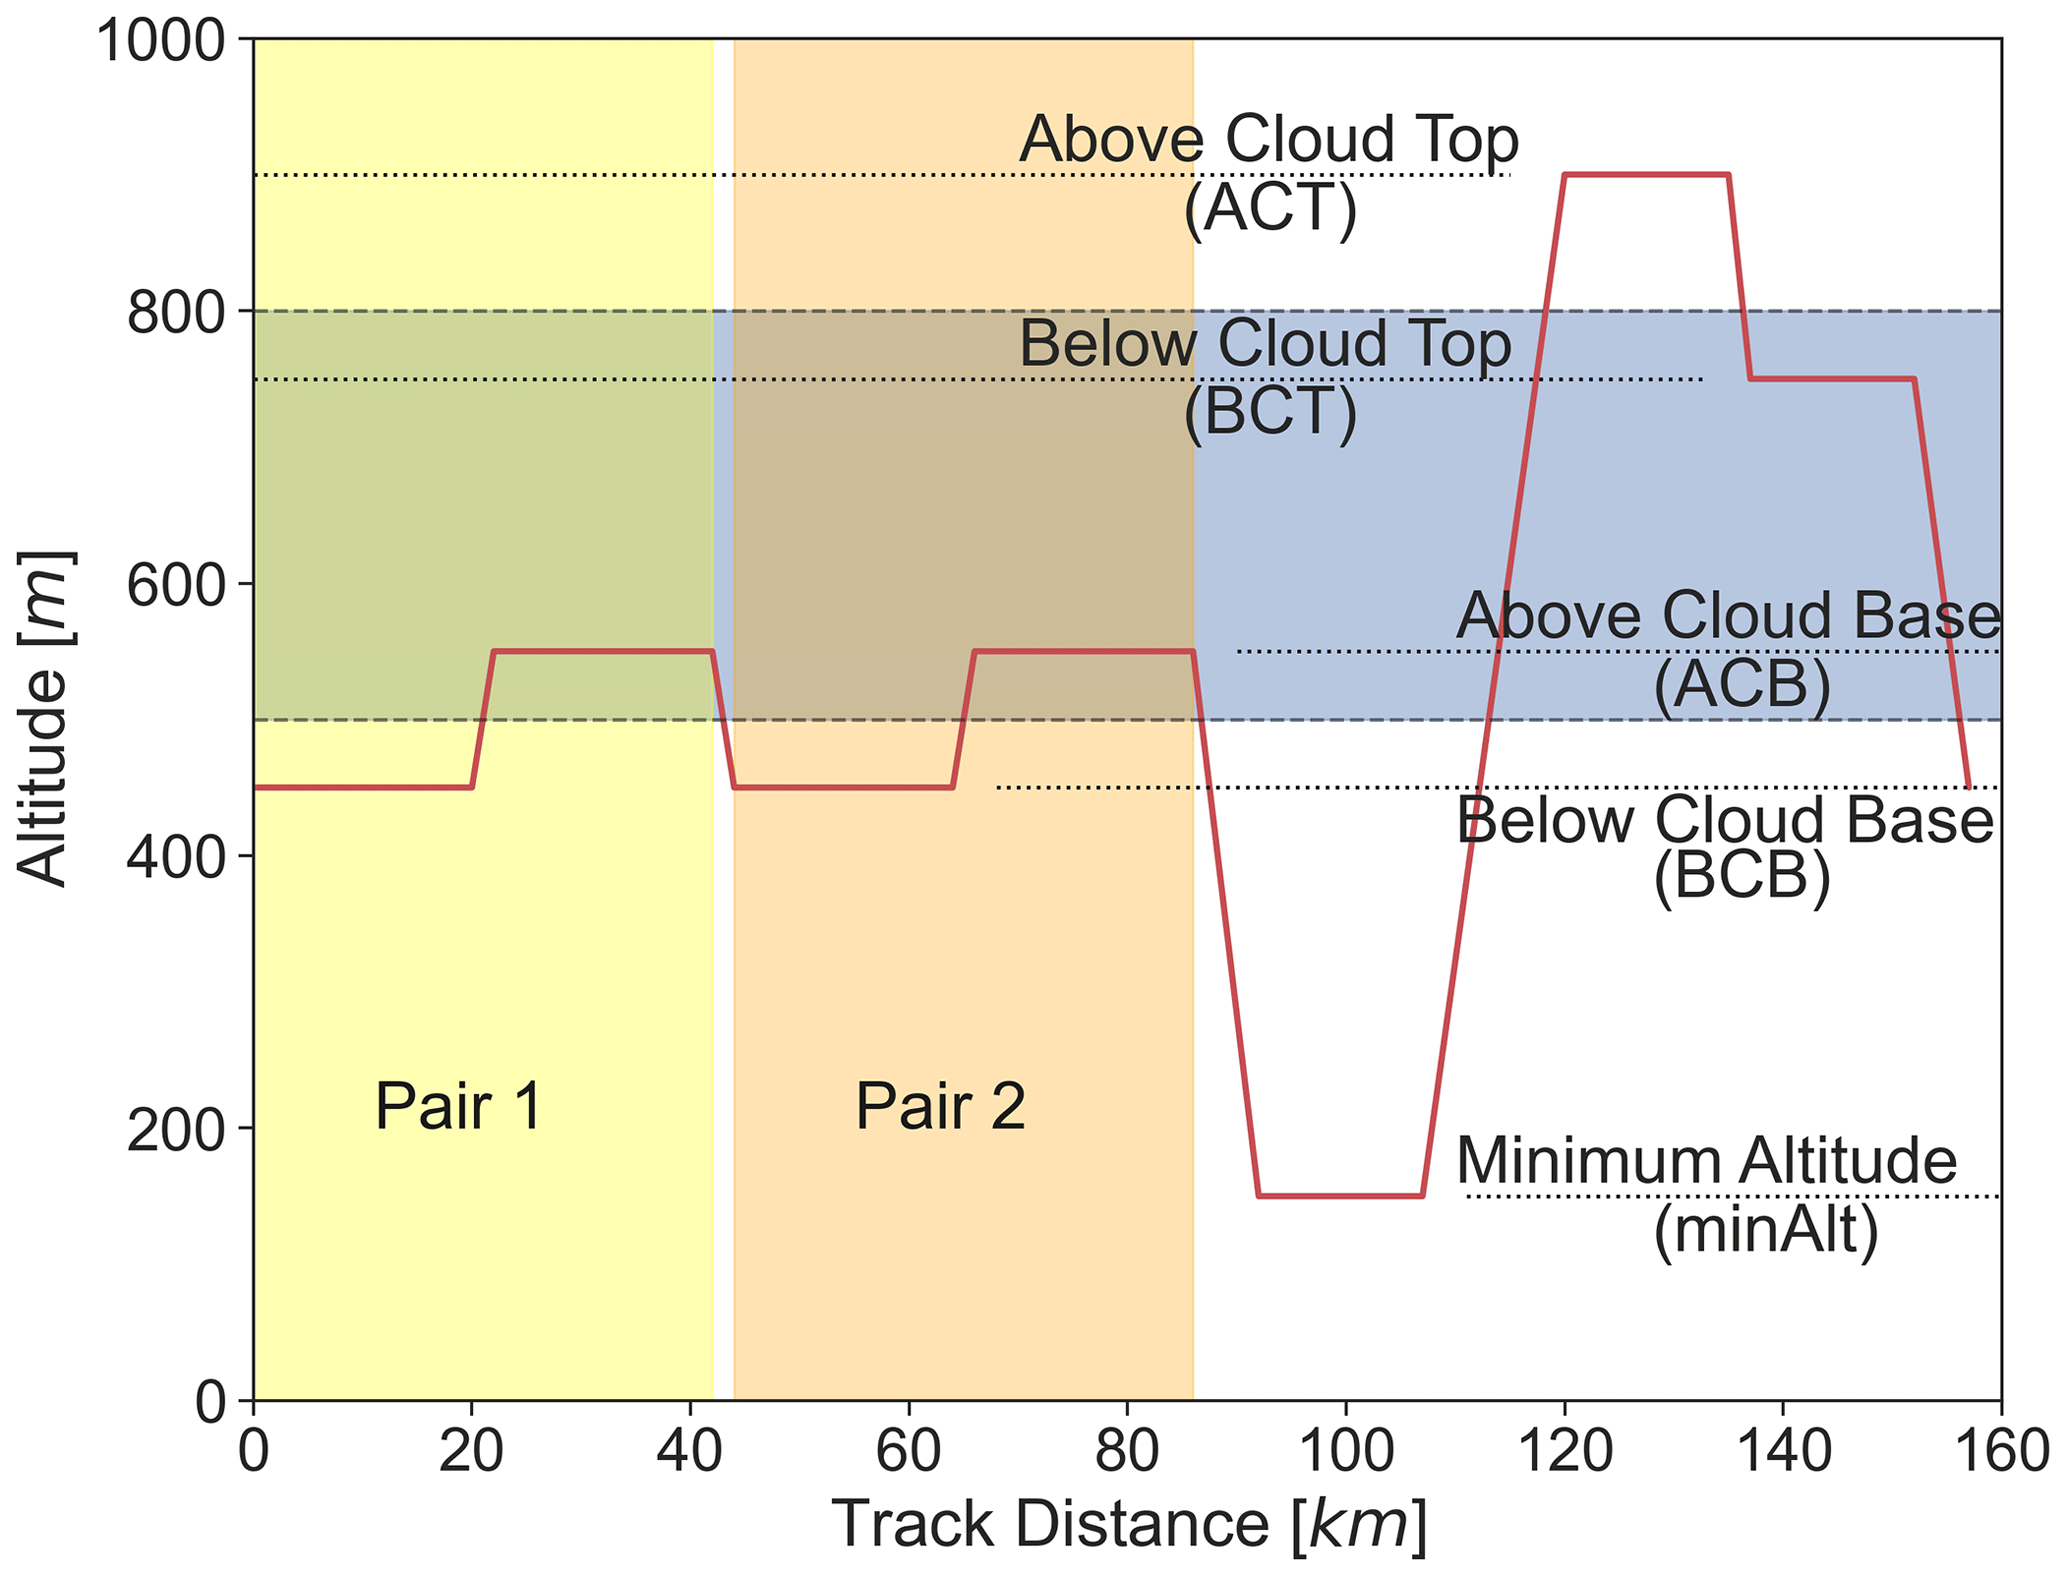
Figure 2Typical flight pattern of one cloud ensemble of the HU-25 aerosol, cloud and vertical velocity data set. In this study we focus on the four legs in the beginning of each ensemble containing two pairs (yellow and orange shaded areas), consisting of a below-cloud-base leg followed by an above-cloud-base leg. The blue shading indicates the cloud layer.
For ensuring similar environmental conditions, the pairs are classified with respect to their mean into a low (L), medium (M) and high (H) group. For comparison, both seasons share the boundaries separating the groups, and the bin boundaries are chosen by identifying minima between the modes in the distribution of all winter pair mean values. The L groups contain from the minimum measured to 372 cm−3, the M group extends from > 372–769 cm−3 and the H group is defined for > 769 cm−3 to the maximum measured in the respective season. The probability matching method (PMM) is used on each group's set of NC and w within a 2.5 to 97.5 percentile interval to quantify the impact of w for the different .
Since the instrument supersaturation is fixed in continuous flow mode and artificially generated in scanning flow mode, we have to estimate the supersaturation in cloud base. The maximum supersaturation Smax is calculated according to Pinsky et al. (2012) with
where C is determined by cloud base temperature and pressure, and w and NC are the updraft speed and cloud droplet number concentration, respectively, measured in cloud base. We determine all groups' C value with their mean cloud base temperature and pressure, a coefficient of air heat conductivity of 26.2 and a coefficient of water vapor diffusion in the air of 0.219 cm2 s−1 at 0 ∘C in winter and 0.242 cm2 s−1 at 20 ∘C in summer; see detailed mathematical background in Pinsky et al. (2012). With the help of the w to NC relation from the PMM, we derive a corresponding relation of the Smax estimate (Braga et al., 2017a). In order to get a representative Smax estimate, we use the effective updraft speed weff for approximating the updraft through the measured w density function in cloud base:
We use the variability and magnitude of w with the related Smax estimates, the aerosol size distribution and chemical composition to quantify their contribution to the activation of CCN in the winter and summer season 2020 for different CCN concentrations.
Probability matching method
The PMM was proposed by Calheiros and Zawadzki (1987) for a statistical comparison of radar reflectivity to rain rate. The derived relationship is verified and performs significantly better than power law regression (Rosenfeld et al., 1994). Additional improvements by taking physical parameters into account for different rain type classification were done by Rosenfeld et al. (1995). The PMM is mathematically justified with an error estimation by Haddad and Rosenfeld (1997), and Braga et al. (2017a) showed that the PMM can be applied to get a reasonable relationship of w to NC. The PMM is based on the assumption that two related parameters taken in non-simultaneous measurements, sharing the same environment in terms of climatological and physical means, are increasing monotonically with each other. The relationship can be computed by matching the percentiles of the parameter's density functions, with more details on the mathematical background described in Haddad and Rosenfeld (1997). Braga et al. (2021) showed good agreement between measurements of NC at cloud bases of convective clouds and estimations from an adiabatic parcel model.

Figure 3(a) Aerosol and cloud properties measured in an ensemble pair of BCB and ACB legs from RF02 on 15 February 2020. The Falcon altitude is given by the black line, and the yellow and blue shading indicates the BCB and the ACB legs. NC (red), (green) and w (orange) are shown as lines. The aerosol loading , representative of the pair's environment, is 440(± 20) cm−3, calculated from the measurements' mean within the BCB leg between 0.40 %–0.46 % supersaturation of the CCN-100 scans nearest to the cloud measurement. The pair's mean values with standard deviation for w and NC are 1.85(± 0.82) m s−1 and 385(± 171) cm−3, respectively. (b) Histogram showing the color-coded log-normalized number concentrations per bin on a 1 s basis of the 2D-S–FCDP combination with the diameter given in the ordinate and the derived mean particle size distribution of in-cloud seconds during the ACB leg below.
3.1 Measurements of below and NC and w near cloud base
The measurements are grouped into pairs with consecutive BCB and ACB legs, illustrated in Fig. 3a for a pair during RF02 on 15 February 2020. In Fig. 3b the size distribution of the 2D-S–FCDP combination is shown. The FCDP measures a constant particle background in a size range of 3–12 µm with concentrations between 0.1 and 1 cm−3. The background is visible in all BCB legs but vanishes at flight levels above cloud top above the boundary layer (not shown). The relative humidity data show values mainly above 75 % in the BCB legs for both seasons, suggesting the measured background concentrations are deliquescent sea salt particles.
Table 1All pairs consisting of serial below-cloud-base (BCB) and above-cloud-base (ACB) legs during the February–March 2020 deployment. Mean values and standard deviation in parentheses for w and NC from ACB cloud portions and from the BCB legs. Dmax is the maximal distance of cloud measurements to the aerosol measurements, and hACB is the height above cloud base with standard deviation in parentheses.
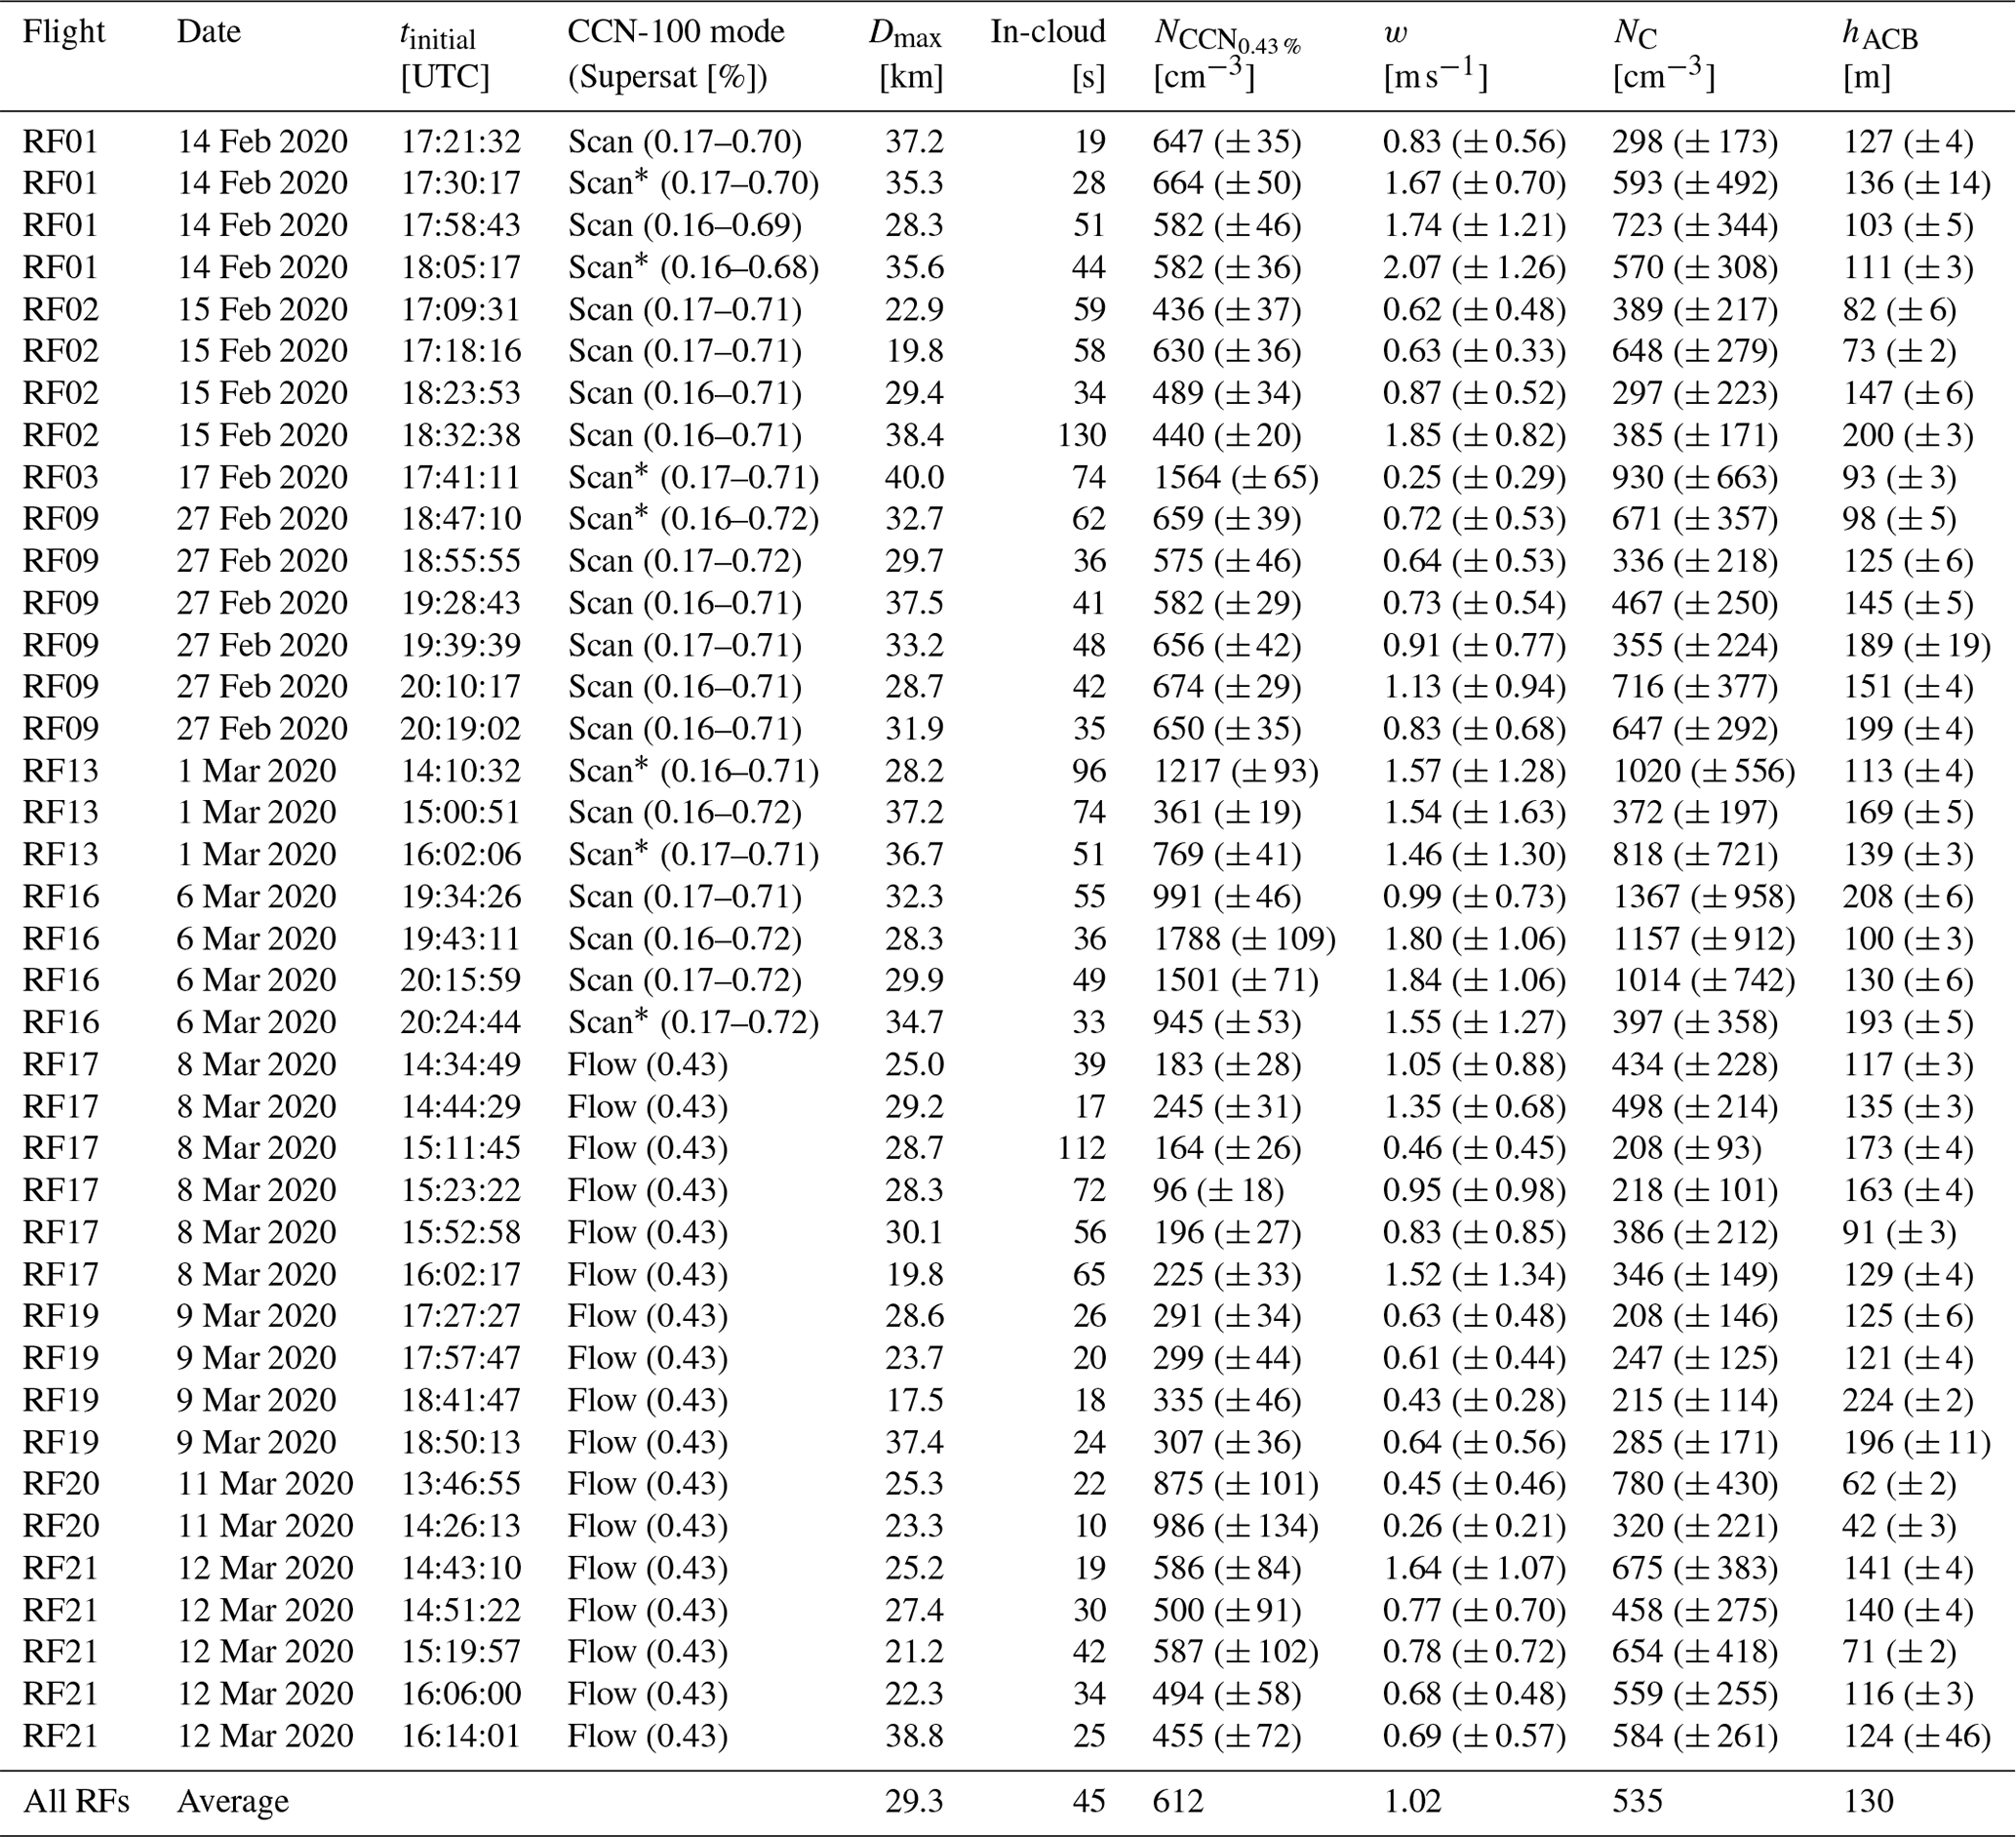
∗ Only one scan in BCB leg.
All data ensemble pairs used in this study from the ACTIVATE winter February–March 2020 deployment are given in Table 1. We use selected pairs with a minimum in-cloud time above or equal 10 s for sufficient statistics. NC is predicted to reach its maximum at a height above cloud base depending on w and subsequent Smax estimates in an adiabatic parcel model (Braga et al., 2021). That the activation of CCN into cloud droplets had sufficient time is ensured by taking only pairs into account with cloud measurements at a height above cloud base hACB greater than 35 m in this analysis. The hACB is gauged by calculating the middle of the difference between leg-mean values at BCB and ACB altitudes. In total we use 39 pairs from 10 RFs, where all needed data are available for the PMM application, with a combined duration of 1786 s in cloud. The aerosol loading mean values range from 96 cm−3 in clean conditions up to 1788 cm−3 in environments with high aerosol loading. The mean of NC is between 208 and 1367 cm−3. The measured w distributional mean ranges from 0.25 up to 2.07 m s−1. During the RF02 15 February 2020 flight, a distinct shift of was measured between 17:42 and 17:57 UTC, which can be attributed to a plume crossing event, and affected pairs were excluded from the analysis because the link between aerosol environment and measured NC through cloud formation is questionable. The horizontal distance between aerosol measurements below-cloud and cloud measurements in cloud base is mainly below 30 km and never exceeds 40 km. Results derived from the PMM are more robust with a choice of narrow a priori boundaries for classifying similar environmental conditions.
Table 2All pairs consisting of serial below-cloud-base (BCB) and above-cloud-base (ACB) legs during the August 2020 deployment. Mean values and standard deviation in parentheses for w and NC from ACB cloud portions and from the BCB legs. Dmax is the maximal distance of cloud measurements to the aerosol measurements, and hACB is the height above cloud base with standard deviation in parentheses.
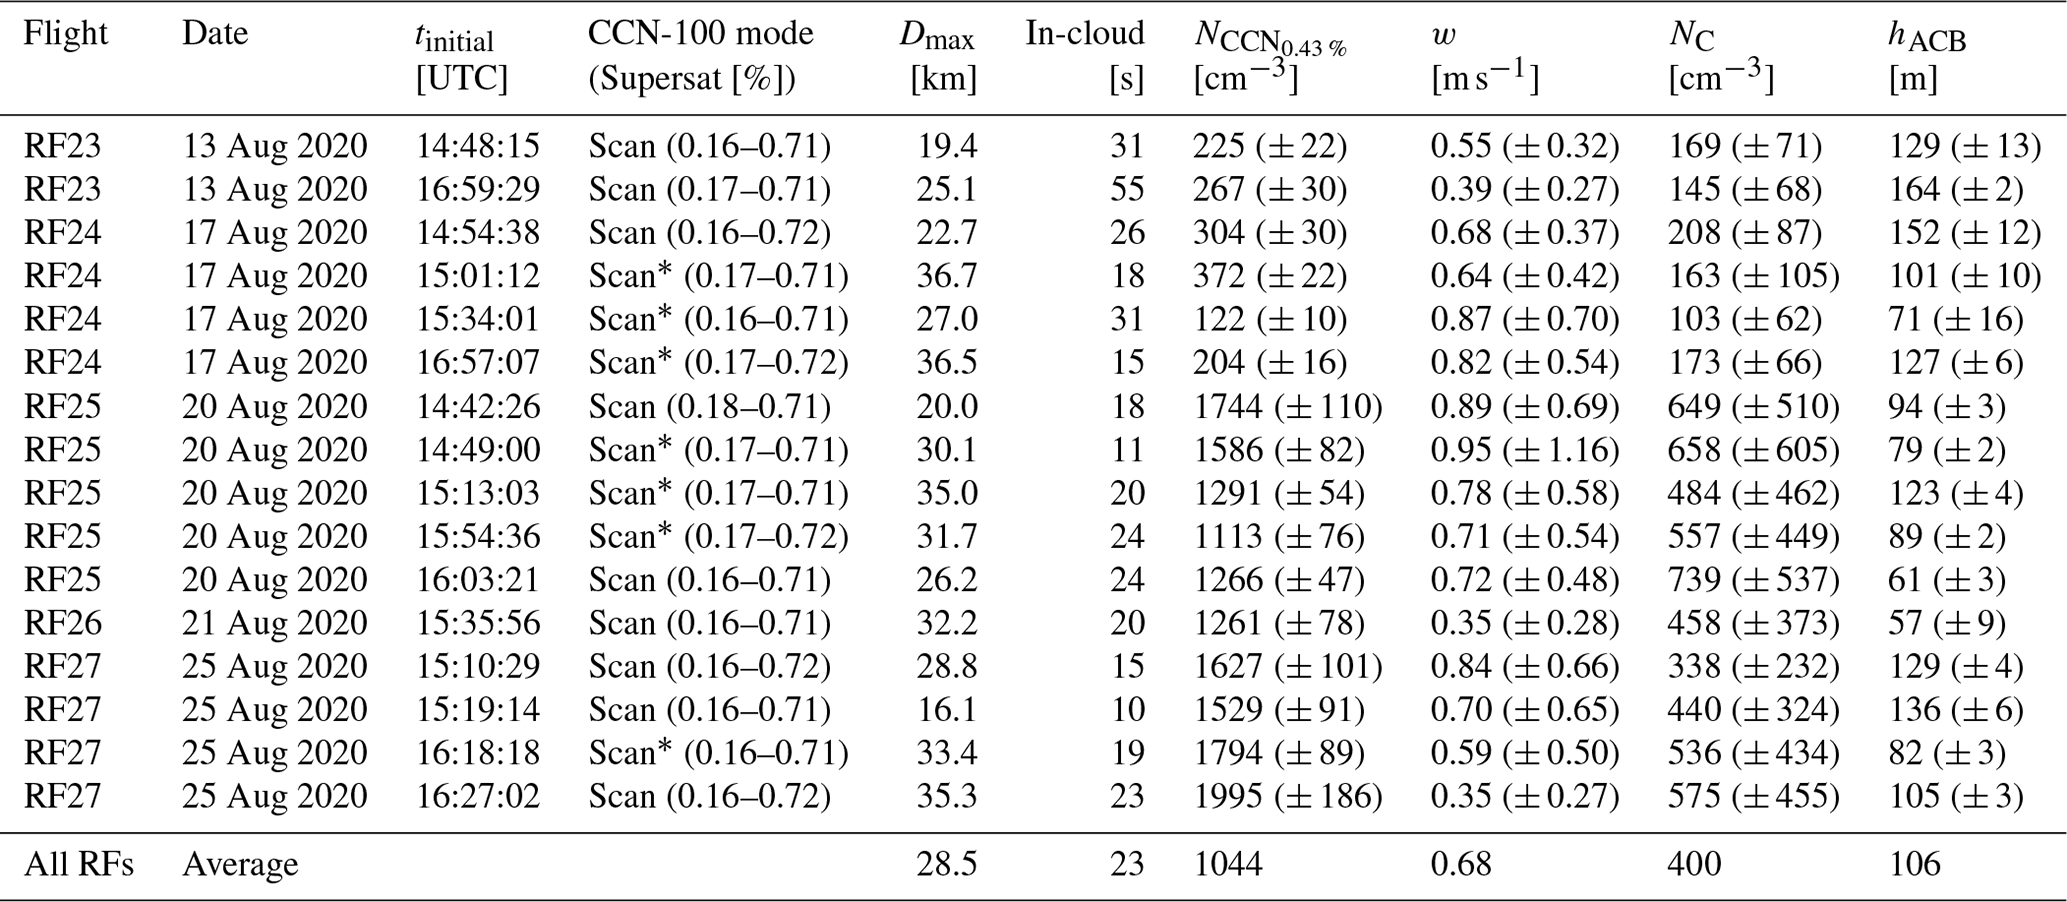
∗ Only one scan in BCB leg.
The same procedure was applied to the flights of the ACTIVATE August 2020 deployment resulting in the pairs listed in Table 2. We use a total of 16 pairs from five RFs with a combined duration of 360 s in cloud. The full data set of the ACTIVATE August–September 2020 deployment including CCN measurements is only available for the August period limiting available pairs. The reduced fraction of time in cloud is in line with the observed lower cloud fraction and horizontal dimension of clouds during summer. In addition to excluding pairs affected by precipitation, the pairs in RF28 were not used in the analysis because of a smoke layer possibly altering the cloud formation process. The aerosol loading mean values range from 122 cm−3 in clean conditions up to 1995 cm−3 in environments with high aerosol loading. The pairs in summer exhibit a bimodal distribution of either very clear or with high and are similar within a day, while the conditions with high aerosol loading occur within a higher frequency. The NC mean ranges from 103 up to 739 cm−3, which is 25 % lower in terms of all pairs average of 400 cm−3 compared to the wintertime 535 cm−3 average and in good agreement with the findings of Dadashazar et al. (2021b). A similar trend is observed in the w measurements, where the mean w is from 0.35 to 0.95 m s−1 and thus 33 % lower in terms of all pairs average 0.68 m s−1 in comparison with the wintertime 1.02 m s−1 average. Also, less variability of updraft speed was measured, with an average of 0.53 m s−1(76 %) compared to 0.76 m s−1(78 %) during wintertime, indicating a higher dynamical influence during winter, i.e., with a high intra-day variability.
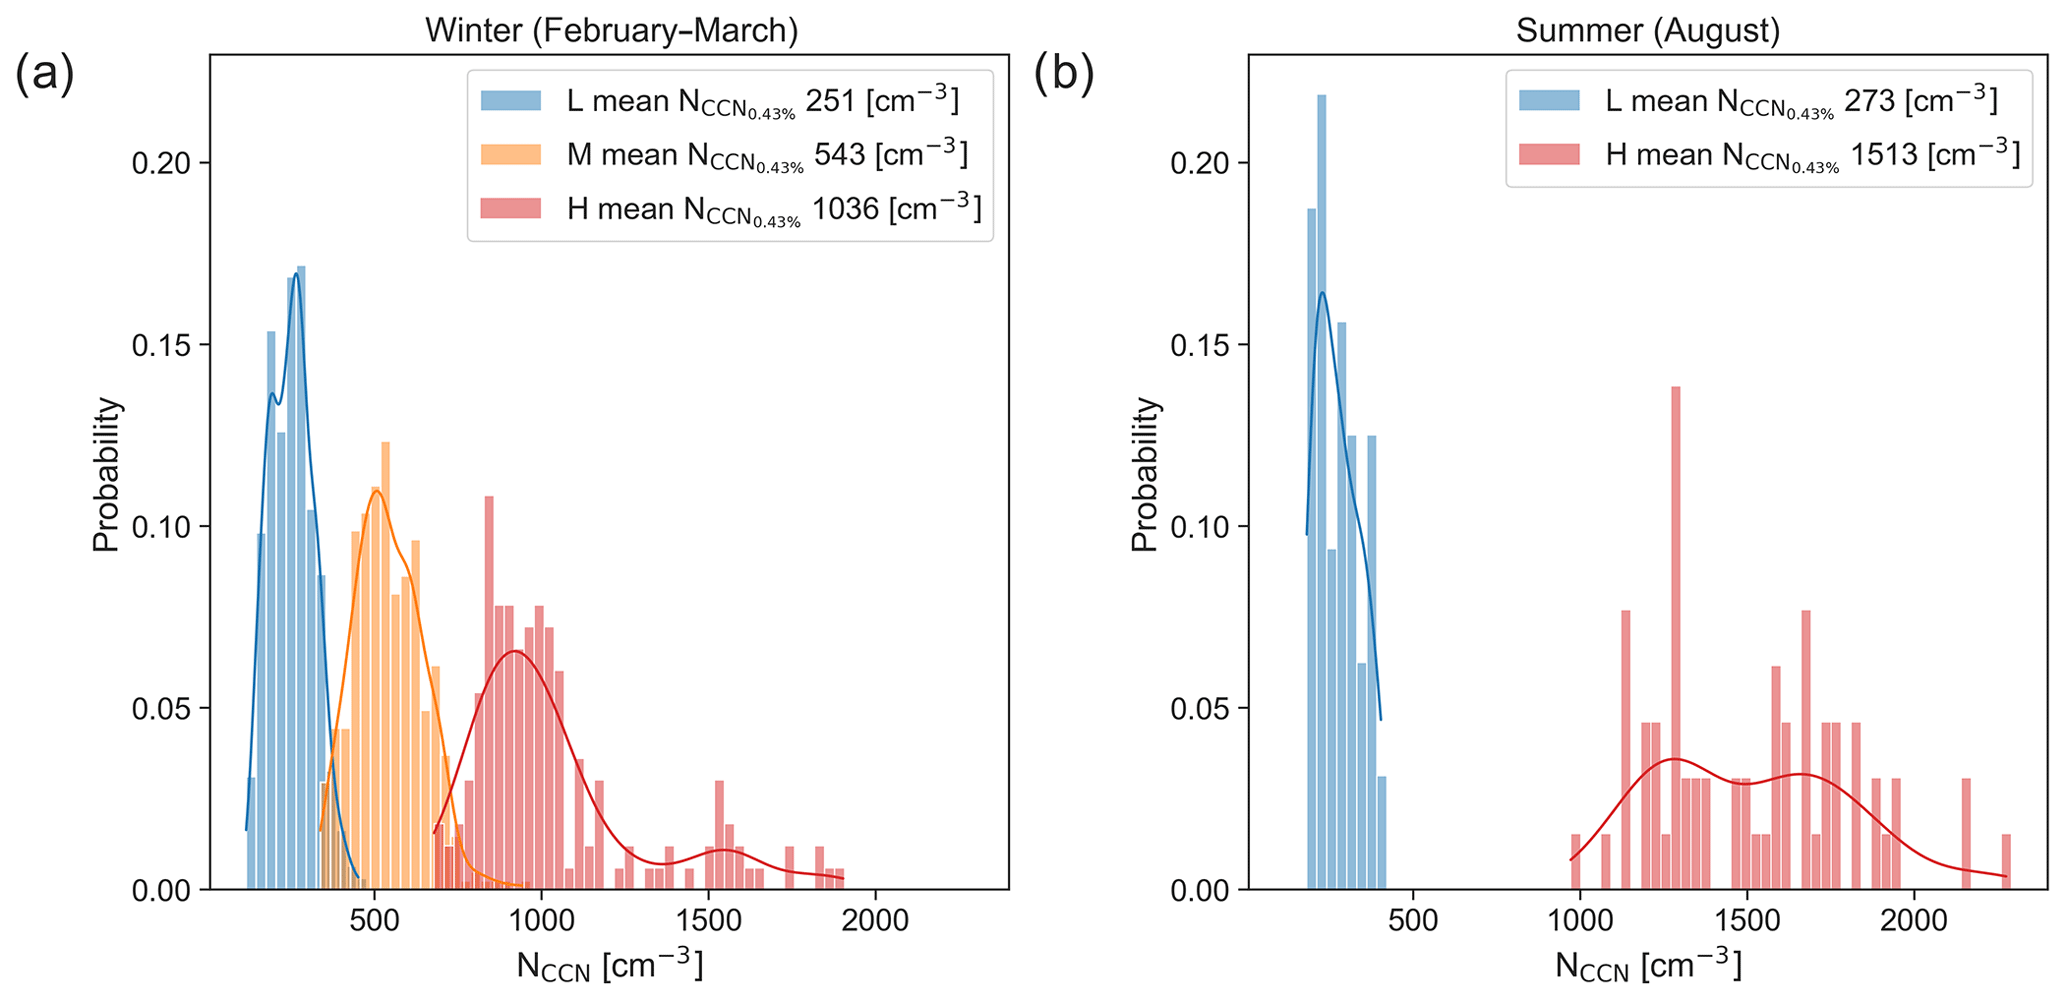
Figure 4Probability distributions of wintertime low (L/blue), medium (M/orange) and high (H/red) group with their mean values (a). All values are binned with a bin width of 30 cm−3, and the abscissa gives the probability of occurrence in the group. The line fit represents a kernel density estimation of the Python Seaborn package (Waskom, 2021). The same is done in (b) for the summertime distribution of the L and H group. No summertime pair is attributable to the M group and is thus not shown.
3.2 Seasonal aerosol distribution and composition below cloud base
The pair measurements indicate a correlation between NC and w which can be quantified by the PMM. For this purpose, all pairs of a season are sorted according to their mean aerosol loading into three groups, where each has a new set of , NC and w, respectively. Figure 4a depicts the distribution of each group observed during winter. The L group ranges from 115–451 cm−3, with a mean of 251 cm−3 for . The M(H) group has values from 337(678)–941(1903) cm−3, with a mean of 542(1036) cm−3. There are overlap regions between the groups due to the usage of single values of in Fig. 4, but the separation is sufficient for the applicability of the PMM.
The same is shown for the summer period in Fig. 4b, where only pairs corresponding to the L and H group were measured. For the summertime, the L(H) group's values range from 181(971)–403(2275) cm−3, with a mean of 273(1513) cm−3. The minimum value of the summertime H group is noticeably higher compared to the wintertime H group, does not have a distinct peak and is more equally distributed. The summer H group's mean is 46 % higher than the winter H mean value, while the L groups are quite similar in shape. Interestingly, no pair in the M group was measured during summer, and is either in clean or high aerosol loading conditions within a research flight.
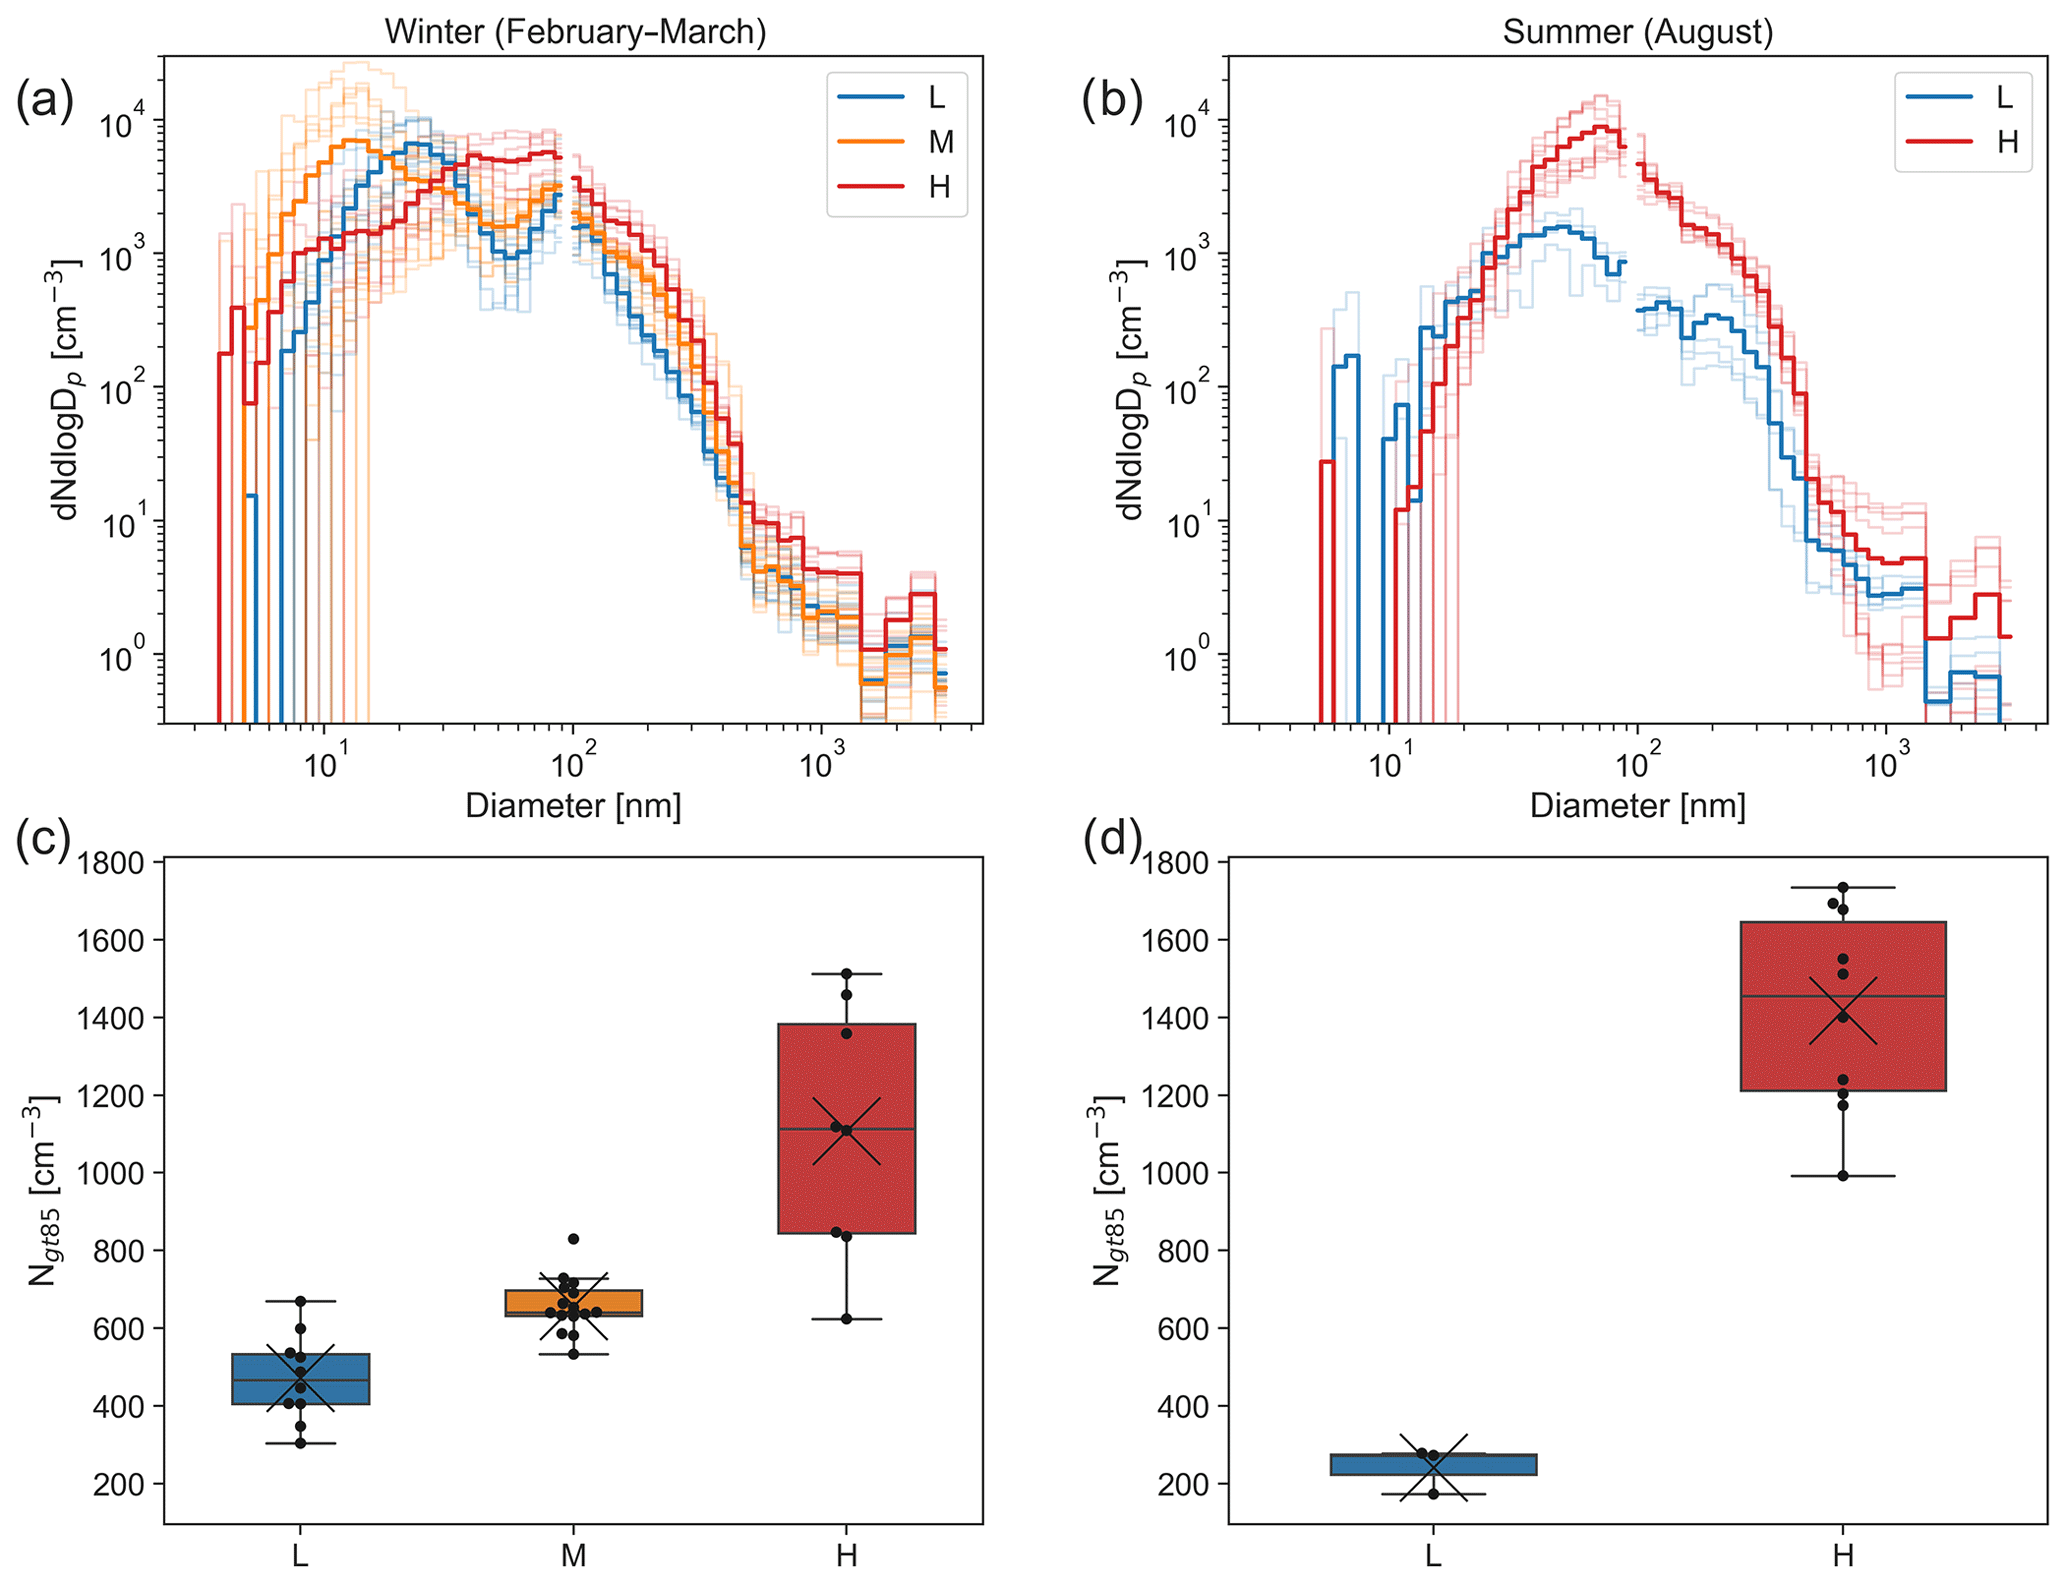
Figure 5Wintertime aerosol size distributions from the SMPS–LAS instrument combination of the low (P/blue), medium (M/orange) and high (H/red) group with their mean distribution and shaded distributions for a single pair (a). The same is done in (b) for the summertime aerosol size distribution of the L and H group. Whisker plots of Ngt85 with the mean marked by a cross for wintertime (c) and summertime (d). No summertime pair is attributable to the M group and is thus not shown in (b) and (d).
is a subsample of the available aerosol population. The aerosol size distributions during wintertime are shown in Fig. 5a. The clean marine environment (L) has a distinct bimodal distribution, consisting of an Aitken mode (10–100 nm) peaking at around 20 nm and an accumulation mode (100–1000 nm) at 100 nm. In contrast, the H group has a unimodal distribution, with a flat peak at 40–100 nm at similar dNdlog Dp concentrations to the L and M group, and exhibits a plateau below 20 nm, which hints at an overlapping ultrafine particle mode. The integrated number concentration for particles greater than 85 nm, Ngt85, in the BCB leg, depicted in Fig. 5c, shows that the steady increase from 472 cm−3 (L) to 658 cm−3 (M) to 1108 cm−3 (H) is significant for L to H and probably stems from condensational growth and coagulation processes for both Aitken and accumulation modes. The unimodal H size distribution originates from an overlapping Aitken and accumulation mode, where the aerosol properties can differ. The M group has a bimodal distribution, with the maximum of the Aitken mode at around 15 nm and accumulation mode peaks similarly at 100 nm.
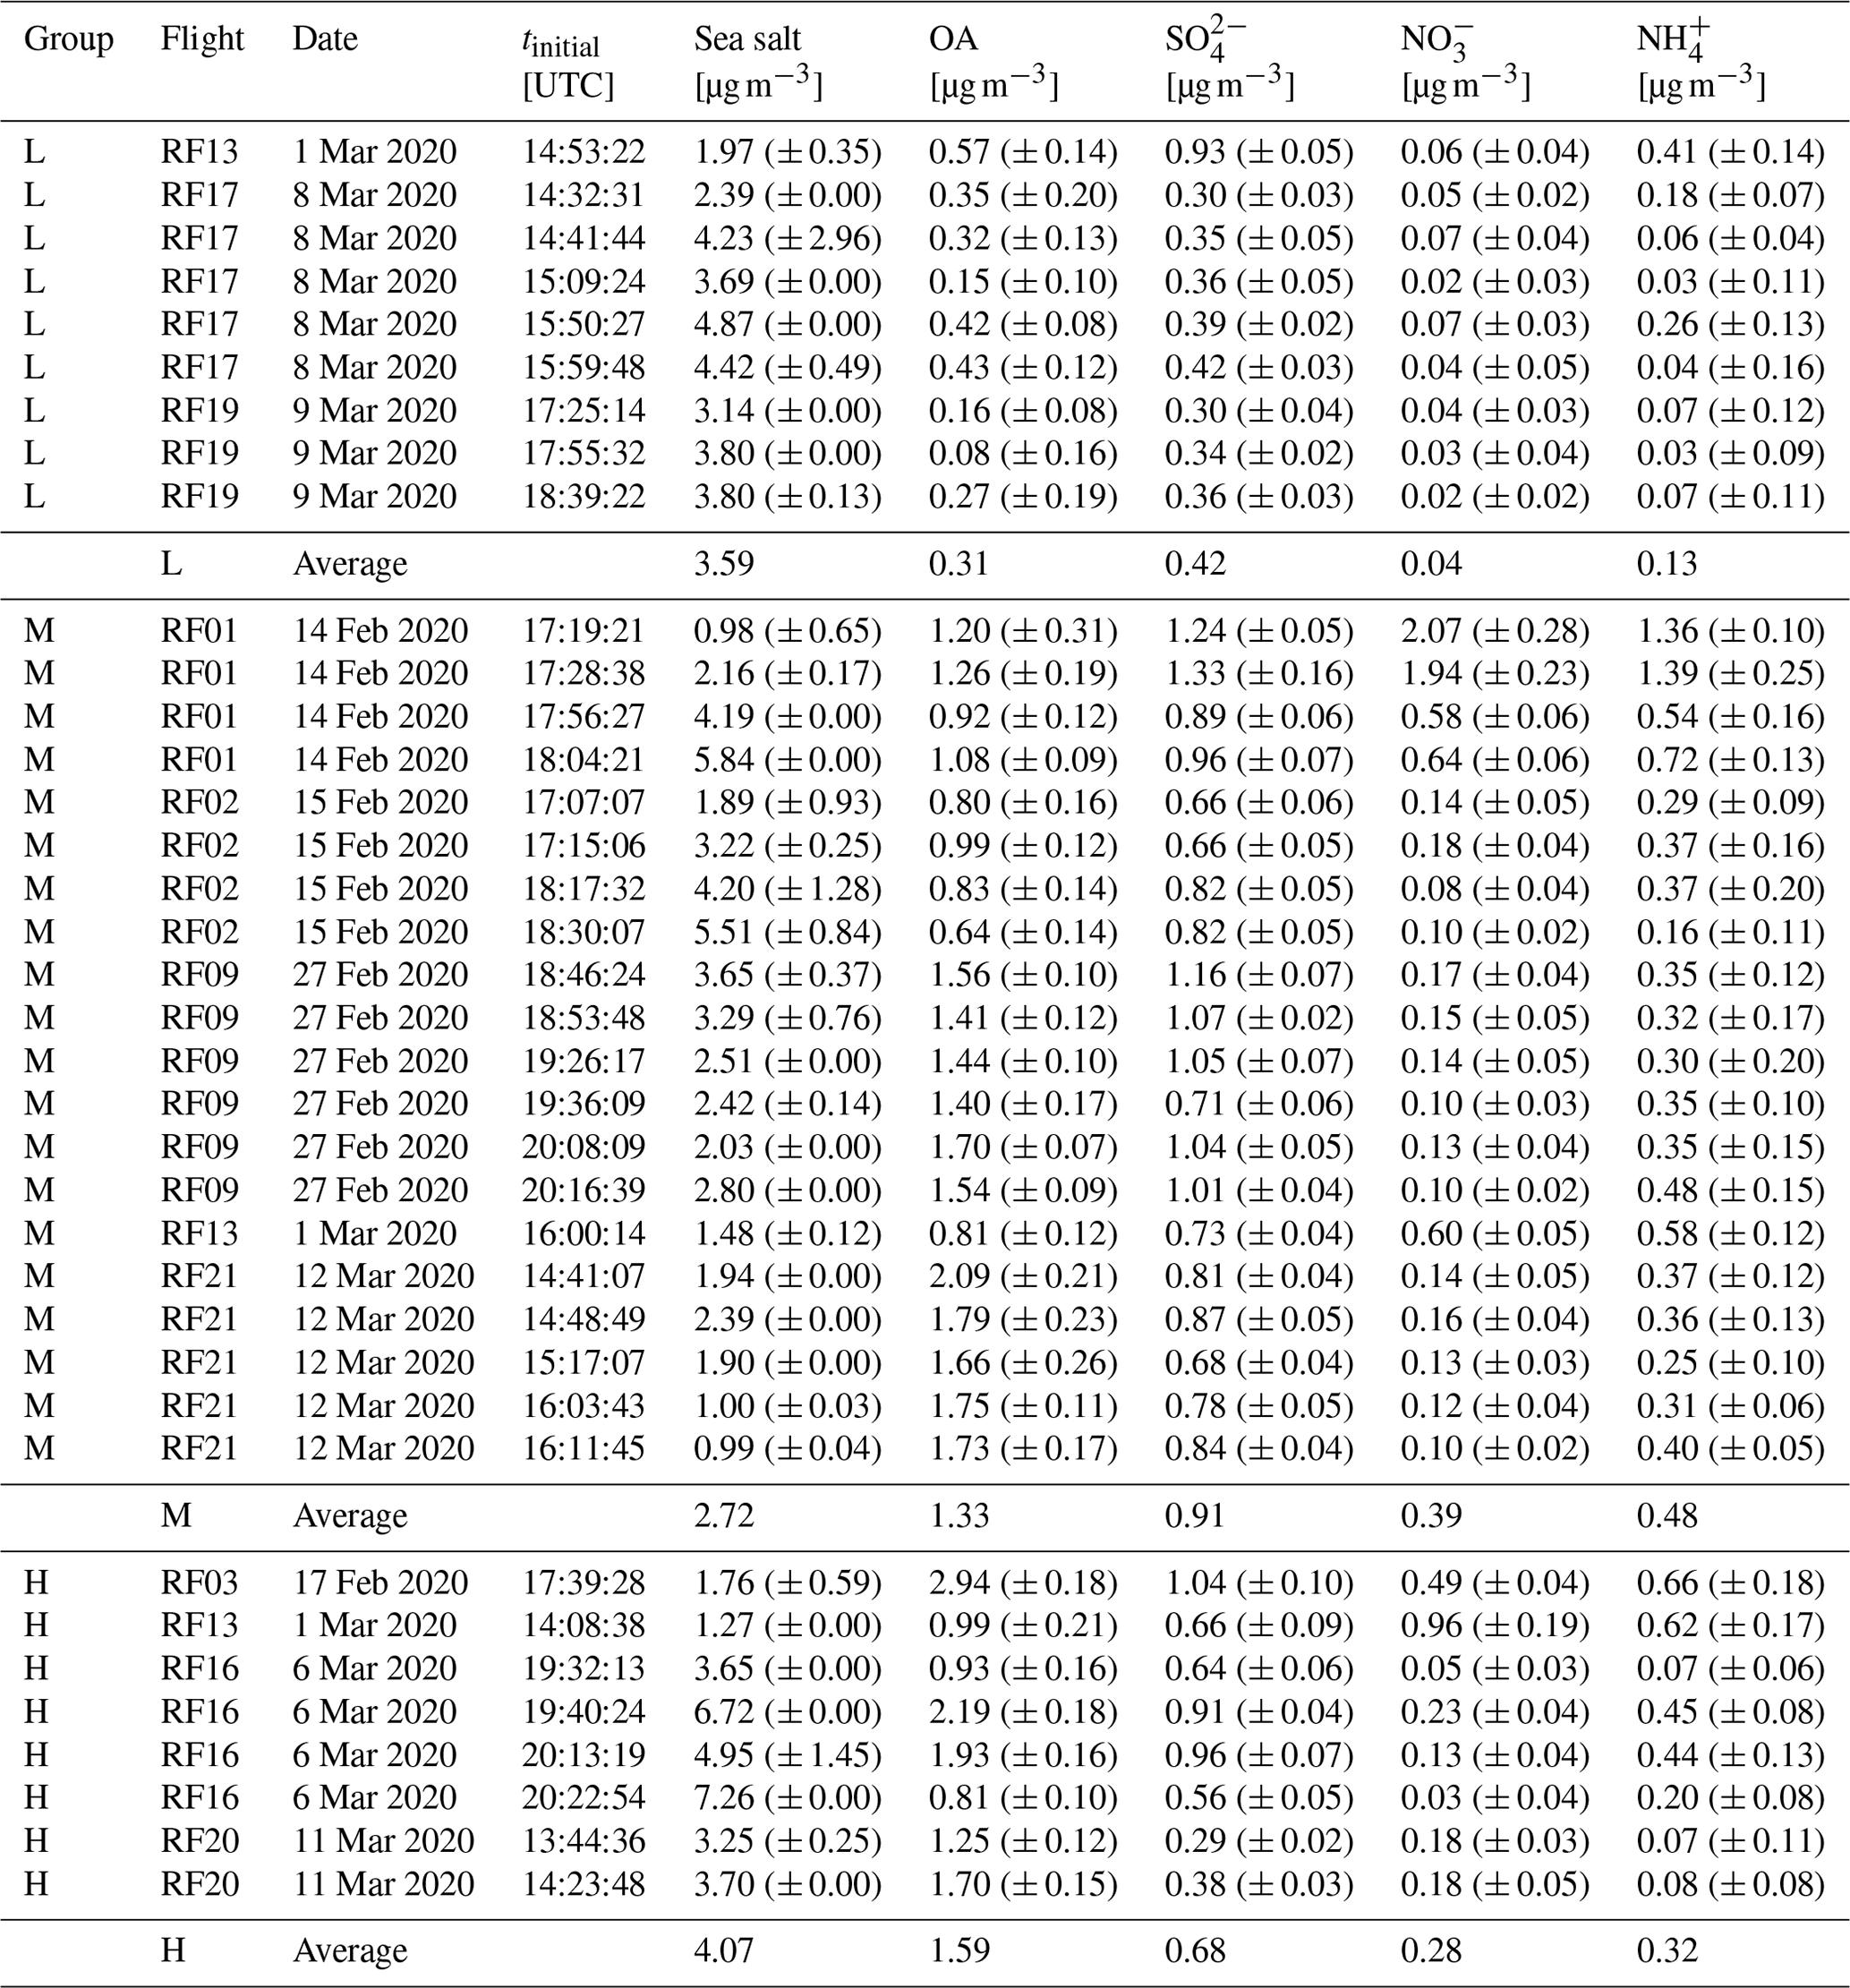
Table 3All pairs' aerosol composition below cloud base (BCB) during the February–March 2020 deployment. Mean values and standard deviation in parentheses for organic aerosol (OA), , NO and NH from AMS measurements and sea salt from PILS measurements. All measurements are given at standard temperature and pressure.
Since the groups are categorized by their mean and the group's Ngt85 values are constantly higher than their values, the activation radius of the size distribution at 0.43 % supersaturation is probably between 85–93 nm for the M and H group and around 106 nm for the L group. The winter groups differ for particles smaller than 40 nm, which contributes a high fraction to the available aerosol population for the L and M group. We consider particles smaller than 40 nm as irrelevant for the cloud formation process itself but as a critical reservoir for the accumulation mode through chemical and physical aerosol processes that increase the particle size, which can be seen in the H group's distribution. The M group with its high fraction of particles below 20 nm could hint at the process of new particle formation (Zheng et al., 2021). However, the aerosol size distributions display that for a critical activation radius down to 40 nm, the H group has the highest number of particles being possible CCN, followed by the M group and finally the L group.
During summertime, the aerosol size distribution of the L and H group is comparable by adhering to a unimodal distribution but differs significantly in the dNdlogDp concentrations between 10 and 400 nm (see Fig. 5b). This difference is reflected in Ngt85 in Fig. 5d, with mean values of 241 cm−3 (L) compared to 1418 cm−3 (H). The summer group's mean Ngt85 is smaller than its mean , suggesting a critical activation radius of the size distribution below 85 nm at 0.43 % supersaturation for both groups. Here the aerosol processes which increase the particle size of Aitken and accumulation modes are negligible, and the difference in the H group suggests another aerosol source during summer. The WNAO is directly located in the Northern Hemisphere west wind band in winter, but during summertime the anticyclonic circulation driven by the Bermuda-Azores High influences the study region with a southwest wind component (Sorooshian et al., 2020; Painemal et al., 2021; Dadashazar et al., 2021a). Therefore the aerosol sources can change between the seasons.
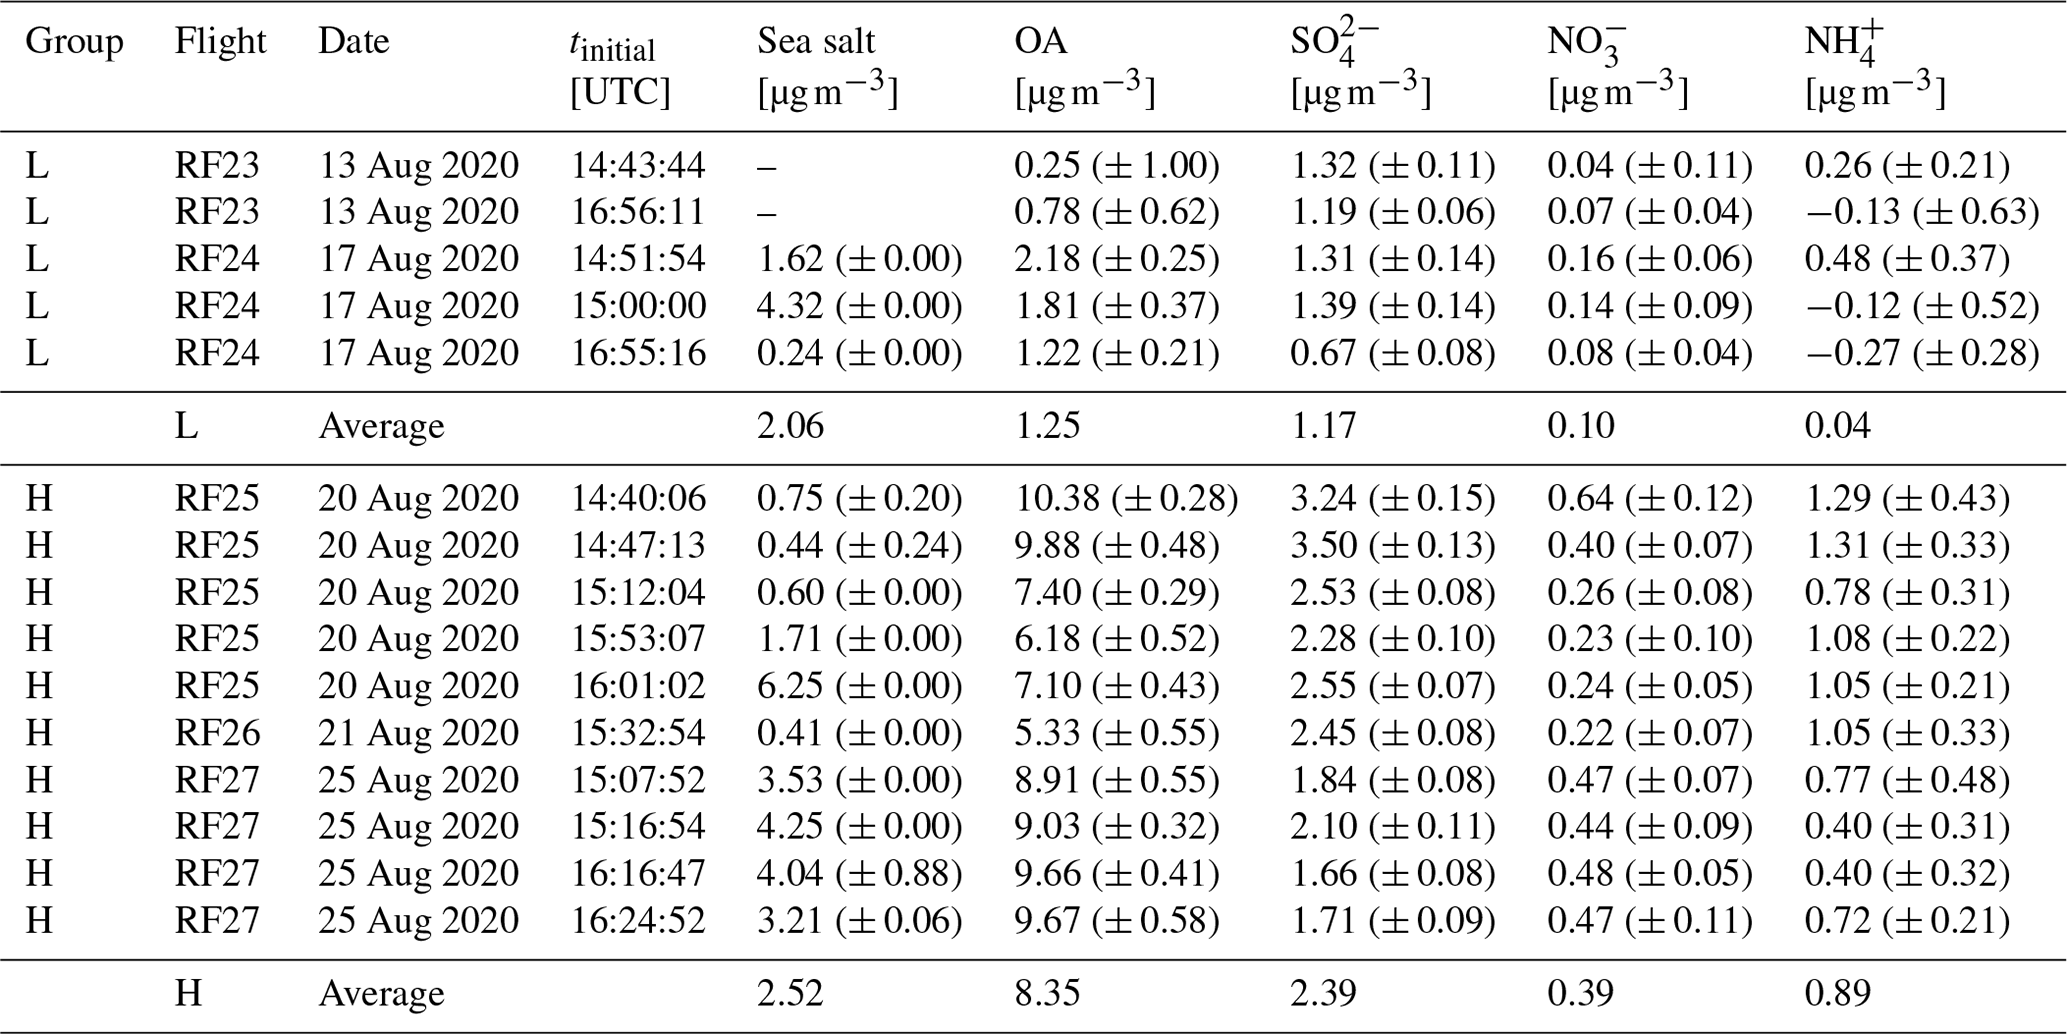
Table 4All pairs' aerosol composition below cloud base (BCB) during the August 2020 deployment. Mean values and standard deviation in parentheses for organic aerosol (OA), , and from AMS measurements and sea salt from PILS measurements. All measurements are given at standard temperature and pressure.
The wintertime aerosol mass concentrations in the BCB legs are given in Table 3. Sea salt is the dominant species with respect to mass throughout the season and has a high variability day to day and within a research flight. The highest concentrations were measured during RF16 on 6 March 2020, which can be attributed to the H group and thus yield high . However, there is no observable trend of sea salt mass concentration between the groups. On the other hand, OA shows a significant increase from the L to the M and H group. It can be deduced that the M and H group are influenced by aerosol sources like the North American east coast outflow, while the L group represents natural marine conditions. The , and mass concentrations have a slight increase from the clean marine condition (L) to conditions with elevated aerosol (M/H); i.e., RF01 on 14 February 2020 is an outlier and has the highest values, which decreases farther offshore during the flight.
In Table 4 is the BCB aerosol mass concentration below cloud depicted for the August 2020 summertime period. The sea salt mass concentration is highly variable like wintertime, with low statistics in the L group. Negative values for mean that the mass concentration is lower than the calibrated background concentration and thus real. A significant increase from the L to the H group is measured for all species except sea salt and suggests more aerosol in the summer season. The difference in mass concentration is not equally distributed, with the smallest rate of a doubling for , followed by a factor of 4 for and a factor of over 6 (20) for OA(). The chemical composition of the aerosol population alters NC (Hoose and Möhler, 2012); i.e., the organic carbon species have variable influences depending on solubility, molecular weight and surface tension (Ervens et al., 2005).
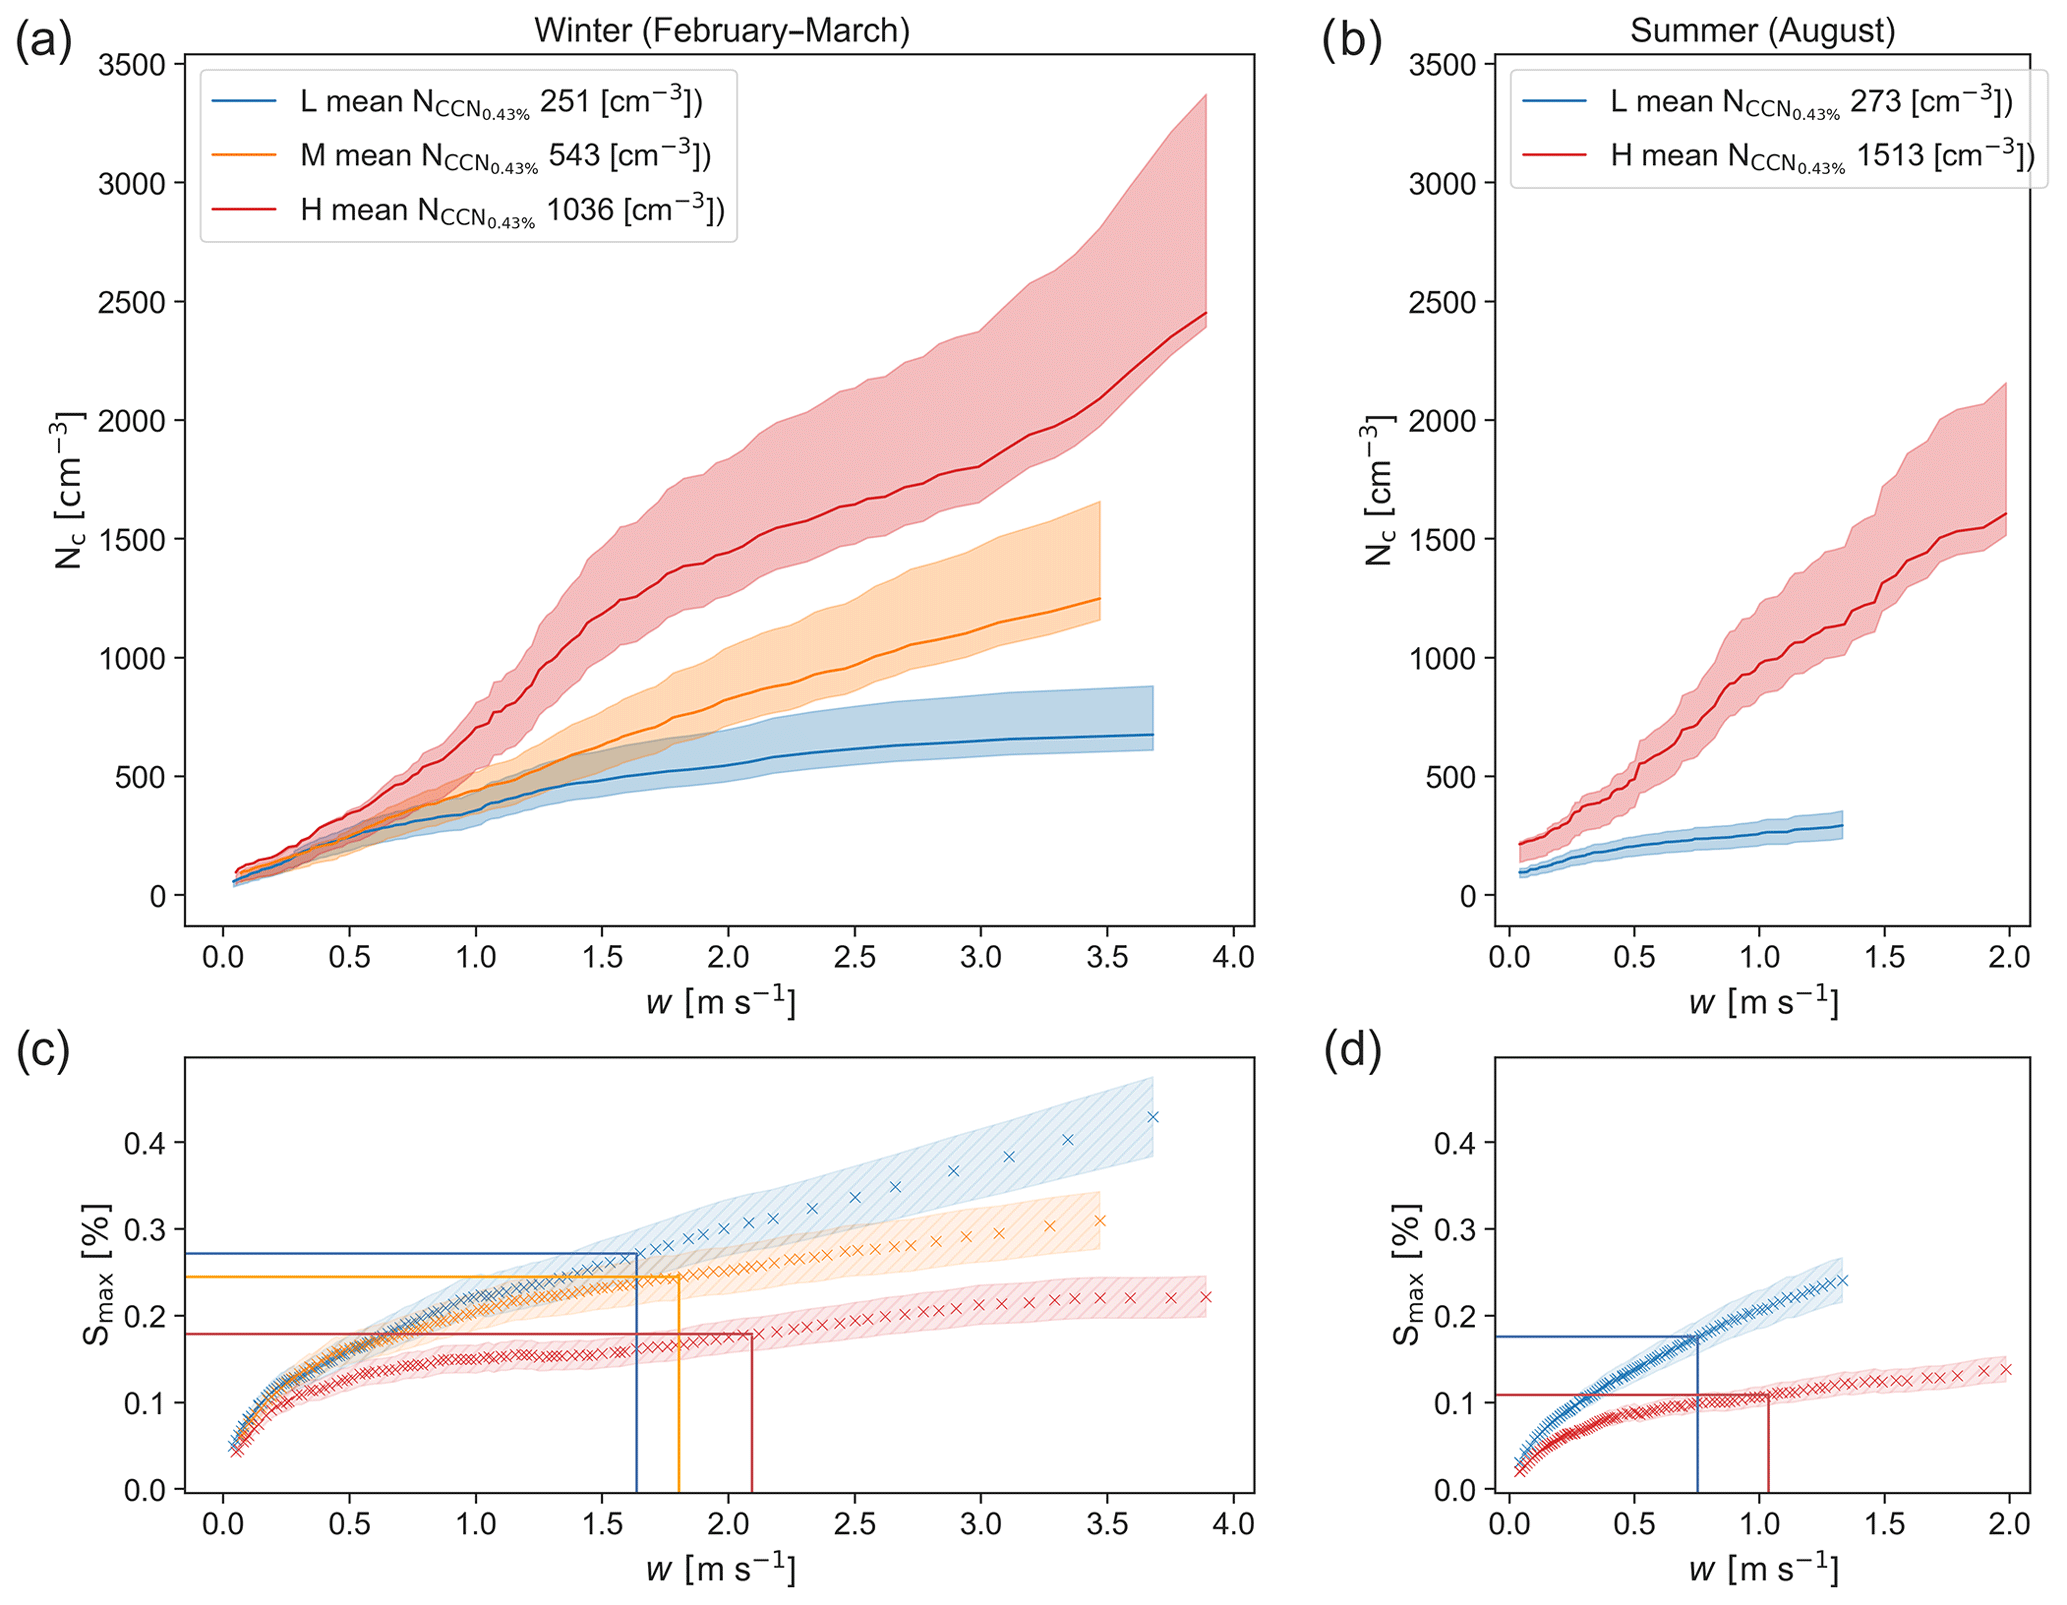
Figure 6(a, b) The lines represent the w to NC relation derived with the PMM for the low (L/blue), medium (M/orange) and high (H/red) group with their boundaries of mean in parentheses. The dark shaded areas represent the measurement uncertainty of 20 % in addition to the relative error calculated according to Haddad and Rosenfeld (1997) with the assumption that the standard deviation of NC in each group represents the ratio of the noisy variation in the NC measurements to the true variation in NC. (c, d) The Smax estimate of each group is given by cross markers for the same w spectrum, with the error as the shallow shaded area with lines. The vertical lines are the weff with associated Smax.
3.3 Seasonal impact of w and on NC
Figure 6a shows the application of the PMM to all groups of the winter season. The w to NC relation shows the fraction of activated aerosol from the aerosol size distribution for a given updraft of supersaturation, respectively. The L group, which has a mean NC of , shows the highest impact of w on NC for smaller w values and reaches saturation for higher w values. The M group exhibits a similar trend with a mean of , but the impact of w is decreasing slower compared to the L group for higher w and does not reach saturation. The H group shows the strongest impact for w < 1.6 m s−1 and as a mean NC of . In addition, it has a second mode with a strong increase in NC for w > 3 m s−1.
The two domains of w in the H group could represent the activation of smaller aerosol particles from the aerosol population. Since the critical diameter of aerosol activation depends on the supersaturation and is shifted towards smaller diameters for higher supersaturation, the positive correlation of w and supersaturation results in smaller aerosols getting activated for higher w (Köhler, 1936; Dusek et al., 2006; Schulze et al., 2020). NC values are slightly smaller than the respective group's , leading to a mean supersaturation below 0.43 % in winter. The L group exhibits some characteristics of an aerosol-limited regime, with NC highly depending on the available aerosol population, while the H group shows the characteristics of an updraft-limited regime, with NC being directly proportional to w (Reutter et al., 2009). The M group is between both regimes and tends to the characteristics of an updraft-limited regime, since NC does not reach saturation for high w.
The Smax estimate for each group's weff in Fig. 6c is decreasing with increasing and is 0.27 %(L), 0.24 %(M) and 0.18 %(H), respectively. Since the variability of updraft speed is higher with larger w, the local supersaturation can deviate from the derived Smax estimates. The reduction of Smax for increasing demonstrates the water vapor competition of more activated CCN and thus function as a buffer for preventing higher supersaturation. The L group's mean NC is above its mean , although Smax is near, and below 0.43 %, which could be explained by a contribution of the soluble Aitken-mode particles in the bimodal aerosol size distribution (Pöhlker et al., 2021). However, the winter groups exhibit mean NC near , with a trend of a reduced fraction of activated aerosol with increasing .
In Fig. 6b the PMM is applied to the summer season in the same way. The impact of w on NC has a similar trend in summer and winter for the L group up to the maximal measured w of 1.3 m s−1 during summer and has a mean NC of . The H group has a nearly constant impact for the full range of w up to 2.1 m s−1 and a mean NC of . The w to NC relation coincides with the wintertime equivalent for w below 1.7 m s−1. The Smax estimate for each group's weff in Fig. 6d is analogously reduced from the L to the H group in summer as in winter, while between the seasons a halving of the Smax takes place.
Ngt85 of the summer L group is significantly lower than its winter counterpart; thus less aerosol for cloud formation is available in clean conditions during summer compared to winter. On the other hand, Ngt85 of the H summer group is substantially higher than during winter. Another key feature is the lower mean Ngt85 in comparison to the mean , showing a higher fraction of activated CCN in summer for a given supersaturation of 0.43 %, which hints at a lower mean critical supersaturation needed for activation of the summer aerosol composition. Tables 3 and 4 show an increased mass concentration of OA and between the respective groups. The high hygroscopicity of is most likely accountable for the observed lower mean Ngt85 than mean because the raised OA mass concentrations from the L to H group are not reflected. Lower supersaturation in summer due to the smaller updrafts results in less activated CCN. The bisection of weff in Fig. 6b propagates through derived Smax estimates to NC.
In this study we examine the seasonal impact of w and on NC over the WNAO from an in situ perspective during the ACTIVATE campaign. The impact is determined by a statistical approach with the PMM, where pairs of flight legs below and in cloud base are used to categorize in situ measurements into similar environmental conditions and . We also give detailed information on the aerosol size distribution and composition below cloud base. Key findings are summarized and related to 2020 winter (February–March) and summer (August) conditions as follows:
-
NC in low clouds over the WNAO show a positive correlation with w and . Updrafts smaller than 1.3 m s−1 have the highest impact on NC in both seasons. Environments with elevated aerosol exhibit a stronger w impact over the full w distribution in a season, while in clean marine environments the available NCCN limits NC for higher w.
-
The WNAO exhibits an anti-correlated seasonal cycle of NC and at cloud base, with 25 % less NC and 71 % more in their overall observed mean values in summer compared to winter. The seasonal cycle is consistent with the anti-correlated AOD and NC cycle measured by remote-sensing and satellite instruments (Dadashazar et al., 2021b).
-
The mean values of w at cloud bases are 33 % lower in summer compared to winter. Simultaneously, the variability of updraft speeds is reduced by 31 % in summer. Both indicate a higher dynamical influence during winter. A correlation of NC and w is observed in the seasonal cycle and suggests that the difference between the seasons is driven by dynamics.
-
The winter directly below cloud shows a broad distribution due to different aerosol sources, while only clear sky or conditions with high aerosol loading were measured in summer. For environments with high aerosol loading, summer exhibits a 46 % increased mean .
-
The aerosol size distribution during winter exhibits a bimodal distribution in clean marine and medium conditions, which transforms into a unimodal distribution for higher aerosol loadings. The Aitken mode acts as reservoir for the accumulation mode, since Ngt85 increases, while the aerosol number concentrations do not differ significantly. In contrast to the winter period, the summer period is characterized by unimodal distributions and a clear difference between the aerosol concentrations of the groups.
-
The aerosol composition shows a constant proportion of sea salt in each season, with an increased aerosol mass concentration measured in winter, which could be related to the increased surface wind speeds resulting in more efficient wind-driven sea salt emissions (Painemal et al., 2021). With the increase in , a concomitant increase in OA, , and mass concentrations is measured in summer. In winter, the increase is comparatively moderate.
-
w and related Smax determine the range of activated CCN, and Smax is reduced at increasing . As shown, w dominantly affects the activation of CCN and determines the fraction of activated aerosol and thus explains generally higher NC values during winter compared to summer.
The observational data presented in this study include key parameters which are used in state-of-the-art aerosol–climate models to describe aerosol-induced cloud modifications. Consistent observations of the aerosol number concentration, size distribution and composition, and w as well as NC are provided for a wide range of conditions in the winter and summer seasons. Hence the data could serve as a valuable basis for evaluating and further improving the representation of aerosol–cloud interactions in future climate simulations.
| Dmax | maximum distance of cloud measurements to aerosol measurements |
| hACB | height above cloud base |
| NC | cloud droplet number concentration |
| cloud condensation nuclei concentration at 0.43 % supersaturation | |
| Ngt85 | aerosol number concentration above 85 nm |
| Smax | maximum supersaturation in cloud base |
| w | updraft speed |
| weff | effective updraft speed |
| 2D-S | Two-Dimensional Stereo probe |
| ACB | above cloud base |
| ACTIVATE | Aerosol Cloud meTerology Interactions oVer the western ATlantic Experiment |
| AMS | aerosol mass spectrometer |
| AOD | aerosol optical depth |
| BCB | below cloud base |
| CCN | cloud condensation nuclei |
| CMIP6 | Coupled Model Intercomparison Project Phase 6 |
| DoF | depth of field |
| FCDP | Fast Cloud Droplet Probe |
| LAS | laser aerosol spectrometer |
| MBL | marine boundary layer |
| OA | organic aerosol |
| PAS | particle air speed |
| PILS | particle-into-liquid sampler |
| PMM | probability matching method |
| RF | research flight |
| SMPS | scanning mobility particle sizer |
| SPEC Inc. | Stratton Park Engineering Company Incorporated |
| TAMMS | turbulent air motion measurement system |
| WNAO | western North Atlantic Ocean |
The ACTIVATE data are available at https://doi.org/10.5067/SUBORBITAL/ACTIVATE/DATA001 (Sorooshian, 2022).
SiK conducted the analysis and wrote the manuscript. CV supervised the study and provided intensive feedback on the manuscript. KLT wrote Sect. 2.2.3. AJS and LDZ wrote Sect. 2.2.5. LDZ wrote Sect. 2.2.6. JH contributed to Sects. 1 and 4. EC, EW and LDZ performed the flight measurements. SiK, VH, StK, CR and DS participated in instrument calibration. BA, RM, LDZ and AJS participated in mission planning. RAF, AJS and MAS conducted the weather forecast. EC, RAF, AJS, RM, MAS and AJS participated in strategic flight planning. SiK, RM, KLT, CR, EW, LDZ, MAS and AJS participated in mission operation. GC and MAS conducted the data management. All authors commented on the manuscript.
The contact author has declared that neither they nor their co-authors have any competing interests.
Publisher's note: Copernicus Publications remains neutral with regard to jurisdictional claims in published maps and institutional affiliations.
We want to express our gratitude to the flight operation teams for their excellent support. The work was funded by NASA grant 80NSSC19K0442 in support of ACTIVATE, a NASA Earth Venture Suborbital-3 (EVS-3) investigation funded by NASA's Earth Science Division and managed through the Earth System Science Pathfinder Program Office.
This research has been supported by the Earth Sciences Division (grant no. 80NSSC19K0442), the Helmholtz-Gemeinschaft (grant no. W2/W3-060) and the Deutsche Forschungsgemeinschaft (grant nos. TRR 301 – Project-ID 428312742 and SPP 1294 HALO – VO 1504/7-1).
The article processing charges for this open-access publication were covered by the German Aerospace Center (DLR).
This paper was edited by Veli-Matti Kerminen and reviewed by two anonymous referees.
Abdul-Razzak, H. and Ghan, S. J.: A Parameterization of Aerosol Activation: 2. Multiple Aerosol Types, J. Geophys. Res.-Atmos., 105, 6837–6844, https://doi.org/10.1029/1999JD901161, 2000. a
Albrecht, B. A.: Aerosols, Cloud Microphysics, and Fractional Cloudiness, Science, 245, 1227–1230, https://doi.org/10.1126/science.245.4923.1227, 1989. a
Andrews, T., Gregory, J. M., and Webb, M. J.: The Dependence of Radiative Forcing and Feedback on Evolving Patterns of Surface Temperature Change in Climate Models, J. Climate, 28, 1630–1648, https://doi.org/10.1175/JCLI-D-14-00545.1, 2015. a
Baker, B. and Lawson, R. P.: Improvement in Determination of Ice Water Content from Two-Dimensional Particle Imagery. Part I: Image-to-Mass Relationships, J. Appl. Meteorol. Clim., 45, 1282–1290, https://doi.org/10.1175/JAM2398.1, 2006. a
Baumgardner, D., Strapp, W., and Dye, J. E.: Evaluation of the Forward Scattering Spectrometer Probe. Part II: Corrections for Coincidence and Dead-Time Losses, J. Atmos. Ocean. Tech., 2, 626–632, https://doi.org/10.1175/1520-0426(1985)002<0626:EOTFSS>2.0.CO;2, 1985. a
Baumgardner, D., Abel, S. J., Axisa, D., Cotton, R., Crosier, J., Field, P., Gurganus, C., Heymsfield, A., Korolev, A., Krämer, M., Lawson, P., McFarquhar, G., Ulanowski, Z., and Um, J.: Cloud Ice Properties: In Situ Measurement Challenges, Meteor. Mon., 58, 9.1–9.23, https://doi.org/10.1175/AMSMONOGRAPHS-D-16-0011.1, 2017. a, b
Bock, L., Lauer, A., Schlund, M., Barreiro, M., Bellouin, N., Jones, C., Meehl, G. A., Predoi, V., Roberts, M. J., and Eyring, V.: Quantifying Progress Across Different CMIP Phases With the ESMValTool, J. Geophys. Res.-Atmos., 125, e2019JD032321, https://doi.org/10.1029/2019JD032321, 2020. a
Bowen, H. J. M.: Environmental Chemistry of the Elements, Academic Press, London, 1979. a
Braga, R. C., Rosenfeld, D., Weigel, R., Jurkat, T., Andreae, M. O., Wendisch, M., Pöhlker, M. L., Klimach, T., Pöschl, U., Pöhlker, C., Voigt, C., Mahnke, C., Borrmann, S., Albrecht, R. I., Molleker, S., Vila, D. A., Machado, L. A. T., and Artaxo, P.: Comparing parameterized versus measured microphysical properties of tropical convective cloud bases during the ACRIDICON–CHUVA campaign, Atmos. Chem. Phys., 17, 7365–7386, https://doi.org/10.5194/acp-17-7365-2017, 2017a. a, b, c
Braga, R. C., Rosenfeld, D., Weigel, R., Jurkat, T., Andreae, M. O., Wendisch, M., Pöschl, U., Voigt, C., Mahnke, C., Borrmann, S., Albrecht, R. I., Molleker, S., Vila, D. A., Machado, L. A. T., and Grulich, L.: Further evidence for CCN aerosol concentrations determining the height of warm rain and ice initiation in convective clouds over the Amazon basin, Atmos. Chem. Phys., 17, 14433–14456, https://doi.org/10.5194/acp-17-14433-2017, 2017b. a
Braga, R. C., Ervens, B., Rosenfeld, D., Andreae, M. O., Förster, J.-D., Fütterer, D., Hernández Pardo, L., Holanda, B. A., Jurkat-Witschas, T., Krüger, O. O., Lauer, O., Machado, L. A. T., Pöhlker, C., Sauer, D., Voigt, C., Walser, A., Wendisch, M., Pöschl, U., and Pöhlker, M. L.: Cloud droplet formation at the base of tropical convective clouds: closure between modeling and measurement results of ACRIDICON–CHUVA, Atmos. Chem. Phys., 21, 17513–17528, https://doi.org/10.5194/acp-21-17513-2021, 2021. a, b, c
Bräuer, T., Voigt, C., Sauer, D., Kaufmann, S., Hahn, V., Scheibe, M., Schlager, H., Diskin, G. S., Nowak, J. B., DiGangi, J. P., Huber, F., Moore, R. H., and Anderson, B. E.: Airborne Measurements of Contrail Ice Properties—Dependence on Temperature and Humidity, Geophys. Res. Lett., 48, e2020GL092166, https://doi.org/10.1029/2020GL092166, 2021a. a
Bräuer, T., Voigt, C., Sauer, D., Kaufmann, S., Hahn, V., Scheibe, M., Schlager, H., Huber, F., Le Clercq, P., Moore, R. H., and Anderson, B. E.: Reduced ice number concentrations in contrails from low-aromatic biofuel blends, Atmos. Chem. Phys., 21, 16817–16826, https://doi.org/10.5194/acp-21-16817-2021, 2021b. a
Calheiros, R. V. and Zawadzki, I.: Reflectivity-Rain Rate Relationships for Radar Hydrology in Brazil, J. Appl. Meteorol. Clim., 26, 118–132, https://doi.org/10.1175/1520-0450(1987)026<0118:RRRRFR>2.0.CO;2, 1987. a
Cecchini, M. A., Machado, L. A. T., Andreae, M. O., Martin, S. T., Albrecht, R. I., Artaxo, P., Barbosa, H. M. J., Borrmann, S., Fütterer, D., Jurkat, T., Mahnke, C., Minikin, A., Molleker, S., Pöhlker, M. L., Pöschl, U., Rosenfeld, D., Voigt, C., Weinzierl, B., and Wendisch, M.: Sensitivities of Amazonian clouds to aerosols and updraft speed, Atmos. Chem. Phys., 17, 10037–10050, https://doi.org/10.5194/acp-17-10037-2017, 2017. a
Ceppi, P., Brient, F., Zelinka, M. D., and Hartmann, D. L.: Cloud Feedback Mechanisms and Their Representation in Global Climate Models, WIREs Clim. Change, 8, e465, https://doi.org/10.1002/wcc.465, 2017. a
Dadashazar, H., Alipanah, M., Hilario, M. R. A., Crosbie, E., Kirschler, S., Liu, H., Moore, R. H., Peters, A. J., Scarino, A. J., Shook, M., Thornhill, K. L., Voigt, C., Wang, H., Winstead, E., Zhang, B., Ziemba, L., and Sorooshian, A.: Aerosol responses to precipitation along North American air trajectories arriving at Bermuda, Atmos. Chem. Phys., 21, 16121–16141, https://doi.org/10.5194/acp-21-16121-2021, 2021a. a
Dadashazar, H., Painemal, D., Alipanah, M., Brunke, M., Chellappan, S., Corral, A. F., Crosbie, E., Kirschler, S., Liu, H., Moore, R. H., Robinson, C., Scarino, A. J., Shook, M., Sinclair, K., Thornhill, K. L., Voigt, C., Wang, H., Winstead, E., Zeng, X., Ziemba, L., Zuidema, P., and Sorooshian, A.: Cloud drop number concentrations over the western North Atlantic Ocean: seasonal cycle, aerosol interrelationships, and other influential factors, Atmos. Chem. Phys., 21, 10499–10526, https://doi.org/10.5194/acp-21-10499-2021, 2021b. a, b, c
DeCarlo, P. F., Kimmel, J. R., Trimborn, A., Northway, M. J., Jayne, J. T., Aiken, A. C., Gonin, M., Fuhrer, K., Horvath, T., Docherty, K. S., Worsnop, D. R., and Jimenez, J. L.: Field-Deployable, High-Resolution, Time-of-Flight Aerosol Mass Spectrometer, Anal. Chem., 78, 8281–8289, https://doi.org/10.1021/ac061249n, 2006. a
Dusek, U., Frank, G. P., Hildebrandt, L., Curtius, J., Schneider, J., Walter, S., Chand, D., Drewnick, F., Hings, S., Jung, D., Borrmann, S., and Andreae, M. O.: Size Matters More Than Chemistry for Cloud-Nucleating Ability of Aerosol Particles, Science, 312, 1375–1378, https://doi.org/10.1126/science.1125261, 2006. a
Ervens, B., Feingold, G., and Kreidenweis, S. M.: Influence of Water-Soluble Organic Carbon on Cloud Drop Number Concentration, J. Geophys. Res.-Atmos., 110, https://doi.org/10.1029/2004JD005634, 2005. a
Faber, S., French, J. R., and Jackson, R.: Laboratory and in-flight evaluation of measurement uncertainties from a commercial Cloud Droplet Probe (CDP), Atmos. Meas. Tech., 11, 3645–3659, https://doi.org/10.5194/amt-11-3645-2018, 2018. a
Farren, N. J., Dunmore, R. E., Mead, M. I., Mohd Nadzir, M. S., Samah, A. A., Phang, S.-M., Bandy, B. J., Sturges, W. T., and Hamilton, J. F.: Chemical characterisation of water-soluble ions in atmospheric particulate matter on the east coast of Peninsular Malaysia, Atmos. Chem. Phys., 19, 1537–1553, https://doi.org/10.5194/acp-19-1537-2019, 2019. a
Flamant, C., Knippertz, P., Fink, A. H., Akpo, A., Brooks, B., Chiu, C. J., Coe, H., Danuor, S., Evans, M., Jegede, O., Kalthoff, N., Konaré, A., Liousse, C., Lohou, F., Mari, C., Schlager, H., Schwarzenboeck, A., Adler, B., Amekudzi, L., Aryee, J., Ayoola, M., Batenburg, A. M., Bessardon, G., Borrmann, S., Brito, J., Bower, K., Burnet, F., Catoire, V., Colomb, A., Denjean, C., Fosu-Amankwah, K., Hill, P. G., Lee, J., Lothon, M., Maranan, M., Marsham, J., Meynadier, R., Ngamini, J.-B., Rosenberg, P., Sauer, D., Smith, V., Stratmann, G., Taylor, J. W., Voigt, C., and Yoboué, V.: The Dynamics–Aerosol–Chemistry–Cloud Interactions in West Africa Field Campaign: Overview and Research Highlights, B. Am. Meteorol. Soc., 99, 83–104, https://doi.org/10.1175/BAMS-D-16-0256.1, 2018. a
Formenti, P., D'Anna, B., Flamant, C., Mallet, M., Piketh, S. J., Schepanski, K., Waquet, F., Auriol, F., Brogniez, G., Burnet, F., Chaboureau, J.-P., Chauvigné, A., Chazette, P., Denjean, C., Desboeufs, K., Doussin, J.-F., Elguindi, N., Feuerstein, S., Gaetani, M., Giorio, C., Klopper, D., Mallet, M. D., Nabat, P., Monod, A., Solmon, F., Namwoonde, A., Chikwililwa, C., Mushi, R., Welton, E. J., and Holben, B.: The Aerosols, Radiation and Clouds in Southern Africa Field Campaign in Namibia: Overview, Illustrative Observations, and Way Forward, B. Am. Meteorol. Soc., 100, 1277–1298, https://doi.org/10.1175/BAMS-D-17-0278.1, 2019. a
Freud, E. and Rosenfeld, D.: Linear Relation between Convective Cloud Drop Number Concentration and Depth for Rain Initiation, J. Geophys. Res.-Atmos., 117, D02207, https://doi.org/10.1029/2011JD016457, 2012. a
Ghan, S. J., Abdul-Razzak, H., Nenes, A., Ming, Y., Liu, X., Ovchinnikov, M., Shipway, B., Meskhidze, N., Xu, J., and Shi, X.: Droplet Nucleation: Physically-based Parameterizations and Comparative Evaluation, J. Adv. Model. Earth Sy., 3, M10001, https://doi.org/10.1029/2011MS000074, 2011. a
Grosvenor, D. P., Sourdeval, O., Zuidema, P., Ackerman, A., Alexandrov, M. D., Bennartz, R., Boers, R., Cairns, B., Chiu, J. C., Christensen, M., Deneke, H., Diamond, M., Feingold, G., Fridlind, A., Hünerbein, A., Knist, C., Kollias, P., Marshak, A., McCoy, D., Merk, D., Painemal, D., Rausch, J., Rosenfeld, D., Russchenberg, H., Seifert, P., Sinclair, K., Stier, P., van Diedenhoven, B., Wendisch, M., Werner, F., Wood, R., Zhang, Z., and Quaas, J.: Remote Sensing of Droplet Number Concentration in Warm Clouds: A Review of the Current State of Knowledge and Perspectives, Rev. Geophys., 56, 409–453, https://doi.org/10.1029/2017RG000593, 2018. a
Gryspeerdt, E., Quaas, J., and Bellouin, N.: Constraining the Aerosol Influence on Cloud Fraction, J. Geophys. Res.-Atmos., 121, 3566–3583, https://doi.org/10.1002/2015JD023744, 2016. a
Gryspeerdt, E., Quaas, J., Ferrachat, S., Gettelman, A., Ghan, S., Lohmann, U., Morrison, H., Neubauer, D., Partridge, D. G., Stier, P., Takemura, T., Wang, H., Wang, M., and Zhang, K.: Constraining the Instantaneous Aerosol Influence on Cloud Albedo, P. Natl. Acad. Sci. USA, 114, 4899–4904, https://doi.org/10.1073/pnas.1617765114, 2017. a
Gurganus, C. and Lawson, P.: Laboratory and Flight Tests of 2D Imaging Probes: Toward a Better Understanding of Instrument Performance and the Impact on Archived Data, J. Atmos. Ocean. Tech., 35, 1533–1553, https://doi.org/10.1175/JTECH-D-17-0202.1, 2018. a
Haddad, Z. S. and Rosenfeld, D.: Optimality of Empirical Z-R Relations, Q. J. Roy. Meteor. Soc., 123, 1283–1293, https://doi.org/10.1002/qj.49712354107, 1997. a, b, c, d
Hersey, S. P., Sorooshian, A., Murphy, S. M., Flagan, R. C., and Seinfeld, J. H.: Aerosol hygroscopicity in the marine atmosphere: a closure study using high-time-resolution, multiple-RH DASH-SP and size-resolved C-ToF-AMS data, Atmos. Chem. Phys., 9, 2543–2554, https://doi.org/10.5194/acp-9-2543-2009, 2009. a
Hilario, M. R. A., Crosbie, E., Shook, M., Reid, J. S., Cambaliza, M. O. L., Simpas, J. B. B., Ziemba, L., DiGangi, J. P., Diskin, G. S., Nguyen, P., Turk, F. J., Winstead, E., Robinson, C. E., Wang, J., Zhang, J., Wang, Y., Yoon, S., Flynn, J., Alvarez, S. L., Behrangi, A., and Sorooshian, A.: Measurement report: Long-range transport patterns into the tropical northwest Pacific during the CAMP2Ex aircraft campaign: chemical composition, size distributions, and the impact of convection, Atmos. Chem. Phys., 21, 3777–3802, https://doi.org/10.5194/acp-21-3777-2021, 2021. a, b
Hoose, C. and Möhler, O.: Heterogeneous ice nucleation on atmospheric aerosols: a review of results from laboratory experiments, Atmos. Chem. Phys., 12, 9817–9854, https://doi.org/10.5194/acp-12-9817-2012, 2012. a
IPCC: Climate Change 2021 – The Physical Science Basis, in: Climate Change 2021: The Physical Science Basis. Contribution of Working Group I to the Sixth Assessment Report of the Intergovernmental Panel on Climate Change, edited by: Masson-Delmotte, V., Zhai, P., Pirani, A., Connorsm S. L., Péan, C., Berger, S., Caud, N., Chen, Y., Goldfarb, L., Gomis, M. I., Huang, M., Leitzell, K., Lonnoy, E., Matthews, J. B. R., Maycock, T. K., Waterfield, T., Yelekçi, O., Yu, R., and Zhou, B., Cambridge University Press, Cambridge edn., p. 1535, 2021. a
Kleine, J., Voigt, C., Sauer, D., Schlager, H., Scheibe, M., Jurkat-Witschas, T., Kaufmann, S., Kärcher, B., and Anderson, B. E.: In Situ Observations of Ice Particle Losses in a Young Persistent Contrail, Geophys. Res. Lett., 45, 13553–13561, https://doi.org/10.1029/2018GL079390, 2018. a
Knippertz, P., Coe, H., Chiu, J. C., Evans, M. J., Fink, A. H., Kalthoff, N., Liousse, C., Mari, C., Allan, R. P., Brooks, B., Danour, S., Flamant, C., Jegede, O. O., Lohou, F., and Marsham, J. H.: The DACCIWA Project: Dynamics–Aerosol–Chemistry–Cloud Interactions in West Africa, B. Am. Meteorol. Soc., 96, 1451–1460, https://doi.org/10.1175/BAMS-D-14-00108.1, 2015. a
Knollenberg, R. G.: The Optical Array: An Alternative to Extinction and Scattering for Particle Size Measurements, J. Appl. Meteor, 9, 86–103, 1970. a, b
Knop, I., Bansmer, S. E., Hahn, V., and Voigt, C.: Comparison of different droplet measurement techniques in the Braunschweig Icing Wind Tunnel, Atmos. Meas. Tech., 14, 1761–1781, https://doi.org/10.5194/amt-14-1761-2021, 2021. a
Koehler, K. A., Kreidenweis, S. M., DeMott, P. J., Prenni, A. J., Carrico, C. M., Ervens, B., and Feingold, G.: Water activity and activation diameters from hygroscopicity data – Part II: Application to organic species, Atmos. Chem. Phys., 6, 795–809, https://doi.org/10.5194/acp-6-795-2006, 2006. a
Köhler, H.: The Nucleus in and the Growth of Hygroscopic Droplets, T. Faraday Soc., 32, 1152–1161, 1936. a, b
Korolev, A.: Reconstruction of the Sizes of Spherical Particles from Their Shadow Images. Part I: Theoretical Considerations, J. Atmos. Ocean. Tech., 24, 376–389, https://doi.org/10.1175/JTECH1980.1, 2007. a
Korolev, A. V., Kuznetsov, S. V., Makarov, Y. E., and Novikov, V. S.: Evaluation of Measurements of Particle Size and Sample Area from Optical Array Probes, J. Atmos. Ocean. Tech., 8, 514–522, https://doi.org/10.1175/1520-0426(1991)008<0514:EOMOPS>2.0.CO;2, 1991. a
Korolev, A. V., Strapp, J. W., and Isaac, G. A.: Evaluation of the Accuracy of PMS Optical Array Probes, J. Atmos. Ocean. Tech., 15, 708–720, https://doi.org/10.1175/1520-0426(1998)015<0708:EOTAOP>2.0.CO;2, 1998. a
Lance, S.: Coincidence Errors in a Cloud Droplet Probe (CDP) and a Cloud and Aerosol Spectrometer (CAS), and the Improved Performance of a Modified CDP, J. Atmos. Ocean. Tech., 29, 1532–1541, https://doi.org/10.1175/JTECH-D-11-00208.1, 2012. a
Lance, S., Nenes, A., Medina, J., and Smith, J. N.: Mapping the Operation of the DMT Continuous Flow CCN Counter, Aerosol Sci. Tech., 40, 242–254, https://doi.org/10.1080/02786820500543290, 2006. a
Lance, S., Brock, C. A., Rogers, D., and Gordon, J. A.: Water droplet calibration of the Cloud Droplet Probe (CDP) and in-flight performance in liquid, ice and mixed-phase clouds during ARCPAC, Atmos. Meas. Tech., 3, 1683–1706, https://doi.org/10.5194/amt-3-1683-2010, 2010. a
Lawson, R. P.: Effects of ice particles shattering on the 2D-S probe, Atmos. Meas. Tech., 4, 1361–1381, https://doi.org/10.5194/amt-4-1361-2011, 2011. a
Lawson, R. P. and Baker, B. A.: Improvement in Determination of Ice Water Content from Two-Dimensional Particle Imagery. Part II: Applications to Collected Data, J. Appl. Meteorol. Clim., 45, 1291–1303, https://doi.org/10.1175/JAM2399.1, 2006. a
Lawson, R. P., O'Connor, D., Zmarzly, P., Weaver, K., Baker, B., Mo, Q., and Jonsson, H.: The 2D-S (Stereo) Probe: Design and Preliminary Tests of a New Airborne, High-Speed, High-Resolution Particle Imaging Probe, J. Atmos. Ocean. Tech., 23, 1462–1477, https://doi.org/10.1175/JTECH1927.1, 2006. a
Lawson, R. P., Woods, S., Jensen, E., Erfani, E., Gurganus, C., Gallagher, M., Connolly, P., Whiteway, J., Baran, A. J., May, P., Heymsfield, A., Schmitt, C. G., McFarquhar, G., Um, J., Protat, A., Bailey, M., Lance, S., Muehlbauer, A., Stith, J., Korolev, A., Toon, O. B., and Krämer, M.: A Review of Ice Particle Shapes in Cirrus Formed In Situ and in Anvils, J. Geophys. Res.-Atmos., 124, 10049–10090, https://doi.org/10.1029/2018JD030122, 2019. a
Lenschow, D. H.: Aircraft Measurements in the Boundary Layer, in: Probing the Atmospheric Boundary Layer, edited by: Lenschow, D. H., American Meteorological Society, Boston, MA, https://doi.org/10.1007/978-1-944970-14-7_5, pp. 39–55, 1986. a
Lohmann, U. and Hoose, C.: Sensitivity studies of different aerosol indirect effects in mixed-phase clouds, Atmos. Chem. Phys., 9, 8917–8934, https://doi.org/10.5194/acp-9-8917-2009, 2009. a
Lohmann, U., Stier, P., Hoose, C., Ferrachat, S., Kloster, S., Roeckner, E., and Zhang, J.: Cloud microphysics and aerosol indirect effects in the global climate model ECHAM5-HAM, Atmos. Chem. Phys., 7, 3425–3446, https://doi.org/10.5194/acp-7-3425-2007, 2007. a
Lu, M.-L., Conant, W. C., Jonsson, H. H., Varutbangkul, V., Flagan, R. C., and Seinfeld, J. H.: The Marine Stratus/Stratocumulus Experiment (MASE): Aerosol–cloud Relationships in Marine Stratocumulus, J. Geophys. Res.-Atmos., 112, D10209, https://doi.org/10.1029/2006JD007985, 2007. a
Ma, L., Dadashazar, H., Hilario, M. R. A., Cambaliza, M. O., Lorenzo, G. R., Simpas, J. B., Nguyen, P., and Sorooshian, A.: Contrasting Wet Deposition Composition between Three Diverse Islands and Coastal North American Sites, Atmos. Environ., 244, 117919, https://doi.org/10.1016/j.atmosenv.2020.117919, 2021. a
McComiskey, A. and Feingold, G.: The scale problem in quantifying aerosol indirect effects, Atmos. Chem. Phys., 12, 1031–1049, https://doi.org/10.5194/acp-12-1031-2012, 2012. a
McCoy, I. L., McCoy, D. T., Wood, R., Regayre, L., Watson-Parris, D., Grosvenor, D. P., Mulcahy, J. P., Hu, Y., Bender, F. A.-M., Field, P. R., Carslaw, K. S., and Gordon, H.: The Hemispheric Contrast in Cloud Microphysical Properties Constrains Aerosol Forcing, P. Natl. Acad. Sci. USA, 117, 18998–19006, https://doi.org/10.1073/pnas.1922502117, 2020. a
McCoy, I. L., Bretherton, C. S., Wood, R., Twohy, C. H., Gettelman, A., Bardeen, C. G., and Toohey, D. W.: Influences of Recent Particle Formation on Southern Ocean Aerosol Variability and Low Cloud Properties, J. Geophys. Res.-Atmos., 126, e2020JD033529, https://doi.org/10.1029/2020JD033529, 2021. a
McNaughton, C. S., Clarke, A. D., Howell, S. G., Pinkerton, M., Anderson, B., Thornhill, L., Hudgins, C., Winstead, E., Dibb, J. E., Scheuer, E., and Maring, H.: Results from the DC-8 Inlet Characterization Experiment (DICE): Airborne Versus Surface Sampling of Mineral Dust and Sea Salt Aerosols, Aerosol Sci. Tech., 41, 136–159, https://doi.org/10.1080/02786820601118406, 2007. a
Moore, R. H. and Nenes, A.: Scanning Flow CCN Analysis—A Method for Fast Measurements of CCN Spectra, Aerosol Sci. Tech., 43, 1192–1207, https://doi.org/10.1080/02786820903289780, 2009. a
Moore, R. H., Thornhill, K. L., Weinzierl, B., Sauer, D., D'Ascoli, E., Kim, J., Lichtenstern, M., Scheibe, M., Beaton, B., Beyersdorf, A. J., Barrick, J., Bulzan, D., Corr, C. A., Crosbie, E., Jurkat, T., Martin, R., Riddick, D., Shook, M., Slover, G., Voigt, C., White, R., Winstead, E., Yasky, R., Ziemba, L. D., Brown, A., Schlager, H., and Anderson, B. E.: Biofuel Blending Reduces Particle Emissions from Aircraft Engines at Cruise Conditions, Nature, 543, 411–415, https://doi.org/10.1038/nature21420, 2017. a, b
Moore, R. H., Wiggins, E. B., Ahern, A. T., Zimmerman, S., Montgomery, L., Campuzano Jost, P., Robinson, C. E., Ziemba, L. D., Winstead, E. L., Anderson, B. E., Brock, C. A., Brown, M. D., Chen, G., Crosbie, E. C., Guo, H., Jimenez, J. L., Jordan, C. E., Lyu, M., Nault, B. A., Rothfuss, N. E., Sanchez, K. J., Schueneman, M., Shingler, T. J., Shook, M. A., Thornhill, K. L., Wagner, N. L., and Wang, J.: Sizing response of the Ultra-High Sensitivity Aerosol Spectrometer (UHSAS) and Laser Aerosol Spectrometer (LAS) to changes in submicron aerosol composition and refractive index, Atmos. Meas. Tech., 14, 4517–4542, https://doi.org/10.5194/amt-14-4517-2021, 2021. a, b
Myhre, G., Shindell, D., Bréon, F.-M., Collins, W., Fuglestvedt, J., Huang, J., Koch, D., Lamarque, J.-F., Lee, D., Mendoza, B., Nakajima, T., Robock, A., Stephens, G., Takemura, T., and Zhang, H.: Anthropogenic and Natural Radiative Forcing, in: Climate Change 2013: The Physical Science Basis. Contribution of Working Group I to the Fifth Assessment Report of the Intergovernmental Panel on Climate Change, edited by: Stocker, T., Qin, D., Plattner, G.-K., Tignor, M., Allen, S., Boschung, J., Nauels, A., Xia, Y., Bex, V., and Midgley, P., Cambridge University Press, Cambridge, UK and New York, NY, USA, https://doi.org/10.1017/CBO9781107415324.018, book Section 8, pp. 659–740, 2013. a
O'Connor, D., Baker, B., and Lawson, R. P.: Upgrades to the FSSP-100 Electronics, in: Proc. 15th Int. Conf. on Clouds and Precipitation, 7–11 July 2008, Cancun, Mexico, P13.7, 2008. a
Painemal, D., Chang, F.-L., Ferrare, R., Burton, S., Li, Z., Smith Jr., W. L., Minnis, P., Feng, Y., and Clayton, M.: Reducing uncertainties in satellite estimates of aerosol–cloud interactions over the subtropical ocean by integrating vertically resolved aerosol observations, Atmos. Chem. Phys., 20, 7167–7177, https://doi.org/10.5194/acp-20-7167-2020, 2020. a
Painemal, D., Corral, A. F., Sorooshian, A., Brunke, M. A., Chellappan, S., Gorooh, V. A., Ham, S.-H., O'Neill, L., Smith, W. L., Tselioudis, G., Wang, H., Zeng, X., and Zuidema, P.: An Overview of Atmospheric Features Over the Western North Atlantic Ocean and North American East Coast – Part 2: Circulation, Boundary Layer, and Clouds, J. Geophys. Res.-Atmos., 126, e2020JD033423, https://doi.org/10.1029/2020JD033423, 2021. a, b
Penner, J. E., Quaas, J., Storelvmo, T., Takemura, T., Boucher, O., Guo, H., Kirkevåg, A., Kristjánsson, J. E., and Seland, Ø.: Model intercomparison of indirect aerosol effects, Atmos. Chem. Phys., 6, 3391–3405, https://doi.org/10.5194/acp-6-3391-2006, 2006. a
Penner, J. E., Xu, L., and Wang, M.: Satellite Methods Underestimate Indirect Climate Forcing by Aerosols, P. Natl. Acad. Sci. USA, 108, 13404–13408, https://doi.org/10.1073/pnas.1018526108, 2011. a
Pinsky, M., Khain, A., Mazin, I., and Korolev, A.: Analytical Estimation of Droplet Concentration at Cloud Base, J. Geophys. Res.-Atmos., 117, D18211, https://doi.org/10.1029/2012JD017753, 2012. a, b
Pöhlker, M. L., Zhang, M., Campos Braga, R., Krüger, O. O., Pöschl, U., and Ervens, B.: Aitken mode particles as CCN in aerosol- and updraft-sensitive regimes of cloud droplet formation, Atmos. Chem. Phys., 21, 11723–11740, https://doi.org/10.5194/acp-21-11723-2021, 2021. a
Prabhakaran, P., Shawon, A. S. M., Kinney, G., Thomas, S., Cantrell, W., and Shaw, R. A.: The Role of Turbulent Fluctuations in Aerosol Activation and Cloud Formation, P. Natl. Acad. Sci. USA, 117, 16831–16838, https://doi.org/10.1073/pnas.2006426117, 2020. a
Quaas, J., Boucher, O., Bellouin, N., and Kinne, S.: Satellite-Based Estimate of the Direct and Indirect Aerosol Climate Forcing, J. Geophys. Res.-Atmos., 113, D05204, https://doi.org/10.1029/2007JD008962, 2008. a, b
Reutter, P., Su, H., Trentmann, J., Simmel, M., Rose, D., Gunthe, S. S., Wernli, H., Andreae, M. O., and Pöschl, U.: Aerosol- and updraft-limited regimes of cloud droplet formation: influence of particle number, size and hygroscopicity on the activation of cloud condensation nuclei (CCN), Atmos. Chem. Phys., 9, 7067–7080, https://doi.org/10.5194/acp-9-7067-2009, 2009. a, b
Righi, M., Hendricks, J., Lohmann, U., Beer, C. G., Hahn, V., Heinold, B., Heller, R., Krämer, M., Ponater, M., Rolf, C., Tegen, I., and Voigt, C.: Coupling aerosols to (cirrus) clouds in the global EMAC-MADE3 aerosol–climate model, Geosci. Model Dev., 13, 1635–1661, https://doi.org/10.5194/gmd-13-1635-2020, 2020. a
Roberts, G. C. and Nenes, A.: A Continuous-Flow Streamwise Thermal-Gradient CCN Chamber for Atmospheric Measurements, Aerosol Sci. Tech., 39, 206–221, https://doi.org/10.1080/027868290913988, 2005. a
Rosenfeld, D., Wolff, D. B., and Amitai, E.: The Window Probability Matching Method for Rainfall Measurements with Radar, J. Appl. Meteorol. Clim., 33, 682–693, https://doi.org/10.1175/1520-0450(1994)033<0682:TWPMMF>2.0.CO;2, 1994. a
Rosenfeld, D., Amitai, E., and Wolff, D. B.: Improved Accuracy of Radar WPMM Estimated Rainfall upon Application of Objective Classification Criteria, J. Appl. Meteorol. Clim., 34, 212–223, https://doi.org/10.1175/1520-0450-34.1.212, 1995. a
Rosenfeld, D., Fischman, B., Zheng, Y., Goren, T., and Giguzin, D.: Combined Satellite and Radar Retrievals of Drop Concentration and CCN at Convective Cloud Base, Geophys. Res. Lett., 41, 3259–3265, https://doi.org/10.1002/2014GL059453, 2014. a
Rosenfeld, D., Zheng, Y., Hashimshoni, E., Pöhlker, M. L., Jefferson, A., Pöhlker, C., Yu, X., Zhu, Y., Liu, G., Yue, Z., Fischman, B., Li, Z., Giguzin, D., Goren, T., Artaxo, P., Barbosa, H. M. J., Pöschl, U., and Andreae, M. O.: Satellite Retrieval of Cloud Condensation Nuclei Concentrations by Using Clouds as CCN Chambers, P. Natl. Acad. Sci. USA, 113, 5828–5834, https://doi.org/10.1073/pnas.1514044113, 2016. a
Rosenfeld, D., Zhu, Y., Wang, M., Zheng, Y., Goren, T., and Yu, S.: Aerosol-Driven Droplet Concentrations Dominate Coverage and Water of Oceanic Low-Level Clouds, Science, 363, eaav0566, https://doi.org/10.1126/science.aav0566, 2019. a
Russell, L. M., Sorooshian, A., Seinfeld, J. H., Albrecht, B. A., Nenes, A., Ahlm, L., Chen, Y.-C., Coggon, M., Craven, J. S., Flagan, R. C., Frossard, A. A., Jonsson, H., Jung, E., Lin, J. J., Metcalf, A. R., Modini, R., Mülmenstädt, J., Roberts, G., Shingler, T., Song, S., Wang, Z., and Wonaschütz, A.: Eastern Pacific Emitted Aerosol Cloud Experiment, B. Am. Meteorol. Soc., 94, 709–729, https://doi.org/10.1175/BAMS-D-12-00015.1, 2013. a
Schulze, B. C., Charan, S. M., Kenseth, C. M., Kong, W., Bates, K. H., Williams, W., Metcalf, A. R., Jonsson, H. H., Woods, R., Sorooshian, A., Flagan, R. C., and Seinfeld, J. H.: Characterization of Aerosol Hygroscopicity Over the Northeast Pacific Ocean: Impacts on Prediction of CCN and Stratocumulus Cloud Droplet Number Concentrations, Earth and Space Science, 7, e2020EA001098, https://doi.org/10.1029/2020EA001098, 2020. a
Seinfeld, J. H., Bretherton, C., Carslaw, K. S., Coe, H., DeMott, P. J., Dunlea, E. J., Feingold, G., Ghan, S., Guenther, A. B., Kahn, R., Kraucunas, I., Kreidenweis, S. M., Molina, M. J., Nenes, A., Penner, J. E., Prather, K. A., Ramanathan, V., Ramaswamy, V., Rasch, P. J., Ravishankara, A. R., Rosenfeld, D., Stephens, G., and Wood, R.: Improving Our Fundamental Understanding of the Role of Aerosol–cloud Interactions in the Climate System, P. Natl. Acad. Sci. USA, 113, 5781–5790, https://doi.org/10.1073/pnas.1514043113, 2016. a
Sorooshian, A.: Aerosol Cloud meTeorology Interactions oVer the western ATlantic Experiment, NASA Earth Data [data set], https://doi.org/10.5067/SUBORBITAL/ACTIVATE/DATA001, 2022. a
Sorooshian, A., Brechtel, F. J., Ma, Y., Weber, R. J., Corless, A., Flagan, R. C., and Seinfeld, J. H.: Modeling and Characterization of a Particle-into-Liquid Sampler (PILS), Aerosol Sci. Tech., 40, 396–409, https://doi.org/10.1080/02786820600632282, 2006. a
Sorooshian, A., MacDonald, A. B., Dadashazar, H., Bates, K. H., Coggon, M. M., Craven, J. S., Crosbie, E., Hersey, S. P., Hodas, N., Lin, J. J., Negrón Marty, A., Maudlin, L. C., Metcalf, A. R., Murphy, S. M., Padró, L. T., Prabhakar, G., Rissman, T. A., Shingler, T., Varutbangkul, V., Wang, Z., Woods, R. K., Chuang, P. Y., Nenes, A., Jonsson, H. H., Flagan, R. C., and Seinfeld, J. H.: A Multi-Year Data Set on Aerosol-Cloud-Precipitation-Meteorology Interactions for Marine Stratocumulus Clouds, Scientific Data, 5, 180026, https://doi.org/10.1038/sdata.2018.26, 2018. a
Sorooshian, A., Anderson, B., Bauer, S. E., Braun, R. A., Cairns, B., Crosbie, E., Dadashazar, H., Diskin, G., Ferrare, R., Flagan, R. C., Hair, J., Hostetler, C., Jonsson, H. H., Kleb, M. M., Liu, H., MacDonald, A. B., McComiskey, A., Moore, R., Painemal, D., Russell, L. M., Seinfeld, J. H., Shook, M., Smith, W. L., Thornhill, K., Tselioudis, G., Wang, H., Zeng, X., Zhang, B., Ziemba, L., and Zuidema, P.: Aerosol–Cloud–Meteorology Interaction Airborne Field Investigations: Using Lessons Learned from the U. S. West Coast in the Design of ACTIVATE off the U. S. East Coast, B. Am. Meteorol. Soc., 100, 1511–1528, https://doi.org/10.1175/BAMS-D-18-0100.1, 2019. a, b
Sorooshian, A., Corral, A. F., Braun, R. A., Cairns, B., Crosbie, E., Ferrare, R., Hair, J., Kleb, M. M., Mardi, A. H., Maring, H., McComiskey, A., Moore, R., Painemal, D., Scarino, A. J., Schlosser, J., Shingler, T., Shook, M., Wang, H., Zeng, X., Ziemba, L., and Zuidema, P.: Atmospheric Research Over the Western North Atlantic Ocean Region and North American East Coast: A Review of Past Work and Challenges Ahead, J. Geophys. Res.-Atmos., 125, e2019JD031626, https://doi.org/10.1029/2019JD031626, 2020. a, b
SPEC inc: FFSSP and FCDP Data Processing Manual, 27. October 2012, http://www.specinc.com/sites/default/files/software_and_manuals/FCDP_Post%20Processing%20Software%20Manual_rev2.6_20121027.pdf (last access: 7 June 2021), 2012. a, b
Thornhill, K. L., Anderson, B. E., Barrick, J. D. W., Bagwell, D. R., Friesen, R., and Lenschow, D. H.: Air Motion Intercomparison Flights during Transport and Chemical Evolution in the Pacific (TRACE-P)/ACE-ASIA, J. Geophys. Res.-Atmos., 108, 9001, https://doi.org/10.1029/2002JD003108, 2003. a
Twomey, S.: The Nuclei of Natural Cloud Formation Part II: The Supersaturation in Natural Clouds and the Variation of Cloud Droplet Concentration, Geofisica pura e applicata, 43, 243–249, https://doi.org/10.1007/BF01993560, 1959. a
Twomey, S.: The Influence of Pollution on the Shortwave Albedo of Clouds, J. Atmos. Sci., 34, 1149–1152, https://doi.org/10.1175/1520-0469(1977)034<1149:TIOPOT>2.0.CO;2, 1977. a
Twomey, S. and Warner, J.: Comparison of Measurements of Cloud Droplets and Cloud Nuclei, J. Atmos. Sci., 24, 702–703, 1967. a
Voigt, C., Schumann, U., Minikin, A., Abdelmonem, A., Afchine, A., Borrmann, S., Boettcher, M., Buchholz, B., Bugliaro, L., Costa, A., Curtius, J., Dollner, M., Dörnbrack, A., Dreiling, V., Ebert, V., Ehrlich, A., Fix, A., Forster, L., Frank, F., Fütterer, D., Giez, A., Graf, K., Grooß, J.-U., Groß, S., Heimerl, K., Heinold, B., Hüneke, T., Järvinen, E., Jurkat, T., Kaufmann, S., Kenntner, M., Klingebiel, M., Klimach, T., Kohl, R., Krämer, M., Krisna, T. C., Luebke, A., Mayer, B., Mertes, S., Molleker, S., Petzold, A., Pfeilsticker, K., Port, M., Rapp, M., Reutter, P., Rolf, C., Rose, D., Sauer, D., Schäfler, A., Schlage, R., Schnaiter, M., Schneider, J., Spelten, N., Spichtinger, P., Stock, P., Walser, A., Weigel, R., Weinzierl, B., Wendisch, M., Werner, F., Wernli, H., Wirth, M., Zahn, A., Ziereis, H., and Zöger, M.: ML-CIRRUS: The Airborne Experiment on Natural Cirrus and Contrail Cirrus with the High-Altitude Long-Range Research Aircraft HALO, B. Am. Meteorol. Soc., 98, 271–288, https://doi.org/10.1175/BAMS-D-15-00213.1, 2017. a
Voigt, C., Kleine, J., Sauer, D., Moore, R. H., Bräuer, T., Le Clercq, P., Kaufmann, S., Scheibe, M., Jurkat-Witschas, T., Aigner, M., Bauder, U., Boose, Y., Borrmann, S., Crosbie, E., Diskin, G. S., DiGangi, J., Hahn, V., Heckl, C., Huber, F., Nowak, J. B., Rapp, M., Rauch, B., Robinson, C., Schripp, T., Shook, M., Winstead, E., Ziemba, L., Schlager, H., and Anderson, B. E.: Cleaner Burning Aviation Fuels Can Reduce Contrail Cloudiness, Communications Earth & Environment, 2, 1–10, https://doi.org/10.1038/s43247-021-00174-y, 2021. a
Waskom, M. L.: Seaborn: Statistical Data Visualization, Journal of Open Source Software, 6, 3021, https://doi.org/10.21105/joss.03021, 2021. a
Weigel, R., Spichtinger, P., Mahnke, C., Klingebiel, M., Afchine, A., Petzold, A., Krämer, M., Costa, A., Molleker, S., Reutter, P., Szakáll, M., Port, M., Grulich, L., Jurkat, T., Minikin, A., and Borrmann, S.: Thermodynamic correction of particle concentrations measured by underwing probes on fast-flying aircraft, Atmos. Meas. Tech., 9, 5135–5162, https://doi.org/10.5194/amt-9-5135-2016, 2016. a
Wendisch, M., Pöschl, U., Andreae, M. O., Machado, L. A. T., Albrecht, R., Schlager, H., Rosenfeld, D., Martin, S. T., Abdelmonem, A., Afchine, A., Araùjo, A. C., Artaxo, P., Aufmhoff, H., Barbosa, H. M. J., Borrmann, S., Braga, R., Buchholz, B., Cecchini, M. A., Costa, A., Curtius, J., Dollner, M., Dorf, M., Dreiling, V., Ebert, V., Ehrlich, A., Ewald, F., Fisch, G., Fix, A., Frank, F., Fütterer, D., Heckl, C., Heidelberg, F., Hüneke, T., Jäkel, E., Järvinen, E., Jurkat, T., Kanter, S., Kästner, U., Kenntner, M., Kesselmeier, J., Klimach, T., Knecht, M., Kohl, R., Kölling, T., Krämer, M., Krüger, M., Krisna, T. C., Lavric, J. V., Longo, K., Mahnke, C., Manzi, A. O., Mayer, B., Mertes, S., Minikin, A., Molleker, S., Münch, S., Nillius, B., Pfeilsticker, K., Pöhlker, C., Roiger, A., Rose, D., Rosenow, D., Sauer, D., Schnaiter, M., Schneider, J., Schulz, C., de Souza, R. A. F., Spanu, A., Stock, P., Vila, D., Voigt, C., Walser, A., Walter, D., Weigel, R., Weinzierl, B., Werner, F., Yamasoe, M. A., Ziereis, H., Zinner, T., and Zöger, M.: ACRIDICON–CHUVA Campaign: Studying Tropical Deep Convective Clouds and Precipitation over Amazonia Using the New German Research Aircraft HALO, B. Am. Meteorol. Soc., 97, 1885–1908, https://doi.org/10.1175/BAMS-D-14-00255.1, 2016. a
Wood, R., Mechoso, C. R., Bretherton, C. S., Weller, R. A., Huebert, B., Straneo, F., Albrecht, B. A., Coe, H., Allen, G., Vaughan, G., Daum, P., Fairall, C., Chand, D., Gallardo Klenner, L., Garreaud, R., Grados, C., Covert, D. S., Bates, T. S., Krejci, R., Russell, L. M., de Szoeke, S., Brewer, A., Yuter, S. E., Springston, S. R., Chaigneau, A., Toniazzo, T., Minnis, P., Palikonda, R., Abel, S. J., Brown, W. O. J., Williams, S., Fochesatto, J., Brioude, J., and Bower, K. N.: The VAMOS Ocean-Cloud-Atmosphere-Land Study Regional Experiment (VOCALS-REx): goals, platforms, and field operations, Atmos. Chem. Phys., 11, 627–654, https://doi.org/10.5194/acp-11-627-2011, 2011. a
Zelinka, M. D., Andrews, T., Forster, P. M., and Taylor, K. E.: Quantifying Components of Aerosol-Cloud-Radiation Interactions in Climate Models, J. Geophys. Res.-Atmos., 119, 7599–7615, https://doi.org/10.1002/2014JD021710, 2014. a
Zelinka, M. D., Randall, D. A., Webb, M. J., and Klein, S. A.: Clearing Clouds of Uncertainty, Nat. Clim. Change, 7, 674–678, https://doi.org/10.1038/nclimate3402, 2017. a
Zheng, G., Wang, Y., Wood, R., Jensen, M. P., Kuang, C., McCoy, I. L., Matthews, A., Mei, F., Tomlinson, J. M., Shilling, J. E., Zawadowicz, M. A., Crosbie, E., Moore, R., Ziemba, L., Andreae, M. O., and Wang, J.: New Particle Formation in the Remote Marine Boundary Layer, Nat. Commun., 12, 527, https://doi.org/10.1038/s41467-020-20773-1, 2021. a