the Creative Commons Attribution 4.0 License.
the Creative Commons Attribution 4.0 License.
 | 22 Jun 2022
Characterizing the hygroscopicity of growing particles in the Canadian Arctic summer
Jonathan P. D. Abbatt
Matthew C. Boyer
Jai Prakash Chaubey
Douglas B. Collins
The impact of aerosols on clouds is a well-studied, although still poorly constrained, part of the atmospheric system. New particle formation (NPF) is thought to contribute 40 %–80 % of the global cloud droplet number concentration, although it is extremely difficult to observe an air mass from NPF to cloud formation. NPF and growth occurs frequently in the Canadian Arctic summer atmosphere, although only a few studies have characterized the source and properties of these aerosols. This study presents cloud condensation nuclei (CCN) concentrations measured on board the CCGS Amundsen in the eastern Canadian Arctic Archipelago from 23 July to 23 August 2016 as part of the Network on Climate and Aerosols: Addressing Uncertainties in Remote Canadian Environments (NETCARE). The study was dominated by frequent ultrafine particle and/or growth events, and particles smaller than 100 nm dominated the size distribution for 92 % of the study period. Using κ-Köhler theory and aerosol size distributions, the mean hygroscopicity parameter (κ) calculated for the entire study was 0.12 (0.06–0.12, 25th–75th percentile), suggesting that the condensable vapours that led to particle growth were primarily slightly hygroscopic, which we infer to be organic. Based on past measurement and modelling studies from NETCARE and the Canadian Arctic, it seems likely that the source of these slightly hygroscopic, organic, vapours is the ocean. Examining specific growth events suggests that the mode diameter (Dmax) had to exceed 40 nm before CCN concentrations at 0.99 % supersaturation (SS) started to increase, although a statistical analysis shows that CCN concentrations increased 13–274 cm−3 during all ultrafine particle and/or growth times (total particle concentrations >500 cm−3, Dmax<100 nm) compared with background times (total concentrations <500 cm−3) at SS of 0.26 %–0.99 %. This value increased to 25–425 cm−3 if the growth times were limited to times when Dmax was also larger than 40 nm. These results support past results from NETCARE by showing that the frequently observed ultrafine particle and growth events are dominated by a slightly hygroscopic fraction, which we interpret to be organic vapours originating from the ocean, and that these growing particles can increase the background CCN concentrations at SS as low as 0.26 %, thus pointing to their potential contribution to cloud properties and thus climate through the radiation balance.
- Article
(3998 KB) - Full-text XML
- BibTeX
- EndNote


The Arctic environment is changing at a rapid pace, driven by surface air temperatures that are increasing up to two or three times faster than the global average (Serreze and Barry, 2011) and summer sea-ice extent that is steadily declining (Stroeve and Notz, 2018; Brennan et al., 2020). Many of these changes are driven by factors that affect the summer surface energy budget, when solar radiation is present and changes in surface albedo due to melting surface ice or snow can affect the balance in the surface energy. In addition, clouds and aerosols can influence the amount of incoming solar radiation that reaches the surface of the earth. The role of low-level clouds in the summer Arctic radiation budget is complex, as they can cause the surface to not only cool, as expected at lower latitudes, but also warm, depending on the surface albedo and solar zenith angle (Shupe and Intrieri, 2004). Liquid cloud droplets form on pre-existing aerosol particles suspended in the atmosphere. Particles that can activate into droplets are called cloud condensation nuclei (CCN), and whether a given particle will act as a CCN depends on its size, chemical composition, and the supersaturation (SS) to which it is exposed. Therefore, it is important to characterize Arctic aerosol properties and their role in cloud formation processes to better understand the surface radiation budget in the changing Arctic atmosphere.
Aerosol concentrations in the Arctic experience a strong seasonal cycle, with long range transport from southerly latitudes bringing high mass concentrations during the winter and spring, which is known as Arctic haze. In contrast, the summer Arctic atmosphere is much cleaner with very low aerosol concentrations, providing conditions favourable for new particle formation (NPF). In the marine atmosphere at lower latitudes, NPF has been observed to occur in the free troposphere, but over open waters in the Arctic summer, frequent drizzle reduces the aerosol concentrations (condensation sink) to favour NPF in the boundary layer (Croft et al., 2016a; Browse et al., 2012). Modelling studies have estimated that NPF can contribute 40 %–80 % of cloud droplets globally (Merikanto et al., 2009; Kuang et al., 2009; Pierce and Adams, 2006). However, most of those studies assume that all particles that reach a minimum size, typically 70–100 nm, will automatically contribute to cloud droplet number concentration (CDNC). In determining the contribution of NPF on cloud droplet formation, it is important to characterize: (1) the source of the condensing vapours that lead to NPF and subsequent growth, noting that these sources could be different; (2) the chemical composition, and therefore the hygroscopicity, of the growing particles to determine their ability to activate as CCN; (3) whether the particles grow large enough to activate at an SS that is relevant in the ambient atmosphere; and (4) whether the particles formed are exposed to an SS that allows them to activate. It is extremely rare to actually observe an entire event from NPF to cloud droplet formation since the temporal and spatial scales usually cannot be captured by a single measurement platform, and most studies, including this one, can only contribute to investigating some of these aspects.
To understand the sources and chemical composition of summer Arctic aerosols, early studies at Alert, Canada, identified large mass fractions from methane sulfonate (MSA) and sulfate, suggesting that secondary aerosol mass originated from the marine biological production of dimethyl sulfide (DMS) and its subsequent atmospheric oxidation products led to aerosol growth (Li et al., 1993). Observations from 2011–2012 at Alert (Leaitch et al., 2013) and during the International Polar Years (2007–2008) in the Canadian Arctic Archipelago (Rempillo et al., 2011; Chang et al., 2011) linked small and growing particles to sulfate and DMS through measurements and modelling, further supporting the role of marine biology in Arctic aerosol through DMS oxidation in NPF and growth. There is evidence that iodine (e.g. iodine oxoacids) can also contribute to nucleation and growth on the coast of Greenland (Allan et al., 2015; Dall'Osto et al., 2018; Sipilä et al., 2016), as well as more recently in the central Arctic Ocean (Baccarini et al., 2020) and under controlled laboratory settings (He et al., 2021). However, the observed iodine is not always sufficient to explain the observed growth (Baccarini et al., 2020). Similarly, NH3 emitted from the guano of migratory birds is thought to significantly contribute to NPF in the Canadian Arctic (Croft et al., 2016b; Wentworth et al., 2016).
More recently, a growing body of work is providing evidence that organic compounds contribute to the growth of newly formed particle at lower latitudes (Ehn et al., 2014; Sihto et al., 2011), as well as in the Arctic. In the Canadian Arctic, direct measurements of chemical composition using aerosol mass spectrometry from aircraft (Willis et al., 2016) and at a ground site (Tremblay et al., 2019) showed significant organic contributions during three observed growth events. These growing particles have been linked to open waters at the local to regional scale through footprint sensitivity analyses, suggesting that the source of these organics was from the ocean. Indeed, oxygenated volatile organic compounds (OVOCs) have been observed in the Canadian Arctic (Mungall et al., 2017), with their atmospheric concentrations correlated to sunlight and surface ocean coloured dissolved organic matter. These OVOCs would be less volatile and could, with short amounts of atmospheric ageing, potentially condense and contribute to aerosol growth if the conditions were favourable (Ehn et al., 2014). On the Fram strait, hygroscopicity measurements at super- and sub-saturated conditions have consistently shown that summer aerosols, which are dominated by NPF and growth (Tunved et al., 2013), are less hygroscopic than pure inorganics, with observed hygroscopicity parameters (κ) ranging from 0.15 to 0.4 (Zábori et al., 2015; Kecorius et al., 2019; Lange et al., 2019). Since the expected κ values for ammonium sulfate and sulfuric acid range from 0.6 to 0.7 (Petters and Kreidenweis, 2007; Shantz et al., 2008), the observed κ values suggest that the aerosol was composed of a significant organic fraction. Similarly, aerosol hygroscopicity measured in the Pacific portion of the Arctic Ocean were 0.08–0.15 (Park et al., 2020; Herenz et al., 2018). A recent modelling study incorporating many of these results found that a large source of organic vapours originating from Arctic waters could explain much of the growth observed after NPF in the Canadian Arctic summer (Croft et al., 2019).
An aspect to consider is whether particles formed from NPF also grow to sizes large enough to activate at atmospherically relevant SS (0.2 %–0.6 % in the Arctic; Leaitch et al., 2016; Bulatovic et al., 2021). Cloud studies often find CDNC correlating with the accumulation mode (e.g. Hegg et al., 2012; Jia et al., 2019). However, it has been hypothesized that the extremely low aerosol number concentrations sometimes found in the summer Arctic causes even the smallest particles to quickly activate in a CCN-limited regime (Mauritsen et al., 2011). In-cloud observations from aircraft in the Canadian Arctic (Leaitch et al., 2016) and a mountain site on Svalbard (Koike et al., 2019) have reported that particles as small as 30 nm could be activating when the concentrations were less than 30 cm−3, suggesting that newly formed particles need only to grow to 30 nm before contributing to CDNC and potentially affecting climate. Although not direct measurements of cloud droplets, measured CCN concentrations have been observed to increase at SS >0.1 % during NPF and growth in Arctic (Willis et al., 2016; Kecorius et al., 2019; Lange et al., 2019) and Antarctic (Kim et al., 2019) locations, further suggesting that these newly formed particles can activate and contribute to climate effects. In addition, recent modelling work has shown that the SS in high Arctic clouds can reach as high as 1 % if aerosol concentrations are low, further supporting the potential climatic importance of newly formed particles (Bulatovic et al., 2021).
Although many of the above-mentioned studies have characterized the hygroscopicity of the summer Arctic aerosol, only four have focussed specifically on studying NPF and growth (Willis et al., 2016; Burkart et al., 2017; Kecorius et al., 2019; Lange et al., 2019), with the first three studies reporting results from five individual events. In this study we expand these findings to more events by presenting aerosol and CCN measurements sampled from the CCGS Amundsen in the Canadian Arctic Archipelago during the summer of 2016 as a part of the Network on Climate and Aerosols: Addressing Uncertainties in Remote Canadian Environments (NETCARE). While previous work by Collins et al. (2017) characterized the ultrafine particle (UFP) and growth events observed during the cruise, this study focuses on understanding the hygroscopicity of the particles during growth to determine if the particles grew sufficiently large to activate at an SS that is relevant for cloud formation. Calculating the hygroscopicity parameter also allows us to characterize the chemical composition of the aerosols and thus infer the sources of the condensing vapours that contributed to the growth of the UFP.
2.1 Sampling platform and instrumentation
This study uses data collected from the NETCARE ship-based observations on board CCGS Amundsen from 14 July to 25 August 2016 (Abbatt, 2019), with the cruise track shown in Fig. 1. Based on the proximity to the open ocean, surrounding land mass, time, and direction of the ship cruise, the study was conveniently divided into three legs based on geography: (i) Baffin Bay (23 July–4 August), (ii) Nares Strait (5–17 August), and (iii) Resolute Bay (17–23 August), shown in Fig. 1 as the red, blue, and green coloured boxes, respectively. While the ship was in the Baffin Bay region, it was influenced more by the surrounding open waters. In contrast, the ship was closer to sea-ice or land masses in legs 2 and 3, respectively. Collins et al. (2017) showed that the 5 d backward simulations of surface (<200 m) influence using the FLEXible PARTicle dispersion model (FLEXPART) was primarily confined to the immediate region of the ship, suggesting that regional emissions were important during our study. However, it is difficult to separate the effects of geography and season on the observed differences in the aerosol population since the local conditions in each region (e.g. sea-ice coverage, solar radiation, biological activity, cloud cover, and wind speed) would have affected the observed aerosols.
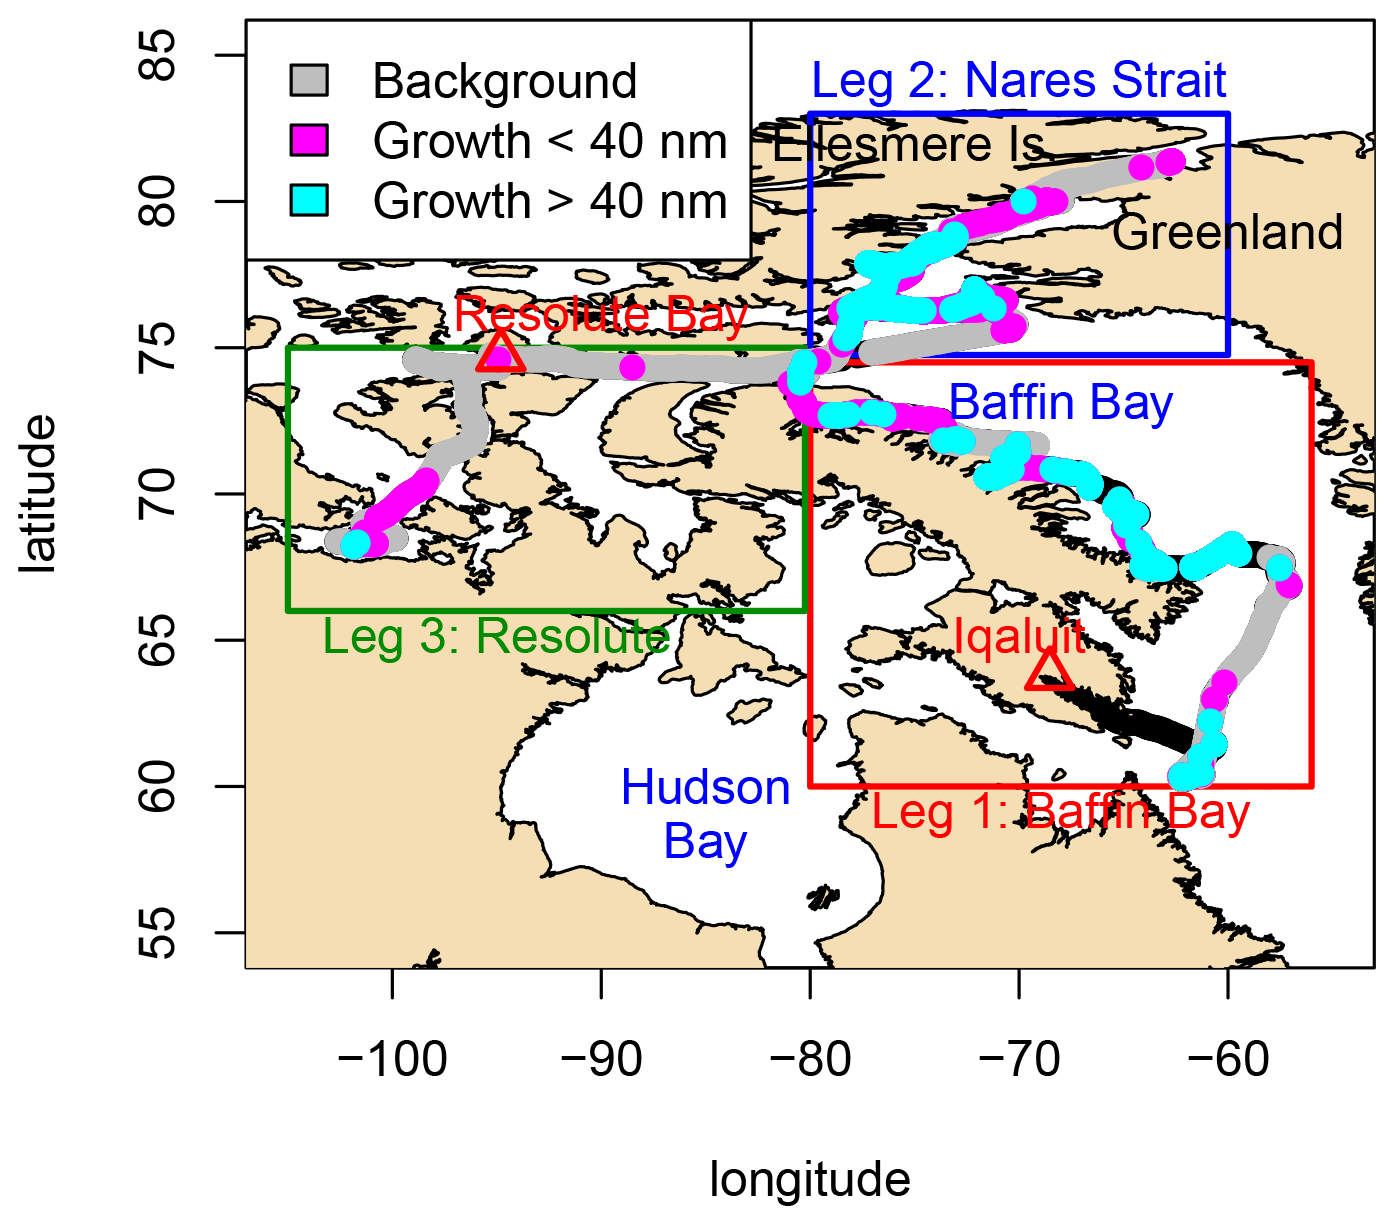
Figure 1Track of the NETCARE ship cruise (black and coloured points). Rectangles show the three legs and red triangles denote communities. The colour of the points shows times used in calculations of background (grey) and growth >40 nm (light blue). Additional times included in the UFP and growth calculations are shown in magenta.
Ambient measurements of CCN concentrations were made with a streamwise thermal gradient CCN counter (CCNC, Droplet Measurement Technologies, CCN-100) (Roberts and Nenes, 2005). Ambient aerosols measured by the CCNC were sampled from an inlet approximately 38 m from the bow on the port side, approximately 9 m above sea level. The CCNC was operated at a total flow rate of 0.5 L min−1 and a sample flow rate of 0.05 L min−1 with an estimated inlet residence time of 1.5 s and particle loss rate of <2 % for the particles that activated in the chamber (>40 nm) (von der Weiden et al., 2009). The temperature gradient of the CCNC was varied such that ambient aerosols were exposed to an SS of 0.17 %, 0.26 %, 0.44 %, 0.63 %, 0.81 %, and 0.99 %, where each SS was maintained for 10 min at a time. The SS of the chamber were calibrated weekly during the observation period with ammonium sulfate aerosols at five SS values between 0.1 % and 1 %, except on 18 August 2016 when it was only calibrated at 0.44 % and 0.99 % SS. The SS was stable throughout the 4 weeks of observations, although the plateau of the calibration curves decreased throughout the study. This could be interpreted as a reduction in the counting efficiency of the CCNC, although after extensive analysis, we believe it is more likely due to issues with the calibration system. As such, we assume that the ambient CCN concentrations were correct, and the analysis in this study used the values directly reported by the CCNC without accounting for any additional particle loss or counting efficiency corrections.
A scanning mobility particle sizer (SMPS; model 3080, 3787, TSI Inc.) measured the number size distributions of aerosol between the diameter range of 10 and 430 nm, with a time resolution of 5 min, and sample and sheath flow rates of 0.6 and 6 L min−1, respectively. This instrument was in the foredeck container, approximately 31 m from the CCNC. Further details on the SMPS sampling methods, data accuracy, and data filtering techniques for ship pollution are presented by Collins et al. (2017). The results presented in this study use observations from 23 July to 23 August 2016 when measurements from both instruments were available and are presented in universal co-ordinated time (UTC).
2.2 CCN data analysis
The first 30 s of CCN data at every SS were excluded because the chamber temperatures require time to stabilize when changing to a new SS. Only values with the temperature stabilized flag, as reported by the CCNC, were used in this analysis. Additionally, the sample times that were previously identified to be contaminated by Collins et al. (2017) were excluded from the CCNC data. It has been reported that the total uncertainty in the estimated CCN concentration above 100 cm−3 varies between 7 % and 16 % due to factors such as temperature, pressure, flow, etc. (Moore et al., 2011). One second CCN concentrations were matched to the 5 min SMPS sample times and the median concentrations calculated. The median was used to avoid the influence of outliers that may have remained after filtering and are, on average, only 1.2 % lower than mean concentrations. Of the 2061 concurrent SMPS and CCN observations, 69 were excluded due to high variability (standard deviation to median ratio was greater than 0.5) or the concentrations exceeded 2000 cm−3.
2.3 κ calculations
The hygroscopicity parameter (κ) was calculated using the aerosol size distribution, CCN concentrations, and κ-Köhler theory (Petters and Kreidenweis, 2007):
where , Mw and ρw are the molar mass and density of water, respectively, while R and T are the ideal gas constant and the absolute temperature, respectively. Da is the activation diameter and represents the diameter above which particles are large enough to activate as CCN at the saturation ratio set in the CCNC ( %). Da was determined by integrating aerosol size distributions downwards from the largest size bin until the cumulative particle number concentration was equal to the corresponding CCN concentration. The size bin at which this occurred was the Da. This method has been previously used in studies where it is not possible to size select the particles before they are counted by the CCNC (e.g. Collins et al., 2013; Gao et al., 2020). Critical assumptions in this approach are that the particles are uniform in composition at a given size and that all the particles larger than Da activate. These assumptions are unlikely to significantly affect our calculations because the summer Arctic aerosol typically originates from local sources, reducing the likelihood of a separate mode with different properties transported from afar. In addition, although primary emissions from Arctic sources, such as sea spray or dust, could potentially contribute to the aerosol being externally mixed, these particles would be expected to be present at larger sizes and not affect the calculation of Da.
It is possible that the more volatile fractions of the ambient aerosol could have evaporated in the inlet line or in the CCNC. The room temperature was approximately 4–6 K warmer than the outside air temperature, the top of the CCNC's chamber was approximately 2–3 K warmer than the inlet temperature, and the bottom of the chamber was up to 20 K warmer than the inlet temperature, although a significant amount of aerosol liquid water would have been present by that point. The effect of a 20 K warming has been observed to reduce the CCN activity of laboratory-generated secondary organic aerosol (SOA), suggesting that the volatile fraction can be more hygroscopic (Asa-Awuku et al., 2009). On the other hand, the most volatile fraction of ambient SOA has been observed to be less oxidized (Huffman et al., 2009), which we would expect to be less hygroscopic (Massoli et al., 2010; Lambe et al., 2011; Chang et al., 2010). More recent results of CCN measurements behind a thermal denuder inferred that the κ value for ambient organics at an urban site increased with heating of 20 K (Mei et al., 2021) suggesting that the volatile fraction was less hygroscopic. Overall, it seems that the effect of heating on aerosol hygroscopicity depends on the specific nature of the organic aerosol present, and it is unclear whether the hygroscopicity estimated in our study is potentially over- or under-estimated. As such, no corrections were applied for this warming, although it should be considered when interpreting our results.
2.4 Defining growth and background times
To determine the overall contribution of growing UFP on the CCN concentrations throughout this study, UFP and/or growth times were defined as times when the total number concentrations from the SMPS (NT)>500 cm−3 and Dmax≤100 nm (magenta and light blue points in Fig. 1), where Dmax is the statistical mode diameter in the size distribution (i.e. the diameter that had the maximum normalized concentration). An additional period when NT>500 cm−3 and 40 nm nm was defined as growth >40 nm (light blue points in Fig. 1) to examine CCN concentrations when the particles had grown larger than 40 nm but remained smaller than 100 nm. Both of these periods were compared with periods when minimal contributions from UFP and growth were expected. These background periods were defined as times when NT≤500 cm−3 (grey points in Fig. 1). To retain clarity, periods when NT>500 cm−3 and Dmax≤40 nm (magenta points in Fig. 1) will be referred to as “growth <40 nm” in the legends, although these events do not always show growth and are not considered separately. The concentration limit of 500 cm−3 was determined by considering various statistical values including the median NT over the entire study (472 cm−3) and the 95th percentile of NT when Dmax>100 nm (484 cm−3).
3.1 General overview
The aerosol size distributions measured by the SMPS throughout the study and Dmax are shown in Fig. 2a, and the CCN concentrations and NT are shown in Fig. 2b. The three legs are denoted by the shaded boxes above panel a. Summary statistics of CCN concentrations for the entire study and each leg are shown in Table 1. As seen in Fig. 2a, the study was characterized by frequent UFP and growth events, which caused NT to vary by three orders of magnitude. These events were especially prevalent in the first part of the study when the ship was in the warmer and more biologically active waters of Baffin Bay and persisted into the southern portion of Nares Strait into Kane Basin of the second leg. The most northern extent of the cruise occurred on 13 August, where the ship encountered sea-ice and very few UFP were observed. Only one UFP and/or growth event was observed during the last leg of the study where the waters were ice free, shallower, and less saline. It is possible that the local conditions were less favourable for the formation of UFP, although it should be noted that this period was much shorter than the other legs (6 d compared with 12–13 d). Collins et al. (2017) identified 14 UFP and growth events during this cruise which accounted for 41 % of the sample times. However, particles smaller than 100 nm dominated the SMPS number size distribution for 92 % of the study, suggesting that most of the aerosol particles observed throughout the study had undergone secondary formation processes such as condensational growth. As such, even if particles were not actively growing at a given time, their CCN activity and inferred chemical composition could still provide insight into the vapours that contributed to particle growth. In addition, any externally mixed aerosol that existed before these growth events would become more similar in composition due to condensational growth, thus reducing errors associated with the assumptions used to calculate κ using Eq. (1).
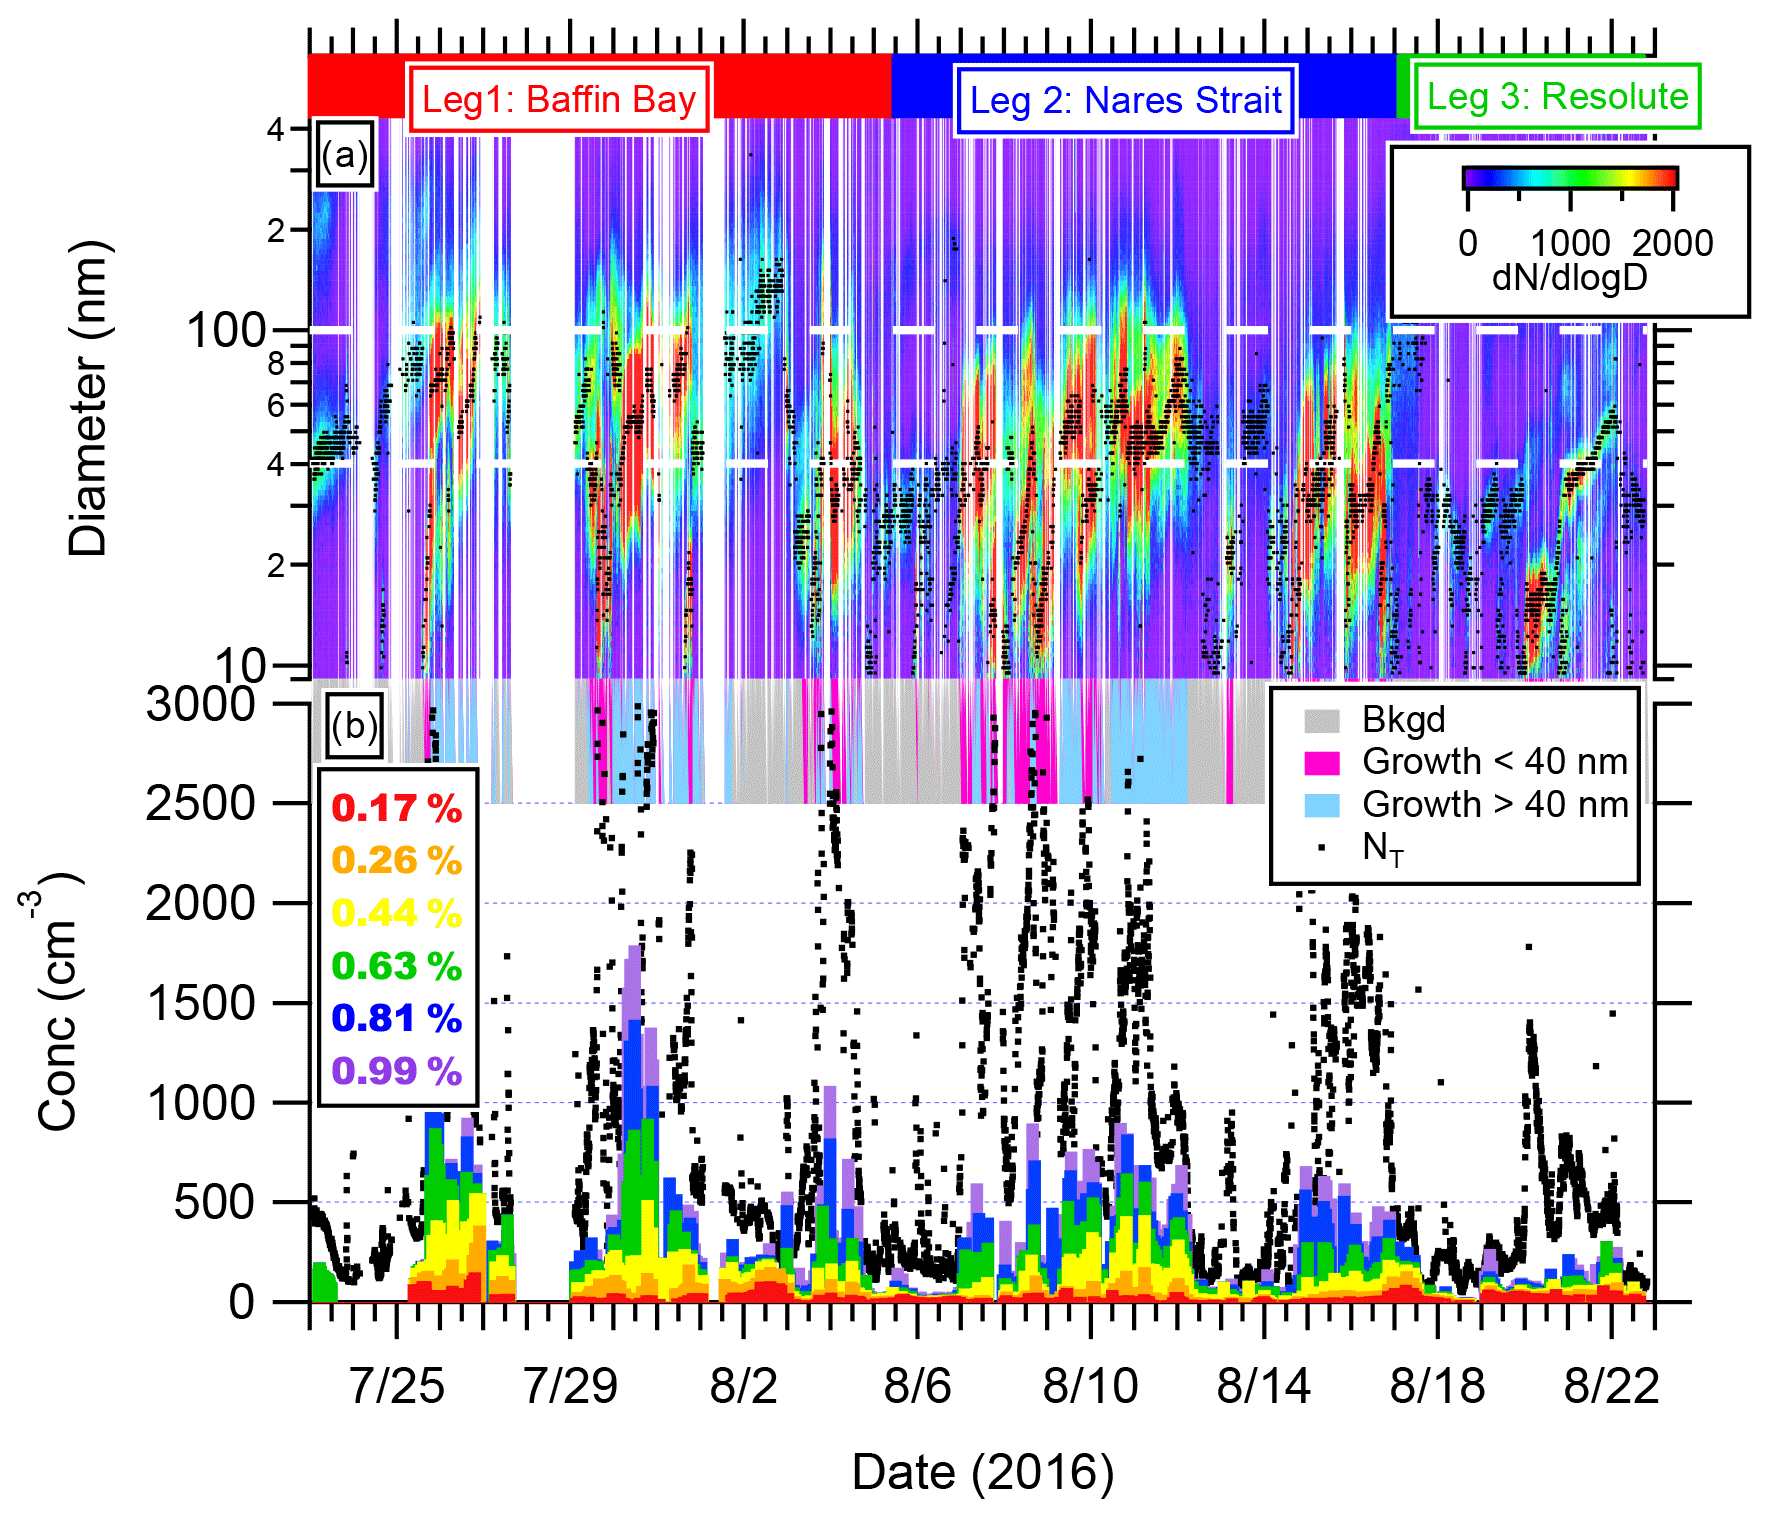
Figure 2Time series in UTC of (a) aerosol number size distribution and Dmax (black points), and (b) NT (black points) and CCN concentrations. Dashed white horizontal lines show particle diameters of 40 and 100 nm. Times used in calculations of background, growth >40 nm and growth <40 nm are shown in grey, light blue, and magenta, respectively.
Table 1Summary of CCN concentrations and associated calculations, given as median (25th–75th percentile).
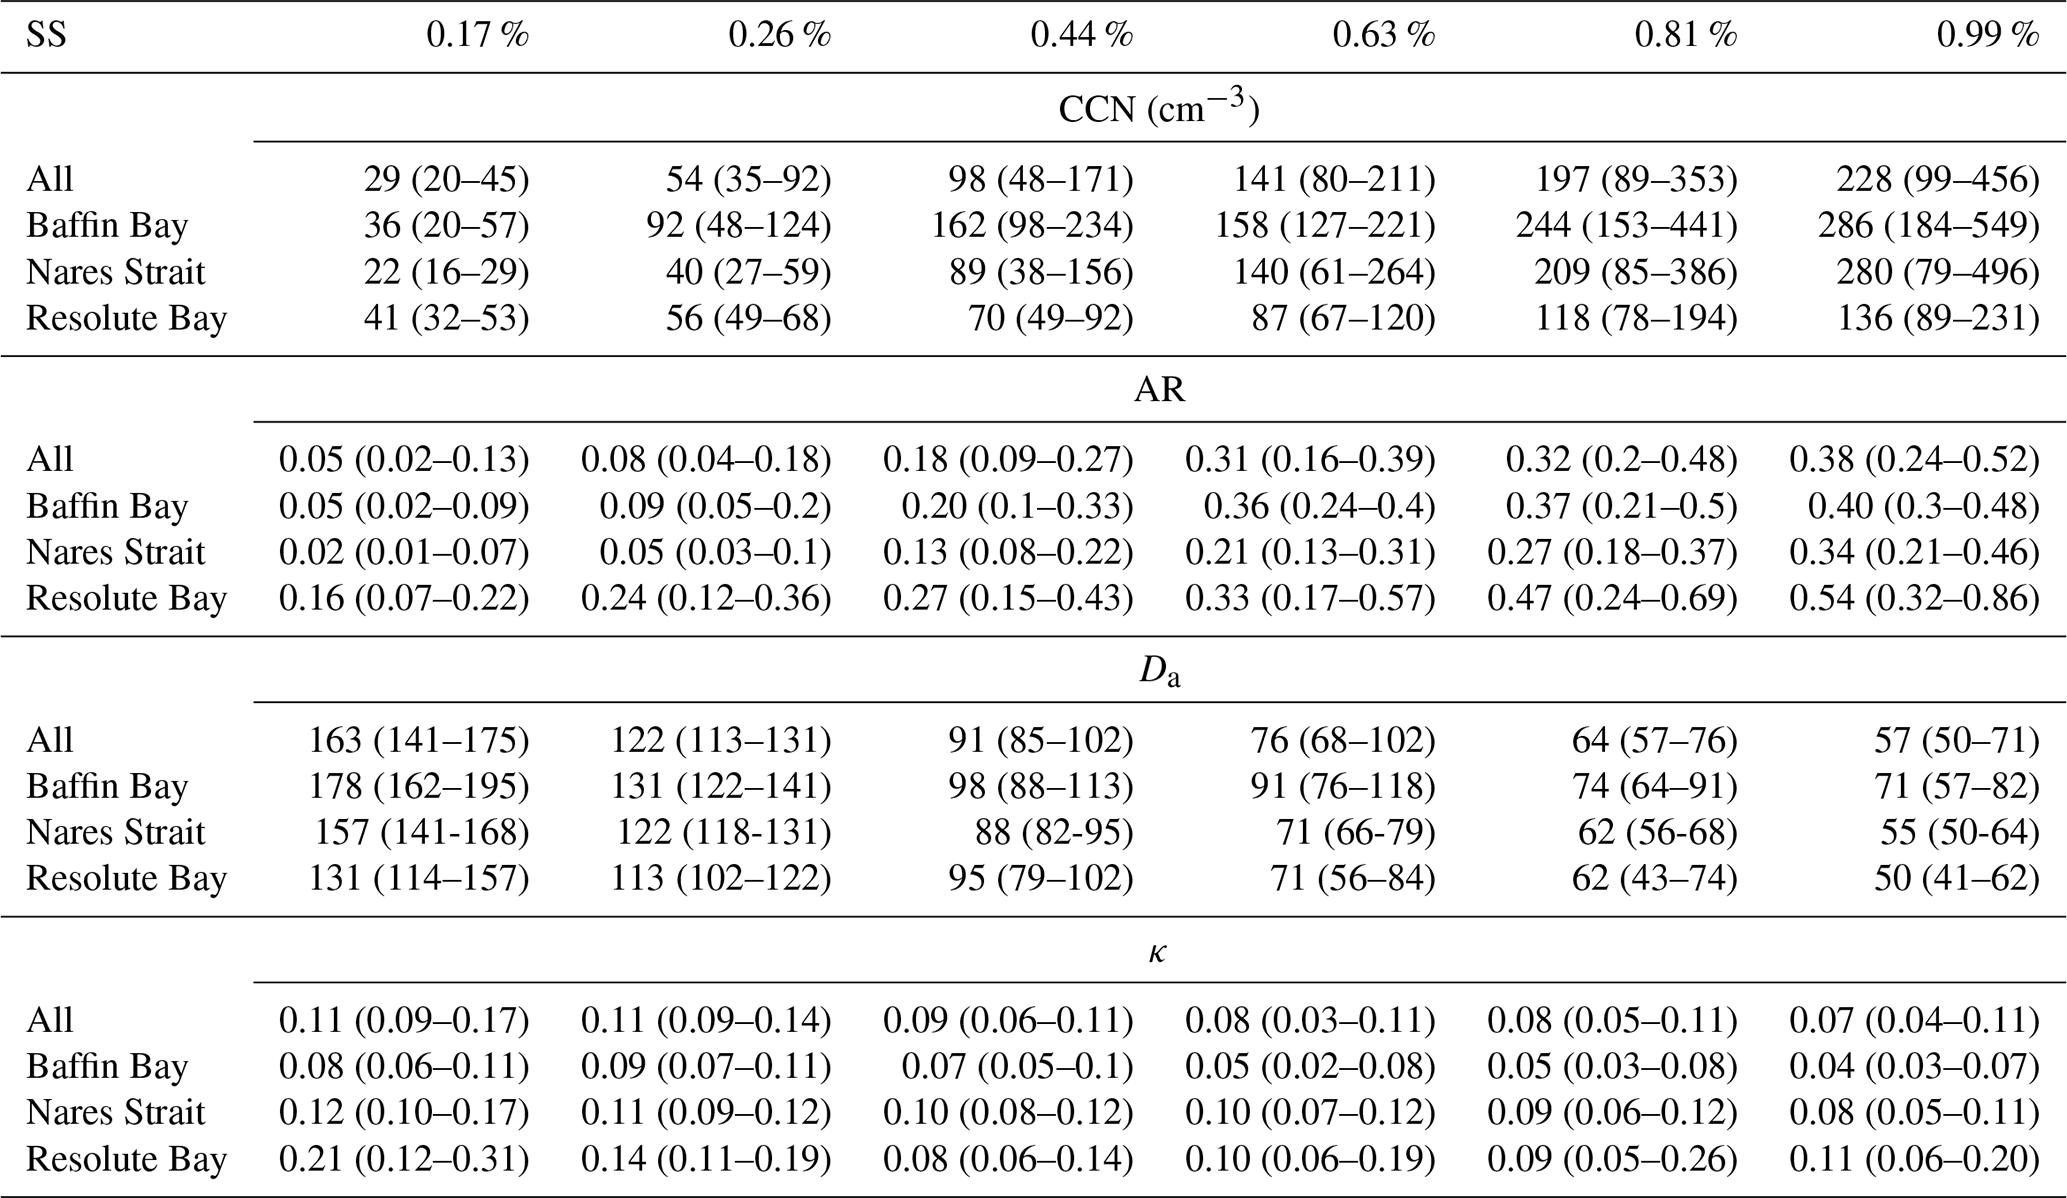
The CCN concentrations at the higher SS usually varied according to NT, showing evidence that UFP and growth can lead to increased CCN concentrations. However, the median activation ratio (AR), defined as the ratio of CCN concentration to NT, was only 0.38 at the highest SS of 0.99 %, suggesting that most of the particles larger than 10 nm were either too small and/or non-hygroscopic to activate. These low AR are consistent with observations from Ny Alesund (Jung et al., 2018), where summer AR of 0.4 for particles between 10 and 561 nm were reported, as well as other Arctic sites with a similar lower cut-off for NT (Table 2). Overall, these low AR values reflect the prevalence of particles smaller than 40 nm, especially in the Baffin Bay and Nares Strait regions. The AR increased during the third leg where the waters were ice free, shallower, and less saline when only one UFP and/or growth event occurred.
Over the entire study, the median and interquartile range of CCN concentrations increased with increasing SS (see Table 1), with a median CCN concentration of 29 cm−3 at SS of 0.17 % compared with 98 and 228 cm−3 at 0.44 % and 0.99 %, respectively. To put our observations into a global perspective, CCN and NT concentrations observed at a select number of polar and remote sites are shown in Table 2. This list is by no means exhaustive but shows that overall, our CCN concentrations are generally higher than other Arctic observations at Ny Alesund (Jung et al., 2018) and the central Arctic Ocean (Martin et al., 2011). A notable exception is the aircraft observations over the Canadian Arctic Archipelago in 2008 which were influenced by biomass burning and transport of industrial emissions and resulted in higher aerosol concentrations (Lathem et al., 2013). Our observations are closer to those reported for a sub-arctic Canadian site in the spring (Herenz et al., 2018) and Antarctica (Herenz et al., 2019; Yu and Luo, 2010). In addition, our observations are lower than measurements from high altitude locations at lower latitudes (Gogoi et al., 2015; Jurányi et al., 2010).
Jung et al. (2018)Martin et al. (2011)Lathem et al. (2013)Herenz et al. (2018)Herenz et al. (2019)Yu and Luo (2010)Gogoi et al. (2015)Jurányi et al. (2010)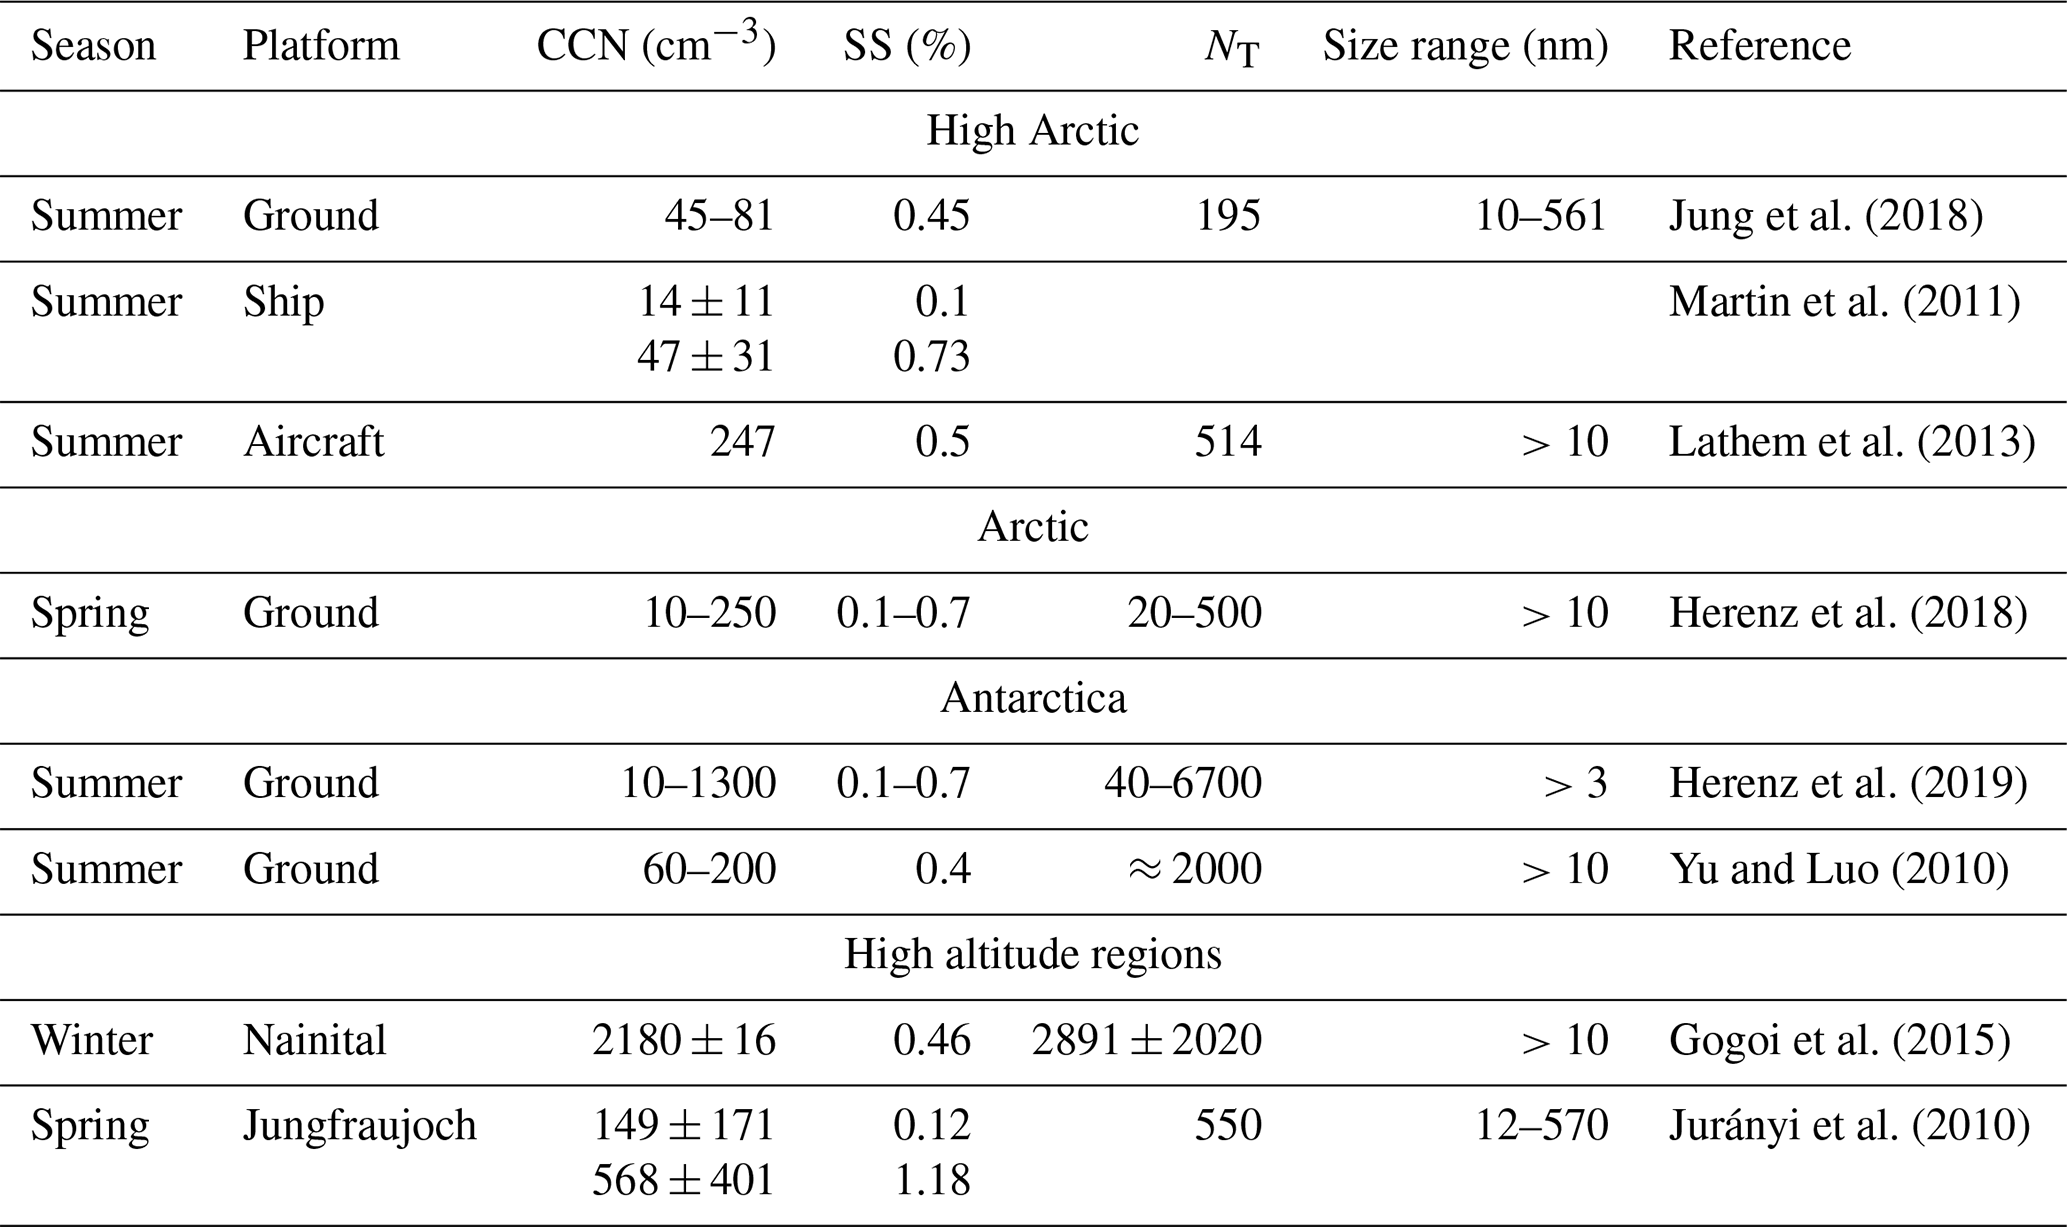
Calculated κ values and summary statistics are also presented in Table 1. Overall, the values were very low, with medians for the entire study ranging from 0.07 to 0.11 over the six SS. Values were highest at the lowest SS (0.08–0.21), suggesting that the larger particles were more hygroscopic, which is consistent with more processing in the larger aerosols or a different source resulting in a higher hygroscopicity, such as sea spray. The values also increased throughout the study, with the lowest values (0.04–0.08) corresponding to the first part of the study when the ship was in the more southerly, warmer, and open waters of Baffin Bay where more UFP and growth events were observed, and the highest values (0.18–0.21) corresponding to the shallower and more coastal waters during leg 3 when only one UFP and growth event occurred. Based on our observations, it is unclear whether the increase in hygroscopicity driven by a reduction in UFP and growth events was caused by changes in emissions in the different regions such as more land influence in the Resolute leg, or whether it was due to the fact that we sampled in this region 2 weeks later when the biological activity had changed. It should be noted that the 2014 NETCARE cruise in the Queen Maud Gulf region west of Resolute Bay did not observe any UFP events in early August (Collins et al., 2017), while Chang et al. (2011) reported one UFP and growth event in late August in 2008 in the same region. Overall, this suggests that local environmental conditions are the main driver of aerosol sources and therefore hygroscopicity. The κ values calculated from this study are consistent with the NETCARE aircraft observations for one NPF event (0.1) (Willis et al., 2016; Burkart et al., 2017) as well as other mobile platforms over Arctic waters near Svalbard during four NPF and growth events (0.13 for 20 nm particles) (Kecorius et al., 2019) and from air influenced by the Beaufort and Chukchi seas (0.08) and the Pacific Ocean (0.03) (calculated from Park et al., 2020). However, the observed particles appear less hygroscopic than those observed in the central Arctic Ocean (0.33±0.11) (Martin et al., 2011), as well as from land-based sites in spring at Tuktoyaktuk, Canada (0.23) (Herenz et al., 2018), non-anthropogenically influenced particles at the VRS site in northeast Greenland (0.25–0.4) (Lange et al., 2019), and from Zeppelin (0.3–0.46) (Jung et al., 2018; Zábori et al., 2015). The lower values determined from the mobile platforms likely reflect the more recently condensed vapours during individual growth events, whereas the land-based sites generally reported values averaged over several months, causing them to be less sensitive to distinct UFP and growth events.
Based on the median calculated κ values from the entire study, we infer that >80 % of the aerosol volume fraction was composed of a non-hygroscopic to slightly hygroscopic component, which we interpret as being organic. Previous modelling results have shown that the air sampled during our study was influenced by source regions within the Arctic circle which is mostly marine (Collins et al., 2017; Burkart et al., 2017), suggesting that these slightly hygroscopic aerosols were influenced by the water. Other recent studies in the Canadian Arctic have inferred that VOCs are emitted from the ocean (Mungall et al., 2017), that the source of secondary aerosol mass for UFP and growth are driven by marine biological influences (Collins et al., 2017; Willis et al., 2017), that particles <100 nm during growth events are almost entirely organic and influenced by open waters (Tremblay et al., 2019; Willis et al., 2016), and that including a significant source of Arctic marine SOA could explain the frequently observed NPF and growth events (Croft et al., 2019). Finally, the reported values are consistent with the κ value reported for pure SOA inferred from ambient observations at continental sites (e.g. Sihto et al., 2011; Gunthe et al., 2009). Together, these results suggest that the condensing material contributing to particle growth is slightly hygroscopic and likely organic, originating from marine biological sources.
3.2 Influence of particle growth on CCN
To further explore the potential role of UFP and growth on climate, CCN concentrations and Da were examined for specific events when UFP and growth were observed. Figure 3 shows a period when particles smaller than 20 nm appeared on several occasions and then grew to Dmax of 40–60 nm, with the larger tail of the mode sometimes growing as large as 100 nm (upper dashed white line in panel a). Since the Da at 0.99 % remained between 45 and 70 nm (purple triangles in panel a), CCN concentrations remained low during the two UFP and growth events on 8 August, even as total concentrations exceeded 2000 cm−3, because the majority of the particles were too small and/or non-hygroscopic to activate. However, as the particle Dmax grew larger than 40 nm after 9 August 08:00 UTC (light blue shading in panel b), CCN concentrations noticeably increased at all SS >0.44 %, suggesting that these growing particles became sufficiently large to activate. The κ values determined during this period mostly remained between 0.05 and 0.18 at all SS, suggesting that the hygroscopicity, and therefore chemical composition, was similar across the size range of the Da determined at all SS (40–180 nm, pink circles and purple triangles in panel a). Similar results are seen in Fig. 4 which shows three UFP and growth events between 29 July and 5 August. The CCN concentrations most obviously increased after 30 July 00:00 UTC when Dmax exceeded 40 nm (light blue shading), and did not increase when bursts of smaller particles appeared at 31 July 18:00 UTC and 3 August 08:00 UTC (magenta shading).
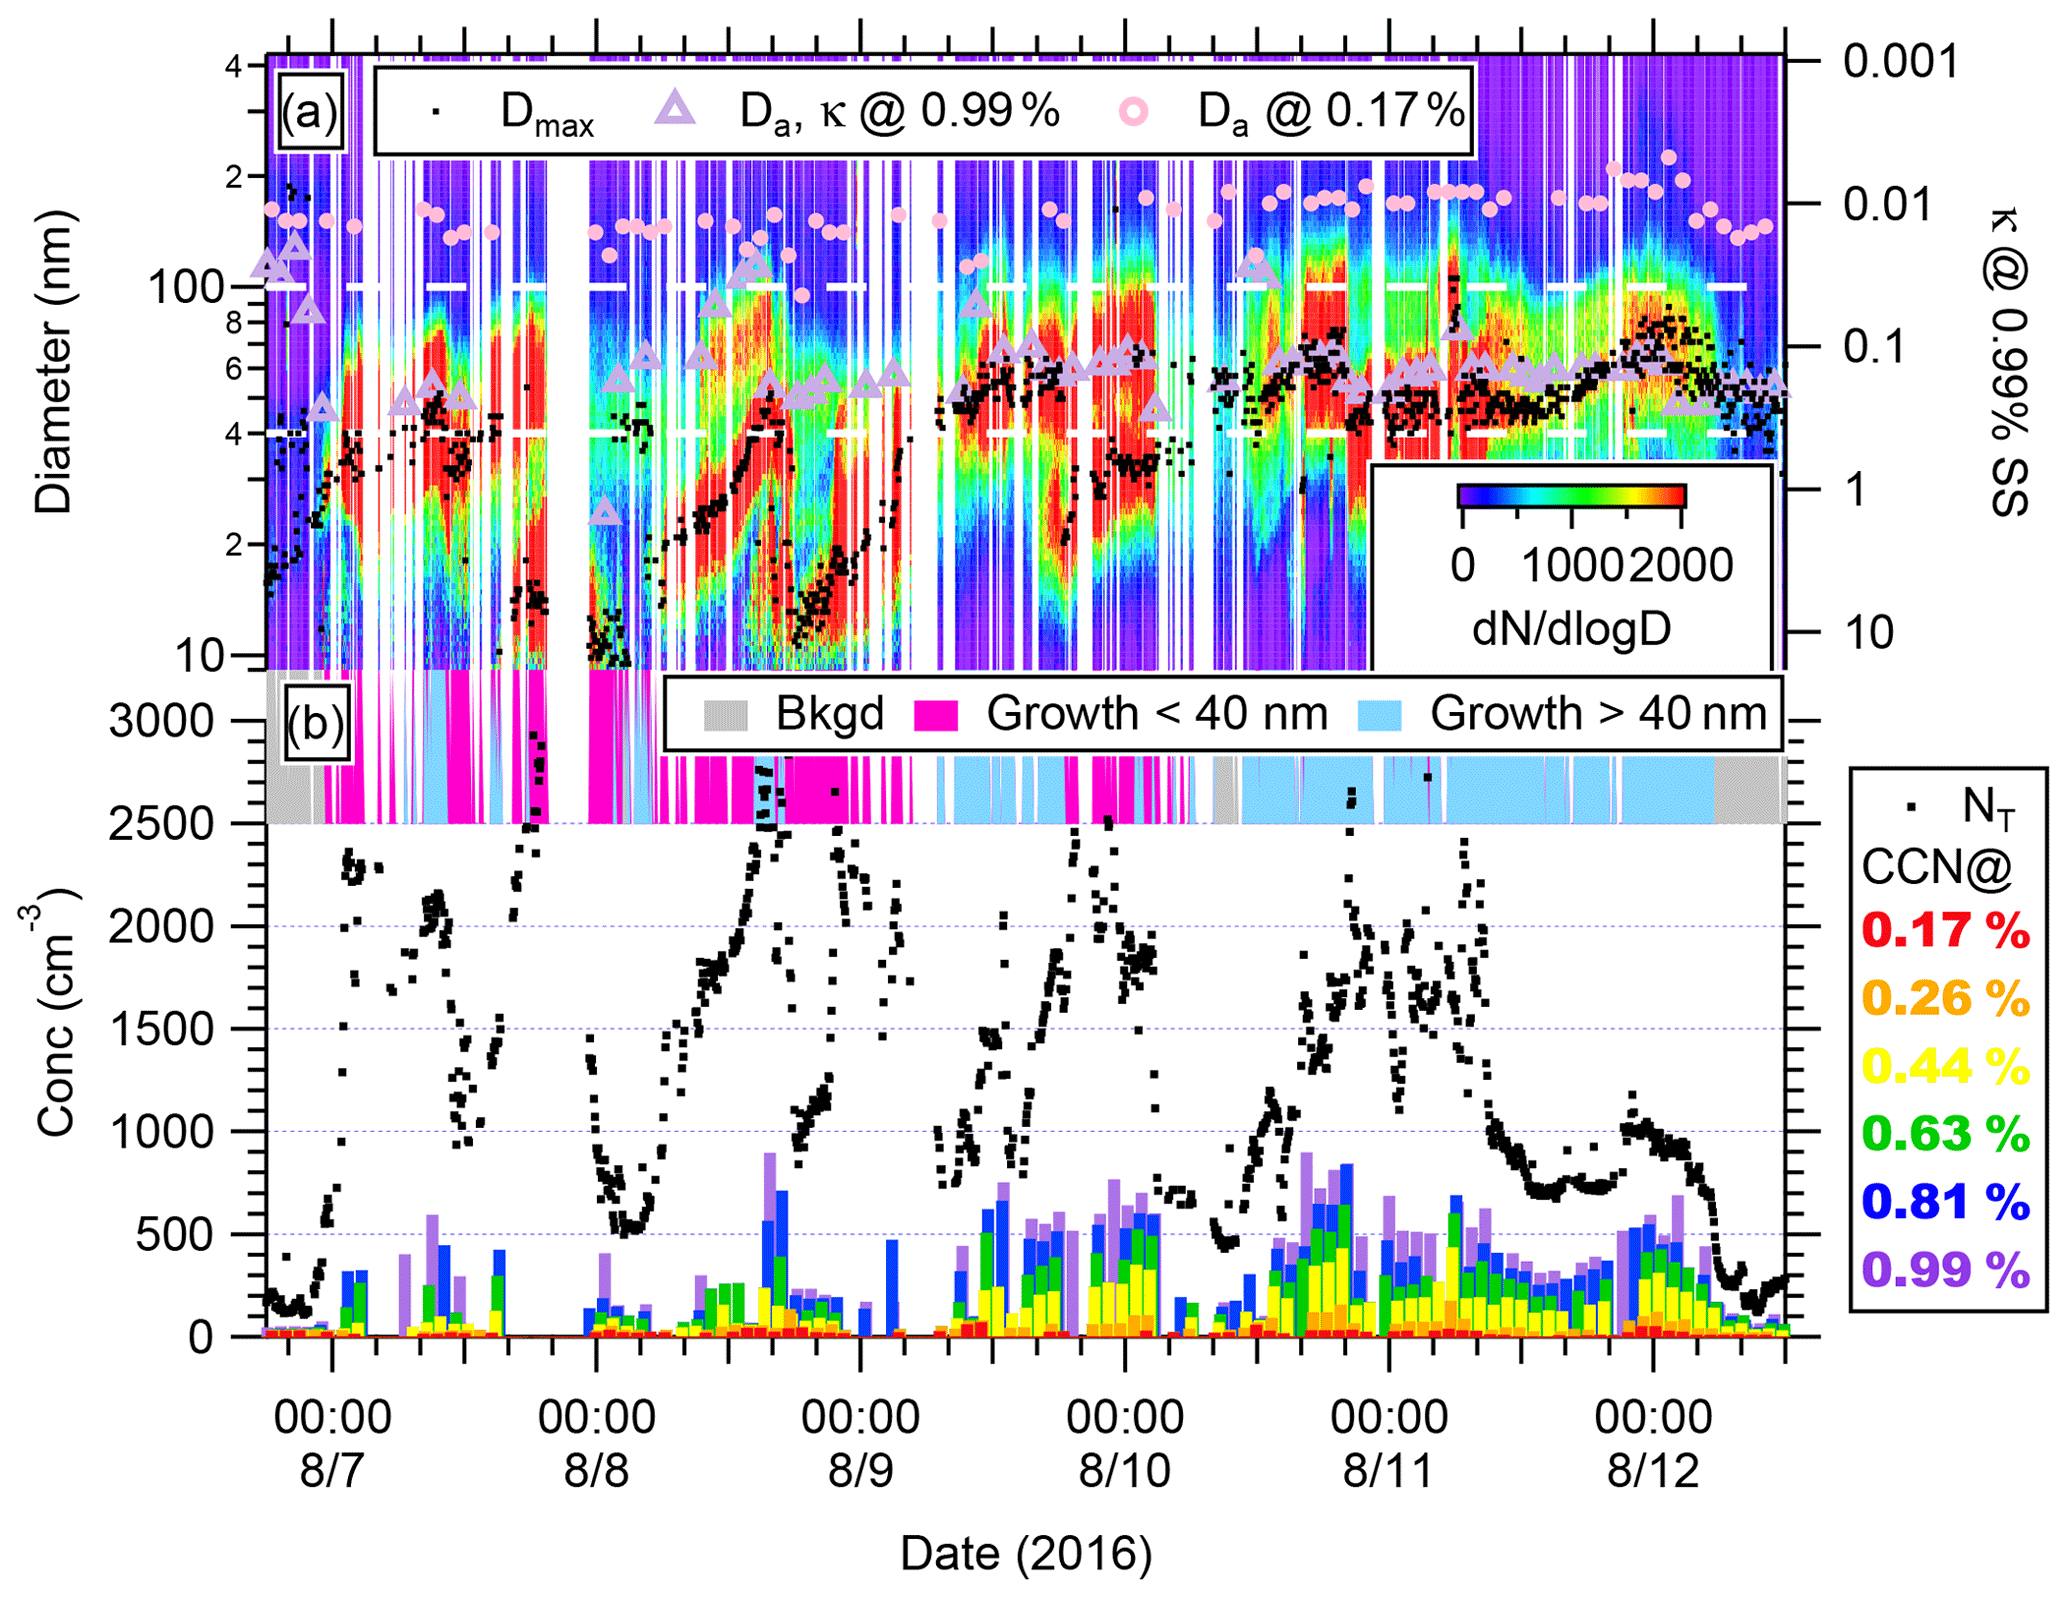
Figure 3As in Fig. 2 but for 7–12 August 2016. Da calculated at 0.17 % and 0.99 % SS are included in panel (a) as well as the corresponding κ values calculated for Da at 0.99 % SS.

Figure 4As in Fig. 2 but for 29 July–05 August 2016. Da calculated at 0.17 % and 0.99 % SS are included in panel (a) as well as the corresponding κ values calculated for Da at 0.99 % SS.
To determine the overall contribution of growing UFP on the CCN concentrations throughout this study, Fig. 5 shows the increase in the mean CCN concentration at each SS during all UFP and/or growth times (i.e. growth <40 nm and growth >40 nm) compared with background times (dashed purple line) as well as the increase during only growth >40 nm times compared with background times (light blue line). The whiskers in Fig. 5 denote the 95 % confidence interval calculated as 1.96 times the standard errors of the two means summed in quadrature. During all UFP and/or growth times, the CCN concentrations increased by 13–161 cm−3 at an SS of 0.26 %–0.99 %, corresponding to a 22 %–167 % increase in concentration compared with background, demonstrating that particles formed from UFP and growth events in the Canadian Arctic can contribute to CDNC at a very modest SS of 0.26 %. This effect is even more pronounced if only growth >40 nm times are considered, when CCN concentrations increased by 25–425 cm−3 at SS of 0.26 %–0.99 %, corresponding to a 43 %–259 % increase in concentration compared with background periods. These values are statistically significant (p<0.05) when tested with a Mann–Whitney test (wilcox.test function, R version 4.0.3). Because only one UFP event was observed in the last leg of the study when the ship was in the Lancaster Sound and Queen Maud Gulf, these results are only representative of the Baffin Bay and Nares Strait periods of the study. Our findings are consistent with observations on northeast Greenland where CCN concentrations were reported to increase by 42–95 cm−3 at an SS of 0.3 % and 85–150 cm−3 at a higher SS during the nascent and bimodal clusters, which were characterized by NPF (Lange et al., 2019). Our findings also support NETCARE aircraft studies performed during the summer of 2014 where CCN concentrations increased by ≈100 cm−3 at an SS of 0.6 % for one growth event (Willis et al., 2016) and particles as small as 30 nm, presumably formed recently, were inferred to have activated at an SS of 0.3 % in clouds (Leaitch et al., 2016). Similarly, particles as small as 30–50 nm were inferred to activate when aerosol concentrations were less than 30 cm−3 at the mountain site Zeppelin on Svalbard (Koike et al., 2019). Together, these studies suggest that small particles, influenced by condensational growth, can affect cloud radiative properties by contributing to CDNC.
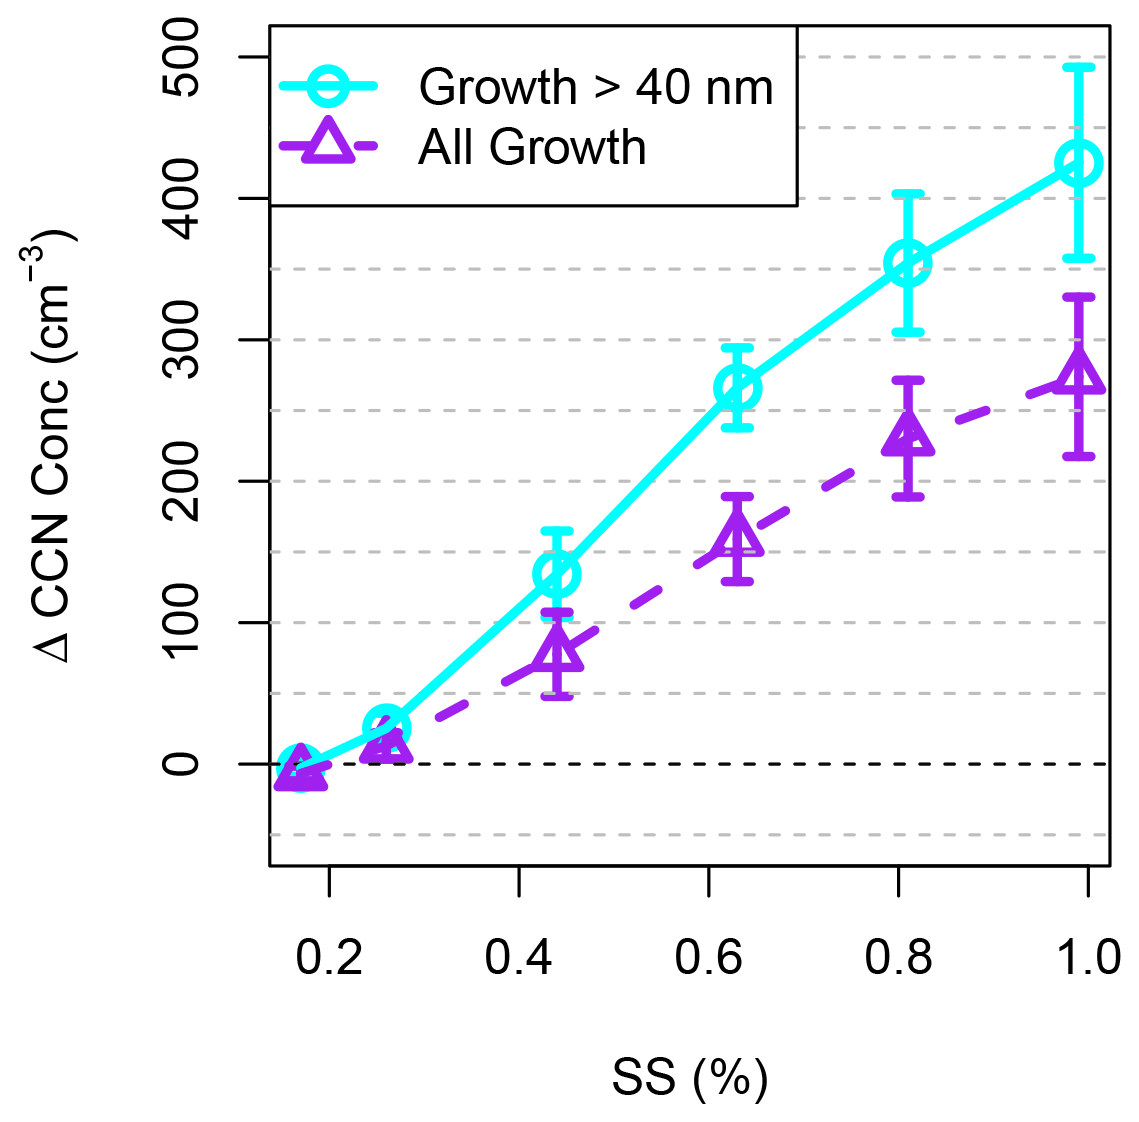
Figure 5The increase in CCN concentration during growth >40 nm (cyan) and all growth (purple) times compared with background times at different SS. The error bars show the 95 % confidence interval.
3.3 Twomey parameterization
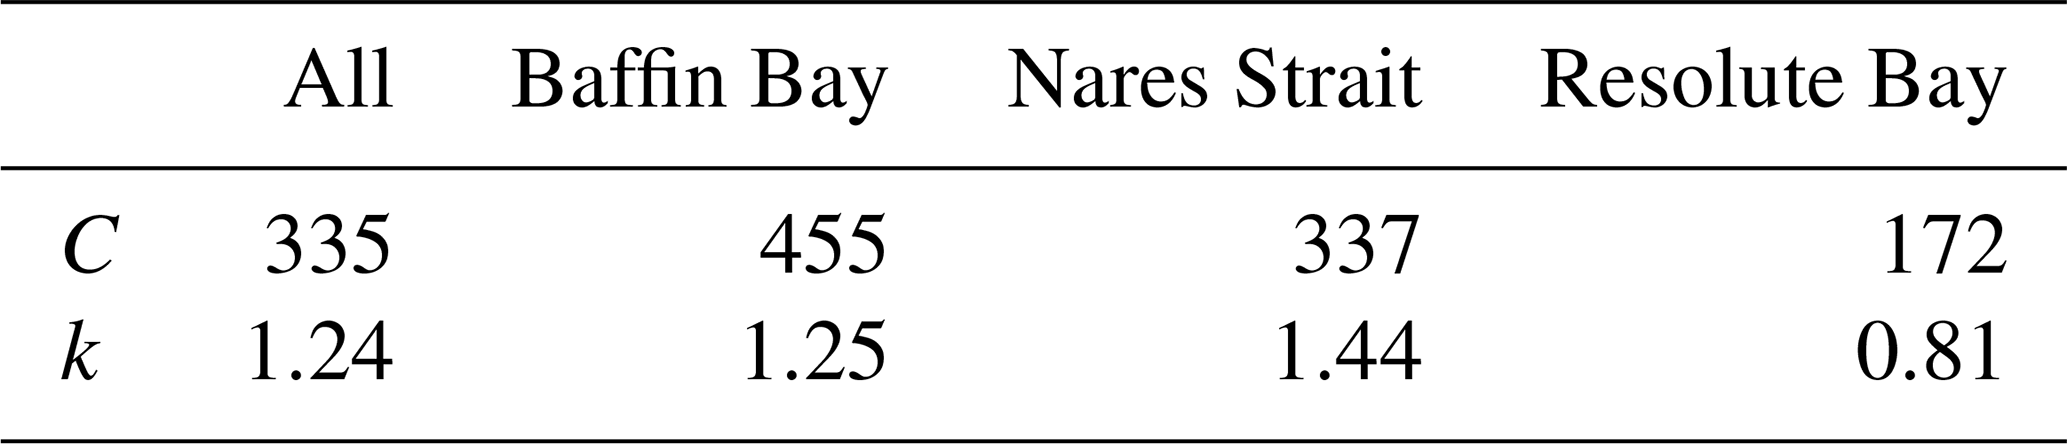
Figure 6 shows the mean CCN concentrations at each SS for the full study period (solid black circles) and the three regions considered in the study. The lines in Fig. 6 represent the best fit of the empirical Twomey parameterization often used in models to relate CCN to SS using
where C represents the CCN concentration at 1 % SS and k is the power law exponent (Twomey, 1959). The parameters C and k are widely used in cloud microphysical models as they provide information about size and composition of the background aerosol concentration (Seinfeld and Pandis, 1997), although more recent parameterizations have adopted Eq. (2) to include more information about the aerosol microphysical parameters (Khvorostyanov and Curry, 2006). The Twomey parameters calculated for our study are listed in Table 3. The C parameter for the full study period and the Baffin Bay and Nares Strait regions are very similar (between 335 and 455 cm−3), whereas it was much lower (172 cm−3) for the Resolute Bay region, reflecting the overall lower NT during leg 3. With the exception of the last leg, these values are all significantly higher than the 100–140 cm−3 determined for the Zeppelin station at Ny Alesund for July and August (Jung et al., 2018), likely due to the greater aerosol concentrations caused by UFP and growth during our study resulting in more CCN at 1 % SS. Similarly, the maximum k estimated at Ny Alesund was in July, with a value of 0.5606, which is lower than the values estimated for our study, especially the Baffin Bay and Nares Strait regions (1.2–1.4). This can also be attributed to the persistent UFP and/or growth events during our study since a greater number of small particles can activate as CCN at a higher SS. In contrast, the Resolute Bay region, which had less UFP and growth events, had a much lower k of 0.81, showing that the CCN spectrum was less sensitive to changes in SS.
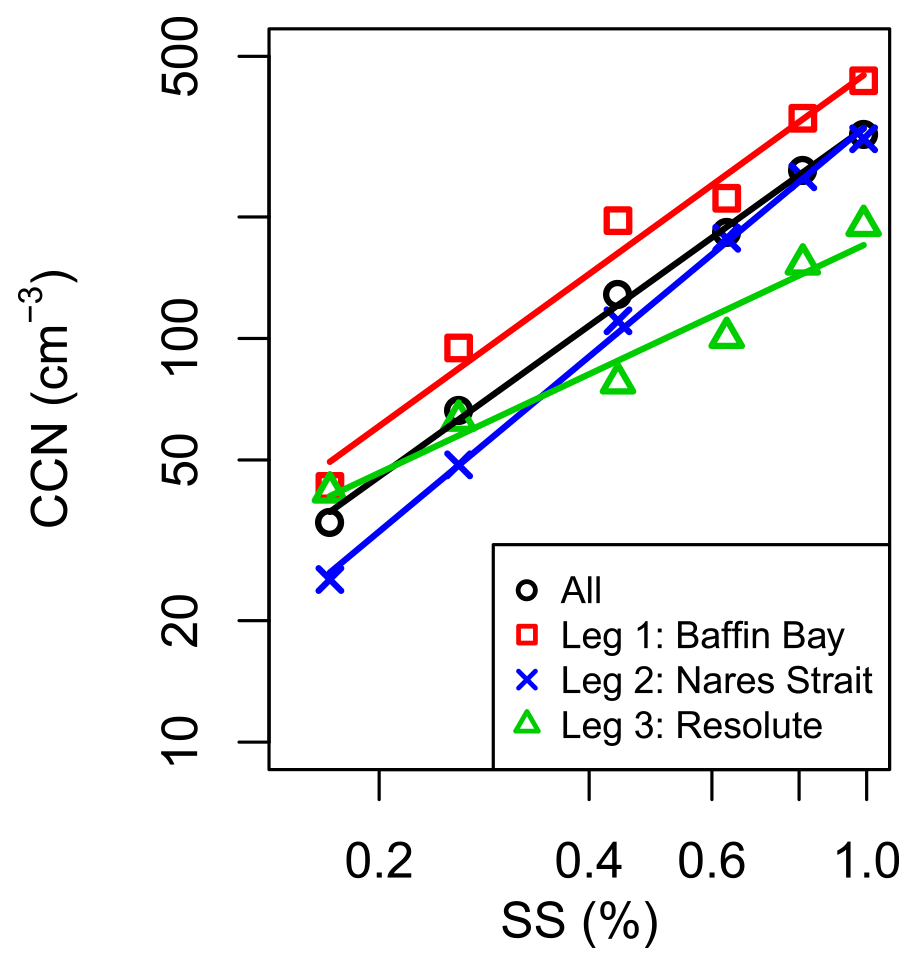
Figure 6Twomey parameterization for the entire study (black) and the three legs (red, blue, and green).
This study reports CCN concentrations measured in the eastern portion of the Canadian Arctic Archipelago during the NETCARE campaign onboard the CCGS Amundsen. The observations reported here took place from 23 July–23 August 2016 when UFP and/or growth events were highly prevalent, with particles smaller than 100 nm dominating the particle number size distribution for 92 % of the study. These UFP and/or growth events resulted in high particle concentrations which were also reflected in increased CCN concentrations, suggesting that the frequently observed small, growing particles have the ability to contribute to CDNC and therefore the radiative budget in the Arctic. The mode diameter of the growing particles generally had to reach 40 nm before the particles became CCN active at 0.99 % SS, although CCN concentrations were shown to have a statistically significant increase of 13 and 78 cm−3 at even a modest SS of 0.26 % and 0.44 % compared with background times, defined as when NT was lower than 500 cm−3. The influence of frequent UFP and/or growth events was also reflected in the Twomey parameterization, which resulted in higher C and k values than previous studies.
The calculated κ values for the observed CCN provide insight on the hygroscopicity of the particles as well as their composition, and thus the source of the condensing vapour that contributed to the observed aerosol growth. Values were low, with a mean of 0.12 (0.06–0.12, 25th–75th percentile) for the entire study over all SS, suggesting that at least 80 % of the volume fraction of the aerosol was non-hygroscopic to slightly hygroscopic, and likely organic. Since the history of the air mass was generally local or regional, the condensing slightly hygroscopic vapours most likely originated from the open waters within the Arctic. These κ values are lower than many other Arctic observations on land, although these other studies reported seasonal means, which likely included more aged aerosols. Our values are more consistent with other observations reported from mobile platforms in open Arctic waters, especially during four UFP and growth events near Svalbard (Kecorius et al., 2019) and one event in the Canadian Arctic (Burkart et al., 2017; Willis et al., 2016), likely reflecting the hygroscopicity of the locally produced condensing vapours before significant chemical ageing could occur.
This work provides an important link between other publications from the Canadian Arctic, especially from the NETCARE study (Willis et al., 2016, 2017; Burkart et al., 2017; Mungall et al., 2017; Collins et al., 2017), by confirming that the numerous particle growth events observed in summer 2016 was indeed driven by slightly hygroscopic vapours that are presumed to be organic. The present study corroborates prior chemical composition measurements of a small number of events (Willis et al., 2016; Tremblay et al., 2019) and expands their spatial and temporal scope, thus demonstrating that the phenomenon of slightly hygroscopic, likely organic vapours condensing on UFPs is likely prevalent throughout the region. The presence of an Arctic marine SOA was a fundamental assumption in the work of Croft et al. (2019) when simulating new particle formation and growth in the Canadian Arctic, and our results support this assumption.
Overall, these results are important because it is the only study besides the work of Kecorius et al. (2019), Burkart et al. (2017), and Willis et al. (2016) to characterize the hygroscopicity of specific UFP and growing particles in Arctic waters. Our study demonstrates that the frequently observed UFP and/or growth in the Canadian Arctic summer increases CCN concentrations by 26 % at a modest SS of 0.44 %, although further work will be needed to determine the ultimate effect on cloud properties and the radiation budget. The chemical composition, as inferred from the hygroscopicity, of the growing particles also provides insight on the source of the condensing vapours and allows us to better understand how changing environmental conditions in the Arctic (e.g. increased temperatures, reduced sea-ice extent, and lower salinities) can alter future aerosol processes, and by extension, the radiation budget.
NETCARE observation data are available at http://crd-data-donnees-rdc.ec.gc.ca/CCCMA/products/NETCARE/ (Abbatt, 2019).
This study was conceived by RYWC and JPDA; the data were collected by RYWC, DBC, and MCB; the data were analyzed by RYWC and JPC; and the manuscript was primarily written by RYWC with contributions from all other authors.
The contact author has declared that neither they nor their co-authors have any competing interests.
Publisher’s note: Copernicus Publications remains neutral with regard to jurisdictional claims in published maps and institutional affiliations.
This article is part of the special issue “NETCARE (Network on Aerosols and Climate: Addressing Key Uncertainties in Remote Canadian Environments) (ACP/AMT/BG inter-journal SI)”. It does not belong to a conference.
The authors thank Tim Papakyriakou as well as Captain Alain Gariépy and the crew of CCGS Amundsen for their assistance throughout the cruise; Greg Evans, Richard Leaitch, Sangeeta Sharma, and Daniel Veber for the use of their equipment for calibration; and Environment and Climate Change Canada, Keith Levesque, and Robert Christensen for logistical support throughout the study.
This research was conducted as a part of Network on Climate and Aerosols: Addressing Key Uncertainties in Remote Canadian Environments (NETCARE), funded by the Climate Change and Atmospheric Research (CCAR) program within the Natural Sciences and Engineering Research Council of Canada (NSERC). Additional research funding was provided through an NSERC Discovery Grant (grant no. 2014-05173) and the Ocean Frontier Institute, through an award from the Canada First Research Excellence Fund.
This paper was edited by Hang Su and reviewed by two anonymous referees.
Abbatt, J.: SMPS data from the NETCARE Amundsen 2016 campaign, Open Data Canada [data set], http://crd-data-donnees-rdc.ec.gc.ca/CCCMA/products/NETCARE/, last access: 13 December 2019. a, b
Allan, J. D., Williams, P. I., Najera, J., Whitehead, J. D., Flynn, M. J., Taylor, J. W., Liu, D., Darbyshire, E., Carpenter, L. J., Chance, R., Andrews, S. J., Hackenberg, S. C., and McFiggans, G.: Iodine observed in new particle formation events in the Arctic atmosphere during ACCACIA, Atmos. Chem. Phys., 15, 5599–5609, https://doi.org/10.5194/acp-15-5599-2015, 2015. a
Asa-Awuku, A., Engelhart, G. J., Lee, B. H., Pandis, S. N., and Nenes, A.: Relating CCN activity, volatility, and droplet growth kinetics of β-caryophyllene secondary organic aerosol, Atmos. Chem. Phys., 9, 795–812, https://doi.org/10.5194/acp-9-795-2009, 2009. a
Baccarini, A., Karlsson, L., Dommen, J., Duplessis, P., Vullers, J., Brooks, I. M., Saiz-Lopez, A., Salter, M., Tjernstrom, M., Baltensperger, U., Zieger, P., and Schmale, J.: Frequent new particle formation over the high Arctic pack ice by enhanced iodine emissions, Nat. Commun., 11, 4924, https://doi.org/10.1038/s41467-020-18551-0, 2020. a, b
Brennan, M. K., Hakim, G. J., and Blanchard-Wrigglesworth, E.: Arctic Sea-Ice Variability During the Instrumental Era, Geophys. Res. Lett., 47, e2019GL086843, https://doi.org/10.1029/2019GL086843, 2020. a
Browse, J., Carslaw, K. S., Arnold, S. R., Pringle, K., and Boucher, O.: The scavenging processes controlling the seasonal cycle in Arctic sulphate and black carbon aerosol, Atmos. Chem. Phys., 12, 6775–6798, https://doi.org/10.5194/acp-12-6775-2012, 2012. a
Bulatovic, I., Igel, A. L., Leck, C., Heintzenberg, J., Riipinen, I., and Ekman, A. M. L.: The importance of Aitken mode aerosol particles for cloud sustenance in the summertime high Arctic – a simulation study supported by observational data, Atmos. Chem. Phys., 21, 3871–3897, https://doi.org/10.5194/acp-21-3871-2021, 2021. a, b
Burkart, J., Hodshire, A. L., Mungall, E. L., Pierce, J. R., Collins, D. B., Ladino, L. A., Lee, A. K. Y., Irish, V., Wentzell, J. J. B., Liggio, J., Papakyriakou, T., Murphy, J., and Abbatt, J.: Organic Condensation and Particle Growth to CCN Sizes in the Summertime Marine Arctic is Driven by Materials More Semivolatile Than at Continental Sites, Geophys. Res. Lett., 44, 10725–10734, https://doi.org/10.1002/2017GL075671, 2017. a, b, c, d, e, f
Chang, R. Y.-W., Slowik, J. G., Shantz, N. C., Vlasenko, A., Liggio, J., Sjostedt, S. J., Leaitch, W. R., and Abbatt, J. P. D.: The hygroscopicity parameter (κ) of ambient organic aerosol at a field site subject to biogenic and anthropogenic influences: relationship to degree of aerosol oxidation, Atmos. Chem. Phys., 10, 5047–5064, https://doi.org/10.5194/acp-10-5047-2010, 2010. a
Chang, R. Y.-W., Sjostedt, S. J., Pierce, J. R., Papakyriakou, T. N., Scarratt, M. G., Michaud, S., Levasseur, M., Leaitch, W. R., and Abbatt, J. P. D.: Relating atmospheric and oceanic DMS levels to particle nucleation events in the Canadian Arctic, J. Geophys. Res.-Atmos., 116, D00S03, https://doi.org/10.1029/2011JD015926, 2011. a, b
Collins, D. B., Ault, A. P., Moffet, R. C., Ruppel, M. J., Cuadra-Rodriguez, L. A., Guasco, T. L., Corrigan, C. E., Pedler, B. E., Azam, F., Aluwihare, L. I., Bertram, T. H., Roberts, G. C., Grassian, V. H., and Prather, K. A.: Impact of marine biogeochemistry on the chemical mixing state and cloud forming ability of nascent sea spray aerosol, J. Geophys. Res.-Atmos., 118, 8553–8565, https://doi.org/10.1002/jgrd.50598, 2013. a
Collins, D. B., Burkart, J., Chang, R. Y.-W., Lizotte, M., Boivin-Rioux, A., Blais, M., Mungall, E. L., Boyer, M., Irish, V. E., Massé, G., Kunkel, D., Tremblay, J.-É., Papakyriakou, T., Bertram, A. K., Bozem, H., Gosselin, M., Levasseur, M., and Abbatt, J. P. D.: Frequent ultrafine particle formation and growth in Canadian Arctic marine and coastal environments, Atmos. Chem. Phys., 17, 13119–13138, https://doi.org/10.5194/acp-17-13119-2017, 2017. a, b, c, d, e, f, g, h
Croft, B., Martin, R. V., Leaitch, W. R., Tunved, P., Breider, T. J., D'Andrea, S. D., and Pierce, J. R.: Processes controlling the annual cycle of Arctic aerosol number and size distributions, Atmos. Chem. Phys., 16, 3665–3682, https://doi.org/10.5194/acp-16-3665-2016, 2016a. a
Croft, B., Wentworth, G. R., Martin, R. V., Leaitch, W. R., Murphy, J. G., Murphy, B. N., Kodros, J. K., Abbatt, J. P. D., and Pierce, J. R.: Contribution of Arctic seabird-colony ammonia to atmospheric particles and cloud-albedo radiative effect, Nat. Commun., 7, 13444, https://doi.org/10.1038/ncomms13444, 2016b. a
Croft, B., Martin, R. V., Leaitch, W. R., Burkart, J., Chang, R. Y.-W., Collins, D. B., Hayes, P. L., Hodshire, A. L., Huang, L., Kodros, J. K., Moravek, A., Mungall, E. L., Murphy, J. G., Sharma, S., Tremblay, S., Wentworth, G. R., Willis, M. D., Abbatt, J. P. D., and Pierce, J. R.: Arctic marine secondary organic aerosol contributes significantly to summertime particle size distributions in the Canadian Arctic Archipelago, Atmos. Chem. Phys., 19, 2787–2812, https://doi.org/10.5194/acp-19-2787-2019, 2019. a, b, c
Dall'Osto, M., Geels, C., Beddows, D. C. S., Boertmann, D., Lange, R., Nøjgaard, J. K., Harrison, R. M., Simo, R., Skov, H., and Massling, A.: Regions of open water and melting sea ice drive new particle formation in North East Greenland, Sci. Rep., 8, 6109, https://doi.org/10.1038/s41598-018-24426-8, 2018. a
Ehn, M., Thornton, J. A., Kleist, E., Sipilä, M., Junninen, H., Pullinen, I., Springer, M., Rubach, F., Tillmann, R., Lee, B., Lopez-Hilfiker, F., Andres, S., Acir, I.-H., Rissanen, M., Jokinen, T., Schobesberger, S., Kangasluoma, J., Kontkanen, J., Nieminen, T., Kurtén, T., Nielsen, L. B., Jørgensen, S., Kjaergaard, H. G., Canagaratna, M., Maso, M. D., Berndt, T., Petäjä, T., Wahner, A., Kerminen, V.-M., Kulmala, M., Worsnop, D. R., Wildt, J., and Mentel, T. F.: A large source of low-volatility secondary organic aerosol, Nature, 506, 476–479, https://doi.org/10.1038/nature13032, 2014. a, b
Gao, Y., Zhang, D., Wang, J., Gao, H., and Yao, X.: Variations in Ncn and Nccn over marginal seas in China related to marine traffic emissions, new particle formation and aerosol aging, Atmos. Chem. Phys., 20, 9665–9677, https://doi.org/10.5194/acp-20-9665-2020, 2020. a
Gogoi, M. M., Babu, S. S., Jayachandran, V., Moorthy, K. K., Satheesh, S. K., Naja, M., and Kotamarthi, V. R.: Optical properties and CCN activity of aerosols in a high-altitude Himalayan environment: Results from RAWEX–GVAX, J. Geophys. Res.-Atmos., 120, 2453–2469, https://doi.org/10.1002/2014JD022966, 2015. a, b
Gunthe, S. S., King, S. M., Rose, D., Chen, Q., Roldin, P., Farmer, D. K., Jimenez, J. L., Artaxo, P., Andreae, M. O., Martin, S. T., and Pöschl, U.: Cloud condensation nuclei in pristine tropical rainforest air of Amazonia: size-resolved measurements and modeling of atmospheric aerosol composition and CCN activity, Atmos. Chem. Phys., 9, 7551–7575, https://doi.org/10.5194/acp-9-7551-2009, 2009. a
He, X.-C., Tham, Y. J., Dada, L., Wang, M., Finkenzeller, H., Stolzenburg, D., Iyer, S., Simon, M., Kürten, A., Shen, J., Rörup, B., Rissanen, M., Schobesberger, S., Baalbaki, R., Wang, D. S., Koenig, T. K., Jokinen, T., Sarnela, N., Beck, L. J., Almeida, J., Amanatidis, S., Amorim, A., Ataei, F., Baccarini, A., Bertozzi, B., Bianchi, F., Brilke, S., Caudillo, L., Chen, D., Chiu, R., Chu, B., Dias, A., Ding, A., Dommen, J., Duplissy, J., El Haddad, I., Gonzalez Carracedo, L., Granzin, M., Hansel, A., Heinritzi, M., Hofbauer, V., Junninen, H., Kangasluoma, J., Kemppainen, D., Kim, C., Kong, W., Krechmer, J. E., Kvashin, A., Laitinen, T., Lamkaddam, H., Lee, C. P., Lehtipalo, K., Leiminger, M., Li, Z., Makhmutov, V., Manninen, H. E., Marie, G., Marten, R., Mathot, S., Mauldin, R. L., Mentler, B., Möhler, O., Müller, T., Nie, W., Onnela, A., Petäjä, T., Pfeifer, J., Philippov, M., Ranjithkumar, A., Saiz-Lopez, A., Salma, I., Scholz, W., Schuchmann, S., Schulze, B., Steiner, G., Stozhkov, Y., Tauber, C., Tomé, A., Thakur, R. C., Väisänen, O., Vazquez-Pufleau, M., Wagner, A. C., Wang, Y., Weber, S. K., Winkler, P. M., Wu, Y., Xiao, M., Yan, C., Ye, Q., Ylisirniö, A., Zauner-Wieczorek, M., Zha, Q., Zhou, P., Flagan, R. C., Curtius, J., Baltensperger, U., Kulmala, M., Kerminen, V.-M., Kurtén, T., Donahue, N. M., Volkamer, R., Kirkby, J., Worsnop, D. R., and Sipilä, M.: Role of iodine oxoacids in atmospheric aerosol nucleation, Science, 371, 589–595, https://doi.org/10.1126/science.abe0298, 2021. a
Hegg, D. A., Covert, D. S., Jonsson, H. H., and Woods, R. K.: A simple relationship between cloud drop number concentration and precursor aerosol concentration for the regions of Earth's large marine stratocumulus decks, Atmos. Chem. Phys., 12, 1229–1238, https://doi.org/10.5194/acp-12-1229-2012, 2012. a
Herenz, P., Wex, H., Henning, S., Kristensen, T. B., Rubach, F., Roth, A., Borrmann, S., Bozem, H., Schulz, H., and Stratmann, F.: Measurements of aerosol and CCN properties in the Mackenzie River delta (Canadian Arctic) during spring–summer transition in May 2014, Atmos. Chem. Phys., 18, 4477–4496, https://doi.org/10.5194/acp-18-4477-2018, 2018. a, b, c, d
Herenz, P., Wex, H., Mangold, A., Laffineur, Q., Gorodetskaya, I. V., Fleming, Z. L., Panagi, M., and Stratmann, F.: CCN measurements at the Princess Elisabeth Antarctica research station during three austral summers, Atmos. Chem. Phys., 19, 275–294, https://doi.org/10.5194/acp-19-275-2019, 2019. a, b
Huffman, J. A., Docherty, K. S., Aiken, A. C., Cubison, M. J., Ulbrich, I. M., DeCarlo, P. F., Sueper, D., Jayne, J. T., Worsnop, D. R., Ziemann, P. J., and Jimenez, J. L.: Chemically-resolved aerosol volatility measurements from two megacity field studies, Atmos. Chem. Phys., 9, 7161–7182, https://doi.org/10.5194/acp-9-7161-2009, 2009. a
Jia, H., Ma, X., and Liu, Y.: Exploring aerosol–cloud interaction using VOCALS-REx aircraft measurements, Atmos. Chem. Phys., 19, 7955–7971, https://doi.org/10.5194/acp-19-7955-2019, 2019. a
Jung, C. H., Yoon, Y. J., Kang, H. J., Gim, Y., Lee, B. Y., Strom, J., Krejci, R., and Tunved, P.: The seasonal characteristics of cloud condensation nuclei (CCN) in the arctic lower troposphere, Tellus B, 70, 1–13, https://doi.org/10.1080/16000889.2018.1513291, 2018. a, b, c, d, e
Jurányi, Z., Gysel, M., Weingartner, E., DeCarlo, P. F., Kammermann, L., and Baltensperger, U.: Measured and modelled cloud condensation nuclei number concentration at the high alpine site Jungfraujoch, Atmos. Chem. Phys., 10, 7891–7906, https://doi.org/10.5194/acp-10-7891-2010, 2010. a, b
Kecorius, S., Vogl, T., Paasonen, P., Lampilahti, J., Rothenberg, D., Wex, H., Zeppenfeld, S., van Pinxteren, M., Hartmann, M., Henning, S., Gong, X., Welti, A., Kulmala, M., Stratmann, F., Herrmann, H., and Wiedensohler, A.: New particle formation and its effect on cloud condensation nuclei abundance in the summer Arctic: a case study in the Fram Strait and Barents Sea, Atmos. Chem. Phys., 19, 14339–14364, https://doi.org/10.5194/acp-19-14339-2019, 2019. a, b, c, d, e, f
Khvorostyanov, V. I. and Curry, J. A.: Aerosol size spectra and CCN activity spectra: Reconciling the lognormal, algebraic, and power laws, J. Geophys. Res., 111, D12202, https://doi.org/10.1029/2005JD006532, 2006. a
Kim, J., Yoon, Y. J., Gim, Y., Choi, J. H., Kang, H. J., Park, K.-T., Park, J., and Lee, B. Y.: New particle formation events observed at King Sejong Station, Antarctic Peninsula – Part 1: Physical characteristics and contribution to cloud condensation nuclei, Atmos. Chem. Phys., 19, 7583–7594, https://doi.org/10.5194/acp-19-7583-2019, 2019. a
Koike, M., Ukita, J., Strom, J., Tunved, P., Shiobara, M., Vitale, V., Lupi, A., Baumgardner, D., Ritter, C., Hermansen, O., Yamada, K., and Pedersen, C. A.: Year-Round In Situ Measurements of Arctic Low-Level Clouds: Microphysical Properties and Their Relationships With Aerosols, J. Geophys. Res.-Atmos., 124, 1798–1822, https://doi.org/10.1029/2018JD029802, 2019. a, b
Kuang, C., McMurry, P. H., and McCormick, A. V.: Determination of cloud condensation nuclei production from measured new particle formation events, Geophys. Res. Lett., 36, L09822, https://doi.org/10.1029/2009GL037584, 2009. a
Lambe, A. T., Onasch, T. B., Massoli, P., Croasdale, D. R., Wright, J. P., Ahern, A. T., Williams, L. R., Worsnop, D. R., Brune, W. H., and Davidovits, P.: Laboratory studies of the chemical composition and cloud condensation nuclei (CCN) activity of secondary organic aerosol (SOA) and oxidized primary organic aerosol (OPOA), Atmos. Chem. Phys., 11, 8913–8928, https://doi.org/10.5194/acp-11-8913-2011, 2011. a
Lange, R., Dall'Osto, M., Wex, H., Skov, H., and Massling, A.: Large Summer Contribution of Organic Biogenic Aerosols to Arctic Cloud Condensation Nuclei, Geophys. Res. Lett., 46, 11500–11509, https://doi.org/10.1029/2019GL084142, 2019. a, b, c, d, e
Lathem, T. L., Beyersdorf, A. J., Thornhill, K. L., Winstead, E. L., Cubison, M. J., Hecobian, A., Jimenez, J. L., Weber, R. J., Anderson, B. E., and Nenes, A.: Analysis of CCN activity of Arctic aerosol and Canadian biomass burning during summer 2008, Atmos. Chem. Phys., 13, 2735–2756, https://doi.org/10.5194/acp-13-2735-2013, 2013. a, b
Leaitch, W. R., Sharma, S., Huang, L., Toom-Sauntry, D., Chivulescu, A., Macdonald, A. M., von Salzen, K., Pierce, J. R., Bertram, A. K., Schroder, J. C., Shantz, N. C., Chang, R. Y.-W., and Norman, A.-L.: Dimethyl sulfide control of the clean summertime Arctic aerosol and cloud, Elementa, 1, 000017, https://doi.org/10.12952/journal.elementa.000017, 2013. a
Leaitch, W. R., Korolev, A., Aliabadi, A. A., Burkart, J., Willis, M. D., Abbatt, J. P. D., Bozem, H., Hoor, P., Köllner, F., Schneider, J., Herber, A., Konrad, C., and Brauner, R.: Effects of 20–100 nm particles on liquid clouds in the clean summertime Arctic, Atmos. Chem. Phys., 16, 11107–11124, https://doi.org/10.5194/acp-16-11107-2016, 2016. a, b, c
Li, S.-M., Barrie, L. A., and Sirois, A.: Biogenic sulfur aerosol in the Arctic troposphere: 2. Trends and seasonal variations, J. Geophys. Res., 98, 20623, https://doi.org/10.1029/93JD02233, 1993. a
Martin, M., Chang, R. Y.-W., Sierau, B., Sjogren, S., Swietlicki, E., Abbatt, J. P. D., Leck, C., and Lohmann, U.: Cloud condensation nuclei closure study on summer arctic aerosol, Atmos. Chem. Phys., 11, 11335–11350, https://doi.org/10.5194/acp-11-11335-2011, 2011. a, b, c
Massoli, P., Lambe, A. T., Ahern, A. T., Williams, L. R., Ehn, M., Mikkilä, J., Canagaratna, M. R., Brune, W. H., Onasch, T. B., Jayne, J. T., Petäjä, T., Kulmala, M., Laaksonen, A., Kolb, C. E., Davidovits, P., and Worsnop, D. R.: Relationship between aerosol oxidation level and hygroscopic properties of laboratory generated secondary organic aerosol (SOA) particles, Geophys. Res. Lett., 37, L24801, https://doi.org/10.1029/2010GL045258, 2010. a
Mauritsen, T., Sedlar, J., Tjernström, M., Leck, C., Martin, M., Shupe, M., Sjogren, S., Sierau, B., Persson, P. O. G., Brooks, I. M., and Swietlicki, E.: An Arctic CCN-limited cloud-aerosol regime, Atmos. Chem. Phys., 11, 165–173, https://doi.org/10.5194/acp-11-165-2011, 2011. a
Mei, F., Wang, J., Zhou, S., Zhang, Q., Collier, S., and Xu, J.: Measurement report: Cloud condensation nuclei activity and its variation with organic oxidation level and volatility observed during an aerosol life cycle intensive operational period (ALC-IOP), Atmos. Chem. Phys., 21, 13019–13029, https://doi.org/10.5194/acp-21-13019-2021, 2021. a
Merikanto, J., Spracklen, D. V., Mann, G. W., Pickering, S. J., and Carslaw, K. S.: Impact of nucleation on global CCN, Atmos. Chem. Phys., 9, 8601–8616, https://doi.org/10.5194/acp-9-8601-2009, 2009. a
Moore, R. H., Bahreini, R., Brock, C. A., Froyd, K. D., Cozic, J., Holloway, J. S., Middlebrook, A. M., Murphy, D. M., and Nenes, A.: Hygroscopicity and composition of Alaskan Arctic CCN during April 2008, Atmos. Chem. Phys., 11, 11807–11825, https://doi.org/10.5194/acp-11-11807-2011, 2011. a
Mungall, E. L., Abbatt, J. P. D., Wentzell, J. J. B., Lee, A. K. Y., Thomas, J. L., Blais, M., Gosselin, M., Miller, L. A., Papakyriakou, T., Willis, M. D., and Liggio, J.: Microlayer source of oxygenated volatile organic compounds in the summertime marine Arctic boundary layer, Proc. Natl. Acad. Sci. USA, 114, 6203–6208, https://doi.org/10.1073/pnas.1620571114, 2017. a, b, c
Park, J., Dall'Osto, M., Park, K., Gim, Y., Kang, H. J., Jang, E., Park, K.-T., Park, M., Yum, S. S., Jung, J., Lee, B. Y., and Yoon, Y. J.: Shipborne observations reveal contrasting Arctic marine, Arctic terrestrial and Pacific marine aerosol properties, Atmos. Chem. Phys., 20, 5573–5590, https://doi.org/10.5194/acp-20-5573-2020, 2020. a, b
Petters, M. D. and Kreidenweis, S. M.: A single parameter representation of hygroscopic growth and cloud condensation nucleus activity, Atmos. Chem. Phys., 7, 1961–1971, https://doi.org/10.5194/acp-7-1961-2007, 2007. a, b
Pierce, J. R. and Adams, P. J.: Global evaluation of CCN formation by direct emission of sea salt and growth of ultrafine sea salt, J. Geophys. Res., 111, D06203, https://doi.org/10.1029/2005JD006186, 2006. a
Rempillo, O., Seguin, A. M., Norman, A.-L., Scarratt, M., Michaud, S., Chang, R., Sjostedt, S., Abbatt, J., Else, B., Papakyriakou, T., Sharma, S., Grasby, S., and Levasseur, M.: Dimethyl sulfide air-sea fluxes and biogenic sulfur as a source of new aerosols in the Arctic fall, J. Geophys. Res.-Atmos., 116, D00S04, https://doi.org/10.1029/2011JD016336, 2011. a
Roberts, G. C. and Nenes, A.: A Continuous-Flow Streamwise Thermal-Gradient CCN Chamber for Atmospheric Measurements, Aerosol Sci. Tech., 39, 206–221, https://doi.org/10.1080/027868290913988, 2005. a
Serreze, M. C. and Barry, R. G.: Processes and impacts of Arctic amplification: A research synthesis, Global Planet. Change, 77, 85–96, https://doi.org/10.1016/j.gloplacha.2011.03.004, 2011. a
Shantz, N. C., Leaitch, W. R., Phinney, L., Mozurkewich, M., and Toom-Sauntry, D.: The effect of organic compounds on the growth rate of cloud droplets in marine and forest settings, Atmos. Chem. Phys., 8, 5869–5887, https://doi.org/10.5194/acp-8-5869-2008, 2008. a
Shupe, M. D. and Intrieri, J. M.: Cloud Radiative Forcing of the Arctic Surface: The Influence of Cloud Properties, Surface Albedo, and Solar Zenith Angle, J. Climate, 17, 13, https://doi.org/10.1175/1520-0442(2004)017%3C0616:CRFOTA%3E2.0.CO;2, 2004. a
Sihto, S.-L., Mikkilä, J., Vanhanen, J., Ehn, M., Liao, L., Lehtipalo, K., Aalto, P. P., Duplissy, J., Petäjä, T., Kerminen, V.-M., Boy, M., and Kulmala, M.: Seasonal variation of CCN concentrations and aerosol activation properties in boreal forest, Atmos. Chem. Phys., 11, 13269–13285, https://doi.org/10.5194/acp-11-13269-2011, 2011. a, b
Sipilä, M., Sarnela, N., Jokinen, T., Henschel, H., Junninen, H., Kontkanen, J., Richters, S., Kangasluoma, J., Franchin, A., Peräkylä, O., Rissanen, M. P., Ehn, M., Vehkamäki, H., Kurten, T., Berndt, T., Petäjä, T., Worsnop, D., Ceburnis, D., Kerminen, V.-M., Kulmala, M., and O'Dowd, C.: Molecular-scale evidence of aerosol particle formation via sequential addition of HIO3, Nature, 537, 532–534, https://doi.org/10.1038/nature19314, 2016. a
Stroeve, J. and Notz, D.: Changing state of Arctic sea ice across all seasons, Environ. Res. Lett., 13, 103001, https://doi.org/10.1088/1748-9326/aade56, 2018. a
Tremblay, S., Picard, J.-C., Bachelder, J. O., Lutsch, E., Strong, K., Fogal, P., Leaitch, W. R., Sharma, S., Kolonjari, F., Cox, C. J., Chang, R. Y.-W., and Hayes, P. L.: Characterization of aerosol growth events over Ellesmere Island during the summers of 2015 and 2016, Atmos. Chem. Phys., 19, 5589–5604, https://doi.org/10.5194/acp-19-5589-2019, 2019. a, b, c
Tunved, P., Ström, J., and Krejci, R.: Arctic aerosol life cycle: linking aerosol size distributions observed between 2000 and 2010 with air mass transport and precipitation at Zeppelin station, Ny-Ålesund, Svalbard, Atmos. Chem. Phys., 13, 3643–3660, https://doi.org/10.5194/acp-13-3643-2013, 2013. a
Twomey, S.: The nuclei of natural cloud formation part I: The chemical diffusion method and its application to atmospheric nuclei, Geofis. Pura Appl., 43, 227–242, https://doi.org/10.1007/BF01993559, 1959. a
von der Weiden, S.-L., Drewnick, F., and Borrmann, S.: Particle Loss Calculator – a new software tool for the assessment of the performance of aerosol inlet systems, Atmos. Meas. Tech., 2, 479–494, https://doi.org/10.5194/amt-2-479-2009, 2009. a
Wentworth, G. R., Murphy, J. G., Croft, B., Martin, R. V., Pierce, J. R., Côté, J.-S., Courchesne, I., Tremblay, J.-É., Gagnon, J., Thomas, J. L., Sharma, S., Toom-Sauntry, D., Chivulescu, A., Levasseur, M., and Abbatt, J. P. D.: Ammonia in the summertime Arctic marine boundary layer: sources, sinks, and implications, Atmos. Chem. Phys., 16, 1937–1953, https://doi.org/10.5194/acp-16-1937-2016, 2016. a
Willis, M. D., Burkart, J., Thomas, J. L., Köllner, F., Schneider, J., Bozem, H., Hoor, P. M., Aliabadi, A. A., Schulz, H., Herber, A. B., Leaitch, W. R., and Abbatt, J. P. D.: Growth of nucleation mode particles in the summertime Arctic: a case study, Atmos. Chem. Phys., 16, 7663–7679, https://doi.org/10.5194/acp-16-7663-2016, 2016. a, b, c, d, e, f, g, h, i, j
Willis, M. D., Köllner, F., Burkart, J., Bozem, H., Thomas, J. L., Schneider, J., Aliabadi, A. A., Hoor, P. M., Schulz, H., Herber, A. B., Leaitch, W. R., and Abbatt, J. P. D.: Evidence for marine biogenic influence on summertime Arctic aerosol, Geophys. Res. Lett., 44, 6460–6470, 2017. a, b
Yu, F. and Luo, G.: Oceanic Dimethyl Sulfide Emission and New Particle Formation around the Coast of Antarctica: A Modeling Study of Seasonal Variations and Comparison with Measurements, Atmosphere, 1, 34–50, https://doi.org/10.3390/atmos1010034, 2010. a, b
Zábori, J., Rastak, N., Yoon, Y. J., Riipinen, I., and Ström, J.: Size-resolved cloud condensation nuclei concentration measurements in the Arctic: two case studies from the summer of 2008, Atmos. Chem. Phys., 15, 13803–13817, https://doi.org/10.5194/acp-15-13803-2015, 2015. a, b