the Creative Commons Attribution 4.0 License.
the Creative Commons Attribution 4.0 License.
 | 20 Jun 2022
Limitations in representation of physical processes prevent successful simulation of PM2.5 during KORUS-AQ
Katherine R. Travis
James H. Crawford
Gao Chen
Carolyn E. Jordan
Benjamin A. Nault
Hwajin Kim
Jose L. Jimenez
Pedro Campuzano-Jost
Jack E. Dibb
Jung-Hun Woo
Younha Kim
Shixian Zhai
Xuan Wang
Erin E. McDuffie
Fangqun Yu
Saewung Kim
Isobel J. Simpson
Donald R. Blake
Limseok Chang
Michelle J. Kim
High levels of fine particulate matter (PM2.5) pollution in East Asia often exceed local air quality standards. Observations from the Korea–United States Air Quality (KORUS-AQ) field campaign in May and June 2016 showed that development of extreme pollution (haze) occurred through a combination of long-range transport and favorable meteorological conditions that enhanced local production of PM2.5. Atmospheric models often have difficulty simulating PM2.5 chemical composition during haze, which is of concern for the development of successful control measures. We use observations from KORUS-AQ to examine the ability of the GEOS-Chem chemical transport model to simulate PM2.5 composition throughout the campaign and identify the mechanisms driving the pollution event. At the surface, the model underestimates sulfate by −64 % but overestimates nitrate by +36 %. The largest underestimate in sulfate occurs during the pollution event, for which models typically struggle to generate elevated sulfate concentrations due to missing heterogeneous chemistry in aerosol liquid water in the polluted boundary layer. Hourly surface observations show that the model nitrate bias is driven by an overestimation of the nighttime peak. In the model, nitrate formation is limited by the supply of nitric acid, which is biased by +100 % against aircraft observations. We hypothesize that this is due to a large missing sink, which we implement here as a factor of 5 increase in dry deposition. We show that the resulting increased deposition velocity is consistent with observations of total nitrate as a function of photochemical age. The model does not account for factors such as the urban heat island effect or the heterogeneity of the built-up urban landscape, resulting in insufficient model turbulence and surface area over the study area that likely results in insufficient dry deposition. Other species such as NH3 could be similarly affected but were not measured during the campaign. Nighttime production of nitrate is driven by NO2 hydrolysis in the model, while observations show that unexpectedly elevated nighttime ozone (not present in the model) should result in N2O5 hydrolysis as the primary pathway. The model is unable to represent nighttime ozone due to an overly rapid collapse of the afternoon mixed layer and excessive titration by NO. We attribute this to missing nighttime heating driving deeper nocturnal mixing that would be expected to occur in a city like Seoul. This urban heating is not considered in air quality models run at large enough scales to treat both local chemistry and long-range transport. Key model failures in simulating nitrate, mainly overestimated daytime nitric acid, incorrect representation of nighttime chemistry, and an overly shallow and insufficiently turbulent nighttime mixed layer, exacerbate the model's inability to simulate the buildup of PM2.5 during haze pollution. To address the underestimate in sulfate most evident during the haze event, heterogeneous aerosol uptake of SO2 is added to the model, which previously only considered aqueous production of sulfate from SO2 in cloud water. Implementing a simple parameterization of this chemistry improves the model abundance of sulfate but degrades the SO2 simulation, implying that emissions are underestimated. We find that improving model simulations of sulfate has direct relevance to determining local vs. transboundary contributions to PM2.5. During the haze pollution event, the inclusion of heterogeneous aerosol uptake of SO2 decreases the fraction of PM2.5 attributable to long-range transport from 66 % to 54 %. Locally produced sulfate increased from 1 % to 25 % of locally produced PM2.5, implying that local emissions controls could have a larger effect than previously thought. However, this additional uptake of SO2 is coupled to the model nitrate prediction, which affects the aerosol liquid water abundance and chemistry driving sulfate–nitrate–ammonium partitioning. An additional simulation of the haze pollution with heterogeneous uptake of SO2 to aerosol and simple improvements to the model nitrate simulation results in 30 % less sulfate due to 40 % less nitrate and aerosol water, and this results in an underestimate of sulfate during the haze event. Future studies need to better consider the impact of model physical processes such as dry deposition and nighttime boundary layer mixing on the simulation of nitrate and the effect of improved nitrate simulations on the overall simulation of secondary inorganic aerosol (sulfate + nitrate + ammonium) in East Asia. Foreign emissions are rapidly changing, increasing the need to understand the impact of local emissions on PM2.5 in South Korea to ensure continued air quality improvements.
- Article
(6693 KB) - Full-text XML
-
Supplement
(1582 KB) - BibTeX
- EndNote


South Korea enacted legislation in 2018 to address local air pollution, which ranked 13th in the world for the worst annual average fine particulate matter (PM2.5) exposure levels (Energy Policy Institute, 2019). Ambient PM2.5 was the fifth-highest risk factor for human health in South Korea in 2018, leading to over 20 000 attributable deaths (GBD, 2021). The government plans to reduce the number of days with pollution warnings (PM2.5 > 90 µg m−3 for 2 h) by 50 % in 2022 from the 89 that occurred in 2016 (Kim et al., 2018b). The reduction of PM2.5 levels through policy measures relies on a thorough understanding of pollution sources and the ability of models to simulate potential control measures. Modeling studies have concluded that on average, approximately half of observed PM2.5 in South Korea is attributable to long-range transport from China (Lee et al., 2017; Choi et al., 2019; Jung et al., 2019; Kumar et al., 2021). Quantifying the effect of long-range transport relies on regional- to global-scale models that trade off the high resolution needed to resolve urban scales with a large enough domain to represent both the study area and upwind source regions. Estimates of long-range transport are based on models that have received limited testing of their ability to simulate PM2.5 chemical composition, particularly during extreme pollution events. This evaluation is critical as the contribution of long-range transport to PM2.5 in South Korea may be declining due to effective emission controls in China (Han et al., 2021), increasing the need to understand the impact of local emissions on pollution events.
Across East Asia, densely populated regions experience haze events, with extremely high levels of PM2.5 frequently associated with periods of elevated relative humidity and low daytime mixed layer heights (An et al., 2019). These conditions are favorable for increasing gas–particle partitioning of aerosol precursors. Secondary inorganic aerosol (secondary sulfate + nitrate + ammonium ≡ SNA) is often the dominant component of PM2.5 in haze, but models have difficulty simulating sulfate during these periods, likely due to missing conversion of SO2 in aqueous aerosol (Wang et al., 2014; B. Zheng et al., 2015; G. J. Zheng et al., 2015; Shao et al., 2019). The MICS-Asia multi-model comparison showed that the annual contribution of SNA to total PM2.5 varied by a factor of 2 across models, and models overpredicted the gas–particle partitioning of nitrate (Chen et al., 2019). In the global AeroCom III intercomparison, models differed in their annual concentrations of nitrate and its precursor, nitric acid, by factors of 13 and 9, respectively (Bian et al., 2017). Models also struggle to represent organic aerosol (Zhao et al., 2016), overestimating primary organic aerosol (POA) but underestimating secondary organic aerosol (SOA), likely due to missing sources from anthropogenic precursors (Nault et al., 2021b). The wide range of model performance in simulating PM2.5 composition emphasizes the urgent need for better model constraints.
In the atmosphere, aqueous-phase chemistry is a major source of sulfate; clouds provide the dominant source of liquid water (Herrmann et al., 2015). Recent studies have hypothesized that the high aerosol liquid water content (ALWC) associated with PM2.5 during extreme pollution events in East Asia allows for significant sulfate production not considered in most models (Wang et al., 2014; B. Zheng et al., 2015; G. J. Zheng et al., 2015; Shao et al., 2019). Early modeling work suggested that this chemistry must be occurring generally in the polluted boundary layer in the United States and Europe (Kasibhatla et al., 1997). Aqueous SO2 oxidation pathway(s) are uncertain in part due to poor understanding of aerosol acidity (An et al., 2019). Aerosol acidity partially controls nitric acid–nitrate partitioning (Guo et al., 2016). Nitrate aerosol has the greatest impact on ALWC, which affects acidity (Ge et al., 2012; Sun et al., 2018). Due to this coupled nature of SNA aerosol, improving model representation of one component (i.e., sulfate) cannot be considered entirely separately from the rest (nitrate + ammonium).
The Korea–United States Air Quality campaign (KORUS-AQ), conducted in May and June 2016 in South Korea (Crawford et al., 2021), provides an extensive set of ground- and aircraft-based observations that can further constrain model simulations of the chemical and physical drivers of PM2.5. The campaign included a haze event with concentrations exceeding local air quality standards, characterized by rapid buildup of SNA aerosol. Throughout KORUS-AQ, surprisingly high levels of nighttime ozone, particularly prevalent during haze, appeared to drive nighttime nitrate formation through N2O5 hydrolysis (Jordan et al., 2020). This was attributed to elevated nocturnal mixed layer heights (MLHs). Zhai et al. (2021a) found a severe model overestimate in nighttime nitrate during KORUS-AQ, implying a failure to correctly simulate these conditions. We use the GEOS-Chem chemical transport model applied at high resolution (0.25∘ × 0.3125∘) over East Asia to investigate model representation of PM2.5 mass and chemical composition during KORUS-AQ. We specifically evaluate model performance during the conditions governing the development of haze pollution such as elevated relative humidity, increased SNA, and high nighttime ozone levels. We demonstrate how addressing deficiencies in model physical processes (e.g., nighttime mixing, deposition) is fundamental to the successful simulation of PM2.5.
Table 1Description of the ground site and aircraft observations used in this work1.
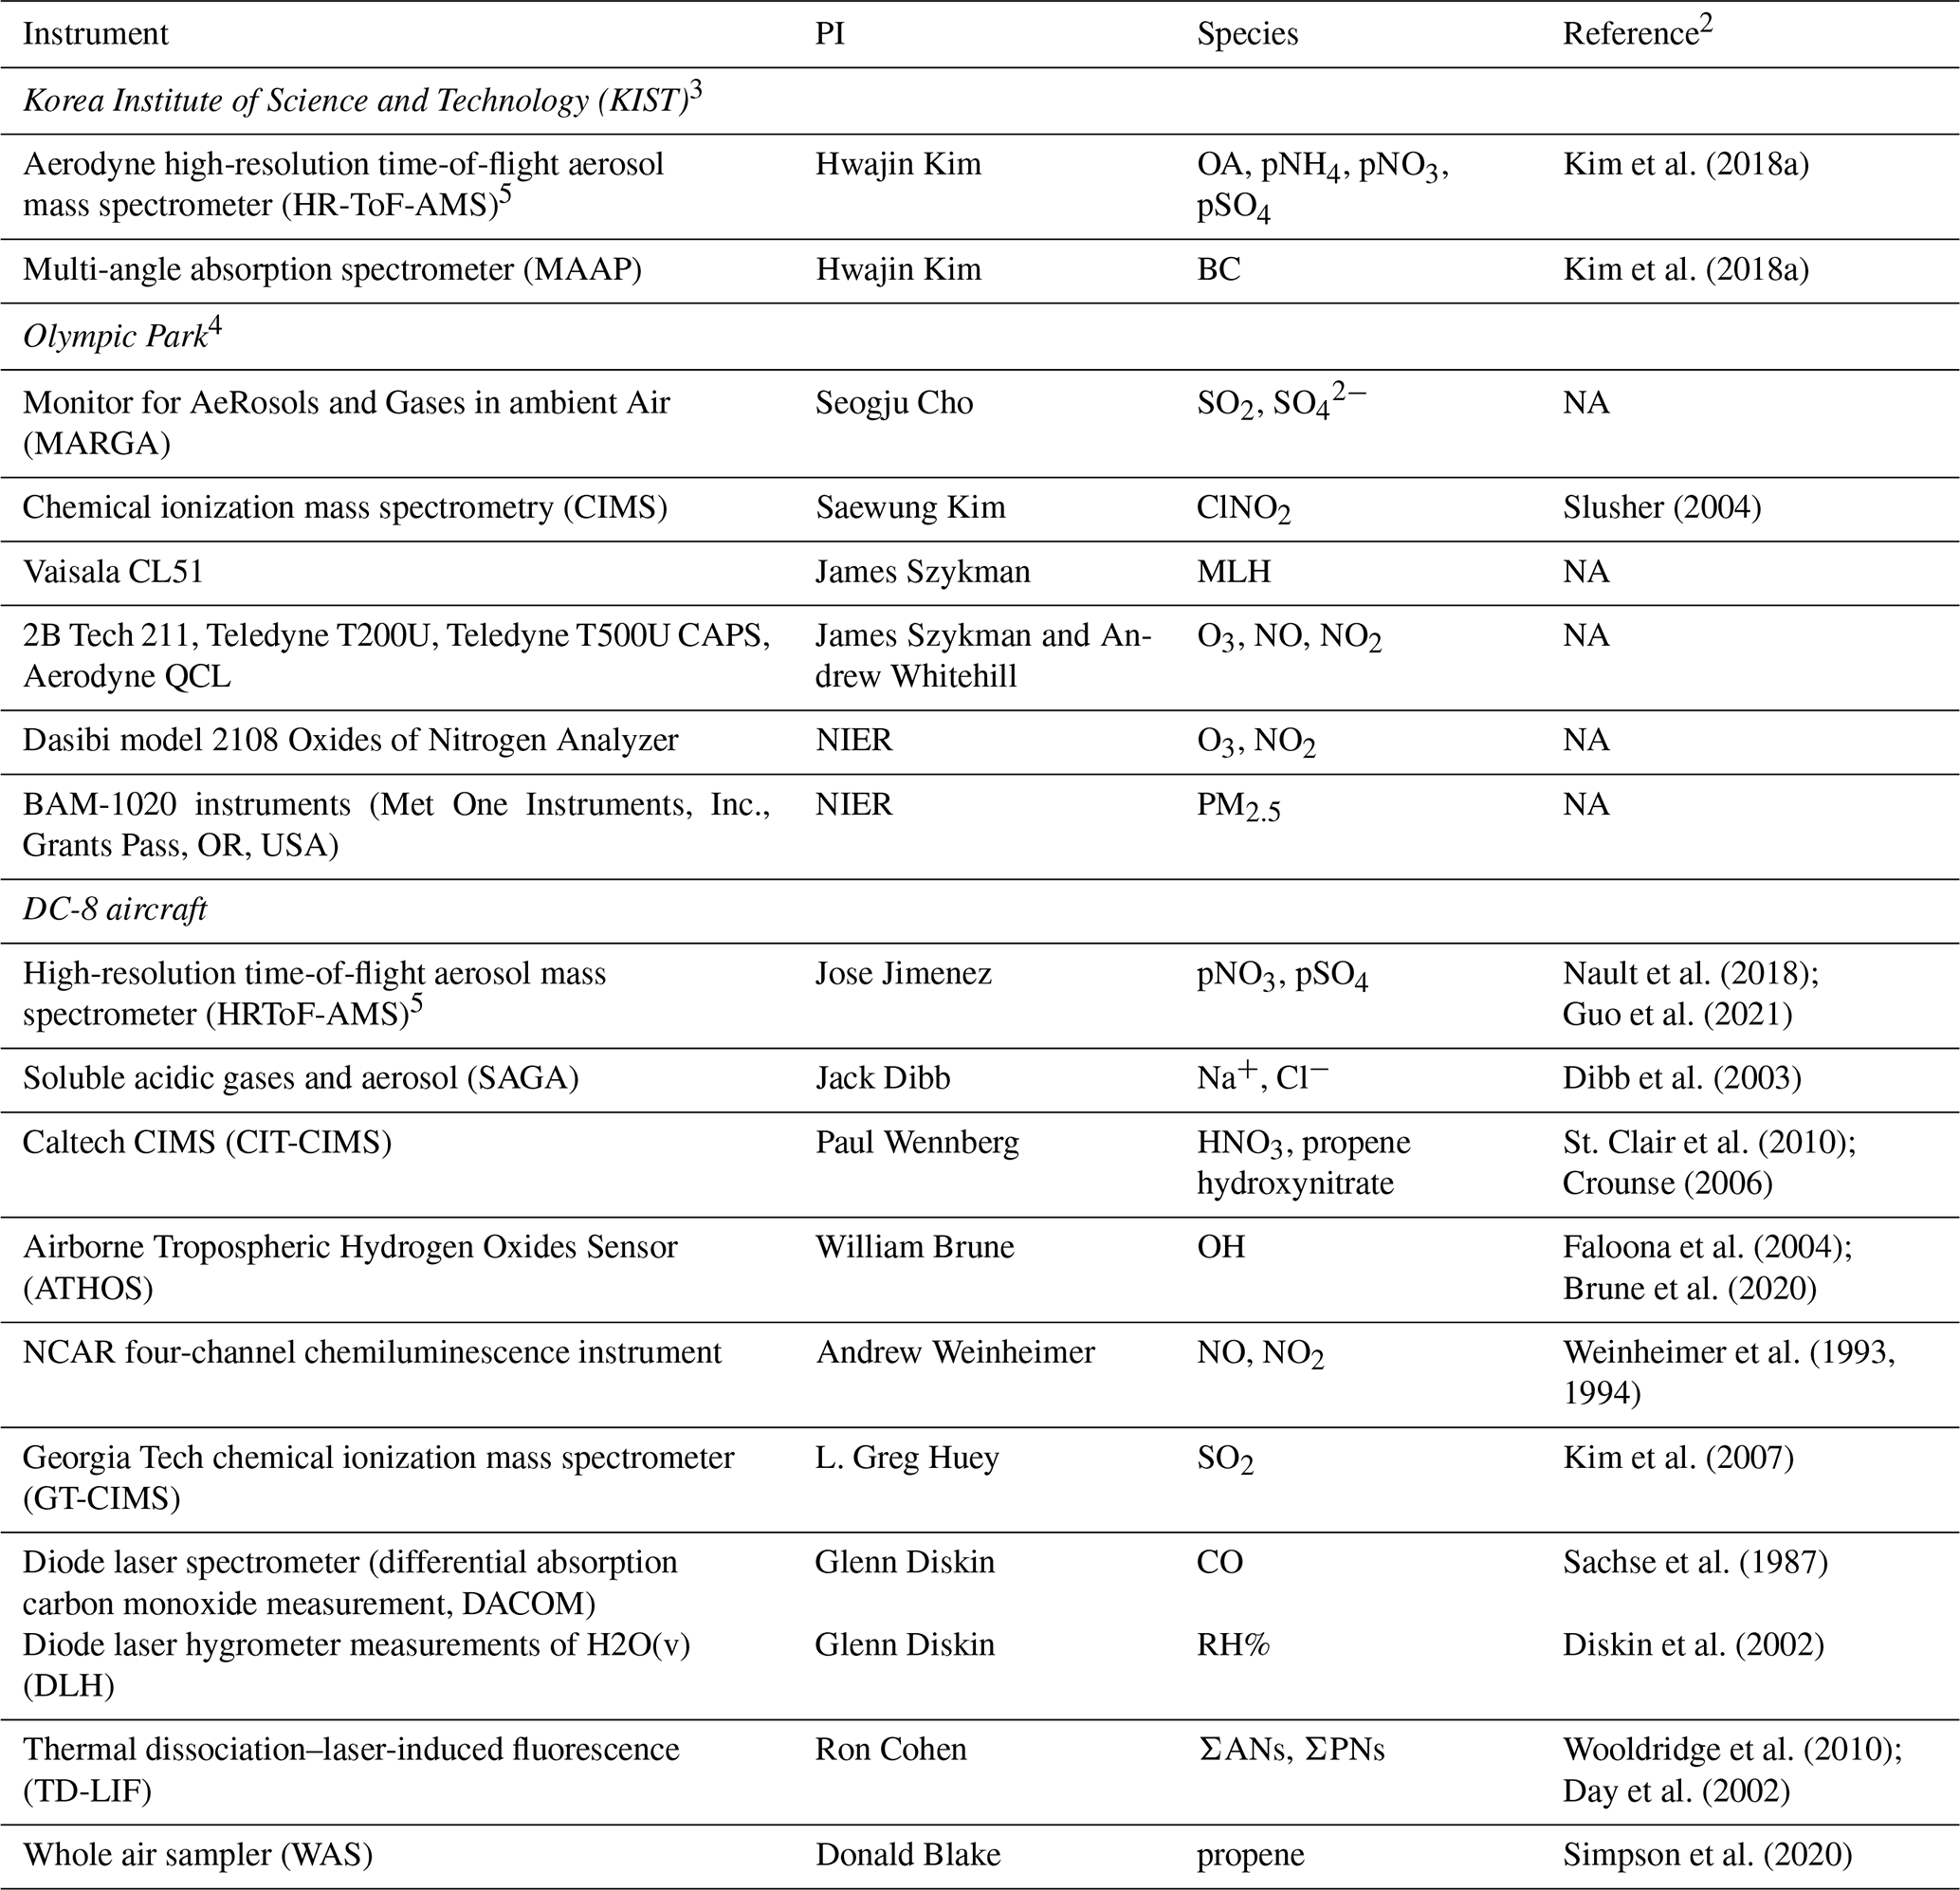
1 For a full description of all KORUS-AQ observations, see Crawford et al. (2021). 2 For specific measurement descriptions including uncertainty information, see the KORUS-AQ data archive (https://doi.org/10.5067/Suborbital/KORUSAQ/DATA01). 3 Korea Institute of Standards and Technology (KIST), 37.602∘ N, 127.126∘ E. 4 Olympic Park site in Seoul, 37.522∘ N, 127.124∘ E. 5 AMS data are written without the charge; see http://cires1.colorado.edu/jimenez-group/wiki/index.php/FAQ_for_AMS_Data_Users#Why_do_you_write_SO4_.26_NO3_and_not_SO42-_.26_NO3-.3F. NA: not available.
The KORUS-AQ campaign (Crawford et al., 2021) was a joint field campaign organized by South Korea's National Institute of Environmental Research (NIER) and the United States National Aeronautics and Space Administration (NASA). KORUS-AQ included 20 flights using the NASA DC-8 aircraft from 1 May to 9 June 2016, complemented by heavily instrumented ground sites including aerosol composition at Olympic Park and the Korea Institute of Science and Technology (KIST) in Seoul. The NIER maintains the extensive AirKorea monitoring network for hourly observations of PM2.5 mass, ozone, and other pollutants, with 329 sites available during the campaign, including locations near Olympic Park and KIST. There were four distinct meteorological periods during KORUS-AQ, as described in Peterson et al. (2019). These included a dynamic period characterized by a series of frontal passages (Dynamic period, 1–16 May), dry, clear, and stagnant conditions (Stagnant period, 17–22 May), long-range transport and haze conditions with high humidity and extensive cloud cover (Transport/Haze period, 25–31 May), and blocking conditions limiting transport (Blocking period, 1–7 June). Details on the impact of the different meteorological periods on PM2.5 are provided in Jordan et al. (2020). We focus on the Seoul Metropolitan Area (SMA) with the highest density of KORUS-AQ observations and the highest PM2.5 levels observed by the AirKorea network during the campaign. Crawford et al. (2021) provide a full listing of all observations made during KORUS-AQ. Table 1 describes the aircraft and ground observations used in this work.
We use the GEOS-Chem chemical transport model (CTM) version 12.7.2 (https://doi.org/10.5281/zenodo.3701669) to simulate KORUS-AQ. The model is driven by assimilated meteorological data from the NASA Global Modeling and Assimilation Office (GMAO) Goddard Earth Observing System Forward-Processing (GEOS-FP) atmospheric data assimilation system. GEOS-FP has a native horizontal resolution of 0.25∘ × 0.3125∘, which we apply with the nested version of GEOS-Chem (Chen et al., 2009) over East Asia (15∘ S–55∘ N, 70–140∘ E) using boundary conditions from a global simulation at 2.0∘ × 2.5∘ with a 1-month initialization period. The model has 47 vertical layers, with the first layer centered at approximately 60 m above the surface. Model time steps are 20 min (chemistry) and 10 min (transport) as recommended by Philip et al. (2016).
Global emissions are from the Community Emissions Database System (CEDS) inventory (Hoesly et al., 2018) overwritten by the KORUSv5 anthropogenic and shipping emissions (Woo et al., 2020) for Asia (10∘ S–54∘ N, 60–146∘ E) developed for the KORUS-AQ campaign. The translation from KORUSv5, provided using the SAPRC99 chemical mechanism, to the GEOS-Chem mechanism is given in Table S1 in the Supplement. We apply sector-specific diurnal variation from the Multi-resolution Emission Inventory for China (MEIC) as in Miao et al. (2020) to the monthly KORUSv5 emissions. Natural emissions are from the Global Emissions Initiative (GEIA, Bouwman et al., 1997) for ammonia and from MEGANv2.1 (Guenther et al., 2012) for biogenic species. We include lightning emissions (Murray et al., 2012), biomass burning emissions (GFED4 s, Werf et al., 2017), soil NOx emissions (Hudman et al., 2012), and volcanic SO2 emissions (Carn et al., 2015). Table 2 shows the emissions inventory for key emitted species in the nested East Asia domain for May 2016.
Table 2KORUS-AQ emissions over the domain 15∘ S to 55∘ N, 70∘ to 140∘ E.
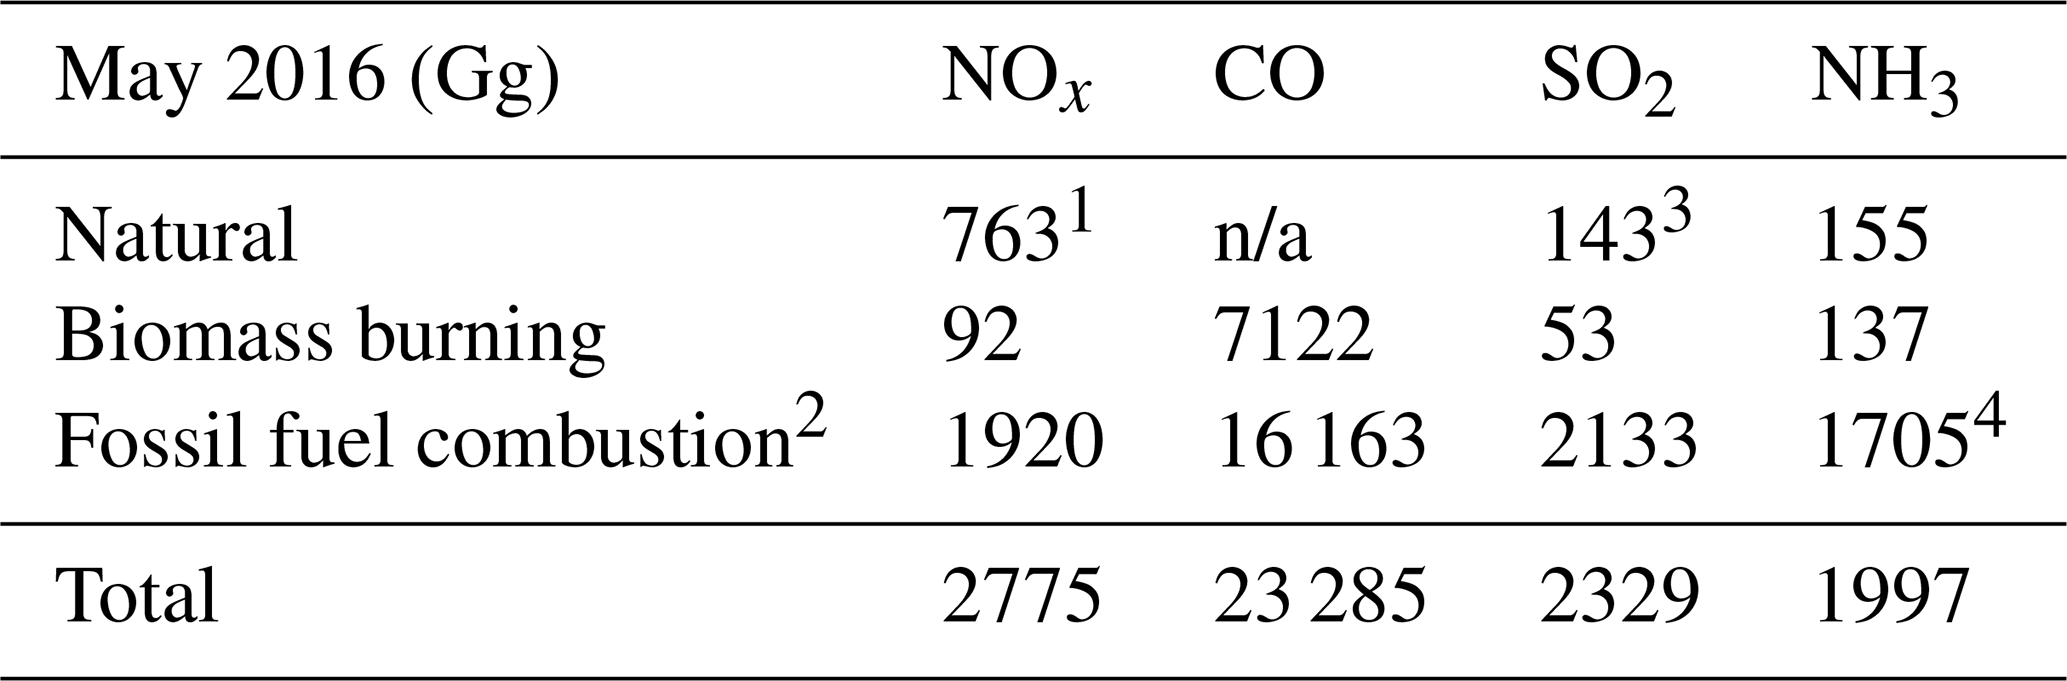
1 Lightning, soil, and fertilizer emissions. 2 Point, area, mobile sources, ships, and aircraft from the KORUSv5 inventory. 3 Volcanic eruptions + degassing. 4 Includes agricultural emissions. n/a: not applicable.
Model dry deposition for gas-phase species is based on the resistance-in-series scheme from Wesely (1989) as implemented by Wang et al. (1998), wherein species deposition is limited by aerodynamic resistance, quasi-laminar layer resistance, and canopy or surface resistance. Species with low surface resistance, such as HNO3, are limited in their deposition velocity by aerodynamic resistance only. Aerosol deposition is from Zhang et al. (2001). The original model wet deposition scheme is described by Liu et al. (2001) for water-soluble aerosols and Amos et al. (2012) for gases. Wet deposition includes scavenging from moist convective updrafts and rainout and washout from precipitation. We include the revised wet deposition scheme of Luo et al. (2019) that uses an empirical washout rate for nitric acid 2 orders of magnitude higher than the previous value and replaces the standard constant value for in-cloud condensation water content with the value calculated by the meteorological fields (GEOS-FP). GEOS-Chem uses a non-local boundary layer mixing scheme (Holtslag and Boville, 1993; Lin and McElroy, 2010) whereby mixing is explicitly calculated from meteorological variables provided by GEOS-FP (i.e., sensible and latent heat flux, temperature, friction velocity). The mixing height is restricted from dropping below a minimum mechanical mixing depth, defined as a function of local friction velocity (Lin and McElroy, 2010).
The GEOS-Chem HOx–NOx–VOC–ozone–halogen–aerosol mechanism includes improvements to PAN (peroxyacetyl nitrate) chemistry (Fischer et al., 2014), isoprene oxidation (Fisher et al., 2016; Travis et al., 2016; Chan Miller et al., 2017), halogen chemistry (Sherwen et al., 2016), Criegee intermediates (Millet et al., 2015), and methyl, ethyl, and propyl nitrates (Fisher et al., 2018). Heterogeneous aerosol uptake of HO2 produces H2O2 (Mao et al., 2013), with a reactive uptake coefficient (γ) of 0.2 (Jacob, 2000). We implement aromatic chemistry from Yan et al. (2019) for the simulation of KORUS-AQ.
We use the model “simple scheme” for organic aerosol (OA) wherein OA is generated using fixed empirically derived yields from isoprene, monoterpenes, biomass burning, and anthropogenic fuel combustion (Pai et al., 2020). This scheme includes an emitted hydrophobic component (OCPO) with an assumed organic-mass-to-organic-carbon (OM:OC) ratio of 1.4 that is aged to a hydrophilic oxygenated component (OCPI) with an OM:OC ratio of 2.1. Secondary organic aerosol (SOA) is a lumped product (SOAS) with a molecular weight of 150 g mol−1. For comparison to observations, primary organic aerosol (POA) is defined as OCPO and SOA is the sum of OCPI and SOAS. The sulfate–nitrate–ammonium (SNA) aerosol simulation (Park, 2004) includes the addition of metal-catalyzed oxidation of SO2 (Alexander et al., 2009), sulfur oxidation by reactive halogens (Chen et al., 2017), and improved implementation of aerosol cloud processing as well as revised uptake coefficients for NO2 (Holmes et al., 2019). Uptake of N2O5 on SNA includes dependence on aerosol water, organic coatings, nitrate aerosol fraction, and particulate chloride (McDuffie et al., 2018). SNA partitioning is calculated with ISORROPIA v2.2 (Pye et al., 2009). The model includes accumulation-mode (SALA) and coarse-mode (SALC) sea salt aerosol (Alexander et al., 2005; Jaeglé et al., 2011) and dust in four size bins (DST1 to 4) (Fairlie et al., 2010); the first bin and 38 % of the second bin are included in PM2.5. The recommended definition of dry PM2.5 is given by Eq. (1).
The AirKorea PM2.5 observations provided by NIER are obtained using the beta-ray attenuation method (BAM-1020, Table 1). We do not adjust modeled PM2.5 for any measurement relative humidity effects as the BAM-1020 has been shown to perform well against federal reference method monitors (Le et al., 2020).
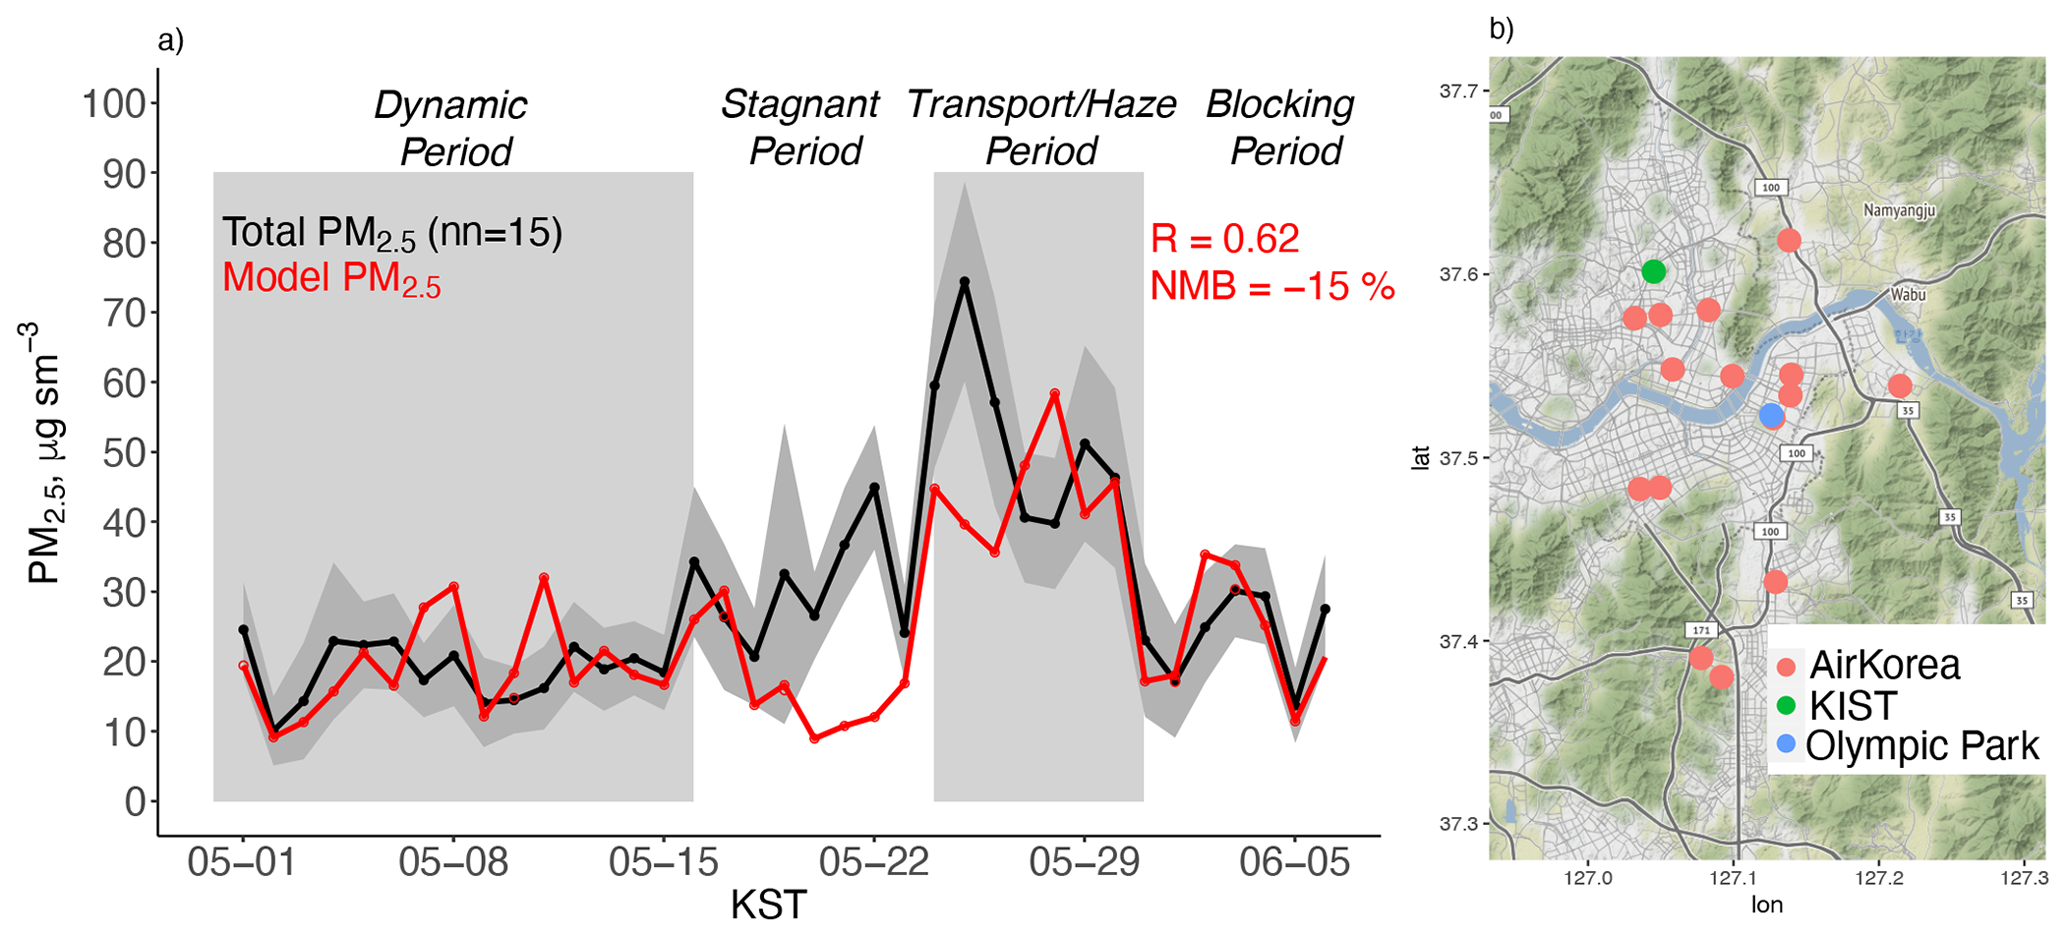
Figure 1(a) Model simulation of PM2.5 during KORUS-AQ compared against the mean observations at the 15 AirKorea sites in the (b) GEOS-Chem model grid box containing Olympic Park and KIST. The gray shading shows the observed standard deviation. The correlation coefficient (R) and normalized mean bias (NMB) are inset. Map tiles by Stamen Design under CC BY 3.0. Data by ©OpenStreetMap contributors under ODbL.
Specific details of production of model nitric acid (HNO3), the gas-phase precursor to aerosol nitrate ( = pNO3), are provided below as KORUS-AQ provides detailed observations of this chemistry. Reactions (R1)–(R6) describe model production of HNO3 from oxidation of NO2 (Reaction R1), aqueous uptake and reaction of N2O5, NO2, and NO3 on aerosol (Reactions R2, R4, and R5), aqueous uptake and reaction of N2O5 and NO3 in cloud water (Reactions R3 and R5), and oxidation of VOCs by the nitrate radical (Reaction R6). Heterogeneous halogen chemistry is provided in Table S2. In Reaction (R2), aqueous uptake and reaction of N2O5 with particle chloride (Cl−) produces nitryl chloride (ClNO2) with a yield (∅) of 1 on sea salt aerosol and zero on all other aerosol types.
Table 3Modeled vs. observed PM2.5 composition.
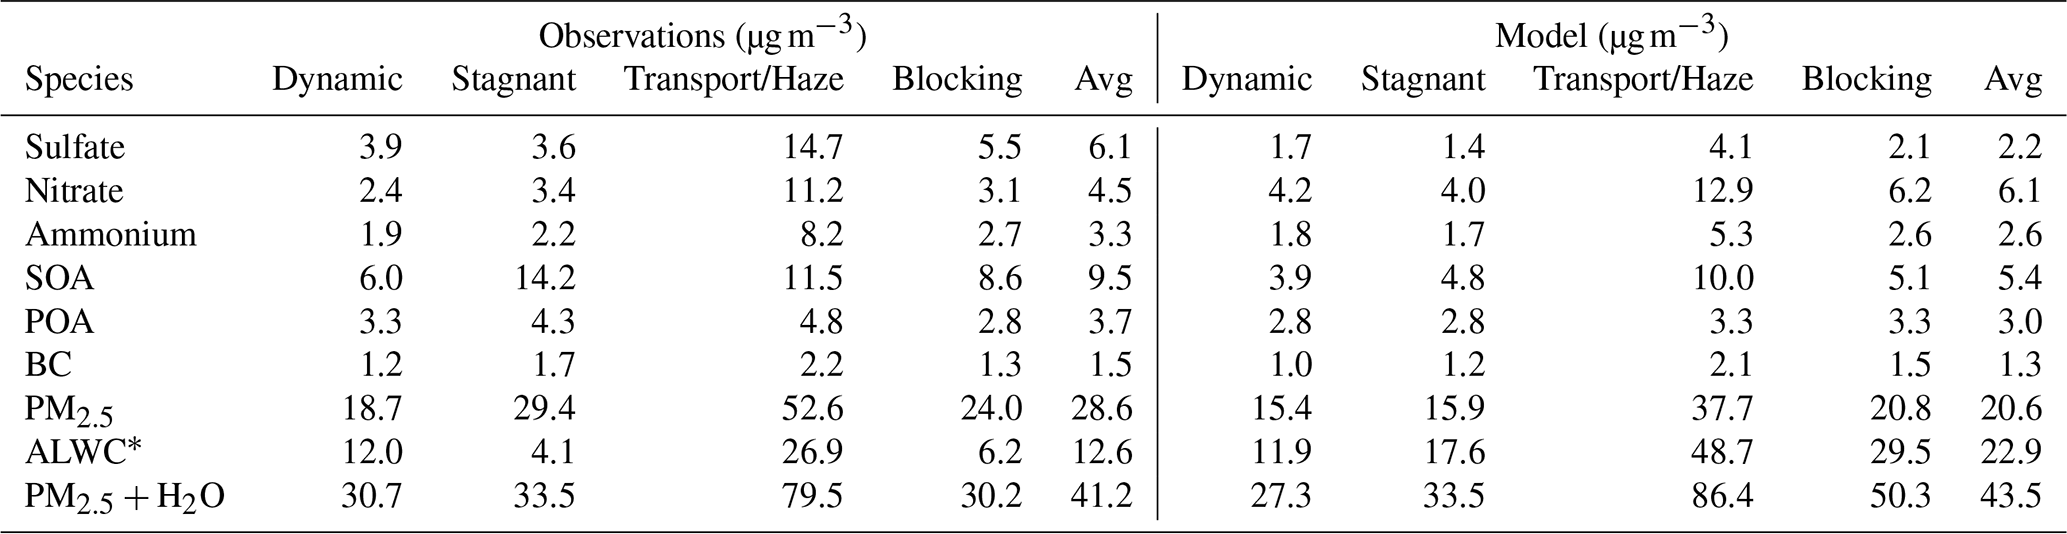
∗ Aerosol liquid water content (ALWC) is calculated using E-AIM from temperature at KIST, the 50th percentile of RH across the AirKorea sites in Fig. 1b, and the speciated PM2.5 components from Fig. 2.
Figure 1a shows the model simulation of daily average PM2.5 (Eq. 1) compared to the observed average of the 15 AirKorea sites within the GEOS-Chem grid box containing the major SMA monitoring sites (KIST and Olympic Park). These two sites are in close proximity to the AirKorea monitors (Fig. 1b). Campaign average PM2.5 is 29 µg m−3, but this increases to 53 µg m−3 during the Transport/Haze period (Table 3). The model reproduces the low PM2.5 during the Dynamic period, the increase during the Transport/Haze period, and the variable concentrations during the Blocking period. Across the campaign, the model underestimates PM2.5 (NMB = −15 %) due to a low bias during the Stagnant period and the initial buildup during the Transport/Haze period. This model performance is similar to Choi et al. (2019) using a different GEOS-Chem configuration.
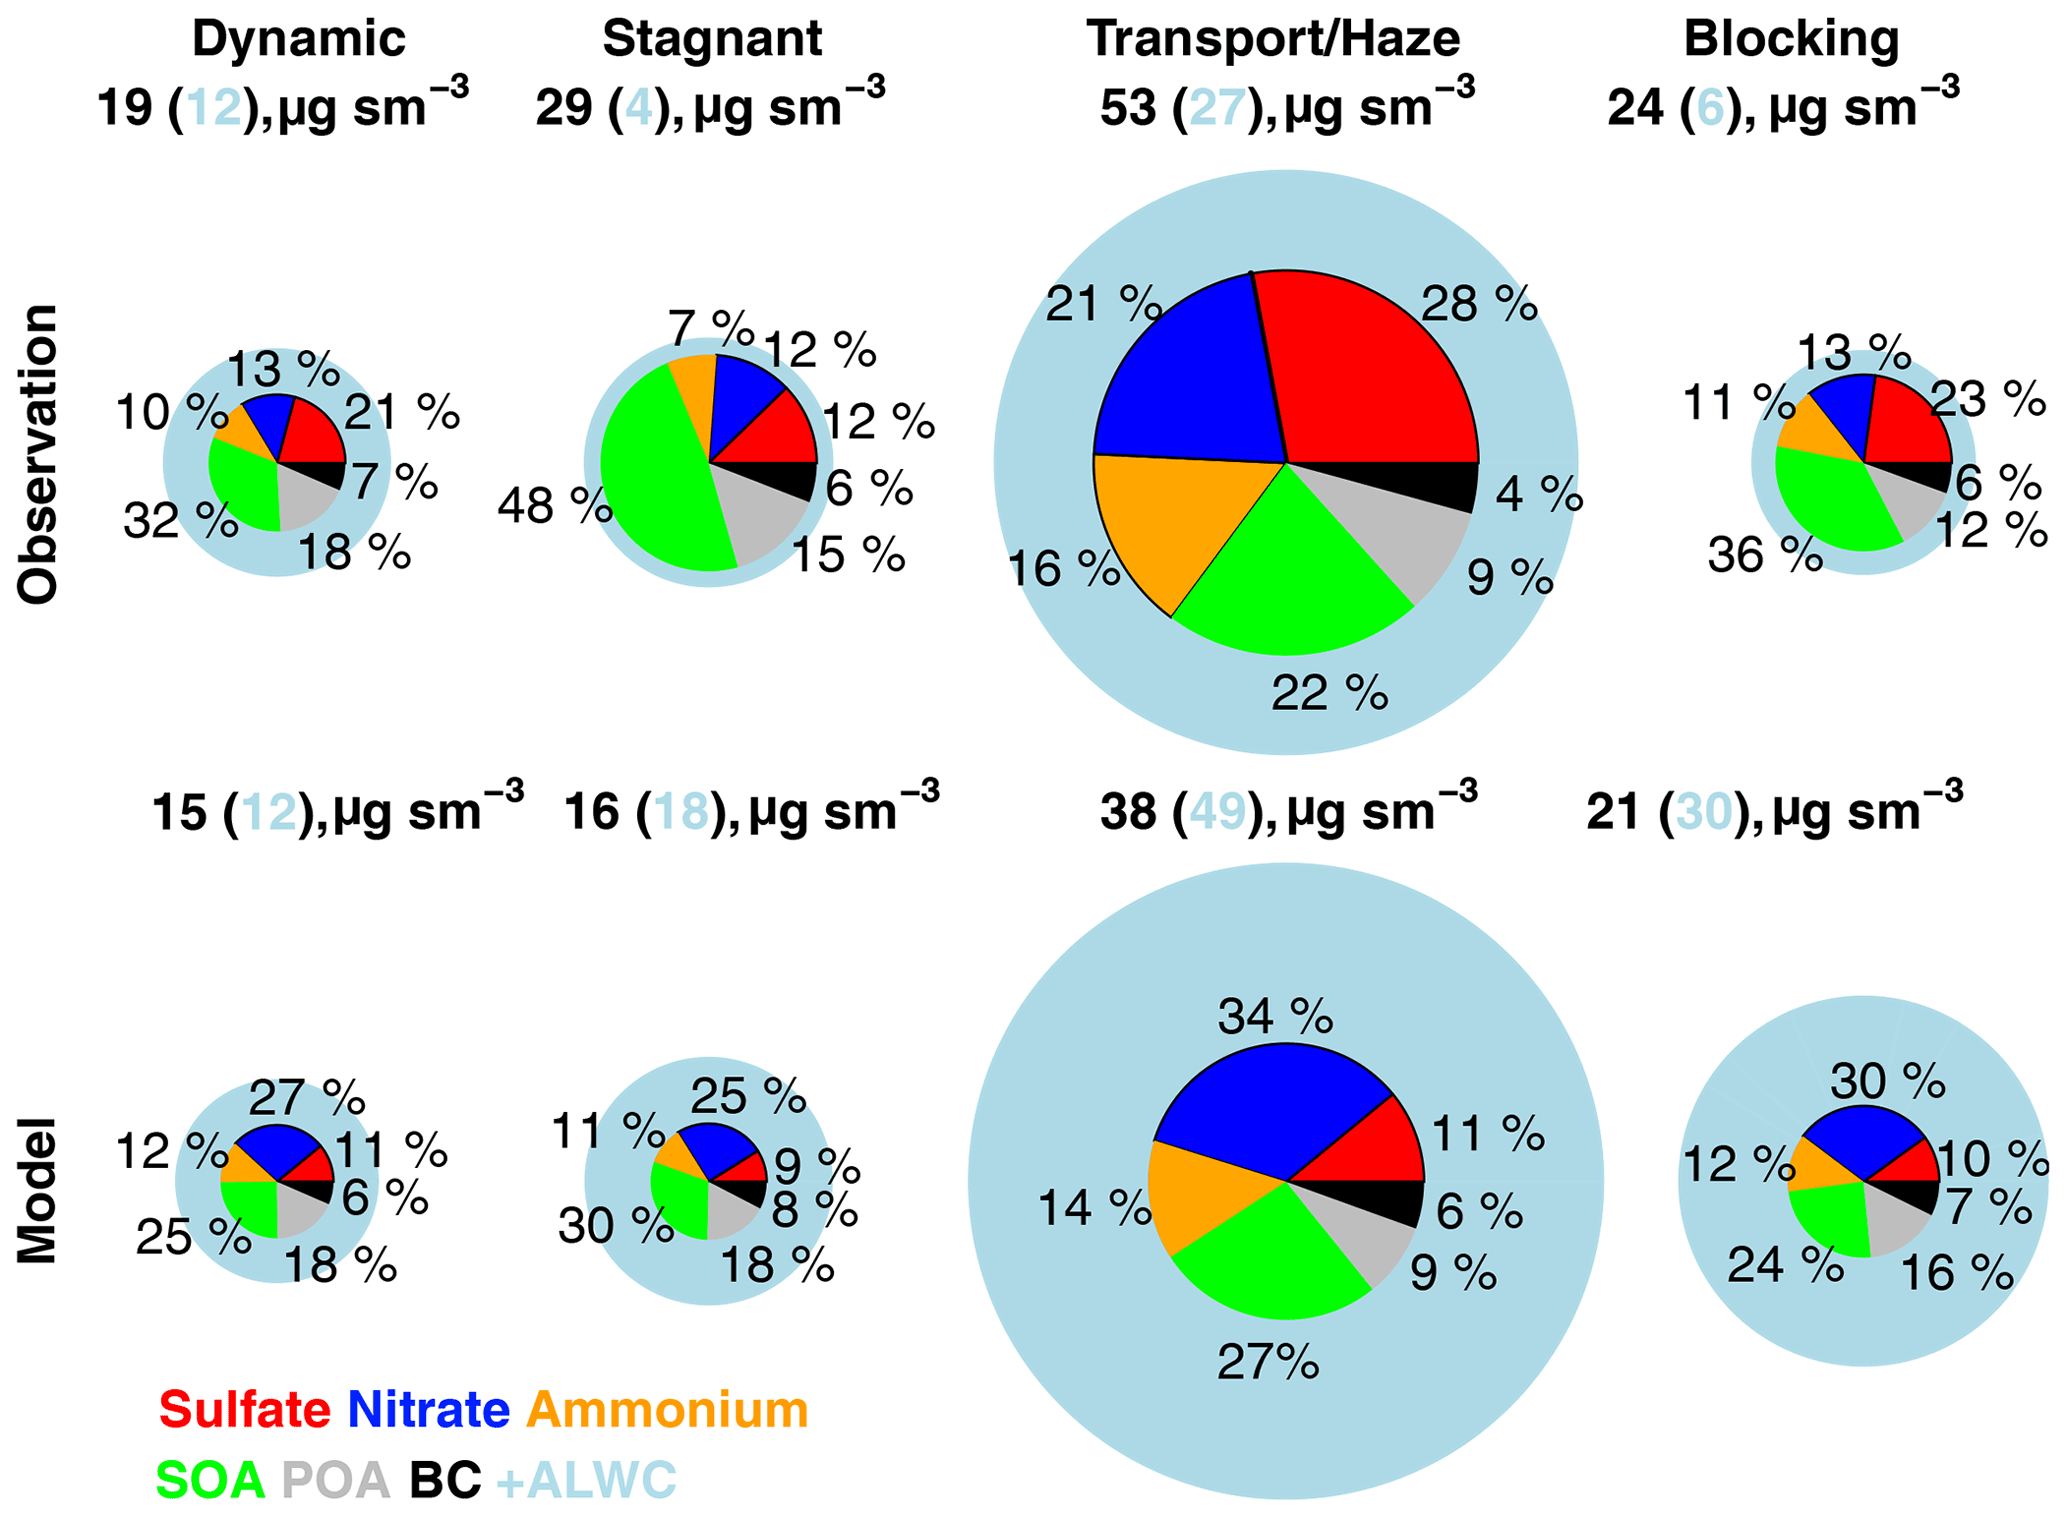
Figure 2Model simulation of PM2.5 compared against observations wherein the fractional source contributions are calculated from KIST and applied to the mean AirKorea PM2.5 observations from Fig. 1 during the four meteorological periods. Figure values are shown in Table 3. The radius of each pie chart is scaled to the maximum value of modeled or observed PM2.5 (53 µg m−3). The blue circles show the aerosol liquid water content (ALWC) associated with PM2.5. The sulfate–nitrate–ammonium components are bordered in black to guide the reader.
Figure 2 compares observed PM2.5 composition against the model for the grid box containing the KIST ground site. Speciated PM2.5 is derived from KIST PM1 composition and AirKorea PM2.5 mass as described in Sect. S2, as the difference in composition between PM1 and PM2.5 is expected to be minor (Sun et al., 2020; Schlosser et al., 2022). PM2.5 is provided for each meteorological period in Table 3. Figure 2 and Table 3 include the ALWC associated with PM2.5, calculated for the observations using the Extended Aerosol Inorganics Model (E-AIM) IV (Clegg and Brimblecombe, 1990; Clegg et al., 1998; Massucci et al., 1999; Wexler and Clegg, 2002; Nault et al., 2021), and ISORROPIAv2.2 (Pye et al., 2009) in GEOS-Chem. During KORUS-AQ, Kim et al. (2022) found that ISORROPIAv2.2 provided similar results as E-AIM, reproducing E-AIM pH within ∼ 0.4 units.
On average, the model simulates SNA within 20 %. However, this is due to compensating biases, which has implications for controlling precursor species. The model underestimated sulfate (−64 %), overestimated nitrate (+36 %), and underestimated SOA (−43 %). The excess model nitrate is the primary driver of overestimated ALWC (+82 %). During the Stagnant period, the model low bias is primarily due to underestimated SOA (−9 µg m−3). This may be due to missing local production from emissions of semi-volatile and intermediate-volatility volatile organic compounds (S/IVOCs, McDonald et al., 2018) and aromatics (Nault et al., 2018), primarily attributable to solvents and vehicle emissions (Shin et al., 2013a, b; Simpson et al., 2020). During the Dynamic and Blocking periods, the model PM2.5 bias is within 20 % of the observations but with overestimated nitrate and underestimated sulfate. The model severely underestimates sulfate during the Transport/Haze period (−11 µg m−3, Table 3), suggesting that the model fails to reproduce the processes driving the pollution episode. Jordan et al. (2020) showed that cloudy and humid conditions during the Transport/Haze period increased PM2.5 through heterogeneous production of SNA, and this is not included in the model.
The KORUS-AQ aircraft observations included detailed daytime (available from ∼ 08:00 to 16:00 KST) aerosol and gas-phase observations that we use to determine the cause of model sulfate and nitrate biases as well as their regional extent. Model SOA biases will be the subject of future work as here they do not contribute to PM2.5 exceedances. The KORUS-AQ campaign included frequent sampling along a repeated flight pattern or “stereo route” over the SMA up to three times a day, supplemented by less frequent flights to investigate specific source regions or transport events (Crawford et al., 2021). Figure S2 shows the high data density in the SMA compared to the rest of the study region. We use the 55 descents over Olympic Park from the SMA stereo route to compare against the daily surface observations shown in Fig. 2.
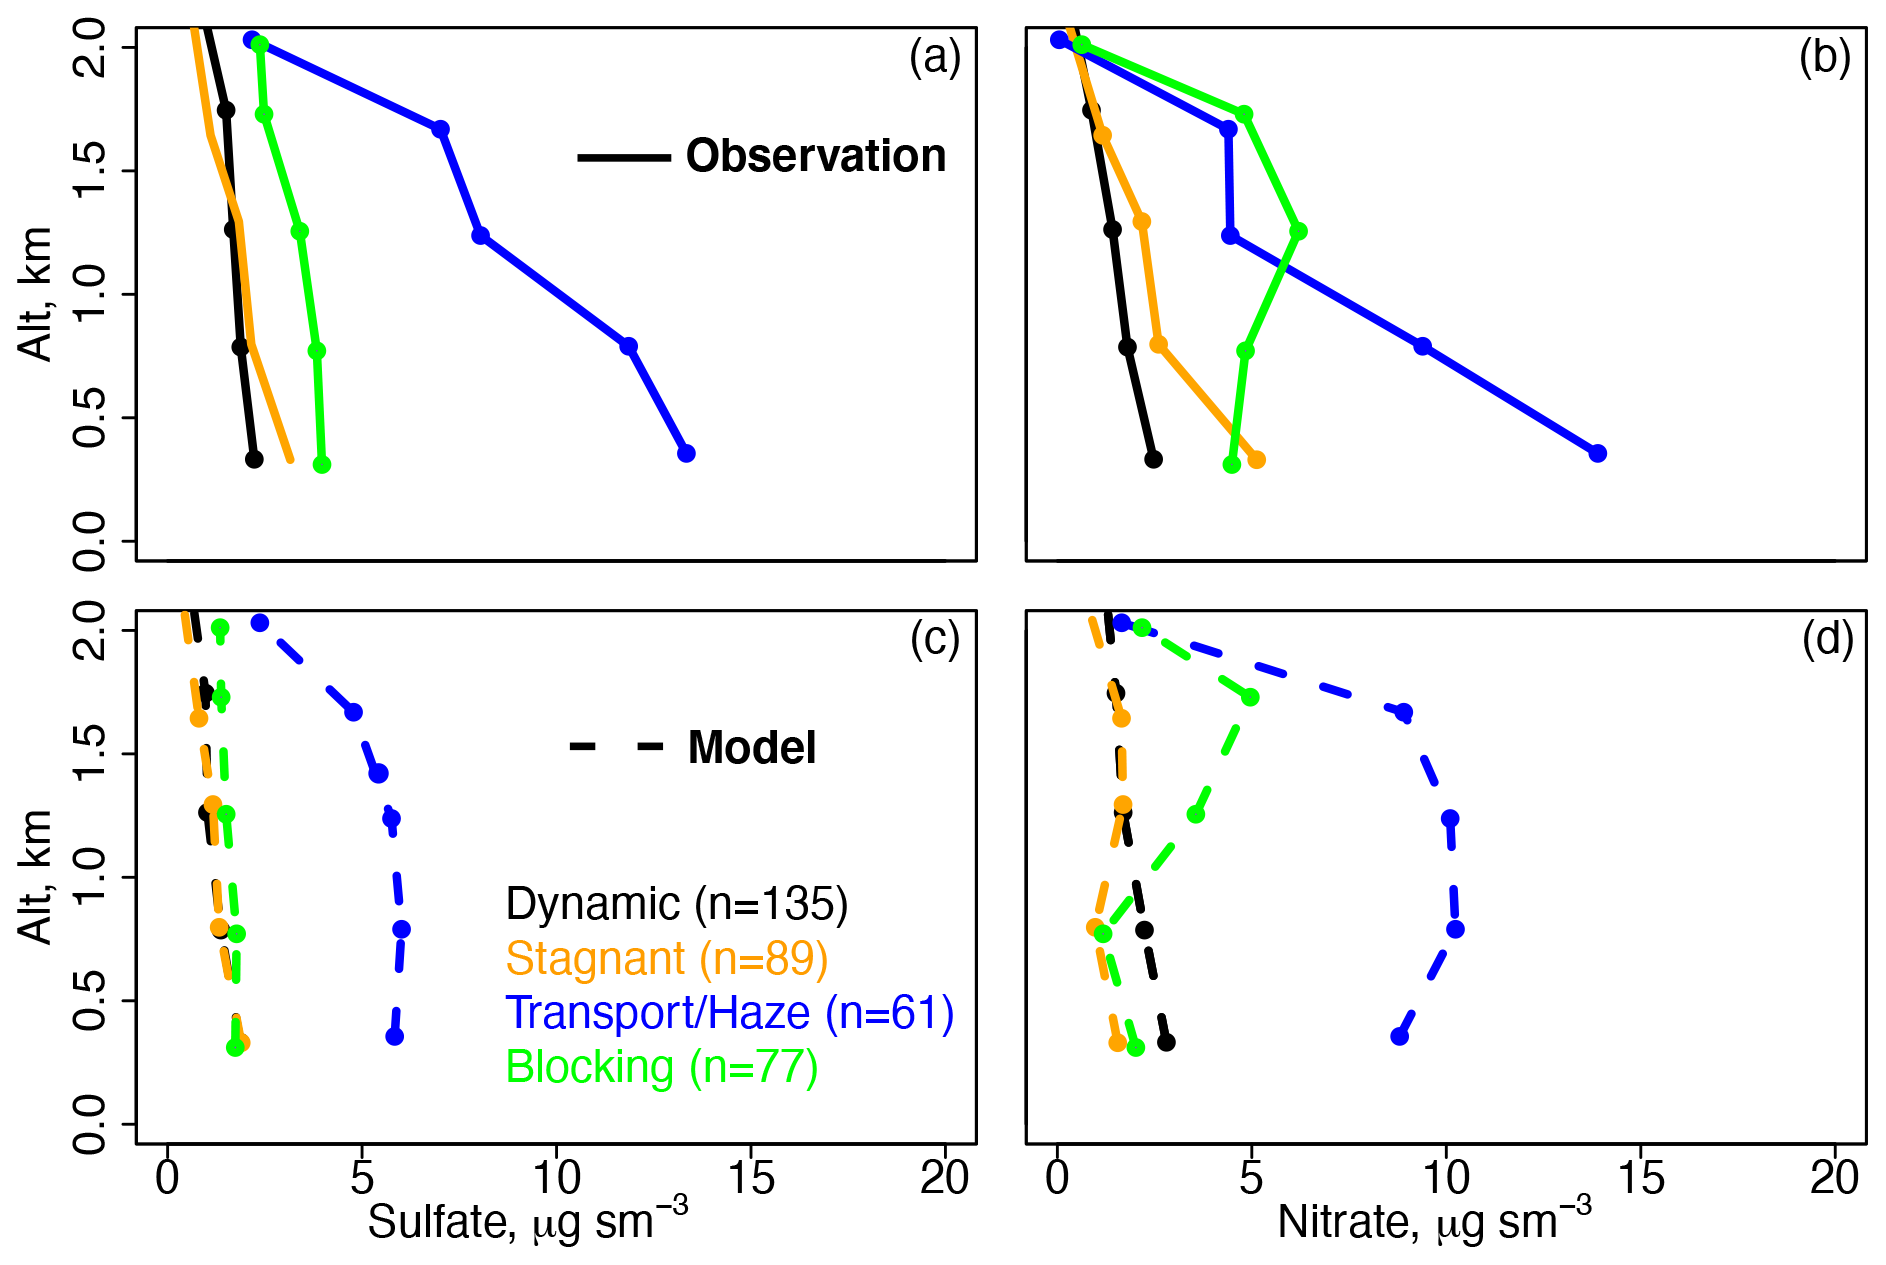
Figure 3Mean vertical profiles of (a) observed sulfate, (b) observed nitrate, (c) model sulfate, and (d) model nitrate for the descents over Olympic Park for each meteorological period. The observations (solid lines) and model (dashed lines) are binned to the nearest 0.5 km below 2 km.
Figure 3 shows the mean daytime aircraft profiles of sulfate and nitrate for the descents over Olympic Park below 2 km separated by the same meteorological periods as Fig. 2. The corresponding profiles for SO2 and nitric acid are shown in Fig. S3. The model is sampled along the flight tracks, and both the model and the observations are averaged to the model grid, time step, and nearest vertical 0.5 km. Similar to the daily surface average, the model underestimates daytime sulfate below 2 km, with the most severe bias (−8 µg m−3 in the lowest altitude bin of 0.5 km) occurring during the Transport/Haze period. Unlike in the daily surface average, the model underestimates daytime nitrate below ∼ 1 km with the exception of the Dynamic period. The model nitrate underestimate could be related to low model relative humidity (RH) of up to −3 % (Stagnant period, 28 % vs. 31 %) below 0.5 km (Fig. S3) or overestimated mixed layer height (Oak et al., 2019). Recent work suggests that model aerosol dry deposition is too fast, but this would increase model concentrations by only ∼ 10 % (Emerson et al., 2020).
There is no available measurement of PM2.5 from the aircraft to provide scaling from PM1 to PM2.5 as was done for Fig. 2 and described in Sect. S2. However, any increase in the observed profiles of PM1 sulfate or nitrate to account for possible growth to larger sizes would exacerbate the model underestimate of these species. The discrepancy between the model low to minimal bias against daytime aircraft nitrate observations (Fig. 3) and the overestimate against daily average nitrate at the KIST ground site (Fig. 2) imply a failure of the model to represent nighttime chemical production. We investigate the possible causes of overestimated daily average model nitrate in Sect. 5 and underestimated model sulfate in Sect. 6.
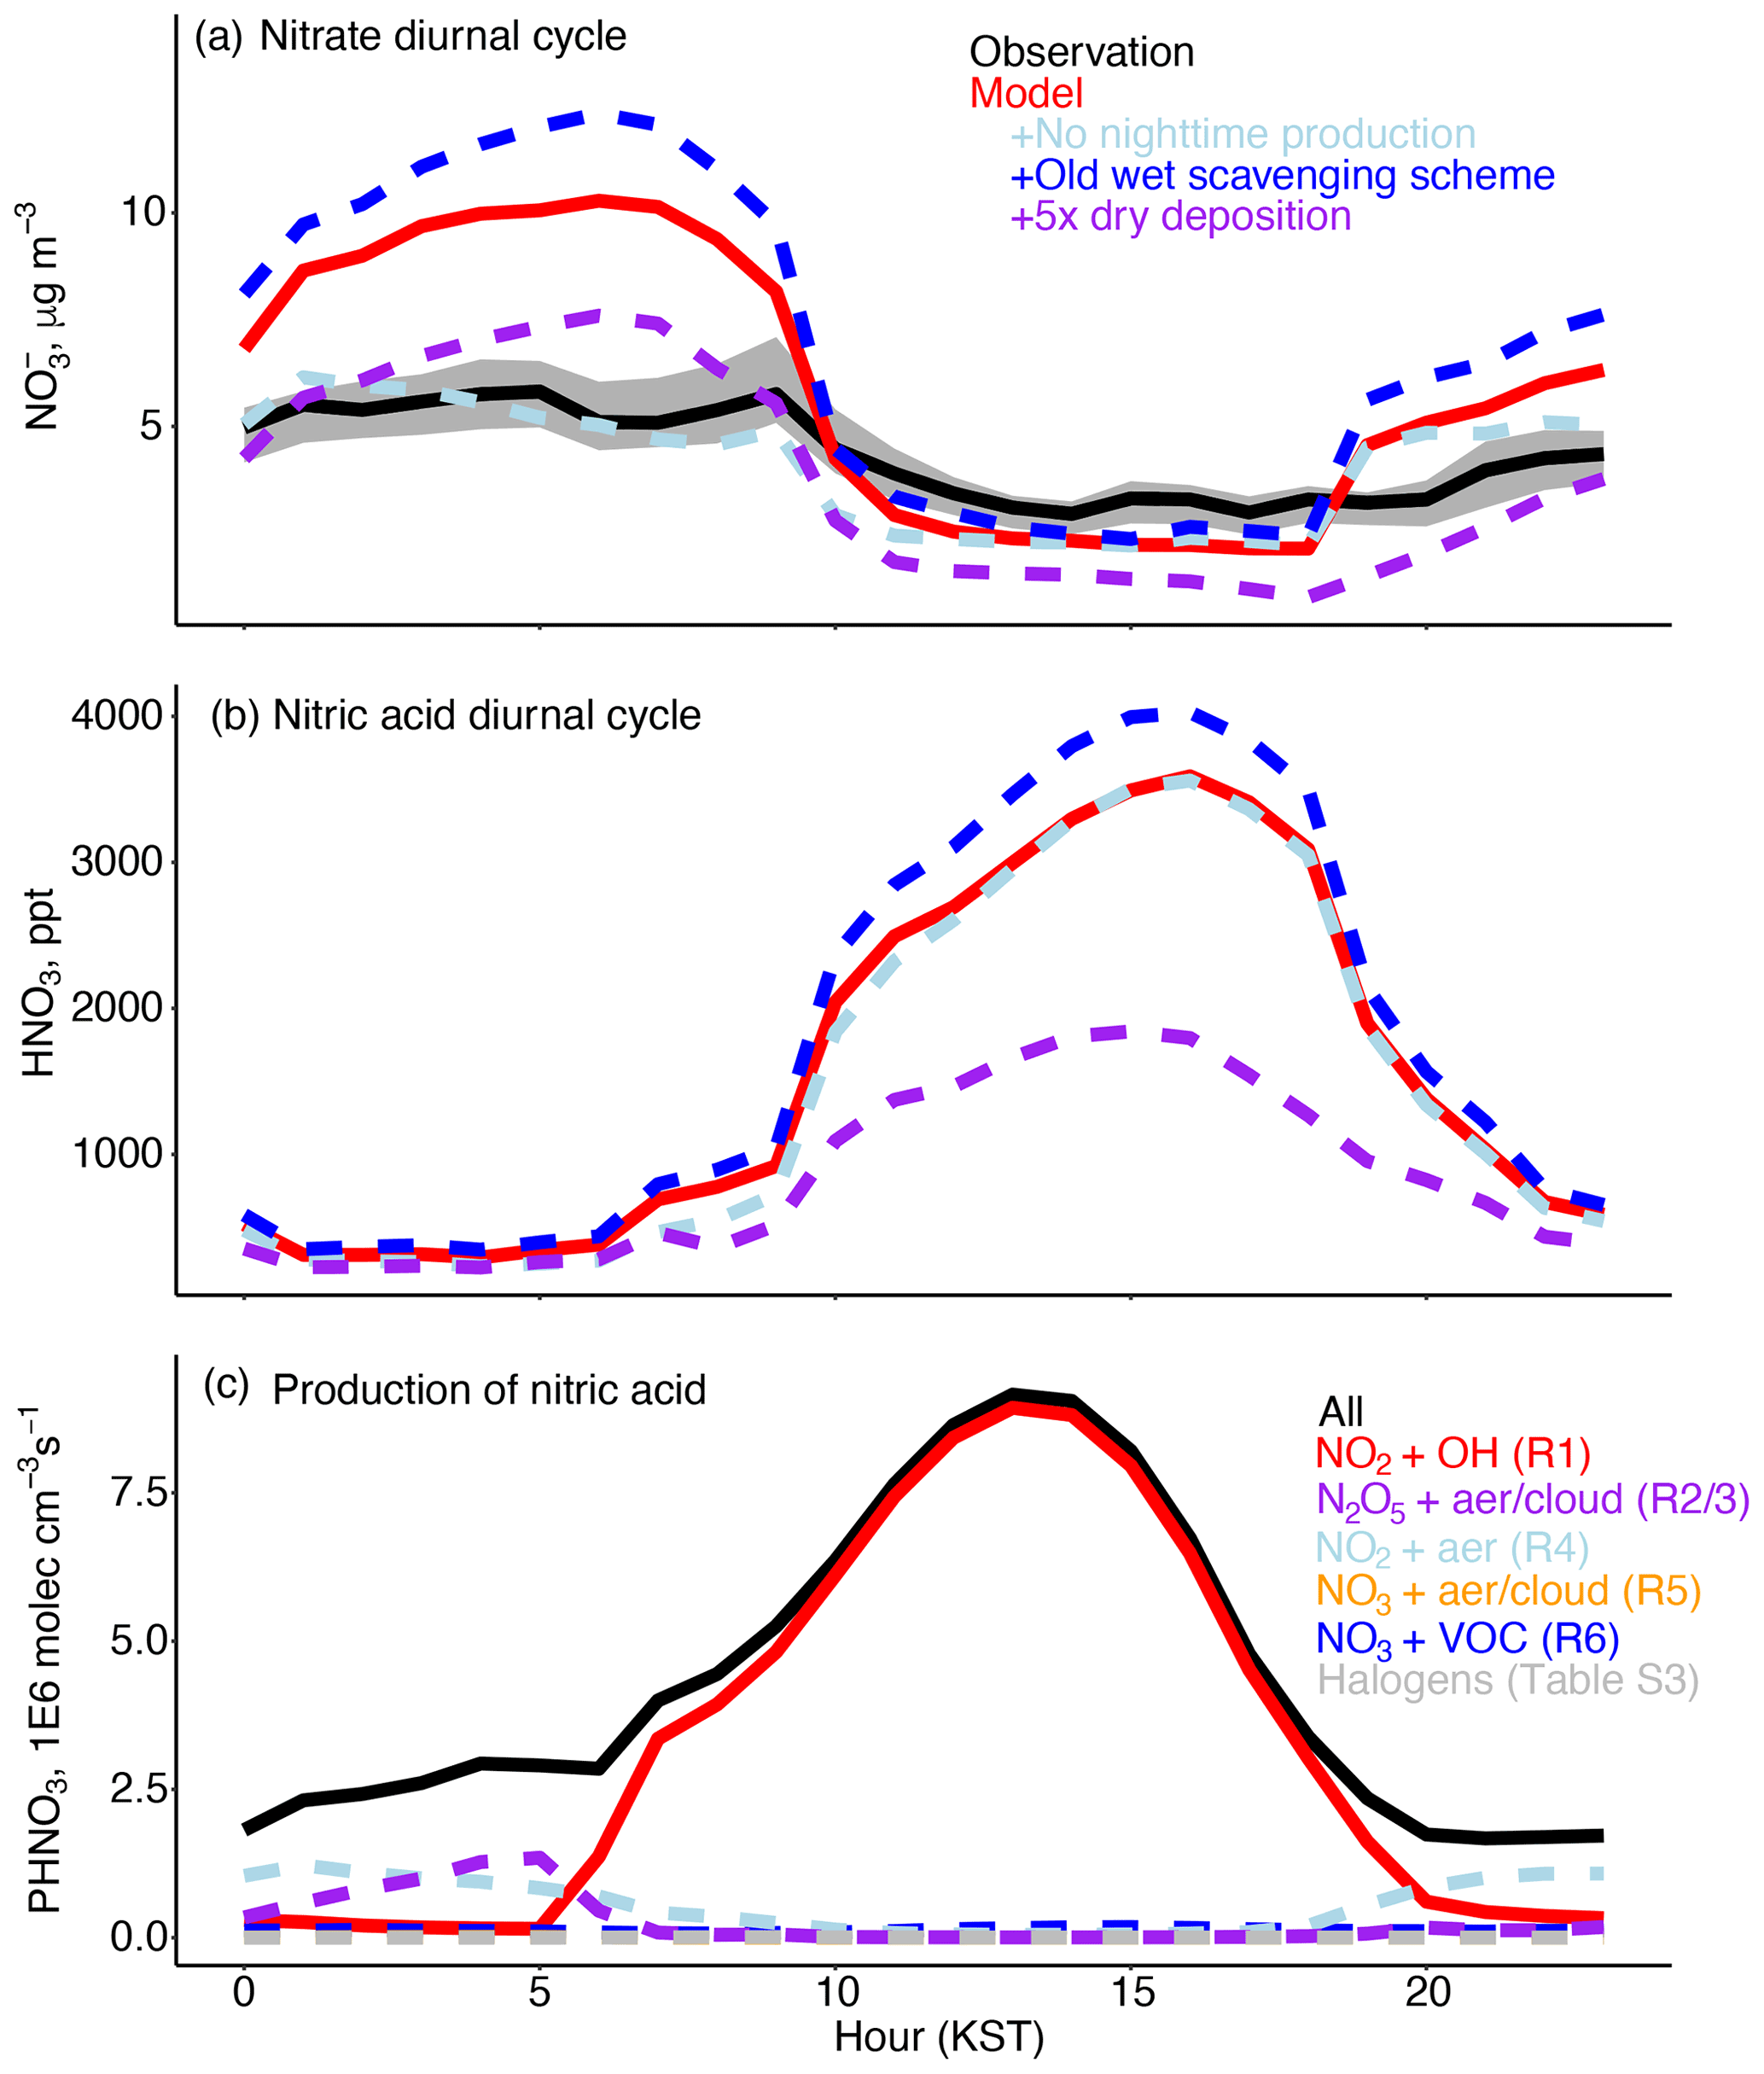
Figure 4(a) Mean hourly modeled vs. observed nitrate derived from PM2.5 observations in the GEOS-Chem grid box and KIST speciated composition as described in Sect. 4 for 1 May to 7 June 2016. The gray shading indicates the observed 25th to 75th percentile across the grid box. The model sensitivity studies are described in Sect. 5. (b) Mean model nitric acid diurnal cycle. (c) Mean model reactions that produce HNO3 as described in Sect. 3.
The discrepancy between the model daytime vs. daily average performance for nitrate demonstrates the need to evaluate the model nitrate diurnal cycle. Figure 4a shows the observed nitrate component of PM2.5 calculated from PM1 composition and PM2.5 mass as described in Sect. S2. Between 06:00 and 18:00 KST (daytime) the model bias is minimal (< 1 µg m−3), while the bias from 18:00 to 06:00 KST (nighttime) is +3 µg m−3. As described in Sect. 3, the model has a newly revised treatment of wet scavenging that significantly reduces the model nitrate and nitric acid biases present in previous model versions (Luo et al., 2019). Without this improvement, the model would have an average nighttime bias of +7 µg m−3. Figure S4 shows daily precipitation in Seoul from the Korea Meteorological Administration (KMA, 2021), which was infrequent and negligible in the later part of the campaign. The model underestimate in total precipitation across the campaign is minimal (121 vs. 112 mm). Insufficient wet scavenging is unlikely to be the cause of the remaining model nitrate bias.
Table 4Description of model experiments.
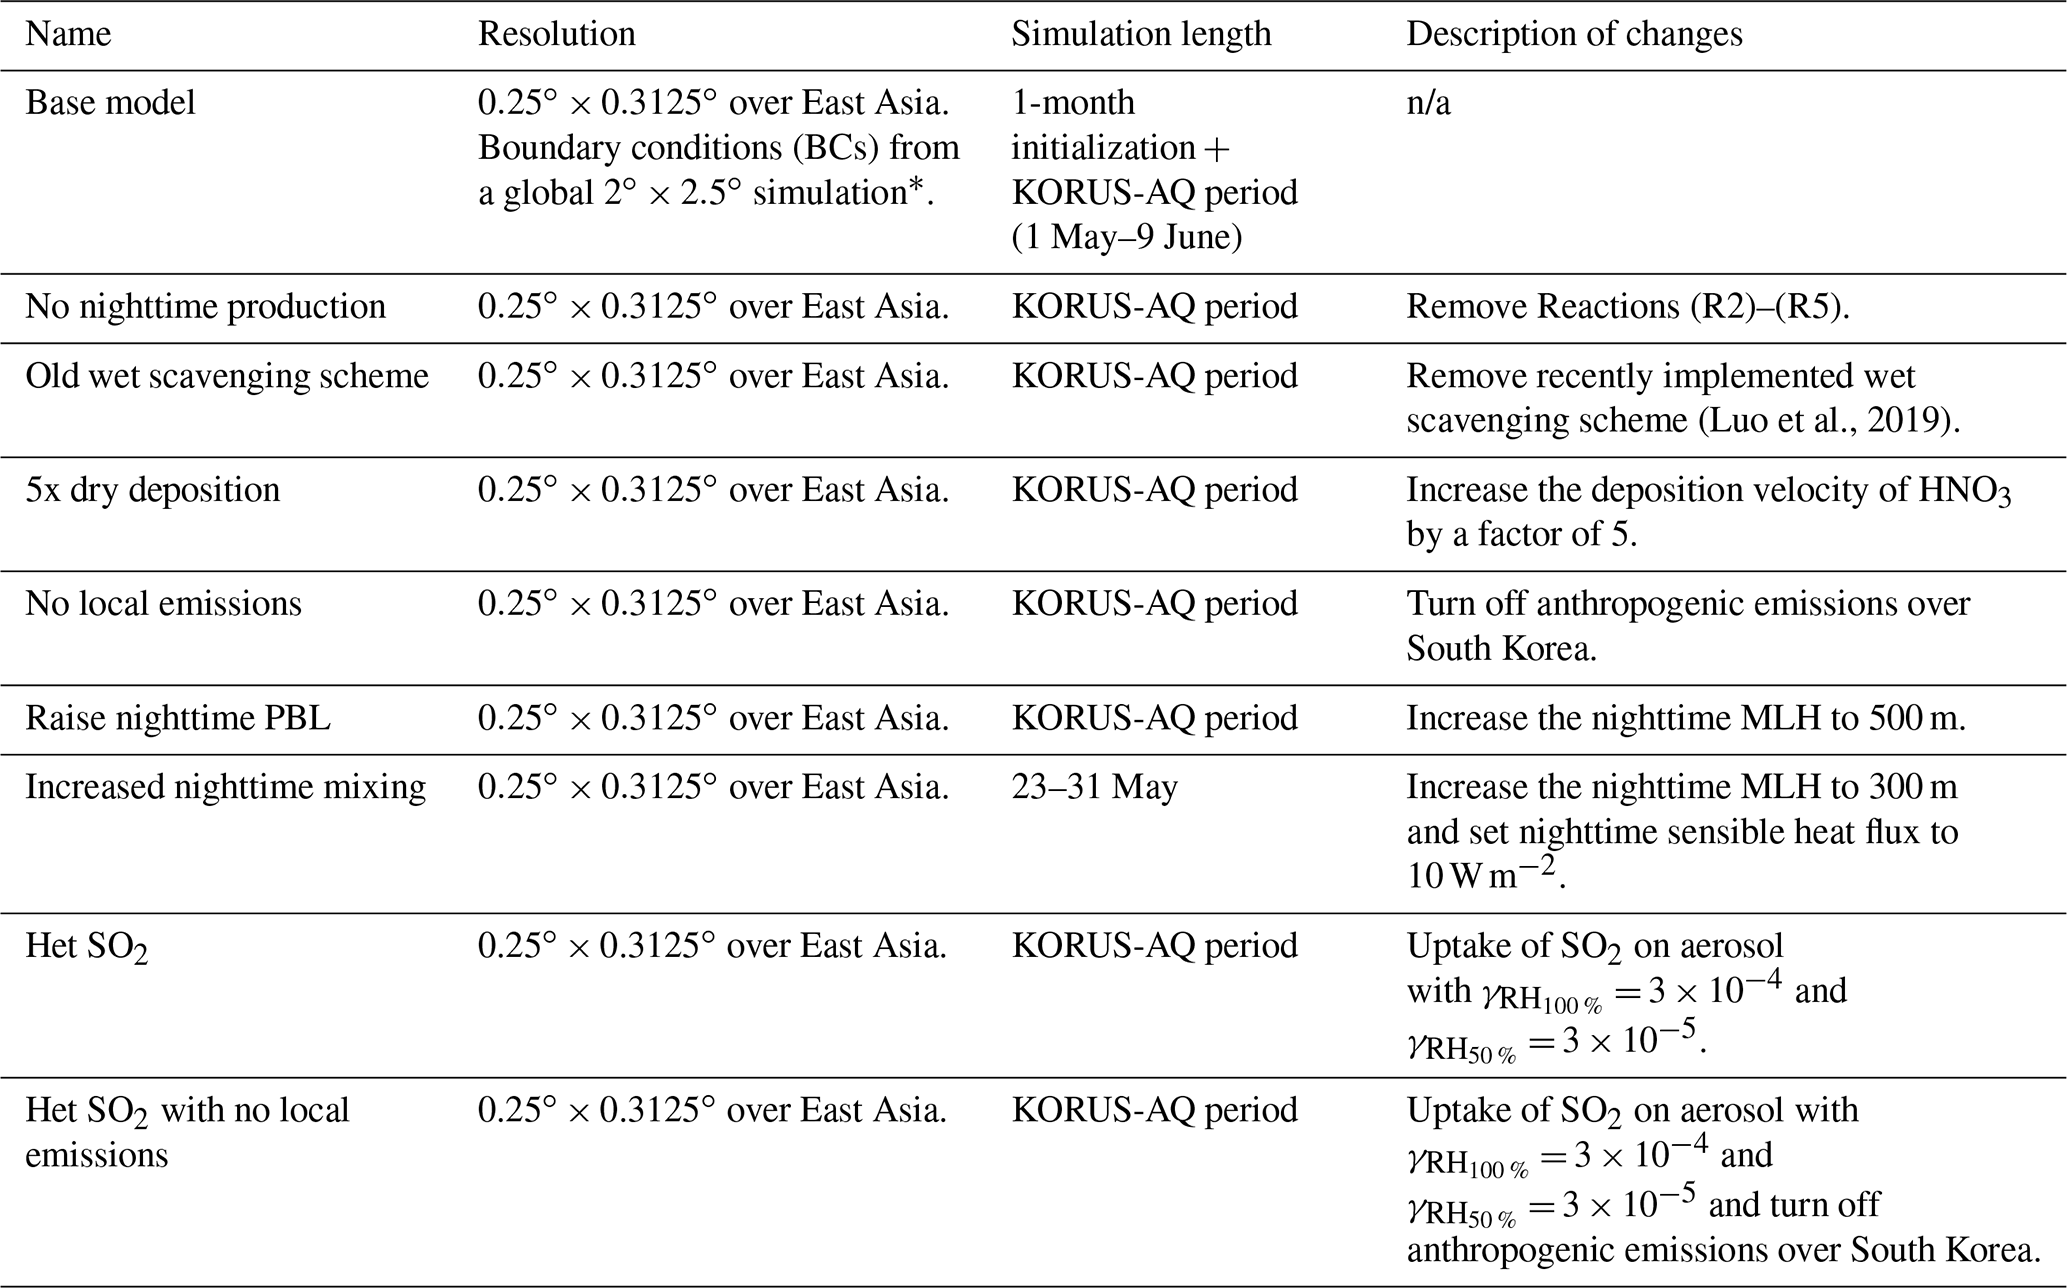
∗ Boundary conditions from the base simulation are applied to all sensitivity simulations. n/a: not applicable.
We perform a sensitivity test (Table 4) to determine the relative impact of daytime (Reaction R1) vs. nighttime (Reactions R2–R5, Sect. 3) production of HNO3 on the model bias by shutting off the nighttime reactions. Figure 4c shows that the main model nighttime pathway is aerosol uptake of NO2 (Reaction R4), with a small contribution from N2O5 hydrolysis (Reactions R2 and R3) in the early morning hours. Figure 4a shows that removing nighttime chemistry results in improved early morning agreement (01:00 to 08:00 KST), but the evening overestimate (20:00 to 01:00 KST) is less affected. Jordan et al. (2020) showed observational evidence for significant nighttime production of nitrate by N2O5 hydrolysis (Reaction R2). We use the removal of nighttime chemistry to hypothesize that part of the model nighttime bias is due to excess daytime HNO3 that has not yet been lost to deposition and is converted to nitrate as conditions become thermodynamically favorable for partitioning to the aerosol phase. The dominance of NO2 uptake over N2O5 hydrolysis in the model suggests that there are additional errors in simulated nighttime chemistry.
5.1 Sensitivity of model nitrate bias to gas-phase precursors
Inorganic aerosol ammonium nitrate (NH4NO3) is formed by dissolution of HNO3, which reacts in the aqueous phase with ammonia (NH3) to establish a thermal equilibrium with NH4NO3. The conditions that favor NH4NO3 are generally cool and humid (i.e., nighttime) and are characterized by high NH3 and HNO3 concentrations relative to sulfate (Guo et al., 2016). We calculate that average nighttime RH (temperature) in the SMA is 69 % (291 K) compared to the model value of 67 % (291 K), indicating that significant errors in RH or temperature are not the cause of nighttime biases. Overproduction of model nighttime nitrate could be due to overestimated NH3 if this species limits NH4NO3 production. In South Korea, and generally East Asia, NH4NO3 is limited by availability of HNO3. This is due to high levels of NH3 (∼ 10 ppb) observed in East Asia, attributable to non-agricultural sources such as transportation (Song et al., 2009; Phan et al., 2013; Link et al., 2017; Sun et al., 2017; Chang et al., 2019; Lim et al., 2022). The model reproduces the expected high concentration of NH3 with an average of 9 ppb at Olympic Park. Ibikunle et al. (2020) performed a rigorous thermodynamic assessment of KORUS-AQ observations, confirming that aerosol was always sensitive to HNO3 in polluted conditions. Nitrate-limited SNA thermodynamics were observed in similar conditions in China and successfully represented by ISORROPIA v2.2 in GEOS-Chem (Zhai et al., 2021b).
Few datasets exist to further test the performance of HNO3–pNO3 partitioning in the model, but KORUS-AQ observations provide this opportunity. This partitioning is described by Eq. (2), wherein the ratio of pNO3 to total nitrate (TNO3 = HNO3 and pNO3), known as εNO3, is impacted by temperature, relative humidity, and aerosol composition (Guo et al., 2016, 2017).
Accurate simulation of εNO3 is critical to regulating the deposition of TNO3 as HNO3 deposits more rapidly than pNO3 (Nenes et al., 2021). Figure 5 shows εNO3 as a function of RH for the observations and the model for the same domain as Fig. 3 below 1.5 km. While the model represents the increase in εNO3 with RH, model εNO3 is generally underestimated, particularly at lower RH (< 50 %). This could be a result of underestimated ammonia, not measured during the campaign, or errors in model temperature and RH. As εNO3 is underestimated in the model, excess partitioning to the aerosol phase is not a cause of the model nitrate overestimate shown in Fig. 2. The successful performance of ISORROPIAv2.2 during KORUS-AQ is also evident from the comparison against E-AIM in Kim et al. (2022).
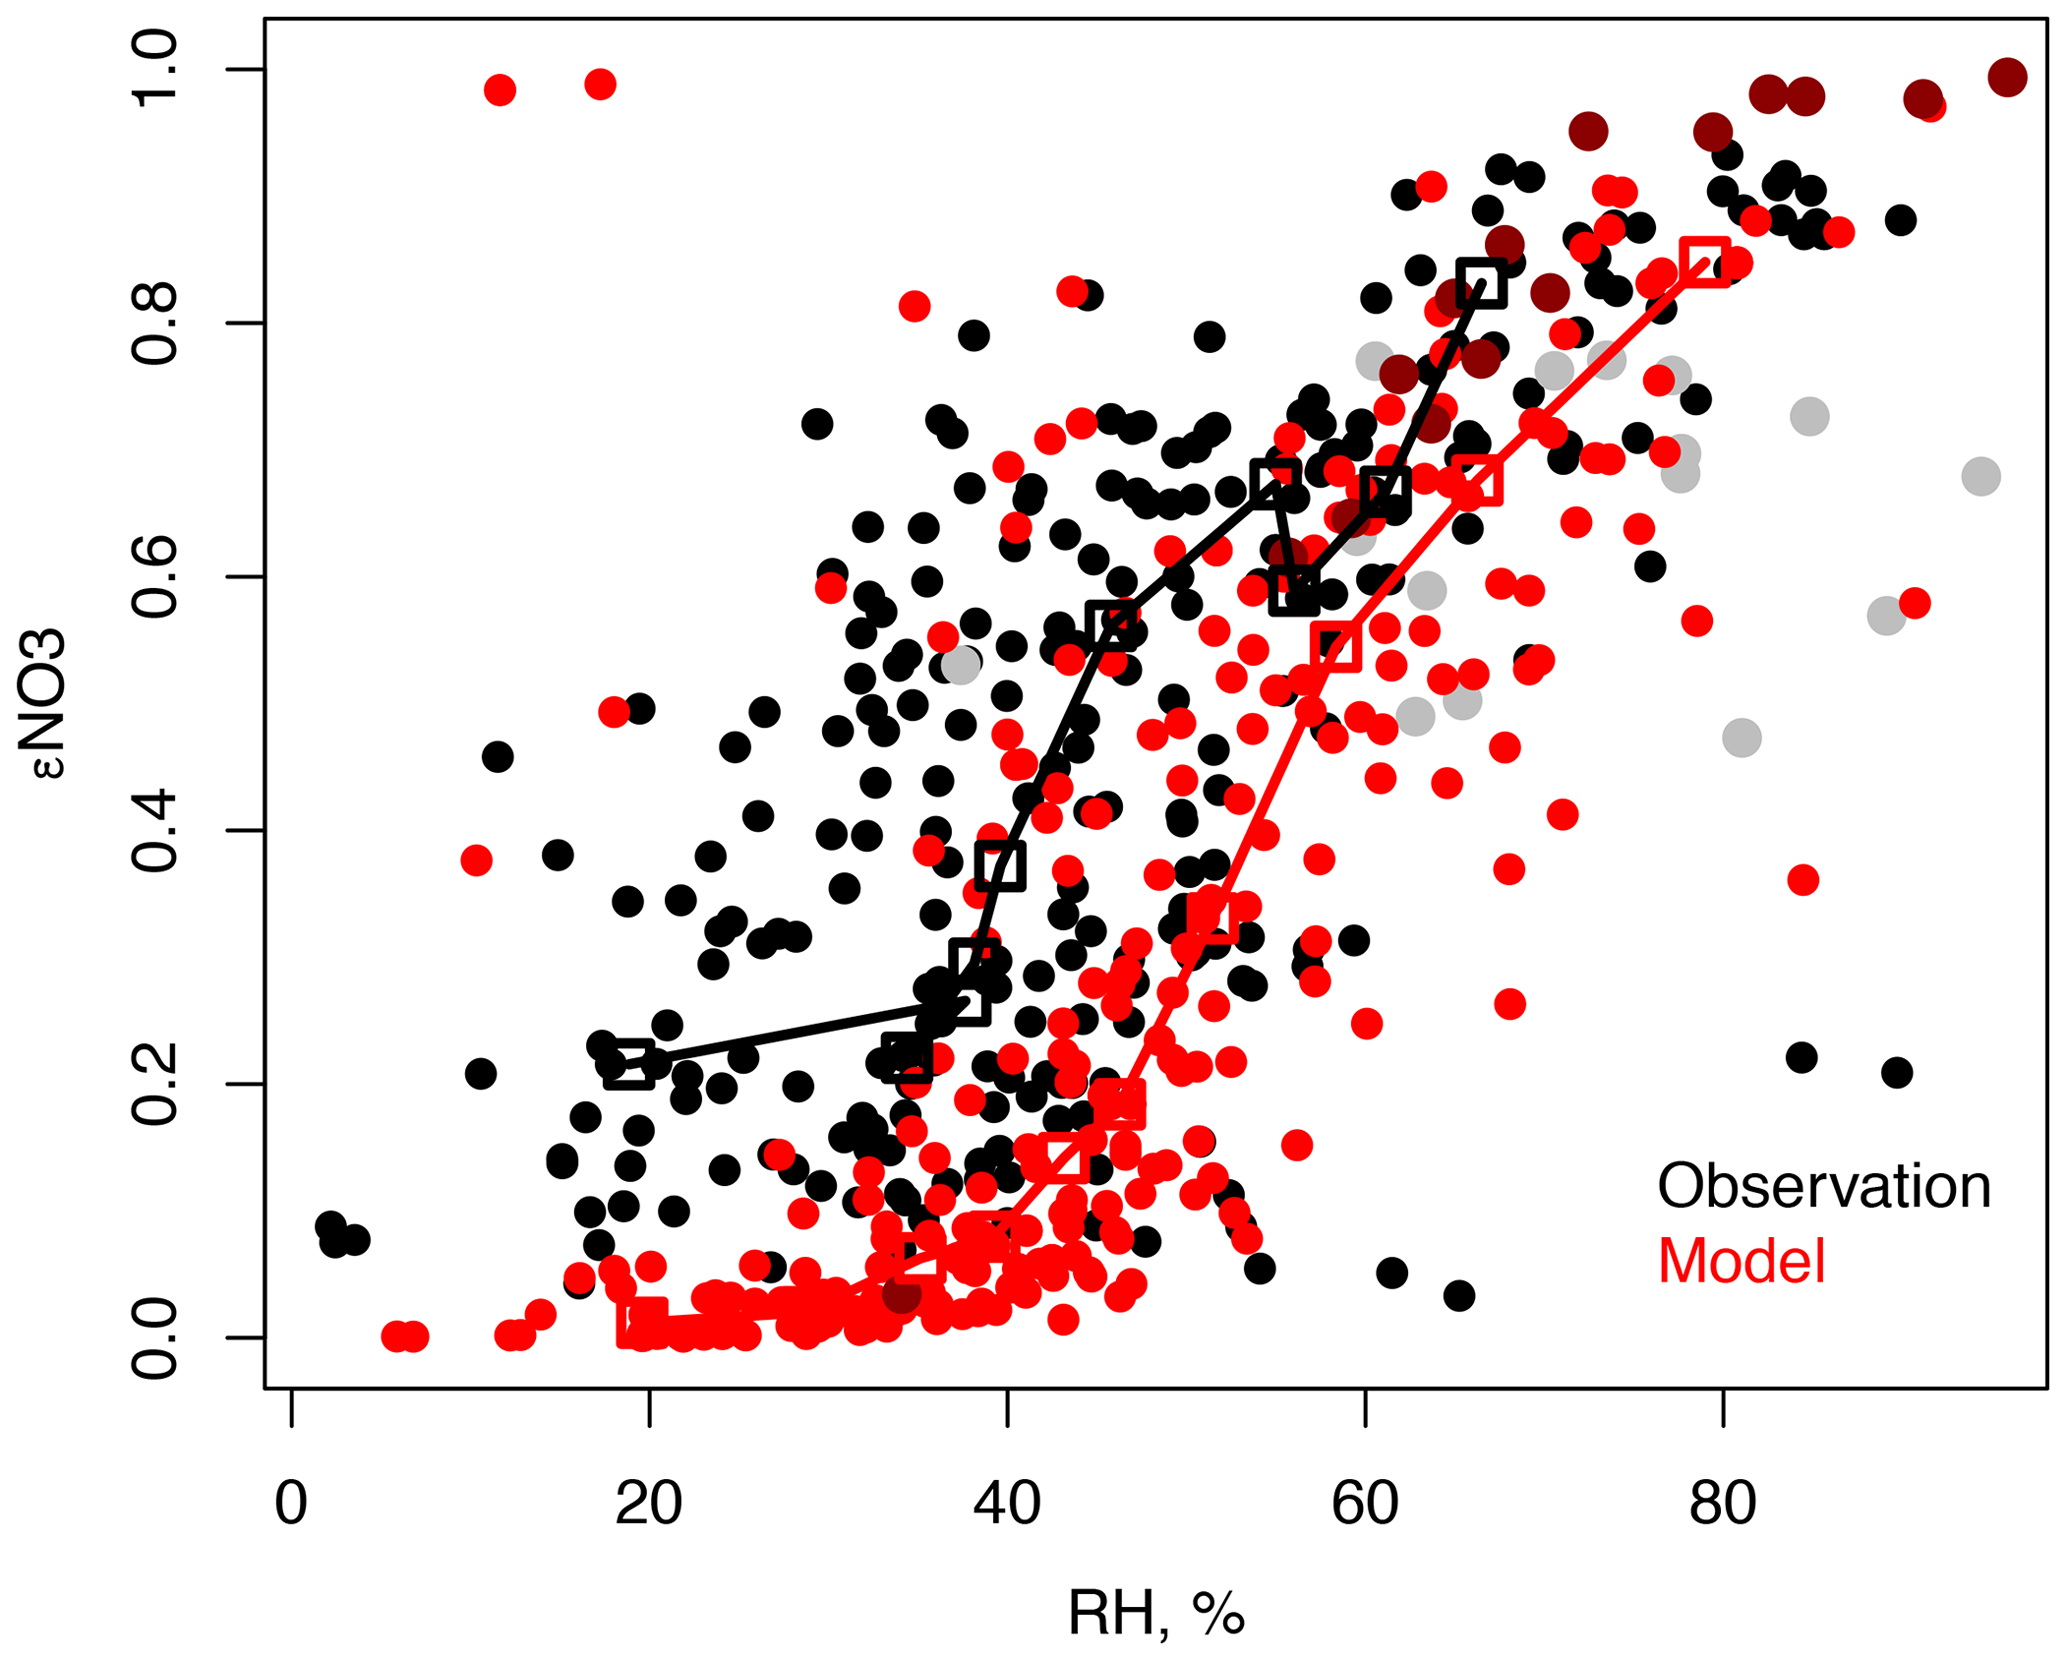
Figure 5Modeled and observed εNO3 as a function of RH below 1.5 km for the domain in Fig. 3. Median εNO3 as a function of size-binned RH, with each bin of equal size, is overlaid (squares). The haze buildup (24–26 May) is shown in gray for the observations and dark red for the model.
Figure 6a shows vertical profiles of observed and modeled HNO3 for the Olympic Park descents. The model overestimates HNO3 in the lowest bin (0.5 km) by +1600 ppt or +100 %. This high bias persists across most of the study domain except over the ocean south of 34∘ N (Fig. 7) where local emissions have a small impact and loss to deposition is slow. During average daytime conditions (∼ 50 % RH, 295 K), model εNO3 is ∼ 0.3, indicating that while the aerosol is HNO3-limited, higher temperatures and low RH also prevent the excess model HNO3 from partitioning to aerosol. A simulation turning off South Korean emissions shows that local sources contribute ∼ 50 % to model HNO3 concentrations below 0.5 km (Fig. 6a). Thus, while model errors in emissions or chemistry could be a cause of the bias, an overestimated lifetime of HNO3 against dry or wet deposition could also play a role. We evaluate these possibilities further in Sect. 5.2.
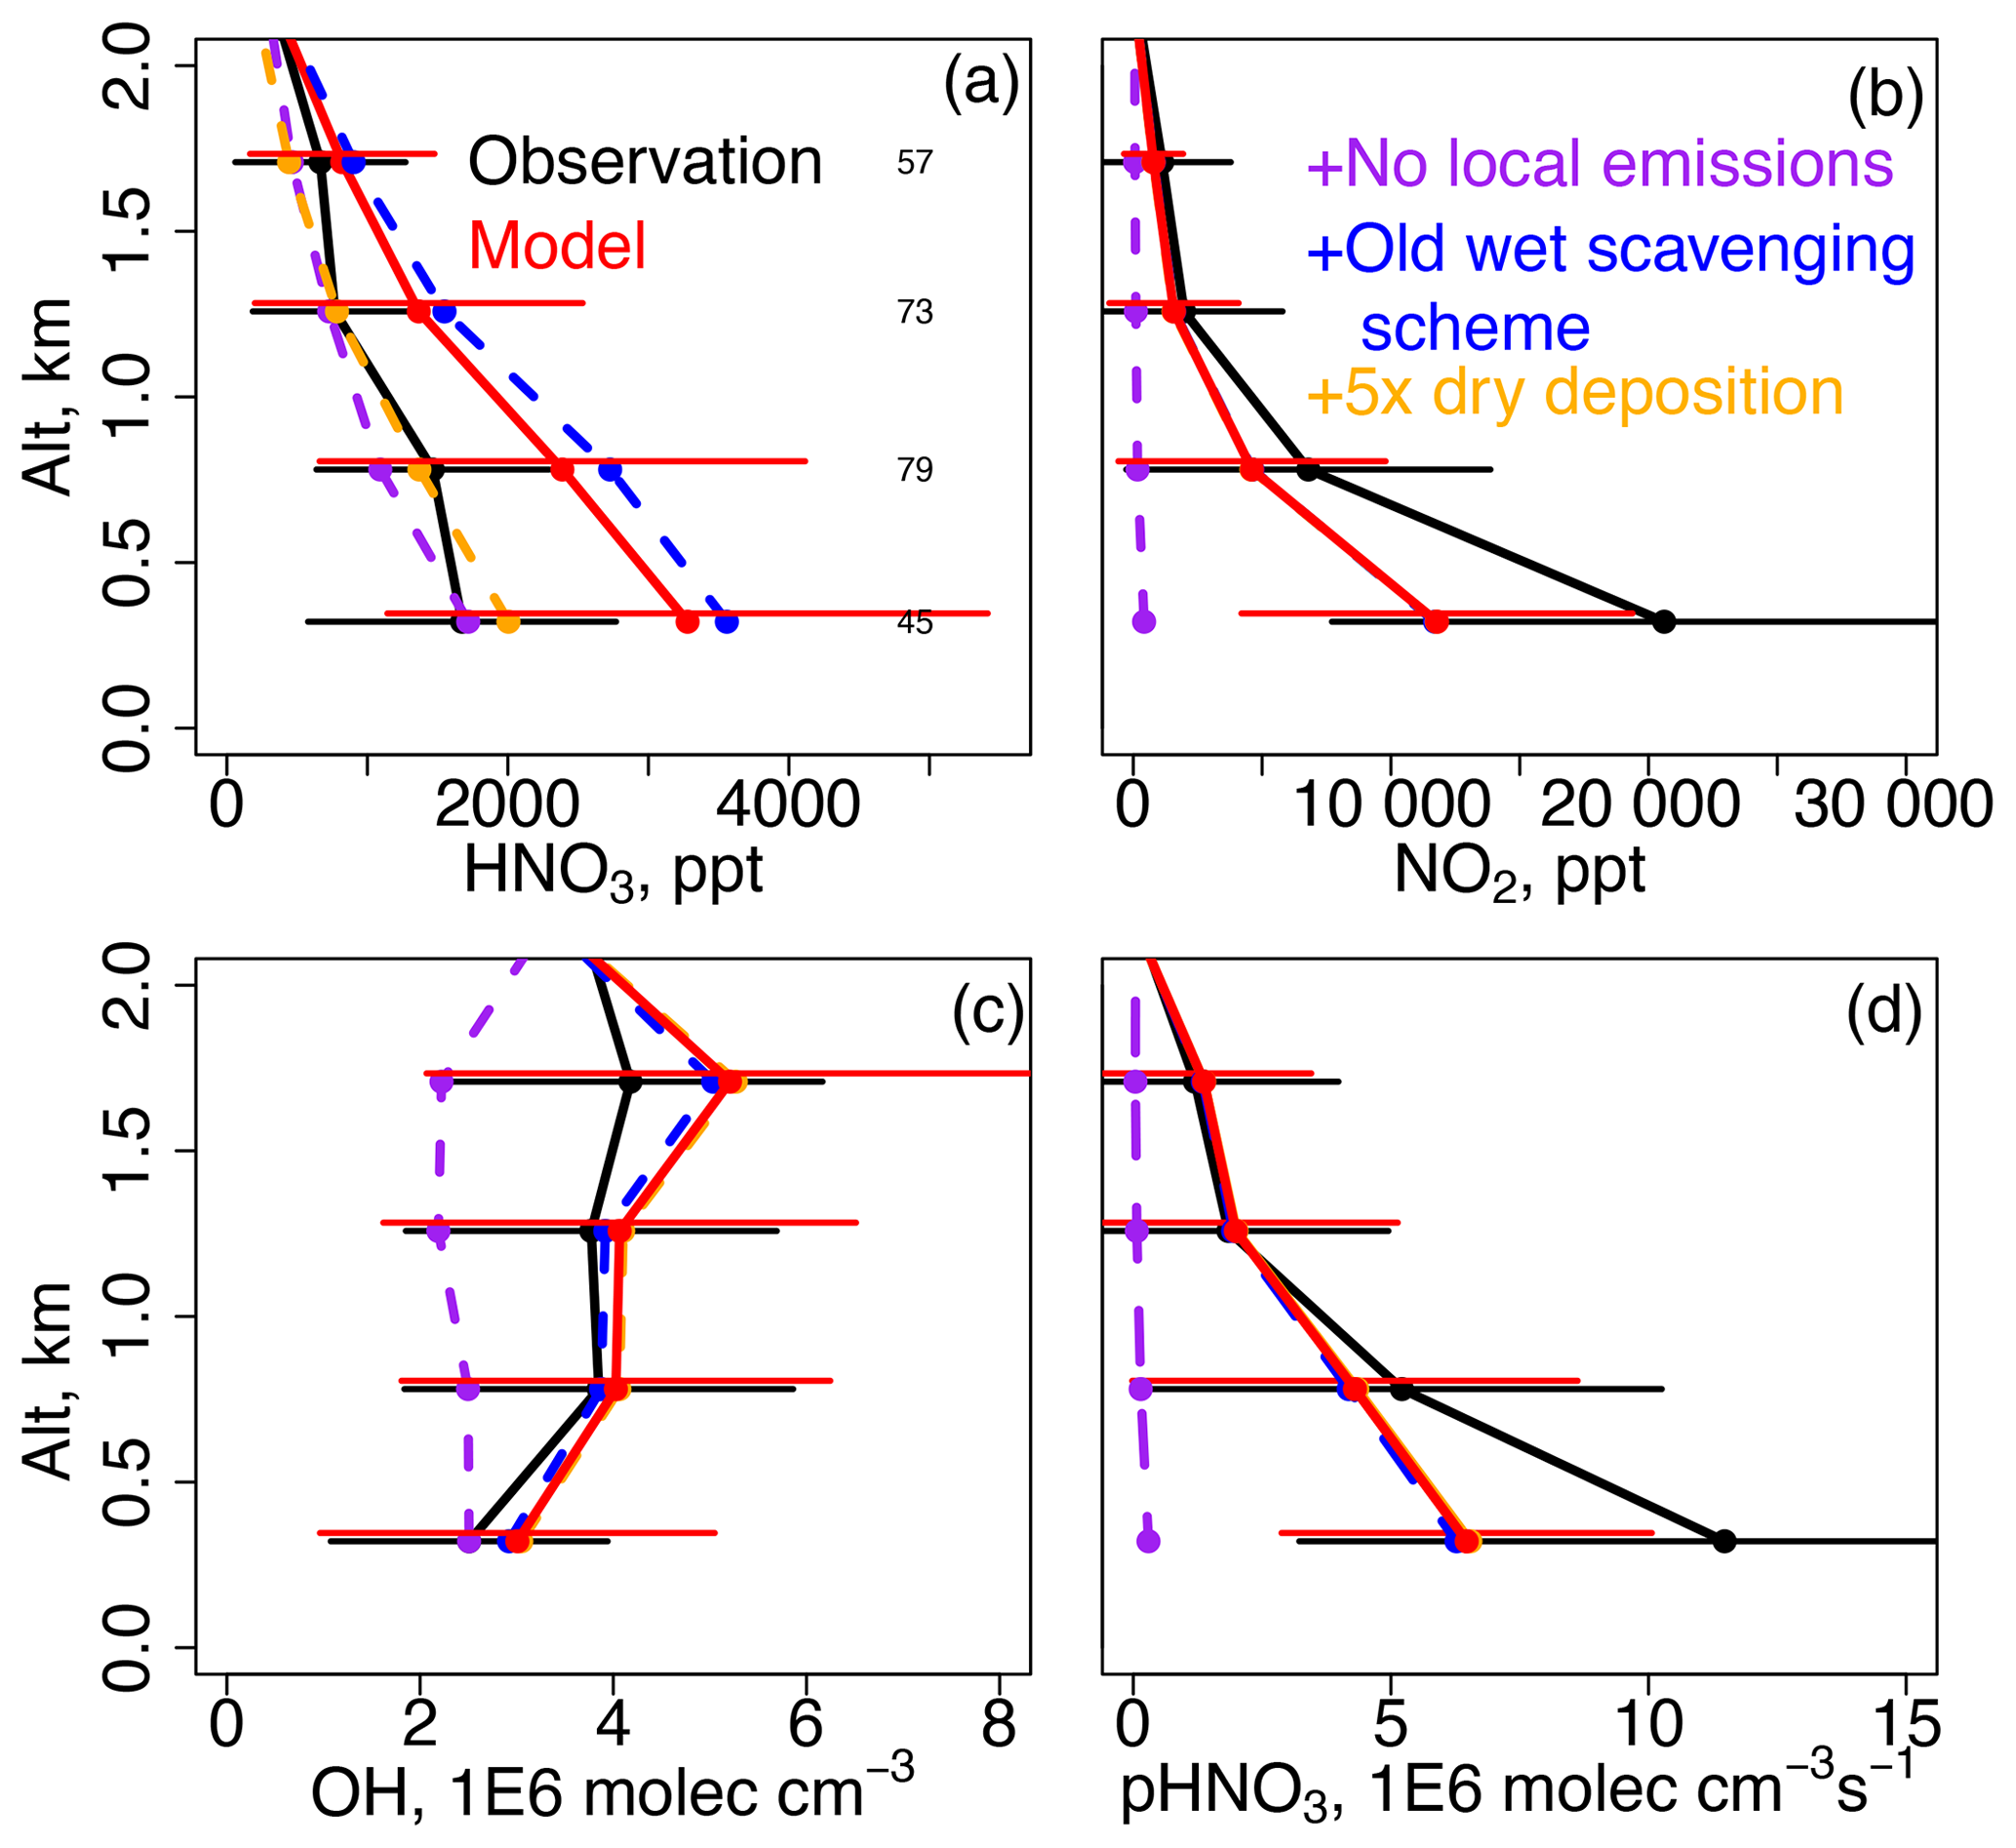
Figure 6Mean vertical profiles of (a) HNO3, (b) NO2, (c) OH, and (d) production of HNO3 (pHNO3) for the same domain as Fig. 3 but accounting for the availability of OH, NO2, and HNO3 observations. The horizontal bars show the observed and modeled standard deviations. The numbers of points in each altitude bin are shown in panel (a). Model sensitivity simulations that are not significantly different than the base model run are plotted underneath the base model line.
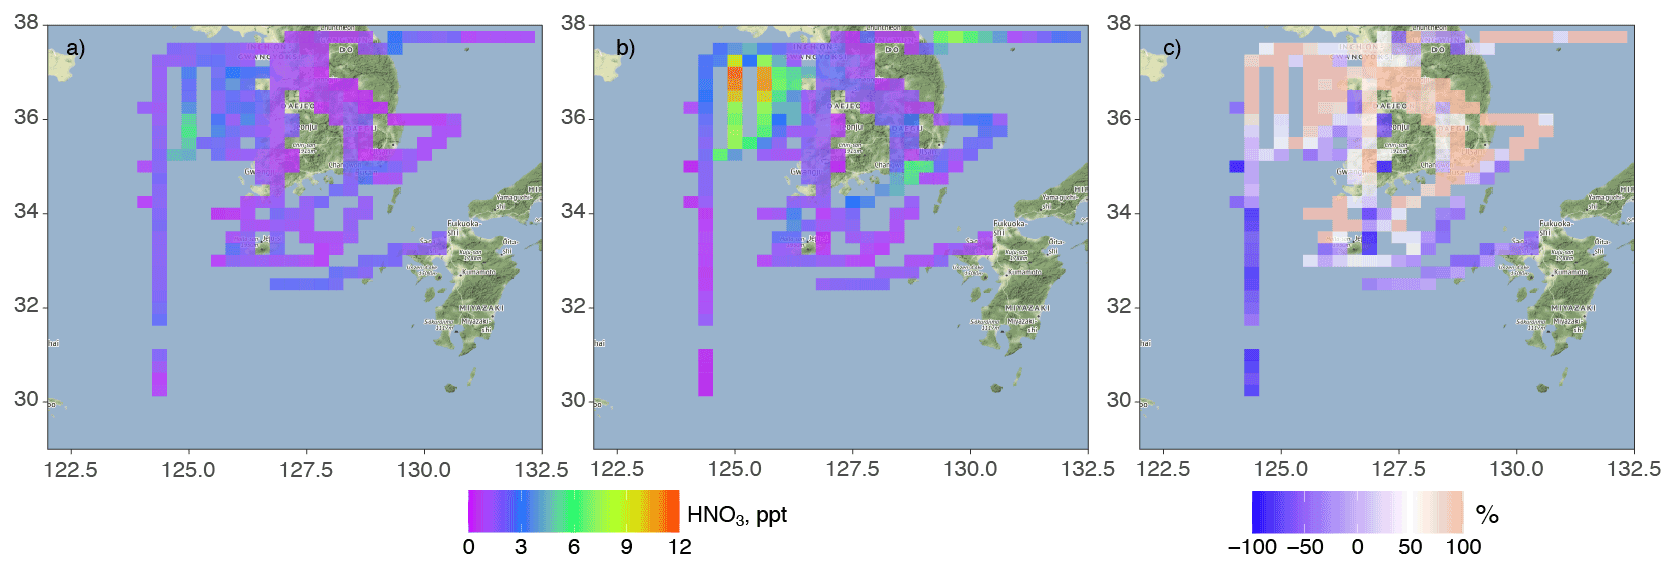
Figure 7Gridded HNO3 from the observations (a), the model (b), and the percent difference (c) along the flight tracks at the model resolution and below 2 km. Map tiles by Stamen Design under CC BY 3.0. Data by ©OpenStreetMap contributors under ODbL.
5.2 Causes of overestimated daytime HNO3
KORUS-AQ provides aircraft and surface observations that provide additional constraints on the model HNO3 bias of +100 % described in Sect. 5.1. We use observations of NO2 and OH from aircraft to evaluate whether NOx emissions or production from Reaction (R1) (NO2 + OH) are overestimated. Figure 6b shows that model NO2 is underestimated by −40 % below 0.5 km. This is partially due to the expected model inability to resolve the highest observed levels of NO2 in an urban region, illustrated by the larger standard deviation in the observations compared to the model. However, given the same emissions inventory used here (KORUSv5), a set of eight models varied in their biases for NOx against KORUS-AQ aircraft observations from a minimal underestimate (−7 %) to a large overestimate (+56 %) depending on model configuration (Park et al., 2021). Thus, model biases could be due to a range of factors including underestimated emissions, inaccuracies in the emission diurnal cycle, or overestimated mixed layer heights. Errors in any of these factors that could increase model NO2, (i.e., increased emissions) would be expected to increase the model overestimate of HNO3. Figure 6c shows that the model bias in OH is small (+20 %) and well within measurement uncertainty (+32 %), and therefore it is unlikely that model errors in Reaction (R1) (Fig. 6d) could cause the model HNO3 bias of +100 %.
The fastest removal pathways for HNO3 are wet and dry deposition. The model implementation of these processes is described in Sect. 3. The recently revised model wet scavenging scheme has improved annual average model simulations of HNO3, but the effect on HNO3 during KORUS-AQ is limited as precipitation was infrequent after the beginning of the campaign as discussed above. Section S3 further discusses the impact of this scheme on KORUS-AQ nitrate and HNO3, but errors in wet deposition are unlikely to be the cause of overestimated model HNO3. Section S3 also describes other possible loss pathways to dust, sea salt, or production of ClNO2 from N2O5 hydrolysis (e.g., Jeong et al., 2019) that have negligible effects on model HNO3 and nitrate.
Previous attempts to improve model nitrate overestimates invoked an unknown sink of HNO3 in the model (Heald et al., 2012; Weagle et al., 2018), as uncertainties in precursor emissions, the rate of N2O5 hydrolysis (Reactions R2 and R3) or gas-phase production (Reaction R1), OH concentrations, and HNO3 dry deposition velocity () could not explain model nitrate biases. We similarly conclude that an unknown loss process must be a main cause of the daytime model overestimate in HNO3 and associated evening nitrate bias during KORUS-AQ that occurs as conditions become more favorable for partitioning HNO3 to pNO3. This unknown loss process could be a larger underestimate in dry deposition than has been previously considered, as constraints from KORUS-AQ show that uncertainties in emissions, nighttime production (Reactions R1–R5), and wet deposition are not the cause. Heald et al. (2012) ruled out dry deposition after assuming an uncertainty of a factor of 2. Here, the increase in required to reproduce observed HNO3 (Fig. 6a) is a factor of 5. A similar increase in was invoked by Itahashi et al. (2017) in their model study of wintertime nitrate in East Asia based on the finding from Shimadera et al. (2014) that (as well as NH3 emissions and dry deposition) was the main factor driving model nitrate performance.
The increase in suggested above would result in an average value of 7.5 cm s−1 compared to the standard model value of 1.5 cm s−1. This corresponds to a maximum midday rate of 15.4 cm s−1 compared to the original value of 3.1 cm s−1 (Fig. S8). Deposition of HNO3 is limited only by aerodynamic resistance (and available surface area), as it readily adheres to surfaces. While the increase in we suggest here is large, this could arise from factors such as increased surface area in urban or heavily forested regions and increased vertical mixing over cities due to turbulence induced by the urban heat island effect. These factors are not accounted for in the limited existing deposition velocity measurements that have been compared against models (Nguyen et al., 2015). Increased turbulence over forested regions results in higher deposition velocities (Sievering et al., 2001; Yazbeck et al., 2021), which would also be expected in an urban environment (i.e., Keuken et al., 1990). The model does not account for increased available surface area for deposition contributed by urban buildings or the elevated vertical mixing over cities due to the urban heat island effect (Hong and Hong, 2016; Halios and Barlow, 2018). The model surface roughness, an important parameter governing turbulence, is just 0.1 m in Seoul compared to values measured between 1 and 3 for forested or urban parts of the city (Hong and Hong, 2016).
Neuman et al. (2004) derived from aircraft observations of power plant plumes in eastern Texas, obtaining values between 8 and 26 cm s−1, which are values at least 4 times faster than reported previously. We take a similar approach as Neuman et al. (2004) to calculate from KORUS-AQ observations in the SMA using the rate equation for TNO3 as a function of photochemical age (Fig. 8 and Eq. 3).
NOx(0) is the initial NOx mixing ratio normalized to CO (Fig. 8, 0.24 ppbv NOx (ppbv CO)−1), β is the first-order loss rate for TNO3, c is the first-order production rate for TNO3 (pTNO3 = pHNO3 = kR1[OH]), and TNO3(t) is observed TNO3 as a function of photochemical age (t). As production of TNO3 was constrained by observed OH and the main loss of TNO3 (β) is from deposition of HNO3, the unknown for TNO3 evolution is the deposition rate. The full calculation is provided in Sect. S4.

Figure 8Plot of binned observations of NOx (right axis), total nitrate (TNO3 = HNO3 + pNO3), sum of peroxy nitrates (ΣPNs), and sum of alkyl- and multi-functional nitrates (ΣANs) (left axis for TNO3, ΣPNs, and ΣANs) normalized to background-subtracted CO. The background CO from Nault et al. (2018) of 200 ppbv was used. The photochemical age was calculated using propene and one of its photochemical products, propene hydroxynitrate (Sect. S4). Data are binned between 0 and 5 equivalent hours between 11:00 and 16:00 KST below 1 km for the SMA (127 to 127.7∘ N, 37.2 to 37.7∘ N). The fit for NOx (dotted gray curve) is an exponential decay, leading to a first-order rate of 0.31 h−1, which represents the loss of NOx via the production of oxidized compounds, such as TNO3. The best fit for TNO3(t) from Eq. (3) (dotted blue curve) includes this production and solves for first-order loss, which is assumed to be equivalent to the TNO3 deposition rate (Sect. S4). Red curves represent solutions for TNO3(t) from Eq. (3), assuming different deposition velocities (Vd) discussed in Sect. 5.2.
Figure 8 shows NOx, TNO3, and the other NOx oxidation products of total peroxy nitrates (ΣPNs) as well as the sum of alkyl- and multi-functional nitrates (ΣANs) as a function of photochemical age. All species are normalized by background-subtracted CO. NOx is continuously depleted at a rate of 0.31 h−1, implying continued production of TNO3, ΣPNs, and ΣANs. This loss rate corresponds to a lifetime of 3.2 h that is similar to the lifetime of 4.8 h for NO2 against conversion to HNO3 (Reaction R1) using the SMA average OH of 5.2 × 10⁻⁶ molec cm−3. From Eq. (3), we derive a loss rate (β) of 13.9 cm s−1 that best fits the observed change in TNO3 with aging. As deposition of pNO3 is slow, we assume that = . All three NOx oxidation products (TNO3, ΣPNs, ΣANs) exhibit similar behavior, with production outpacing loss until approximately 3 h of aging, when loss appears to balance production and concentrations remain relatively constant. There is likely large uncertainty in the derived photochemical ages shown in Fig. 8, as the aircraft did not follow plumes as in Neuman et al. (2004). However, our derived NOx lifetime is consistent with average SMA conditions and is not affected by our choice of observed altitude range, suggesting that the aging represents true chemical processing.
Figure 8 shows that the slower value for midday in the original model (3.1 cm s−1) poorly represents observations compared to the faster value obtained in Fig. 6 (15.4 cm s−1). We calculate that the original deposition rate would correspond to a first-order loss rate for TNO3 of only 0.07 h−1 (assuming a 1.5 km boundary layer height), and thus observed TNO3 should increase with photochemical age, which is not supported by the observed relationship in Fig. 8. The factor of 5 increase in , constrained only using observed HNO3, implies a similar loss rate of TNO3 as derived in Fig. 8 and leads to the observed behavior whereby after initial production, the normalized mixing ratio remains constant. This analysis supports the hypothesis given above that existing observations supporting lower values for (Nguyen et al., 2015) may underrepresent deposition in regions with greater turbulence and available surface area such as in cities like Seoul. Deposition of atmospheric pollutants such as nitric acid on buildings generates “urban grime” that may photolyze and produce NOx and HONO (nitrous acid) (Baergen and Donaldson, 2013, 2016; Zhang et al., 2016). This source may be larger than previously thought if models underestimate nitric acid deposition.
Figure 4a shows the impact on the diurnal cycle of model nitrate from increasing model by a factor of 5. The rapid late afternoon–early evening increase in model nitrate (Fig. 4a) is largely resolved and model HNO3 is now in better agreement with aircraft observations (Fig. 6) due to a significant dampening of the HNO3 diurnal cycle (Fig. 4b). This reduction in the HNO3 diurnal cycle is better supported by observations of TNO3 as discussed above. We conclude that a key reason for the high bias in daily average model nitrate (Fig. 2) is overestimated daytime HNO3 that produces excess nitrate at night when conditions become favorable (cool, humid) for gas-to-aerosol partitioning. The model overestimate is due to insufficient loss, likely underestimated dry deposition. This finding does not address possible errors in nighttime nitrate production pathways (NO2 vs. N2O5). KORUS-AQ provides detailed ground observations that can be used to constrain model nighttime chemistry.
5.3 Errors in model nighttime production of HNO3
Figure 4c shows that model nighttime production of HNO3 by aerosol uptake of NO2 (Reaction R4) is approximately twice as large as Reaction (R2) (N2O5 hydrolysis). This contradicts the calculation from Jordan et al. (2020) that Reaction (R2) is the driver of nitrate production during KORUS-AQ, particularly during the Transport/Haze period due to sufficient nighttime ozone concentrations that allow for production of the nitrate radical and N2O5 through Reactions (R8) and (R9).
Production of nitrate by N2O5 hydrolysis is supported by observations of ClNO2, thought to be produced primarily by this reaction (Thornton et al., 2010). As discussed above in Sect. 5.2, observations of ClNO2 at Olympic Park are elevated at night (Fig. S7). Despite recent large reductions of the uptake coefficient (γ) for NO2 in the model (Holmes et al., 2019), NO2 uptake still is the dominant nighttime pathway. We use observations of ozone, NO, and NO2 at Olympic Park to determine whether errors in Reactions (R7)–(R9) are impacting model ability to produce N2O5.
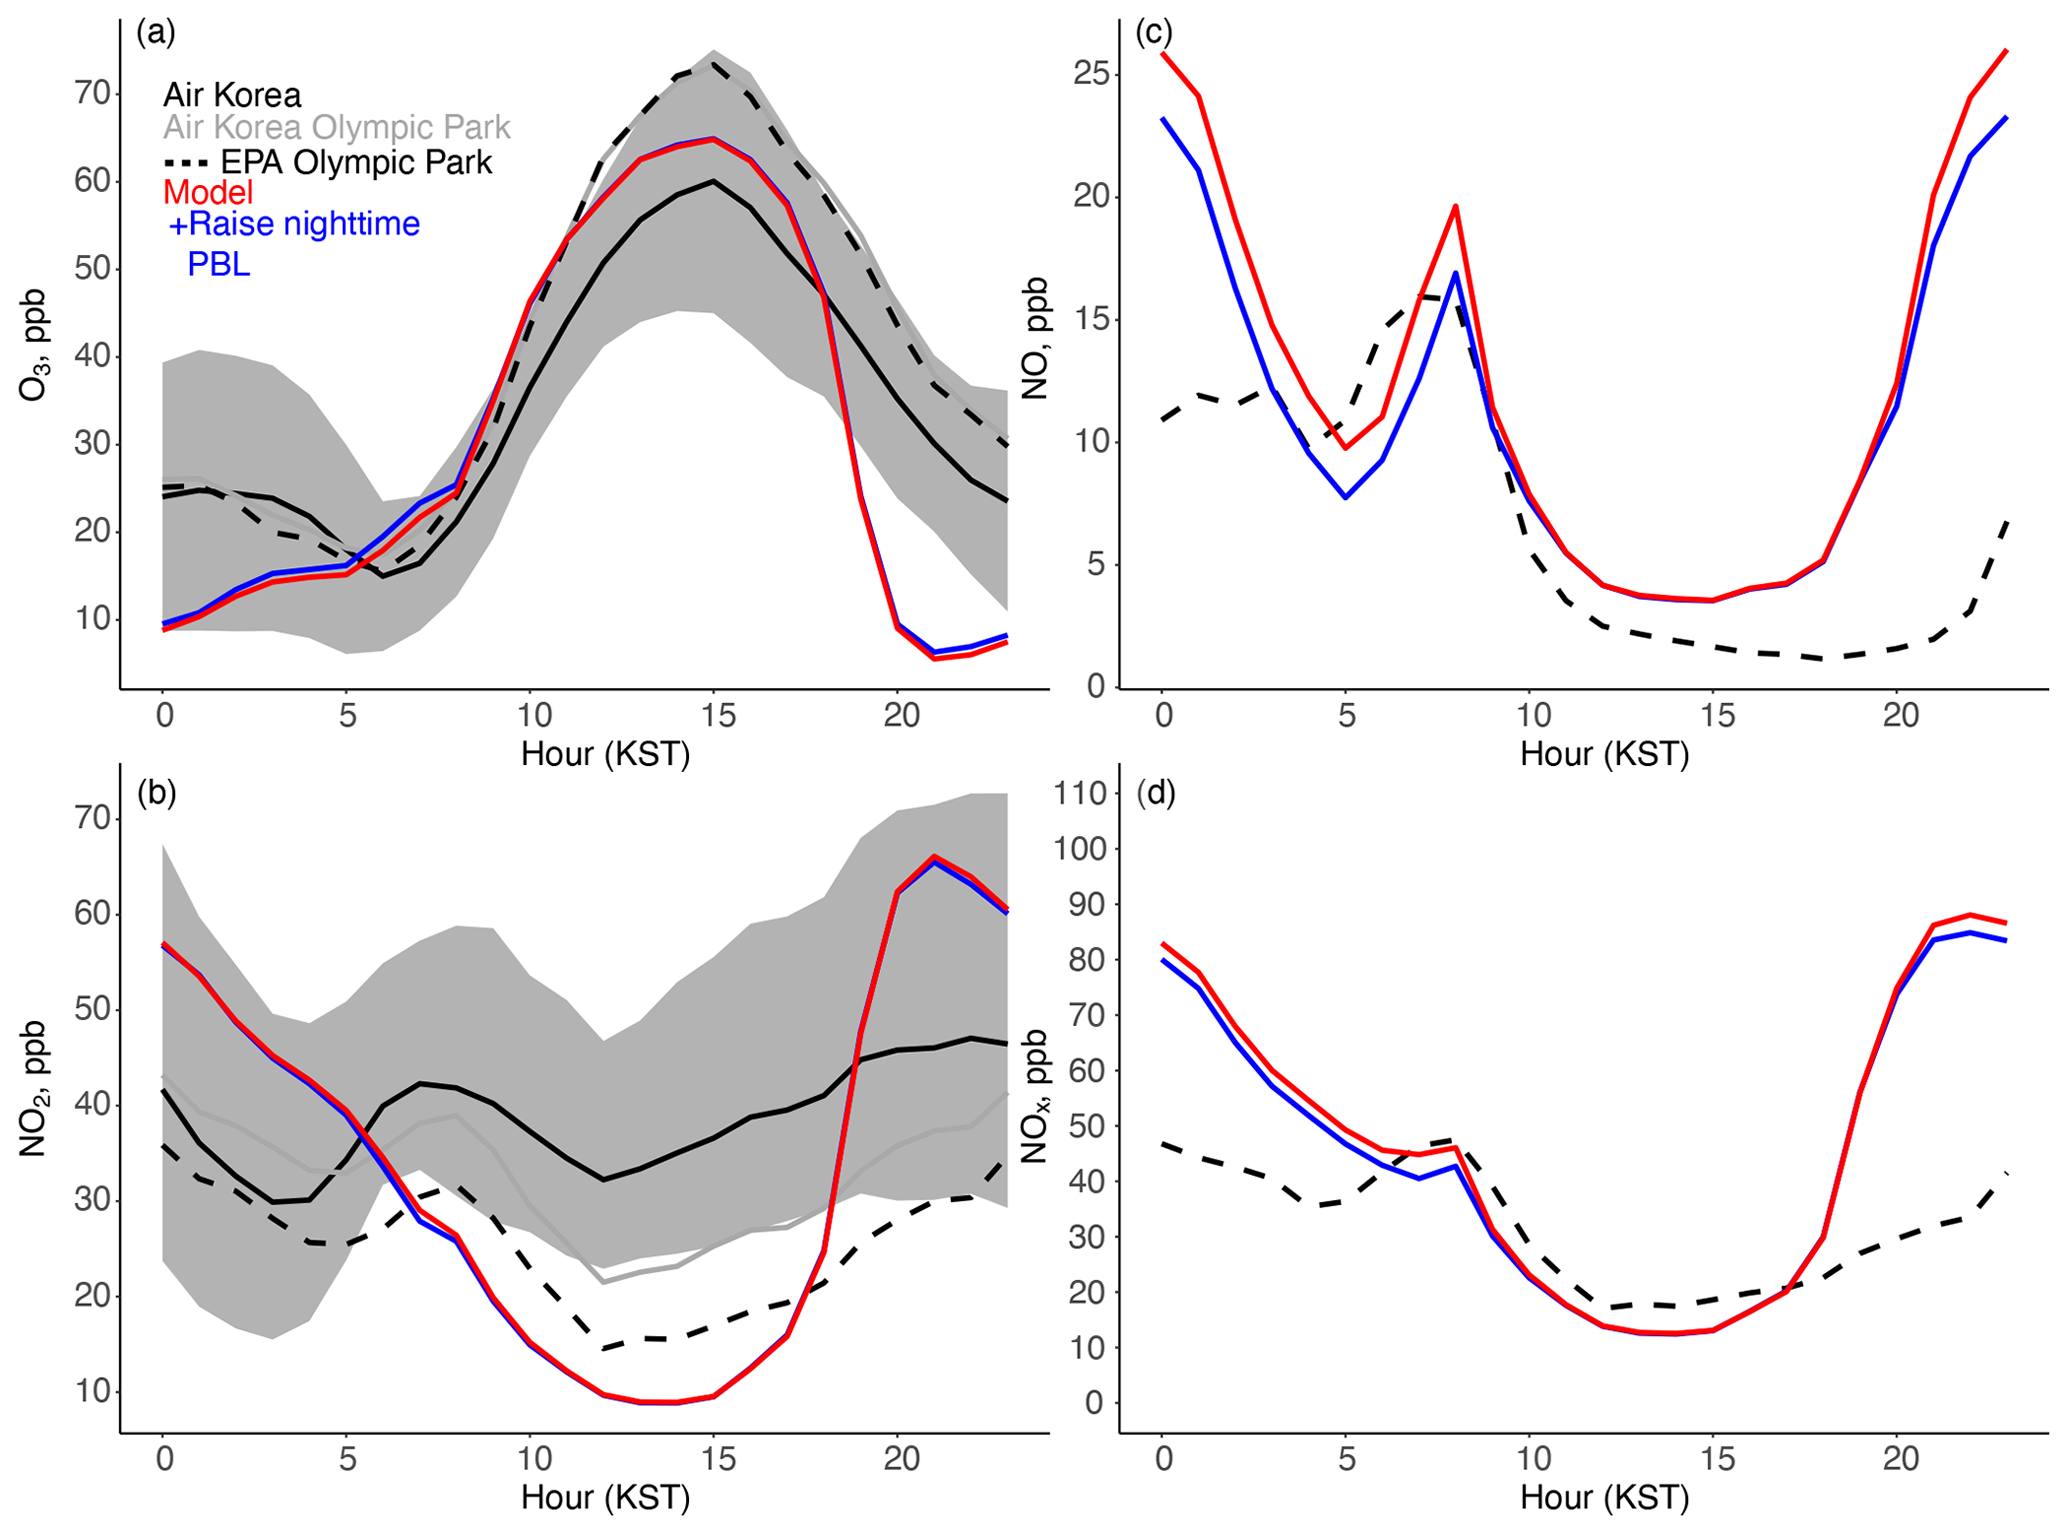
Figure 9Mean diurnal cycle from 1 May to 7 June 2016 for (a) ozone and (b) NO2 for the AirKorea sites within the GEOS-Chem grid box (Fig. 1b) and for (c) NO and (d) NOx at Olympic Park. The gray shading represents the standard deviation across the AirKorea sites. The solid gray line is the AirKorea site closest to Olympic Park, and the dashed line is the measurement from the EPA (Table 2) at Olympic Park. The sensitivity study (blue line) is described in Sect. 5.3.
Figure 9 shows the mean modeled and observed diurnal cycles of ozone and NO2 for the AirKorea sites in the model grid box (Fig. 1b) and for ozone, NO, NO2, and NOx at Olympic Park. Ozone might be expected to be titrated in an urban area by Reaction (R7) as the mixed layer collapses in the evening, resulting in elevated NO and shutting down production of the nitrate radical (Reaction R8). This is the case in the model wherein nighttime ozone is < 2 ppb approximately 20 % of the time, but this occurs in the observations only twice (Fig. S9). As a result, average observed nighttime ozone is 23 ppb but only 13 ppb in the model (Fig. 9). The time series of observed and modeled ozone in Fig. S9 shows that while the model does succeed in simulating high nighttime ozone concentrations during the Dynamic period, characterized by higher wind speeds, ozone is incorrectly titrated at other times, particularly during the buildup of the haze pollution following a frontal passage on 24 May. The implications of this excess ozone titration for the simulation of PM2.5 specifically during haze conditions will be further discussed in Sect. 6.
As shown in Fig. 9b and c, model ozone titration corresponds to excess model NO and NO2 at night and explains the dominance of NO2 uptake in the model over N2O5 hydrolysis for nighttime HNO3 production. The model bias for NOx is minimal during the day, providing additional support for the level of emissions in the model, but is overestimated by 50 % at night. The excess model ozone titration and overestimated nighttime NOx implies an error in nocturnal mixing. Figure 10a shows the mixed layer height (MLH) diurnal cycle measured by ceilometers at Olympic Park and Seoul National University. The aerosol gradients detected by the ceilometer to estimate MLH are less reliable at night due to the possible presence of aerosols in the residual layer (Jordan et al., 2020). We support these measurements with additional calculations of nighttime MLH from radiosonde observations of temperature and RH four times a day (Sect. S5 and Fig. S10). As previously discussed in Sect. 5.2, in urban regions such as Seoul, the anthropogenic heat island effect and the heterogeneity of the urban land cover increase sensible heat fluxes and turbulence over non-urban areas (Halios and Barlow, 2018) and create an unstable mixed layer even at night. Min et al. (2020) showed that the nighttime mixed layer in Seoul is elevated in all seasons and that nighttime conditions are generally unstable due to urban heat storage and anthropogenic heat release; this could explain the observed elevated nighttime MLH (Figs. 10a and S11 in the Supplement). This effect is not captured in many meteorological models including the one used here (GEOS-CF, Sect. 3); instead, nighttime model sensible heat flux is always negative (stable conditions) (Fig. 10b).
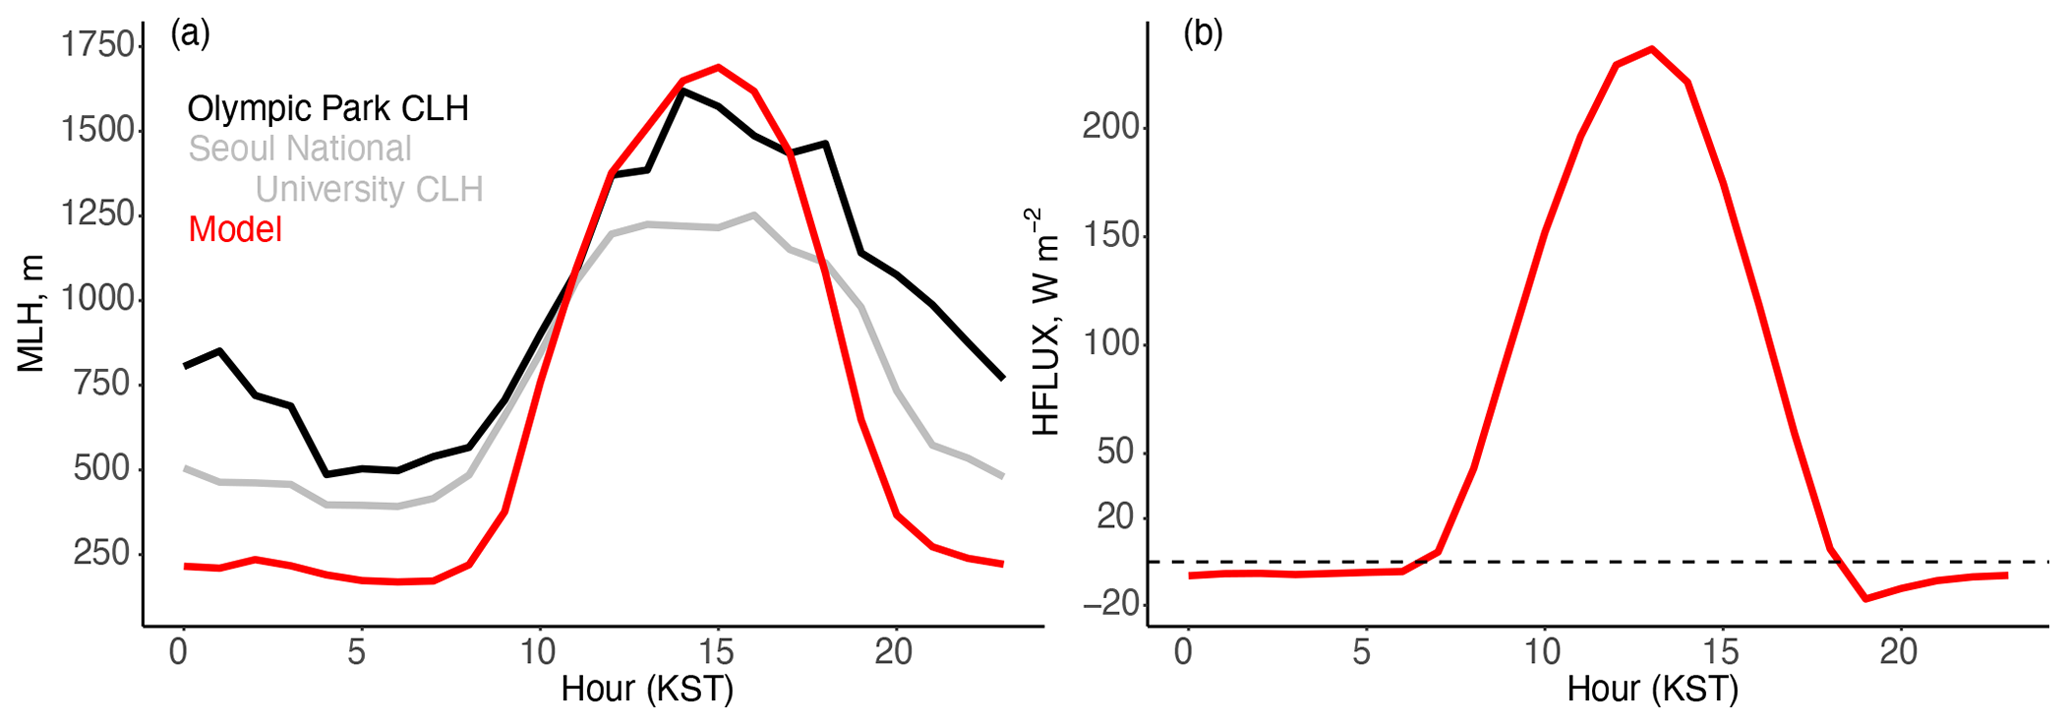
Figure 10(a) Mean diurnal cycle for the mixed layer height (MLH) from the model and observations from 1 May to 7 June 2016, as well as (b) sensible heat flux (HFLUX) from the model. The MLH is given for the ceilometers (CLH) at Olympic Park (black) and at Seoul National University (gray).
Starting at 17:00 KST, the model mixed layer collapses early, causing a more rapid decline in ozone than in the observations (Figs. 9a and 10a). The transition from a convective daytime mixed-layer to a stable nocturnal boundary layer is poorly understood (Lothon et al., 2014). The early collapse of the mixed layer has been observed in other models including the widely used Weather Research and Forecasting (WRF) model (Hegarty et al., 2018). One possibility for the delay in this collapse is continued mixing from the last eddy of the day formed just before the sensible heat flux changes sign during the evening transition (Blay-Carreras et al., 2014). This has been hypothesized as a reason for errors in the model diurnal cycle of ozone in the United States (Travis and Jacob, 2019). Here, this early collapse drives excess production of nitrate from NO2 (Reaction R4).
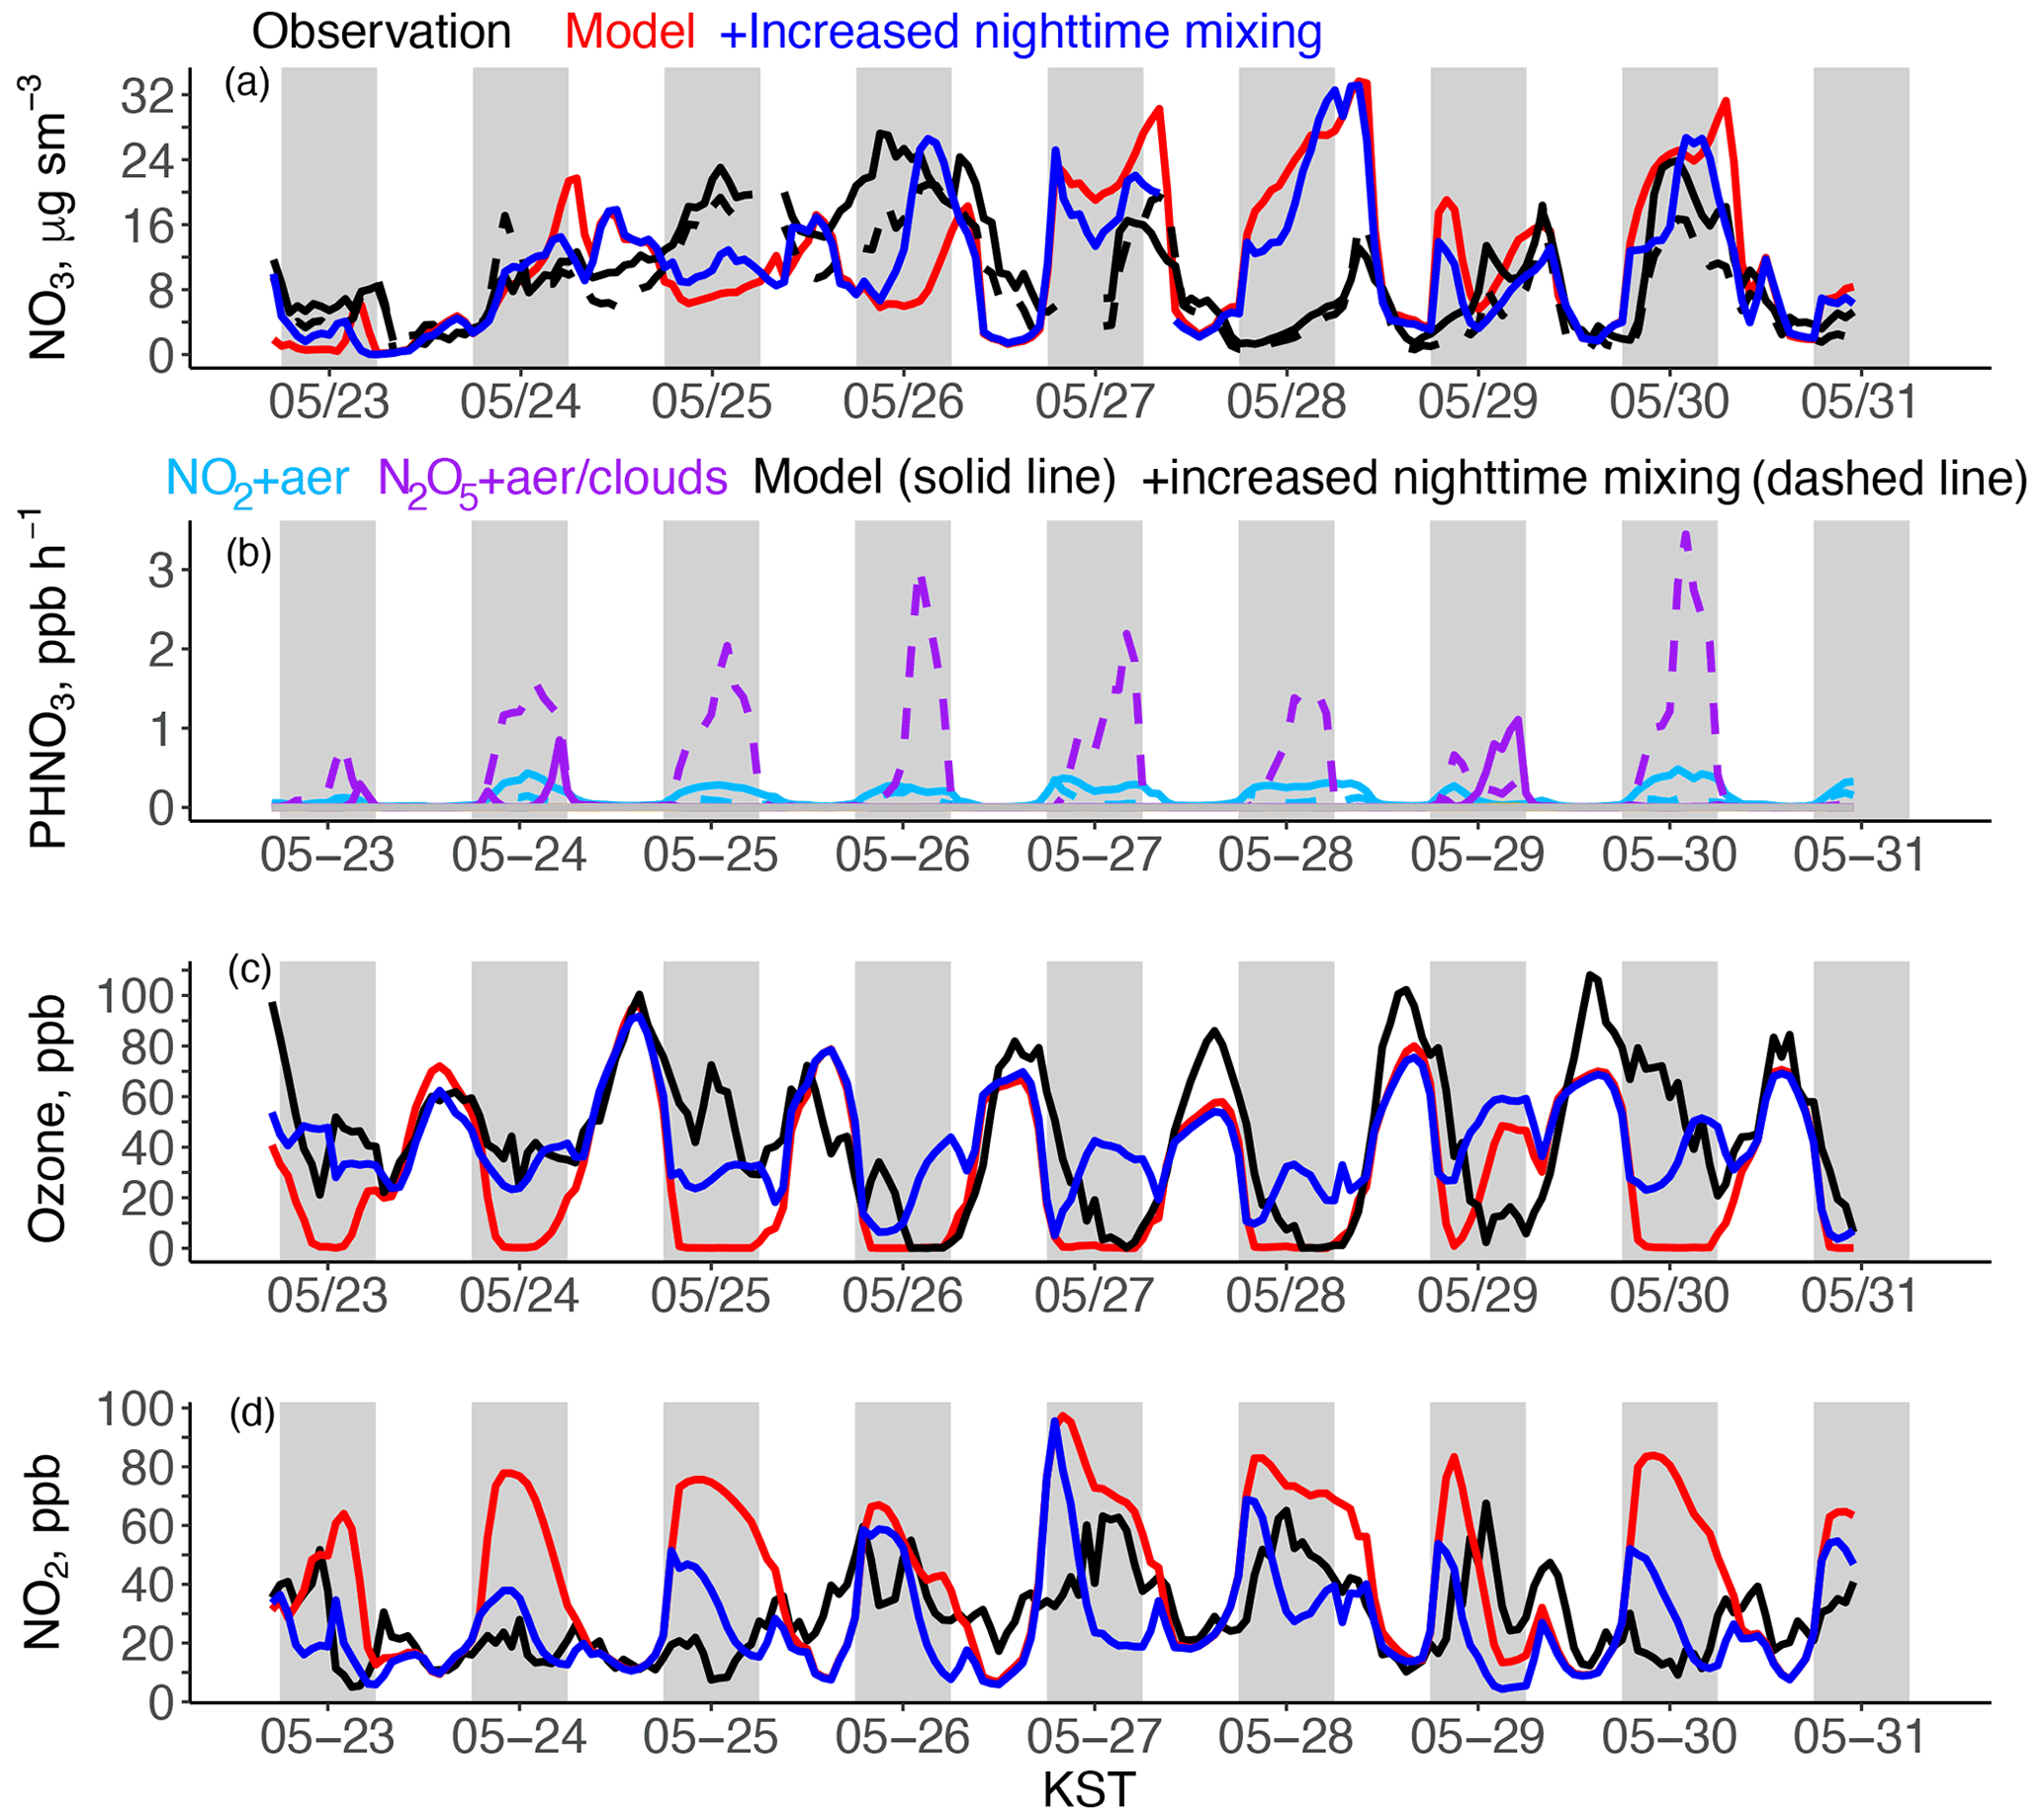
Figure 11(a) Transport/Haze period time series of modeled and observed hourly nitrate fraction of PM2.5, (b) modeled production of HNO3 from N2O5 (Reaction R2) and NO2 (Reaction R4), (c) ozone, and (d) NO2. The sensitivity studies are described in Sect. 6. The gray shaded regions represent 18:00 to 06:00.
While addressing the shortcomings of the model mixing scheme is beyond the scope of this study, we test the sensitivity of model nitrate production to the main two problems identified above: (1) the overly rapid collapse of the afternoon mixed layer and (2) insufficient nocturnal mixing. While model meteorology is calculated offline, mixing in the boundary layer is calculated online (Sect. 3), allowing us to perturb mixing parameters. We increase the nighttime MLH to 500 m (Table 4) to examine the impact on model ozone, NO, and NO2. The effect of this change on these species is minimal (Fig. 9), similar to the findings of other model sensitivity studies that performed this same test (Oak et al., 2019; Miao et al., 2020). While the strength of model vertical mixing is sensitive to MLH, the model sensible heat flux and friction velocity have a larger impact (Holtslag and Boville, 1993), and the nighttime mixed layer will remain stable while the sensible heat flux is negative. We illustrate in Sect. S6 that reducing the collapse of the evening MLH without a significant change to the drivers of mixing (i.e., heat fluxes, friction velocity) also has a negligible impact on decreasing model ozone titration (Fig. S12b).
Errors in model nighttime mixing are difficult to remedy without significant revisions to the model mixing parameterizations, including implementing continued mixing from daytime eddies into the evening hours (Blay-Carreras et al., 2014) and increased urban heat fluxes (Halios and Barlow, 2018). We address the implications of these errors for the simulation of haze pollution events in Sect. 6.
The failure of models to simulate sulfate production in haze in East Asia is a current topic of intensive research and is attributable to missing sulfate production in aerosol water (Wang et al., 2014; B. Zheng et al., 2015; Chen et al., 2016; Shao et al., 2019; Miao et al., 2020). There has been less assessment of the ability of models to simulate nitrate in haze, but nitrate-dominated haze is becoming more common due to the reductions in SO2 in East Asia (Wang et al., 2020). Figure 2 and Table 3 show that the model can reproduce the increase in the nitrate component of PM2.5 during the Transport/Haze period but overestimates absolute concentrations by ∼ 15 %. This contributes to an 80 % overestimate in ALWC. Efforts to explicitly simulate SO2 oxidation in ALWC may be hindered by this model bias, which also impacts the rates of all other heterogeneous reactions through the increase in aerosol surface area and volume.
Figure 11a shows the hourly time series of observed and modeled nitrate at Olympic Park during the Transport/Haze period. During the haze buildup, the model initially overestimates nitrate during the day (24 May), followed by large nighttime underestimates (24–25 May). This is opposite to the nighttime overestimate and daytime agreement shown in the campaign average (Fig. 4a). During the haze buildup, daytime RH remained elevated (> 50 %, Fig. S13) and the daytime mixed layer was suppressed (Fig. S14 and Jordan et al., 2020). The model reproduces both conditions, which are favorable for SNA production. Model nitrate biases here are likely due to the errors identified in Sect. 5.2 (overestimated daytime HNO3) and Sect. 5.3 (incorrect representation of nighttime conditions), but here the excess daytime HNO3 in the model results in higher daytime nitrate than in the campaign average. Insufficient model sulfate during the haze event results in overestimated model pH and excess partitioning of HNO3 to the particle phase (Guo et al., 2016). Figure S15 in the Supplement shows that εNO3 (the calculated fraction of TNO3 in the aerosol phase) decreases as sulfate increases, and the model sulfate bias corresponds to a difference in εNO3 of ∼ 0.3.
The model underestimate of nighttime nitrate concentrations during the haze buildup must be because the rate of observed N2O5 hydrolysis (Reaction R2) exceeds even the erroneously high model rate of NO2 aerosol uptake (Reaction R4). The haze buildup was characterized by a lower daytime MLH and a deeper nocturnal MLH (inferred from the lack of ozone titration) that resulted in higher nitrate production from N2O5 hydrolysis (Jordan et al., 2020). The model overly titrates ozone (Fig. 11c) due to insufficient nighttime mixing. We drive additional nocturnal mixing (Table 4, increased nighttime mixing) by increasing the sensible heat flux at night from slightly negative (−4 W m−2) to weakly positive (+10 W m−2), representative of anthropogenic heat fluxes in this region (Hong and Hong, 2016; Varquez et al., 2021). To reduce the rate of Reaction (R4) from overestimated NO2 and allow for a high rate of Reaction (R2), we increase the nighttime MLH over land to 300 m as suggested by the observations.
This sensitivity test (Table 4) largely resolves the incorrect model ozone titration and the severe model overestimate of nighttime NO2 on 23–24 and on 24–25 May but does not remedy the early model collapse of the evening mixed layer (Fig. 11). Extending this sensitivity test past the haze buildup results in excess nighttime ozone. This may be due to the increased cloud cover during the haze buildup (Fig. S16) that could cause additional nighttime mixing over average conditions through enhancement of the urban heat island effect (Theeuwes et al., 2019). As the meteorology in GEOS-Chem is calculated offline (Sect. 3), increasing surface sensible heat flux only impacts the boundary layer mixing parameterization but not the simulation of other meteorological fields. Future work should use a coupled system to investigate other effects of the urban heat island effect on air quality.
Figure 11b shows that increased nighttime mixing allows N2O5 hydrolysis (Reaction R2) to become the main nighttime pathway for HNO3, with a rate 3 times greater than NO2 uptake (Reaction R4) in the base model. The raised mixed layer height of 300 m prevents this high rate from resulting in overestimated model nitrate. Increased model nighttime nitrate corresponds to an increase in nighttime ALWC of ∼ 50 %. We use the simulations shown in Fig. 11 to illustrate that model errors in simulating mixed layer dynamics (overly rapid collapse of the evening mixed layer and insufficient nighttime mixing) result in errors in model chemistry. Nighttime measurements of the vertical structure of key species such as ozone, NO2, N2O5, and HNO3, complemented by sensible heat flux observations, are needed to further constrain model simulations of nighttime nitrate production.
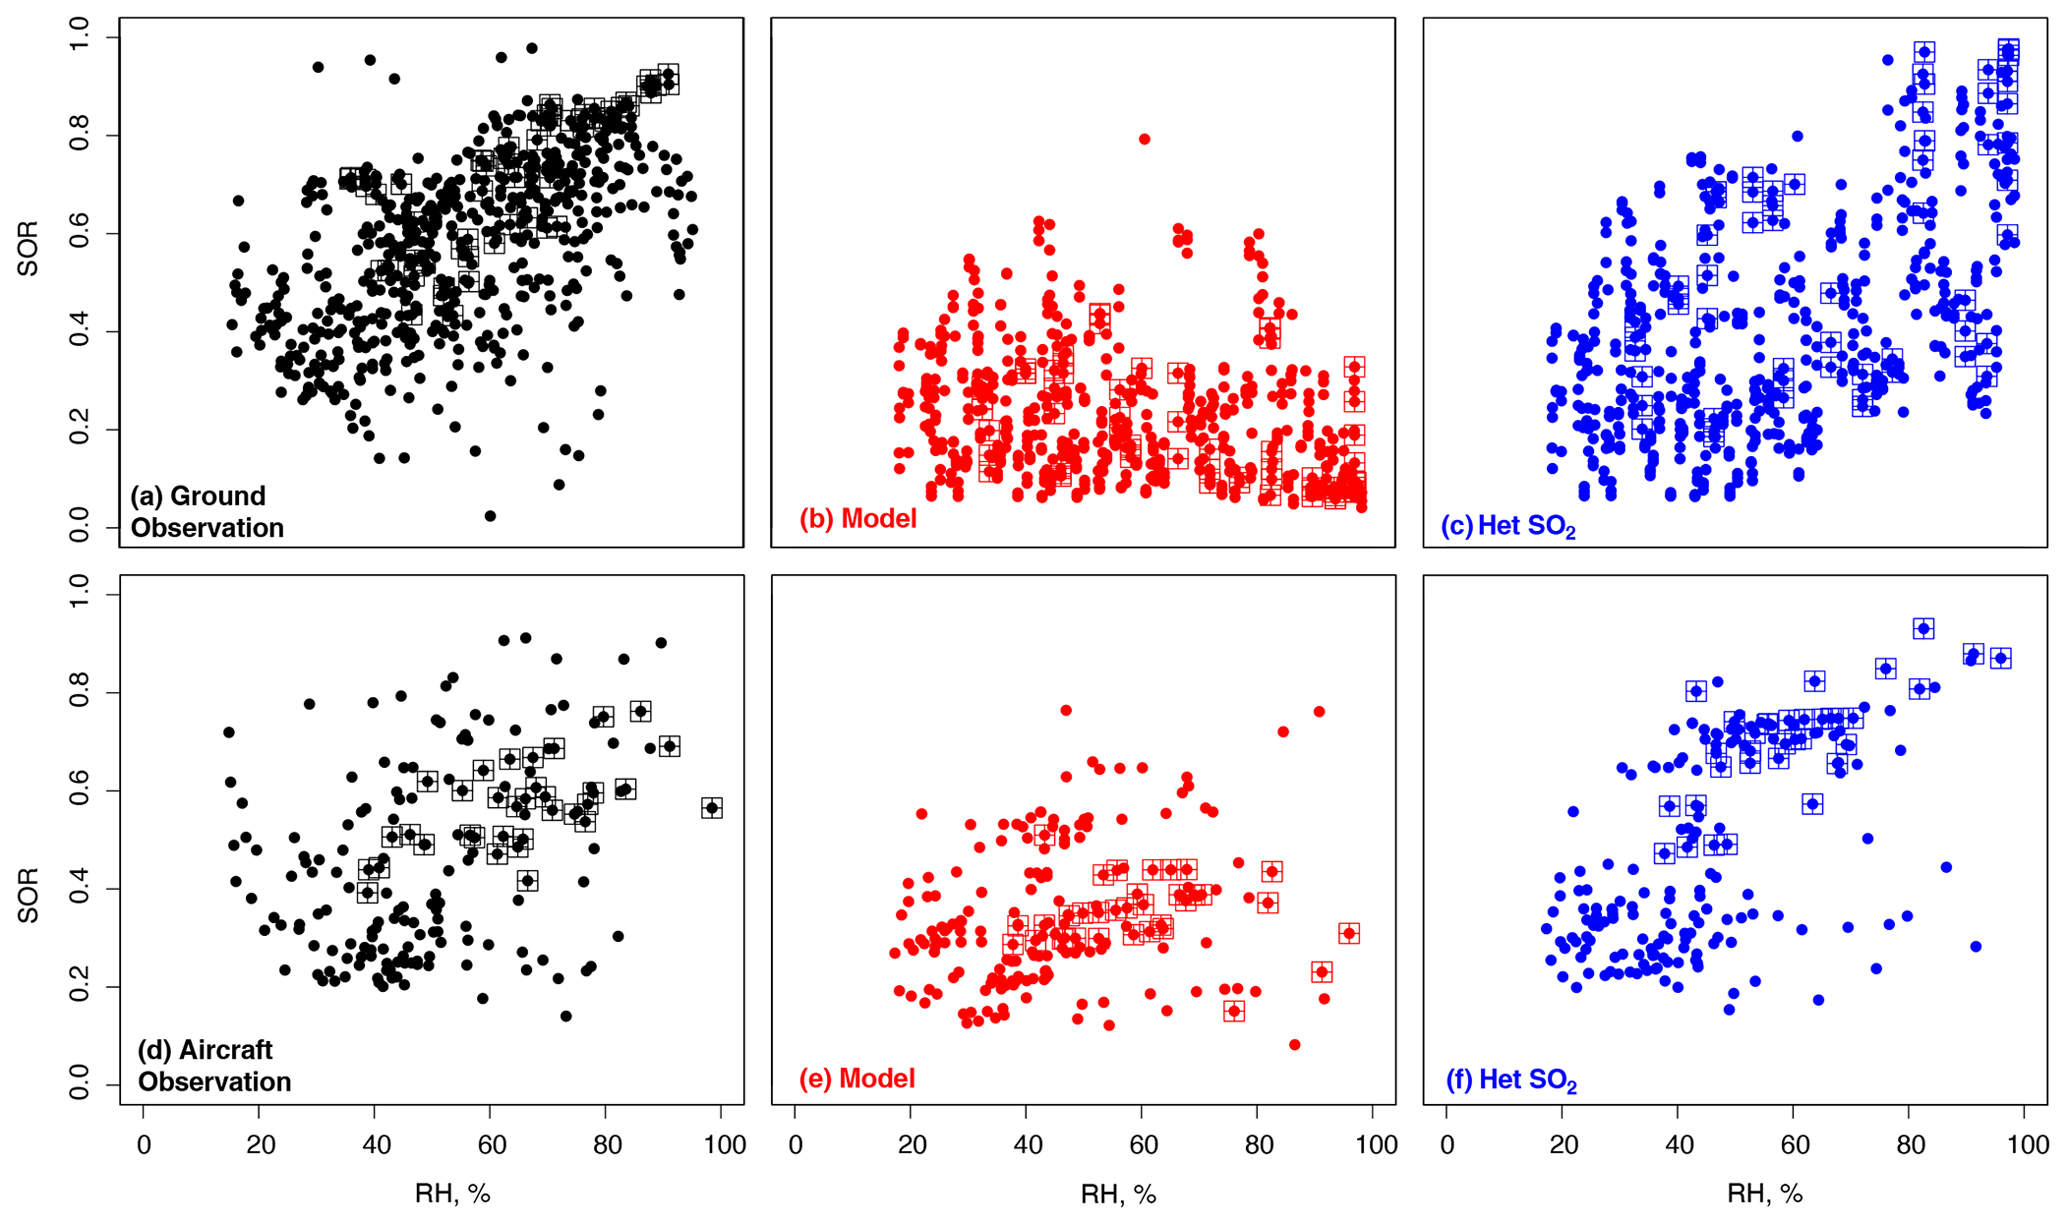
Figure 12Sulfate oxidation ratio () as a function of RH at Olympic Park and from aircraft below 1 km for the descents over Olympic Park. The squares highlight the data during the Transport/Haze period.
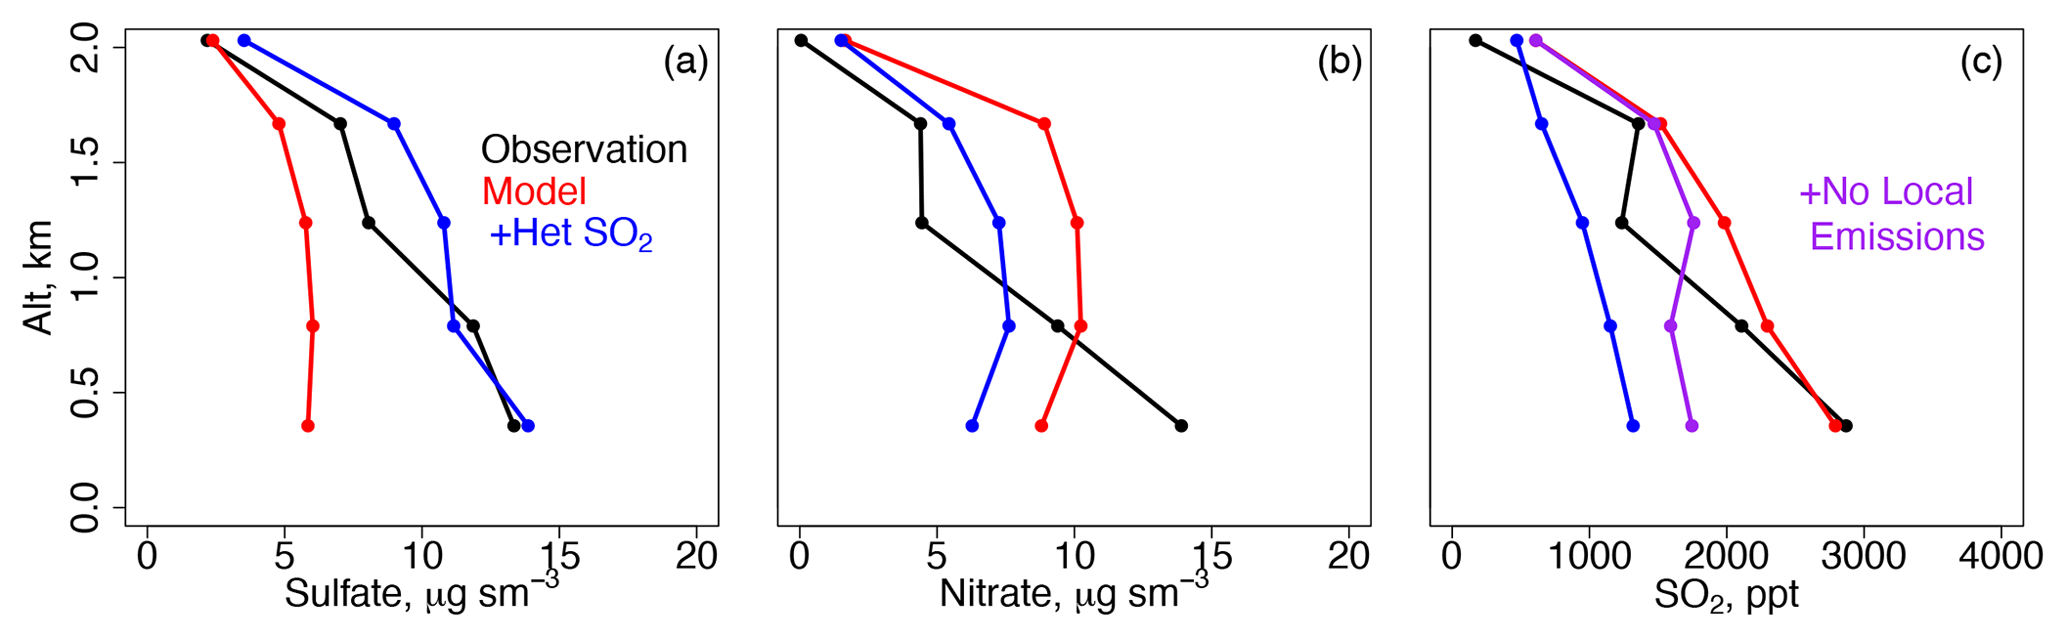
Figure 13The same as Fig. 3 but for the Transport/Haze period only for (a) sulfate, (b) nitrate, and (c) SO2. The sensitivity studies are described in Sect. 6.
As discussed in Sect. 4, in addition to the above difficulties in simulating nitrate, the model fails to reproduce observed sulfate during the Transport/Haze period, and this corresponds to a 15 µg m−3 underestimate in PM2.5 (Table 3). Studies have shown a strong relationship between increasing RH and conversion of gas-phase precursors to SNA in haze, indicating the occurrence of heterogeneous chemistry in ALWC (Sun et al., 2013; Liu et al., 2015; Quan et al., 2015; Chen et al., 2016; Wu et al., 2018). Figure 12 shows the sulfate oxidation ratio, as a function of RH at Olympic Park and from aircraft observations. In the observations, SOR increases with RH, but this is missing from the model. We take the approach of Wang et al. (2014) and implement heterogeneous uptake of SO2 on aerosol (not present in the standard model) as a function of RH according to Eq. (4),
where the mass transfer rate (kT) at which a species is lost from the gas phase is a function of the particle radius (a), the molecular diffusion coefficient (Dg), the mean molecular speed (v), and the reactive uptake coefficient (γ) or the probability of irreversible reaction. The value for γ depends on RH (Wang et al., 2014) according to Eq. (5).
The values = 3 × 10⁻⁴ and = 3 × 10⁻⁵ best fit the observations using the base model (without the aforementioned adjustments for nitrate simulation, Table 4). These values are 2 orders of magnitude slower than in the original formulation of Wang et al. (2014) but similar to more recent studies (B. Zheng et al., 2015; Chen et al., 2016). During the Transport/Haze period, this improves model agreement with sulfate observations at the surface (∼ 15 vs. Table 3: 15 µg m−3) and aloft (Fig. 13). Model agreement with daytime aircraft SO2 observations is degraded, implying that model emissions during the Transport/Haze period are insufficient to produce the amount of both observed SO2 and sulfate. The derived values for γ described above may need to be revised in future work to consider the impacts of errors in the nitrate simulation (discussed below) as well as errors in SO2 emissions.
During the Transport/Haze period, Choi et al. (2019) estimated a contribution from transported pollution of 68 %. However, the inclusion of heterogeneous uptake of SO2 on aerosol would increase the amount of both locally produced and transported pollution, as the model attributes ∼ 60 % of SO2 to foreign sources and ∼ 40 % to local emissions (Fig. 13). We simulate PM2.5 with heterogeneous conversion of SO2 as described above and then remove South Korean emissions (Table 4) in order to investigate changes to the fraction of transported pollution. Figure 14 shows the model PM2.5 composition for each case during the Transport/Haze period (with an additional 15 µg m−3 of PM2.5 in the model sensitivity with heterogeneous uptake of SO2). In the original model, foreign transport accounts for 66 % of PM2.5 (25 vs. 38 µg m−3), but this fraction is reduced to 54 % (29 vs. 53 µg m−3) in the revised model as the local contribution (13 vs. 24 µg m−3) makes up a greater fraction of the increase. Locally produced sulfate increases from only 1 % (< 1 µg m−3) to 25 % (6 µg m−3) of local PM2.5, implying that local SO2 controls could have a greater effect on PM2.5 levels than previously thought. Locally produced nitrate increases from 6 to 8 µg m−3. The total amount of model nitrate (local + foreign) decreases slightly at the surface and aloft (Fig. 13), which we attribute to the impact of sulfate on reducing εNO3 described above.
The previous calculations only account for the missing model sulfate during the Transport/Haze period and do not account for the incorrect model representation of nighttime nitrate production or overestimated model HNO3. This accounts for the dramatic increase in ALWC in Fig. 14, which is already overestimated in the original model formulation as shown in Fig. 2. Given the uncertainties in revising the model nitrate simulation, we did not assess the policy implications for improving model nitrate in terms of local vs. transported pollution. However, a simple test of the haze buildup with the heterogeneous SO2 uptake described above and including a factor of 5 increase in and increased nighttime mixing results in ∼40 % less nitrate and ALWC and 30 % less sulfate than in the simulation with heterogeneous SO2 uptake alone. Therefore, studies estimating γ to improve sulfate simulations of haze must also consider the impact of model nitrate biases on their parameterization. Follow-up work will include consideration of improvements to the model sulfate and nitrate simulation with a coupled model system such as WRF-GC (Lin et al., 2020) that is able to better simulate the urban scale as well as long-range transport.
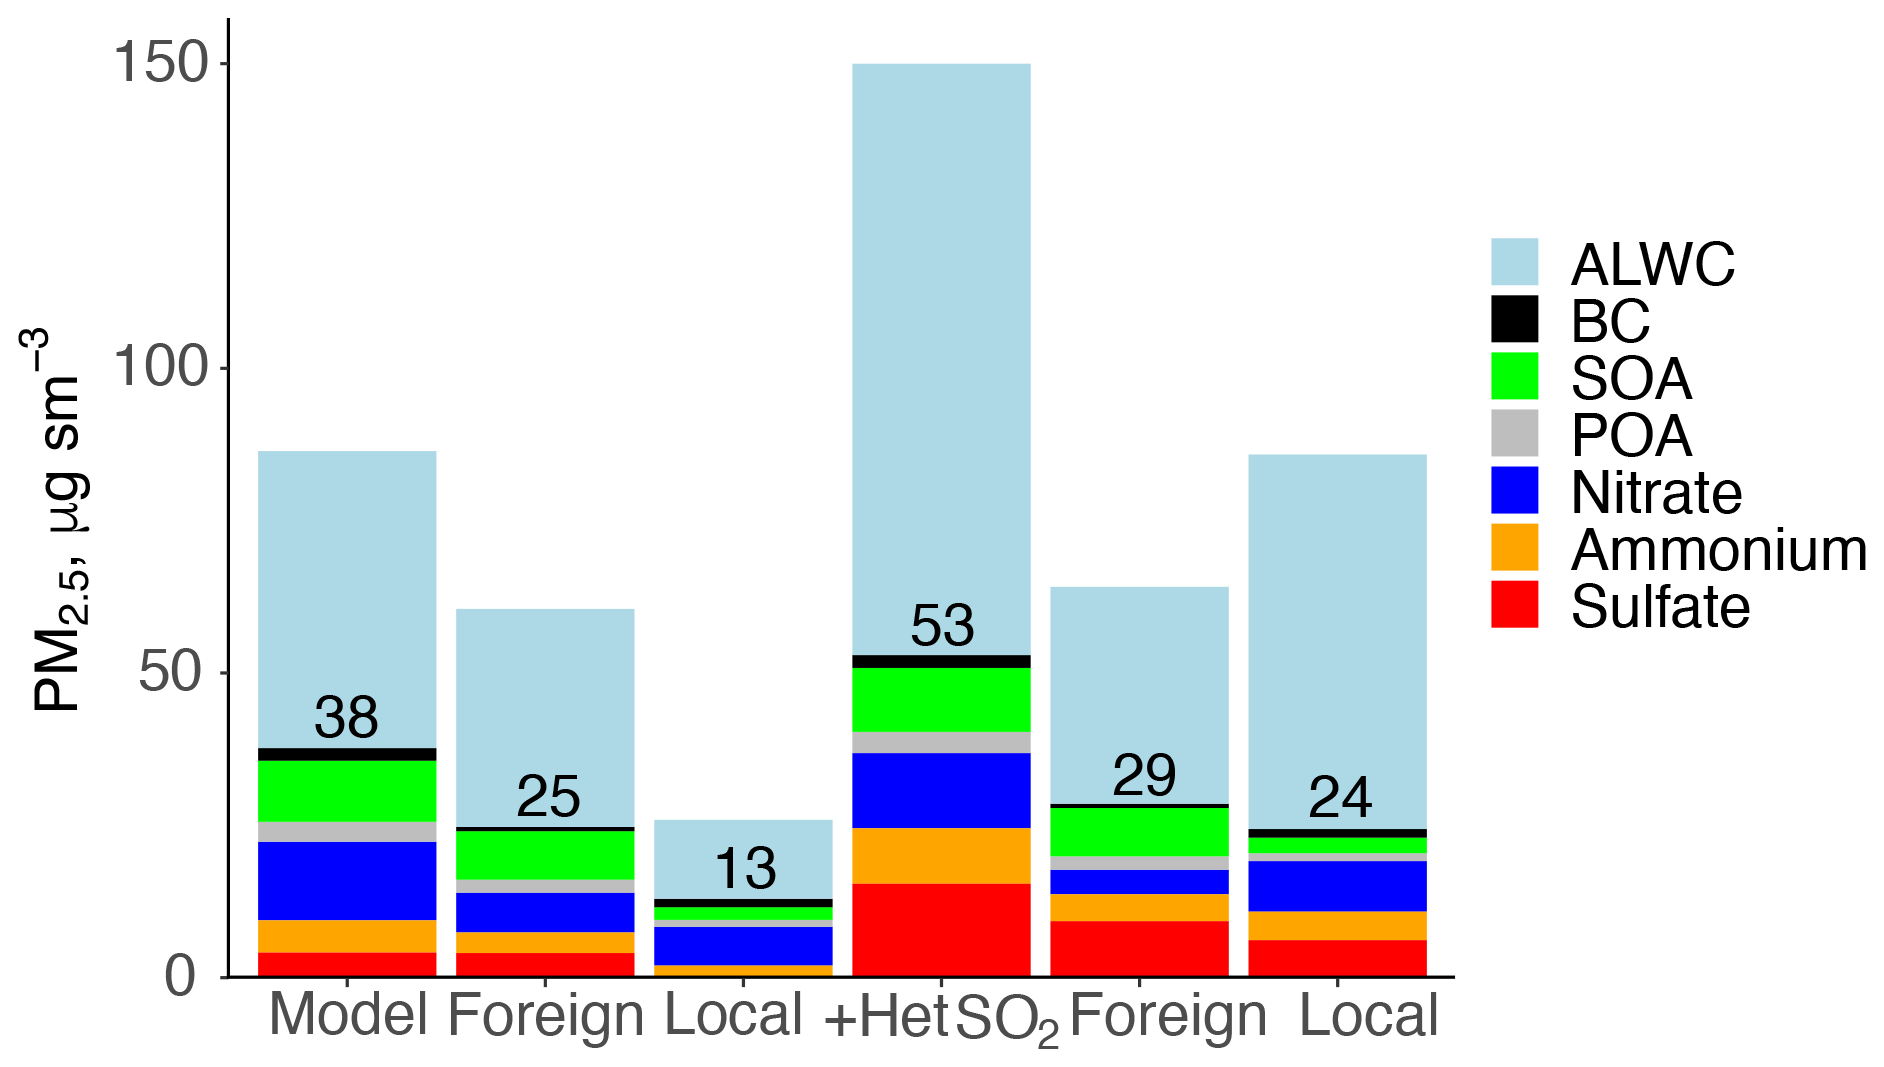
Figure 14Composition of model PM2.5 during the Transport/Haze period. The foreign and local contributions as well as the model sensitivity test including heterogeneous uptake of SO2 to aerosol (Het SO2) are calculated as discussed in Sect. 6. The total PM2.5 excluding aerosol liquid water content (ALWC) is given for each simulation.
We used aircraft and surface observations from the NIER-NASA KORUS-AQ field campaign in May and June 2016 to evaluate GEOS-Chem simulations of PM2.5 composition in the Seoul Metropolitan Area, including during a haze pollution event characterized by high levels of secondary inorganic aerosol. Models generally underestimate sulfate during haze and generally overestimate nitric acid and the gas–particle partitioning of nitric acid to aerosol in East Asia (An et al., 2019). This is of concern for using models to determine the fraction of PM2.5 pollution that can be controlled using local policy measures in South Korea and the extent to which exceedances of PM2.5 standards are caused by long-range transport.
The model underestimated PM2.5 in Seoul during the campaign (NMB = −15 %) with larger errors in composition. On average, the model underestimated sulfate (−64 %) and SOA (−43 %) but overestimated nitrate (+36 %). Models typically underestimate secondary organic aerosol (SOA, Zhao et al., 2016), and this could be due to missing sources from anthropogenic precursors (Nault et al., 2021b). This SOA bias will be investigated in future studies. Aircraft observations, which are only available during daytime hours, showed model underestimates in sulfate comparable to the bias at the surface. However, modeled nitrate was underestimated aloft, contradicting the model overestimate in the campaign average (which includes nighttime observations). Hourly surface observations showed that this was due to a model overestimate at night. During the campaign, nitrate formation was limited by the supply of nitric acid, which was overestimated against daytime aircraft observations by +100 % and contributed to the model nighttime bias.
The model overestimate in nitric acid was not due to overestimated production, insufficient loss to wet deposition, or uptake to dust or sea salt. Increasing the loss of nitric acid, implemented here as an increase in the nitric acid dry deposition velocity by a factor of 5, was required to reconcile the model with observations. Aircraft observations of total nitrate (TNO3=HNO3 and pNO3) as a function of photochemical age support this increase. The model underestimate in deposition could be explained by missing treatment of turbulence driven by the urban heat island effect and the heterogeneity of the urban landscape, which would also increase the surface area available for deposition. Here, we only consider the effect on HNO3, but these factors would also impact other species that readily deposit to surfaces such as NH3, which was not measured during the campaign.
Observations of ozone, NO2, and ClNO2 showed that N2O5 hydrolysis should be the main driver of nighttime nitrate production, while the model primarily produced nitrate through aerosol uptake of NO2. The model overly titrated ozone, with an average nighttime concentration of 13 ppb compared to 23 ppb in the observations. This resulted in excess model NO2 and prevented production of N2O5. Observations of ozone and nighttime mixed layer height implied insufficient nighttime mixing and an overly rapid collapse of the afternoon mixed layer in the model. We attributed these errors to the premature shutdown of afternoon eddies and missing treatment of the urban heat island effect that typically generates a positive nighttime heat flux not present in the model. Nighttime measurements of the vertical structure of key species such as ozone, NO2, N2O5, and HNO3, ideally complemented by surface heat flux observations, are needed to further constrain model nighttime nitrate production and determine the extent to which the model underestimates nighttime heating and mixing depth.
The model errors in simulating nitrate and nitric acid, mainly arising from overestimated daytime nitric acid and excess nighttime ozone titration, are exacerbated in the simulation of haze pollution. Overestimated nitric acid results in larger values of daytime nitrate during the haze buildup. This could be due to the model underestimate in sulfate as overestimated model pH would allow for increased partitioning of nitric acid to the particle phase. Nighttime nitrate in the model is underestimated during the haze buildup, likely due to missing rapid N2O5 hydrolysis. Sensitivity simulations showed that raising the nighttime mixed layer and providing a positive nighttime sensible heat flux of +10 W m−2 improved the model simulation of nitrate and ozone and allowed for nighttime production of nitrate via N2O5. Previous studies have simply raised the nighttime mixed layer and found little effect on simulated pollution (Oak et al., 2019; Miao et al., 2020), but this may be due to missing nocturnal heating from anthropogenic heat release.
The underestimate in model sulfate during the KORUS-AQ haze event is typical of models that do not include heterogeneous aerosol uptake of SO2 (Wang et al., 2014; B. Zheng et al., 2015; G. J. Zheng et al., 2015; Shao et al., 2019). Observations of the sulfate oxidation ratio (SOR) as a function of RH supported the need for this pathway as the strong increase in SOR with RH was not present in the model. A simple parameterization of this process increased model sulfate levels from 4 to 15 µg m−3 during the haze, in better agreement with observations. However, the success of this parameterization was complicated by model nitrate biases. A simulation of the haze with both improved model nitrate and heterogeneous uptake of SO2 resulted in a 30 % reduction in model sulfate over the simulation with heterogeneous uptake of SO2, illustrating the need to consider model biases in sulfate and nitrate simultaneously. GEOS-Chem parameterizations of the urban environment are lacking and cannot be currently adjusted to robustly simulate nitrate during the campaign. Future studies attempting to simulate sulfate in haze should consider the impact of model nitrate biases on their parameterizations. These studies require models that are able to simulate a large domain to calculate long-range transport but include the detailed parameterizations of the urban environment (urban heat island effect, etc.) required to successfully simulate nitrate.
Determining the contribution of local vs. transported PM2.5 is essential to the development of successful policy measures to reduce unhealthy pollution levels. Significant effort has gone into this evaluation in South Korea, but with models that have errors in PM2.5 composition (Choi et al., 2019; Kumar et al., 2021). The local PM2.5 contribution may be underestimated without including heterogeneous uptake of SO2 on aerosol to produce sulfate during haze. Locally produced PM2.5 increased from 13 to 24 µg m−3, decreasing the fraction of foreign pollution from 66 % to 54 %. Locally produced sulfate increased from < 1 to 6 µg m−3, implying that controls on SO2 could have a larger impact than in model formulations without this chemistry. As a consequence of the 2013 Clean Air Action plan implemented in China, emissions of inorganic aerosol precursors have been decreasing (Zheng et al., 2018), resulting in declines in PM2.5 (Zhai et al., 2019). Emission reductions in South Korea may be less rapid (Bae et al., 2021), and thus the impact of long-range transport on future PM2.5 pollution events could decline in the future. It is critical for models to improve representations of the interactions between physical processes and chemical production of PM2.5 to support continued local air quality improvements. Follow-up studies to this work will evaluate model performance during other seasons (i.e., winter) using a model system with online meteorology to determine whether factors driving model errors in this work occur throughout the year.
The model code used in this work is available at https://doi.org/10.5281/zenodo.5620667 (Travis, 2022).
The KORUS-AQ data archive (KORUS-AQ Science Team, 2019) includes both the aircraft and ground-based measurements from AirKorea, Olympic Park, and KIST. The precipitation data are available at https://www.ncdc.noaa.gov/cdo-web/confirmation (NOAA, 2021). Cloud observations (RKSS ASOS station) are available here: http://mesonet.agron.iastate.edu/request/download.phtml (Iowa Environmental Mesonet, 2020).
The supplement related to this article is available online at: https://doi.org/10.5194/acp-22-7933-2022-supplement.
The original draft preparation was completed by KRT, with review and editing by JHC, BAN, CEJ, HK, and GC. JHC, CEJ, GC, BAN, HK, and KRT contributed to project conceptualization. Modeling work was done by KRT, with additional support from SZ, XW, EM, GL, and FY. Formal analysis was completed by KRT and BAN. The observational data for this project were provided by BAN, HK, JLJ, PCJ, JED, MJK, SK, IJS, DRB, and LC. JHW and YK provided the KORUS-AQ emissions.
At least one of the co-authors is a member of the editorial board of Atmospheric Chemistry and Physics. The peer-review process was guided by an independent editor, and the authors also have no other competing interests to declare.
Publisher's note: Copernicus Publications remains neutral with regard to jurisdictional claims in published maps and institutional affiliations.
We acknowledge Gangwoong Lee for his leadership in managing the campaign efforts at Olympic Park. We acknowledge Andrew Weinheimer for the use of his NO and NO2 data from KORUS-AQ. We acknowledge Ron Cohen for the use of the TD-LIF data. We acknowledge Glenn Diskin for the use of DACOM CO and DLH RH data. We acknowledge Bill Brune for the use of his ATHOS OH data. We acknowledge Paul Wennberg and John Crounse for the use of their CIT-CIMS HNO3 data. We acknowledge L. Greg Huey for the use of his SO2 data. We acknowledge James J. Szykman for the use of ceilometer data at Olympic Park. We acknowledge Seogjo Cho for the MARGA data at Olympic Park. We acknowledge Ke Li and Yingying Yan for their help implementing aromatic chemistry in GEOS-Chem. We thank Jerome Fast, Rahul Zaveri, and David Peterson for helpful discussions. Katherine R. Travis and Benjamin A. Nault were supported by NASA grant 80NSSC22K0283. Pedro Campuzano-Jost and Jose L. Jimenez were supported by NASA grants 80NSSC18K0630 and 80NSSC19K0124. The GEOS-FP data used in this study/project have been provided by the Global Modeling and Assimilation Office (GMAO) at NASA Goddard Space Flight Center.
This research has been supported by the National Aeronautics and Space Administration (grant nos. 80NSSC18K0630, 80NSSC19K0124 and 80NSSC22K0283).
This paper was edited by Chul Han Song and reviewed by two anonymous referees.
Alexander, B., Park, R. J., Jacob, D. J., Li, Q. B., Yantosca, R. M., Savarino, J., Lee, C. C. W., and Thiemens, M. H.: Sulfate formation in sea-salt aerosols: Constraints from oxygen isotopes, J. Geophys. Res.-Atmos., 110, D10307, https://doi.org/10.1029/2004JD005659, 2005.
Alexander, B., Park, R. J., Jacob, D. J., and Gong, S.: Transition metal-catalyzed oxidation of atmospheric sulfur: Global implications for the sulfur budget, J. Geophys. Res., 114, D02309, https://doi.org/10.1029/2008JD010486, 2009.
Amos, H. M., Jacob, D. J., Holmes, C. D., Fisher, J. A., Wang, Q., Yantosca, R. M., Corbitt, E. S., Galarneau, E., Rutter, A. P., Gustin, M. S., Steffen, A., Schauer, J. J., Graydon, J. A., St. Louis, V. L., Talbot, R. W., Edgerton, E. S., Zhang, Y., and Sunderland, E. M.: Gas-particle partitioning of atmospheric Hg(II) and its effect on global mercury deposition, Atmos. Chem. Phys., 12, 591–603, https://doi.org/10.5194/acp-12-591-2012, 2012.
An, Z., Huang, R.-J., Zhang, R., Tie, X., Li, G., Cao, J., Zhou, W., Shi, Z., Han, Y., Gu, Z., and Ji, Y.: Severe haze in northern China: A synergy of anthropogenic emissions and atmospheric processes, P. Natl. Acad. Sci. USA, 116, 8657–8666, 2019.
Bae, M., Kim, B.-U., Kim, H. C., Kim, J., and Kim, S.: Role of emissions and meteorology in the recent PM2.5 changes in China and South Korea from 2015 to 2018, Environ. Pollut., 270, 116233, https://doi.org/10.1016/j.envpol.2020.116233, 2021.
Baergen, A. M. and Donaldson, D. J.: Photochemical Renoxification of Nitric Acid on Real Urban Grime, Environ. Sci. Technol., 47, 815–820, 2013.
Baergen, A. M. and Donaldson, D. J.: Formation of reactive nitrogen oxides from urban grime photochemistry, Atmos. Chem. Phys., 16, 6355–6363, https://doi.org/10.5194/acp-16-6355-2016, 2016.
Bian, H., Chin, M., Hauglustaine, D. A., Schulz, M., Myhre, G., Bauer, S. E., Lund, M. T., Karydis, V. A., Kucsera, T. L., Pan, X., Pozzer, A., Skeie, R. B., Steenrod, S. D., Sudo, K., Tsigaridis, K., Tsimpidi, A. P., and Tsyro, S. G.: Investigation of global particulate nitrate from the AeroCom phase III experiment, Atmos. Chem. Phys., 17, 12911–12940, https://doi.org/10.5194/acp-17-12911-2017, 2017.
Blay-Carreras, E., Pardyjak, E. R., Pino, D., Alexander, D. C., Lohou, F., and Lothon, M.: Countergradient heat flux observations during the evening transition period, Atmos. Chem. Phys., 14, 9077–9085, https://doi.org/10.5194/acp-14-9077-2014, 2014.
Bouwman, A. F., Lee, D. S., Asman, W. A. H., Dentener, F. J., Van Der Hoek, K. W., and Olivier, J. G. J.: A global high-resolution emission inventory for ammonia, Global Biogeochem. Cy., 11, 561–587, 1997.
Brune, W. H., Miller, D. O., Thames, A. B., Allen, H. M., Apel, E. C., Blake, D. R., Bui, T. P., Commane, R., Crounse, J. D., Daube, B. C., Diskin, G. S., DiGangi, J. P., Elkins, J. W., Hall, S. R., Hanisco, T. F., Hannun, R. A., Hintsa, E. J., Hornbrook, R. S., Kim, M. J., McKain, K., Moore, F. L., Neuman, J. A., Nicely, J. M., Peischl, J., Ryerson, T. B., St. Clair, J. M., Sweeney, C., Teng, A. P., Thompson, C., Ullmann, K., Veres, P. R., Wennberg, P. O., and Wolfe, G. M.: Exploring Oxidation in the Remote Free Troposphere: Insights From Atmospheric Tomography (ATom), J. Geophys. Res.-Atmos., 125, e2019JD031685, https://doi.org/10.1029/2019JD031685, 2020.
Carn, S. A., Yang, K., Prata, A. J., and Krotkov, N. A.: Extending the long-term record of volcanic SO2 emissions with the Ozone Mapping and Profiler Suite nadir mapper: OMPS volcanic SO2 measurements, Geophys. Res. Lett., 42, 925–932, 2015.
Chan, Y., Evans, M. J., He, P., Holmes, C. D., Jaeglé, L., Kasibhatla, P., Liu, X., Sherwen, T., Thornton, J. A., Wang, X., Xie, Z., Zhai, S., and Alexander, B.: Heterogeneous nitrate production mechanisms in intense haze events in the North China Plain, J. Geophys. Res., 126, e2021JD034688, https://doi.org/10.1029/2021jd034688, 2021.
Chang, Y., Zou, Z., Zhang, Y., Deng, C., Hu, J., Shi, Z., Dore, A. J., and Collett Jr., J. L.: Assessing Contributions of Agricultural and Nonagricultural Emissions to Atmospheric Ammonia in a Chinese Megacity, Environ. Sci. Technol., 53, 1822–1833, 2019.
Chan Miller, C., Jacob, D. J., Marais, E. A., Yu, K., Travis, K. R., Kim, P. S., Fisher, J. A., Zhu, L., Wolfe, G. M., Hanisco, T. F., Keutsch, F. N., Kaiser, J., Min, K.-E., Brown, S. S., Washenfelder, R. A., González Abad, G., and Chance, K.: Glyoxal yield from isoprene oxidation and relation to formaldehyde: chemical mechanism, constraints from SENEX aircraft observations, and interpretation of OMI satellite data, Atmos. Chem. Phys., 17, 8725–8738, https://doi.org/10.5194/acp-17-8725-2017, 2017.
Chen, D., Wang, Y., McElroy, M. B., He, K., Yantosca, R. M., and Le Sager, P.: Regional CO pollution and export in China simulated by the high-resolution nested-grid GEOS-Chem model, Atmos. Chem. Phys., 9, 3825–3839, https://doi.org/10.5194/acp-9-3825-2009, 2009.
Chen, D., Liu, Z., Fast, J., and Ban, J.: Simulations of sulfate–nitrate–ammonium (SNA) aerosols during the extreme haze events over northern China in October 2014, Atmos. Chem. Phys., 16, 10707–10724, https://doi.org/10.5194/acp-16-10707-2016, 2016.
Chen, L., Gao, Y., Zhang, M., Fu, J. S., Zhu, J., Liao, H., Li, J., Huang, K., Ge, B., Wang, X., Lam, Y. F., Lin, C.-Y., Itahashi, S., Nagashima, T., Kajino, M., Yamaji, K., Wang, Z., and Kurokawa, J.: MICS-Asia III: multi-model comparison and evaluation of aerosol over East Asia, Atmos. Chem. Phys., 19, 11911–11937, https://doi.org/10.5194/acp-19-11911-2019, 2019.
Chen, Q., Schmidt, J. A., Shah, V., Jaeglé, L., Sherwen, T., and Alexander, B.: Sulfate production by reactive bromine: Implications for the global sulfur and reactive bromine budgets: Sulfur-Halogen Interactions, Geophys. Res. Lett., 44, 7069–7078, 2017.
Choi, J., Park, R. J., Lee, H.-M., Lee, S., Jo, D. S., Jeong, J. I., Henze, D. K., Woo, J.-H., Ban, S.-J., Kee, M.-D., Lim, C.-S., Park, M.-K., Shin, H. J., Cho, S., Peterson, D., and Song, C.-K.: Impacts of local vs. trans-boundary emissions from different sectors on PM2.5 exposure in South Korea during the KORUS-AQ campaign, Atmos. Environ., 203, 196–205, 2019.
Clegg, S. L. and Brimblecombe, P.: Equilibrium partial pressures and mean activity and osmotic coefficients of 0 %–100 % nitric acid as a function of temperature, J. Phys. Chem., 94, 5369–5380, 1990.
Clegg, S. L., Brimblecombe, P., and Wexler, A. S.: Thermodynamic Model of the System H+––––H2O at Tropospheric Temperatures, J. Phys. Chem. A, 102, 2137–2154, 1998.
Crawford, J. H., Ahn, J.-Y., Al-Saadi, J. A., Chang, L., Emmons, L. K., Kim, J., Lee, G., Park, J.-H., Park, R. J., Woo, J. H., Song, C. K., Hong, J.-H., Hong, Y.-D., Lefer, B. L., Lee, M., Lee, T., Kim, S., Min, K.-E., Yum, S. S., Shin, H. J., Kim, Y.-W., Choi, J.-S., Park, J.-S., Szykman, J. J., Long, R. W., Jordan, C. E., Simpson, I. J., Fried, A., Dibb, J. E., Cho, S. Y., and Kim, Y. P.: The Korea-United States Air Quality (KORUS-AQ) Field Study, Elem. Sci. Anth., 9, 1–27, https://doi.org/10.1525/elementa.2020.00163, 2021.
Crounse, J. D.: Measurement of Gas-Phase Hydroperoxides by Chemical Ionization Mass Spectrometry, Anal. Chem., 78, 6726–6732, https://doi.org/10.1021/ac0604235, 2006.
Day, D. A., Wooldridge, P. J., Dillon, M. B., Thornton, J. A., and Cohen, R. C.: A thermal dissociation laser-induced fluorescence instrument for in situ detection of NO2, peroxy nitrates, alkyl nitrates, and HNO3, J. Geophys. Res., 107, ACH 4-1–ACH 4-14, https://doi.org/10.1029/2001JD000779, 2002.
Dibb, J. E., Talbot, R. W., Scheuer, E. M., Seid, G., Avery, M. A., and Hanwant, B.: Aerosol chemical composition in Asian continental outflow during the TRACE-P campaign: Comparison with PEM-West B, J. Geophys. Res.-Atmos., 108, 8815, https://doi.org/10.1029/2002JD003111, 2003.
Diskin, G. S., Podolske, J. R., Sachse, G. W., and Slate, T. A.: Open-path airborne tunable diode laser hygrometer, Proc. SPIE, 4817, 196–204, https://doi.org/10.1117/12.453736, 2002.
Emerson, E. W., Hodshire, A. L., DeBolt, H. M., Bilsback, K. R., Pierce, J. R., McMeeking, G. R., and Farmer, D. K.: Revisiting particle dry deposition and its role in radiative effect estimates, P. Natl. Acad. Sci. USA, 117, 26076–26082, https://doi.org/10.1073/pnas.2014761117, 2020.
Energy Policy Institute: Air Quality Life Index: South Korea Fact Sheet, https://aqli.epic.uchicago.edu/wp-content/uploads/2019/05/EPIC_SouthKorea_FactSheet_31319.pdf (last access: 24 February 2020), 2019.
Fairlie, T. D., Jacob, D. J., Dibb, J. E., Alexander, B., Avery, M. A., van Donkelaar, A., and Zhang, L.: Impact of mineral dust on nitrate, sulfate, and ozone in transpacific Asian pollution plumes, Atmos. Chem. Phys., 10, 3999–4012, https://doi.org/10.5194/acp-10-3999-2010, 2010.
Faloona, I. C., Tan, D., Lesher, R. L., Hazen, N. L., Frame, C. L., Simpas, J. B., Harder, H., Martinez, M., Di Carlo, P., Ren, X., and Brune, W. H.: A Laser-induced Fluorescence Instrument for Detecting Tropospheric OH and HO2 : Characteristics and Calibration, J. Atmos. Chem., 47, 139–167, https://doi.org/10.1023/B:JOCH.0000021036.53185.0e, 2004.
Fischer, E. V., Jacob, D. J., Yantosca, R. M., Sulprizio, M. P., Millet, D. B., Mao, J., Paulot, F., Singh, H. B., Roiger, A., Ries, L., Talbot, R. W., Dzepina, K., and Pandey Deolal, S.: Atmospheric peroxyacetyl nitrate (PAN): a global budget and source attribution, Atmos. Chem. Phys., 14, 2679–2698, https://doi.org/10.5194/acp-14-2679-2014, 2014.
Fisher, J. A., Jacob, D. J., Travis, K. R., Kim, P. S., Marais, E. A., Chan Miller, C., Yu, K., Zhu, L., Yantosca, R. M., Sulprizio, M. P., Mao, J., Wennberg, P. O., Crounse, J. D., Teng, A. P., Nguyen, T. B., St. Clair, J. M., Cohen, R. C., Romer, P., Nault, B. A., Wooldridge, P. J., Jimenez, J. L., Campuzano-Jost, P., Day, D. A., Hu, W., Shepson, P. B., Xiong, F., Blake, D. R., Goldstein, A. H., Misztal, P. K., Hanisco, T. F., Wolfe, G. M., Ryerson, T. B., Wisthaler, A., and Mikoviny, T.: Organic nitrate chemistry and its implications for nitrogen budgets in an isoprene- and monoterpene-rich atmosphere: constraints from aircraft (SEAC4RS) and ground-based (SOAS) observations in the Southeast US, Atmos. Chem. Phys., 16, 5969–5991, https://doi.org/10.5194/acp-16-5969-2016, 2016.
Fisher, J. A., Atlas, E. L., Barletta, B., Meinardi, S., Blake, D. R., Thompson, C. R., Ryerson, T. B., Peischl, J., Tzompa-Sosa, Z. A., and Murray, L. T.: Methyl, ethyl, and propyl nitrates: global distribution and impacts on reactive nitrogen in remote marine environments, J. Geophys. Res., 123, 12429–12451, https://doi.org/10.1029/2018JD029046, 2018.
GBD –Global Burden of Disease – Collaborative Network: Global Burden of Disease Study 2019 (GBD 2019) Reference Life Table, https://doi.org/10.6069/1D4Y-YQ37, IHME – Institute for Health Metrics and Evaluation, 2021.
Ge, X., Zhang, Q., Sun, Y., Ruehl, C. R., and Setyan, A.: Effect of aqueous-phase processing on aerosol chemistry and size distributions in Fresno, California, during wintertime, Environ. Chem., 9, 221–235, https://doi.org/10.1016/j.atmosenv.2013.06.019, 2012.
Guenther, A. B., Jiang, X., Heald, C. L., Sakulyanontvittaya, T., Duhl, T., Emmons, L. K., and Wang, X.: The Model of Emissions of Gases and Aerosols from Nature version 2.1 (MEGAN2.1): an extended and updated framework for modeling biogenic emissions, Copernicus, http://dspace.mit.edu/handle/1721.1/78869 (last access: 12 February 2018), 2012.
Guo, H., Sullivan, A. P., Campuzano-Jost, P., Schroder, J. C., Lopez-Hilfiker, F. D., Dibb, J. E., Jimenez, J. L., Thornton, J. A., Brown, S. S., Nenes, A., and Weber, R. J.: Fine particle pH and the partitioning of nitric acid during winter in the northeastern United States, J. Geophys. Res.-Atmos., 121, 10355–10376, 2016.
Guo, H., Liu, J., Froyd, K. D., Roberts, J. M., Veres, P. R., Hayes, P. L., Jimenez, J. L., Nenes, A., and Weber, R. J.: Fine particle pH and gas–particle phase partitioning of inorganic species in Pasadena, California, during the 2010 CalNex campaign, Atmos. Chem. Phys., 17, 5703–5719, https://doi.org/10.5194/acp-17-5703-2017, 2017.
Guo, H., Campuzano-Jost, P., Nault, B. A., Day, D. A., Schroder, J. C., Kim, D., Dibb, J. E., Dollner, M., Weinzierl, B., and Jimenez, J. L.: The importance of size ranges in aerosol instrument intercomparisons: a case study for the Atmospheric Tomography Mission, Atmos. Meas. Tech., 14, 3631–3655, https://doi.org/10.5194/amt-14-3631-2021, 2021.
Halios, C. H. and Barlow, J. F.: Observations of the Morning Development of the Urban Boundary Layer Over London, UK, Taken During the ACTUAL Project, Bound.-Lay. Meteorol., 166, 395–422, 2018.
Han, X., Cai, J., Zhang, M., and Wang, X.: Numerical simulation of interannual variation in transboundary contributions from Chinese emissions to PM2.5 mass burden in South Korea, Atmos. Environ., 256, 118440, https://doi.org/10.1016/j.atmosenv.2021.118440, 2021.
Heald, C. L., Collett Jr., J. L., Lee, T., Benedict, K. B., Schwandner, F. M., Li, Y., Clarisse, L., Hurtmans, D. R., Van Damme, M., Clerbaux, C., Coheur, P.-F., Philip, S., Martin, R. V., and Pye, H. O. T.: Atmospheric ammonia and particulate inorganic nitrogen over the United States, Atmos. Chem. Phys., 12, 10295–10312, https://doi.org/10.5194/acp-12-10295-2012, 2012.
Hegarty, J. D., Lewis, J., McGrath-Spangler, E. L., Henderson, J., Scarino, A. J., DeCola, P., Ferrare, R., Hicks, M., Adams-Selin, R. D., and Welton, E. J.: Analysis of the Planetary Boundary Layer Height during DISCOVER-AQ Baltimore–Washington, D. C., with Lidar and High-Resolution WRF Modeling, J. Appl. Meteorol. Clim., 57, 2679–2696, 2018.
Herrmann, H., Schaefer, T., Tilgner, A., Styler, S. A., Weller, C., Teich, M., and Otto, T.: Tropospheric aqueous-phase chemistry: kinetics, mechanisms, and its coupling to a changing gas phase, Chem. Rev., 115, 4259–4334, 2015.
Hoesly, R. M., Smith, S. J., Feng, L., Klimont, Z., Janssens-Maenhout, G., Pitkanen, T., Seibert, J. J., Vu, L., Andres, R. J., Bolt, R. M., Bond, T. C., Dawidowski, L., Kholod, N., Kurokawa, J.-I., Li, M., Liu, L., Lu, Z., Moura, M. C. P., O'Rourke, P. R., and Zhang, Q.: Historical (1750–2014) anthropogenic emissions of reactive gases and aerosols from the Community Emissions Data System (CEDS), Geosci. Model Dev., 11, 369–408, https://doi.org/10.5194/gmd-11-369-2018, 2018.
Holmes, C. D., Bertram, T. H., Confer, K. L., Graham, K. A., Ronan, A. C., Wirks, C. K., and Shah, V.: The Role of Clouds in the Tropospheric NOx Cycle: A New Modeling Approach for Cloud Chemistry and Its Global Implications, Geophys. Res. Lett., 46, 4980–4990, 2019.
Holtslag, A. A. M. and Boville, B. A.: Local Versus Nonlocal Boundary-Layer Diffusion in a Global Climate Model, J. Climate, 6, 1825–1842, 1993.
Hong, J.-W. and Hong, J.: Changes in the Seoul Metropolitan Area Urban Heat Environment with Residential Redevelopment, J. Appl. Meteorol. Clim., 55, 1091–1106, 2016.
Hudman, R. C., Moore, N. E., Mebust, A. K., Martin, R. V., Russell, A. R., Valin, L. C., and Cohen, R. C.: Steps towards a mechanistic model of global soil nitric oxide emissions: implementation and space based-constraints, Atmos. Chem. Phys., 12, 7779–7795, https://doi.org/10.5194/acp-12-7779-2012, 2012.
Ibikunle, I., Beyersdorf, A., Campuzano-Jost, P., Corr, C., Crounse, J. D., Dibb, J., Diskin, G., Huey, G., Jimenez, J.-L., Kim, M. J., Nault, B. A., Scheuer, E., Teng, A., Wennberg, P. O., Anderson, B., Crawford, J., Weber, R., and Nenes, A.: Fine particle pH and sensitivity to NH3 and HNO3 over summertime South Korea during KORUS-AQ, Atmos. Chem. Phys. Discuss. [preprint], https://doi.org/10.5194/acp-2020-501, 2020.
Iowa Environmental Mesonet: Automated Surface Observation System, ASOS, Iowa Environmental Mesonet [data set], http://mesonet.agron.iastate.edu/request/download.phtml, last access: 23 June 2020.
Itahashi, S., Uno, I., Osada, K., Kamiguchi, Y., Yamamoto, S., Tamura, K., Wang, Z., Kurosaki, Y., and Kanaya, Y.: Nitrate transboundary heavy pollution over East Asia in winter, Atmos. Chem. Phys., 17, 3823–3843, https://doi.org/10.5194/acp-17-3823-2017, 2017.
Jacob, D.: Heterogeneous chemistry and tropospheric ozone, Atmos. Environ., 34, 2131–2159, 2000.
Jaeglé, L., Quinn, P. K., Bates, T. S., Alexander, B., and Lin, J.-T.: Global distribution of sea salt aerosols: new constraints from in situ and remote sensing observations, Atmos. Chem. Phys., 11, 3137–3157, https://doi.org/10.5194/acp-11-3137-2011, 2011.
Jeong, D., Seco, R., Gu, D., Lee, Y., Nault, B. A., Knote, C. J., Mcgee, T., Sullivan, J. T., Jimenez, J. L., Campuzano-Jost, P., Blake, D. R., Sanchez, D., Guenther, A. B., Tanner, D., Huey, L. G., Long, R., Anderson, B. E., Hall, S. R., Ullmann, K., Shin, H., Herndon, S. C., Lee, Y., Kim, D., Ahn, J., and Kim, S.: Integration of airborne and ground observations of nitryl chloride in the Seoul metropolitan area and the implications on regional oxidation capacity during KORUS-AQ 2016, Atmos. Chem. Phys., 19, 12779–12795, https://doi.org/10.5194/acp-19-12779-2019, 2019.
Jordan, C., Crawford, J. H., Beyersdorf, A. J., Eck, T. F., Halliday, H. S., Nault, B. A., Chang, L.-S., Park, J., Park, R., Lee, G., Kim, H., Ahn, J.-Y., Cho, S., Shin, H. J., Lee, J. H., Jung, J., Kim, D.-S., Lee, M., Lee, T., Whitehill, A., Szykman, J., Schueneman, M. K., Campuzano-Jost, P., Jimenez, J. L., DiGangi, J. P., Diskin, G. S., Anderson, B. E., Moore, R. H., Ziemba, L. D., Fenn, M. A., Hair, J. W., Kuehn, R. E., Holz, R. E., Chen, G., Travis, K., Shook, M., Peterson, D. A., Lamb, K. D., and Schwarz, J. P.: Investigation of factors controlling PM2.5 variability across the South Korean Peninsula during KORUS-AQ, Elementa, 8, 28, https://doi.org/10.1525/elementa.424, 2020.
Jung, J., Ghim, Y. S., Lyu, Y. S., Lim, Y.-J., Park, J., and Sung, M.-Y.: Quantification of regional contributions to fine particles at downwind areas under Asian continental outflows during winter 2014, Atmos. Environ., 210, 231–240, 2019.
Kasibhatla, P., Chameides, W. L., and St. John, J.: A three-dimensional global model investigation of seasonal variations in the atmospheric burden of anthropogenic sulfate aerosols, J. Geophys. Res., 102, 3737–3759, https://doi.org/10.1029/96JD03084, 1997.
Keuken, M. P., Bakker, F. P., Möls, J. J., Broersen, B., and Slanina, J.: Atmospheric Deposition and Conversion of Ammonium to Nitric Acid on a Historic Building: A Pilot Study, Int. J. Environ. An. Ch., 38, 47–62, 1990.
Kim, H., Zhang, Q., and Heo, J.: Influence of intense secondary aerosol formation and long-range transport on aerosol chemistry and properties in the Seoul Metropolitan Area during spring time: results from KORUS-AQ, Atmos. Chem. Phys., 18, 7149–7168, https://doi.org/10.5194/acp-18-7149-2018, 2018a.
Kim, J.-H., Kim, H.-J., and Yoo, S.-H.: Public Value of Enforcing the PM2.5 Concentration Reduction Policy in South Korean Urban Areas, Sustain. Sci. Pract. Policy, 10, 1144, https://doi.org/10.3390/su10041144, 2018b.
Kim, S., Huey, L. G., Stickel, R. E., Tanner, D. J., Crawford, J. H., Olson, J. R., Chen, G., Brune, W. H., Ren, X., Lesher, R., Wooldridge, P. J., Bertram, T. H., Perring, A., Cohen, R. C., Lefer, B. L., Shetter, R. E., Avery, M., Diskin, G., and Sokolik, I.: Measurement of HO2NO2 in the free troposphere during the Intercontinental Chemical Transport Experiment–North America 2004, J. Geophys. Res., 112, D12S01, https://doi.org/10.1029/2006JD007676, 2007.
Kim, Y., Park, O., Park, S. H., Kim, M., Kim, J.-J., Choi, J.-Y., Lee, D., Cho, S., and Shim, S.: PM2.5 pH estimation in Seoul during the KORUS-AQ campaign using different thermodynamic models, Atmos. Environ., 268, 118787, https://doi.org/10.1016/j.atmosenv.2021.118787, 2022.
KMA – Korea Meteorological Administration: KMA Weather Data Service Open MET Data Portal, https://data.kma.go.kr/resources/html/en/aowdp.html, last access: 29 March 2021.
KORUS-AQ Science Team: KORUS-AQ Data, NASA Langley Research Center [data set], https://doi.org/10.5067/Suborbital/KORUSAQ/DATA01, 2019.
Kumar, N., Park, R. J., Jeong, J. I., Woo, J.-H., Kim, Y., Johnson, J., Yarwood, G., Kang, S., Chun, S., and Knipping, E.: Contributions of International Sources to PM2.5 in South Korea, Atmos. Environ., 261, 118542, https://doi.org/10.1016/j.atmosenv.2021.118542, 2021.
Le, T.-C., Shukla, K. K., Chen, Y.-T., Chang, S.-C., Lin, T.-Y., Li, Z., Pui, D. Y. H., and Tsai, C.-J.: On the concentration differences between PM2.5 FEM monitors and FRM samplers, Atmos. Environ., 222, 117138, https://doi.org/10.1016/j.atmosenv.2019.117138, 2020.
Lee, H.-M., Park, R. J., Henze, D. K., Lee, S., Shim, C., Shin, H.-J., Moon, K.-J., and Woo, J.-H.: PM2.5 source attribution for Seoul in May from 2009 to 2013 using GEOS-Chem and its adjoint model, Environ. Pollut., 221, 377–384, 2017.
Lim, S., Hwang, J., Lee, M., Czimczik, C. I., Xu, X., and Savarino, J.: Robust Evidence of 14C, 13C, and 15N Analyses Indicating Fossil Fuel Sources for Total Carbon and Ammonium in Fine Aerosols in Seoul Megacity, Environ. Sci. Technol., 56, 6894–6904, https://doi.org/10.1021/acs.est.1c03903, 2022.
Lin, H., Feng, X., Fu, T.-M., Tian, H., Ma, Y., Zhang, L., Jacob, D. J., Yantosca, R. M., Sulprizio, M. P., Lundgren, E. W., Zhuang, J., Zhang, Q., Lu, X., Zhang, L., Shen, L., Guo, J., Eastham, S. D., and Keller, C. A.: WRF-GC (v1.0): online coupling of WRF (v3.9.1.1) and GEOS-Chem (v12.2.1) for regional atmospheric chemistry modeling – Part 1: Description of the one-way model, Geosci. Model Dev., 13, 3241–3265, https://doi.org/10.5194/gmd-13-3241-2020, 2020.
Lin, J.-T. and McElroy, M. B.: Impacts of boundary layer mixing on pollutant vertical profiles in the lower troposphere: Implications to satellite remote sensing, Atmos. Environ., 44, 1726–1739, 2010.
Link, M. F., Kim, J., Park, G., Lee, T., Park, T., Babar, Z. B., Sung, K., Kim, P., Kang, S., Kim, J. S., Choi, Y., Son, J., Lim, H.-J., and Farmer, D. K.: Elevated production of NH4NO3 from the photochemical processing of vehicle exhaust: Implications for air quality in the Seoul Metropolitan Region, Atmos. Environ., 156, 95–101, 2017.
Liu, H., Jacob, D. J., Bey, I., and Yantosca, R. M.: Constraints from 210Pb and 7Be on wet deposition and transport in a global three-dimentional chemical tracer model driven by assimilated meteorological fields, J. Geophys. Res., 106, 12109–12128, 2001.
Liu, X., Sun, K., Qu, Y., Hu, M., Sun, Y., Zhang, F., and Zhang, Y.: Secondary Formation of Sulfate and Nitrate during a Haze Episode in Megacity Beijing, China, Aerosol Air Qual. Res., 15, 2246–2257, https://doi.org/10.4209/aaqr.2014.12.0321, 2015.
Lothon, M., Lohou, F., Pino, D., Couvreux, F., Pardyjak, E. R., Reuder, J., Vilà-Guerau de Arellano, J., Durand, P., Hartogensis, O., Legain, D., Augustin, P., Gioli, B., Lenschow, D. H., Faloona, I., Yagüe, C., Alexander, D. C., Angevine, W. M., Bargain, E., Barrié, J., Bazile, E., Bezombes, Y., Blay-Carreras, E., van de Boer, A., Boichard, J. L., Bourdon, A., Butet, A., Campistron, B., de Coster, O., Cuxart, J., Dabas, A., Darbieu, C., Deboudt, K., Delbarre, H., Derrien, S., Flament, P., Fourmentin, M., Garai, A., Gibert, F., Graf, A., Groebner, J., Guichard, F., Jiménez, M. A., Jonassen, M., van den Kroonenberg, A., Magliulo, V., Martin, S., Martinez, D., Mastrorillo, L., Moene, A. F., Molinos, F., Moulin, E., Pietersen, H. P., Piguet, B., Pique, E., Román-Cascón, C., Rufin-Soler, C., Saïd, F., Sastre-Marugán, M., Seity, Y., Steeneveld, G. J., Toscano, P., Traullé, O., Tzanos, D., Wacker, S., Wildmann, N., and Zaldei, A.: The BLLAST field experiment: Boundary-Layer Late Afternoon and Sunset Turbulence, Atmos. Chem. Phys., 14, 10931–10960, https://doi.org/10.5194/acp-14-10931-2014, 2014.
Luo, G., Yu, F., and Schwab, J.: Revised treatment of wet scavenging processes dramatically improves GEOS-Chem 12.0.0 simulations of surface nitric acid, nitrate, and ammonium over the United States, Geosci. Model Dev., 12, 3439–3447, https://doi.org/10.5194/gmd-12-3439-2019, 2019.
Mao, J., Fan, S., Jacob, D. J., and Travis, K. R.: Radical loss in the atmosphere from Cu-Fe redox coupling in aerosols, Atmos. Chem. Phys., 13, 509–519, https://doi.org/10.5194/acp-13-509-2013, 2013.
Massucci, M., Clegg, S. L., and Brimblecombe, P.: Equilibrium Partial Pressures, Thermodynamic Properties of Aqueous and Solid Phases, and Cl2 Production from Aqueous HCl and HNO3 and Their Mixtures, J. Phys. Chem. A, 103, 4209–4226, 1999.
McDonald, B. C., de Gouw, J. A., Gilman, J. B., Jathar, S. H., Akherati, A., Cappa, C. D., Jimenez, J. L., Lee-Taylor, J., Hayes, P. L., McKeen, S. A., Cui, Y. Y., Kim, S.-W., Gentner, D. R., Isaacman-VanWertz, G., Goldstein, A. H., Harley, R. A., Frost, G. J., Roberts, J. M., Ryerson, T. B., and Trainer, M.: Volatile chemical products emerging as largest petrochemical source of urban organic emissions, Science, 359, 760–764, 2018.
McDuffie, E. E., Fibiger, D. L., Dubé, W. P., Lopez-Hilfiker, F., Lee, B. H., Thornton, J. A., Shah, V., Jaeglé, L., Guo, H., Weber, R. J., Michael Reeves, J., Weinheimer, A. J., Schroder, J. C., Campuzano-Jost, P., Jimenez, J. L., Dibb, J. E., Veres, P., Ebben, C., Sparks, T. L., Wooldridge, P. J., Cohen, R. C., Hornbrook, R. S., Apel, E. C., Campos, T., Hall, S. R., Ullmann, K., and Brown, S. S.: Heterogeneous N2O5 Uptake During Winter: Aircraft Measurements During the 2015 WINTER Campaign and Critical Evaluation of Current Parameterizations, J. Geophys. Res.-Atmos., 123, 4345–4372, 2018.
Miao, R., Chen, Q., Zheng, Y., Cheng, X., Sun, Y., Palmer, P. I., Shrivastava, M., Guo, J., Zhang, Q., Liu, Y., Tan, Z., Ma, X., Chen, S., Zeng, L., Lu, K., and Zhang, Y.: Model bias in simulating major chemical components of PM2.5 in China, Atmos. Chem. Phys., 20, 12265–12284, https://doi.org/10.5194/acp-20-12265-2020, 2020.
Millet, D. B., Baasandorj, M., Farmer, D. K., Thornton, J. A., Baumann, K., Brophy, P., Chaliyakunnel, S., de Gouw, J. A., Graus, M., Hu, L., Koss, A., Lee, B. H., Lopez-Hilfiker, F. D., Neuman, J. A., Paulot, F., Peischl, J., Pollack, I. B., Ryerson, T. B., Warneke, C., Williams, B. J., and Xu, J.: A large and ubiquitous source of atmospheric formic acid, Atmos. Chem. Phys., 15, 6283–6304, https://doi.org/10.5194/acp-15-6283-2015, 2015.
Min, J.-S., Park, M.-S., Chae, J.-H., and Kang, M.: Integrated System for Atmospheric Boundary Layer Height Estimation (ISABLE) using a ceilometer and microwave radiometer, Atmos. Meas. Tech., 13, 6965–6987, https://doi.org/10.5194/amt-13-6965-2020, 2020.
Murray, L. T., Jacob, D. J., Logan, J. A., Hudman, R. C., and Koshak, W. J.: Optimized regional and interannual variability of lightning in a global chemical transport model constrained by LIS/OTD satellite data, J. Geophys. Res., 117, D20307, https://doi.org/10.1029/2012jd017934, 2012.
Nault, B. A., Campuzano-Jost, P., Day, D. A., Schroder, J. C., Anderson, B., Beyersdorf, A. J., Blake, D. R., Brune, W. H., Choi, Y., Corr, C. A., de Gouw, J. A., Dibb, J., DiGangi, J. P., Diskin, G. S., Fried, A., Huey, L. G., Kim, M. J., Knote, C. J., Lamb, K. D., Lee, T., Park, T., Pusede, S. E., Scheuer, E., Thornhill, K. L., Woo, J.-H., and Jimenez, J. L.: Secondary organic aerosol production from local emissions dominates the organic aerosol budget over Seoul, South Korea, during KORUS-AQ, Atmos. Chem. Phys., 18, 17769–17800, https://doi.org/10.5194/acp-18-17769-2018, 2018.
Nault, B. A., Campuzano-Jost, P., Day, D. A., Jo, D. S., Schroder, J. C., Allen, H. M., Bahreini, R., Bian, H., Blake, D. R., Chin, M., Clegg, S. L., Colarco, P. R., Crounse, J. D., Cubison, M. J., DeCarlo, P. F., Dibb, J. E., Diskin, G. S., Hodzic, A., Hu, W., Katich, J. M., Kim, M. J., Kodros, J. K., Kupc, A., Lopez-Hilfiker, F. D., Marais, E. A., Middlebrook, A. M., Andrew Neuman, J., Nowak, J. B., Palm, B. B., Paulot, F., Pierce, J. R., Schill, G. P., Scheuer, E., Thornton, J. A., Tsigaridis, K., Wennberg, P. O., Williamson, C. J., and Jimenez, J. L.: Chemical transport models often underestimate inorganic aerosol acidity in remote regions of the atmosphere, Commun. Earth Environ., 2, 93, https://doi.org/10.1038/s43247-021-00164-0, 2021.
Nault, B. A., Jo, D. S., McDonald, B. C., Campuzano-Jost, P., Day, D. A., Hu, W., Schroder, J. C., Allan, J., Blake, D. R., Canagaratna, M. R., Coe, H., Coggon, M. M., DeCarlo, P. F., Diskin, G. S., Dunmore, R., Flocke, F., Fried, A., Gilman, J. B., Gkatzelis, G., Hamilton, J. F., Hanisco, T. F., Hayes, P. L., Henze, D. K., Hodzic, A., Hopkins, J., Hu, M., Huey, L. G., Jobson, B. T., Kuster, W. C., Lewis, A., Li, M., Liao, J., Nawaz, M. O., Pollack, I. B., Peischl, J., Rappenglück, B., Reeves, C. E., Richter, D., Roberts, J. M., Ryerson, T. B., Shao, M., Sommers, J. M., Walega, J., Warneke, C., Weibring, P., Wolfe, G. M., Young, D. E., Yuan, B., Zhang, Q., de Gouw, J. A., and Jimenez, J. L.: Secondary organic aerosols from anthropogenic volatile organic compounds contribute substantially to air pollution mortality, Atmos. Chem. Phys., 21, 11201–11224, https://doi.org/10.5194/acp-21-11201-2021, 2021b.
Nenes, A., Pandis, S. N., Kanakidou, M., Russell, A. G., Song, S., Vasilakos, P., and Weber, R. J.: Aerosol acidity and liquid water content regulate the dry deposition of inorganic reactive nitrogen, Atmos. Chem. Phys., 21, 6023–6033, https://doi.org/10.5194/acp-21-6023-2021, 2021.
Neuman, J. A., Parrish, D. D., Ryerson, T. B., Brock, C. A., Wiedinmyer, C., Frost, G. J., Holloway, J. S., and Fehsenfeld, F. C.: Nitric acid loss rates measured in power plant plumes, J. Geophys. Res., 109, D23304, https://doi.org/10.1029/2004jd005092, 2004.
Nguyen, T. B., Crounse, J. D., Teng, A. P., St. Clair, J. M., Paulot, F., Wolfe, G. M., and Wennberg, P. O.: Rapid deposition of oxidized biogenic compounds to a temperate forest, P. Natl. Acad. Sci. USA, 112, E392–E401, 2015.
NOAA – National Oceanic and Atmospheric Administration: Climate Data Online, CDO, https://www.ncdc.noaa.gov/cdo-web/confirmation, last access: 29 March 2021.
Oak, Y. J., Park, R. J., Schroeder, J. R., Crawford, J. H., Blake, D. R., Weinheimer, A. J., Woo, J.-H., Kim, S.-W., Yeo, H., Fried, A., Wisthaler, A., and Brune, W. H.: Evaluation of simulated O3 production efficiency during the KORUS-AQ campaign: Implications for anthropogenic NOx emissions in Korea, Elem. Sci. Anth., 7, 56, https://doi.org/10.1525/elementa.394, 2019.
Pai, S. J., Heald, C. L., Pierce, J. R., Farina, S. C., Marais, E. A., Jimenez, J. L., Campuzano-Jost, P., Nault, B. A., Middlebrook, A. M., Coe, H., Shilling, J. E., Bahreini, R., Dingle, J. H., and Vu, K.: An evaluation of global organic aerosol schemes using airborne observations, Atmos. Chem. Phys., 20, 2637–2665, https://doi.org/10.5194/acp-20-2637-2020, 2020.
Park, R. J.: Natural and transboundary pollution influences on sulfate-nitrate-ammonium aerosols in the United States: Implications for policy, J. Geophys. Res., 109, D15204, https://doi.org/10.1029/2003JD004473, 2004.
Park, R. J., Oak, Y. J., Emmons, L. K., Kim, C.-H., Pfister, G. G., Carmichael, G. R., Saide, P. E., Cho, S.-Y., Kim, S., Woo, J.-H., Crawford, J. H., Gaubert, B., Lee, H.-J., Park, S.-Y., Jo, Y.-J., Gao, M., Tang, B., Stanier, C. O., Shin, S. S., Park, H. Y., Bae, C., and Kim, E.: Multi-model inter-comparisons of air quality simulations for the KORUS-AQ campaign, Elementa, 9, 00139, https://doi.org/10.1525/elementa.2021.00139, 2021.
Peterson, D. A., Hyer, E. J., Han, S.-O., Crawford, J. H., Park, R. J., Holz, R., Kuehn, R. E., Eloranta, E., Knote, C., Jordan, C. E., and Lefer, B. L.: Meteorology influencing springtime air quality, pollution transport, and visibility in Korea, Elementa, 7, 57, https://doi.org/10.1525/elementa.395, 2019.
Phan, N.-T., Kim, K.-H., Shon, Z.-H., Jeon, E.-C., Jung, K., and Kim, N.-J.: Analysis of ammonia variation in the urban atmosphere, Atmos. Environ., 65, 177–185, 2013.
Philip, S., Martin, R. V., and Keller, C. A.: Sensitivity of chemistry-transport model simulations to the duration of chemical and transport operators: a case study with GEOS-Chem v10-01, Geosci. Model Dev., 9, 1683–1695, https://doi.org/10.5194/gmd-9-1683-2016, 2016.
Pye, H. O. T., Liao, H., Wu, S., Mickley, L. J., Jacob, D. J., Henze, D. K., and Seinfeld, J. H.: Effect of changes in climate and emissions on future sulfate-nitrate-ammonium aerosol levels in the United States, J. Geophys. Res., 114, D01205, https://doi.org/10.1029/2008JD010701, 2009.
Quan, J., Liu, Q., Li, X., Gao, Y., Jia, X., Sheng, J., and Liu, Y.: Effect of heterogeneous aqueous reactions on the secondary formation of inorganic aerosols during haze events, Atmos. Environ., 122, 306–312, https://doi.org/10.1016/j.atmosenv.2015.09.068, 2015.
Sachse, G. W., Hill, G. F., Wade, L. O., and Perry, M. G.: Fast-response, high precision carbon monoxide sensor using a tunable diode laser absorption technique, J. Geophys. Res., 92, 2071–2081, 1987.
Schlosser, J. S., Stahl, C., Sorooshian, A., Le, Y. T.-H., Jeon, K.-J., Xian, P., Jordan, C. E., Travis, K. R., Crawford, J. H., Gong, S. Y., Shin, H.-J., Song, I.-H., and Youn, J.: Evidence of haze-driven secondary production of supermicrometer aerosol nitrate and sulfate in size distribution data in South Korea, Atmos. Chem. Phys., 22, 7505–7522, https://doi.org/10.5194/acp-22-7505-2022, 2022.
Shao, J., Chen, Q., Wang, Y., Lu, X., He, P., Sun, Y., Shah, V., Martin, R. V., Philip, S., Song, S., Zhao, Y., Xie, Z., Zhang, L., and Alexander, B.: Heterogeneous sulfate aerosol formation mechanisms during wintertime Chinese haze events: air quality model assessment using observations of sulfate oxygen isotopes in Beijing, Atmos. Chem. Phys., 19, 6107–6123, https://doi.org/10.5194/acp-19-6107-2019, 2019.
Sherwen, T., Evans, M. J., Carpenter, L. J., Andrews, S. J., Lidster, R. T., Dix, B., Koenig, T. K., Sinreich, R., Ortega, I., Volkamer, R., Saiz-Lopez, A., Prados-Roman, C., Mahajan, A. S., and Ordóñez, C.: Iodine's impact on tropospheric oxidants: a global model study in GEOS-Chem, Atmos. Chem. Phys., 16, 1161–1186, https://doi.org/10.5194/acp-16-1161-2016, 2016.
Shimadera, H., Hayami, H., Chatani, S., Morino, Y., Mori, Y., Morikawa, T., Yamaji, K., and Ohara, T.: Sensitivity analyses of factors influencing CMAQ performance for fine particulate nitrate, J. Air Waste Manage., 64, 374–387, 2014.
Shin, H. J., Kim, J. C., Lee, S. J., and Kim, Y. P.: Evaluation of the optimum volatile organic compounds control strategy considering the formation of ozone and secondary organic aerosol in Seoul, Korea, Environ. Sci. Pollut. R., 20, 1468–1481, 2013a.
Shin, H. J., Roh, S. A., Kim, J. C., Lee, S. J., and Kim, Y. P.: Temporal variation of volatile organic compounds and their major emission sources in Seoul, Korea, Environ. Sci. Pollut. R., 20, 8717–8728, 2013b.
Sievering, H., Kelly, T., McConville, G., Seibold, C., and Turnipseed, A.: Nitric acid dry deposition to conifer forests:: Niwot Ridge spruce–fir–pine study, Atmos. Environ., 35, 3851–3859, 2001.
Simpson, I. J., Blake, D. R., Blake, N. J., Meinardi, S., Barletta, B., Hughes, S. C., Fleming, L. T., Crawford, J. H., Diskin, G. S., Emmons, L. K., Fried, A., Guo, H., Peterson, D. A., Wisthaler, A., Woo, J.-H., Barré, J., Gaubert, B., Kim, J., Kim, M. J., Kim, Y., Knote, C., Mikoviny, T., Pusede, S. E., Schroeder, J. R., Wang, Y., Wennberg, P. O., and Zeng, L.: Characterization, sources and reactivity of volatile organic compounds (VOCs) in Seoul and surrounding regions during KORUS-AQ, Elementa, 8, 37 https://doi.org/10.1525/elementa.434, 2020.
Slusher, D. L.: A thermal dissociation–chemical ionization mass spectrometry (TD-CIMS) technique for the simultaneous measurement of peroxyacyl nitrates and dinitrogen pentoxide, J. Geophys. Res., 109, D19315, https://doi.org/10.1029/2004JD004670, 2004.
Song, C. H., Park, M. E., Lee, E. J., Lee, J. H., Lee, B. K., Lee, D. S., Kim, J., Han, J. S., Moon, K. J., and Kondo, Y.: Possible particulate nitrite formation and its atmospheric implications inferred from the observations in Seoul, Korea, Atmos. Environ., 43, 2168–2173, 2009.
St. Clair, J. M., McCabe, D. C., Crounse, J. D., Steiner, U., and Wennberg, P. O.: Chemical ionization tandem mass spectrometer for the in situ measurement of methyl hydrogen peroxide, Rev. Scient. Instrum., 81, 094102, https://doi.org/10.1063/1.3480552, 2010.
Sun, J., Liu, L., Xu, L., Wang, Y., Wu, Z., Hu, M., Shi, Z., Li, Y., Zhang, X., Chen, J., and Li, W.: Key Role of Nitrate in Phase Transitions of Urban Particles: Implications of Important Reactive Surfaces for Secondary Aerosol Formation, J. Geophys. Res.-Atmos., 123, 1234–1243, 2018.
Sun, K., Tao, L., Miller, D. J., Pan, D., Golston, L. M., Zondlo, M. A., Gri, R. J., Mauzerall, D. L., and Zhu, T.: Vehicle Emissions as an Important Urban Ammonia Source in the United States and China, Environ. Sci., 51, 2472–2481, 2017.
Sun, Y., Wang, Z., Fu, P., Jiang, Q., Yang, T., Li, J., and Ge, X.: The impact of relative humidity on aerosol composition and evolution processes during wintertime in Beijing, China, Atmos. Environ., 77, 927–934, https://doi.org/10.1016/j.atmosenv.2013.06.019, 2013.
Sun, Y., He, Y., Kuang, Y., Xu, W., Song, S., Ma, N., Tao, J., Cheng, P., Wu, C., Su, H., Cheng, Y., Xie, C., Chen, C., Lei, L., Qiu, Y., Fu, P., Croteau, P., and Worsnop, D. R.: Chemical differences between PM1 and PM2.5 in highly polluted environment and implications in air pollution studies, Geophys. Res. Lett., 47, e2019GL086288, https://doi.org/10.1029/2019gl086288, 2020.
Theeuwes, N. E., Barlow, J. F., Teuling, A. J., Grimmond, C. S. B., and Kotthaus, S.: Persistent cloud cover over mega-cities linked to surface heat release, npj Clim. Atmos. Sci., 2, 15, https://doi.org/10.1038/s41612-019-0072-x, 2019.
Thornton, J. A., Kercher, J. P., Riedel, T. P., Wagner, N. L., Cozic, J., Holloway, J. S., Dubé, W. P., Wolfe, G. M., Quinn, P. K., Middlebrook, A. M., Alexander, B., and Brown, S. S.: A large atomic chlorine source inferred from mid-continental reactive nitrogen chemistry, Nature, 464, 271–274, https://doi.org/10.1038/nature08905, 2010.
Travis, K. R.: Supporting Information for “Limitations in representation of physical processes prevents successful simulation of PM2.5 during KORUS-AQ”, Zenodo [code], https://doi.org/10.5281/zenodo.5620667, 2022.
Travis, K. R. and Jacob, D. J.: Systematic bias in evaluating chemical transport models with maximum daily 8 h average (MDA8) surface ozone for air quality applications: a case study with GEOS-Chem v9.02, Geosci. Model Dev., 12, 3641–3648, https://doi.org/10.5194/gmd-12-3641-2019, 2019.
Travis, K. R., Jacob, D. J., Fisher, J. A., Kim, P. S., Marais, E. A., Zhu, L., Yu, K., Miller, C. C., Yantosca, R. M., Sulprizio, M. P., Thompson, A. M., Wennberg, P. O., Crounse, J. D., St. Clair, J. M., Cohen, R. C., Laughner, J. L., Dibb, J. E., Hall, S. R., Ullmann, K., Wolfe, G. M., Pollack, I. B., Peischl, J., Neuman, J. A., and Zhou, X.: Why do models overestimate surface ozone in the Southeast United States?, Atmos. Chem. Phys., 16, 13561–13577, https://doi.org/10.5194/acp-16-13561-2016, 2016.
van der Werf, G. R., Randerson, J. T., Giglio, L., van Leeuwen, T. T., Chen, Y., Rogers, B. M., Mu, M., van Marle, M. J. E., Morton, D. C., Collatz, G. J., Yokelson, R. J., and Kasibhatla, P. S.: Global fire emissions estimates during 1997–2016, Earth Syst. Sci. Data, 9, 697–720, 2017.
Varquez, A. C. G., Kiyomoto, S., Khanh, D. N., and Kanda, M.: Global 1 km present and future hourly anthropogenic heat flux, Sci. Data, 8, 64, https://doi.org/10.1038/s41597-021-00850-w, 2021.
Wang, Y., Jacob, D. J., and Logan, J. A.: Global simulation of tropospheric O3-NOx-hydrocarbon chemistry 1. Model formulation, J. Geophys. Res., 103, 10713–10725, 1998.
Wang, Y., Zhang, Q., Jiang, J., Zhou, W., Wang, B., He, K., Duan, F., Zhang, Q., Philip, S., and Xie, Y.: Enhanced sulfate formation during China's severe winter haze episode in January 2013 missing from current models, J. Geophys. Res.-Atmos., 119, 10425–10440, 2014.
Wang, Y., Chen, Y., Wu, Z., Shang, D., Bian, Y., Du, Z., Schmitt, S. H., Su, R., Gkatzelis, G. I., Schlag, P., Hohaus, T., Voliotis, A., Lu, K., Zeng, L., Zhao, C., Alfarra, M. R., McFiggans, G., Wiedensohler, A., Kiendler-Scharr, A., Zhang, Y., and Hu, M.: Mutual promotion between aerosol particle liquid water and particulate nitrate enhancement leads to severe nitrate-dominated particulate matter pollution and low visibility, Atmos. Chem. Phys., 20, 2161–2175, https://doi.org/10.5194/acp-20-2161-2020, 2020.
Weagle, C. L., Snider, G., Li, C., van Donkelaar, A., Philip, S., Bissonnette, P., Burke, J., Jackson, J., Latimer, R., Stone, E., Abboud, I., Akoshile, C., Anh, N. X., Brook, J. R., Cohen, A., Dong, J., Gibson, M. D., Griffith, D., He, K. B., Holben, B. N., Kahn, R., Keller, C. A., Kim, J. S., Lagrosas, N., Lestari, P., Khian, Y. L., Liu, Y., Marais, E. A., Martins, J. V., Misra, A., Muliane, U., Pratiwi, R., Quel, E. J., Salam, A., Segev, L., Tripathi, S. N., Wang, C., Zhang, Q., Brauer, M., Rudich, Y., and Martin, R. V.: Global Sources of Fine Particulate Matter: Interpretation of PM2.5 Chemical Composition Observed by SPARTAN using a Global Chemical Transport Model, Environ. Sci. Technol., 52, 11670–11681, https://doi.org/10.1021/acs.est.8b01658, 2018.
Weinheimer, A. J., Walega, J. G., Ridley, B. A., Sachse, G. W., Anderson, B. E., and Collins, J. E.: Stratospheric NOy measurements on the NASA DC-8 during AASE II, Geophys. Res. Lett., 20, 2563–2566, https://doi.org/10.1029/93GL02627, 1993.
Weinheimer, A. J., Walega, J. G., Ridley, B. A., Gary, B. L., Blake, D. R., Blake, N. J., Rowland, F. S., Sachse, G. W., Anderson, B. E., and Collins, J. E.: Meridional distributions of NOx, NOy, and other species in the lower stratosphere and upper troposphere during AASE II, Geophys. Res. Lett., 21, 2583–2586, https://doi.org/10.1029/94GL01897, 1994.
Wesely, M. L.: Parameterization of surface resistances to gaseous dry deposition in regional-scale numerical models, Atmos. Environ., 23, 1293–1304, 1989.
Wexler, A. S. and Clegg, S. L.: Atmospheric aerosol models for systems including the ions H+, , Na+, , , Cl−, Br−, and H2O, J. Geophys. Res., 107, 4207, 2002.
Woo, J.-H., Kim, Y., Kim, H.-K., Choi, K.-C., Eum, J.-H., Lee, J.-B., Lim, J.-H., Kim, J., and Seong, M.: Development of the CREATE Inventory in Support of Integrated Climate and Air Quality Modeling for Asia, Sustain. Sci. Pract. Policy, 12, 7930, https://doi.org/10.3390/su12197930, 2020.
Wooldridge, P. J., Perring, A. E., Bertram, T. H., Flocke, F. M., Roberts, J. M., Singh, H. B., Huey, L. G., Thornton, J. A., Wolfe, G. M., Murphy, J. G., Fry, J. L., Rollins, A. W., LaFranchi, B. W., and Cohen, R. C.: Total Peroxy Nitrates (ΣPNs) in the atmosphere: the Thermal Dissociation-Laser Induced Fluorescence (TD-LIF) technique and comparisons to speciated PAN measurements, Atmos. Meas. Tech., 3, 593–607, https://doi.org/10.5194/amt-3-593-2010, 2010.
Wu, Y., Ge, X., Wang, J., Shen, Y., Ye, Z., Ge, S., Wu, Y., Yu, H., and Chen, M.: Responses of secondary aerosols to relative humidity and photochemical activities in an industrialized environment during late winter, Atmos. Environ., 193, 66–78, https://doi.org/10.1016/j.atmosenv.2018.09.008, 2018.
Yan, Y., Cabrera-Perez, D., Lin, J., Pozzer, A., Hu, L., Millet, D. B., Porter, W. C., and Lelieveld, J.: Global tropospheric effects of aromatic chemistry with the SAPRC-11 mechanism implemented in GEOS-Chem version 9-02, Geosci. Model Dev., 12, 111–130, https://doi.org/10.5194/gmd-12-111-2019, 2019.
Yazbeck, T., Bohrer, G., Vines, C., De Roo, F., Mauder, M., and Bakshi, B.: Effects of spatial heterogeneity of leaf density and crown spacing of canopy patches on dry deposition rates, Agr. Forest. Meteorol., 306, 108440, https://doi.org/10.1016/j.agrformet.2021.108440, 2021.
Zhai, S., Jacob, D. J., Wang, X., Shen, L., Li, K., Zhang, Y., Gui, K., Zhao, T., and Liao, H.: Fine particulate matter (PM2.5) trends in China, 2013–2018: separating contributions from anthropogenic emissions and meteorology, Atmos. Chem. Phys., 19, 11031–11041, https://doi.org/10.5194/acp-19-11031-2019, 2019.
Zhai, S., Jacob, D. J., Brewer, J. F., Li, K., Moch, J. M., Kim, J., Lee, S., Lim, H., Lee, H. C., Kuk, S. K., Park, R. J., Jeong, J. I., Wang, X., Liu, P., Luo, G., Yu, F., Meng, J., Martin, R. V., Travis, K. R., Hair, J. W., Anderson, B. E., Dibb, J. E., Jimenez, J. L., Campuzano-Jost, P., Nault, B. A., Woo, J.-H., Kim, Y., Zhang, Q., and Liao, H.: Relating geostationary satellite measurements of aerosol optical depth (AOD) over East Asia to fine particulate matter (PM2.5): insights from the KORUS-AQ aircraft campaign and GEOS-Chem model simulations, Atmos. Chem. Phys., 21, 16775–16791, https://doi.org/10.5194/acp-21-16775-2021, 2021a.
Zhai, S., Jacob, D. J., Wang, X., Liu, Z., Wen, T., Shah, V., Li, K., Moch, J. M., Bates, K. H., Song, S., Shen, L., Zhang, Y., Luo, G., Yu, F., Sun, Y., Wang, L., Qi, M., Tao, J., Gui, K., Xu, H., Zhang, Q., Zhao, T., Wang, Y., Lee, H. C., Choi, H., and Liao, H.: Control of particulate nitrate air pollution in China, Nat. Geosci., 14, 389–395, https://doi.org/10.1038/s41561-021-00726-z, 2021b.
Zhang, L., Gong, S., Padro, J., and Barrie, L.: A size-segregated particle dry deposition scheme for an atmospheric aerosol module, Atmos. Environ., 35, 549–560, 2001.
Zhang, L., Wang, T., Zhang, Q., Zheng, J., Xu, Z., and Lv, M.: Potential sources of nitrous acid (HONO) and their impacts on ozone: A WRF-Chem study in a polluted subtropical region., J. Geophys. Res.-Atmos., 121, 3645–3662, https://doi.org/10.1002/2015JD024468, 2016.
Zhao, B., Wang, S., Donahue, N. M., Jathar, S. H., Huang, X., Wu, W., Hao, J., and Robinson, A. L.: Quantifying the effect of organic aerosol aging and intermediate-volatility emissions on regional-scale aerosol pollution in China, Sci. Rep., 6, 28815, https://doi.org/10.1038/srep28815, 2016.
Zheng, B., Zhang, Q., Zhang, Y., He, K. B., Wang, K., Zheng, G. J., Duan, F. K., Ma, Y. L., and Kimoto, T.: Heterogeneous chemistry: a mechanism missing in current models to explain secondary inorganic aerosol formation during the January 2013 haze episode in North China, Atmos. Chem. Phys., 15, 2031–2049, https://doi.org/10.5194/acp-15-2031-2015, 2015.
Zheng, B., Tong, D., Li, M., Liu, F., Hong, C., Geng, G., Li, H., Li, X., Peng, L., Qi, J., Yan, L., Zhang, Y., Zhao, H., Zheng, Y., He, K., and Zhang, Q.: Trends in China's anthropogenic emissions since 2010 as the consequence of clean air actions, Atmos. Chem. Phys., 18, 14095–14111, https://doi.org/10.5194/acp-18-14095-2018, 2018.
Zheng, G. J., Duan, F. K., Su, H., Ma, Y. L., Cheng, Y., Zheng, B., Zhang, Q., Huang, T., Kimoto, T., Chang, D., Pöschl, U., Cheng, Y. F., and He, K. B.: Exploring the severe winter haze in Beijing: the impact of synoptic weather, regional transport and heterogeneous reactions, Atmos. Chem. Phys., 15, 2969–2983, https://doi.org/10.5194/acp-15-2969-2015, 2015.
- Abstract
- Introduction
- KORUS-AQ observations
- GEOS-Chem model
- Simulation of PM2.5 during KORUS-AQ
- Model errors representing the nitrate diurnal cycle
- Model simulation of haze buildup
- Conclusions
- Code availability
- Data availability
- Author contributions
- Competing interests
- Disclaimer
- Acknowledgements
- Financial support
- Review statement
- References
- Supplement