the Creative Commons Attribution 4.0 License.
the Creative Commons Attribution 4.0 License.
 | 15 Jun 2022
Optical and chemical properties and oxidative potential of aqueous-phase products from OH and 3C∗-initiated photooxidation of eugenol
Xudong Li
Ye Tao
Longwei Zhu
Shuaishuai Ma
Shipeng Luo
Zhuzi Zhao
Ning Sun
Zhaolian Ye
Aqueous reactions may turn precursors into light-absorbing and toxic products, leading to air quality deterioration and adverse health effects. In this study, we comprehensively investigated eugenol photooxidation (a representative biomass-burning-emitted, highly substituted phenolic compound) in the bulk aqueous phase with direct photolysis, a hydroxyl radical (OH), and an organic triplet excited state (3C∗). Results show that the degradation rates of eugenol followed the order of 3C OH > direct photolysis. During the 3C∗-initiated oxidation, different reactive oxygen species (ROS), including 3C∗, OH, 1O2, and O, can participate in the oxidation of eugenol, quenching experiments verified 3C∗ was the most important one, while, during OH-initiated oxidation, O was a more important ROS than OH for degrading eugenol. The rate constants under saturated O2, air, and N2 followed the order of for both direct photolysis and OH-initiated oxidation but changed to for 3C∗-mediated oxidation. pH and dissolved oxygen (DO) levels both decreased during oxidation, indicating the formation of acids and the participation of DO in oxidation. Ultraviolet and visible (UV-vis) light absorption spectra of the reaction products showed a clear absorbance enhancement in the 300–400 nm range for all three sets of experiments, and new fluorescence at excitation/emission (400–500) nm appeared, suggesting the formation of new chromophores and fluorophores (brown carbon species). These species were likely attributed to humic-like substances (HULIS), as shown by the increases in HULIS concentrations during oxidation. Large mass yields of products (140 %–197 %) after 23 h of illumination were obtained, and high oxidation degrees of these products were also observed. Correspondingly, a series of oxygenated compounds were identified, and a detailed reaction mechanism with functionalization as a dominant pathway was proposed. At last, the dithiothreitol (DTT) assay was applied to assess the oxidation potential of the reaction products, and the end products of all three sets of experiments showed higher DTT consumption rates than those of eugenol, indicating that more toxic species were produced upon aqueous oxidation. Overall, our results from using eugenol as a model compound, underscore the potential importance of the aqueous processing of biomass burning emissions in secondary organic aerosol (SOA) formation.
- Article
(1905 KB) - Full-text XML
-
Supplement
(1058 KB) - BibTeX
- EndNote


Photochemical reactions in atmospheric aqueous phases (cloud/fog droplets and aerosol water) can affect the lifetimes of many organic species and are an important source and pathway of secondary organic aerosol (SOA) formation (Vione et al., 2006; Zhao et al., 2012). Compared to the SOA formed via gas-phase photochemical oxidation (gasSOA), aqueous-phase SOA (aqSOA) is often more oxidized and less volatile and therefore might play an important role in haze formation, air quality, and global climate change (Ervens et al., 2011; Lim et al., 2010). However, due to the complexity of the aqueous reactions and influencing factors (such as precursors, oxidants, and light intensities), the detailed reaction mechanism, optical property, oxidative potential (OP), and the interplay among them remain poorly understood.
Many laboratory studies have focused on aqueous-phase oxidations of low molecular weight (LMW) volatile organic compounds (VOCs), such as isoprene, terpenes (α-, β-pinene), and their gas-phase oxidation products (such as glyoxal, methylglyoxal, cis-pinonic acid, and methyl vinyl ketone; Faust et al., 2017; Herrmann, 2003; Herrmann et al., 2015; Huang et al., 2011; Lee et al., 2012; Zhang et al., 2010). Recently, aqueous oxidation of semi-/intermediate volatility VOCs (S/IVOCs), such as the phenolic compounds emitted from combustion or pyrolysis of lignin in biomass, were also extensively investigated (Barzaghi and Herrmann, 2002; Bonin et al., 2007; Chen et al., 2020; Gilardoni et al., 2016; He et al., 2019; Jiang et al., 2021; Li et al., 2014, 2021; Ma et al., 2021; Mabato et al., 2022; Smith et al., 2014; Sun et al., 2010; Tang et al., 2020; Yang et al., 2021; Yu et al., 2016; Lu et al., 2019). Generally, chemical structures of precursors have profound influences on the reaction mechanisms and products, while the effect of oxidants also cannot be neglected. It is evident that liquid water can contain various types of oxidants, such as singlet oxygen (1O2), nitrate radical (NO3), hydroxyl radical (OH), and organic triplet excited states (3C∗), and all oxidants can play crucial roles in photooxidation reactions (Kaur and Anastasio, 2018; Scharko et al., 2014). Among them, OH is a ubiquitous oxidant with concentrations of 10−13–10−12 mol L−1 (Arakaki et al., 2013; Gligorovski et al., 2015; Herrmann, 2003). Hence, aqueous OH-induced photooxidation has been extensively studied (Chen et al., 2020; Sun et al., 2010; Yu et al., 2016). Compared to OH oxidation, 3C∗-initiated aqueous oxidation (photosensitized reactions) has also attracted attentions in recent years (Ma et al., 2021; J. Wang et al., 2021). Several classes of organic compounds in ambient air, including non-phenolic aromatic carbonyls, quinones, aromatic ketones, and nitrogen-containing heterocyclic compounds, can form 3C∗ after absorbing light (Alegría et al., 1999; Kaur et al., 2019; Nau and Scaiano, 1996; Rossignol et al., 2014; Chen et al., 2018). These compounds are termed photosensitizers. 3C∗ is capable of reacting with O2 to produce singlet oxygen (1O2) and superoxide radicals (O). Various reactive oxygen species (ROS) can be generated and greatly affect the 3C∗-initiated aqueous-phase reactions. Despite some studies demonstrating importance of ROS in photochemical process (Ma et al., 2021; Wang and Wang, 2020; L. Wang et al., 2021), our current understanding on 3C∗-initiated oxidation is still limited.
Excitation–emission matrix (EEM) fluorescence spectroscopy, as a low-cost, rapid, non-destructive, and high-sensitivity technique, can offer detailed information on chromophores and hence has been widely employed for studies of aquatic dissolved organic matter (Aryal et al., 2015). Nevertheless, it has not been extensively used in atmospheric aerosol research (Mladenov et al., 2011). Prior studies have investigated the relationship between the fluorescence components and chemical structures of atmospheric aerosols by using high-resolution aerosol mass spectrometry (AMS) and EEM fluorescence spectroscopy (Chen et al., 2016a, b). An earlier report from Chang and Thompson (2010) found fluorescence spectra of aqueous-phase reaction products of phenolic compounds, which had some similarities with those of humic-like substances (HULIS), and Tang et al. (2020) reported that the aqueous photooxidation of vanillic acid could be a potential source of HULIS. Chang and Thompson (2010) also showed that light-absorbing and fluorescent substances generally had large conjugated moieties (i.e., quinones, HULIS, polycyclic aromatic hydrocarbons, which can damage human body (Dou et al., 2015; McWhinney et al., 2013). HULIS are considered as being an important contributor for the induction of oxidative stress since they can serve as electron carriers to catalyse ROS formation (Dou et al., 2015; Ma et al., 2019; Huo et al., 2021; Xu et al., 2020), causing adverse health effects. Dithiothreitol (DTT) assay (Alam et al., 2013; Verma et al., 2015), as a non-cellular method, was widely employed to determine oxidation activity and OP of atmospheric PM (Chen et al., 2019; Cho et al., 2005) for the evaluation of its health effects. Some other works (Fang et al., 2016; McWhinney et al., 2013; Verma et al., 2015; Zhang et al., 2022) focused on the link between chemical components and OP in PM and confirmed that several kinds of compounds, such as quinones, HULIS, and transition metals usually had strong DTT activities. However, the DTT method has rarely been used to evaluate the OP of aqueous-phase oxidation products previously (Ou et al., 2021).
In the present work, we chose eugenol (ally guaiacol) as a model compound to conduct an aqueous oxidation experiment. As a representative methoxyphenol emitted from biomass burning (BB; Hawthorne et al., 1989; Simpson et al., 2005), it was widely detected in atmospheric particles. For instance, the concentration and emission factors of this compound from beech wood burning were 0.032 µg m−3 and 1.534 µg g−1, which were twice those of guaiacol (0.016 µg m−3 and 0.762 µg g−1; Bari et al., 2009). Eugenol is a semivolatile aromatic compound with a moderate water-solubility (2.46 g L−1 at 298 K). Chemical characteristics of aqueous reaction products under direct photolysis (without oxidant) and oxidations by OH radicals and 3C∗ triplet states were comprehensively elucidated by a suite of analytical techniques, including high-performance liquid chromatography (HPLC), ultraviolet and visible (UV-vis) spectrophotometry, gas chromatography mass spectrometry (GC-MS), and soot particle aerosol mass spectrometry (SP-AMS). Moreover, light absorption, and fluorescent and oxidative properties of the aqueous oxidation products were also investigated.
2.1 Chemicals and reagents
Eugenol (99 %), tert-butanol (TBA; 99 %), 3,4-dimethoxybenzaldehyde (DMB; 99 %), para-benzoquinone (pBQ; 99 %), dithiothreitol (99 %), 5,5'-dithiobis-2-nitrobenzoic acid (DTNB; 99 %), 2-nitro-5-thiobenzoic (99 %), 5,5-dimethyl-1-pyrroline NO2 (DMPO), and 2,2,6,6-tetramethylpiperidine (TEMP) were all purchased from Sigma-Aldrich. Superoxide dismutase (SOD) was purchased from Bovine Erythrocytes Biochemika. Dichloromethane (HPLC-MS grade; 99 %), methanol (HPLC-MS grade, 99 %), acetonitrile (HPLC-MS grade; 98 %), hydrogen peroxide (H2O2, 35 wt %), and 2,4,6-trimethylphenol (TMP; 99 %) were all obtained from Acros chemicals. Sodium azide (NaN3, 98 %) was purchased from J&K Scientific Ltd. (Beijing, China). All solutions were prepared using ultrapure water (Millipore) on the days of experiments.
2.2 Photochemical oxidation experiments
Aqueous-phase photochemical reactions were carried out in a Rayonet photoreactor (model RPR-200) equipped with 16 light tubes (2 RPR-3000, 7 RPR-3500, and 7 RPR-4190 tubes), which was frequently used to mimic sunlight for photochemical experiments and was described in details by several groups (George et al., 2015; Hong et al., 2015; Huang et al., 2018; Jiang et al., 2021; Zhao et al., 2014). Pyrex tubes containing sample solutions were placed in the centre and received radiation on all sides from surrounding lamps. To ensure mixing of the solution, a fan and a magnetic stir bar were placed at the bottom of the reaction tube. The solution temperature was controlled at C. The same photoreactor system and a normalized distribution of photon fluxes inside the reactor have been reported elsewhere (George et al., 2015), and the wavelength of light was in the range of 280 to 500 nm. We only measured the light intensity at the surface of the solution with a radiometer (photoelectric instrument factory of EVERFINE Corporation, Hangzhou, China), which was determined to be ∼2400 µW cm−2 in the range of 290–320 nm (UVB), lower than the sunlight intensity (6257.1 µW cm−2).
In this work, 300 µM H2O2 and 15 µM DMB were added into solutions as sources of OH and 3C∗, respectively. The initial concentration of eugenol was 300 µM. For 3C∗-mediated experiments, solutions were adjusted to pH =3 by sulfuric acid in order to perform experiments under optimal conditions (Ma et al., 2021; Smith et al., 2014) since the DMB triplet state is protonated to a more reactive form in acidic solution. We conducted the following three sets of oxidation experiments: (a) 300 µM eugenol +300 µM H2O2, (b) 300 µM eugenol +15 µM DMB, and (c) 300 µM eugenol without oxidants. In each series of experiments, a dark control experiment was performed synchronously with a Pyrex tube wrapped by aluminium foil. Results showed that a loss of eugenol under dark conditions were negligible (data not shown). In addition, to evaluate the roles of ROS in eugenol degradation during the 3C∗-initiated oxidation, quenching experiments by using specific scavengers to capture different ROS were performed, namely TBA for OH, NaN3 for 1O2, SOD for O, and TMP for 3C∗, respectively (Pan et al., 2020; Chen et al., 2020). For OH-initiated oxidation, quenching experiments using pBQ for O (Ma et al., 2019; Raja et al., 2005) and TBA for OH were conducted. For most experiments, solutions were saturated by air and each experiment presented was repeated three times, unless otherwise stated. Average results with one standard deviation were provided. In order to further evaluate the role of oxygen in photooxidation, experiments were also conducted by using different saturated gases (air, N2, and O2).
2.3 Analytical methods
2.3.1 Determination of eugenol concentrations
Before and during the photochemical experiment, 2 mL of the reacted solution was sampled periodically and subjected to HPLC (LC-10AT; Shimadzu, Japan) analysis to quantify eugenol concentration. The HPLC was equipped with an InertSustain AQ-C18 reverse-phase column (4.6×250 mm, 5.0 µm; Shimadzu) and a UV-vis detector. The mobile phase was a mixture of acetonitrile H2O ( of ) at a flow rate of 0.6 mL min−1, and the detection wavelength was 280 nm. The first-order kinetic rate constant of eugenol degradation can be obtained from the slope of plot of vs. reaction time, as presented in Eq. (1).
where c0 and ct are eugenol concentrations (in µM) at the initial and reaction time t, while k represents the pseudo first-order rate constant (in s−1).
2.3.2 UV-vis and fluorescent spectra
The UV-vis light absorption spectra of reacted solutions (placed in a 1 cm path length quartz cuvette) were measured by using an UV-vis spectrophotometer (SPECORD 210 PLUS; Analytik Jena, Germany). The instrument has a dual-beam optical system with tungsten and deuterium lamps as light sources. A reference absorption spectrum of ultrapure water was carried out in the same cuvette prior to sample analysis for baseline correction.
Immediately after the UV-vis measurement, the cuvette was transferred to a three-dimensional EEM fluorescence spectrometer (FluoroMax Plus; HORIBA Scientific). The ranges of wavelength varied from 200 to 450 nm for excitation wavelengths (Ex) and from 290 to 650 nm for emission wavelengths (Em). Intervals of the excitation and emission wavelengths were 5 and 2 nm, respectively. The reported absorbance and EEM spectra here are averages of the results from experiments in triplicate.
2.3.3 Determination of HULIS concentrations
Solid phase extraction (SPE) cartridges (CNW Poly-Sery HLB; 60 mg per cartridge) were used to isolate HULIS from the reaction products. The SPE cartridge was first rinsed with 1 mL ultrapure water and then with 3 mL methanol prior to extraction. The solution was acidified to pH ∼2 using HCl and loaded on an SPE cartridge, which was rinsed with 1 mL ultrapure water again. Next, 3 mL methanol ammonia ( of 98:2) mixture was added into the SPE cartridge to elute HULIS, and the solution was blown to full dryness with high-purity N2, followed by dilution with ultrapure water to 25 mL for quantification of HULIS using the HPLC coupled with an evaporative light scattering detector (ELSD3000). Recovery efficiency of the HULIS standard, Suwannee River Fulvic Acid (SRFA), was 75 %–80 %, with the standard deviation of reproducibility less than 5 %. More details have been described elsewhere (Tao et al., 2021).
2.3.4 Oxidative potential (OP) based on DTT assay
The OP of the reaction products was determined by the DTT method (Cho et al., 2005; Lin and Yu, 2019) with slight improvements. Briefly, 1.2 mL sample solution was transferred into a 10 mL glass tube, and then 6 mL phosphate buffer (0.1 M, pH 7.4) and 300 µL of 2.5 mM DTT were added and mixed thoroughly. The DTT mixed solution was placed in a 37 ∘C water bath for incubation. Over the course of the reactions that lasted for 150 min, 1 mL aliquot of DTT mixture was taken every 30 min, and 100 µL of 5 mM DTNB (prepared in 0.1 mM phosphate buffer) was added and loaded in a centrifuge tube. Next, reactions between DTNB and DTT produced bright yellow 5-thio-2-nitrobenzoic acid (NB), which was quantified by the UV-vis spectrometer within 30 min. Finally, we measured the light absorbance (At) at 412 nm to indirectly quantify the remaining DTT. Another 1.2 mL ultrapure water instead of a sample solution was treated in the same way, and the absorbance was denoted as A as the blank value. A0 represents the initial light absorbance value. Thus, DTT concentration consumed by the sample solution (MDTT; µM) and that by the blank solution (MDTT0; µM) can be calculated according to Eqs. (2) and (3), respectively.
Here, CDTT0 was the initial DTT concentration in the sample solution (100 µM in this work). DTT consumption rates (RDTT and RDTT0) were then obtained from the slopes of plots of MDTT and MDTT0 vs. incubation times. Experiments of blanks and samples were typically run in a triplicate. The reproducibility of the whole analysis showed that the relative standard deviation of DTT consumption rate was 3 %–4 %.
2.3.5 Product analysis by GC-MS
A reacted solution (about 30 mL) was extracted with 10 mL dichloromethane twice. The extract was concentrated into 1 mL by blowing N2 gently, which was subsequently transferred to a 2 mL vial, and analysed by a GC-MS (7890A GC/5975C MS; Agilent) with a DB-5ms capillary column (30 m ×0.25 mm ×0.5 µm). The operational conditions were set as follows: the injector was at 200 ∘C, the ion source was at 230 ∘C, and the column oven temperature was programmed to be held at 35 ∘C for 4 min, then ramped to 250 ∘C at a rate of 20 ∘C min−1, and held for 10 min. The recovery efficiency, method detection limits and quality assurance/quality control have been described in our previous work (Ye et al., 2020).
2.3.6 SP-AMS analysis and mass yields of reaction products
An Aerodyne SP-AMS (Onasch et al., 2012) was applied to analyse the low-volatility organic products, similar to our previous work (Chen et al., 2020; Ge et al., 2017). SP-AMS data were acquired in V mode (ion path in a “V” shape) and analysed by SQUIRREL v.1.56D and PIKA v1.15D software. The organic fragments were classified into the following six groups: CH, CHO, CHN, CHO2, CHON, and HO. Elemental ratios (oxygen-to-carbon, ; hydrogen-to-carbon, ), were calculated according to the method proposed by Canagaratna et al. (2015).
Since the AMS analysis requires the nebulization of the sample solution into particles before determination, and quantification of organics was influenced by the atomization efficiency and carrier gas flow, we thus cannot use the SP-AMS measured concentration to quantify the mass of products directly. In this case, according to Li et al. (2014), we added an internal standard (SO) prior to AMS analysis, and the mass ratio of particle-phase organics to SO () can be used to calculate the mass concentration of products. Furthermore, the mass yield of aqueous oxidation products (Yproducts; %), which is the mass of products generated per unit mass of precursor consumed, can be calculated according to Eq. (4).
where is the SO concentration (here 7.27 mg L−1), C0 is the initial eugenol concentration (in mmol L−1), M is the molecular weight (MW) of the precursor (164 g mol−1 for eugenol), and η is the degraded fraction of eugenol.
3.1 Kinetics of aqueous photooxidation
Figure 1 shows the unreacted eugenol concentrations (ct) and the negative logarithm of as a function of reaction time, respectively. The pseudo first-order rate constants (k) obtained by Eq. (1) were also presented. As described in Fig. 1a, the eugenol concentration decreased to be <20 % of the initial concentration in 3 h, suggesting that photooxidation was fast under all three reaction conditions. In the presence of 3C∗, eugenol was degraded by nearly 100 % after 3 h. A previous study (Chen et al., 2020) on 3C∗-initiated 4-ethylguaiacol oxidation reports a time of 21 h for a complete degradation. Apart from a difference in precursors, the different light irradiation spectra and stronger light energy in this work compared to the previous work might be responsible for the fast loss of eugenol. The bond dissociation energies (BDEs) are 340 kJ mol−1 for OH, 374 kJ mol−1 for C-H in the −CH3 group, 345 kJ mol−1 for the C=C bond, and 403 kJ mol−1 for C-H in −OCH3 group, respectively (Herrmann, 2003; He et al., 2019). Due to influences of steric hindrance and intramolecular hydrogen bonding, the H abstraction from the OH group might not be favourable, and the most probable H abstraction might take place in C=C of the allyl group. As a result, the breakage of C=C into C−C at the allyl group can lead to the formation of 2-methoxy-4-propylphenol (Sect. 3.6.1). When photon energy is higher than the BDE, chemical bonds can break, leading to decomposition of compounds and possibly further mineralization. The energy of the photon of 300 nm is 412 kJ mol−1 and can break all major bonds in eugenol, while the energy of 350 nm is 353 kJ mol−1, which is able to break some of the bonds in eugenol as well. Overall, eugenol can be easily decomposed after absorbing the photons.
As shown in Fig. 1b, the first-order rate constants were , , and s−1 for direct photolysis and photooxidations by OH and 3C∗, respectively. 3C∗-initiated photooxidation was quicker than that attacked by OH, likely due to combined contributions from reactions with 1O2, O, and OH (Sect. 3.2). Similar results were found for aqueous-phase reactions of three phenols against OH and 3C∗ by Yu et al. (2016; note that the initial concentrations of H2O2 and DMB were 100 and 5 µM, respectively, with the same ratio as 300 µM H2O2 to 15 µM DMB in this work).

Figure 1Aqueous-phase eugenol decay kinetic curves (a) and first-order rate constants (b) obtained, based on Eq. (1), under direct photolysis, OH-initiated oxidation, and 3C∗-initiated oxidation. The error bar represents 1 standard deviation from the measurements in triplicate.
3.2 Relative importance of ROS in photooxidation
3.2.1 Quenching experiments in 3C∗-initiated photooxidation
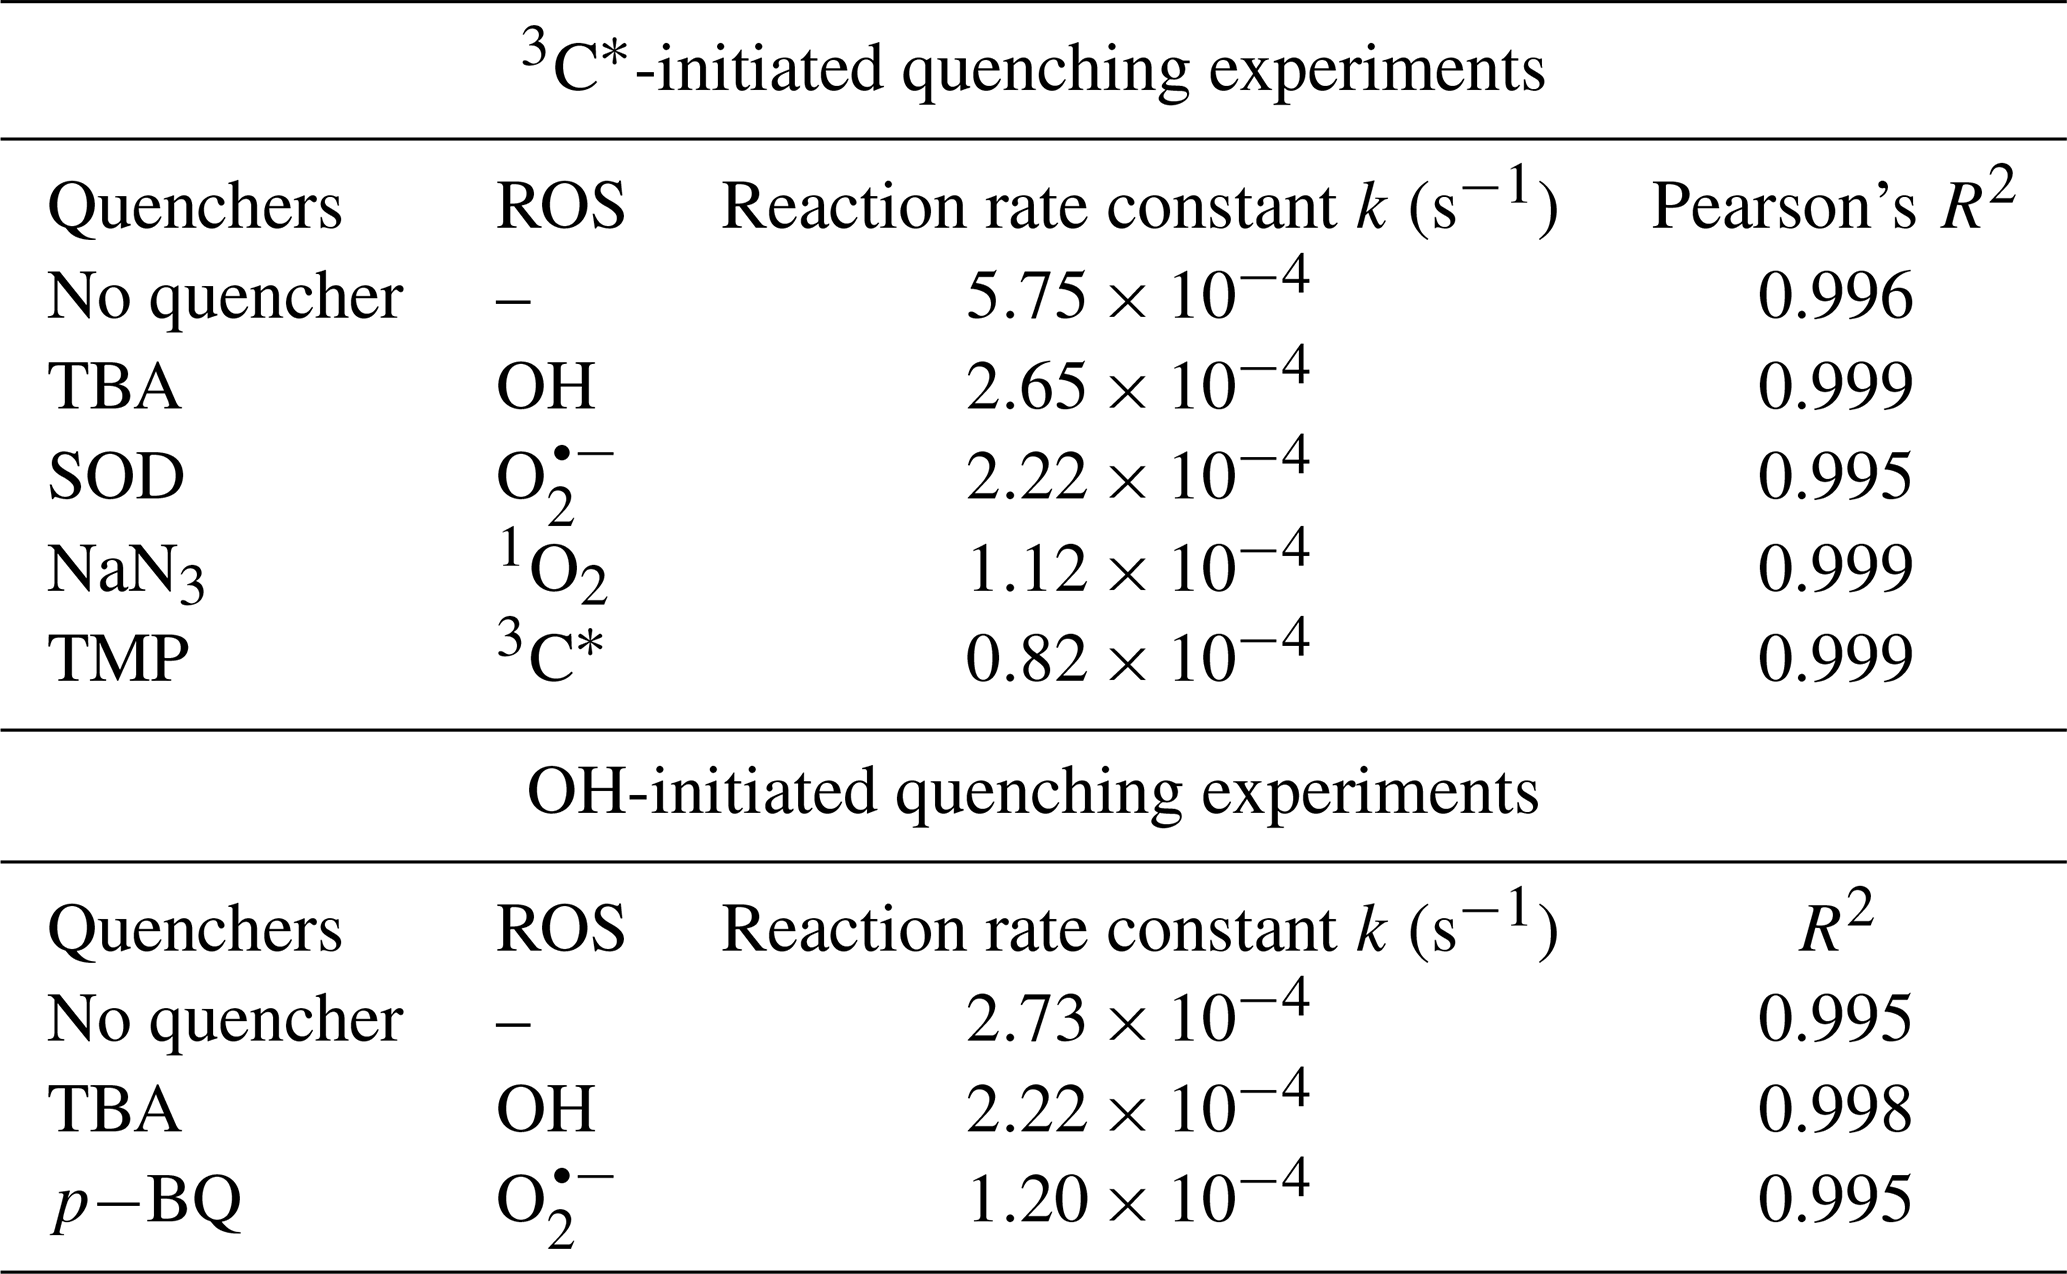
The relative importance of different ROS in photooxidation can be investigated by an addition of scavengers/quenchers and then be evaluated based on the different degradation efficiencies of eugenol in the absence and presence of the corresponding ROS quenchers. For each quencher, we conducted several gradient experiments with varying molar ratios of eugenol to quencher. The ratios were 0.075:1, 0.15:1, 0.3:1, 0.75:1, and 1.5:1 for quenchers of NaN3, TMP, and TBA, and 1.2:1, 1.6:1, 2.5:1, 5:1, and 10:1 for SOD, which were all within the typical ranges of ROS quenching experiments reported previously (Zhou et al., 2018). Excess concentrations of quenchers have been added repeatedly to ensure the complete reactions between ROS and scavengers. Figure 2 displays the impacts of quenchers on eugenol degradation. All rate constants (k) with quenchers were lower than those of the quencher-free solutions. The optimum molar ratio of eugenol to quencher was selected such that the eugenol degradation did not change with the increase in the added quencher (L. Wang et al., 2021). For example, along with the decrease in molar ratios of eugenol to NaN3 from 1.5:1 to 0.075:1, the variation in eugenol degradation was stabilized at the ratio of 0.15:1, indicating that 1O2 has been completely quenched at this ratio; therefore, a molar ratio of 0.15:1 for NaN3 was optimal, since excess scavengers may generate other products that interfere with the existing reactions. Finally, the optimal molar ratios of eugenol to quenchers of TBA, NaN3, TMP, and SOD were determined to be 1.5, 0.15, 0.075, and 2.5, respectively. Table 1 and Fig. S1 compared the rate constants determined under the ratios above, and they were of the order of TMP < NaN3 < SOD < TBA, suggesting that the relative importance of generated ROS to eugenol degradation was of the order of 3C 1O2> O OH. This result suggests that 3C∗ plays a major role among all ROS in the photooxidation. Previously, De Laurentiis et al. (2013a) reported that 4-carboxybenzophenone (70 µM) could act as 3C∗, and the photosensitized degradation was more effective than oxidants such as OH or O3. Misovich et al. (2021) investigated the aqueous DMB-photosensitized reaction (5 µM; same as in this study) and also demonstrated that 3C∗ was the greatest contributor to phenol or guaiacyl acetone degradation, followed by 1O2, while both OH and 1O2 contributions were relatively minor.
To further assess the relative importance of different ROS, we propose using Eq. (5), as follows, for a rough estimation:
Here k (in s−1) is the original rate constant of 3C∗-initiated oxidation (or OH-initiated oxidation in Sect. 3.2.2), and kquencher (in s−1) is the rate constant after the target ROS has been completely scavenged by its quencher. k and kquencher in fact refer to those reported in Fig. S1b. RedROS then refers to the percentages of reduction due to addition of quencher for a ROS.
According to Eq. (5), Red was calculated to be 85.7 %. Similarly, the values of 1O2, O, and OH were 80.5 %, 61.4 %, and 53.9 %, respectively. Note that RedROS only reflects the relative important of ROS, and it does not correspond to the exact contribution of that ROS in eugenol degradation without quenchers. The reason is that although the addition of a ROS scavenger can eliminate oxidation by this ROS, it also significantly interrupts the original chain reactions, as compared to those in the absence of the scavenger, and reactions with other ROS might be enhanced. In this regard, the sum of the four RedROS values may exceed 100 %. Therefore, one should be cautious when using RedROS as a precise quantification of the ROS contribution in an aqueous oxidation. Determination of ROS concentrations during oxidation should instead be an effective way to elucidate the role of ROS. Here, we tried to detect in situ generated OH, O, and 1O2 during photochemical reactions using a micro electron spin resonance (ESR) spectrometer (Bruker Magnettech, Berlin, Germany) with DMPO as the spin trap to form stable DMPO-OH or DMPO-O, with TEMP to capture 1O2 to produce TEMP-1O2 spin adduct (TEMPO). The radicals can be identified and quantified by the peak patterns in ESR spectra, such as the quarter line with a height ratio of for DMPO-OH, for DMPO-O, and for TEMP-1O2 (Guo et al., 2021). Unfortunately, the OH radical cannot be detected since its concentration might be lower than the detection limit of the instrument (Fig. S2; ESR spectra of OH). In contrast, we were able to detect high concentrations of 3C∗ and found that the intensity of TEMP-1O2 signal reached its maximum at 30 min and then decreased slowly (Fig. S2; ESR spectra of 1O2). Combining the great quenching effect of TMP with a high 1O2 concentration from the ESR method, we can conclude that 3C∗ and 1O2 play relatively important roles in eugenol photooxidation.
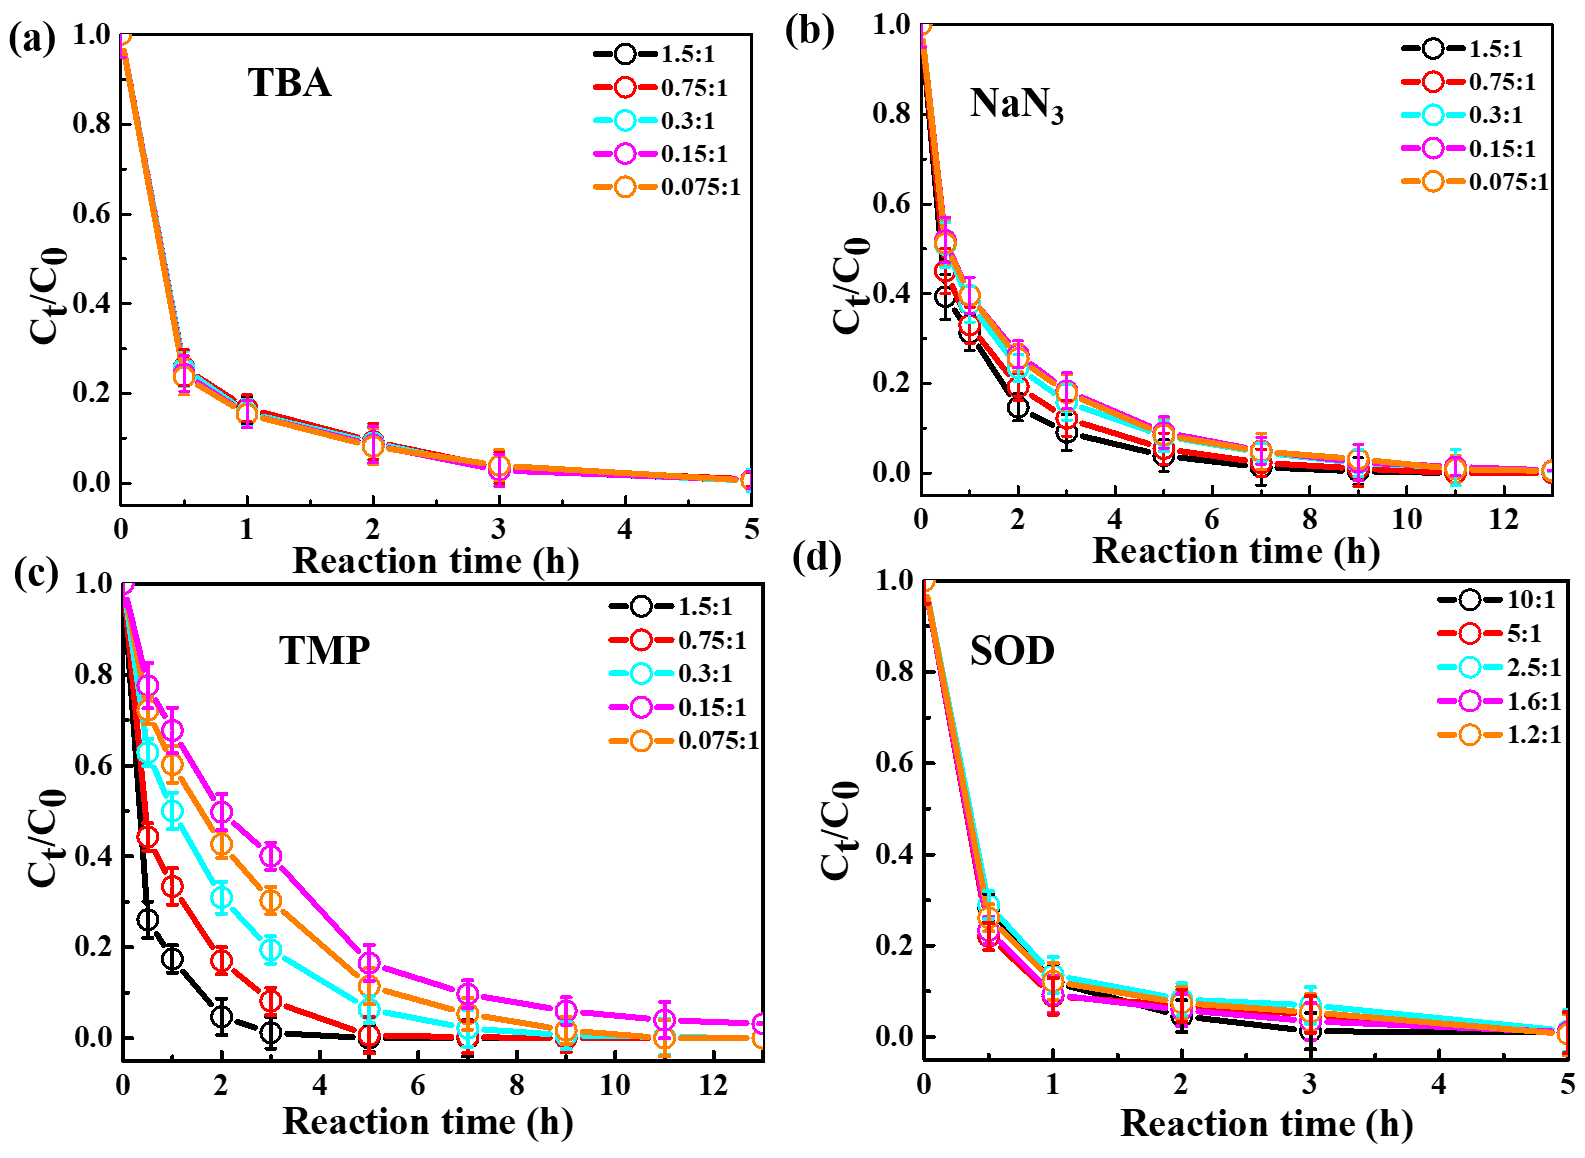
Figure 2Ratio of unreacted eugenol concentration to its initial concentration () at different molar ratios of eugenol to the quencher, as a function of reaction time. (a) TBA. (b) NaN3. (c) TMP. (d) SOD.
3.2.2 Quenching experiments in OH-initiated photooxidation
To examine the contributions of ROS to eugenol degradation for OH-initiated oxidation, TBA and pBQ were added as trapping agents. Similar to 3C∗-initiated oxidation, several gradient experiments with varying molar ratios of eugenol to quenchers were conducted. The ratios were set as 6.5:1, 3.2:1, 1.6:1, 1.1:1, and 0.8:1 for pBQ and 3.0:1, 1.5:1, 0.75:1, 0.3:1, and 0.15:1 for TBA. According to Fig. S3, the molar ratio only had a slight influence on the eugenol degradation, although the degradation can be inhibited effectively by quenchers. Thus, we determined the appropriate molar ratios of 0.8 and 0.75 for pBQ and TBA, respectively, as excess scavengers might influence the chemical reactions.
Variations in the rate constants for the aforementioned quenching experiments were determined, in comparison with those conducted without quenchers, and the results are listed in Table 1 and presented in Fig. S4. For TBA quenching tests, the rate constant decreased by 18.7 % (from to s−1), showing that the OH radical played a certain role in eugenol photooxidation. Since H2O2 was mainly photolysed at wavelength <300 nm to generate OH radical, irradiation above 300 nm did not affect the reaction significantly. The pBQ could quench O, further suppressing the generation of other ROS (e.g., •HO2); therefore, the rate constant decreased the most (from to s−1), suggesting that O was important for eugenol photooxidation. This hypothesis could be further confirmed by the decline in the rate constant under a N2-saturated solution (Sect. 3.2.3). However, it was difficult to detect both OH and O via ESR directly due to their relatively short lifetimes and low concentrations in this work.
Table 1The first-order rate constants of eugenol in the presence of various scavengers. The initial conditions were as follows: 300 µM eugenol, molar ratios of eugenol to quenchers TBA, NaN3, TMP, and SOD of 1.5, 0.15, 0.075, and 2.5, respectively, molar ratios of eugenol to quenchers pBQ and TBA of 0.8 and 0.75, respectively.
3.2.3 Influences of different saturated gases
In order to assess the role of O2 in eugenol degradation, a series of experiments were performed under both O2-saturated and N2-saturated conditions in addition to air. N2 gas was purged into the reaction solution for ∼30 min before the experiment to achieve the O2-free condition. Figure 3 compares the changes in the eugenol concentrations and rate constants under the three gas conditions for direct photolysis and OH-initiated and 3C∗-initiated oxidations, respectively. The rate constants followed the order of under both direct photolysis and OH oxidation, providing evidence in support of O2 being significant for eugenol degradation. This might be explained by the fact that O2 can act as an electron acceptor to generate O and •HO2 and subsequently form H2O2 and OH. For direct photolysis, the rate constant under the O2-saturated condition increased by 14.4 %, while it decreased by 19.3 % under N2 saturation from that under saturated air. For OH-initiated oxidation, the difference in the rate constants under three saturated gases became more distinct.
On the contrary, rate constants followed the order of in 3C∗-initiated oxidation. There are two possible explanations. On the one hand, under N2-saturated condition without oxygen, DMB would be involved in Reactions (R1)–(R4), leading to a more effective generation of 3DMB∗, therefore leading to a higher degradation efficiency than under a O2-saturated condition. On the other hand, for air/O2-saturated solutions, irradiation of DMB and eugenol would also involve Reactions (R5)–(R8), in addition to Reactions (R1)–(R4), and as a result, the amount of 3DMB∗ decreases due to formation of other ROS (1O2, O, OH, etc.) with relatively weak oxidative capacities. In summary, the quenching of 3DMB∗ by ground state molecular oxygen could account for the low degradation efficiency in O2-saturated condition.
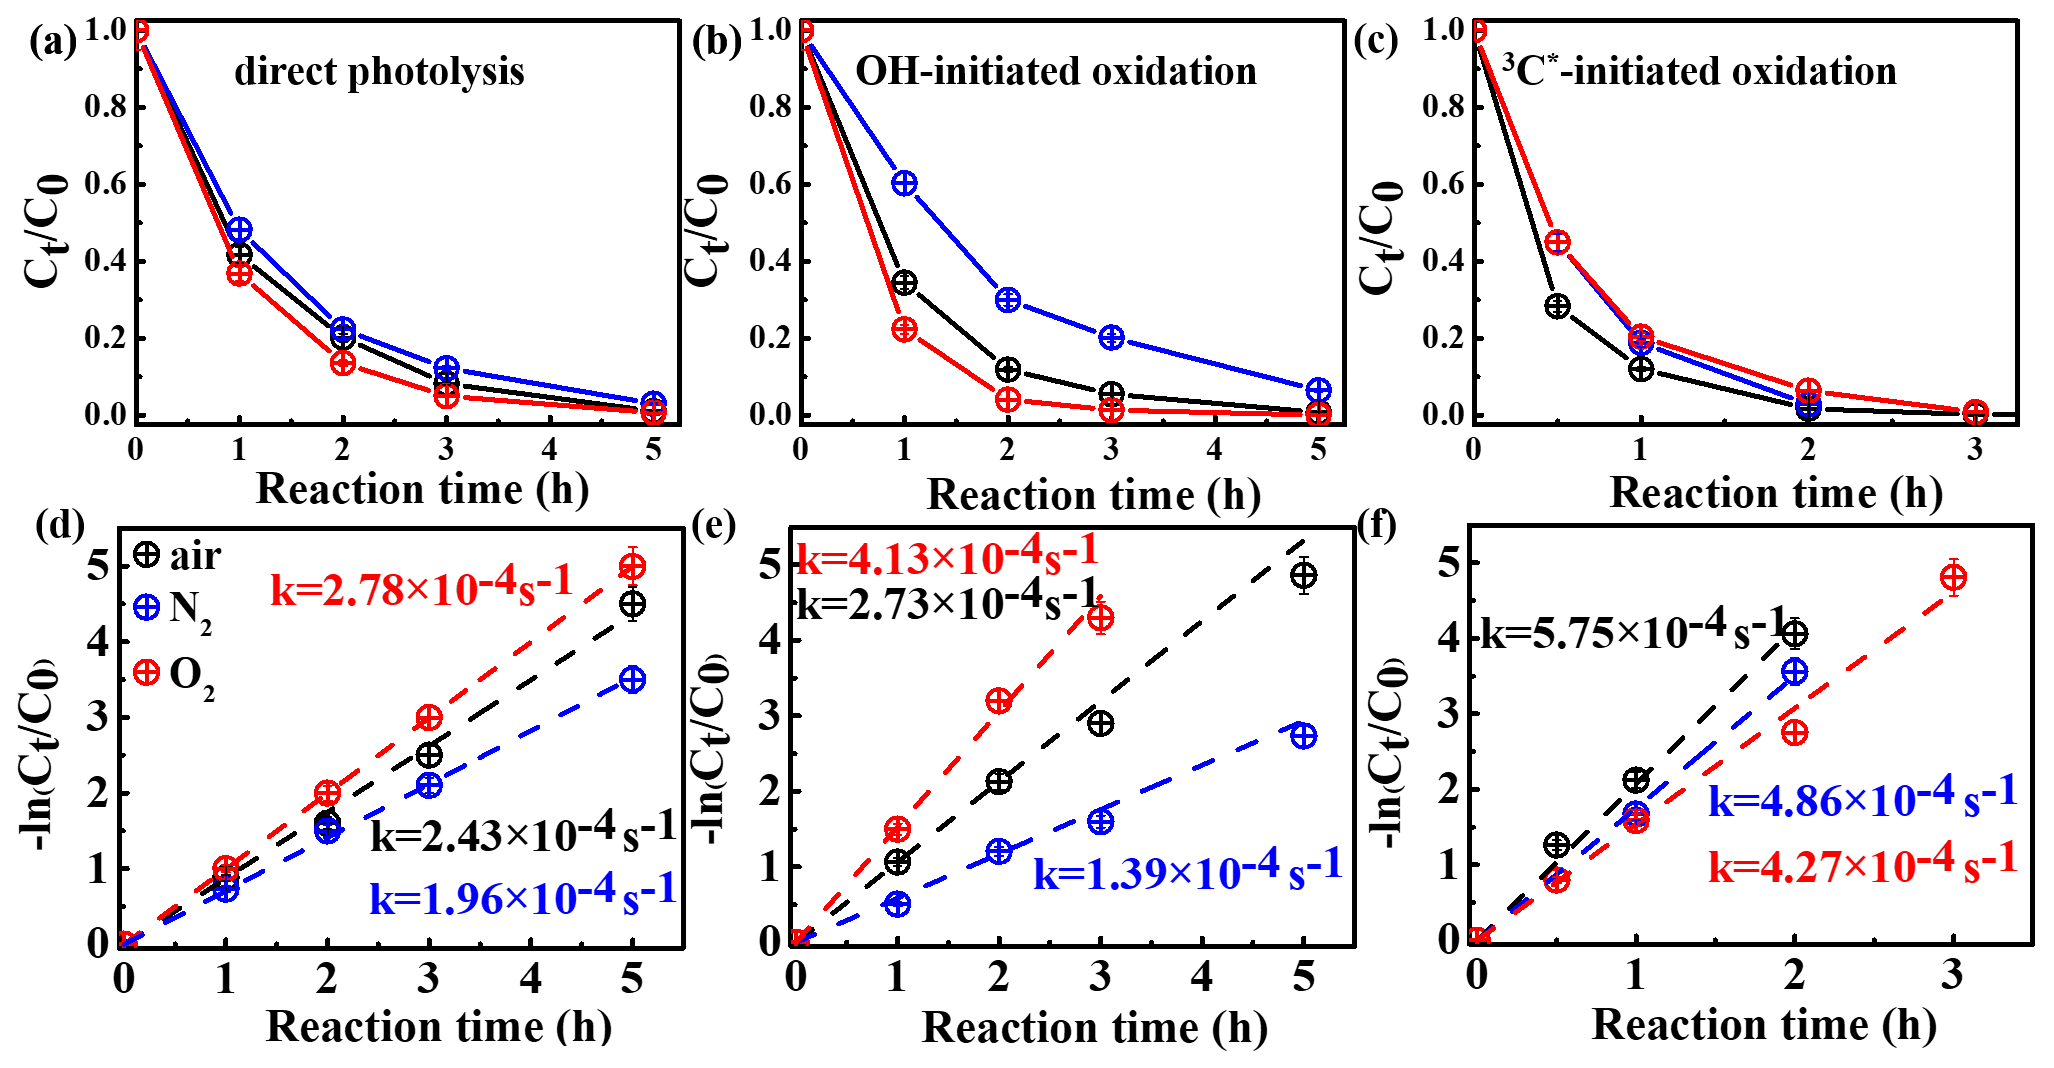
Figure 3Ratio of unreacted eugenol concentration to its initial concentration () as a function of reaction time at different saturated gases under (a) direct photolysis (b) OH-initiated oxidation and (c) 3C∗-initiated oxidation. Rate constants of panels (a)–(c) are presented in panels (d)–(f) correspondingly.
3.2.4 Variations in pH and dissolved oxygen
The initial pH values of the reaction solutions for direct photolysis and OH-initiated oxidation were unadjusted, while that for the 3C∗ oxidation was adjusted to 3. The variation in the solution pH is presented in Fig. 4a. The pH values decreased quickly at the beginning of the illumination (from 7.4 to ∼5.0 in the first 1 h) and then tended to be flat for both direct photolysis and OH-initiated oxidation. However, little change in pH (less than 0.1 of a unit) was observed for the 3C∗-initiated photooxidation throughout the oxidation, which can likely be ascribed to its low initial pH of 3. Since the solution pH was acidic (pH =3), we cannot rule out formation of acidic products (such as organic acids) during 3C∗-initiated oxidation as is the case during direct photolysis and OH-initiated oxidation.
As discussed in Sect. 3.2.3, oxygen can take part in photochemical reactions to form ROS, which may in turn destroy the structure of the precursor. Here we measured the oxygen consumption during oxidation through determination of dissolved oxygen (DO) contents by a dissolved oxygen meter (Seven2Go Pro S9; Zurich, Switzerland). DO was consumed mainly during the first 1 h and remained stable afterwards (Figs. 4b–c and S5). The amounts of consumed DO followed the order of 3C OH > direct photolysis. The maximum consumed DO was found in 3C∗-initiated oxidation, which might be explained by the consumption of O2 that reacts with 3C∗ to form 1O2 (Reaction R5). Obviously, a steady-state DO level was reached when the consumption rate was equal to the diffusion of O2 into the solution (Pan et al., 2020). Overall, these results reemphasize that O2 can influence eugenol degradation and chemical transformation via the induction of radical chain reactions.

Figure 4(a) pH values and (b) dissolved oxygen (DO) contents against reaction time under direct photolysis, OH-initiated oxidation, 3C∗-initiated oxidation, and (c) DO contents during 3C∗-initiated oxidation under air or O2-saturated conditions.
3.3 Optical properties of reaction products
3.3.1 Light-absorbing properties
The UV-vis light absorption spectra of the solutions at different reaction times are presented in Fig. 5. The light absorption by eugenol itself mainly occurs in the range of 260–300 nm ( electronic transition; 270–350 nm), which overlaps with the major photon fluxes (280 and 500 nm) of our lamp for photooxidation. Therefore, we can clearly observe that the characteristic absorption peak at 280 nm of the precursor decreased with the propagation of direct photolysis (Fig. 5a), similar to that in OH-initiated photooxidation (Fig. 5b). However, the reaction was quick in the presence of 3C∗, and the characteristic absorption peak at 280 nm after 3 h of illumination almost disappeared, suggesting a nearly complete loss of eugenol, consistent with the results in Sect. 3.1 which show that more than 99 % eugenol was degraded in 3 h. Additionally, there was an obvious absorption enhancement at longer wavelengths (300–400 nm) during the photooxidation, whereas eugenol itself did not absorb light in this range, indicating that some light-absorbing products (e.g., brown carbon, BrC, species) were generated. Aqueous photooxidation of some phenolic compounds (e.g., vanillic acid) also presented long-wavelength (300–400 nm) light absorbance, with the intensity increasing with illumination time (Tang et al., 2020; Zhao et al., 2015). In addition, there were some differences for light absorbance at wavelengths of 300–400 nm in all three reaction conditions. For direct photolysis and OH-initiated oxidation, light absorbance increased during the first 15 h and then remained at a plateau until 23 h. However, for 3C∗-initiated oxidation, light absorbance increased during the first 7 h and then decreased slowly afterwards. The different shapes of UV-vis spectra between OH and 3C∗ photooxidations indicate the formation of different products.
Compared to the light spectrum of eugenol, there were also increases in light absorbance at ∼260 nm ( electronic transitions) upon aqueous oxidation in all three reaction conditions (Fig. 5), demonstrating the generation of new substances likely with both aromatic C=C and carbonyl (C=O) functional groups (Tang et al., 2020). The enhancement at 300–400 nm may point to products with high MWs and conjugated structures. Unfortunately, we were unable to quantify the relative contributions of individual products to the overall light absorbance between 300 to 400 nm due to lack of a full speciation of the products and their light absorption spectra.

Figure 5UV-vis light absorption spectra of reacted solutions at different reaction times under (a) direct photolysis, (b) OH-initiated oxidation, and (c)3C∗-initiated oxidation.
3.3.2 Fluorescence properties
The fluorescence properties of solutions before (0 h) and during photooxidation (3 and 7 h) were investigated via the EEM technique, as shown in Fig. 6. For comparison, we also presented EEM profiles of pure eugenol (non-irradiated), pure DMB, and the end solutions (23 h) of direct photolysis and OH-initiated oxidation in Fig. S6. The peaks at excitation emission (Ex Em) nm can be attributed to fluorescence of the phenolic structure of the parent substance (eugenol here), as suggested by De Laurentiis et al. (2013b). As shown in both Figs. 6 and S6, the fluorescence intensity decreased after oxidation due to eugenol decay, and the reduction was very fast for 3C∗-initiated oxidation. This finding matches with the fast degradation and large rate constant for 3C∗-initiated oxidation. The EEM plots for direct photolysis and OH-initiated oxidation had similar contour patterns, as shown in Fig. 6a and b, although EEM profiles changed significantly with irradiation time. We also observed distinct fluorescent peaks at Ex Em (400–500) nm, indicating that illumination can cause a red shift in the fluorescence emission wavelength. As suggested by Chang and Thompson (2010), fluorophores at Ex Em nm are linked with aromatic structures and condensed saturated bonds, including polycyclic aromatic hydrocarbons. Another work (Li et al., 2021) showed that the red shift in the fluorescence spectra was usually related to an increase in the size of the ring system and an increase in the degree of conjugation. Previous studies (Chen et al., 2016a, 2019) have reported that fluorescent compounds with emission wavelength at 400–500 nm were likely linked with HULIS. Additionally, HULIS have two typical fluorescent peaks in EEM profile at Ex Em = (200–300) (400–500) nm and Ex Em (400–500) nm, with the former having a higher intensity (Graber and Rudich, 2006; De Laurentiis et al., 2013b; Vione et al., 2019). There was also evidence that direct photolysis of tyrosine and 4-phenoxyphenol generated HULIS with new fluorescence signals at Ex Em = (200–250) (400-450) and 300 (400–450) nm (Bianco et al., 2014). In this regard, we inferred that new peak at Ex Em (400–500) nm here was likely attributed to HULIS. For the 3C∗-initiated oxidation, extra fluorescent peaks at Ex Em = (220–300) (400–500) nm appeared in the first 1 h (data not shown), but their intensities weakened and gradually disappeared with prolonged reactions (3 h). Nevertheless, EEM results should be interpreted with caution because many substances might contribute to absorption and emission at a certain wavelength, and it is hard to distinguish and isolate fluorescent and nonfluorescent constituents simply via the EEM technique.
Another interesting finding was that a small fluorescence peak appeared at Ex Em = (300–350) (300–350) nm in some of the EEM profiles. Specifically, it appeared earlier for 3C∗ oxidation (at 3 h) than in the other two systems, yet its intensity seemed to be a bit stronger in the end solutions of direct photolysis and OH oxidation (Fig. S6). Moreover, as suggested by Leenheer and Croue (2003), the fluorescence peak position of the maximum Ex Em for HULIS with lower MWs would shift towards lower wavelengths; thus, we inferred that a fluorescence peak at Ex Em = (300–350) (300–350) nm might be, in part, attributed to the organic acids with a few carbon atoms (probably C1–C6). Nevertheless, large uncertainties still exist in using EEM fluorescence technique to identify molecular compositions of the products due to lack of standard EEM profiles for specific compounds from aqueous-phase oxidation, and clearly more studies are needed in future.
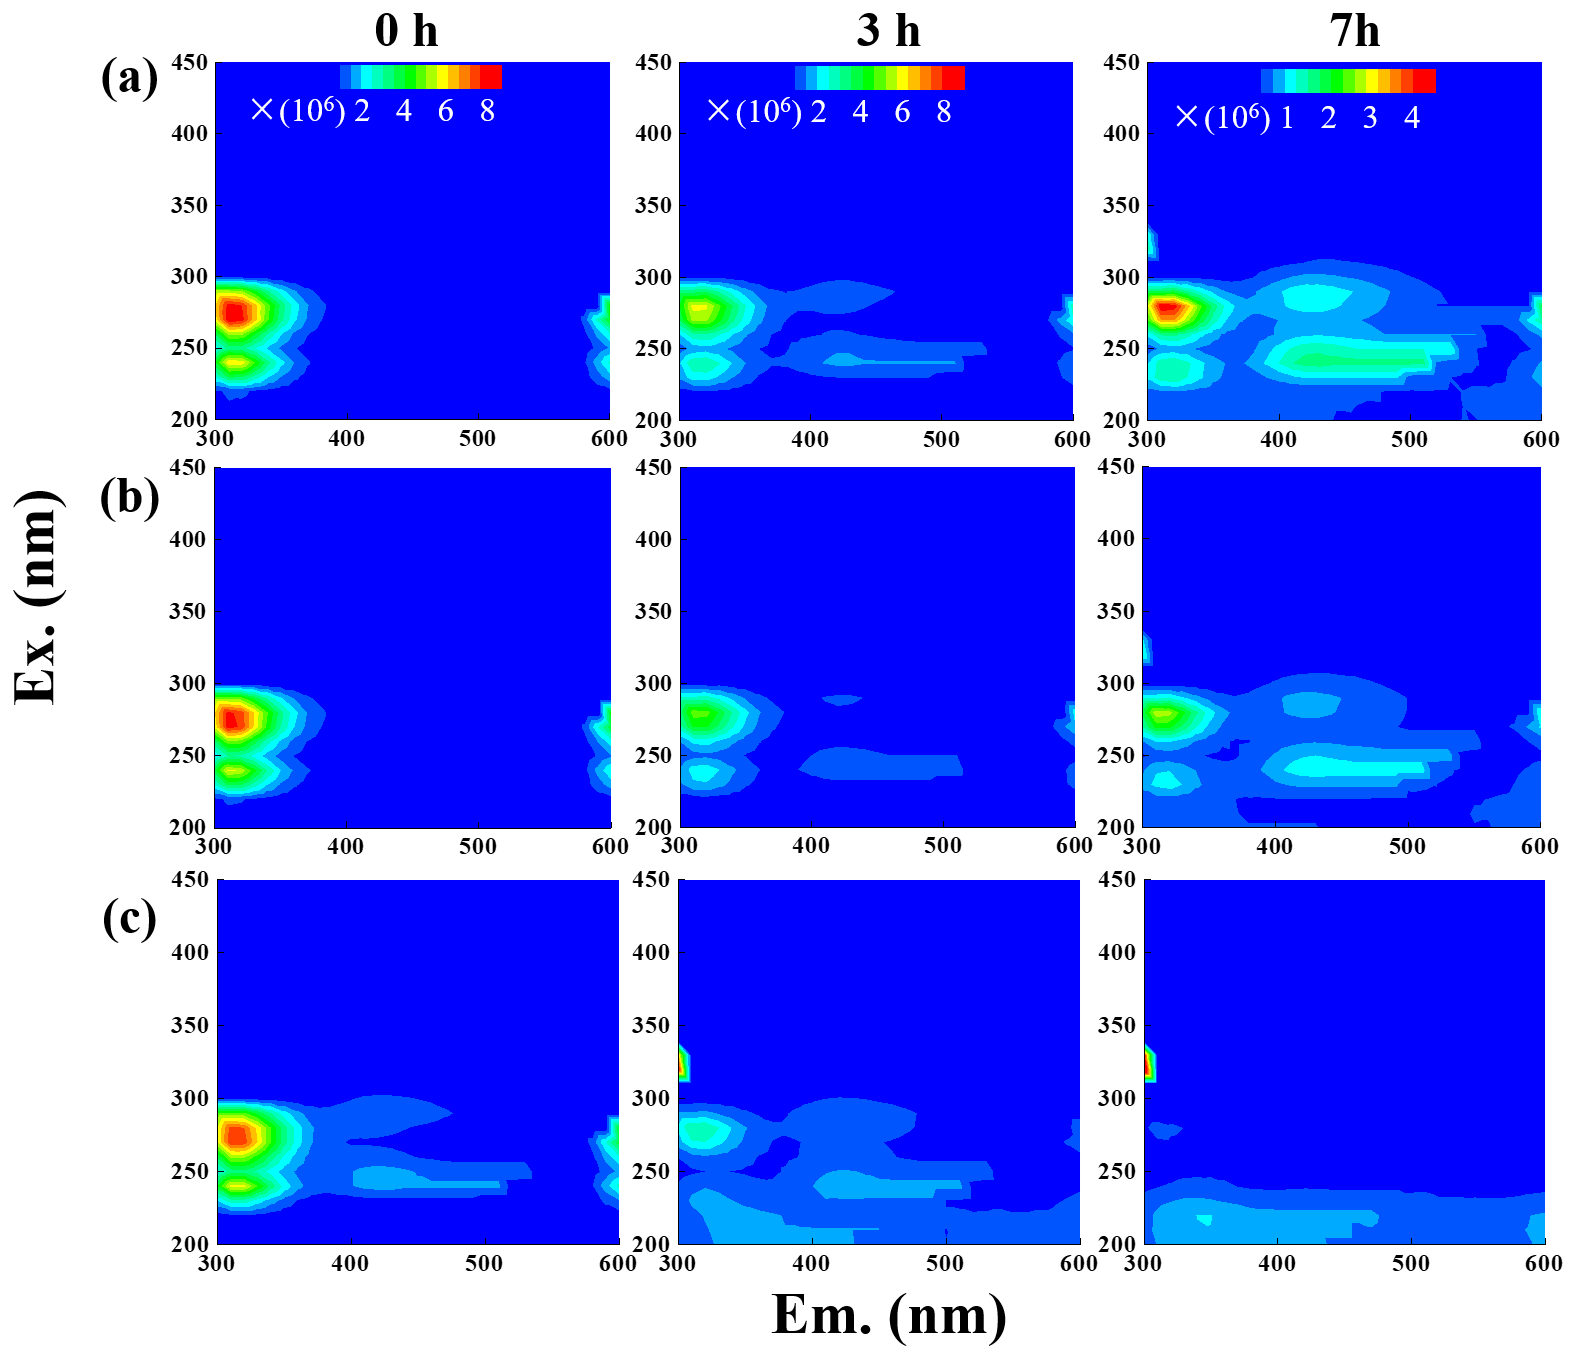
Figure 6EEM fluorescence spectra of the initial solution (0 h) and those at different reaction time (3 and 7 h) under (a) direct photolysis, (b) OH-initiated oxidation, and (c) 3C∗-initiated oxidation.
3.4 Characteristics of HULIS
The EEM spectra revealed a new prominent fluorescent peak at Ex Em (400–500) nm, which was likely owing to HULIS. HULIS can be divided into fulvic acid (water soluble at all pH levels), humic acid (base soluble; acid insoluble), and humin (insoluble at all pH levels). In principle, extracted HULIS in this work with polymer-based HLB SPE packing include LMW organic acids, fulvic acids, and other humic substances.
Figure 7 presents the measured HULIS concentrations against the reaction time. The results show clearly that aqueous-phase eugenol oxidation is a source of HULIS; the amount increased gradually in the first 7 h and then remained at a similar level (about 30 mg L−1) for the OH-initiated oxidation. For direct photolysis, the HULIS concentration increased until 11 h and then became steady at a level around 40 mg L−1. For the 3C∗ oxidation, the HULIS concentration increased to a maximum at 7 h and then declined slightly afterwards. A plausible reason for such variabilities is that the generated HULIS was capable of further taking part in photochemical reactions since it can act as a photosensitizer. Moreover, Yu et al. (2016) characterized the products from aqueous oxidations of phenols by 3C∗ triplet states and OH radicals and found both could produce oligomers and hydroxylated species, but the 3C∗ oxidation could produce more of these compounds when 50 % of the precursor reacted. Considering the large increases in HULIS in the first 7 h and the much faster increase in 3C∗ oxidation in the first 3 h, as shown in Fig. 7, we postulate that HULIS species might be some of the high MW oligomers, which can in turn contribute to fluorescence at an emission of ∼400 nm (Barsotti et al., 2016).
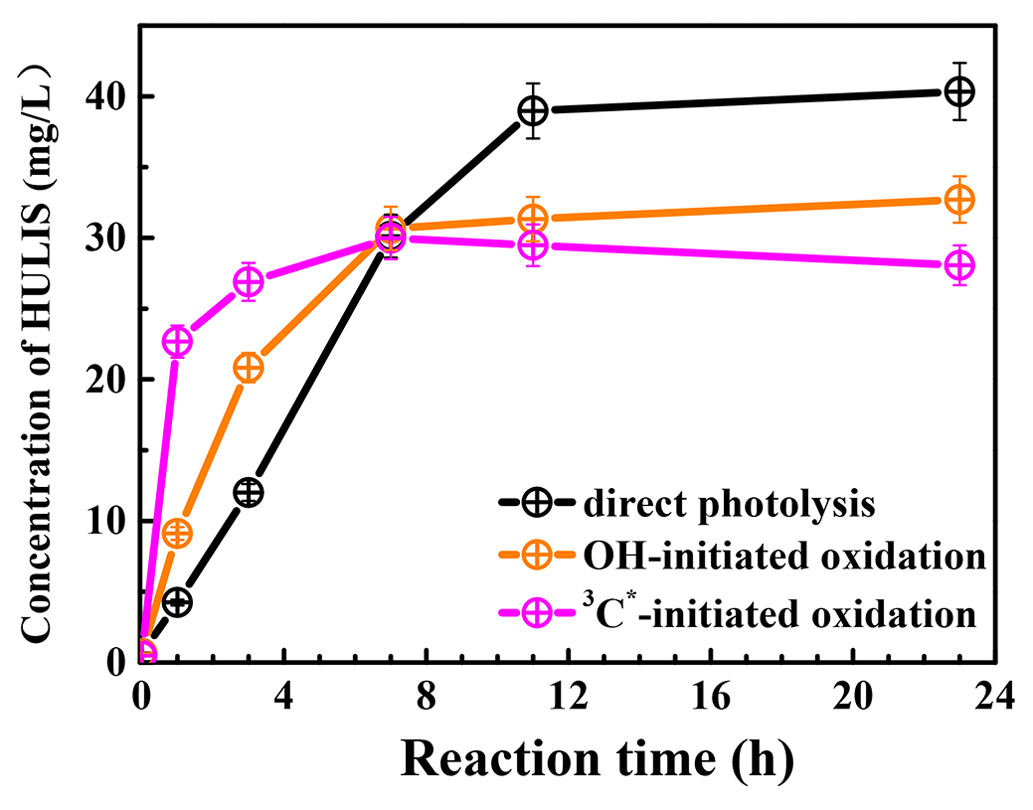
Figure 7HULIS concentrations as a function of reaction time under direct photolysis, OH-initiated oxidation, and 3C∗-initiated oxidation.
3.5 Mass yield and oxidation degree of reaction products
3.5.1 Mass yields
HULIS is only a subset of the products from aqueous oxidation, and here we used AMS to further quantify the total reaction products. Figure 8a shows SP-AMS-measured organic mass profiles (normalized by sulfate mass; ) against the reaction time. As the reaction propagated, increased continuously in the 3C∗-initiated system. Nevertheless, it arose stepwise and reached a maximum at 19 h and then remained at a plateau for the direct photolysis and OH-mediated oxidation. Figure 8b illustrates the calculated mass yields at different reaction times. The mass yields were in the ranges of 46.2 %–196.5 %, 22.1 %–144.9 %, and 19.3 %–140.1 % for 3C∗ oxidation, OH oxidation, and direct photolysis, respectively. For the same oxidation time, the mass yield from 3C∗ oxidation was generally higher than those from OH oxidation and direct photolysis. There are two plausible reasons for the high mass yield of 3C∗-initiated oxidation. First, oxidation by 3C∗ was more efficient at forming oligomers and functionalized/oxygenated products (Richards-Henderson et al., 2014; Yu et al., 2016). A higher oxidative degree of products from 3C∗-initiated photooxidation (see Sect. 3.5.2) supports this hypothesis. Second, more light-absorbing products which formed during the initial stage of the 3C∗ oxidation (Fig. 5c) may accelerate the oxidation by acting as photosensitizers (Tsui and McNeill, 2018).
The product mass yields obtained in this work (∼ 20 %–197 %) agree overall with those reported previously for phenolic compounds. For example, Huang et al. (2018) reported mass yields of 30 %–120 % for syringaldehyde and acetosyringone, Smith et al. (2014) found that mass yields of aqSOA from three phenols with 3C∗ were nearly 100 %, and Ma et al. (2021) reported a yield ranging from 59 % to 99 % for six highly substituted phenols with 3C∗. Mass yields of SOA from three benzene-diols were near 100 % with both OH and 3C∗ oxidants (Smith et al., 2015). Direct photolysis of phenolic carbonyls, and oxidation of syringol by 3C∗, had SOA mass yields ranging from 80 % to 140 % (Smith et al., 2016). Our previous study on eugenol OH oxidation, illuminated by a 500 W Xe lamp, reported a mass yield of ∼180 % (Ye et al., 2020), which is slightly higher than the value determined here owing to different light wavelengths/intensities.
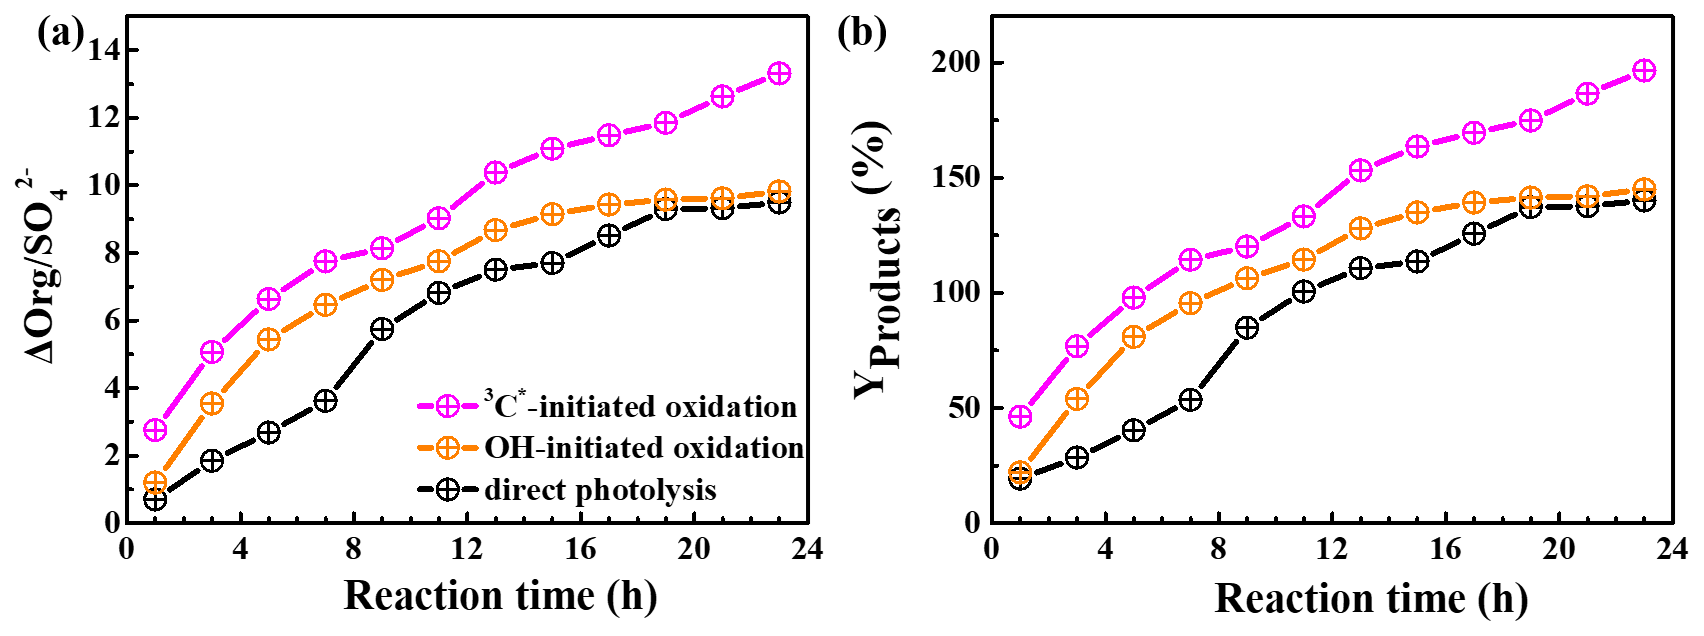
Figure 8Variations in the organic mass normalized by sulfate (a) () and (b) mass yields of reaction products with reaction time under direct photolysis, OH-initiated oxidation, and 3C∗-initiated oxidation.
3.5.2 Oxidation degree
In order to further probe the oxidation levels of the reaction products, derived from the SP-AMS mass spectrum of the organics was used to represent the oxidation degree of the products. In addition, the carbon oxidation state (OSc; defined as ; Kroll et al., 2011) was also calculated. Figure 9a–c depict variations in the elemental ratios ( and ) and OSc during oxidations. Rapid increases in and OSc during the initial stage of oxidation (within 1 h) were observed, with changing from 0.26 to 0.65, 0.26 to 0.70, and 0.25 to 0.75 and OSc changing from −1.11 to −0.15, −1.16 to −0.05, and −1.13 to 0.09 for direct photolysis, OH oxidation, and 3C∗ oxidation, respectively. The was lower than those of other phenolic aqSOA (Yu et al., 2014), due to different substituted groups in the aromatic ring of the precursors. Both and OSc gradually increased, while changed little after 1 h. The enhancements of OSc in the end were 1.22, 1.11, and 0.86 for 3C∗-initiated oxidation, OH-initiated oxidation, and direct photolysis, respectively.
Furthermore, the f44 vs. f43 diagram (triangle plot) can be used to demonstrate the evolution of SOA during oxidation (Ng et al., 2010). The f44 and f43 values are defined as the ratios of signal intensities of 44 (mainly CO) and 43 (mainly C2H3O+) to the total organics. The results show that the f44 increased continuously (moved upwards) during both OH and 3C∗ oxidations, indicating the persistent formation of highly oxygenated compounds, including organic acids, such as formic acid and oxalic acid (Sun et al., 2010). Note the f44 enhancement was much more significant for 3C∗ oxidation (from 0.07 to 0.16) than direct photolysis (from 0.07 to 0.12) and OH oxidation (from 0.07 to 0.13), consistent with its higher and OSc. The f43 value decreased in the first stage (1–3 h) and then increased at later stages. The final f43 values were almost the same as those of the initial solutions and were small. As a result, all data points were located outside the f44 vs. f43 region (bounded by the two dashed lines in Fig. 9d–f) for ambient aerosols, as established by Ng et al. (2010).
In summary, our results shown here demonstrate that aqueous-phase eugenol photochemical oxidation can generate highly oxygenated products and hence increase the degree of oxygenation of overall SOA.
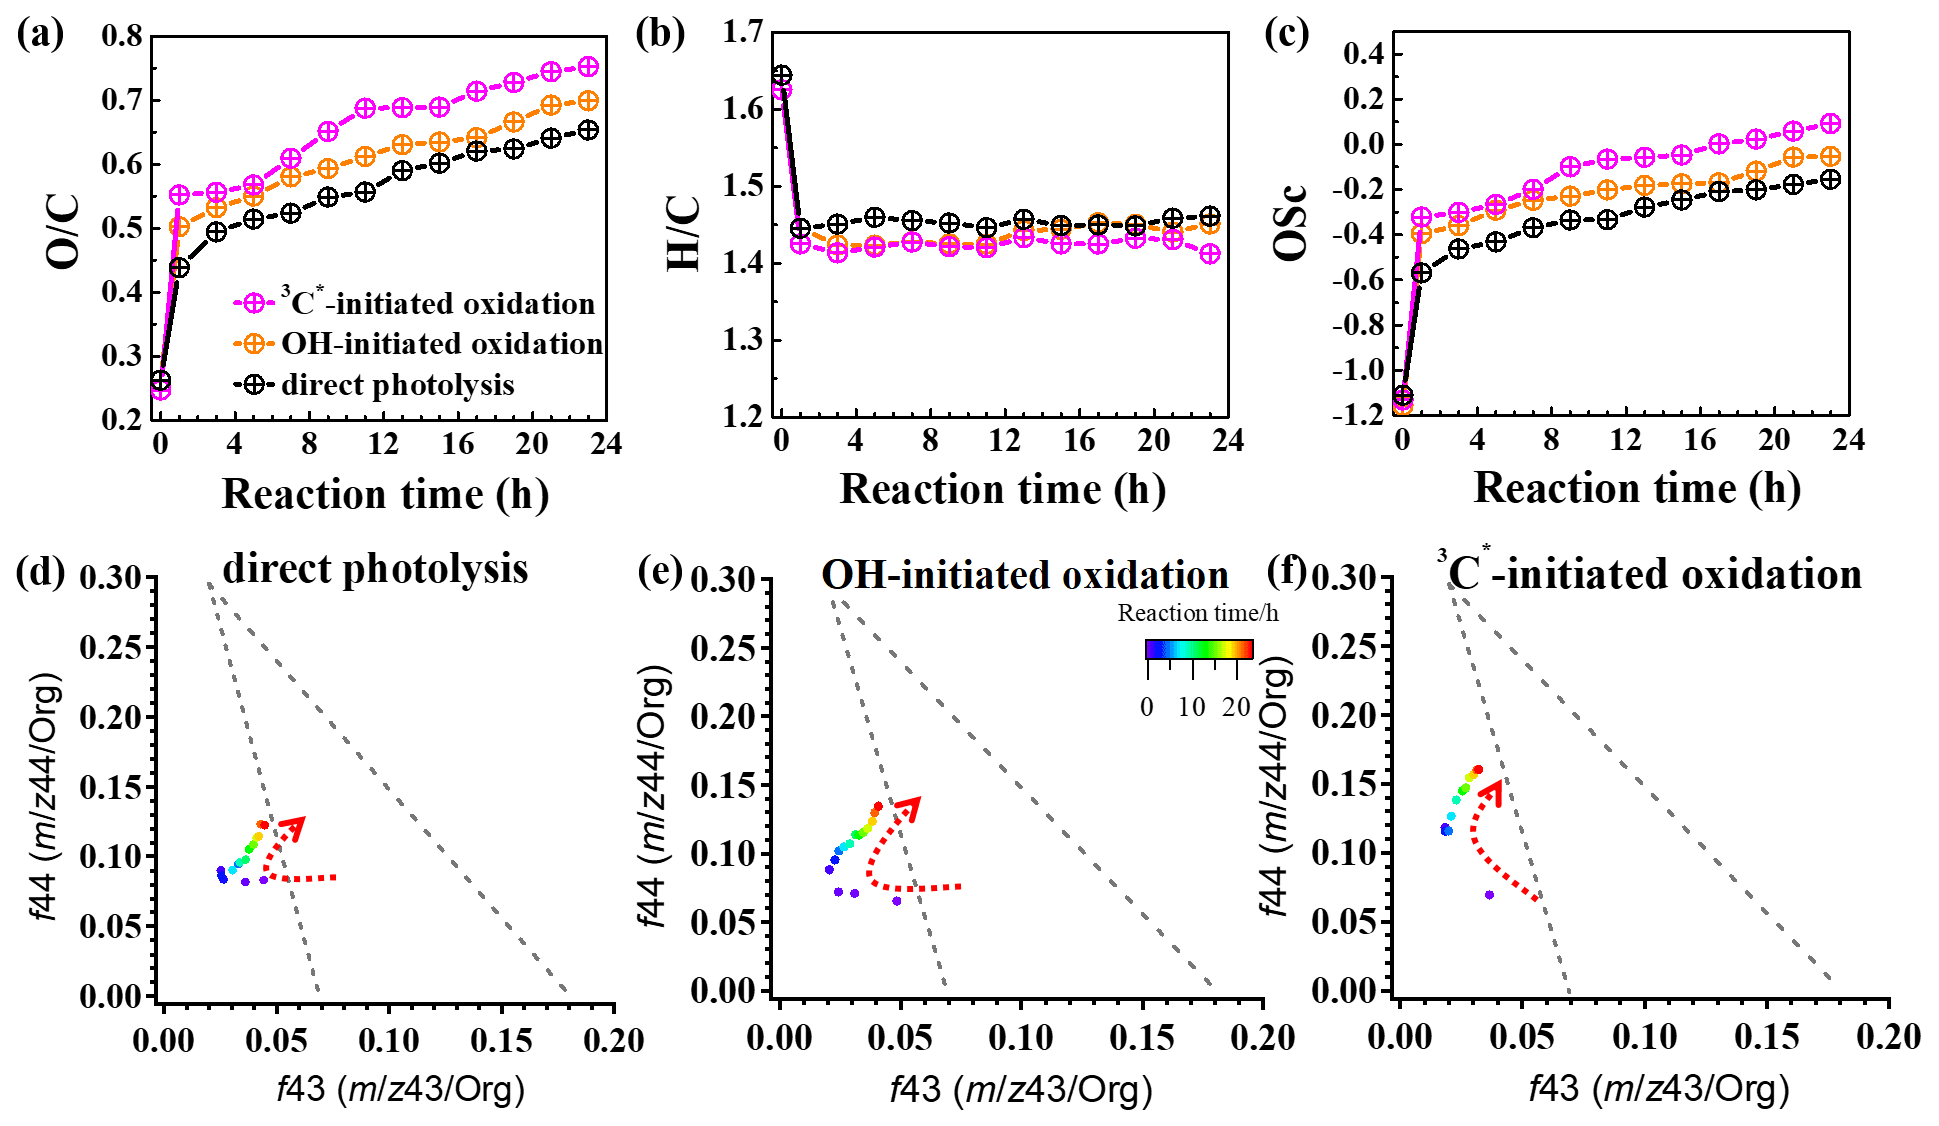
Figure 9Variations in the elemental ratios of (a) , (b) , and (c) oxidation state (OSc) as a function of reaction time. The f44 vs. f43 plots of reaction products under (d) direct photolysis, (e) OH-initiated oxidation, and (f) 3C∗-initiated oxidation.
3.6 Molecular characterization of reaction products and proposed reaction mechanism
3.6.1 Major products identified by GC-MS
SP-AMS was limited to probing the bulk composition of low-volatility oxidation products; thus, the molecular-level characterization of products was performed by using GC-MS here. The total ion chromatograph (TIC) of GC-MS on the solutions before illumination (0 h) and at illumination times of 11 and 23 h for the 3C∗-initiated photooxidation is shown in Fig. S7. As shown in Fig. S7, eugenol (retention time, RT, at 11:50 min) loss was more than 90 % at 11 h, which could be confirmed by the experimental data reported in Sect. 3.1. A comparison of the products at 11 and 23 h showed no significant difference. Similar to the aqueous photochemical oxidation with OH (Ye et al., 2020), a series of products were identified and listed in Table 2. Except for 5-allyl-3-methoxybenzene-1,2-diol (MW 180; RT = 12:59 min), the other eight products were detected for both OH and 3C∗-initiated photooxidations. Some of them (eugenol, DMB, and products 1, 2, and 5) were identified by using certified reference materials, and some of them (products 3, 4, 6, 7, 8, and 9) were inferred according to the molecular ion peaks and fragments from GC-MS, based on spectra from the National Institute of Standards and Technology (NIST) database (Stein, 2014) and from the reactants and reaction conditions.
Table 2Major reaction products identified via GC-MS.

a The precursor (eugenol) and triplet precursor (DMB) are also shown. b This compound was only identified in 3C∗ oxidation solution.
We also found 4-(1-hydroxypropyl)-2-methoxyphenol (product 8) was relatively abundant (Fig. S7), suggesting that functionalization might dominate as compared to oligomerization and fragmentation. Products were mainly from the addition/elimination of hydroxyl (-OH), methoxyl (-OCH3) to the benzene ring or allyl group and further oxidized to carbonyl or carboxyl compounds. As suggested by Bonin et al. (2007), the OH addition to the aromatic ring of phenol preferentially takes place at the ortho (48 %) and the para (36 %) positions, leading to the formation of the OH-adduct product 6 (5-allyl-3-methoxybenzene-1,2-diol). Notably, dimers and ring-opening products were not observed, but they cannot be excluded since they would be probably out of the detection of GC-MS technique (Vione et al., 2014).
3.6.2 Reaction mechanism
The reaction pathways of the 3C∗-initiated photooxidation of eugenol are demonstrated in Fig. 10 based on the products identified by GC-MS. The other intermediates and the potential pathways were proposed according to the identified products and the reaction rationality from the starting reactant. To better depict the mechanism, DMB was expressed as [RCHO] and eugenol as Ph-R for simplicity. [RCHO] absorbs light and undergoes excitation to 1[RCHO]∗ and then experiences the intersystem crossing (ISC) to form 3[RCHO]∗. 3[RCHO]∗ can participate in subsequent reactions via three channels. First, it can react with O2 to form 1O2 via energy transfer. Second, it can transform to [RCHO]•− and subsequently react with O2 to generate O via electron transfer, which can then disproportionate to H2O2. The decomposition of H2O2 can generate the OH radical. Third, the 3[RCHO]∗ can react with Ph-R to form [Ph-R•] via H abstraction. The cleavage of [Ph-R•] to the free radical segment (such as CH2CH• or CH3O•) takes place and then an additional hydrogen transfer could occur, resulting in a 2H addition to the new intermediate compound to form 4-allyl-phenol (product 1). Similarly, when the CH2CH• is lost from [Ph-R•], an addition of H2O would happen on the new compound (product 4) and be further oxidized to 4-hydroxy-3-methoxybenzaldehyde (product 2). Another possibility is that the intermediate [Ph-R•] can resonate to several different isoelectronic species, where the radical position changes to aromatic ring or allyl group site, which would couple with OH to form hydroxylated eugenol monomer (products 6, 7, and 9 MW =180). Consequently, the isoelectronic species at allyl group site could also abstract a hydrogen atom to form isoeugenol (product 3 MW =164). Also, the breakage of C=C into C−C and a 2H addition at the allyl group site could form 2-methoxy-4-propylphenol (product 5; MW =166). Besides, the C=C breaking intermediate can couple with OH to form 4-(1-hydroxypropyl)-2-methoxyphenol (product 8; MW =182). In conclusion, 3C∗ can directly oxidize eugenol to form SOA products or small molecular compounds or indirectly oxidize eugenol via energy transfer, electron transfer, hydrogen abstraction, proton-coupled electron transfer, or other radical chain reactions.
The organic groups, such as methoxy and allyl groups, can be eliminated from aromatic ring, which then participate in photochemical reaction, resulting in the generation of dimers, small organic acids, CO2 and H2O, etc. Dimers previously reported from aqueous reaction of 4-methylsyringol with OH were not detected via GC-MS in the present work, but dimer fragment ions (C20H22O) were detected by SP-AMS with trace amounts. Functionalization due to the additions of hydroxyl and carbonyl functional groups to the aromatic rings could account for the enhancement of light absorption at wavelengths of 300–400 nm. However, polar high MW organic acids were not detected likely due to the limitation of GC-MS technique.

Figure 10Proposed reaction mechanism of 3C∗-initiated photooxidation of eugenol. The red text represents the precursor, and the compounds labelled as products 1–9 are those identified by GC-MS (Table 2).
3.7 Oxidative potential (OP) of reaction products
The OP of oxidation products can be represented by the consumption rate of DTT concentration, defined as RDTT. Figure 11a shows the DTT consumed mass (MDTT) as a function of incubation times (0, 30, 60, 90, 120, and 150 min) for a triplicate sample (300 µM eugenol) and blank (ultrapure water). MDTT values for both blank and eugenol were proportional to incubation time, indicating that ROS-generating substances in the reaction solution act only as catalyst and was itself not consumed. The slopes represent the DTT consumption rates, which are also illustrated in Fig. 11a. Average RDTT0 (blank) was 0.31 µM min−1, and RDTT for the initial 300 µM eugenol (before the experiment) was 0.52 µM min−1. Since the self-oxidation of DTT might lead to the consumption of DTT in ultrapure water, a final DTT consumption rate of the reacted solution after oxidation was then blank corrected by subtracting the average RDTT0.
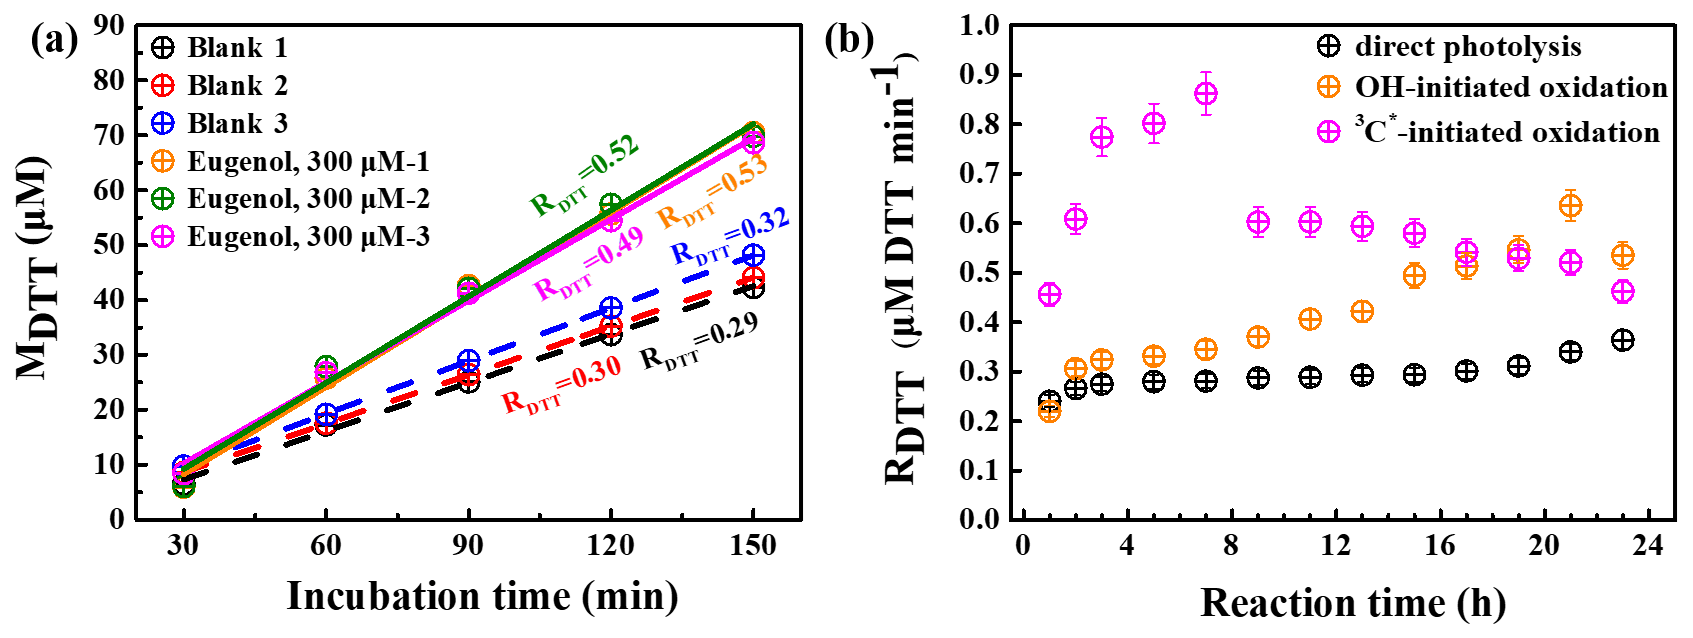
Figure 11(a) DTT consumed mass vs. incubation times for blank (ultrapure water) and 300 µM eugenol solutions in a triplicate and (b) blank-corrected DTT consumption rates vs. reaction time for direct photolysis, OH-initiated oxidation, and 3C∗-induced oxidation.
Figure 11b shows changes in blank-corrected RDTT with the reaction times for direct photolysis, OH-initiated oxidation, and 3C∗-initiated oxidation, respectively. The RDTT value of 3C∗ oxidation products increased quickly, and reached the maximum (0.9) at 7 h, then decreased slowly, and its end value was lower than that from OH oxidation. The RDTT value of the OH oxidation products, on the other hand, increased slowly and reached the maximum at 21 h. The RDTT value of the products from the direct photolysis increased continuously but also slowly to ∼0.36 until the end of the oxidation. Nevertheless, we can see that the final RDTT values were all higher than that of eugenol, proving that aqueous-phase processing can generate products with higher OP, resulting in more health hazards than the precursor does. The DTT consumption rates are comparable to those using the same DTT method (Charrier and Anastasio, 2012; Lin and Yu, 2019). The weak correlation was found between the HULIS concentration and RDTT, implying that OP was not only dependent upon HULIS. Moreover, HULIS with diverse molecular structures also exhibits different ROS-generation potentials (Kramer et al., 2016); therefore the HULIS as an ensemble may not correlate well with OP.
The high mass yields of the aqueous-phase photooxidation of eugenol (exceeding 100 % after 23 h of illumination) found here are similar to or even higher than those previously reported yields of a number of phenolic compounds (e.g., Smith et al., 2014, 2015, 2016; Ma et al., 2021), which reemphasizes the importance of biomass burning (BB) to the SOA budget (Gilardoni et al., 2016), particularly in regions or periods with significant BB activities. In addition, our study here used 300 µM H2O2 and 15 µM DMB as sources of OH and 3C∗, and 3C∗-mediated oxidation appeared to be faster than the OH-initiated oxidation of eugenol. Of course, whether or not 3C∗ is more important than OH in the real atmosphere depends upon their concentrations. OH and 3C∗ are difficult to measure, and concentrations vary greatly in real atmospheric samples. Herrmann et al. (2010) estimated an average OH level of M in urban fog water; Kaur and Anastasio (2018) measured 3C∗ concentration to be (0.70–15) M, which is 10–100 times higher than the coexisting OH in ambient fog waters; Kaur et al. (2019) determined both OH and 3C∗ concentrations in PM extracts, where the OH steady-state concentration was M, similar to its level in fog, cloud, and rain, while the 3C∗ concentration was M, a few hundred times higher than OH and nearly double its average value in fog. Therefore, together with these measurements, our findings likely signify a more important role of 3C∗ than OH in aqueous-phase (especially aerosol water) reactions. However, the liquid water content of aerosol is typically ∼10 000 times smaller than that of cloud (for instance, ∼50 µg m−3 vs. 0.5 g m−3). Even if the reaction rates in aerosol water were 10 times higher than those in cloud water, the overall importance of aqueous reactions initiated by the same oxidant in the aerosol phase would be still ∼1000 times smaller than it in cloud water. Moreover, quenching experiments reveal that O2 can inhibit eugenol degradation by effectively scavenging 3C∗, while it can promote degradation by fostering chain reactions in OH-induced oxidation, which offers insights to the control of reaction pathways by regulating ROS generations; of course, such an operation calls for application of highly sensitive ESR method.
Eugenol has a strong light absorption peak around 280 nm; therefore, it can undergo direct photolysis, and the addition of OH or other photosensitizers (3C∗) can gradually diminish its light absorption around 280 nm but increase the absorption in visible light range (>300 nm). In the meantime, HULIS was generated continuously, and GC-MS identified a number of high MW organic products, in line with those detected in earlier aqueous photooxidation of phenolic compounds (Jiang et al., 2021; Misovich et al., 2021; Tang et al., 2020; Yu et al., 2014). Overall, our work demonstrates that the aqueous oxidation of BB emissions is a source of BrC, and this BrC may act as a photosensitizer to oxidize other species; a portion of this BrC might be HULIS, and some high MW aromatic compounds are a subset of this HULIS. However, a recent study by J. Wang et al. (2021) shows that fossil-fuel-derived organic aerosol (FFOA) can be an effective precursor of aqSOA, but the aqSOA became less light-absorbing than the FFOA. These contrasting results indicate that the contribution of aqueous oxidation to BrC is largely dependent upon the precursors; molecular structures of major chromophores, changes in the structures upon oxidation, and their interplay with light absorptivity should be carefully investigated to achieve a full understanding of the impacts of aqueous processing on air quality, radiative forcing, and climate change.
Investigations on the OPs of the reaction products from eugenol photooxidation show that aqueous processing can produce more toxic products than the precursor. This result is in agreement with our previous work on resorcinol, hydroquinone, and methoxyhydroquinone (Ou et al., 2021). Although more studies on a broad spectrum of atmospherically relevant species and multiple indicators of toxicity are clearly needed, our findings here underscore the potential of aqueous processing on the enhancement of particle toxicity.
This study comprehensively investigated the aqueous photooxidation of eugenol upon direct photolysis and attacks by OH radicals and 3C∗ triplet states. By using a suite of techniques, the decay kinetics of eugenol, chemical, and optical properties, as well as the toxicity of reaction products, were studied. The first-order rate constants followed the order of 3C OH > direct photolysis (300 µM, H2O2, and 15 µM DMB as sources of OH and 3C∗). Further quenching experiments on different ROS during 3C∗-mediated oxidation showed that 3C∗ was the major contributor, followed by 1O2, O and OH; O played a more important role than OH during OH-initiated oxidation. The rate constants under saturated O2, air, and N2 followed the order of for both direct photolysis and OH-initiated oxidation but changed to for 3C∗-mediated oxidation. O2 appeared to be a scavenger of 3C∗, therefore suppressing 3C∗ oxidation, while it could promote the generation of OH and thus accelerate OH-mediated oxidation. pH and DO levels both decreased during oxidation, indicating the formation of acids and a certain role of DO in oxidation.
Eugenol itself can absorb light significantly at around 280 nm, and aqueous oxidation gradually decreases this absorption of UV light but enhances the absorbance in the visible light range (mainly 300–400 nm), indicative of the generation of BrC species. These species were likely linked with HULIS, as the HULIS concentration increased during the course of oxidation, in particular for the initial stage of 3C∗-mediated reactions. The final mass yields of reaction products (after 23 h of irradiation) were 140.1 %, 144.9 %, and 196.5 % for direct photolysis, OH oxidation, and 3C∗ oxidation, respectively. Oxidation degrees of the products increased continuously with the illumination time, indicating the persistent formation of highly oxygenated compounds, especially during 3C∗-mediated reactions. Molecular characterization by GC-MS identified a series of oxygenated compounds, allowing us to propose the detailed oxidation mechanism. Functionalization appeared to be a dominant pathway to form the observed species.
The DTT method was used to assess OP of the reaction products. The end products in all three sets of experiments showed higher DTT consumption rates than that of the precursor; products from 3C∗ oxidation showed a particularly fast increase in the first few hours of reactions. This result demonstrates that species that are more toxic than its precursors could be produced upon aqueous oxidation, indicative of the potential toxic effects induced by aqueous processing.
The relevant data of this study are available at http://nuistairquality.com/eugenol_data_and_figure (last access: 9 June 2022, Li et al., 2022).
The supplement related to this article is available online at: https://doi.org/10.5194/acp-22-7793-2022-supplement.
XL, YT, LZ, SM, SL, ZZ, and NS conducted the experiments. XL and YT analysed the data. XL and ZY prepared and wrote the paper, with contributions from all co-authors. ZY and XG reviewed and commented on the paper.
The contact author has declared that neither they nor their co-authors have any competing interests.
Publisher’s note: Copernicus Publications remains neutral with regard to jurisdictional claims in published maps and institutional affiliations.
The authors acknowledge support from the National Natural Science Foundation of China (grant nos. 21976093 and 42021004), the Natural Science Foundation of Jiangsu Province (grant no. BK20181476), the open fund by the Jiangsu Key Laboratory of Atmospheric Environment Monitoring and Pollution Control (grant no. KHK1904), the Postgraduate Research & Practice Innovation Program of Jiangsu Province (grant nos. SJCX21_1332 and SJCX20_1030), and the Jiangsu University of Technology (grant no. XSJCX20_05).
This research has been supported by the National Natural Science Foundation of China (grant nos. 21976093 and 42021004), the Natural Science Foundation of Jiangsu Province (grant no. BK20181476), the open fund by the Jiangsu Key Laboratory of Atmospheric Environment Monitoring and Pollution Control (grant no. KHK1904), the Postgraduate Research & Practice Innovation Program of Jiangsu Province (grant nos. SJCX21_1332 and SJCX20_1030), and the Jiangsu University of Technology (grant no. XSJCX20_05).
This paper was edited by Barbara Ervens and reviewed by three anonymous referees.
Alam, M. S., Delgado-Saborit, J. M., Stark, C., and Harrison, R. M.: Using atmospheric measurements of PAH and quinone compounds at roadside and urban background sites to assess sources and reactivity, Atmos. Environ., 77, 24–35, https://doi.org/10.1016/j.atmosenv.2013.04.068, 2013.
Alegría, A. E., Ferrer, A., Santiago, G., Sepúlveda, E., and Flores, W.: Photochemistry of water-soluble quinones. Production of the hydroxyl radical, singlet oxygen and the superoxide ion, J. Photochem. Photobiol. Chem., 127, 57–65, https://doi.org/10.1016/S1010-6030(99)00138-0, 1999.
Arakaki, T., Anastasio, C., Kuroki, Y., Nakajima, H., Okada, K., Kotani, Y., Handa, D., Azechi, S., Kimura, T., Tsuhako, A., and Miyagi, Y.: A general scavenging rate constant for reaction of hydroxyl radical with organic carbon in atmospheric waters, Environ. Sci. Technol., 47, 8196–8203, https://doi.org/10.1021/es401927b, 2013.
Aryal, R., Lee, B. K., Beecham, S., Kandasamy, J., Aryal, N., and Parajuli, K.: Characterisation of road dust organic matter as a function of particle size: A PARAFAC Approach, Water Air Soil Poll., 226, 24, https://doi.org/10.1007/s11270-014-2289-y, 2015.
Bari, M. A., Baumbach, G., Kuch, B., and Scheffknecht, G.: Wood smoke as a source of particle-phase organic compoundsin residential areas, Atmos. Environ., 43, 4722–4732, https://doi.org/10.1016/j.atmosenv.2008.09.006, 2009.
Barsotti, F., Ghigo, G., and Vione, D.: Computational assessment of the fluorescence emission of phenol oligomers: A possible insight into the fluorescence properties of humic-like Substances (HULIS), J. Photochem. Photobio. A, 315, 87–93, https://doi.org/10.1016/j.jphotochem.2015.09.012, 2016.
Barzaghi, P. and Herrmann, H.: A mechanistic study of the oxidation of phenol by OH/NO2/NO3 in aqueous solution, Phys. Chem. Chem. Phys., 4, 3669–3675, https://doi.org/10.1039/B201652D, 2002.
Bianco, A., Minella, M., De Laurentiis, E., Maurino, V., Minero, C., and Vione, D.: Photochemical generation of photoactive compounds with fulvic-like and humic-like fluorescence in aqueous solution, Chemosphere, 111, 529–536, https://doi.org/10.1016/j.chemosphere.2014.04.035, 2014.
Bonin, J., Janik, I., Janik, D., and Bartels, D. M.: Reaction of the hydroxyl radical with phenol in water up to supercritical conditions, J. Phys. Chem. A, 111, 1869–1878, https://doi.org/10.1021/jp0665325, 2007.
Canagaratna, M. R., Jimenez, J. L., Kroll, J. H., Chen, Q., Kessler, S. H., Massoli, P., Hildebrandt Ruiz, L., Fortner, E., Williams, L. R., Wilson, K. R., Surratt, J. D., Donahue, N. M., Jayne, J. T., and Worsnop, D. R.: Elemental ratio measurements of organic compounds using aerosol mass spectrometry: characterization, improved calibration, and implications, Atmos. Chem. Phys., 15, 253–272, https://doi.org/10.5194/acp-15-253-2015, 2015.
Chang, J. L. and Thompson, J. E.: Characterization of colored products formed during irradiation of aqueous solutions containing H2O2 and phenolic compounds, Atmos. Environ., 44, 541–551, https://doi.org/10.1016/j.atmosenv.2009.10.042, 2010.
Charrier, J. G. and Anastasio, C.: On dithiothreitol (DTT) as a measure of oxidative potential for ambient particles: evidence for the importance of soluble transition metals, Atmos. Chem. Phys., 12, 9321–9333, https://doi.org/10.5194/acp-12-9321-2012, 2012.
Chen, H., Ge, X., and Ye, Z.: Aqueous-phase secondary organic aerosol formation via reactions with organic triplet excited states – a short review, Curr. Pollut. Rep., 4, 8–12, https://doi.org/10.1007/s40726-018-0079-7, 2018.
Chen, Q., Ikemori, F., and Mochida, M.: Light Absorption and excitation–emission fluorescence of urban organic aerosol components and their relationship to chemical structure, Environ. Sci. Technol., 50, 10859–10868, https://doi.org/10.1021/acs.est.6b02541, 2016a.
Chen, Q., Miyazaki, Y., Kawamura, K., Matsumoto, K., Coburn, S., Volkamer, R., Iwamoto, Y., Kagami, S., Deng, Y., Ogawa, S., Ramasamy, S., Kato, S., Ida, A., Kajii, Y., and Mochida, M.: Characterization of chromophoric water-soluble organic matter in urban, forest, and marine aerosols by HR-ToF-AMS analysis and excitation-emission matrix spectroscopy, Environ. Sci. Technol., 50, 10351–10360, https://doi.org/10.1021/acs.est.6b01643, 2016b.
Chen, Q., Wang, M., Wang, Y., Zhang, L., Li, Y., and Han, Y.: Oxidative potential of water-soluble matter associated with chromophoric substances in PM2.5 over Xi'an, China, Environ. Sci. Technol., 53, 8574–8584, https://doi.org/10.1021/acs.est.9b01976, 2019.
Chen, Y., Li, N., Li, X., Tao, Y., Luo, S., Zhao, Z., Ma, S., Huang, H., Chen, Y., Ye, Z., and Ge, X.: Secondary organic aerosol formation from 3C∗-initiated oxidation of 4-ethylguaiacol in atmospheric aqueous-phase, Sci. Total. Environ., 723, 137953, https://doi.org/10.1016/j.scitotenv.2020.137953, 2020.
Cho, A. K., Sioutas, C., Miguel, A. H., Kumagai, Y., Schmitz, D. A., Singh, M., Eiguren-Fernandez, A., and Froines, J. R.: Redox activity of airborne particulate matter at different sites in the Los Angeles Basin, Environ. Res., 99, 40–47, https://doi.org/10.1016/j.envres.2005.01.003, 2005.
De Laurentiis, E., Socorro, J., Vione, D., Quivet, E., Brigante, M., Mailhot, G., Wortham, H., and Gligorovski, S.: Phototransformation of 4-phenoxyphenol sensitised by 4-carboxybenzophenone: evidence of new photochemical pathways in the bulk aqueous phase and on the surface of aerosol deliquescent particles, Atmos. Environ., 8, 569–578, https://doi.org/10.1016/j.atmosenv.2013.09.036, 2013a.
De Laurentiis, E., Sur, B., Pazzi, M., Maurino, V., Minero, C., Mailhot, G., Brigante, M., and Vione, D.: Phenol transformation and dimerisation, photosensitised by the triplet state of 1-nitronaphthalene: A possible pathway to humic-like substances (HULIS) in atmospheric waters, Atmos. Environ., 70, 318–327, https://doi.org/10.1016/j.atmosenv.2013.01.014, 2013b.
Dou, J., Lin, P., Kuang, B. Y., and Yu, J.: Reactive oxygen species production mediated by humic-like substances in atmospheric aerosols: enhancement effects by pyridine, imidazole, and their derivatives, Environ. Sci. Technol., 49, 6457–6465, https://doi.org/10.1021/es5059378, 2015.
Ervens, B., Turpin, B. J., and Weber, R. J.: Secondary organic aerosol formation in cloud droplets and aqueous particles (aqSOA): a review of laboratory, field and model studies, Atmos. Chem. Phys., 11, 11069–11102, https://doi.org/10.5194/acp-11-11069-2011, 2011.
Fang, T., Verma, V., Bates, J. T., Abrams, J., Klein, M., Strickland, M. J., Sarnat, S. E., Chang, H. H., Mulholland, J. A., Tolbert, P. E., Russell, A. G., and Weber, R. J.: Oxidative potential of ambient water-soluble PM2.5 in the southeastern United States: contrasts in sources and health associations between ascorbic acid (AA) and dithiothreitol (DTT) assays, Atmos. Chem. Phys., 16, 3865–3879, https://doi.org/10.5194/acp-16-3865-2016, 2016.
Faust, J. A., Wong, J. P., Lee, A. K., and Abbatt, J. P.: Role of aerosol liquid water in secondary organic aerosol formation from volatile organic compounds, Environ. Sci. Technol., 51, 1405–1413, https://doi.org/10.1021/acs.est.6b04700, 2017.
Ge, X., Li, L., Chen, Y., Chen, H., Wu, D., Wang, J., Xie, X., Ge, S., Ye, Z., Xu, J., and Chen, M.: Aerosol characteristics and sources in Yangzhou, China resolved by offline aerosol mass spectrometry and other techniques, Environ. Pollut., 225, 74–85, https://doi.org/10.1016/j.envpol.2017.03.044, 2017.
George, K. M., Ruthenburg, T. C., Smith, J., Yu, L., Zhang, Q., Anastasio, C., and Dillner, A. M.: FT-IR quantification of the carbonyl functional group in aqueous-phase secondary organic aerosol from phenols, Atmos. Environ., 100, 230–237, https://doi.org/10.1016/j.atmosenv.2014.11.011, 2015.
Gilardoni, S., Massoli, P., Paglione, M., Giulianelli, L., Carbone, C., Rinaldi, M., Decesari, S., Sandrini, S., Costabile, F., Gobbi, G. P., Pietrogrande, M. C., Visentin, M., Scotto, F., Fuzzi, S., and Facchini, M. C.: Direct observation of aqueous secondary organic aerosol from biomass-burning emissions, P. Natl. Acad. Sci. USA, 113, 10013–10018, https://doi.org/10.1073/pnas.1602212113, 2016.
Gligorovski, S., Strekowski, R., Barbati, S., and Vinoe, D.: Environmental implications of hydroxyl radicals (•OH), Chem. Rev., 115, 13051–13092, https://doi.org/10.1021/cr500310b, 2015.
Graber, E. R. and Rudich, Y.: Atmospheric HULIS: How humic-like are they? A comprehensive and critical review, Atmos. Chem. Phys., 6, 729–753, https://doi.org/10.5194/acp-6-729-2006, 2006.
Guo, Y., Zhang, Y., Yu, G., and Wang, Y.: Revisiting the role of reactive oxygen species for pollutant abatement during catalytic ozonation: the probe approach vs. the scavenger approach, Appl. Catal. B-Environ., 280, 119418, https://doi.org/10.1016/j.apcatb.2020.119418, 2021.
Hawthorne, S. B., Krieger M. S., Miller D. J., and Mathiason M. B.: Collection and quantitation of methoxylated phenol tracers for atmospheric pollution from residential wood stoves, Environ. Sci. Technol., 23, 470–475, https://doi.org/10.1021/es00181a013, 1989.
He, L., Schaefer, T., Otto, T., Kroflic, A., and Herrmann, H.: Kinetic and theoretical study of the atmospheric aqueous-phase reactions of OH radicals with methoxyphenolic compounds, J. Phys. Chem. A, 123, 7828–7838, https://doi.org/10.1021/acs.jpca.9b05696, 2019.
Herrmann, H.: Kinetics of aqueous phase reaction relevant for atmospheric chemistry, Chem. Rev., 103, 4691–4716, https://doi.org/10.1021/cr020658q, 2003.
Herrmann, H., Hoffmann, D., Schaefer, T., Bräuer, P., and Tilgner, A.: Tropospheric aqueous-phase free-radical chemistry: Radical sources, spectra, reaction kinetics and prediction tools, ChemPhysChem, 11, 3796–3822, https://doi.org/10.1002/cphc.201000533, 2010.
Herrmann, H., Schaefer, T., Tilgner, A., Styler, S. A., Weller, C., Teich, M., and Otto, T.: Tropospheric aqueous-phase chemistry: kinetics, mechanisms, and its coupling to a changing gas phase, Chem. Rev., 115, 4259–4334, https://doi.org/10.1021/cr500447k, 2015.
Hong, J., Han, B., Yuan, N., and Gu, J.: The roles of active species in photo-decomposition of organic compounds by microwave powered electrodeless discharge lamps, J. Environ. Sci. (China), 33, 60–68, https://doi.org/10.1016/j.jes.2014.12.016, 2015.
Huang, D., Zhang, X., Chen, Z. M., Zhao, Y., and Shen, X. L.: The kinetics and mechanism of an aqueous phase isoprene reaction with hydroxyl radical, Atmos. Chem. Phys., 11, 7399–7415, https://doi.org/10.5194/acp-11-7399-2011, 2011.
Huang, D., Zhang, Q., Cheung, H. H. Y., Yu, L., Zhou, S., Anastasio, C., Smith, J. D., and Chan, C. K.: Formation and evolution of aqSOA from aqueous-phase reactions of phenolic carbonyls: comparison between ammonium sulfate and ammonium nitrate solutions, Environ. Sci. Technol., 52, 9215–9224, https://doi.org/10.1021/acs.est.8b03441, 2018.
Huo, Y., Guo, Z., Li, Q., Wu, D., Ding, X., Liu, A., Huang, D., Qiu, G., Wu, M., Zhao, Z., Sun, H., Song, W., Li, X., Chen, Y., Wu, T., and Chen, J. Chemical fingerprinting of HULIS in particulate matters emitted from residential coal and biomass combustion, Environ. Sci. Technol., 55, 3593–3603, https://doi.org/10.1021/acs.est.0c08518, 2021.
Jiang, W., Misovich, M. V., Hettiyadura, A. P. S., Laskin, A., McFall, A. S., Anastasio, C., and Zhang, Q.: Photosensitized reactions of a phenolic carbonyl from wood combustion in the aqueous phase-chemical evolution and light absorption properties of aqSOA, Environ. Sci. Technol., 55, 5199–5211, https://doi.org/10.1021/acs.est.0c07581, 2021.
Kaur, R. and Anastasio, C.: First measurements of organic triplet excited states in atmospheric waters, Environ. Sci. Technol., 52, 5218–5226, https://doi.org/10.1021/acs.est.7b06699, 2018.
Kaur, R., Labins, J. R., Helbock, S. S., Jiang, W., Bein, K. J., Zhang, Q., and Anastasio, C.: Photooxidants from brown carbon and other chromophores in illuminated particle extracts, Atmos. Chem. Phys., 19, 6579–6594, https://doi.org/10.5194/acp-19-6579-2019, 2019.
Kramer, A. J., Rattanavaraha, W., Zhang, Z., Gold, A., Surratt, J. D., and Lin, Y.-H.: Assessing the oxidative potential of isoprene-derived epoxides and secondary organic aerosol, Atmos. Environ., 130, 211–218, https://doi.org/10.1016/j.atmosenv.2015.10.018, 2016.
Kroll, J. H., Donahue, N. M., Jimenez, J. L., Kessler, S. H., Canagaratna, M. R., Wilson, K. R., Altieri, K. E., Mazzoleni, L. R., Wozniak, A. S., Bluhm, H., Mysak, E. R., Smith, J. D., Kolb, C. E., and Worsnop, D. R.: Carbon oxidation state as a metric for describing the chemistry of atmospheric organic aerosol, Nat. Chem., 3, 133–139, https://doi.org/10.1038/nchem.948, 2011.
Lee, A. K. Y., Hayden, K. L., Herckes, P., Leaitch, W. R., Liggio, J., Macdonald, A. M., and Abbatt, J. P. D.: Characterization of aerosol and cloud water at a mountain site during WACS 2010: secondary organic aerosol formation through oxidative cloud processing, Atmos. Chem. Phys., 12, 7103–7116, https://doi.org/10.5194/acp-12-7103-2012, 2012.
Leenheer, J. A. and Croue, J. P.: Characterizing aquatic dissolved organic matter, Environ. Sci. Technol., 37, 18A–26A, https://doi.org/10.1021/es032333c, 2003.
Li, F., Tsona, N. T., Li, J., and Du, L.: Aqueous-phase oxidation of syringic acid emitted from biomass burning: formation of light-absorbing compounds, Sci. Total Environ., 765, 144239, https://doi.org/10.1016/j.scitotenv.2020.144239, 2021.
Li, X., Tao, Y., Zhu, L., Ma, S., Luo, S., Zhao, Z., Sun, N., Ge, X., and Ye, Z.: Eugenol data and figures, NUIST [data set], http://nuistairquality.com/eugenol_data_and_figure, last access: 9 June 2022.
Li, Y. J., Huang, D. D., Cheung, H. Y., Lee, A. K. Y., and Chan, C. K.: Aqueous-phase photochemical oxidation and direct photolysis of vanillin – a model compound of methoxy phenols from biomass burning, Atmos. Chem. Phys., 14, 2871–2885, https://doi.org/10.5194/acp-14-2871-2014, 2014.
Lim, Y. B., Tan, Y., Perri, M. J., Seitzinger, S. P., and Turpin, B. J.: Aqueous chemistry and its role in secondary organic aerosol (SOA) formation, Atmos. Chem. Phys., 10, 10521–10539, https://doi.org/10.5194/acp-10-10521-2010, 2010.
Lin, M. and Yu, J. Z.: Dithiothreitol (DTT) concentration effect and its implications on the applicability of DTT assay to evaluate the oxidative potential of atmospheric aerosol samples, Environ. Pollut., 251, 938–944, https://doi.org/10.1016/j.envpol.2019.05.074, 2019.
Lu, J., Ge, X., Liu, Y., Chen, Y., Xie, X., Ou, Y., Ye, Z., and Chen, M.: Significant secondary organic aerosol production from aqueous-phase processing of two intermediate volatility organic compounds, Atmos. Environ., 211, 63–68, https://doi.org/10.1016/j.atmosenv.2019.05.014, 2019.
Ma, L., Guzman, C., Niedek, C., Tran, T., Zhang, Q., and Anastasio, C.: Kinetics and mass yields of aqueous secondary organic aerosol from highly substituted phenols reacting with a triplet excited state, Environ. Sci. Technol., 55, 5772–5781, https://doi.org/10.1021/acs.est.1c00575, 2021.
Ma, Y., Cheng, Y., Qiu, X., Cao, G., Kuang, B., Yu, J. Z., and Hu, D.: Optical properties, source apportionment and redox activity of Humic-Like Substances (HULIS) in airborne fine particulates in Hong Kong, Environ. Pollut., 255, 113087, https://doi.org/10.1016/j.envpol.2019.113087, 2019.
Mabato, B. R. G., Lyu, Y., Ji, Y., Li, Y. J., Huang, D. D., Li, X., Nah, T., Lam, C. H., and Chan, C. K.: Aqueous secondary organic aerosol formation from the direct photosensitized oxidation of vanillin in the absence and presence of ammonium nitrate, Atmos. Chem. Phys., 22, 273–293, https://doi.org/10.5194/acp-22-273-2022, 2022.
McWhinney, R. D., Zhou, S., and Abbatt, J. P. D.: Naphthalene SOA: redox activity and naphthoquinone gas–particle partitioning, Atmos. Chem. Phys., 13, 9731–9744, https://doi.org/10.5194/acp-13-9731-2013, 2013.
Misovich, M. V., Hettiyadura, A. P. S., Jiang, W. Q., and Zhang, Q.: Molecular-level study of the photo-oxidation of aqueous-phase guaiacyl acetone in the presence of 3C∗: formation of brown carbon products, ACS Earth Space Chem., 5, 1983–1996, https://doi.org/10.1021/acsearthspacechem.1c00103, 2021.
Mladenov, N., Alados-Arboledas, L., Olmo, F. J., Lyamani, H., Delgado, A., Molina, A., and Reche, I.: Applications of optical spectroscopy and stable isotope analyses to organic aerosol source discrimination in an urban area, Atmos. Environ., 45, 1960–1969, https://doi.org/10.1016/j.atmosenv.2011.01.029, 2011.
Nau, W. M. and Scaiano, J. C.: Oxygen quenching of excited aliphatic ketones and diketones, J. Phys. Chem., 100, 11360–11367, https://doi.org/10.1021/jp960932i, 1996.
Ng, N. L., Canagaratna, M. R., Zhang, Q., Jimenez, J. L., Tian, J., Ulbrich, I. M., Kroll, J. H., Docherty, K. S., Chhabra, P. S., Bahreini, R., Murphy, S. M., Seinfeld, J. H., Hildebrandt, L., Donahue, N. M., DeCarlo, P. F., Lanz, V. A., Prévôt, A. S. H., Dinar, E., Rudich, Y., and Worsnop, D. R.: Organic aerosol components observed in Northern Hemispheric datasets from Aerosol Mass Spectrometry, Atmos. Chem. Phys., 10, 4625–4641, https://doi.org/10.5194/acp-10-4625-2010, 2010.
Onasch, T. B., Trimborn, A., Fortner, E. C., Jayne, J. T., Kok, G. L., Williams, L. R., Davidovits, P., and Worsnop, D. R.: Soot particle aerosol mass spectrometer: Development, validation, and initial application, Aerosol Sci. Tech., 46, 804–817, https://doi.org/10.1080/02786826.2012.663948, 2012.
Ou, Y., Nie, D., Chen, H., Ye, Z., and Ge, X.: Characterization of products from the aqueous-phase photochemical oxidation of benzene-diols, Atmosphere, 12, 534, https://doi.org/10.3390/atmos12050534, 2021.
Pan, Y., Ma, H., Li, Z., Du, Y., Liu, Y., Yang, J., and Li, G.: Selective conversion of lignin model veratryl alcohol by photosynthetic pigment via photo-generated reactive oxygen species, Chem. Eng. J., 393, 124772, https://doi.org/10.1016/j.cej.2020.124772, 2020.
Raja, P., Bozzi, A., Mansilla, H., and Kiwi, J.: Evidence for superoxide-radical anion, singlet oxygen and OH-radical intervention during the degradation of the lignin model compound (3-methoxy-4-hydroxyphenylmethylcarbinol), J. Photochem. Photobiol. Chem., 169, 271–278, https://doi.org/10.1016/j.jphotochem.2004.07.009, 2005.
Richards-Henderson, N. K., Hansel, A. K., Valsaraj, K. T., and Anastasio, C.: Aqueous oxidation of green leaf volatiles by hydroxyl radical as a source of SOA: Kinetics and SOA yields, Atmos. Environ., 95, 105–112, https://doi.org/10.1016/j.atmosenv.2014.06.026, 2014.
Rossignol, S., Aregahegn, K. Z., Tinel, L., Fine, L., Nozière, B., and George, C.: Glyoxal induced atmospheric photosensitized chemistry leading to organic aerosol growth, Environ. Sci. Technol., 48, 3218–3227, https://doi.org/10.1021/es405581g, 2014.
Scharko, N. K., Berke, A. E., and Raff, J. D.: Release of nitrous acid and nitrogen dioxide from nitrate photolysis in acidic aqueous solutions, Environ. Sci. Technol., 48, 11991–12001, https://doi.org/10.1021/es503088x, 2014.
Simpson, C. D., Paulsen, M., Dills, R. L., Liu, L.-J. S., and Kalman, A. A.: Determination of methoxyphenols in ambient atmospheric particulate matter: Tracers for wood combustion, Environ. Sci. Technol., 39, 631–637, https://doi.org/10.1021/es0486871, 2005.
Smith, J. D., Sio, V., Yu, L., Zhang, Q., and Anastasio, C.: Secondary organic aerosol production from aqueous reactions of atmospheric phenols with an organic triplet excited state, Environ. Sci. Technol., 48, 1049–1057, https://doi.org/10.1021/es4045715, 2014.
Smith, J. D., Kinney, H., and Anastasio, C.: Aqueous benzene-diols react with an organic triplet excited state and hydroxyl radical to form secondary organic aerosol, Phys. Chem. Chem. Phys., 17, 10227, https://doi.org/10.1039/c4cp06095d, 2015.
Smith, J. D., Kinney, H., and Anastasio, C.: Phenolic carbonyls undergo rapid aqueous photodegradation to form low-volatility, light-absorbing products, Atmos. Environ., 126, 36–44, https://doi.org/10.1016/j.atmosenv.2015.11.035, 2016.
Stein, S. E.: NIST/EPA/NIH Mass Spectral Library with Search Program – SRD 1a, National Institute of Standards and Technology, https://doi.org/10.18434/T4H594, 2014,
Sun, Y. L., Zhang, Q., Anastasio, C., and Sun, J.: Insights into secondary organic aerosol formed via aqueous-phase reactions of phenolic compounds based on high resolution mass spectrometry, Atmos. Chem. Phys., 10, 4809–4822, https://doi.org/10.5194/acp-10-4809-2010, 2010.
Tang, S., Li, F., Tsona, N.T., Lu, C., Wang, X., and Du, L.: Aqueous-phase photooxidation of vanillic acid: a potential source of humic-like substances (HULIS), ACS Earth Space Chem., 4, 862–872, https://doi.org/10.1021/acsearthspacechem.0c00070, 2020.
Tsui, W. G. and McNeill, V. F.: Modeling secondary organic aerosol production from photosensitized humic-like substances (HULIS), Environ. Sci. Technol. Lett., 5, 255–259, https://doi.org/10.1021/acs.estlett.8b00101, 2018.
Verma, V., Fang, T., Xu, L., Peltier, R. E., Russell, A. G., Ng, N. L., and Weber, R. J.: Organic aerosols associated with the generation of reactive oxygen species (ROS) by water-soluble PM2.5, Environ. Sci. Technol., 49, 4646–4656, https://doi.org/10.1021/es505577w, 2015.
Vione, D., Maurino, V., Minero, C., Pelizzetti, E., Harrison, M. A., Olariu, R. I., and Arsene, C.: Photochemical reactions in the tropospheric aqueous phase and on particulate matter, Chem. Soc. Rev., 35, 441–453, https://doi.org/10.1039/b510796m, 2006.
Vione, D., Maurino, V., and Minero, C.: Photosensitised humic-like substances (HULIS) formation processes of atmospheric significance: a review, Environ. Sci. Pollut. R., 21, 11614–11622, https://doi.org/10.1007/s11356-013-2319-0, 2014.
Vione, D., Albinet, A., Barsotti, F., Mekic, M., Jiang, B., Minero, C., Brigante, M., and Gligorovski, S.: Formation of substances with humic-like fluorescence properties, upon photoinduced oligomerization of typical phenolic compounds emitted by biomass burning, Atmos. Environ., 206, 197–207, https://doi.org/10.1016/j.atmosenv.2019.03.005, 2019.
Wang, J. and Wang, S.: Reactive species in advanced oxidation processes: Formation, identification and reaction mechanism, Chem. Eng. J., 401, 126158, https://doi.org/10.1016/j.cej.2020.126158, 2020.
Wang, J., Ye, J., Zhang, Q., Zhao, J., Wu, Y., Li, J., Liu, D., Li, W., Zhang, Y., Wu, C., Xie, C., Qin, Y., Lei, Y., Huang, X., Guo, J., Liu, P., Fu, P., Li, Y., Lee, H. C., Choi, H., Zhang, J., Liao, H., Chen, M., Sun, Y., Ge, X., Martin, S. T., and Jacob, D. J.: Aqueous production of secondary organic aerosol from fossil-fuel emissions in winter Beijing haze, P. Natl. Acad. Sci. USA., 118, e2022179118, https://doi.org/10.1073/pnas.2022179118, 2021.
Wang, L., Lan, X., Peng, W., and Wang, Z.: Uncertainty and misinterpretation over identification, quantification and transformation of reactive species generated in catalytic oxidation processes: A review, J. Hazard. Mater., 408, 124436, https://doi.org/10.1016/j.jhazmat.2020.124436, 2021.
Xu, X., Lu, X., Li, X., Liu, Y., Wang, X., Chen, H., Chen, J., Yang, X., Fu, T., Zhao, Q., and Fu, Q.: ROS-generation potential of Humic-like substances (HULIS) in ambient PM2.5 in urban Shanghai: Association with HULIS concentration and light absorbance, Chemosphere, 256, 127050, https://doi.org/10.1016/j.chemosphere.2020.127050, 2020.
Yang, J., Au, W. C., Law, H., Lam, C. H., and Nah, T.: Formation and evolution of brown carbon during aqueous-phase nitrate-mediated photooxidation of guaiacol and 5-nitroguaiacol, Atmos. Environ., 254, 118401, https://doi.org/10.1016/j.atmosenv.2021.118401, 2021.
Ye, Z., Zhuang, Y., Chen, Y., Zhao, Z., Ma, S., Huang, H., Chen, Y., and Ge, X.: Aqueous-phase oxidation of three phenolic compounds by hydroxyl radical: Insight into secondary organic aerosol formation yields, mechanisms, products and optical properties, Atmos. Environ., 223, 117240, https://doi.org/10.1016/j.atmosenv.2019.117240, 2020.
Yu, L., Smith, J., Laskin, A., Anastasio, C., Laskin, J., and Zhang, Q.: Chemical characterization of SOA formed from aqueous-phase reactions of phenols with the triplet excited state of carbonyl and hydroxyl radical, Atmos. Chem. Phys., 14, 13801–13816, https://doi.org/10.5194/acp-14-13801-2014, 2014.
Yu, L., Smith, J., Laskin, A., George, K. M., Anastasio, C., Laskin, J., Dillner, A. M., and Zhang, Q.: Molecular transformations of phenolic SOA during photochemical aging in the aqueous phase: competition among oligomerization, functionalization, and fragmentation, Atmos. Chem. Phys., 16, 4511–4527, https://doi.org/10.5194/acp-16-4511-2016, 2016.
Zhang, T., Huang, S., Wang, D., Sun, J., Zhang, Q., Xu, H., Ho, S., Cao, J., and Shen, Z.: Seasonal and diurnal variation of PM2.5 HULIS over Xi'an in Northwest China: Optical properties, chemical functional group, and relationship with reactive oxygen species (ROS), Atmos. Environ., 268, 118782, https://doi.org/10.1016/j.atmosenv.2021.118782, 2022.
Zhang, X., Chen, Z. M., and Zhao, Y.: Laboratory simulation for the aqueous OH-oxidation of methyl vinyl ketone and methacrolein: significance to the in-cloud SOA production, Atmos. Chem. Phys., 10, 9551–9561, https://doi.org/10.5194/acp-10-9551-2010, 2010.
Zhao, R., Lee, A. K., and Abbatt, J. P.: Investigation of aqueous-phase photooxidation of glyoxal and methylglyoxal by aerosol chemical ionization mass spectrometry: observation of hydroxyhydroperoxide formation, J. Phys. Chem. A., 116, 6253–6263, https://doi.org/10.1021/jp211528d, 2012.
Zhao, R., Mungall, E. L., Lee, A. K. Y., Aljawhary, D., and Abbatt, J. P. D.: Aqueous-phase photooxidation of levoglucosan – a mechanistic study using aerosol time-of-flight chemical ionization mass spectrometry (Aerosol ToF-CIMS), Atmos. Chem. Phys., 14, 9695–9706, https://doi.org/10.5194/acp-14-9695-2014, 2014.
Zhao, R., Lee, A. K. Y., Huang, L., Li, X., Yang, F., and Abbatt, J. P. D.: Photochemical processing of aqueous atmospheric brown carbon, Atmos. Chem. Phys., 15, 6087–6100, https://doi.org/10.5194/acp-15-6087-2015, 2015.
Zhou, Z., Chen, B., Qu, X., Fu, H., and Zhu, D.: Dissolved black carbon as an efficient sensitizer in the photochemical transformation of 17β-estradiol in aqueous solution, Environ. Sci. Technol., 52, 10391–10399, https://doi.org/10.1021/acs.est.8b01928, 2018.