the Creative Commons Attribution 4.0 License.
the Creative Commons Attribution 4.0 License.
 | 15 Jun 2022
Strong light scattering of highly oxygenated organic aerosols impacts significantly on visibility degradation
Li Liu
Miaomiao Zhai
Biao Xue
Yao He
Biao Luo
Wanyun Xu
Jiangchuan Tao
Changqin Yin
Hanbing Xu
Tao Deng
Xuejiao Deng
Haobo Tan
Min Shao
Secondary organic aerosols (SOAs) account for a large fraction of atmospheric aerosol mass and play significant roles in visibility impairment by scattering solar radiation. However, comprehensive evaluations of SOA scattering abilities under ambient relative humidity (RH) conditions on the basis of field measurements are still lacking due to the difficulty of simultaneously direct quantifications of SOA scattering efficiency in dry state and SOA water uptake abilities. In this study, field measurements of aerosol chemical and physical properties were conducted in winter in Guangzhou (lasting about 3 months) using a humidified nephelometer system and aerosol chemical speciation monitor. A modified multilinear regression model was proposed to retrieve dry-state mass scattering efficiencies (MSEs, defined as scattering coefficient per unit aerosol mass) of aerosol components. The more oxidized oxygenated organic aerosol (MOOA) with an ratio of 1.17 was identified as the most efficient light scattering aerosol component. On average, 34 % mass contribution of MOOA to total submicron organic aerosol mass contributed 51 % of dry-state organic aerosol scattering. The overall organic aerosol hygroscopicity parameter κOA was quantified directly through hygroscopicity closure, and hygroscopicity parameters of SOA components were further retrieved using a multilinear regression model by assuming hydrophobic properties of primary organic aerosols. The highest water uptake ability of MOOA among organic aerosol factors was revealed with κMOOA reaching 0.23, thus further enhancing the fractional contribution of MOOA in ambient organic aerosol scattering. In particular, the scattering abilities of MOOA were found to be even higher than those of ammonium nitrate under RH of <70 %, which was identified as the most efficient inorganic scattering aerosol component, demonstrating that MOOA had the strongest scattering abilities in ambient air (average RH of 57 %) during winter in Guangzhou. During the observation period, secondary aerosols contributed dominantly to visibility degradation (∼70 %), with substantial contributions from MOOA (16 % on average), demonstrating significant impacts of MOOA on visibility degradation. The findings of this study demonstrate that more attention needs to be paid to SOA property changes in future visibility improvement investigations. Also, more comprehensive studies on MOOA physical properties and chemical formation are needed to better parameterize its radiative effects in models and implement targeted control strategies on MOOA precursors for visibility improvement.
- Article
(5392 KB) - Full-text XML
-
Supplement
(3681 KB) - BibTeX
- EndNote


Atmospheric aerosols directly scatter and absorb solar radiation and thus have significant radiative effects on both the Earth–atmosphere radiative budget and the atmospheric environment. Aerosols represent the dominant contributor to atmospheric visibility impairment in polluted regions (Liu et al., 2017a). With rapid industrialization and urbanization, China has experienced severe haze pollution in the last decade, and frequent low visibility events have aroused public attention and concern, especially since 2013. In recent years, the Chinese government has implemented stringent control policies called “Blue Sky Actions” to lower aerosol mass concentration and improve atmospheric visibility. However, Xu et al. (2020) revealed that the visibility improvement in southern China was less than expected; it was especially poor in the Pearl River Delta region, due to the nonlinear responses of the visibility improvement to PM2.5 (particulate matter with aerodynamic diameter less than 2.5 µm) mass concentration reduction. Several recent literature reports also proved that visibility was less improved than PM2.5 mass concentrations. Results of Liu et al. (2020) demonstrated that increased aerosol extinction efficiency associated with nitrate was responsible for the less improved visibility in eastern China. Hu et al. (2021) raised the challenge of visibility improvement due to increased nitrate contribution in Beijing area. However, results of Xu et al. (2020) demonstrate that this situation was likely associated with both increased aerosol scattering efficiency and aerosol hygroscopicity and particularly pointed out that other than changes of inorganic aerosol components, special attention should be paid to scattering efficiency and hygroscopicity changes of secondary organic aerosol (SOA).
Organic aerosols including primary and secondary organic aerosols (POAs and SOAs) represent a large and sometimes even dominant fraction of submicron aerosol mass (Jimenez et al., 2009). In particular, SOA was found to contribute dominantly to total organic aerosol mass under polluted hazy conditions (Huang et al., 2014; Kuang et al., 2020b). Wang et al. (2019) reported increased contributions of both secondary organic and inorganic aerosol mass across China due to clean air actions, and the nonlinear responses of secondary aerosol mass concentration to emission reductions were further confirmed during the COVID lockdown period as reported by Huang et al. (2020). Xu et al. (2019) also reported substantial changes of SOA properties such as enhanced oxidation state. However, most previous studies only paid attention to influences of nitrate increase on visibility degradation, whereas synergistic effects of SOA on visibility have never been the focus due to the complexity of SOA hygroscopicity and scattering efficiency. Organic aerosol evolves in the atmosphere including their sizes and chemical structures and thus also their optical properties and hygroscopicity (Jimenez et al., 2009), leading to the difficulty of quantifying contributions of organic aerosol in visibility degradation. Li et al. (2022) reported that nitrate and SOA dominated particle extinction in dry state in Beijing due to clean air actions; however, evaluations in ambient air were lacking, further stressing the importance of comprehensive evaluations of SOA scattering abilities under ambient relative humidity (RH) conditions to better elucidate the roles of SOA in visibility degradation and long-term visibility changes.
In this study, we comprehensively quantified the dry-state mass scattering efficiencies (MSEs) of both primary and secondary organic aerosol components and organic aerosol hygroscopicity, thus systematically evaluating contributions of SOA factors to aerosol scattering and visibility degradation in ambient air.
2.1 Campaign information
Aerosol physical and chemical properties were simultaneously measured during winter from 13 December 2020 to 25 February 2021 in the Guangzhou urban area. Instruments were housed in an air-conditioned container in Haizhu wetland park (Sect. S1 in the Supplement for site information). A PM2.5 inlet (BGI, SCC 2.354) was used for aerosol sampling, and a sample flow of 8–9 L min−1 was maintained during the observation period, thus generally satisfying the flow requirement (8 L min−1) of 2.5 µm cutting diameter. A Nafion dryer was used to lower sample RH to less than 40 %. A humidified nephelometer system with a total flow of about 5 L min−1 and a quadrupole aerosol chemical speciation monitor (Q-ACSM) with a flow of 3 L min−1 were placed downstream of the dryer to measure aerosol scattering abilities under controlled RH conditions and aerosol chemical compositions. An AE33 aethalometer (Drinovec et al., 2015) set up with a flow rate of 5 L min−1 was separately operated under another inlet (PM2.5, BGI SCC 1.829) to measure aerosol absorptions and thus indirectly black carbon (BC) mass concentration. Measurements of meteorological parameters such as temperature, wind speed and direction, and RH were made by an automatic weather station.
2.2 Humidified nephelometer measurements
The humidified nephelometer system is a laboratory-assembled one, including two Aurora 3000 nephelometers, one measuring aerosol scattering abilities (aerosol scattering and back scattering coefficients at 450, 525 and 635 nm) under low RH conditions (mostly less than 30 %, dry nephelometer) and another one measuring aerosol scattering abilities under controlled RH conditions (wet nephelometer). The humidified nephelometer system can operate either in fixed-RH mode or in scanning-RH mode; details about techniques of fixed-RH mode and scanning-RH mode were introduced in detail in several previous studies (Kuang et al., 2017, 2020c). In this study, the humidified nephelometer system was operated in scanning-RH mode before 26 January 2021 and in fixed-RH mode (80 % RH) from 26 January to 9 February. The RH ranges of scanning-RH mode were 75 %–90 % from 11 December 2020 to 5 January 2021 and 60 %–90 % from 13 to 26 January 2021. The humidified nephelometer system provides direct measurements of the aerosol light scattering enhancement factor , where σsp(RH,λ) is the aerosol scattering coefficient of light wavelength λ at condition of RH (Titos et al., 2016; C. Zhao et al., 2019), and f(RH, 525) is referred directly to as f(RH) was usually used to derive the optical hygroscopicity parameter κsca through (Brock et al., 2016; Kuang et al., 2017, 2018, 2020c, 2021b; Xu et al., 2020). The nephelometer measurements are associated with truncation error and nonideality of the light source. The dry-state aerosol scattering coefficients were corrected using the empirical formula provided by Qiu et al. (2021). RH0 in the dry nephelometer was in the range of 6 %–49 % with an average of 22 %; thus dry-state aerosol scattering coefficient at 525 nm (σsp,525) was further corrected using measured aerosol optical hygroscopicity through .
2.3 Q-ACSM measurements and positive matrix factorization (PMF) analysis
The Q-ACSM was deployed to routinely characterize and measure the mass concentrations of nonrefractory submicron aerosol components at a time resolution of 15 min, including organics, sulfate, nitrate, ammonium and chloride; for details about the Q-ACSM setup, please refer to Ng et al. (2011). The mass concentrations and mass spectra were processed using ACSM data analysis software (ACSM Local 1.5.10.0 Released 6 July 2015) based on Igor Pro (version 6.37). The detailed procedures were described in Ng et al. (2011) and Sun et al. (2013). A composition-dependent CE value consistent with Middlebrook et al. (2012) and Sun et al. (2013) was chosen considering that aerosol samples were dried before entering the ACSM instrument. According to Middlebrook et al. (2012), CE = max (0.45, ANMF), where ANMF is the ammonium nitrate mass fraction in NR. The results showed that about 10 % of samples had CE values larger than 0.45, with the largest value of 0.65. The average CE value of the samples with a CE greater than 0.45 was 0.5. Relative ionization efficiencies (RIEs) of 5.15 and 0.7 from calibration results during the campaign using 300 nm pure ammonium nitrate (AN) and ammonium sulfate (AS) were used for ammonium and sulfate quantifications, while default RIEs of 1.4, 1.1 and 1.3 for organic aerosol, nitrate and chloride were adopted. A PMF technique with a multilinear engine (ME-2; Canonaco et al., 2013, 2021) was used for resolving potential organic aerosol (OA) factors related to different sources and processes. Four factors were deconvolved, including two primary OA factors and two oxygenated OA factors, which were usually treated as SOA: a hydrocarbon-like OA (HOA; ), a cooking-like OA (COA; ), a less oxidized oxygenated OA (LOOA; ) and a more oxidized oxygenated OA (MOOA; ). The mass spectra of these factors (Fig. S9 in the Supplement) and more details about the factor analysis can be found in Sect. S2.
2.4 Organic aerosol hygroscopicity derivation
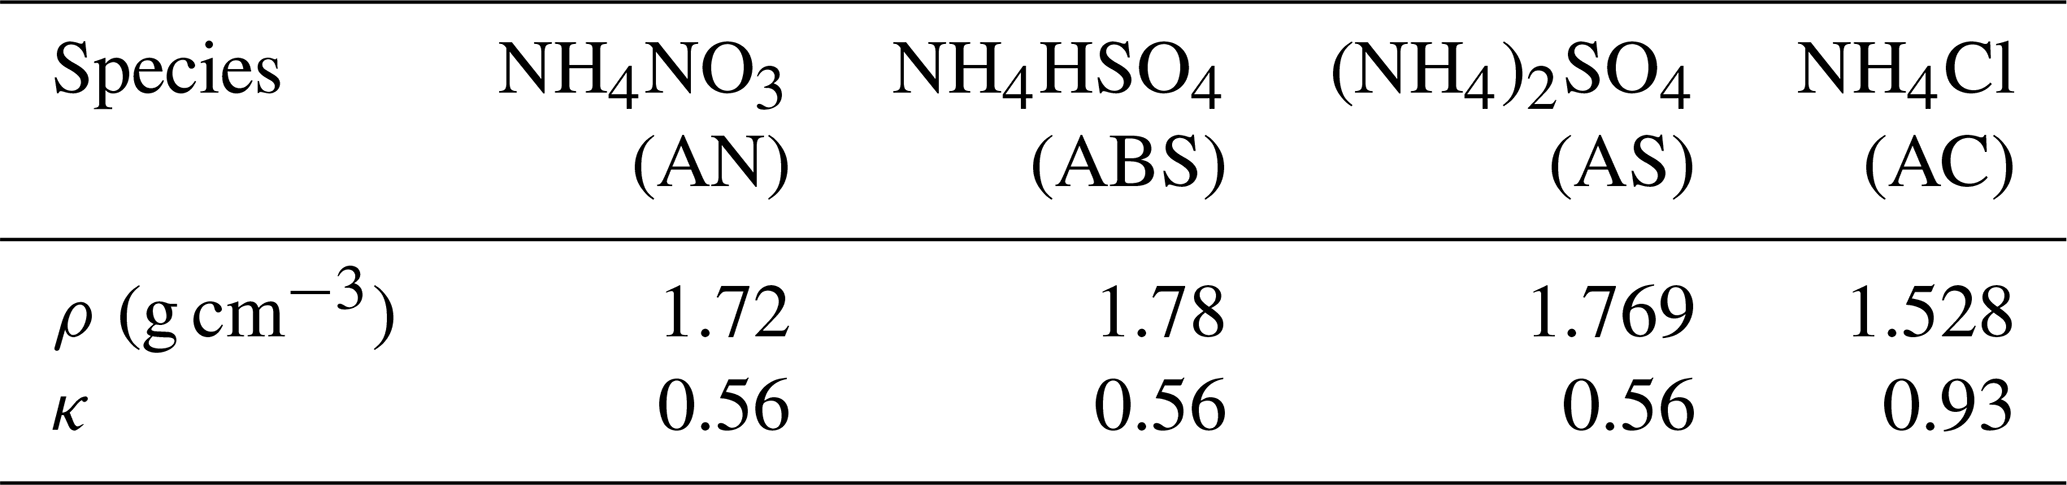
Organic aerosol was usually treated as nearly hydrophobic in many previous studies when considering environmental effects of organic aerosol (Cheng et al., 2016); however it is quantified in this study based on the most recently developed organic aerosol hygroscopicity quantification method by Kuang et al. (2020a). On the basis of field measurements, the organic aerosol hygroscopicity parameter κ (κOA) can only be estimated through closure between directly measured overall aerosol hygroscopicity and aerosol chemical compositions using the volume mixing rule (Kuang et al., 2020d). Kuang et al. (2020c) developed an optical method to calculate κOA based on the combination of the humidified nephelometer system measurements and bulk PM1 aerosol chemical-composition measurements, and the application of this method was further manifested and discussed in Kuang et al. (2021b) and thus used in this study to estimate κOA. The humidified nephelometer system provides direct measurements of the optical hygroscopicity parameter κsca and aerosol scattering Ångström exponent, which can be used together to derive a κ value referred to as κf(RH) (Kuang et al., 2017), which can be treated as the overall aerosol hygroscopicity parameter in the hygroscopicity closure (Kuang et al., 2021a). In the closure, ions were paired using the scheme proposed by Gysel et al. (2007) as listed in Table S1 in the Supplement. The same as in Kuang et al. (2021b), retrieved κf(RH) at RH of 80 % was used as measured average κ of PM1 aerosol populations, κ values of ammonium sulfate (AS) and ammonium nitrate (AN) at 80 % RH were predicted using the Extended Aerosol Inorganic Model (E-AIM) and those of ammonium chloride (AC) and ammonium bisulfate (ABS) were consistent with Liu et al. (2014). Then, the κOA can be estimated using the following formula by assuming volume additivity and zero κ of BC:
where ε represents the volume fraction whose calculation needs total aerosol volume concentrations, and the subscript represents name of an aerosol component. The total PM1 aerosol volume concentration was calculated using measurements of the dry nephelometer following the machine learning method proposed by Kuang et al. (2018). Organic aerosol density varies over a wide range, and previous studies demonstrate that it is tightly associated with aerosol oxidation state (Kuwata et al., 2012) and that a higher ratio usually corresponds to higher aerosol density. Following Wu et al. (2016), densities of primary organic aerosol (POA) components including HOA and COA were assumed to be 1 g cm−3, and density of MOOA was assumed to be 1.4 g cm−3 due to its highly oxygenated feature with of 1.17; however, the density of LOOA was assumed to be 1.2 g cm−3 due to its moderate value of 0.7. In addition, the difference between predicted volume concentration from nephelometer measurements and the total aerosol volume concentrations summed from known aerosol components was attributed to aerosol components unidentified by the mass spectrometer; thus its volume fraction and hygroscopicity were named εX and κX in Eq. (1), where κX was assumed to be 0.05 since the unidentified parts are usually metals and dust with low aerosol hygroscopicity. For more comprehensive discussions on κOA estimations as well as κX treatment, please refer to Kuang et al. (2021b).
Table 1Densities (ρ) and hygroscopicity parameters (κ) of inorganic salts.
Using the ZSR (Zdanovskii, Stokes and Robinson) mixing rule, the κOA derived at RH of 80 % can be further expressed as
where ε represents volume fractions of primary and secondary organic aerosol components in total organic aerosols. Assuming κ values of HOA and COA as zero, Eq. (2) can be simplified as . Considering the noisy characteristics of derived κOA as shown in Fig. 4a, this simplified formula was not directly used to fit all derived κOA values. Instead, average diurnal variations of derived κOA were firstly acquired and then fitted using with average diurnal volume fractions of MOOA and LOOA (εMOOA and εLOOA) in total organic aerosol as inputs, which yields average κMOOA and κLOOA.

Figure 1Time series of (a) RH; (b) aerosol scattering coefficient in dry state, and NR concentration; (c) secondary inorganic aerosols (SIAs), including sulfate and nitrate, and organic aerosol in right axis; (d) MOOA and LOOA; (e) HOA and COA; and (f) wind speed and wind direction. Gray shaded areas are three identified pollution episodes, and the pink shaded area is the period of the spring festival.
3.1 Overview of the pollution characteristics during winter in Guangzhou
The time series of corrected aerosol scattering coefficients in dry state (σsp,525), nonrefractory PM1 (NR) mass concentrations and resolved organic aerosol factors, as well as meteorological parameters, are shown in Fig. 1. The scattering coefficient at 525 nm of aerosols in dry state (σsp,525) varied over a wide range of 8 to 688 Mm−1, with an average of 118 Mm−1. The average NR is 20 µg m−3, with the highest NR mass concentrations reaching beyond 160 µg m−3. This suggests relatively clean conditions compared to aerosol pollution in other polluted regions in China (Zhou et al., 2020); however, severe pollution episodes occurred occasionally. Three haze pollution episodes characterized by relatively high aerosol mass loading and scattering coefficients were observed before February (gray shaded areas in Fig. 1). The evolution and formation of these three episodes were tightly associated with the stagnant meteorological conditions, as indicated by the low wind speed (<2 m s−1) and increasing RH during the last two severe pollution episodes. As shown in Fig. 1c, organic aerosol and nitrate contributed dominantly to the increase of aerosol mass, while sulfate remained almost flat or increased slightly during these pollution episodes. For example, for the episode in which the worst pollution conditions occurred, the daily average NR increased from 19 to 143 µg m−3 from 12 to 16 February, with the organic aerosol increasing from 9.3 to 69.8 µg m−3 and nitrate increasing from 5.5 to 44.2 µg m−3; however, sulfate only increased from 1.4 to 8.5 µg m−3. This phenomenon is quite different from the results reported by Guo et al. (2020) and W. Chen et al. (2021) that organic aerosol dominated the aerosol mass increase with a significant increase of both sulfate and nitrate in pollution episodes in autumn of Guangzhou urban area; however, it is generally consistent with the increasing characteristics reported by C. Chen et al. (2021). These observations suggest that the aerosol pollution differs much among seasons and years due to the highly variable characteristics of meteorological conditions. As for the organic aerosol mass increase, the time series of resolved organic aerosol factors are also shown in Fig. 1d and e. For the three observed pollution episodes, both increases of primary and secondary organic aerosol (represented by summation of MOOA and LOOA) were observed, with LOOA contributing dominantly to SOA increase and HOA contributing dominantly to POA increase. However, the accumulation of POA (summation of HOA and COA) contributed almost twice as much as the increase of SOA, suggesting that primary emissions, especially vehicle emissions, played significant roles in aerosol mass increase during pollution episodes of winter in Guangzhou.
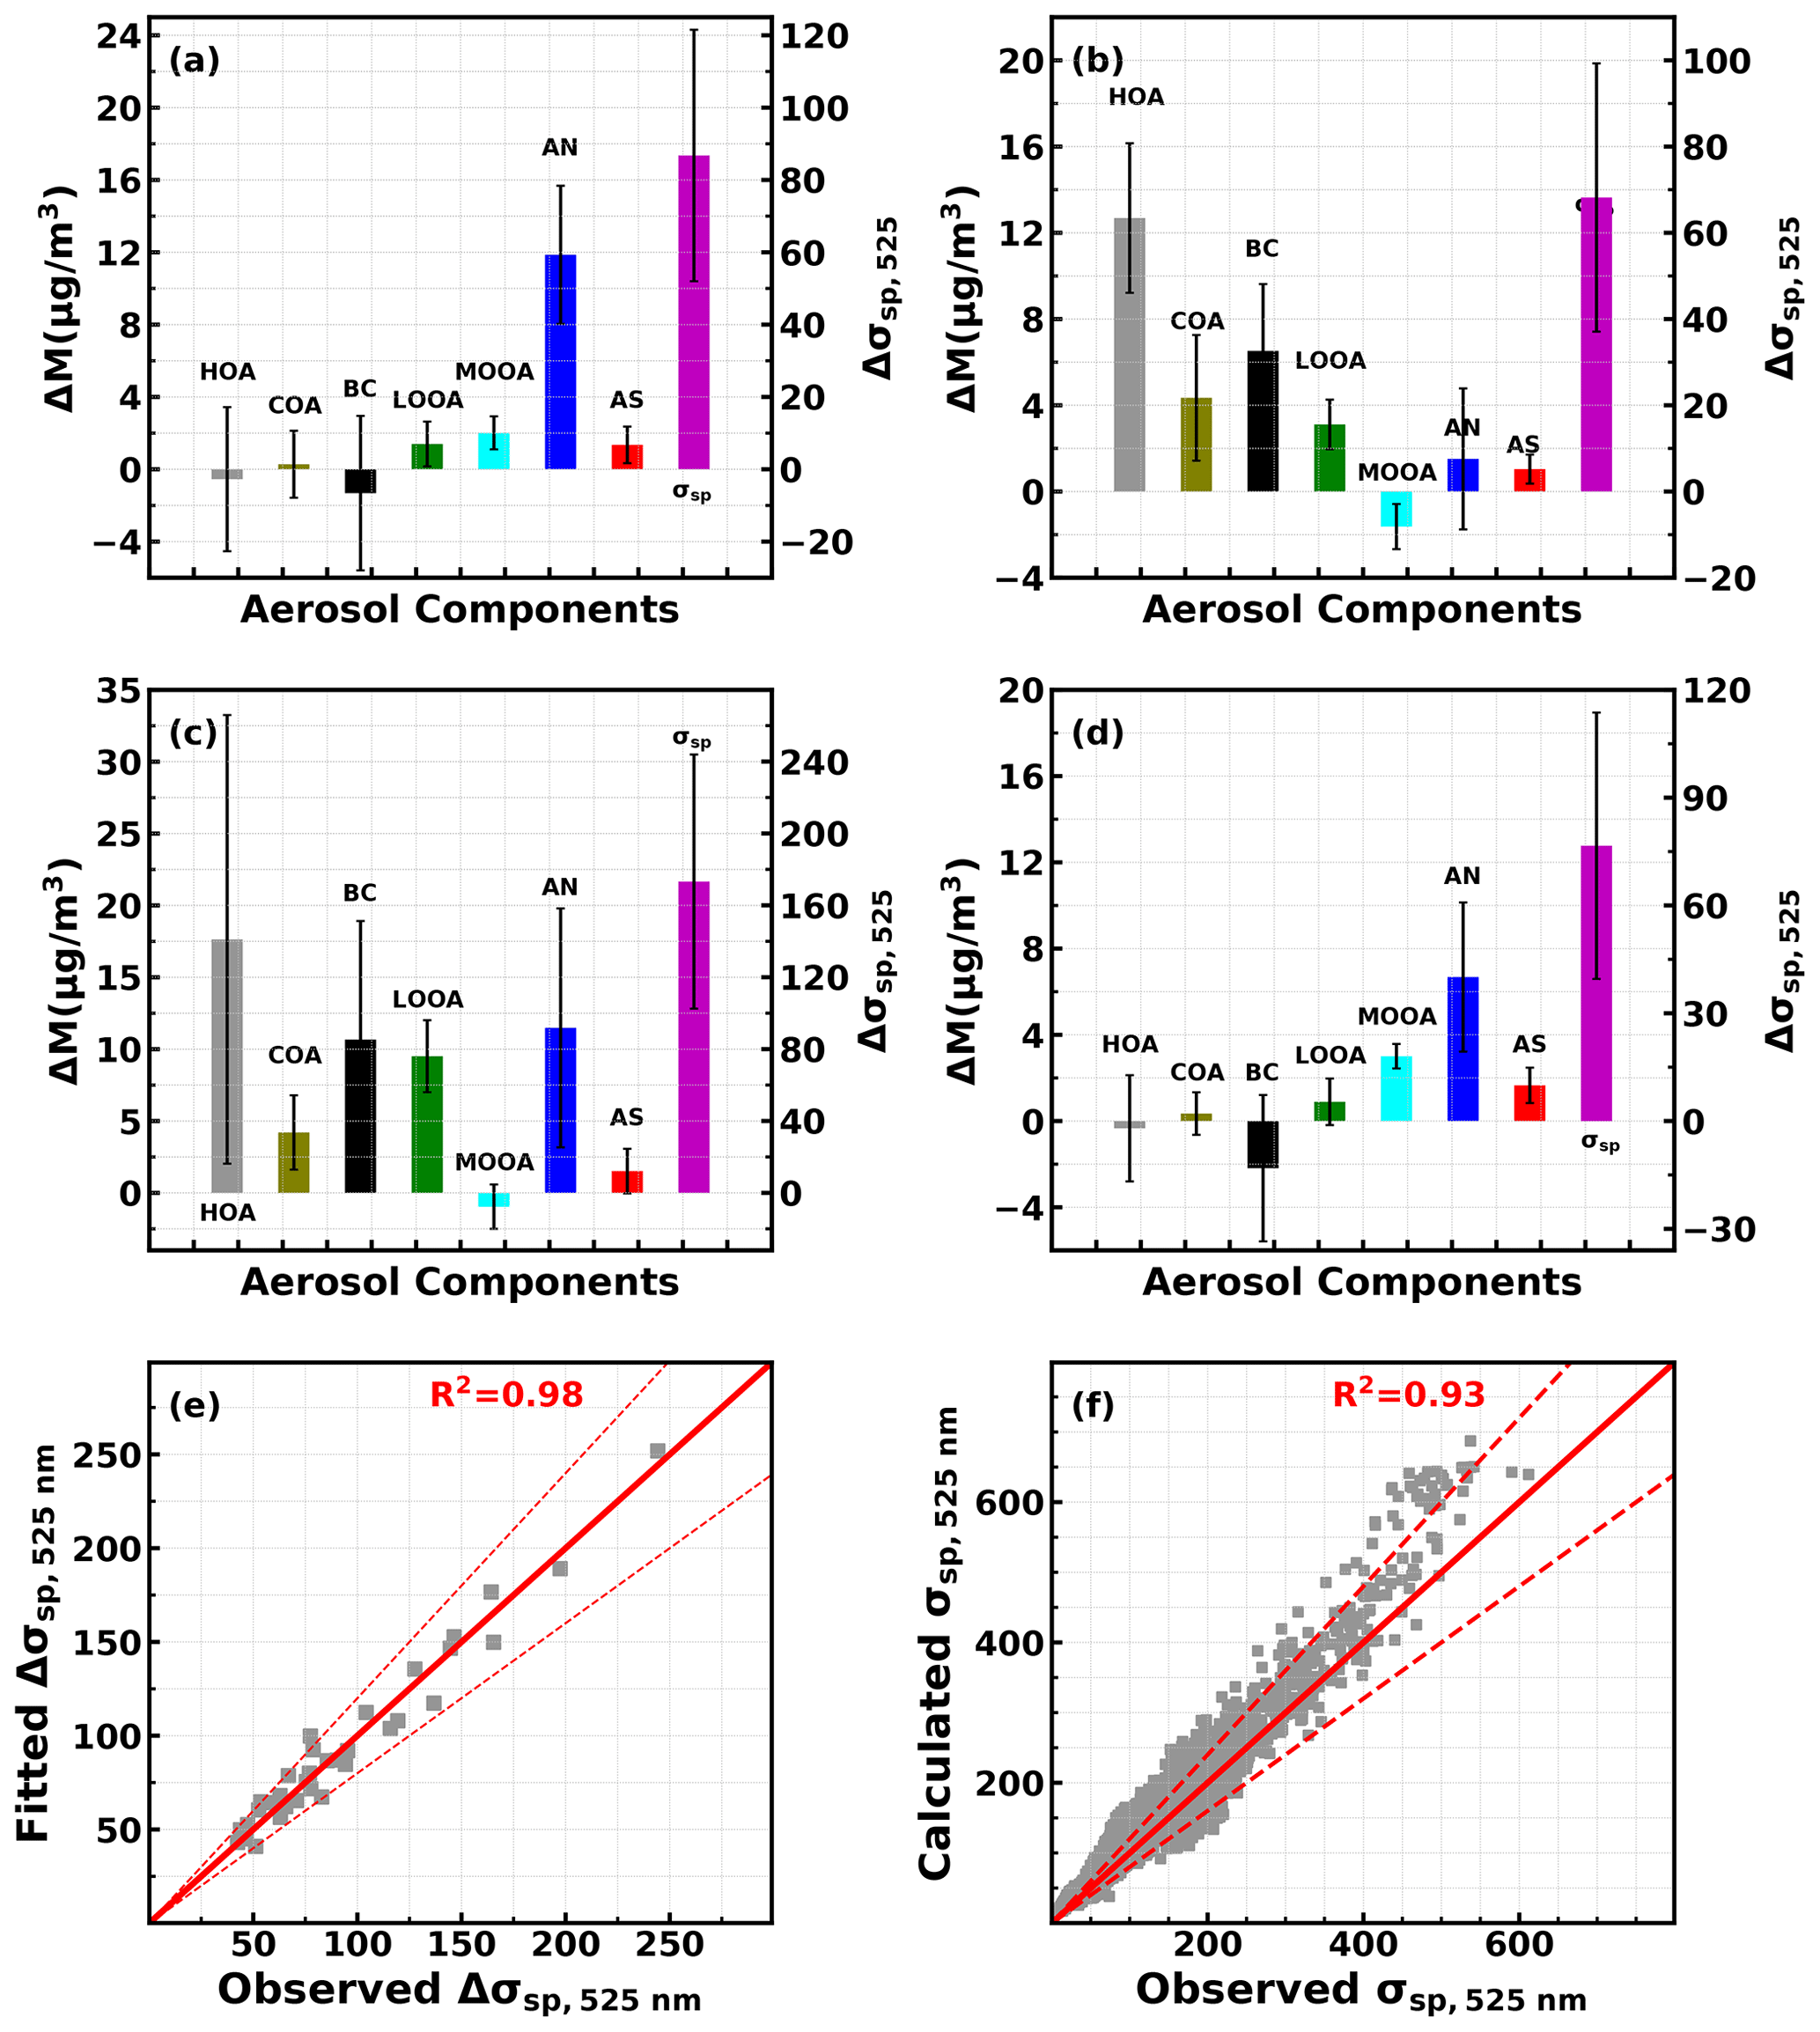
Figure 2Average changes of aerosol components and σsp,525 (right axis) for identified increase cases of (a) nitrate,; (b) HOA, (c) LOOA and (d) MOOA. Black error bars represent standard deviations. (e) Comparisons between observed σsp,525 changes for identified cases and multiple linear fitted values. (f) The comparison between observed σsp,525 and calculated σsp,525 using retrieved MSEs of aerosol components. Dashed red lines represent 20 % deviation lines.
3.2 Strong scattering ability of MOOA in dry state
Traditional multiple linear regression models were usually applied to determine MSEs of different aerosol components using simultaneously measured aerosol scattering coefficients and mass concentrations of aerosol components (Hand and Malm, 2007; Han et al., 2015; Chan et al., 1999). However, the traditional model failed in this study due to co-variations of input variables and impactor inconsistencies (PM2.5 versus PM1) between aerosol chemical compositions and aerosol scattering measurements. Details about this failure are discussed in Sect. S4. A new methodology was proposed to lower correlations between variables and reduce the impacts of measurement inconsistency of aerosol populations between the nephelometer and the mass spectrometer. This method mainly considers the responses of the aerosol scattering coefficient to quick mass concentration increases of aerosol components. Using AN as an example, cases of significant increases of AN were identified, and average changes of aerosol components as well as σsp,525 for these cases are shown in Fig. 2a. On average, AN dominated the aerosol mass increase (>90 %) in these cases; however, changes of other aerosol components differed much among cases, as indicated by large standard deviations. The MSEAN can be roughly estimated as around 7 m2 g−1 if assuming σsp,525 was solely contributed by AN increase. As shown in Fig. 1d and e, prominent increases of HOA, COA and LOOA were frequently observed. Average changes of aerosol components and σsp,525 for identified cases of HOA increase or COA increase are shown in Fig. 2b. This shows that increases of HOA or COA were usually accompanied by significant increases of BC and LOOA; thus the impacts of HOA or COA increases on observed aerosol scattering increases cannot be isolated. Similar results were obtained with LOOA and MOOA. As shown in Fig. 1, remarkable increases of LOOA cases were almost always accompanied by the spontaneously quick HOA increase because most LOOA rapid increase cases happened during pollution episodes and start near dusk when accumulation of vehicle emissions and nitrate formation occurred. Thus, the average increase of LOOA was even smaller than that of AN and HOA. Cases of slight but significant MOOA increase were also identified, and average results are also shown in Fig. 2d, showing that MOOA increases were usually accompanied by significant nitrate formation. These results demonstrate that MSEs of aerosol components cannot be quantified directly from responses of aerosol scattering to aerosol emission or formation processes. However, for these cases, mass increases of aerosol components and corresponding changes in aerosol scattering matter most, and impacts of unidentified aerosol components are reduced substantially through differentially considering that the average time change for these identified cases is only 4 h. In addition, as listed in Table S3, the correlations between changes of most variables for all identified cases are much smaller than their time series correlations shown in Table S1. Thus, the modified multiple linear regression model was applied to retrieve MSEs of aerosol components. The derived MSEs for HOA, COA, LOOA, MOOA, AN, AS and BC were 2.1, 3.9, 3.4, 9.9, 7.1, 5.5 and 3.3 m2 g−1, respectively. The fitted Δσsp,525 correlated highly (R2=0.98, average ratio 1.0) with observed Δσsp,525 as shown in Fig. 2e. Derived MSEs were used to calculate σsp,525 during the whole observation period using the formula and compared with observed σsp,525. Good consistency (R2=0.93 and average ratio of 1.05; Fig. 2f) was achieved between calculated and observed σsp,525 values. In addition, the retrieved MSEAN (7.1) using the modified multilinear regression model was quite consistent with the estimated one (7 m2 g−1) based on average changes shown in Fig. 2a, which indirectly confirms the reliability of the modified method.

Figure 3(a) AN mass size distributions derived by Tao et al. (2019) based on size-resolved filter measurements, Da is the aerodynamic diameter. (b) Simulated aerosol volume scattering efficiency (VSE) under different volume size distributions through varying volume geometric mean Dgv and standard deviation σgv of lognormal size distributions. The blue shaded area corresponds to PM1, and the pink shaded area corresponds to PM1−2.1.
Tao et al. (2019) quantified MSEs of fine-mode AS and AN as well as elemental carbon (EC) using size-resolved filter measurements in four seasons of the Guangzhou urban area. Their results demonstrate that MSEs of AN and AS bear relatively large standard deviations and variations among seasons; however, the MSE of EC varied little among seasons with small standard deviations (2.6±0.1 m2 g−1). The derived MSEBC of 3.3 m2 g−1 was close to the MSEEC reported in Tao et al. (2019). The derived MSEAN and MSEAS were significantly higher than those reported in previous studies in which MSEAN and MSEAS were estimated through Mie theory of size-resolved filter measurements (Tao et al., 2019; Chen et al., 2020). For example, Tao et al. (2019) reported MSEs of 4.4±1.3 m2 g−1 for AN and 4.3±0.9 m2 g−1 for AS in winter of urban Guangzhou for fine-mode aerosols (<2.1 µm). The reason explaining this inconsistency is that the derived MSEAN using the multiple regression method here is ; however, MSEAN derived for example in Tao et al. (2019) in the fine mode is . The , and values of 4.4, 5.3 and 7.5 m2 g−1 are simulated using the reported average AN mass size distributions reconstructed from size-resolved filter measurements in winter of urban Guangzhou by Tao et al. (2019) (as shown in Fig. 3a) as inputs of the Mie model. The simulated of 7.5 is very close to the retrieved and is much higher than simulated due to substantial mass contributions of 1 to 2.1 µm as shown in Fig. 3a, demonstrating that good consistency between results of the multiple regression model and results of Tao et al. (2019) was achieved.
If using the simulated ratio to approximate , and , values of 5.0, 3.9 and 6.9 m2 g−1 for , and would be obtained, which fall in the reported ranges of MSEAS and MSEAN (Tao et al., 2019); however, the high needs further investigation. MSE is determined by the aerosol volume scattering efficiency (VSE) defined as aerosol scattering per unit aerosol volume and aerosol density (ρa) with . High of 9.9 m2 g−1 was retrieved; however, most of the difference between and might be explained by their density differences. Based on the Mie theory, aerosol scattering is in general proportional to aerosol volume (Kuang et al., 2018); thus the volume size distribution is a determining factor in VSE variations. The VSE of PM1 under different unimodal volume lognormal distribution conditions with a refractive index of 1.53–10−7i was simulated and is shown in Fig. 3b. The approximated and of 5.0 and 6.9 m2 g−1 corresponds to and of 8.6 and 9.7 m2 µm−3 according to the aerosol densities discussed in Sect. 2.4, falling within the VSE ranges of geometric mean diameter (Dgv) near 500 nm and geometric standard deviation (σgv) of 1.3 to 1.5. This result is consistent with conclusions of several previous studies that the MOOA with the highest oxygen state that has experienced complex chemical aging such as aqueous-phase reactions likely shares a similar shape of mass and volume size distribution with inorganic secondary aerosols (Kuang et al., 2020b; Wang et al., 2021), and this result rationalizes using the ratio to derive and . In addition, the aerosol refractive index also played a significant role in aerosol VSE variations (G. Zhao et al., 2019; Liu et al., 2013), and the high MSE of MOOA might also be related with the high real part of its refractive index. Laboratory results of Li et al. (2017) revealed enhanced light scattering of SOA formed through multiphase reactions due to an increase of the real part of the refractive index. Zhao et al. (2021) reported that the real part of the aerosol refractive index varied over a wide range (1.36 to 1.78) and in general increased with the mass fraction increase of organic aerosol, suggesting a generally higher real part of the refractive index of organic aerosol. In general, these results revealed strong scattering abilities of MOOA under dry state; however the size distribution and refractive index of MOOA need further comprehensive investigations.
Moreover, effective densities of HOA, COA and LOOA are near 1 g cm−3, suggesting that VSEs of HOA, COA and LOOA are around or slightly higher than their corresponding MSEs. As shown in Fig. 3b, m2 µm−3 means that Dgv was generally lower than 250 nm; thus more than 99 % of aerosol mass resided in PM1 under σgv<1.8. Therefore, derived MSEs of HOA, COA and LOOA can be treated as their corresponding values. Cai et al. (2020) reported average HOA and COA volume size distributions in urban Beijing using PMF techniques. They found (Fig. 7 in Cai et al., 2020) that HOA volume peaked near 200 nm, and COA volume size distribution showed bimodal characteristics, with the first mode peaking near 90 nm and the second mode peaking near 350 nm, yielding MSEs that share similar magnitude with the retrieved MSEs of HOA and COA. These results further confirmed the reliability of the newly proposed multiple regression method.
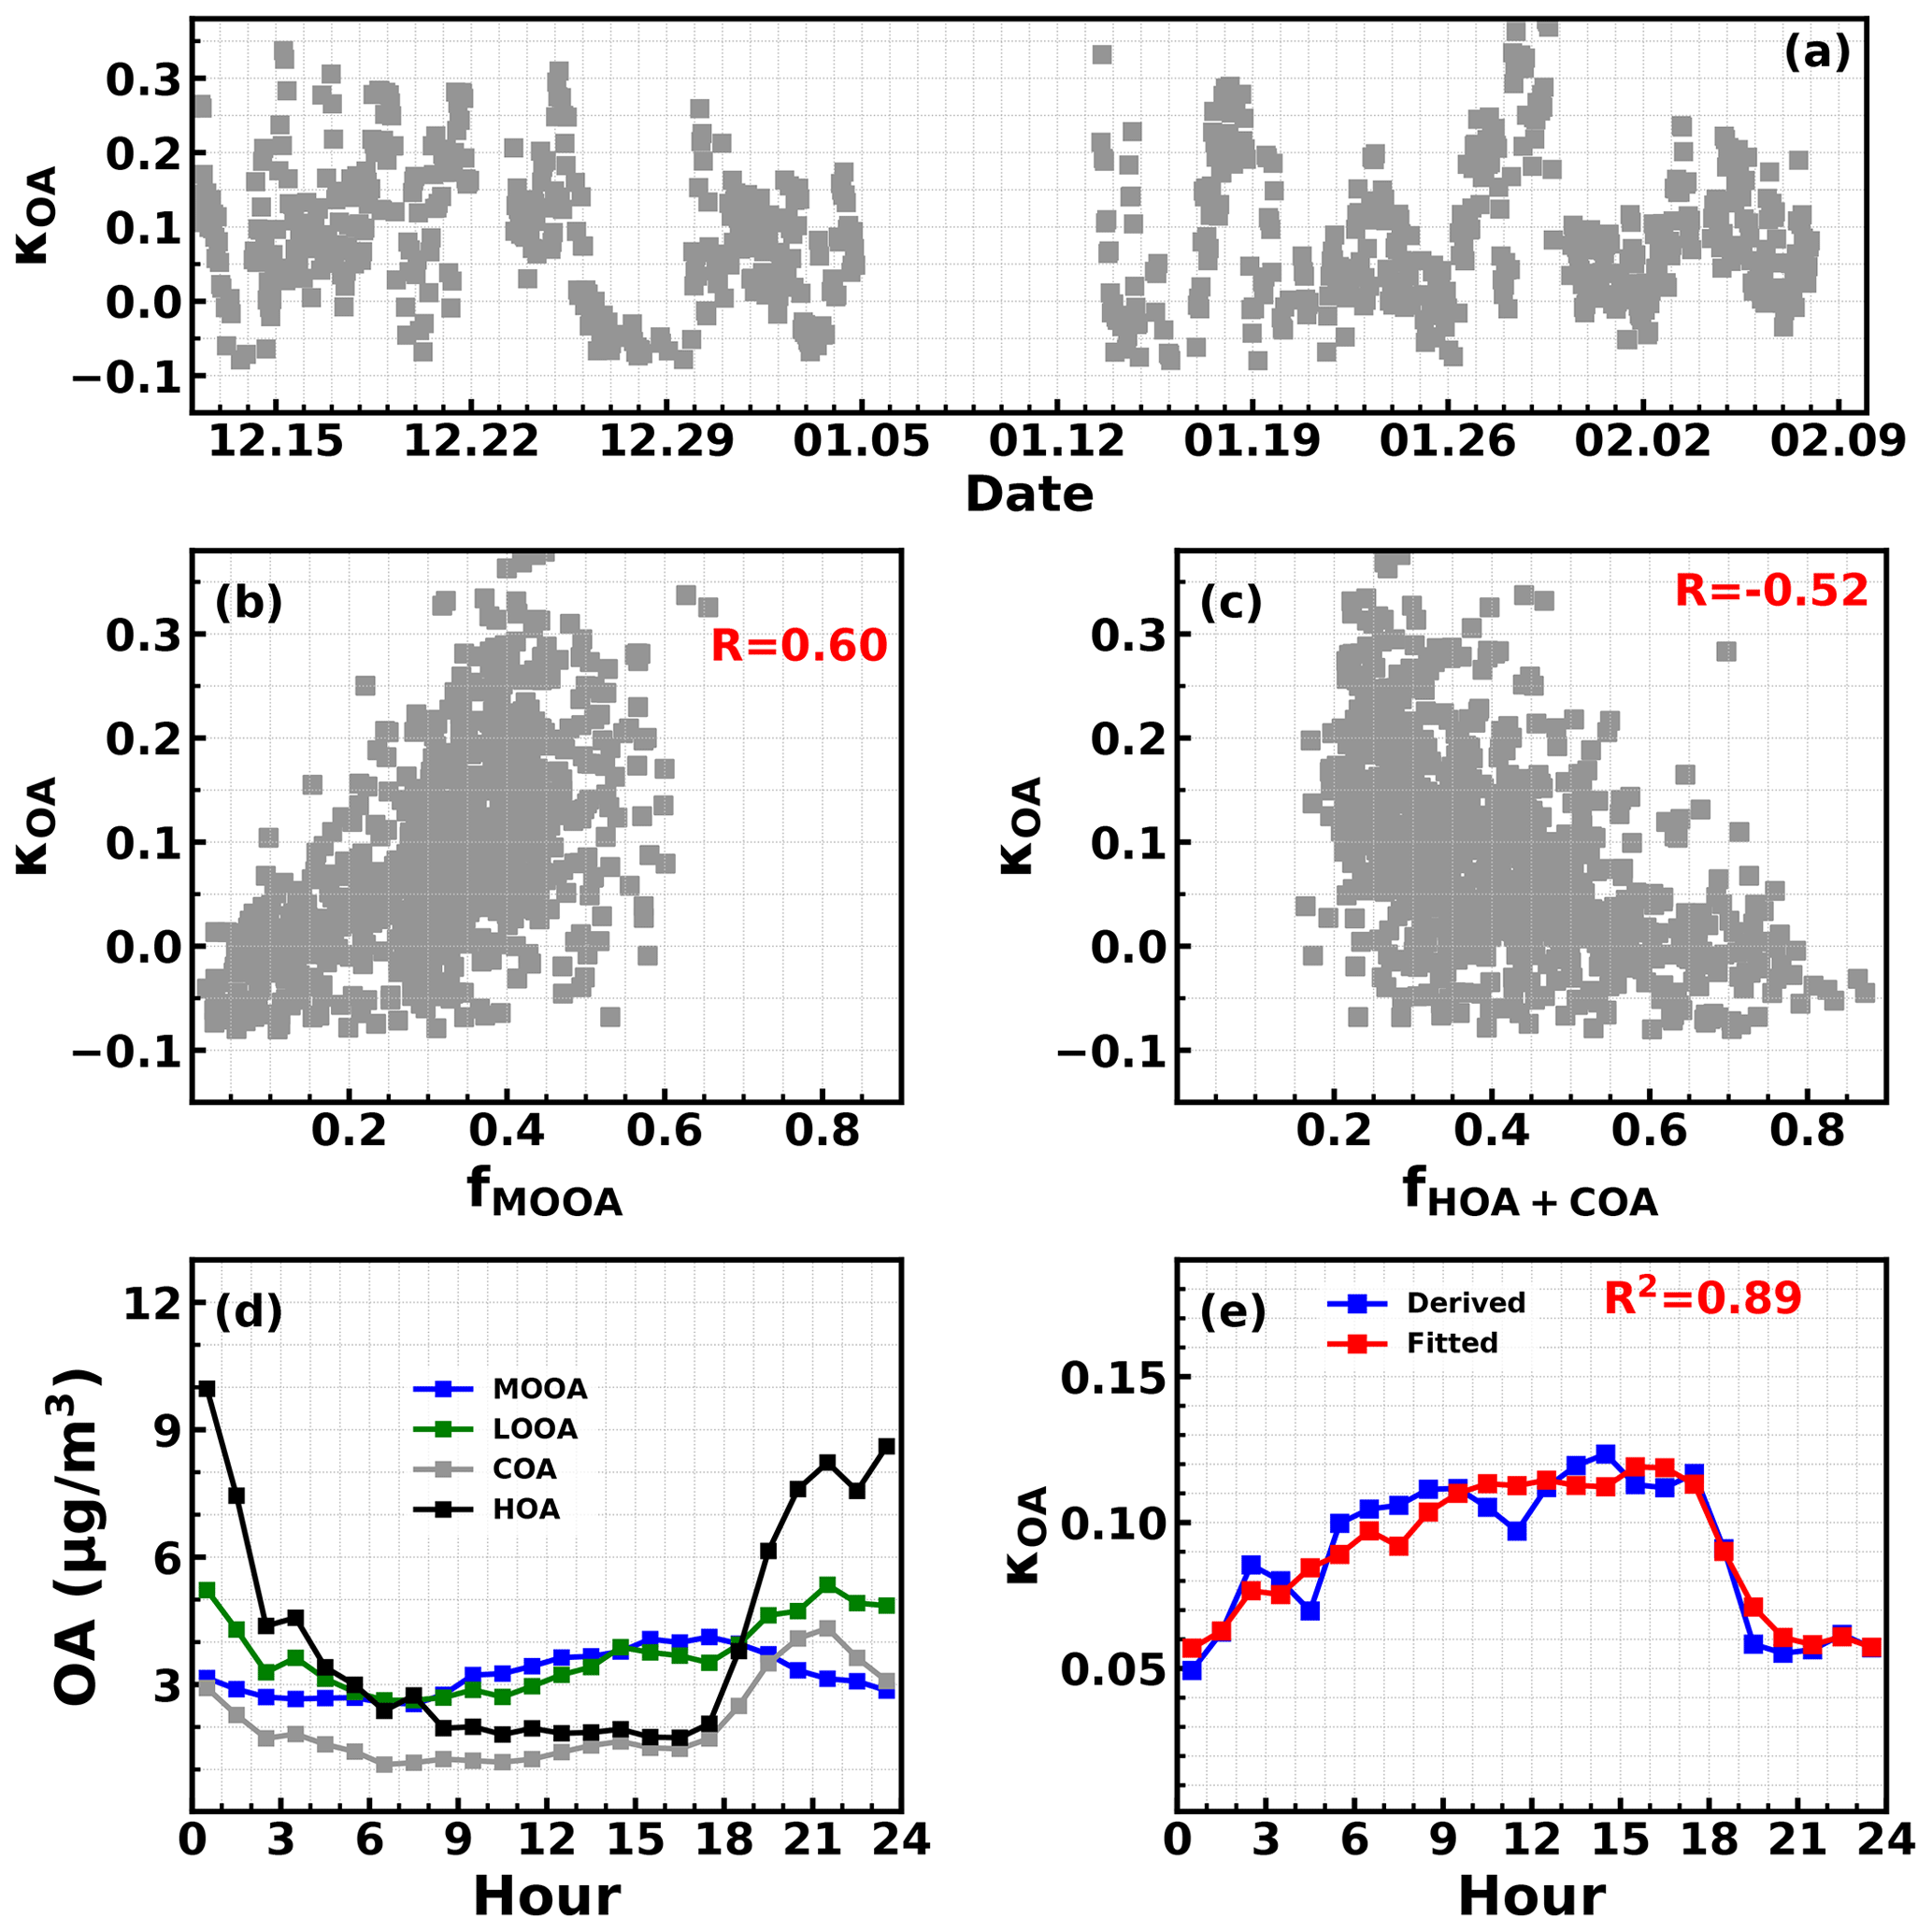
Figure 4Time series of derived κOA (a). Correlations between derived κOA and mass fractions of MOOA (b) and HOA+COA (c) in total organic aerosols. (d) Average diurnal variations of derived κOA (blue) and corresponding fitted ones. (e) Average diurnal variations of resolved mass concentrations of organic aerosol factors.
3.3 Water uptake abilities of organic aerosols
The time series of derived κOA is shown in Fig. 4a, where the estimated κOA ranged from −0.08 to near 0.35 with an average of 0.09, which is generally consistent with the values reported in other regions (Kuang et al., 2020d). It was found that variations of derived κOA correlated tightly with mass fractions of MOOA (R=0.6) and POA (), as shown in Fig. 4b and c. The MOOA enhanced the overall κOA, and POA lowered κOA, which is consistent with conclusions of previous studies; however, no correlations were found between κOA and mass fractions of LOOA (R=0.06). As shown in Fig. 4d and e, a drastic increase of POA before dusk would bring a drastic decrease of κOA to around 0.05, which are in accordance with reported results in previous literature that most POA components are hydrophobic with a κ value of almost zero. As introduced in Sect. 2.4, the average diurnal variations of volume fractions of MOOA and LOOA were used as variables to fit average diurnal variations of derived κOA shown in Fig. 4e to retrieve κMOOA and κLOOA. The fitted results are shown in Fig. 4e (R2=0.89, average ratio of 1), yielding κMOOA and κLOOA values of 0.23 and 0.13. The relatively lower value of κLOOA and the phenomenon of sometimes co-increasing LOOA and POA during the dusk period (as shown in Figs. 1 and 3d) explain the weak correlations between κOA and LOOA mass fraction. Most previous field-based organic aerosol hygroscopicity studies focused only on the overall κOA characterization of entire organic aerosol population and were rarely specific to secondary organic aerosol factors (Kuang et al., 2020d). Considering the estimated ratios of 1.17 and 0.7 for MOOA and LOOA, the retrieved κLOOA and κMOOA values are consistent with previous findings that organic aerosol oxidation state impacts significantly on organic aerosol hygroscopicity and usually higher hygroscopicity of more oxygenated organic aerosol (Kuang et al., 2020d). In particular, Lambe et al. (2011) investigated the relationships between organic aerosol hygroscopicity of laboratory-generated SOA of varying kinds of volatile organic compounds using cloud condensation nuclei activity measurements and reported a linear relationship of , yielding κOA values of 0.24 and 0.16 for of 1.17 and 0.7, which is slight higher but generally consistent with retrieved ones of this study. Overall, the retrieved κLOOA and κMOOA are further verified indirectly through comparison with previous literature results, confirming the strongest water uptake abilities of MOOA among OA factors.
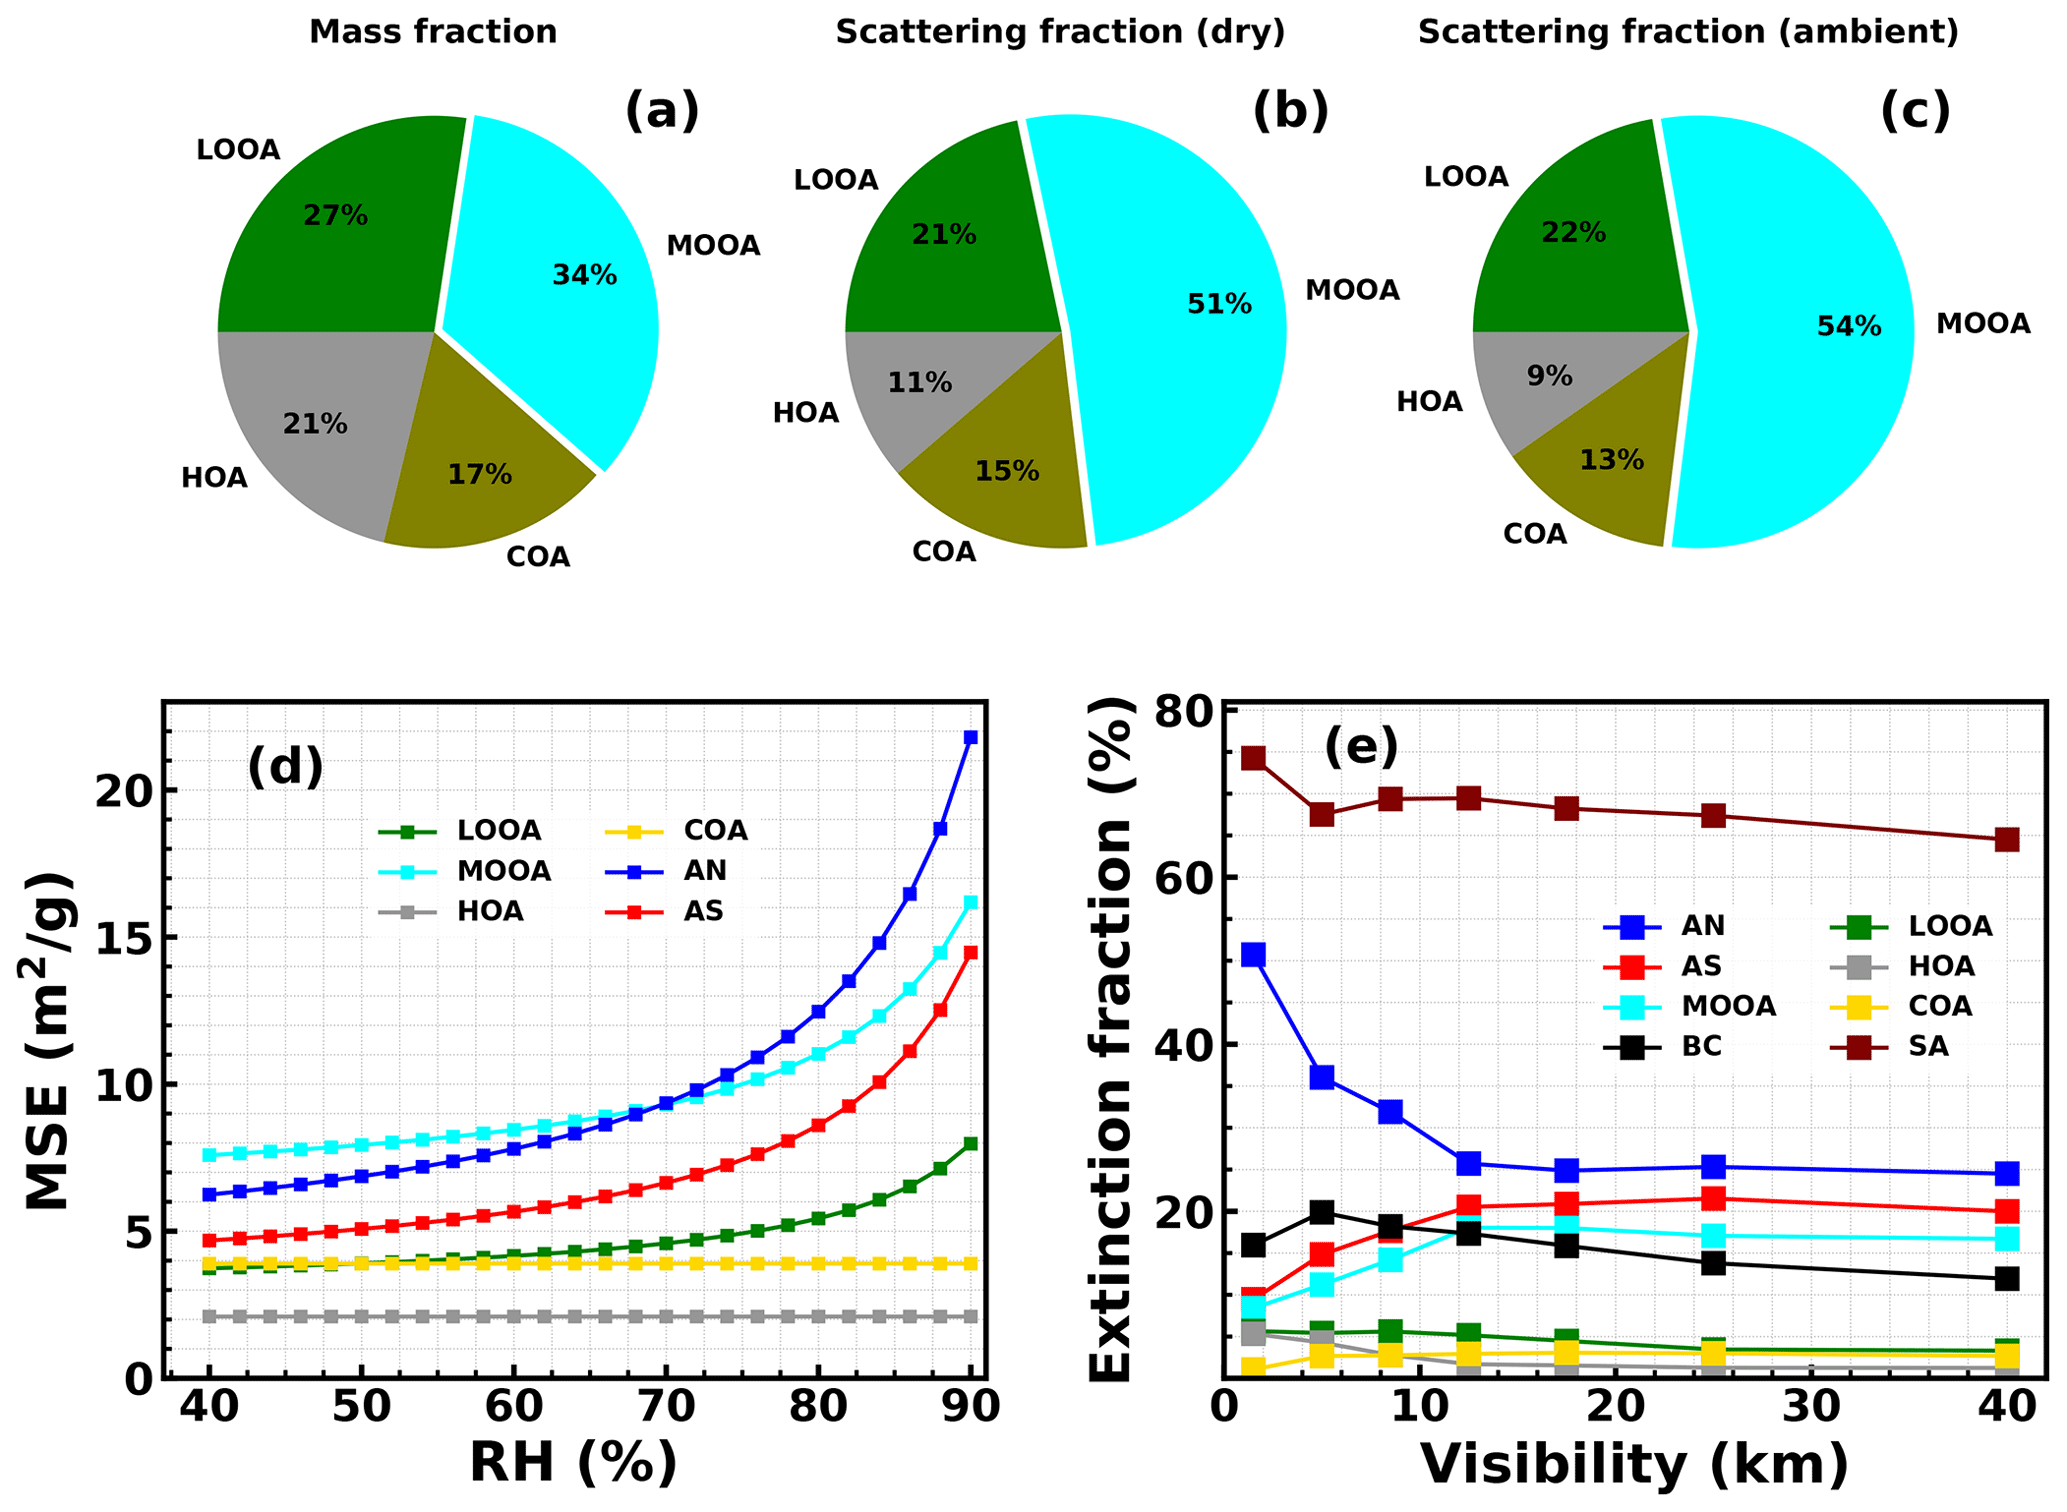
Figure 5(a) Average mass fractions of organic aerosol components in total organic aerosol. Contributions of different organic aerosol components to total organic aerosol scattering coefficients under dry (b) and ambient (c) conditions for PM1. (d) MSEs of aerosol components under different RH conditions. (e) Contributions of different aerosol components to visibility degradation under different visibility conditions. SA corresponds to summation of secondary aerosol components.
3.4 Dominant contribution of MOOA to organic aerosol scattering ability
High scattering efficiency and water uptake abilities of MOOA resulted in the strongest light scattering abilities of MOOA among all organic aerosol factors. As shown in Fig. 5a and b, on average, a 34 % mass contribution of MOOA to entire PM1 organic aerosol populations, however, contributed 51 % of organic aerosol scattering in dry state. The dominant role of MOOA in organic aerosol scattering would be further enhanced under ambient RH conditions due to the highest water uptake abilities of MOOA among organic aerosol factors. Results of Kuang et al. (2017) demonstrate that the hygroscopicity parameter κ can be directly linked to the optical hygroscopicity parameter κsca through and thus aerosol light scattering enhancement factor f(RH). Particle number size distributions plays the most important role in Rsca variations, with κ playing the smaller role. Yu et al. (2018) investigated Rsca variations from measurements of several field campaigns and found that Rsca varied within the range of 0.55 to 0.8 with an average of 0.66 and parameterized Rsca with scattering Ångström exponent. Here, the relationship between VSE and Rsca was further simulated using Mie theory through varying the volume geometric mean Dgv of lognormal size distributions from 100 to 700 nm considering that aerosol size distributions also play the dominant role in VSE variations. Simulated results are shown in Fig. S11, demonstrating that Rsca decreased almost linearly with the increase of VSE for VSEm2 µm−3; however, it varied complexly with VSE for VSEm2 µm−3. According to estimated MSE values of LOOA, MOOA, AS and AN in Sect. 4.2 and their densities introduced in Sect. 2.4. VSE values of LOOA, MOOA, AS and AN are 4.08, 9.6, 6.9 and 8.7 m2 µm−3, respectively. Accordingly, the Rsca,LOOA was estimated as 0.87, and 0.63 as an average estimate was used for Rsca,MOOA, Rsca,AS and Rsca,AN. MSEs of LOOA, MOOA, AS and AN with their water uptake abilities considered under different RH conditions can thus be estimated using .
The problem remains as to whether a continuous increase of MSE as a function of ambient RH increase can be applied because aerosol phase states are also crucial in determining the responses of aerosol scattering to RH increases (Kuang et al., 2016). Many factors such as ambient RH (Liu et al., 2017b, 2016) and the RH history that aerosol particles have experienced (Kuang et al., 2016) and the deliquescent and crystalline properties determined by aerosol chemical compositions and mixing states are important in determining aerosol phase state (Li et al., 2021). The ambient RH ranged from 20 to 94, with an average of 57 %, with the histogram of ambient RH also shown in Fig. S12. Results of Liu et al. (2017b) found a transition from a semisolid to a liquid state at RH of about 60 %, suggesting ambient aerosol particle might exist as semisolid or solid phase at low RH conditions. The phase state of ambient aerosols depends not only on ambient RH, but also on the RH history that aerosols have experienced (Kuang et al., 2016). For instance, aerosols under ambient RH of 40 % in the afternoon would remain liquid if their crystalline RH is lower than 40 % and they had experienced high RH conditions (such as >80 %) during the morning. Therefore, the lowest RH that aerosols have experienced in the afternoon and highest RH they have experienced in the morning are crucial for their phase state for hydrophilic aerosols. In addition, the deliquescent RH and crystalline RH are another two crucial parameters; however, they are quite complex for ambient multicomponent aerosols (Kuang et al., 2016; Li et al., 2021). Scanning RH of 60 %–90 % was set up for the humidified nephelometer system from 13 to 26 January, and a continuous increase of the aerosol light scattering enhancement factor was always observed (Fig. S13), with the RH in the dry nephelometer always lower than 35 % (Fig. 1a), suggesting that aerosols were either not crystalized under RH of <35 % or were deliquesced under RH of <60 %. The lines of 35 % and 60 % are plotted in Fig. 1a, and most days (>85 %) either had its lowest RH >35 % or its highest RH >60 %, suggesting a liquid state most of the time for internally mixed ambient secondary aerosols and a continuous increase of aerosol light scattering as ambient RH changes.
Therefore, continuous increases of MSEs of LOOA, MOOA, AN and AS as a function of RH were considered, and results are shown in Fig. 5d. MSE of MOOA changed from 6.9 m2 g−1 under dry conditions to 11 and 16 m2 g−1 (corresponding to f(RH) values of 1.6 and 2.3) under RH of 80 % and 90 %, revealing that scattering abilities of MOOA would be largely enhanced by aerosol hygroscopic growth. The MSE of LOOA was enhanced from 3.4 under dry conditions to 7 m2 g−1 of 90 % RH; however, MSE values of HOA and COA remained constant due to their hydrophobic properties. Both MSE values of AS and AN increased quickly as a function of RH, and their f(RH) values reached as high as 2.5 and 2.2 at RH of 80 %. The MSE of AN exceeded that of MOOA at RH near 70 %; however, MSE of MOOA was always higher than that of AS for RH <90 %. Average MSE values of secondary aerosol components considering water uptake under ambient RH conditions during the observation period are 6.8, 8.5, 8.9 and 4.2 m2 g−1 for AS, AN, MOOA and LOOA, respectively, demonstrating the strongest scattering abilities of MOOA under ambient air conditions during the observation period. Thus, the average contribution of MOOA to PM1 organic aerosol scattering are further enhanced to 54 % under ambient conditions, as shown in Fig. 5c (campaign average RH ∼57 %).
Atmospheric visibility measures the maximum distance that people can see, which is determined by air extinction. The strong light scattering abilities of MOOA might have significant effects on atmospheric visibility and direct aerosol radiative effects and thus have broad implications for both aerosol environmental and climate effects. The contributions of different aerosol components to visibility degradation under different visibility conditions were estimated as fractional contributions to ambient atmospheric extinction caused by both aerosols and air molecules. The results are shown in Fig. 5e, and a detailed estimation method is introduced in Sect. S6. It shows that AN contributed most to visibility degradation especially under polluted conditions, which is consistent with findings of several recent studies that nitrate plays an increasing and even dominant role in visibility degradation (Liu et al., 2020; Li et al., 2022) in several regions of China. MOOAs contributed slightly less than ammonium sulfate, and their contributions increased to ∼20 % for a visibility range of 10–20 km. Contribution of MOOA to total organic aerosol scattering under ambient conditions was slightly higher than that under dry conditions due to the relatively low RH conditions during winter. However, the contributions of MOOA might be much higher during other seasons due to much higher RH conditions, for example, yearly average RH of >70 % in Guangzhou (Xu et al., 2020). Overall, secondary aerosols contributed dominantly to visibility degradation (∼70 % on average), and MOOA represented the third contributor among secondary aerosol components (16 % on average), demonstrating significant impacts of MOOA on visibility degradation. Thus, more attention should be paid to property changes of SOA regarding visibility improvement investigations and policymaking. Moreover, MOOA with high scattering abilities would likely contribute substantially to aerosol optical depth, and the accurate estimations of organic aerosol radiative effects in models need accurate representations of MOOA, even its mass contribution to organic aerosol is small. However, constant scattering efficiencies for organic aerosols derived from fixed size distributions and the refractive index were usually assumed in current chemical models (Latimer and Martin, 2019), and unsatisfactory performances of current models in SOA simulations were generally reported, which hinders the accurate representations of direct aerosol radiative effects.
The role of MOOA will likely become more important in future due to stringent control policies of precursors of inorganic aerosol components such as sulfur dioxide and nitrogen oxides. Both formation pathways and precursor sources of MOOA are complex; however, current understanding of physical and chemical properties as well as formation pathways of MOOA remains limited. Therefore, we call for more comprehensive studies on formation, evolution and physical properties of MOOA to better parameterize optical properties of MOOA in models and implement targeted control strategies on MOOA precursors of volatile organic compounds in the future.
All data needed are presented in figures, tables and supplementary figures. Raw datasets of this study are available from the first author and corresponding author upon request.
Supporting information on site information, Q-ACSM PMF analysis, the traditional multiple linear regression model analysis and the visibility contribution estimation method, including two supporting tables and 13 supporting figures, is given in the Supplement. The supplement related to this article is available online at: https://doi.org/10.5194/acp-22-7713-2022-supplement.
YK and LL designed the aerosol experiments. YK conceived and led this research. LL and YK wrote the manuscript. MMZ, LL and CQY conducted the Q-ACSM measurements. MMZ and YH performed the PMF analysis. BX, BL, HBX, FL and YK performed aerosol optical property measurements. XJD and TD obtained funding for this campaign and provided instruments. JT, JCT, WYX, HBT and MS provided insights into data analysis, and all authors contributed to discussions and revisions of this paper.
The contact author has declared that neither they nor their coauthors have any competing interests.
Publisher's note: Copernicus Publications remains neutral with regard to jurisdictional claims in published maps and institutional affiliations.
This work is supported by the National Key Research and Development Program of China (2019YFCO214605 and 2016YFC0202000), the National Natural Science Foundation of China (41805109 and 42105092), the Guangdong Basic and Applied Basic Research Foundation (2019A1515110791), the Science and Technology Innovation Team Plan of Guangdong Meteorological Bureau (grant no. GRMCTD202003), and the Natural Science Foundation of Fujian Province, China (2021J01463).
This research has been supported by the National Key Research and Development Program of China (grant nos. 2019YFC0214605 and 2016YFC0202000), the National Natural Science Foundation of China (grant nos. 41805109 and 42105092), the Guangdong Basic and Applied Basic Research Foundation (grant no. 2019A1515110791), the Science and Technology Innovation Team Plan of Guangdong Meteorological Bureau (grant no. GRMCTD202003) and the Natural Science Foundation of Fujian Province, China (grant no.2021J01463).
This paper was edited by Sergey A. Nizkorodov and reviewed by two anonymous referees.
Brock, C. A., Wagner, N. L., Anderson, B. E., Attwood, A. R., Beyersdorf, A., Campuzano-Jost, P., Carlton, A. G., Day, D. A., Diskin, G. S., Gordon, T. D., Jimenez, J. L., Lack, D. A., Liao, J., Markovic, M. Z., Middlebrook, A. M., Ng, N. L., Perring, A. E., Richardson, M. S., Schwarz, J. P., Washenfelder, R. A., Welti, A., Xu, L., Ziemba, L. D., and Murphy, D. M.: Aerosol optical properties in the southeastern United States in summer – Part 1: Hygroscopic growth, Atmos. Chem. Phys., 16, 4987–5007, https://doi.org/10.5194/acp-16-4987-2016, 2016.
Cai, J., Chu, B., Yao, L., Yan, C., Heikkinen, L. M., Zheng, F., Li, C., Fan, X., Zhang, S., Yang, D., Wang, Y., Kokkonen, T. V., Chan, T., Zhou, Y., Dada, L., Liu, Y., He, H., Paasonen, P., Kujansuu, J. T., Petäjä, T., Mohr, C., Kangasluoma, J., Bianchi, F., Sun, Y., Croteau, P. L., Worsnop, D. R., Kerminen, V.-M., Du, W., Kulmala, M., and Daellenbach, K. R.: Size-segregated particle number and mass concentrations from different emission sources in urban Beijing, Atmos. Chem. Phys., 20, 12721–12740, https://doi.org/10.5194/acp-20-12721-2020, 2020.
Canonaco, F., Crippa, M., Slowik, J. G., Baltensperger, U., and Prévôt, A. S. H.: SoFi, an IGOR-based interface for the efficient use of the generalized multilinear engine (ME-2) for the source apportionment: ME-2 application to aerosol mass spectrometer data, Atmos. Meas. Tech., 6, 3649–3661, https://doi.org/10.5194/amt-6-3649-2013, 2013.
Canonaco, F., Tobler, A., Chen, G., Sosedova, Y., Slowik, J. G., Bozzetti, C., Daellenbach, K. R., El Haddad, I., Crippa, M., Huang, R.-J., Furger, M., Baltensperger, U., and Prévôt, A. S. H.: A new method for long-term source apportionment with time-dependent factor profiles and uncertainty assessment using SoFi Pro: application to 1 year of organic aerosol data, Atmos. Meas. Tech., 14, 923–943, https://doi.org/10.5194/amt-14-923-2021, 2021.
Chan, Y. C., Simpson, R. W., McTainsh, G. H., Vowles, P. D., Cohen, D. D., and Bailey, G. M.: Source apportionment of visibility degradation problems in Brisbane (Australia) using the multiple linear regression techniques, Atmos. Environ., 33, 3237–3250, https://doi.org/10.1016/S1352-2310(99)00091-6, 1999.
Chen, C., Tan, H., Hong, Y., Yin, C., Deng, X., Chen, B., Wu, M., Bu, Q., Weng, J., and Gan, Q.: Characteristics, formation mechanisms, and sources of non-refractory submicron aerosols in Guangzhou, China, Atmos. Environ., 250, 118255, https://doi.org/10.1016/j.atmosenv.2021.118255, 2021.
Chen, D., Zhao, Y., Zhang, J., Yu, H., and Yu, X.: Characterization and source apportionment of aerosol light scattering in a typical polluted city in the Yangtze River Delta, China, Atmos. Chem. Phys., 20, 10193–10210, https://doi.org/10.5194/acp-20-10193-2020, 2020.
Chen, W., Ye, Y., Hu, W., Zhou, H., Pan, T., Wang, Y., Song, W., Song, Q., Ye, C., Wang, C., Wang, B., Huang, S., Yuan, B., Zhu, M., Lian, X., Zhang, G., Bi, X., Jiang, F., Liu, J., Canonaco, F., Prevot, A. S. H., Shao, M., and Wang, X.: Real-Time Characterization of Aerosol Compositions, Sources, and Aging Processes in Guangzhou During PRIDE-GBA 2018 Campaign, J. Geophys. Res.-Atmos., 126, e2021JD035114, https://doi.org/10.1029/2021JD035114, 2021.
Cheng, Y., Zheng, G., Wei, C., Mu, Q., Zheng, B., Wang, Z., Gao, M., Zhang, Q., He, K., Carmichael, G., Pöschl, U., and Su, H.: Reactive nitrogen chemistry in aerosol water as a source of sulfate during haze events in China, Sci. Adv., 2, e1601530, https://doi.org/10.1126/sciadv.1601530, 2016.
Drinovec, L., Močnik, G., Zotter, P., Prévôt, A. S. H., Ruckstuhl, C., Coz, E., Rupakheti, M., Sciare, J., Müller, T., Wiedensohler, A., and Hansen, A. D. A.: The ”dual-spot” Aethalometer: an improved measurement of aerosol black carbon with real-time loading compensation, Atmos. Meas. Tech., 8, 1965–1979, https://doi.org/10.5194/amt-8-1965-2015, 2015.
Guo, J., Zhou, S., Cai, M., Zhao, J., Song, W., Zhao, W., Hu, W., Sun, Y., He, Y., Yang, C., Xu, X., Zhang, Z., Cheng, P., Fan, Q., Hang, J., Fan, S., Wang, X., and Wang, X.: Characterization of submicron particles by time-of-flight aerosol chemical speciation monitor (ToF-ACSM) during wintertime: aerosol composition, sources, and chemical processes in Guangzhou, China, Atmos. Chem. Phys., 20, 7595–7615, https://doi.org/10.5194/acp-20-7595-2020, 2020.
Gysel, M., Crosier, J., Topping, D. O., Whitehead, J. D., Bower, K. N., Cubison, M. J., Williams, P. I., Flynn, M. J., McFiggans, G. B., and Coe, H.: Closure study between chemical composition and hygroscopic growth of aerosol particles during TORCH2, Atmos. Chem. Phys., 7, 6131–6144, https://doi.org/10.5194/acp-7-6131-2007, 2007.
Han, T., Xu, W., Chen, C., Liu, X., Wang, Q., Li, J., Zhao, X., Du, W., Wang, Z., and Sun, Y.: Chemical apportionment of aerosol optical properties during the Asia-Pacific Economic Cooperation summit in Beijing, China, J. Geophys. Res.-Atmos., 120, 12281–212295, https://doi.org/10.1002/2015JD023918, 2015.
Hand, J. L. and Malm, W. C.: Review of aerosol mass scattering efficiencies from ground-based measurements since 1990, J. Geophys. Res.-Atmos., 112, https://doi.org/10.1029/2007JD008484, 2007.
Hu, S., Zhao, G., Tan, T., Li, C., Zong, T., Xu, N., Zhu, W., and Hu, M.: Current challenges of improving visibility due to increasing nitrate fraction in PM2.5 during the haze days in Beijing, China, Environ. Pollut., 290, 118032, https://doi.org/10.1016/j.envpol.2021.118032, 2021.
Huang, R.-J., Zhang, Y., Bozzetti, C., Ho, K.-F., Cao, J.-J., Han, Y., Daellenbach, K. R., Slowik, J. G., Platt, S. M., Canonaco, F., Zotter, P., Wolf, R., Pieber, S. M., Bruns, E. A., Crippa, M., Ciarelli, G., Piazzalunga, A., Schwikowski, M., Abbaszade, G., Schnelle-Kreis, J., Zimmermann, R., An, Z., Szidat, S., Baltensperger, U., Haddad, I. E., and Prévôt, A. S. H.: High secondary aerosol contribution to particulate pollution during haze events in China, Nature, 514, 218–222, https://doi.org/10.1038/nature13774, 2014.
Huang, X., Ding, A., Gao, J., Zheng, B., Zhou, D., Qi, X., Tang, R., Wang, J., Ren, C., Nie, W., Chi, X., Xu, Z., Chen, L., Li, Y., Che, F., Pang, N., Wang, H., Tong, D., Qin, W., Cheng, W., Liu, W., Fu, Q., Liu, B., Chai, F., Davis, S. J., Zhang, Q., and He, K.: Enhanced secondary pollution offset reduction of primary emissions during COVID-19 lockdown in China, Natl. Sci. Rev., 8, nwaa137, https://doi.org/10.1093/nsr/nwaa137, 2020.
Jimenez, J. L., Canagaratna, M. R., Donahue, N. M., Prevot, A. S. H., Zhang, Q., Kroll, J. H., DeCarlo, P. F., Allan, J. D., Coe, H., Ng, N. L., Aiken, A. C., Docherty, K. S., Ulbrich, I. M., Grieshop, A. P., Robinson, A. L., Duplissy, J., Smith, J. D., Wilson, K. R., Lanz, V. A., Hueglin, C., Sun, Y. L., Tian, J., Laaksonen, A., Raatikainen, T., Rautiainen, J., Vaattovaara, P., Ehn, M., Kulmala, M., Tomlinson, J. M., Collins, D. R., Cubison, M. J., Dunlea, J., Huffman, J. A., Onasch, T. B., Alfarra, M. R., Williams, P. I., Bower, K., Kondo, Y., Schneider, J., Drewnick, F., Borrmann, S., Weimer, S., Demerjian, K., Salcedo, D., Cottrell, L., Griffin, R., Takami, A., Miyoshi, T., Hatakeyama, S., Shimono, A., Sun, J. Y., Zhang, Y. M., Dzepina, K., Kimmel, J. R., Sueper, D., Jayne, J. T., Herndon, S. C., Trimborn, A. M., Williams, L. R., Wood, E. C., Middlebrook, A. M., Kolb, C. E., Baltensperger, U., and Worsnop, D. R.: Evolution of Organic Aerosols in the Atmosphere, Science, 326, 1525–1529, https://doi.org/10.1126/science.1180353, 2009.
Kuang, Y., Zhao, C. S., Ma, N., Liu, H. J., Bian, Y. X., Tao, J. C., and Hu, M.: Deliquescent phenomena of ambient aerosols on the North China Plain, Geophys. Res. Lett., 43, 8744–8750, https://doi.org/10.1002/2016gl070273, 2016.
Kuang, Y., Zhao, C., Tao, J., Bian, Y., Ma, N., and Zhao, G.: A novel method for deriving the aerosol hygroscopicity parameter based only on measurements from a humidified nephelometer system, Atmos. Chem. Phys., 17, 6651–6662, https://doi.org/10.5194/acp-17-6651-2017, 2017.
Kuang, Y., Zhao, C. S., Zhao, G., Tao, J. C., Xu, W., Ma, N., and Bian, Y. X.: A novel method for calculating ambient aerosol liquid water content based on measurements of a humidified nephelometer system, Atmos. Meas. Tech., 11, 2967–2982, https://doi.org/10.5194/amt-11-2967-2018, 2018.
Kuang, Y., He, Y., Xu, W., Zhao, P., Cheng, Y., Zhao, G., Tao, J., Ma, N., Su, H., Zhang, Y., Sun, J., Cheng, P., Yang, W., Zhang, S., Wu, C., Sun, Y., and Zhao, C.: Distinct diurnal variation in organic aerosol hygroscopicity and its relationship with oxygenated organic aerosol, Atmos. Chem. Phys., 20, 865–880, https://doi.org/10.5194/acp-20-865-2020, 2020a.
Kuang, Y., He, Y., Xu, W., Yuan, B., Zhang, G., Ma, Z., Wu, C., Wang, C., Wang, S., Zhang, S., Tao, J., Ma, N., Su, H., Cheng, Y., Shao, M., and Sun, Y.: Photochemical Aqueous-Phase Reactions Induce Rapid Daytime Formation of Oxygenated Organic Aerosol on the North China Plain, Environ. Sci. Technol., 54, 3849–3860, https://doi.org/10.1021/acs.est.9b06836, 2020b.
Kuang, Y., He, Y., Xu, W., Zhao, P., Cheng, Y., Zhao, G., Tao, J., Ma, N., Su, H., Zhang, Y., Sun, J., Cheng, P., Yang, W., Zhang, S., Wu, C., Sun, Y., and Zhao, C.: Distinct diurnal variation in organic aerosol hygroscopicity and its relationship with oxygenated organic aerosol, Atmos. Chem. Phys., 20, 865–880, https://doi.org/10.5194/acp-20-865-2020, 2020c.
Kuang, Y., Xu, W., Tao, J., Ma, N., Zhao, C., and Shao, M.: A Review on Laboratory Studies and Field Measurements of Atmospheric Organic Aerosol Hygroscopicity and Its Parameterization Based on Oxidation Levels, Current Pollution Reports, 6, 410–424, https://doi.org/10.1007/s40726-020-00164-2, 2020d.
Kuang, Y., Huang, S., Xue, B., Luo, B., Song, Q., Chen, W., Hu, W., Li, W., Zhao, P., Cai, M., Peng, Y., Qi, J., Li, T., Wang, S., Chen, D., Yue, D., Yuan, B., and Shao, M.: Contrasting effects of secondary organic aerosol formations on organic aerosol hygroscopicity, Atmos. Chem. Phys., 21, 10375–10391, https://doi.org/10.5194/acp-21-10375-2021, 2021a.
Kuang, Y., Huang, S., Xue, B., Luo, B., Song, Q., Chen, W., Hu, W., Li, W., Zhao, P., Cai, M., Peng, Y., Qi, J., Li, T., Wang, S., Chen, D., Yue, D., Yuan, B., and Shao, M.: Contrasting effects of secondary organic aerosol formations on organic aerosol hygroscopicity, Atmos. Chem. Phys., 21, 10375–10391, https://doi.org/10.5194/acp-21-10375-2021, 2021b.
Kuwata, M., Zorn, S. R., and Martin, S. T.: Using Elemental Ratios to Predict the Density of Organic Material Composed of Carbon, Hydrogen, and Oxygen, Environ. Sci. Technol., 46, 787–794, https://doi.org/10.1021/es202525q, 2012.
Lambe, A. T., Onasch, T. B., Massoli, P., Croasdale, D. R., Wright, J. P., Ahern, A. T., Williams, L. R., Worsnop, D. R., Brune, W. H., and Davidovits, P.: Laboratory studies of the chemical composition and cloud condensation nuclei (CCN) activity of secondary organic aerosol (SOA) and oxidized primary organic aerosol (OPOA), Atmos. Chem. Phys., 11, 8913–8928, https://doi.org/10.5194/acp-11-8913-2011, 2011.
Latimer, R. N. C. and Martin, R. V.: Interpretation of measured aerosol mass scattering efficiency over North America using a chemical transport model, Atmos. Chem. Phys., 19, 2635–2653, https://doi.org/10.5194/acp-19-2635-2019, 2019.
Li, K., Li, J., Liggio, J., Wang, W., Ge, M., Liu, Q., Guo, Y., Tong, S., Li, J., Peng, C., Jing, B., Wang, D., and Fu, P.: Enhanced Light Scattering of Secondary Organic Aerosols by Multiphase Reactions, Environ. Sci. Technol., 51, 1285–1292, https://doi.org/10.1021/acs.est.6b03229, 2017.
Li, W., Teng, X., Chen, X., Liu, L., Xu, L., Zhang, J., Wang, Y., Zhang, Y., and Shi, Z.: Organic Coating Reduces Hygroscopic Growth of Phase-Separated Aerosol Particles, Environ. Sci. Technol., 55, 16339–16346, https://doi.org/10.1021/acs.est.1c05901, 2021.
Li, Z., Sun, Y., Wang, Q., Xin, J., Sun, J., Lei, L., Li, J., Fu, P., and Wang, Z.: Nitrate and secondary organic aerosol dominated particle light extinction in Beijing due to clean air action, Atmos. Environ., 269, 118833, https://doi.org/10.1016/j.atmosenv.2021.118833, 2022.
Liu, H. J., Zhao, C. S., Nekat, B., Ma, N., Wiedensohler, A., van Pinxteren, D., Spindler, G., Müller, K., and Herrmann, H.: Aerosol hygroscopicity derived from size-segregated chemical composition and its parameterization in the North China Plain, Atmos. Chem. Phys., 14, 2525–2539, https://doi.org/10.5194/acp-14-2525-2014, 2014.
Liu, J., Ren, C., Huang, X., Nie, W., Wang, J., Sun, P., Chi, X., and Ding, A.: Increased Aerosol Extinction Efficiency Hinders Visibility Improvement in Eastern China, Geophys. Res. Lett., 47, e2020GL090167, https://doi.org/10.1029/2020GL090167, 2020.
Liu, M., Bi, J., and Ma, Z.: Visibility-Based PM2.5 Concentrations in China: 1957–1964 and 1973–2014, Environ. Sci. Technol., 51, 13161–13169, https://doi.org/10.1021/acs.est.7b03468, 2017a.
Liu, P., Zhang, Y., and Martin, S. T.: Complex Refractive Indices of Thin Films of Secondary Organic Materials by Spectroscopic Ellipsometry from 220 to 1200 nm, Environ. Sci. Technol., 47, 13594–13601, https://doi.org/10.1021/es403411e, 2013.
Liu, P., Li, Y. J., Wang, Y., Gilles, M. K., Zaveri, R. A., Bertram, A. K., and Martin, S. T.: Lability of secondary organic particulate matter, P. Natl. Acad. Sci. USA, 113, 12643–12648, https://doi.org/10.1073/pnas.1603138113, 2016.
Liu, Y., Wu, Z., Wang, Y., Xiao, Y., Gu, F., Zheng, J., Tan, T., Shang, D., Wu, Y., Zeng, L., Hu, M., Bateman, A. P., and Martin, S. T.: Submicrometer Particles Are in the Liquid State during Heavy Haze Episodes in the Urban Atmosphere of Beijing, China, Environ. Sci. Technol. Lett., 4, 427–432, https://doi.org/10.1021/acs.estlett.7b00352, 2017b.
Middlebrook, A. M., Bahreini, R., Jimenez, J. L., and Canagaratna, M. R.: Evaluation of Composition-Dependent Collection Efficiencies for the Aerodyne Aerosol Mass Spectrometer using Field Data, Aerosol Sci. Technol., 46, 258–271, https://doi.org/10.1080/02786826.2011.620041, 2012.
Ng, N. L., Herndon, S. C., Trimborn, A., Canagaratna, M. R., Croteau, P. L., Onasch, T. B., Sueper, D., Worsnop, D. R., Zhang, Q., Sun, Y. L., and Jayne, J. T.: An Aerosol Chemical Speciation Monitor (ACSM) for Routine Monitoring of the Composition and Mass Concentrations of Ambient Aerosol, Aerosol Sci. Tech., 45, 780–794, https://doi.org/10.1080/02786826.2011.560211, 2011.
Qiu, J., Tan, W., Zhao, G., Yu, Y., and Zhao, C.: New correction method for the scattering coefficient measurements of a three-wavelength nephelometer, Atmos. Meas. Tech., 14, 4879–4891, https://doi.org/10.5194/amt-14-4879-2021, 2021.
Sun, Y. L., Wang, Z. F., Fu, P. Q., Yang, T., Jiang, Q., Dong, H. B., Li, J., and Jia, J. J.: Aerosol composition, sources and processes during wintertime in Beijing, China, Atmos. Chem. Phys., 13, 4577–4592, https://doi.org/10.5194/acp-13-4577-2013, 2013.
Tao, J., Zhang, Z., Wu, Y., Zhang, L., Wu, Z., Cheng, P., Li, M., Chen, L., Zhang, R., and Cao, J.: Impact of particle number and mass size distributions of major chemical components on particle mass scattering efficiency in urban Guangzhou in southern China, Atmos. Chem. Phys., 19, 8471–8490, https://doi.org/10.5194/acp-19-8471-2019, 2019.
Titos, G., Cazorla, A., Zieger, P., Andrews, E., Lyamani, H., Granados-Muñoz, M. J., Olmo, F. J., and Alados-Arboledas, L.: Effect of hygroscopic growth on the aerosol light-scattering coefficient: A review of measurements, techniques and error sources, Atmos. Environ., 141, 494–507, https://doi.org/10.1016/j.atmosenv.2016.07.021, 2016.
Wang, J., Ye, J., Zhang, Q., Zhao, J., Wu, Y., Li, J., Liu, D., Li, W., Zhang, Y., Wu, C., Xie, C., Qin, Y., Lei, Y., Huang, X., Guo, J., Liu, P., Fu, P., Li, Y., Lee, H. C., Choi, H., Zhang, J., Liao, H., Chen, M., Sun, Y., Ge, X., Martin, S. T., and Jacob, D. J.: Aqueous production of secondary organic aerosol from fossil-fuel emissions in winter Beijing haze, P. Natl. Acad. Sci. USA, 118, e2022179118, https://doi.org/10.1073/pnas.2022179118, 2021.
Wang, Y., Chen, J., Wang, Q., Qin, Q., Ye, J., Han, Y., Li, L., Zhen, W., Zhi, Q., Zhang, Y., and Cao, J.: Increased secondary aerosol contribution and possible processing on polluted winter days in China, Environ. Int., 127, 78–84, https://doi.org/10.1016/j.envint.2019.03.021, 2019.
Wu, Z. J., Zheng, J., Shang, D. J., Du, Z. F., Wu, Y. S., Zeng, L. M., Wiedensohler, A., and Hu, M.: Particle hygroscopicity and its link to chemical composition in the urban atmosphere of Beijing, China, during summertime, Atmos. Chem. Phys., 16, 1123–1138, https://doi.org/10.5194/acp-16-1123-2016, 2016.
Xu, W., Sun, Y., Wang, Q., Zhao, J., Wang, J., Ge, X., Xie, C., Zhou, W., Du, W., Li, J., Fu, P., Wang, Z., Worsnop, D. R., and Coe, H.: Changes in Aerosol Chemistry From 2014 to 2016 in Winter in Beijing: Insights From High-Resolution Aerosol Mass Spectrometry, J. Geophys. Res.-Atmos., 124, 1132–1147, https://doi.org/10.1029/2018jd029245, 2019.
Xu, W., Kuang, Y., Bian, Y., Liu, L., Li, F., Wang, Y., Xue, B., Luo, B., Huang, S., Yuan, B., Zhao, P., and Shao, M.: Current Challenges in Visibility Improvement in Southern China, Environ. Sci. Tech. Lett., 7, 395–401, https://doi.org/10.1021/acs.estlett.0c00274, 2020.
Yu, Y., Zhao, C., Kuang, Y., Tao, J., Zhao, G., Shen, C., and Xu, W.: A parameterization for the light scattering enhancement factor with aerosol chemical compositions, Atmos. Environ., 191, 370–377, https://doi.org/10.1016/j.atmosenv.2018.08.016, 2018.
Zhao, C., Yu, Y., Kuang, Y., Tao, J., and Zhao, G.: Recent Progress of Aerosol Light-scattering Enhancement Factor Studies in China, Adv. Atmos. Sci., 36, 1015–1026, https://doi.org/10.1007/s00376-019-8248-1, 2019.
Zhao, G., Tan, T., Zhao, W., Guo, S., Tian, P., and Zhao, C.: A new parameterization scheme for the real part of the ambient urban aerosol refractive index, Atmos. Chem. Phys., 19, 12875–12885, https://doi.org/10.5194/acp-19-12875-2019, 2019.
Zhao, G., Hu, M., Fang, X., Tan, T., Xiao, Y., Du, Z., Zheng, J., Shang, D., Wu, Z., Guo, S., and Zhao, C.: Larger than expected variation range in the real part of the refractive index for ambient aerosols in China, Sci. Total Environ., 779, 146443, https://doi.org/10.1016/j.scitotenv.2021.146443, 2021.
Zhou, W., Xu, W., Kim, H., Zhang, Q., Fu, P., Worsnop, D. R., and Sun, Y.: A review of aerosol chemistry in Asia: insights from aerosol mass spectrometer measurements, Environ. Sci.-Proc. Imp., 22, 1616–1653, https://doi.org/10.1039/D0EM00212G, 2020.