the Creative Commons Attribution 4.0 License.
the Creative Commons Attribution 4.0 License.
 | 03 Jun 2022
Contribution of Asian emissions to upper tropospheric CO over the remote Pacific
Linda Smoydzin
Peter Hoor
Upon analysing the global distribution of the highest 2 % of daily CO mixing ratios at 400 hPa derived from the MOPITT satellite instrument for 20 years (2000–2019), we very regularly detect regions with very high CO values (i.e. mixing ratios belonging to the globally highest 2 %) over the remote Northern Hemispheric (NH) Pacific. Such events of elevated CO over the upper tropospheric NH Pacific occur throughout the year with surprisingly high regularity and frequency (70 % of all days during winter, 80 % of all days during spring). During winter, most of these pollution events are detected over the north-eastern and central NH Pacific, during spring over the central NH Pacific, and during summer over the western NH Pacific. We detect most pollution events during spring.
To link each individual pollution event detected by the 2 % filtering method with a specific CO source region, we perform trajectory calculations using MPTRAC, a Lagrangian transport model. To analyse transport pathways and uplift mechanisms, we combine MOPITT data, the trajectory calculations, and ERA-Interim reanalysis data. It becomes apparent that air masses from China that are lifted along a frontal system into the free troposphere are the major CO source throughout the year. The contributions of other source regions and uplift mechanisms show a strong seasonal cycle: NE Asia in combination with upward transport of air masses in the warm conveyor belt of a midlatitude cyclone is a significant CO source region during winter, spring, and summer, while India is an important source region mainly during spring and summer and SE Asia mainly during spring.
- Article
(4677 KB) - Full-text XML
-
Supplement
(1330 KB) - BibTeX
- EndNote


The long-range transport of trace gases and aerosols from East Asia across the Pacific has been the subject of investigation for many years, as pollution plumes can be lifted to the free troposphere, where they are quickly transported to the North Pacific and North American West Coast by midlatitude storm tracks (Yienger et al., 2000; Liang et al., 2004; Holzer et al., 2005; Liang et al., 2005; Wuebbles et al., 2007; Turquety et al., 2008). A lot of effort has been spent in recent years to quantify the contribution of trace gases and aerosols of Asian origin to North American pollution levels (e.g. Zhang et al., 2008; Yu et al., 2008; Hu et al., 2019; Yu et al., 2019). However, these studies mainly focus on the chemical processing of the pollution plume rather than dynamical transport aspects. Several studies use satellite-derived CO data to better understand vertical and horizontal transport mechanisms in relation to the prevailing synoptic situation. Ding et al. (2015) use data from numerical models and the MOPITT satellite instrument to investigate high levels of CO in the upper troposphere over the eastern Pacific, while Liu et al. (2006) examine the influence of synoptic processes on the distribution of tropospheric CO, also using MOPITT satellite data. Many studies in recent years have focused on the role of the Asian summer monsoon anticyclone in the export of trace gases, pollutants, or aerosols from Asia to the stratosphere or into the subtropical upper troposphere and tropical tropopause layer (e.g. Garny and Randel, 2016; Müller et al., 2016; Vogel et al., 2016; Yu et al., 2017; Santee et al., 2017; Lelieveld et al., 2018). However, the export of Asian pollution to the upper troposphere at mid- and high latitudes occurs at lower levels during the whole year. Numerous studies have revealed a seasonal maximum of the Asian pollution outflow in spring. Studies using CO as a pollution tracer state that this observation can be explained by efficient ventilation of the Asian boundary layer via midlatitude cyclones and convection and increasing biomass burning emissions compared to winter (Liang et al., 2004; Holzer et al., 2005; Zhang et al., 2008; Yu et al., 2008; Luan and Jaeglé, 2013). Even though the strength and frequency of such pollution outflow events vary with the season, they occur regularly throughout the year (Liang et al., 2004; Han et al., 2018). As stated by e.g. Liang et al. (2004), midlatitude cyclones seem to be the driving mechanism for long-range transport (LRT) of polluted air masses from Asia to the western Pacific or North American West Coast. More than half a century ago, studies first revealed the existence of air streams such as warm conveyor belts (WCBs), cold conveyor belts, and dry intrusions associated with extratropical cyclones. Since then, several studies have investigated dynamical aspects of WCBs (e.g. Wernli and Davies, 1997; Wernli, 1997; Madonna et al., 2014; Gehring et al., 2020) as well as the vertical transport of polluted air masses in warm conveyor belts, in particular over the northern Pacific (e.g. Hannan et al., 2003; Kiley and Fuelberg, 2006; Klich and Fuelberg, 2014; Dickerson et al., 2007; Heald et al., 2003). Apart from uplift in the vicinity of a cyclone, orographic lifting (Chen et al., 2009; Ding et al., 2009) and convection play a major role in the vertical transport of Asian pollution plumes, especially during summer (Bey et al., 2001; Kiley and Fuelberg, 2006; Liang et al., 2005, 2007, 2004; Vogel et al., 2014).
Even though WCBs occur more frequently in the Northern Hemispheric winter than summer (Eckhardt et al., 2004; Madonna et al., 2014), their contribution to the uplift of polluted air masses is presumably important throughout the year (Liang et al., 2004). Madonna et al. (2014) find a global maximum of WCBs over the western North Pacific, China, and Taiwan during the NH summer. They discuss in detail that, presumably, a nearly stationary low-level baroclinic zone (Yihui and Chan, 2005; Ninomiya and Shibagaki, 2007), together with the East Asian monsoon, is responsible for tropical moisture exports over the West Pacific in summer, explaining the high frequency of WCBs during June, July, and August (Knippertz and Wernli, 2010). Generally, the Asian monsoon directly or indirectly controls the pollution outflow to the Pacific throughout the year (e.g. Kaneyasu et al., 2000; Müller et al., 2016; Lelieveld et al., 2018; Tomsche et al., 2019).
Many studies addressing the long-range transport of Asian pollution to the western Pacific or Arctic are based on case studies (e.g. Heald et al., 2003; Di Pierro et al., 2011; Matsui et al., 2011; Roiger et al., 2011). Several of those studies see uplift in the vicinity of a cyclone as an important part of the pollution transport process, though those studies show very different, individual transport pathways across the Pacific. Luan and Jaeglé (2013) present a composite analysis of aerosol export events from Asia to North America. Based on their analysis using MODIS satellite data and the GEOS-CHEM model, they find an enhancement of aerosol optical depth (AOD) values over the north-eastern Pacific/Alaska and over the south-western Pacific. The two separated maxima in the AOD composites appear as a split of the Asian outflow plume. Such a split of a single outflow plume caused by a blocking high-pressure system over the Pacific is also described by Heald et al. (2003), though, in that particular case study, the northern branch of the plume reached the western US while the second branch headed southward towards the tropical western Pacific, and no transport towards the Arctic was observed. Liang et al. (2005) and Reidmiller et al. (2010) also find that enhanced transpacific transport is characterised by the combined effects of a strong Pacific high and a strong low over Alaska.
Even though many studies investigate the effect of long-range transport, they are mostly based on case studies such as those discussed above, use a composite approach, or focus on meteorological conditions leading to the uplift of polluted air masses into the free troposphere.
Our study presents a detailed analysis of the spatial and temporal distribution of elevated CO level as a pollution tracer in the mid- and upper troposphere over the Pacific using 20 years of MOPITT data. We create a climatology of severe pollution episodes and use trajectory calculations to link each particular pollution event detected in MOPITT satellite data with a distinct source region. A second objective is the investigation of different uplift regions and uplift types, in particular WCB-related upward transport. We analyse each trajectory linking a pollution event detected by MOPITT with a CO source region individually. We create a seasonal statistic about different transport pathways and uplift types that depends on the location of elevated upper tropospheric CO, its source region, and the uplift region and uplift type of polluted air masses.
2.1 MOPITT
To detect pollution outflow events from the Asian continent, we use thermal infrared level 3 data from the version 8 product of CO measurements derived from the MOPITT instrument (Deeter et al., 2019). Level 3 products are available as daily mean values on a 1×1∘ global grid. The Terra satellite carrying the MOPITT instrument flies in a sun-synchronous polar orbit at an altitude of 705 km. MOPITT splits the earth into pixels 22 km2 in size. By using a cross-tracking scanning method, it sees the earth in a swath of about 640 km consisting of 29 pixels. Near-complete global coverage of the measurements is reached after 3 d. Pixels with a high cloud content are filtered out. As MOPITT uses gas correlation spectroscopy of the thermal infrared radiation emitted from the earth's surface, it can retrieve vertical profiles for almost two independent layers of CO. Data products are available for 10 levels with a vertical resolution of 100 hPa (surface, 900–100 hPa). A retrieval algorithm is applied to the MOPITT data that is based on optimal estimation using a priori information to obtain additional constraints (Deeter et al., 2015). The averaging kernels (see the Supplement) applied to the in situ profiles give confidence that the vertical resolution of the MOPITT data in our study region is sufficient to use this data set to address our scientific objective.
2.2 Detection of long-range transport events using MOPITT CO data
As we are primarily interested in upper tropospheric pollution episodes, we focus our analysis on the 400 hPa data from MOPITT, which is chosen as it is reliably in the troposphere throughout the year. The 300 hPa level is frequently located above the tropopause (north of about ∼45∘) during winter (Wilcox et al., 2012), where CO mixing ratios decrease quickly.
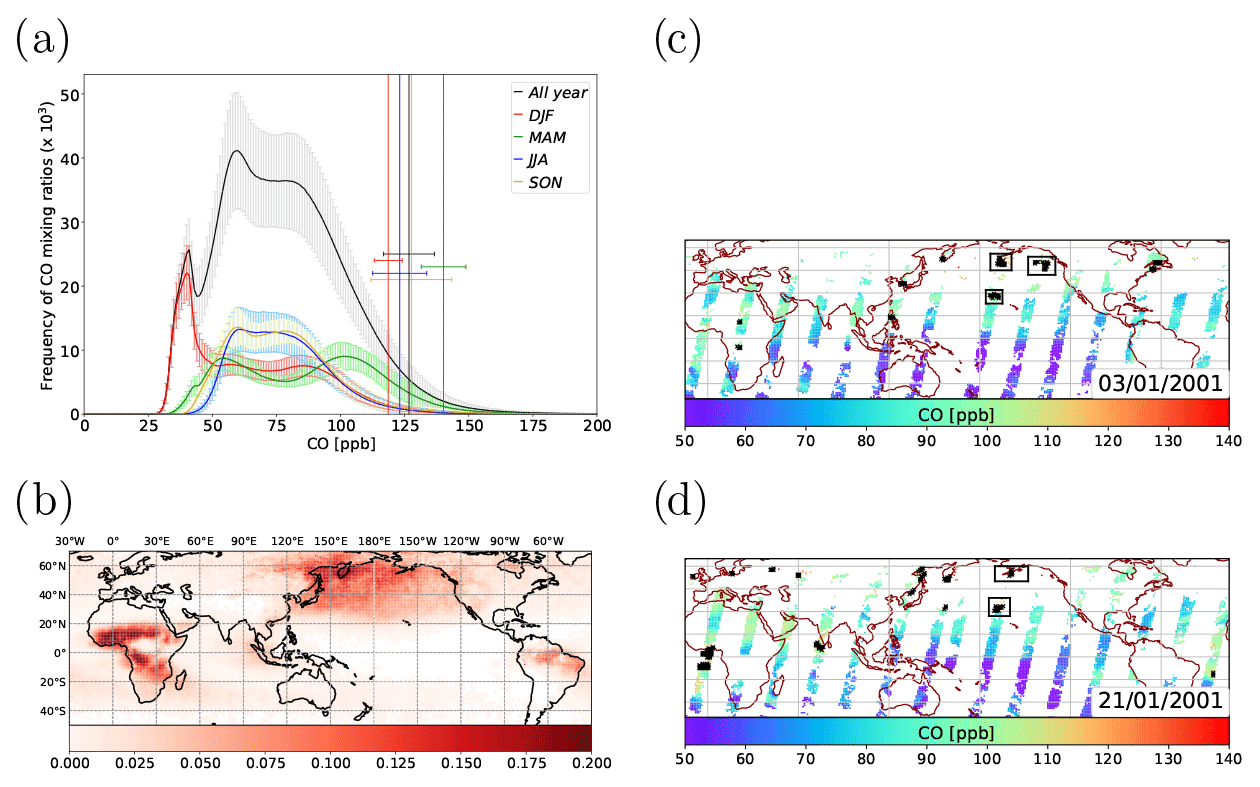
Figure 1Panel (a) shows the frequency distribution of mean CO mixing ratios [ppb] at 400 hPa (years 2000–2019) as retrieved from MOPITT, including the standard deviation. Vertical lines ranging from the bottom to the top of the plot denote the smallest (mean) mixing ratio belonging to the highest 2 % of mixing ratios. Horizontal bars mark the standard deviation of this value. Panel (b) shows the global frequency distribution (2000–2019) of those 2 % of data points (weighted by the total number of valid retrievals at each grid point). Panels (c) and (d) show CO mixing ratios from one MOPITT overpath for 2 selected days. Black crosses mark the highest 2 % of the CO values of the given overpath, which are selected. Black squares mark the CO maxima cluster where trajectories are initiated (Sect. 3.3).
Note further that the 400 hPa MOPITT CO has been shown to be insensitive to potential long-term bias drifts (Deeter et al., 2019), which could potentially affect long-term satellite observations (Yoon et al., 2013). To identify individual synoptic-scale pollution events in the MOPITT CO data set, we determine a CO data set by focusing only on CO anomalies of elevated CO as described in the following. Daily CO data from MOPITT are highly episodic and variable. In addition, atmospheric CO mixing ratios generally undergo a seasonal cycle. Therefore, we use a statistical approach to select pollution events similar to Luan and Jaeglé (2013), who create a frequency distribution of modelled AOD values in a certain latitude range over the Pacific. This AOD distribution is log-normal, and Luan and Jaeglé (2013) choose the top 20 % of days in the frequency distribution as LRT events. The frequency distribution of observed CO mixing ratios at 400 hPa is also log-normal (Fig. 1a), and we use the highest 2 % of global daily CO data (literally speaking, we cut off the left tail of the frequency distribution and use only the right tail, i.e. the maximum 2 % of CO data) for further analysis. Figure 1c, d shows, as an example, all CO observations (from one overpath of Terra) on 2 selected days and the filtered grid points following the application of the 2 % criterion (black crosses). We refer to those data points as CO maxima. Regions with at least three neighbouring maximum grid points are defined as a CO maximum cluster and are included in our analysis. It turns out that, throughout the year, these CO maxima are found surprisingly regularly over the remote Pacific, far away from CO source regions, and therefore long-range transport of CO must be responsible for these observations (Fig. 1b).
It is hypothetically possible that on days with strong and widespread biomass burning at any region outside the study region (i.e. the NH Pacific), the pollution signal over the NH Pacific is weak and we underestimate the number of severe pollution events. However, due to the incomplete global coverage of the satellite data, MOPITT only sees a fraction of the potential biomass burning area (Fig. 1c, d), such that a sufficient number of the selected 2 % of grid points are always located over regions that are not typical of biomass burning. In addition, it is possible that we miss LRT events where polluted regions are covered with clouds. However, on average, we find 195 LRT events for winter (DJF), 330 for spring (MAM), 239 for summer (JJA), and 98 for autumn (SON) per year over the Pacific (the Pacific region that is included in our analysis is shown in Fig. 3). The seasonal distribution of LRT events is very similar to the one found by Luan and Jaeglé (2013). Since the total number of events selected by our filter is rather large and certainly sufficient to compose statistics, our final results regarding the trajectory analysis (Sect. 3) would not be impacted severely if we missed single LRT events.
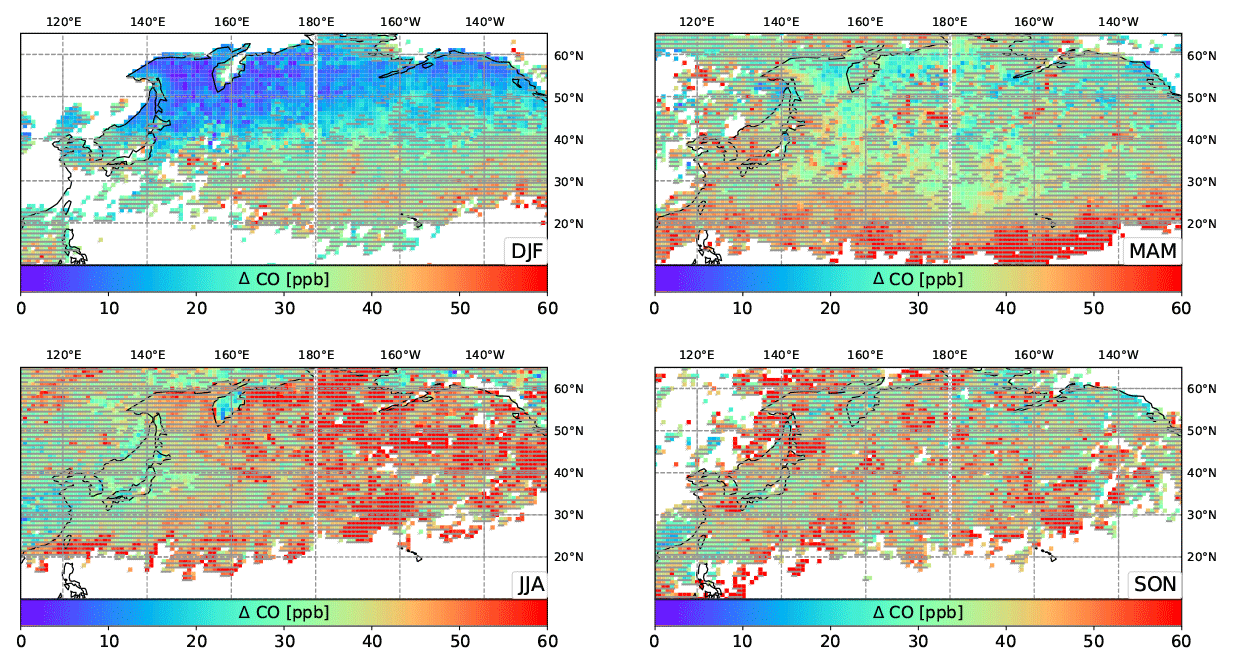
Figure 2Difference [ppb] between CO seasonal mean mixing ratios at 400 hPa considering only CO maxima events and total seasonal mean CO mixing ratios including all valid data points (2000–2019). Grid points marked by grey crosses show a difference with a strong statistical significance (regions where the pooled standard deviation is within the 99 % confidence interval).
CO maxima events represent periods of elevated CO mixing ratios compared to the background level. The difference between mean CO mixing ratios considering only CO maxima events and mean CO mixing ratios considering all data is rather high over almost the entire NH Pacific during all seasons (Fig. 2). This indicates that, through our selection of data points, we really do capture periods with extraordinary high pollution levels in the upper troposphere compared to the background level. An exception is clearly visible over the northern Pacific during winter (Fig. 2, DJF) where the difference in CO mixing ratios is rather small and of no statistical significance. Thus, we can assume that the maximum CO levels (according to our criterion) are within the variability of the climatological mean in this region during this time. They thus represent this mean rather than extreme pollution events. This conclusion can also be drawn for the central NH Pacific during spring (Fig. 2, MAM). Regions with a difference in CO mixing ratios of low statistical significance are also found during the summer east of Japan (Fig. 2, JJA), where many maxima events occur. However, this region is much closer to potential CO sources than the northern/central NH Pacific (where background CO levels are lower) and it is less surprising that pollution outflow events strongly impact the overall climatological mean at this site.
CO maxima events occur throughout the year over the NH Pacific, although autumn is an exception, as there are much fewer events then than during the rest of the year (Fig. 3). A seasonal shift of the regions where most CO maxima occur at 400 hPa is clearly visible (this is also the case at 500 and 300 hPa). In winter time (Fig. 3, DJF), CO maxima occur more often over the north-eastern NH Pacific, while they are found over the central NH Pacific during spring (Fig. 3, MAM). The total number of CO maxima events is much higher during spring than in other seasons, which is in agreement with other studies showing a maximum of pollution export from Asia during spring (e.g. Luan and Jaeglé, 2013; Holzer et al., 2005; Zhang et al., 2008; Yu et al., 2008; Liang et al., 2004). During summer time (JJA), the occurrence of midlatitude cyclones is generally less frequent than during winter and spring, while convection and the Asian summer monsoon gain in importance as transport pathways. The detected CO maxima are then found much closer to the continent over the western NH Pacific, Siberia, and Kamchatka.
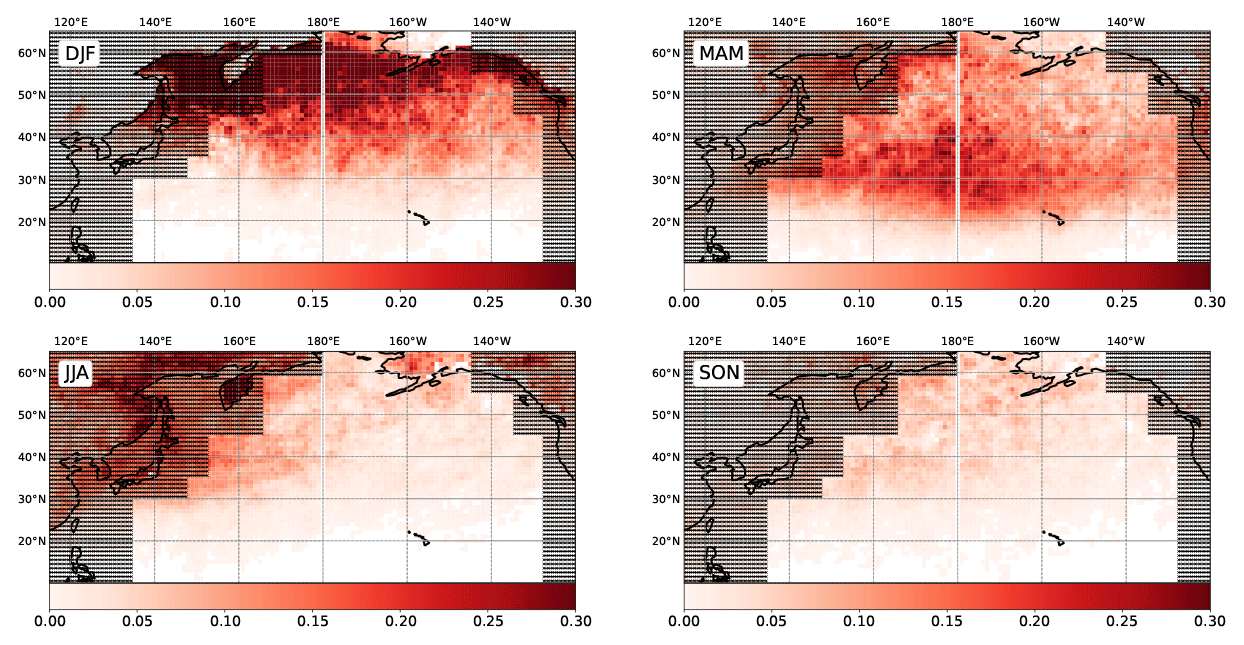
Figure 3All panels in this plot show the same quantity as in Fig. 1b, though separately for each season and solely for the Pacific region (i.e. the global frequency distribution (2000–2019) of the 2 % of data points weighted by the total number of valid retrievals at each grid point). Only CO maxima in the area which is not grey shaded are included in the trend and trajectory analysis.
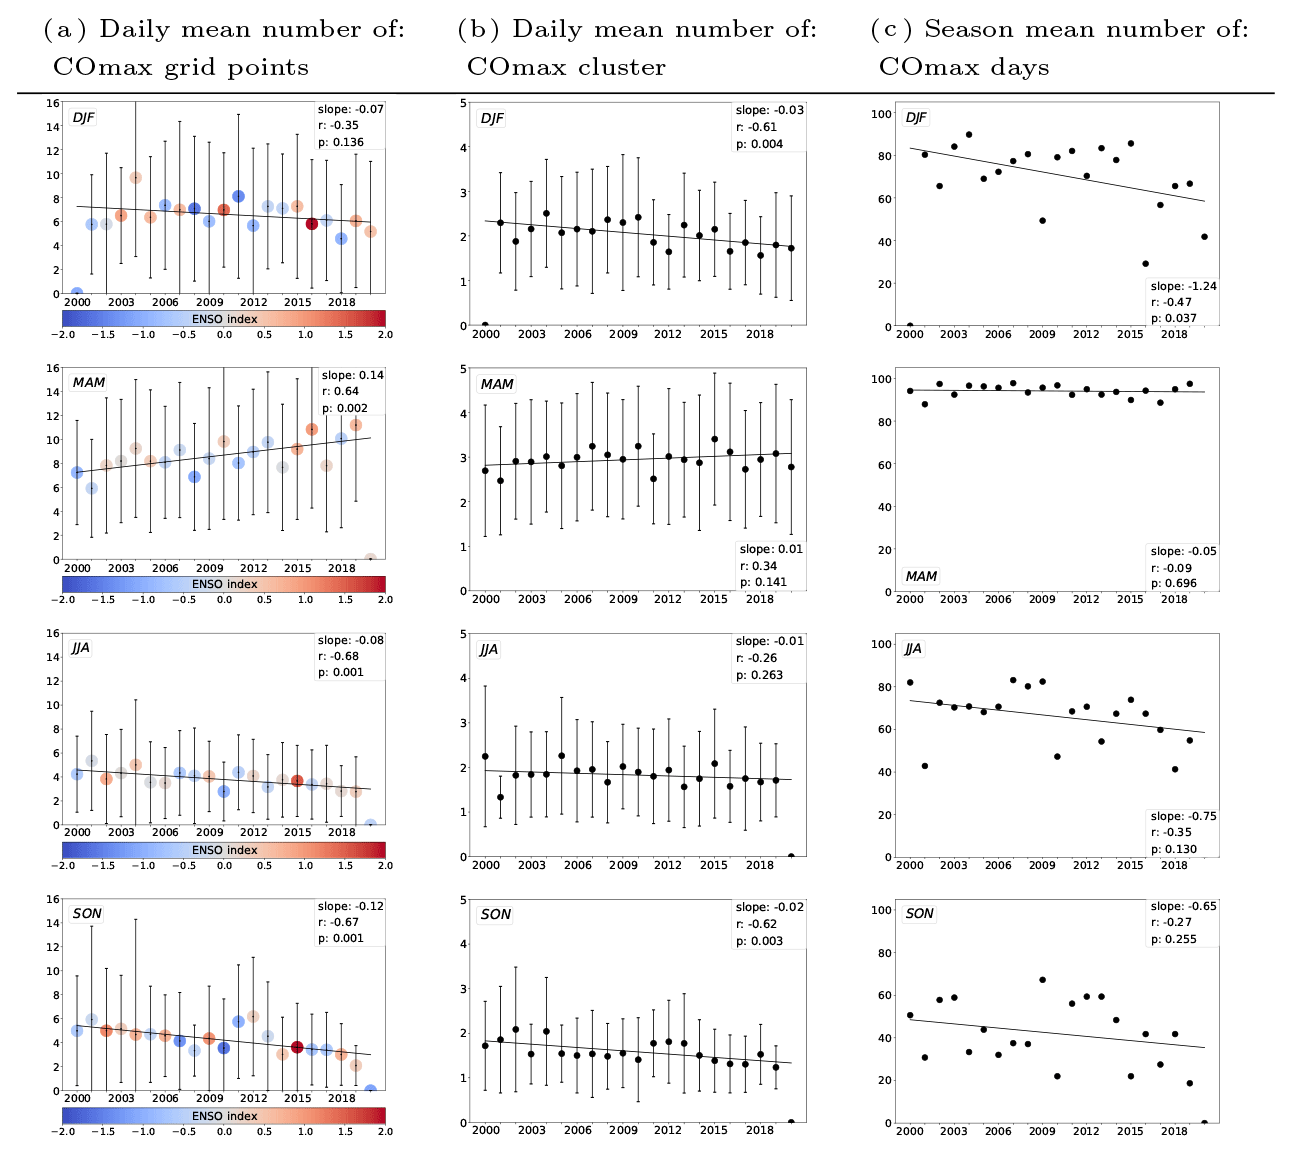
Figure 4(a) Plots show time series of the season mean number of daily CO maxima grid points normalised by the total number of retrieved MOPITT data points over the NH Pacific. Circles are coloured according to the ENSO index (taken from https://origin.cpc.ncep.noaa.gov/products/analysis_monitoring/ensostuff/ONI_v5.php, last access: January 2022). Vertical lines show the standard deviation of the daily number of CO maxima grid points with respect to the season mean. Further shown are the season mean number of CO maxima cluster (b) and a percentage corresponding to the number of CO maxima days within one season weighted by the number of days with MOPITT data (c). The area that is included in this analysis is shown in Fig. 3. Periods with data gaps are excluded from the statistics.
We detect CO maxima over the NH Pacific on ∼70 % of all days during winter and summer, ∼90 % of all days during spring, and ∼40 % of all days during autumn (Fig. 4c). The high temporal frequency of LRT events during spring stays unchanged during the analysed time period, while the number of CO maxima days in winter, summer, and autumn decreases from 2000 until 2019. In particular, during winter time, the decrease in CO maxima days is statistically significant. We find CO maxima on ∼80 % of all days in 2001, but on less than 60 % of all days in DJF in 2019 (Fig. 4c DJF). However, the correlation of the data points is rather weak (r<0.5), showing a high interannual variability.
The daily number of grid points that are selected by our filtering method as a CO maximum over the Pacific varies strongly (visible in the high standard deviation, Fig. 4a). We select exemplarily 84 grid points in total on 3 January 2001 (46 are located over the study region over the Pacific, and distributed among three clusters; see Fig. 1c) and 131 grid points on 21 January 2001 (24 grid points are over the Pacific and are distributed among two clusters; see Fig. 1d).
During the 20 years of daily data that we analysed, the number of CO maxima grid points slightly increases during spring (slope of regression line: 0.14) and decreases during winter (slope: −0.12, Fig. 4a), while the number of clusters (Fig. 4b) and the frequency of LRT events (Fig. 4c) stay the same (they slightly decrease during winter). Both trends (MAM, SON) are small but mathematically of statistical significance. However, the results need to be carefully interpreted. Firstly, the standard deviation of the mean number of CO maxima grid points found in one season is very high (especially for spring). Secondly, we cannot directly conclude that the spatial coverage of severe pollution episodes increased, though it is likely. Regarding our filtering method, an increase in the number of CO maxima grid points over the Pacific during spring could hypothetically be also the result of e.g. (i) weaker biomass burning in other regions of the world, (ii) CO emission reductions in other regions of the world, (iii) faster dilution of CO plumes in other regions of the world, (iv) less clouds over the Pacific or more clouds over other polluted areas, or (v) instrumentational reasons. In addition, it is well known that precipitation patterns over the Pacific and the position of the jet stream can be altered during El Niño episodes (Breeden et al., 2021), thus altering transport pathways of pollution plumes. Therefore, we considered a correlation between warm phases of ENSO and our selected LRT events. Years with an extraordinarily large spatial extension of the upper tropospheric CO maxima cluster during MAM (e.g. 2004, 2010, 2016, 2019) are indeed related with El Niño periods (Fig. 4a). This result is in agreement with work by Breeden et al. (2021), who find an increase in storm track activity during La Niña years compared to neutral or El Niño years.
Nevertheless, the changes over time (2000–2019) concerning the selection of LRT events are small compared to the large total number of LRT events selected during the 20 years of available MOPITT data by our 2 % filter criterion. Therefore, these changes do not significantly impact the trajectory analysis, which is presented in Sect. 3.
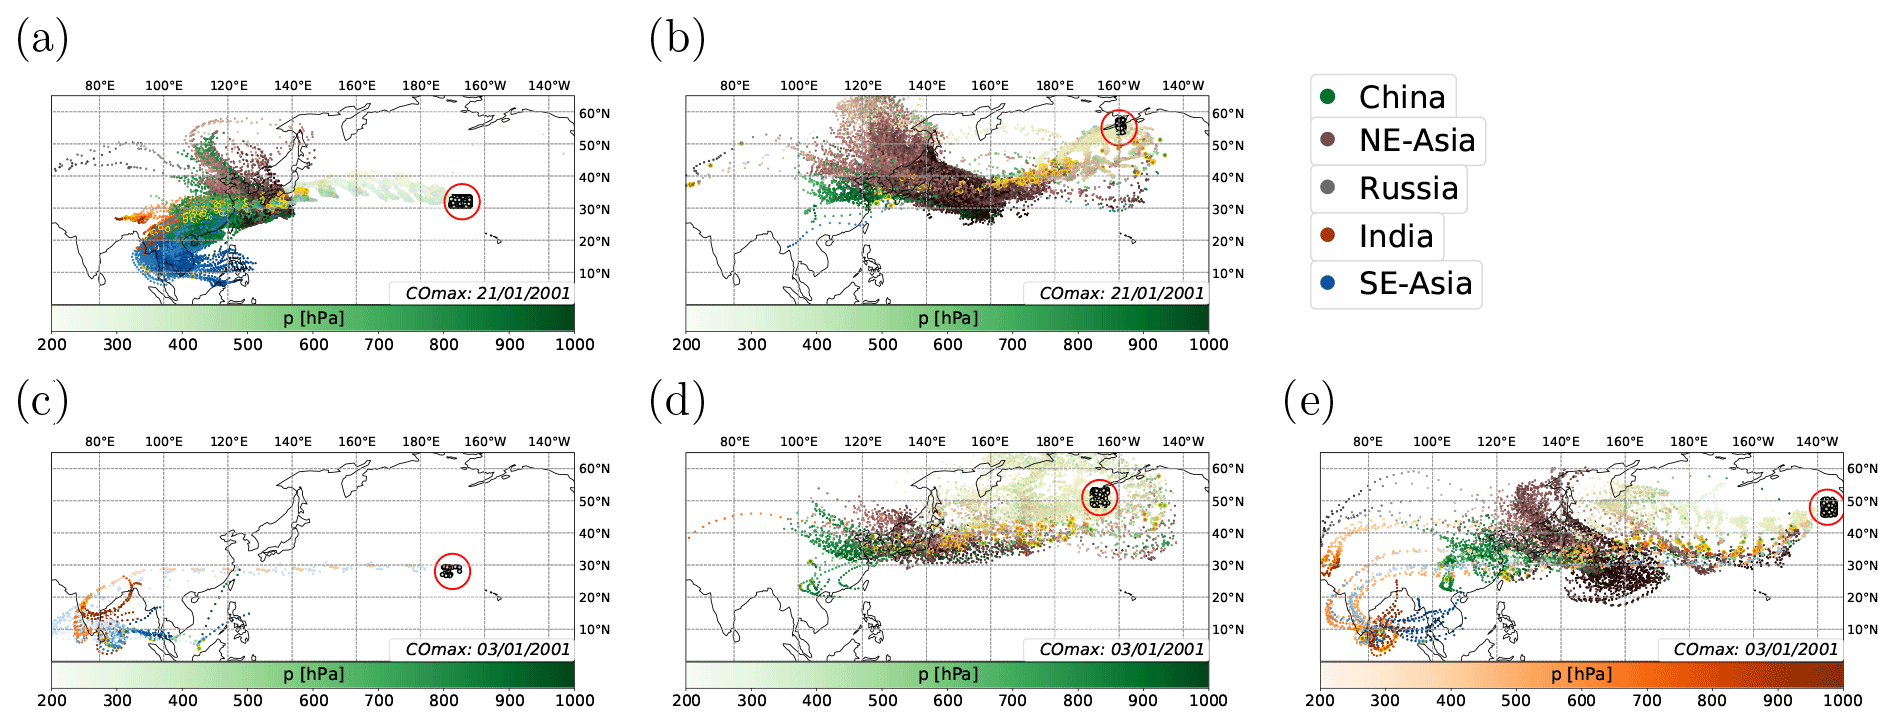
Figure 5Plots show trajectories starting at a CO maxima cluster on 3 January 2001 (c, d, e) and 21 January 2001 (a, b). Trajectories with the same source region have the same colour (see legend, e.g. trajectories from China are green, those from SE Asia are blue). The lighter the colour of the circles marking the position of the trajectory, the lower the pressure level. Yellow circles mark the time of uplift, and black circles (over the Pacific) mark the start position of the trajectory, i.e. the region of the CO maxima cluster.

3.1 MPTRAC
In order to link the regions of elevated CO derived from MOPITT with a particular source region, we use the trajectory model MPTRAC (Hoffmann et al., 2016), which was recently developed at the Jülich Supercomputing Centre. MPTRAC is a massive-parallel Lagrangian particle dispersion model allowing a computationally efficient calculation of transport simulations in the troposphere and stratosphere.
We calculate backward trajectories starting in a square region covering each single CO-maximum cluster detected by MOPITT. To account for the vertical extent of the averaging kernel and uncertainties in the reanalysis data set driving MPTRAC, trajectories are initiated at 400 hPa and then this altitude is varied randomly between 386 and 424 hPa. The number of trajectories for each square covering a CO maximum cluster is defined by . Trajectories are started four times a day (00:00, 06:00, 12:00, 18:00 UTC) if a CO maximum is observed. The simulation time is 16 d. Meteorological input data for all trajectory calculations are taken from the ERA-Interim data set (Dee et al., 2011). Output is also written every 6 h in order to compare our MPTRAC simulations with the ERA-Interim data set. Trajectories are included in our statistics if they descend below 850 hPa, the altitude above the ground is less than 1.5 km, and the trajectories cross emission regions (taken from the IPCC AR5/RCP85 emission inventory Lamarque et al., 2010) with a CO flux of at least kg(CO) m−2 s−1. This value roughly corresponds to the average CO emission flux in industrialised regions, excluding biomass burning emissions.
3.2 Transport characteristics
One of the questions we address in this study is the potential importance of vertical transport of pollution by extratropical cyclones and particularly warm conveyor belts as part of long-range transport events. Closely following Madonna et al. (2014), we define a criterion for WCB-related upward transport: trajectories must be located within a two-dimensional surface cyclone field for at least one 6-hourly time step during the ascend phase, i.e. trajectories must cross the cyclone within the time between two time steps prior to or after being lifted above the 800 hPa level (Fig. 8).
This condition not only ensures that trajectories rise in the vicinity of a cyclone but it also excludes the accidental consideration of convectively uplifted air masses (Madonna et al., 2014). We require uplift from below 800 to 400 hPa (the altitude we mainly analyse, see Sect. 2.2), but we give no time limit for the uplift. Our analysis reveals, however, that by far the majority of all trajectories are lifted to 400 hPa within 48 h, which is the time frame for the WCB-type uplift used in the study by Madonna et al. (2014).
To define the position and size of a cyclone, we follow the method of Wernli and Schwierz (2006) and the modifications described by Madonna et al. (2014). Based on ERA-Interim reanalysis data, a cyclone centre is defined as a local minimum in sea-level pressure. Starting at the centre of a cyclone, closed isobars are calculated at intervals of 0.5 hPa. To define the horizontal extension of a cyclone, this procedure is repeated until no closed isobars can be found. As described by Madonna et al. (2014), our algorithm also allows the merging of two cyclones that are very close to each other. The algorithm calculating the horizontal extension of a cyclone tends to underestimate rather than overestimate the size of a cyclone.
In addition to WCB-type uplift, we determine trajectories that are lifted along a frontal zone. The classification of trajectories belonging to this category follows the procedure described above, but the trajectories must cross a frontal zone during their ascent. The definition of a front follows, in general, one of the approaches discussed by Schemm et al. (2017): a frontal zone is identified by enhanced θe gradients (at least 4 K 100 km−1). We slightly modify this criterion by requiring a gradient of at least 3 K in one grid box (0.75∘) in the ERA-Interim data set. As discussed by Thomas and Schultz (2018), numerous definitions to detect a front in a gridded data set exist, all of which have their advantages and disadvantages. As the definition of the front has a rather high uncertainty, and as the ERA-Interim data set has a rather coarse horizontal resolution of 0.75∘, it is likely that we miss frontal systems in our analysis. Therefore, several trajectories do not fulfil one of the two above-described criteria and are classified as “rest”. Also, trajectories that are orographically lifted belong to this group. Due to the coarse vertical resolution of the ERA-Interim data set that also underlies the MPTRAC trajectory calculations, it is not possible to separate those trajectories accurately.
The ERA-Interim-based MPTRAC simulations do not explicitly represent deep convection since trajectory calculations are only driven by large-scale wind fields. Therefore, we cannot further distinguish between different uplift types occurring in the vicinity of a frontal zone. Due to the long simulation period of 19 years, it is also not possible to analyse each uplift event individually, as done by Liang et al. (2005). However, Lawrence and Salzmann (2008) point out that trajectories should represent the net vertical and long-range transport reasonably well, since much of the convective upwelling in our region of interest is connected to large-scale circulations. As Lawrence and Salzmann (2008) and Lawrence and Lelieveld (2010) discuss in detail, it can be assumed that the basic regional lofting will be present in Lagrangian trajectory simulations using input from global circulation models. It has to be expected that the mean rate of vertical transport will be underestimated.
3.3 Case study
As described in Sect. 3.1, we use Lagrangian trajectory calculations and ERA-Interim reanalysis data to analyse the source regions of the upper tropospheric CO detected over the Pacific and related uplift mechanisms. To better illustrate the trajectory analysis, we will discuss in more detail 2 particular days (3 and 21 January 2001) with CO maxima observed over the remote Pacific by MOPITT (Fig. 5). On both days, a CO maximum cluster was found near the Aleutian Peninsula (Fig. 5b, d) and over the central NH Pacific (Fig. 5a, c). On 3 January, a third cluster was found over the Gulf of Alaska (Fig. 5e).
Trajectory simulations link all three CO maxima clusters north of 40∘ N (Fig. 5b, d, e) mainly with NE Asia (dark red trajectories) and NE China (green trajectories) as source regions, while the cluster over the central NH Pacific (Fig. 5a, c) has a strong contribution from air masses coming from (SE) China (green trajectories), SE Asia (blue trajectories), and India (orange trajectories). Even though both clusters over the central NH Pacific are found in very similar regions (∼170∘ E, 30∘ N, Fig. 5a, c), trajectory simulations indicate significantly different source regions. On 21 January (Figs. 5a, 6a), 65 % of all trajectories come from China, 15 % come from NE Asia and SE Asia, and a small fraction of trajectories come from India (4 %). The CO maximum observed on 3 January (Fig. 6d) is mainly fed by CO from SE Asia (46 % of all trajectories) and India (50 %), while China seems to play a minor role as a source region (3 %) on that particular day.
Most of the trajectories reaching the CO maximum over the Aleutian Peninsula on 21 January are lifted into the free troposphere in the vicinity of an eastward-moving cyclone (66 % of all trajectories, Figs. 5b, 6c). Figure 7 shows exemplarily the position of the cyclone at 18:00 UTC on 14 January 2001 (a) and 00:00 UTC on 15 January 2001 (b). Once they have been lifted into the free troposphere, the air masses are transported north-eastward, they circulate in the Aleutian low, and they finally move further north towards the Arctic or eastward towards the American West Coast (not shown). This transport pathway is typical of LRT by fast uplift of air masses in the warm conveyor belt of a midlatitude cyclone over the Pacific with subsequent eastward motion in the free troposphere (Madonna et al., 2014). In contrast, air masses reaching the second cluster on 21 January over the central NH Pacific (Fig. 5a) are mainly lifted into the free troposphere over the continent (Fig. 6b, c) along a front.
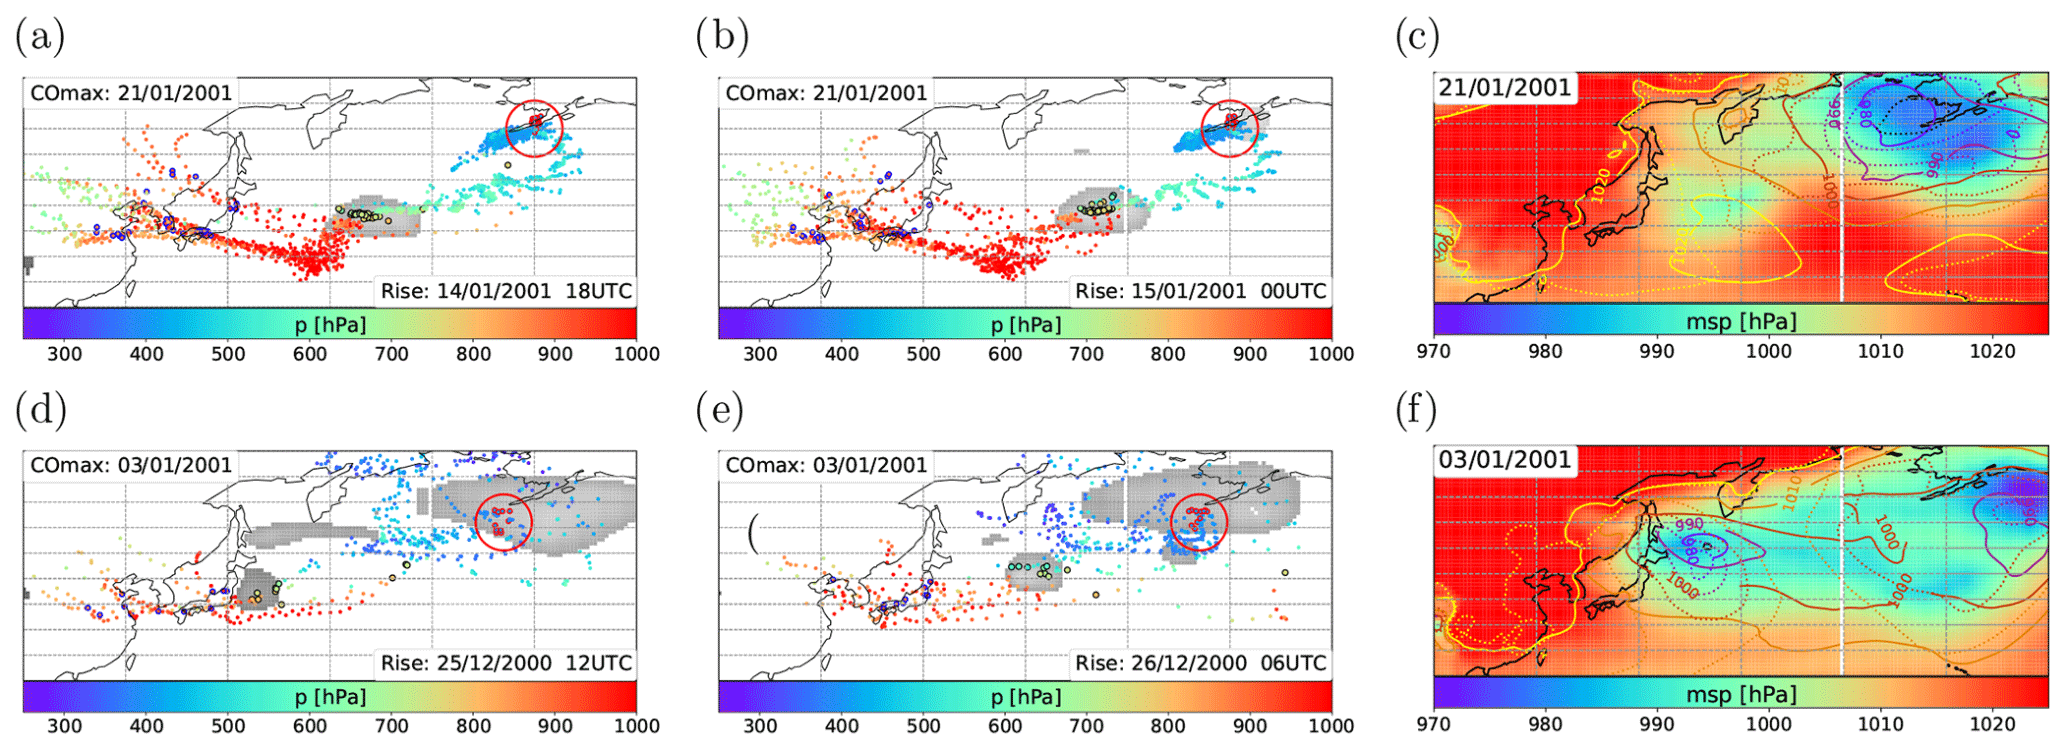
Figure 7Panels (a)–(b), (d)–(e) show trajectories that reach a common CO maxima cluster and have a common time at which they rise (above 800 hPa). Black circles mark the trajectory position at the time of rise; blue circles mark the position of descent below 800 hPa above a CO emission region. Grey-shaded areas mark the positions of low-pressure systems in the ERA-Interim data set. Panels (c) and (f) show daily averages of the mean sea-level pressure (msp; hPa) taken from ERA-Interim on 21 January 2001 (c) and 3 January 2001 (f). Solid contour lines show the daily mean msp 1 d prior to the case study day (i.e. on 20 January 2001 in c and on 2 January 2001 in f), and dotted contour lines show it 2 d prior to the case study day (i.e. on 19 January 2001 in c and on 1 January 2001 in f).
Air masses reaching the CO maximum cluster over the Aleutian Peninsula on 3 January do not show such a uniform transport pattern as that seen on 21 January. Even though a large fraction of the trajectories experience WCB-type uplift (43 % of all trajectories, Fig. 6d), the uplift time and uplift position show stronger temporal and spatial variability compared to 21 January. Air masses need on average 3.3 d to reach the CO maxima cluster after rising into the free troposphere (4.8 d on 21 January). Parts of the air masses are lifted faster to higher altitudes (∼400 hPa 6–12 h after uplift; see the trajectories at the edge of the cyclone at ∼165∘ E in Fig. 7e) compared to 21 January, but transport patterns in the free troposphere are rather diffuse (Fig. 7d, e). On both case study days, a strong Aleutian low has built up, although its position differs on these days. It is located over the Gulf of Alaska on 3 January (Fig. 7f) and over the Aleutian Peninsula on 21 January (Fig. 7c).
The CO maxima cluster over the Gulf of Alaska (Fig. 5e) is half composed of air masses that are lifted along a front near CO emission regions (NE China, NE Asia) and for which eastward transport takes place in the free troposphere, while the other half cross almost the entire Pacific in the lowermost (marine) troposphere. Those air masses are finally lifted into the free troposphere close to the observed CO maximum cluster in the vicinity of a cyclone. As a consequence, it can be assumed that the two plume composites experience significantly different chemical processing and mixing during transport.
3.4 Statistics of the long-term observational data set (2000–2018)
We extended the statistics presented above to all CO maxima clusters detected in our simulation period (March 2000–December 2018) and to all trajectories calculated for each single CO-maximum cluster. As described in Sect. 3.1, backward trajectories are assigned to a certain source region if they descend below 850 hPa, are less than 1.5 km above the ground, and CO emissions exceed a certain threshold. Throughout the year, trajectories reveal China as the dominant source region (Fig. 8d) of upper tropospheric CO. The contributions of other regions show stronger seasonality. During winter and summer, there is almost the same percentage of trajectories from NE Asia (33.7 % DJF, 27.9 % JJA) as from China (36.8 % DJF, 29 % JJA, Fig. 8d). During spring, however, India becomes an important upper tropospheric CO source region (32 % source contribution). During summer, the total percentage of trajectories coming from India is smaller than during spring, though we find that the individual contribution of India to a single pollution event is stronger during summer than during spring.
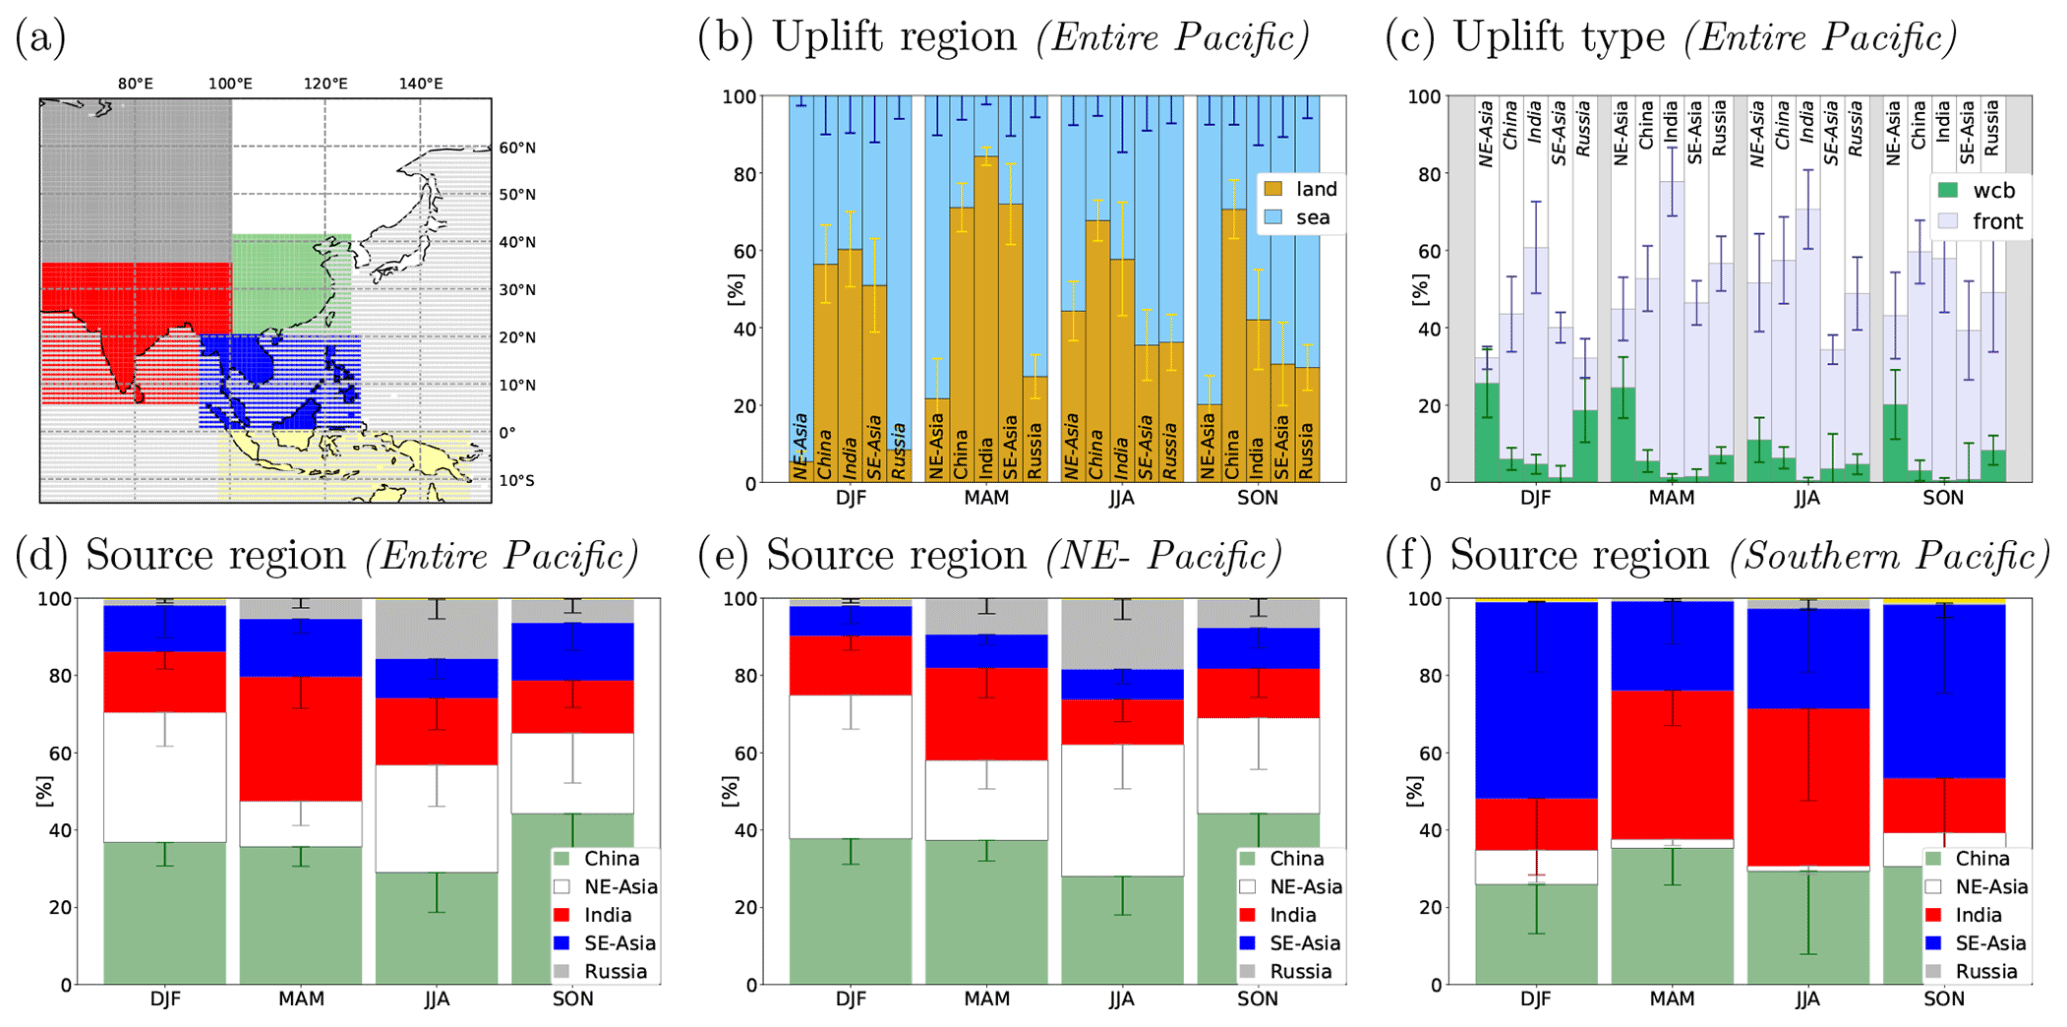
Figure 8CO source regions are shown in (a): China (green), NE Asia (white), India (red), SE Asia (blue), Russia (grey), and Indonesia (yellow). The contribution from Indonesia is very small and almost not visible in the bar charts. All other plots show seasonal statistics [%] of the trajectory calculations. Panel (b) shows the percentage of trajectories that rise over land or sea for each source region. The uplift type is shown in (c). Panels (d)–(f) show the percentage of trajectories from each source region when including all CO maxima over the entire Pacific (d), including only CO maxima north of 45∘ N (e), and including only CO maxima between 0 and 30∘ N (f). Vertical lines show the standard deviation (which is only plotted in the negative direction in panels d–f).
Considering only CO maxima over the NE Pacific (north of 45∘ N, Fig. 8e), China and NE Asia are the dominant CO source regions (the statistics are similar to those for the entire Pacific). However, when only considering CO maxima over the southern NH Pacific (between 0 and 30∘ N), we see a much stronger source contribution from SE Asia (Fig. 8f), especially during winter (50 %) and autumn (45 %), and from India during spring (38.4 %) and summer (40.7 %).
The yellow area covering Indonesia in Fig. 8a) has a source region contribution of less than 1 % and is therefore (almost) not visible in the bar charts in Fig. 8.
Both case studies presented above indicate that pollution plumes reaching a CO maximum over the NE Pacific during winter come from NE Asia and are predominantly lifted into the free troposphere in the warm conveyor belt of a midlatitude cyclone over the Pacific. Statistics including all 19 years of trajectory calculations confirm this result: more than 90 % of all trajectories from NE Asia ascend over the ocean during winter (almost 80 % do so during spring) (Fig. 8b, DJF), and 26 % of those trajectories rise by WCB-type uplift (Fig. 8c, DJF). We found that 90 % of the trajectories that fit our criteria of vertical transport are classified as the WCB type.
The fraction of WCB-related upward transport is much smaller for all other source regions throughout the year. This finding is in agreement with the detailed study by Madonna et al. (2014), who show that by far the largest fraction of trajectories experiencing WCB-type uplift over the Pacific come from NE Asia, especially during winter. This can be explained by the position of a semi-permanent low-pressure system over Japan during winter time (Liang et al., 2005; Madonna et al., 2014). For trajectories from all other source regions, uplift along a front line is the dominant uplift process. The uplift region shows a strong seasonality for all source regions. Only trajectories coming from China are predominantly lifted over land throughout the year (more than 60 %, with a rather small standard deviation; Fig. 8b).
The time between the rise into the free troposphere and the arrival of air masses at the CO cluster is longer for trajectories coming from China (3.7 d DJF, 6.6 d JJA) compared to NE Asia (2.8 d DJF, 5.7 d JJA), corresponding to different uplift regions (land/sea). The residence time in the free troposphere is longer in summer than in winter for all source regions, even though CO maxima are located much closer to the continent during summer compared to winter. It is not surprising that trajectories coming from India have the longest residence time in the free troposphere before reaching the CO maxima site (6.5 d DJF, 9 d JJA).
Upon analysing the global distribution of the highest 2 % of daily CO mixing ratios at 400 hPa derived from MOPITT data for 20 years, we (i) very regularly detect regions with very high CO mixing ratios (i.e. belonging to the globally highest 2 % of values) over the remote NH Pacific. Based on an extended analysis of Lagrangian trajectories in combination with ERA-Interim data, we (ii) conclude that long-range transport events from East Asia are responsible for the observed CO maxima. We (iii) can link the majority of the CO maxima not only to a specific source region but also with a distinct transport and uplift mechanism.
In agreement with the findings by Luan and Jaeglé (2013) and Liang et al. (2004, 2005, 2007), we see a strong seasonality of pollution events over the Pacific, with most CO maxima being observed during spring, followed by winter and summer. Our results further extend the conclusion of the authors cited above, since we analysed the effect of LRT and vertical transport on the composition of the upper troposphere region. Notably, we see a spatial shift of the occurrence of the CO maxima related to different transport pathways, with most events being detected over the north-eastern Pacific during winter, over the central NH Pacific during spring, and over the western NH Pacific during summer.
The contributions of different CO emission regions to the observed upper tropospheric CO plumes change with the season, though China is the major CO source region throughout the year. In relation with uplift in the warm conveyor belt of a midlatitude cyclone, NE Asia is the second most important source region for upper tropospheric CO observed over the north-eastern Pacific, in particular during winter.
In general, we find a correlation between the occurrence of high levels of CO in the upper troposphere over the remote Pacific (e.g. over the Aleutian Peninsula/north-eastern NH Pacific during winter) and the synoptic situation. We can systematically link CO maxima that are found in specific regions over the NH Pacific (e.g. near Alaska) with a specific source region (e.g. NE Asia) and uplift mechanism (e.g. WCB type uplift) which is based on the synoptic situation. However, we find strong differences when comparing individual pollution events in detail (regarding the location of CO maxima; the location, strength, and development of the Aleutian low; the transport time from a CO source region over the continent to the observed location of elevated CO over the Pacific; the location of uplift from the boundary layer to the upper troposphere; the positions and strengths of cyclones leading to uplift; and the residence time in the boundary layer/free troposphere during transport). Even though we describe transport patterns for one of our case studies (21 January 2001, CO maxima cluster over the Aleutian Peninsula) as being rather uniform, the times of uplift of air masses in the vicinity of a midlatitude cyclone into the free troposphere differ by more than 24 h for single trajectories, corresponding to hundreds of kilometres in distance. This is due to the fact that the relevant synoptic systems have a highly variable lifetime as they may exist for several hours or days, thereby travelling over large distances, which results in a broad range of times and distances between source emission and the vertical uplift of potential polluted air masses.
The observations of CO maxima at 400 hPa confirm the crucial role of East Asian emissions in the pollution of the lower upper troposphere/lower stratosphere (UTLS) region. Notably, this also holds for non-monsoon seasons. Our analysis presents evidence for the surprisingly regular and highly frequent occurrence of these long-range transport events. Taking CO as a general marker of pollution and given the regularity of the transport processes, our study highlights the global role of this region for pollution export to the upper troposphere. As these LRT events take place on timescales of less than one week, it is very likely that our findings do not only hold for long-lived trace gases like CO, but also for other trace species and aerosols.
MOPITT data were obtained from https://www2.acom.ucar.edu/mopitt (Deeter et al., 2019). ECMWF (ERA-Interim) data were retrieved from the MARS server. The code from MPTRAC is available from https://github.com/slcs-jsc/mptrac (slcs-jsc, 2022).
The supplement related to this article is available online at: https://doi.org/10.5194/acp-22-7193-2022-supplement.
PH designed the study. LS performed MPTRAC simulations and processed and analysed the data (MPTRAC, MOPITT, ERA-Interim) with input from PH. LS wrote the paper with input from PH.
The contact author has declared that neither they nor their co-authors have any competing interests.
Publisher’s note: Copernicus Publications remains neutral with regard to jurisdictional claims in published maps and institutional affiliations.
The study is a pre-study related to the PHILEAS mission (Probing high Latitude Export from the Asian summer monsoon, HO 4225/17-1) within the HALO-SPP 1294.
This research has been supported by the Deutsche Forschungsgemeinschaft (grant no. HO 4225/13-1).
This open-access publication was funded by Johannes Gutenberg University Mainz.
This paper was edited by Gabriele Stiller and reviewed by three anonymous referees.
Bey, I., Jacob, D. J., Logan, J. A., and Yantosca, R. M.: Asian chemical outflow to the Pacific in spring: Origins, pathways, and budgets, J. Geophys. Res.-Atmos., 106, 23097–23113, https://doi.org/10.1029/2001JD000806, 2001. a
Breeden, M. L., Butler, A. H., Albers, J. R., Sprenger, M., and Langford, A. O.: The spring transition of the North Pacific jet and its relation to deep stratosphere-to-troposphere mass transport over western North America, Atmos. Chem. Phys., 21, 2781–2794, https://doi.org/10.5194/acp-21-2781-2021, 2021. a, b
Chen, Y., Zhao, C., Qiang, Z., Deng, Z., Huang, M., and Ma, X.: Aircraft study of Mountain Chimney Effect of Beijing, China, J. Geophys. Res., 114, 1–10, https://doi.org/10.1029/2008JD010610, 2009. a
Dee, D. P., Uppala, S. M., Simmons, A. J., Berrisford, P., Poli, P., Kobayashi, S., Andrae, U., Balmaseda, M. A., Balsamo, G., Bauer, P., Bechtold, P., Beljaars, A. C. M., van de Berg, L., Bidlot, J., Bormann, N., Delsol, C., Dragani, R., Fuentes, M., Geer, A. J., Haimberger, L., Healy, S. B., Hersbach, H., Hólm, E. V., Isaksen, L., Kållberg, P., Köhler, M., Matricardi, M., McNally, A. P., Monge-Sanz, B. M., Morcrette, J.-J., Park, B.-K., Peubey, C., de Rosnay, P., Tavolato, C., Thépaut, J.-N., and Vitart, F.: The ERA-Interim reanalysis: configuration and performance of the data assimilation system, Q. J. Roy. Meteor. Soc., 137, 553–597, https://doi.org/10.1002/qj.828, 2011. a
Deeter, M., Edwards, D., Gille, J., and Worden, H.: Information content of MOPITT CO profile retrievals: Temporal and geographical variability, J. Geophys. Res.-Atmos., 120, 12723–12738, https://doi.org/10.1002/2015JD024024, 2015. a
Deeter, M. N., Edwards, D. P., Francis, G. L., Gille, J. C., Mao, D., Martínez-Alonso, S., Worden, H. M., Ziskin, D., and Andreae, M. O.: Radiance-based retrieval bias mitigation for the MOPITT instrument: the version 8 product, Atmos. Meas. Tech., 12, 4561–4580, https://doi.org/10.5194/amt-12-4561-2019, 2019 (data available at: https://www2.acom.ucar.edu/mopitt, last access: June 2020). a, b, c
Dickerson, R., Li, C., Li, Z., Marufu, L., Stehr, J., McClure, B., Krotkov, N., Chen, H., Wang, P., Xia, X., Ban, X., and Gong, F.: Aircraft Observations of Dust and Pollutants over NE China: Insight into the Meteorological Mechanisms of Long-Range Transport, J. Geophys. Res., 112, D24S90, https://doi.org/10.1029/2007JD008999, 2007. a
Ding, A., Wang, T., Xue, L., Gao, J., Stohl, A., Lei, H., Jin, D., Ren, Y., Wang, X., Wei, X., Qi, Y., Liu, J., and Zhang, X.: Transport of north China air pollution by midlatitude cyclones: Case study of aircraft measurements in summer 2007, J. Geophys. Res.-Atmos., 114, D08304, https://doi.org/10.1029/2008JD011023, 2009. a
Ding, K., Liu, J., Ding, A., Liu, Q., Zhao, T. L., Shi, J., Han, Y., Wang, H., and Jiang, F.: Uplifting of carbon monoxide from biomass burning and anthropogenic sources to the free troposphere in East Asia, Atmos. Chem. Phys., 15, 2843–2866, https://doi.org/10.5194/acp-15-2843-2015, 2015. a
Di Pierro, M., Jaeglé, L., and Anderson, T. L.: Satellite observations of aerosol transport from East Asia to the Arctic: three case studies, Atmos. Chem. Phys., 11, 2225–2243, https://doi.org/10.5194/acp-11-2225-2011, 2011. a
Eckhardt, S., Stohl, A., Wernli, H., James, P., Forster, C., and Spichtinger, N.: A 15-Year Climatology of Warm Conveyor Belts, J. Climate, 17, 218–237, 2004. a
Garny, H. and Randel, W. J.: Transport pathways from the Asian monsoon anticyclone to the stratosphere, Atmos. Chem. Phys., 16, 2703–2718, https://doi.org/10.5194/acp-16-2703-2016, 2016. a
Gehring, J., Oertel, A., Vignon, É., Jullien, N., Besic, N., and Berne, A.: Microphysics and dynamics of snowfall associated with a warm conveyor belt over Korea, Atmos. Chem. Phys., 20, 7373–7392, https://doi.org/10.5194/acp-20-7373-2020, 2020. a
Han, H., Liu, J., Yuan, H., Jiang, F., Zhu, Y., Wu, Y., Wang, T., and Zhuang, B.: Impacts of Synoptic Weather Patterns and their Persistency on Free Tropospheric Carbon Monoxide Concentrations and Outflow in Eastern China, J. Geophys. Res.-Atmos., 123, 7024–7046, https://doi.org/10.1029/2017JD028172, 2018. a
Hannan, J., Fuelberg, H., Crawford, J., Sachse, G., and Blake, D.: The Role of Wave Cyclones in Transporting Boundary Layer Air to the Free Troposphere During the Spring 2001 NASA / TRACE-P Experiment, J. Geophys. Res.-Atmos., 108, 8785, https://doi.org/10.1029/2002JD003105, 2003. a
Heald, C., Jacob, D., Fiore, A., Emmons, L., Gille, J., Deeter, M., Warner, J., Edwards, D., Crawford, J., Hamlin, A., Sachse, G., and Browell, E.: Asian outflow and trans-Pacific transport of carbon monoxide and ozone pollution: An integrated satellite, aircraft and model perspective, J. Geophys. Res., 108, 4804, https://doi.org/10.1029/2003JD003507, 2003. a, b, c
Hoffmann, L., Rößler, T., Griessbach, S., Heng, Y., and Stein, O.: Lagrangian transport simulations of volcanic sulfur dioxide emissions: Impact of meteorological data products, J. Geophys. Res.-Atmos., 121, 4651–4673, https://doi.org/10.1002/2015JD023749, 2016. a
Holzer, M., Hall, T., and Stull, R.: Seasonality and weather-driven variability of transpacific transport, J. Geophys. Res., 110, D23103, https://doi.org/10.1029/2005JD006261, 2005. a, b, c
Hu, Z., Huang, J., Zhao, C., Ma, Y., Jin, Q., Qian, Y., Leung, L. R., Bi, J., and Ma, J.: Trans-Pacific transport and evolution of aerosols: spatiotemporal characteristics and source contributions, Atmos. Chem. Phys., 19, 12709–12730, https://doi.org/10.5194/acp-19-12709-2019, 2019. a
Kaneyasu, N., Takeuchi, K., Hayashi, M., Fujita, S.-i., Uno, I., and Sasaki, H.: Outflow patterns of pollutants from East Asia to the North Pacific in the winter monsoon, J. Geophys. Res., 105, 17361–17378, https://doi.org/10.1029/2000JD900138, 2000. a
Kiley, C. and Fuelberg, H.: An examination of summertime cyclone transport processes during Intercontinental Chemical Transport Experiment (INTEX-A), J. Geophys. Res, 111, 24–6, https://doi.org/10.1029/2006JD007115, 2006. a, b
Klich, C. A. and Fuelberg, H. E.: The role of horizontal model resolution in assessing the transport of CO in a middle latitude cyclone using WRF-Chem, Atmos. Chem. Phys., 14, 609–627, https://doi.org/10.5194/acp-14-609-2014, 2014. a
Knippertz, P. and Wernli, H.: A Lagrangian Climatology of Tropical Moisture Exports to the Northern Hemispheric Extratropics, J. Climate, 23, 987–1003, https://doi.org/10.1175/2009JCLI3333.1, 2010. a
Lamarque, J.-F., Bond, T. C., Eyring, V., Granier, C., Heil, A., Klimont, Z., Lee, D., Liousse, C., Mieville, A., Owen, B., Schultz, M. G., Shindell, D., Smith, S. J., Stehfest, E., Van Aardenne, J., Cooper, O. R., Kainuma, M., Mahowald, N., McConnell, J. R., Naik, V., Riahi, K., and van Vuuren, D. P.: Historical (1850–2000) gridded anthropogenic and biomass burning emissions of reactive gases and aerosols: methodology and application, Atmos. Chem. Phys., 10, 7017–7039, https://doi.org/10.5194/acp-10-7017-2010, 2010. a
Lawrence, M. G. and Salzmann, M.: On interpreting studies of tracer transport by deep cumulus convection and its effects on atmospheric chemistry, Atmos. Chem. Phys., 8, 6037–6050, https://doi.org/10.5194/acp-8-6037-2008, 2008. a, b
Lawrence, M. G. and Lelieveld, J.: Atmospheric pollutant outflow from southern Asia: a review, Atmos. Chem. Phys., 10, 11017–11096, https://doi.org/10.5194/acp-10-11017-2010, 2010. a
Lelieveld, J., Bourtsoukidis, E., Brühl, C., Fischer, H., Fuchs, H., Harder, H., Hofzumahaus, A., Holland, F., Marno, D., Neumaier, M., Pozzer, A., Schlager, H., Williams, J., Zahn, A., and Ziereis, H.: The South Asian monsoon–pollution pump and purifier, Science, 361, 270–273, https://doi.org/10.1126/science.aar2501, 2018. a, b
Liang, Q., Jaeglé, L., Jaffe, D., Weiss, P., Heckman, A., and Snow, J.: Long-range transport of Asian pollution to the northeast Pacific: Seasonal variations and transport pathways of carbon monoxide, J. Geophys. Res., 109, D23S07, https://doi.org/10.1029/2003JD004402, 2004. a, b, c, d, e, f, g, h
Liang, Q., Jaeglé, L., and Wallace, J. M.: Meteorological indices for Asian outflow and transpacific transport on daily to interannual timescales, J. Geophys. Res.-Atmos., 110, D18308, https://doi.org/10.1029/2005JD005788, 2005. a, b, c, d, e, f
Liang, Q., Jaeglé, L., Hudman, R., Turquety, S., Jacob, D., Avery, M., Browell, E., Sachse, G., Blake, D., Brune, W., Ren, X., Cohen, R., Dibb, J., Fried, A., Fuelberg, H., Porter, M., Heikes, B., Huey, G., Singh, H., and Wennberg, P.: Summertime influence of Asian pollution in the free troposphere over North America, J. Geophys. Res.-Atmos., 112, D12S11, https://doi.org/10.1029/2006JD007919, 2007. a, b
Liu, J., Drummond, J., Jones, D., Cao, Z., Bremer, H., Kar, J., Zou, J., Florian, N., and Gille, J.: Large horizontal gradients in atmospheric CO at the synoptic scale as seen by spaceborne Measurements of Pollution in the Troposphere, J. Geophys. Res., 111, D02306, https://doi.org/10.1029/2005JD006076, 2006. a
Luan, Y. and Jaeglé, L.: Composite study of aerosol export events from East Asia and North America, Atmos. Chem. Phys., 13, 1221–1242, https://doi.org/10.5194/acp-13-1221-2013, 2013. a, b, c, d, e, f, g
Madonna, E., Wernli, H., Joos, H., and Martius, O.: Warm Conveyor Belts in the ERA-Interim Dataset (1979–2010). Part I: Climatology and Potential Vorticity Evolution, J. Climate, 27, 3–26, https://doi.org/10.1175/JCLI-D-12-00720.1, 2014. a, b, c, d, e, f, g, h, i, j, k
Matsui, H., Kondo, Y., Moteki, N., Takegawa, N., Sahu, L. K., Zhao, Y., Fuelberg, H. E., Sessions, W. R., Diskin, G., Blake, D. R., Wisthaler, A., and Koike, M.: Seasonal variation of the transport of black carbon aerosol from the Asian continent to the Arctic during the ARCTAS aircraft campaign, J. Geophys. Res.-Atmos., 116, D05202, https://doi.org/10.1029/2010JD015067, 2011. a
Müller, S., Hoor, P., Bozem, H., Gute, E., Vogel, B., Zahn, A., Bönisch, H., Keber, T., Krämer, M., Rolf, C., Riese, M., Schlager, H., and Engel, A.: Impact of the Asian monsoon on the extratropical lower stratosphere: trace gas observations during TACTS over Europe 2012, Atmos. Chem. Phys., 16, 10573–10589, https://doi.org/10.5194/acp-16-10573-2016, 2016. a, b
Ninomiya, K. and Shibagaki, Y.: Multi-Scale Features of the Meiyu-Baiu Front and Associated Precipitation Systems, J. Meteorol. Soc. Jpn., 85B, 103–122, https://doi.org/10.2151/jmsj.85B.103, 2007. a
Reidmiller, D. R., Jaffe, D. A., Fischer, E. V., and Finley, B.: Nitrogen oxides in the boundary layer and free troposphere at the Mt. Bachelor Observatory, Atmos. Chem. Phys., 10, 6043–6062, https://doi.org/10.5194/acp-10-6043-2010, 2010. a
Roiger, A., Schlager, H., Schäfler, A., Huntrieser, H., Scheibe, M., Aufmhoff, H., Cooper, O. R., Sodemann, H., Stohl, A., Burkhart, J., Lazzara, M., Schiller, C., Law, K. S., and Arnold, F.: In-situ observation of Asian pollution transported into the Arctic lowermost stratosphere, Atmos. Chem. Phys., 11, 10975–10994, https://doi.org/10.5194/acp-11-10975-2011, 2011. a
Santee, M. L., Manney, G. L., Livesey, N. J., Schwartz, M. J., Neu, J. L., and Read, W. G.: A comprehensive overview of the climatological composition of the Asian summer monsoon anticyclone based on 10 years of Aura Microwave Limb Sounder measurements, J. Geophys. Res.-Atmos., 122, 5491–5514, https://doi.org/10.1002/2016JD026408, 2017. a
Schemm, S., Sprenger, M., and Wernli, H.: When during their life cycle are extratropical cyclones attended by fronts?, B. Am. Meteorol. Soc., 99, 149–165, https://doi.org/10.1175/BAMS-D-16-0261.1, 2017. a
slcs-jsc: mptrac, GitHub, https://github.com/slcs-jsc/mptrac#readme, last access: May 2022. a
Thomas, C. and Schultz, D.: What are the Best Thermodynamic Quantity and Function to Define a Front in Gridded Model Output?, B. Am. Meteorol. Soc., 100, 873–895, https://doi.org/10.1175/BAMS-D-18-0137.1, 2018. a
Tomsche, L., Pozzer, A., Ojha, N., Parchatka, U., Lelieveld, J., and Fischer, H.: Upper tropospheric CH4 and CO affected by the South Asian summer monsoon during the Oxidation Mechanism Observations mission, Atmos. Chem. Phys., 19, 1915–1939, https://doi.org/10.5194/acp-19-1915-2019, 2019. a
Turquety, S., Clerbaux, C., Law, K., Coheur, P.-F., Cozic, A., Szopa, S., Hauglustaine, D. A., Hadji-Lazaro, J., Gloudemans, A. M. S., Schrijver, H., Boone, C. D., Bernath, P. F., and Edwards, D. P.: CO emission and export from Asia: an analysis combining complementary satellite measurements (MOPITT, SCIAMACHY and ACE-FTS) with global modeling, Atmos. Chem. Phys., 8, 5187–5204, https://doi.org/10.5194/acp-8-5187-2008, 2008. a
Vogel, B., Günther, G., Müller, R., Grooß, J.-U., Hoor, P., Krämer, M., Müller, S., Zahn, A., and Riese, M.: Fast transport from Southeast Asia boundary layer sources to northern Europe: rapid uplift in typhoons and eastward eddy shedding of the Asian monsoon anticyclone, Atmos. Chem. Phys., 14, 12745–12762, https://doi.org/10.5194/acp-14-12745-2014, 2014. a
Vogel, B., Günther, G., Müller, R., Grooß, J.-U., Afchine, A., Bozem, H., Hoor, P., Krämer, M., Müller, S., Riese, M., Rolf, C., Spelten, N., Stiller, G. P., Ungermann, J., and Zahn, A.: Long-range transport pathways of tropospheric source gases originating in Asia into the northern lower stratosphere during the Asian monsoon season 2012, Atmos. Chem. Phys., 16, 15301–15325, https://doi.org/10.5194/acp-16-15301-2016, 2016. a
Wernli, H.: A lagrangian-based analysis of extratropical cyclones. II: A detailed case-study, Q. J. Roy. Meteor. Soc., 123, 1677–1706, https://doi.org/10.1002/qj.49712354211, 1997. a
Wernli, H. and Davies, H.: A Lagrangian-based analysis of extratropical cyclones. I: The method and some applications, Q. J. Roy. Meteor. Soc., 123, 467–489, https://doi.org/10.1002/qj.49712353811, 1997. a
Wernli, H. and Schwierz, C.: Surface Cyclones in the ERA-40 Dataset (1958–2001). Part I: Novel Identification Method and Global Climatology, J. Atmos. Sci., 63, 2486–2507, https://doi.org/10.1175/JAS3766.1, 2006. a
Wilcox, L., Hoskins, B., and Shine, K.: A global blended tropopause based on ERA data. Part I: Climatology, Q. J. Roy. Meteor. Soc., 138, 561–575, https://doi.org/10.1002/qj.951, 2012. a
Wuebbles, D. J., Lei, H., and Lin, J.: Intercontinental transport of aerosols and photochemical oxidants from Asia and its consequences, Environ. Pollut., 150, 65–84, https://doi.org/10.1016/j.envpol.2007.06.066, 2007. a
Yienger, J., Hastings, M., Holloway, T., Phadnis, M., Guttikunda, S., Carmichael, G., Moxim, W., and Levy, H.: The Episodic Nature of Air Pollution Transport From Asia to North America, J. Geophys. Res., 105, 26931–26946, https://doi.org/10.1029/2000JD900309, 2000. a
Yihui, D. and Chan, J.: The East Asian summer monsoon: An overview, Meteorol. Atmos. Phys., 89, 117–142, https://doi.org/10.1007/s00703-005-0125-z, 2005. a
Yoon, J., Pozzer, A., Hoor, P., Chang, D. Y., Beirle, S., Wagner, T., Schloegl, S., Lelieveld, J., and Worden, H. M.: Technical Note: Temporal change in averaging kernels as a source of uncertainty in trend estimates of carbon monoxide retrieved from MOPITT, Atmos. Chem. Phys., 13, 11307–11316, https://doi.org/10.5194/acp-13-11307-2013, 2013. a
Yu, H., Remer, L., Chin, M., Bian, H., Kleidman, R., and Diehl, T.: A satellite-based assessment of transpacific transport of pollution aerosol, J. Geophys. Res., 113, D14S12, https://doi.org/10.1029/2007JD009349, 2008. a, b, c
Yu, P., Rosenlof, K. H., Liu, S., Telg, H., Thornberry, T. D., Rollins, A. W., Portmann, R. W., Bai, Z., Ray, E. A., Duan, Y., Pan, L. L., Toon, O. B., Bian, J., and Gao, R.-S.: Efficient transport of tropospheric aerosol into the stratosphere via the Asian summer monsoon anticyclone, P. Natl. Acad. Sci. USA, 114, 6972–6977, https://doi.org/10.1073/pnas.1701170114, 2017. a
Yu, Y., Kalashnikova, O. V., Garay, M. J., and Notaro, M.: Climatology of Asian dust activation and transport potential based on MISR satellite observations and trajectory analysis, Atmos. Chem. Phys., 19, 363–378, https://doi.org/10.5194/acp-19-363-2019, 2019. a
Zhang, L., Jacob, D. J., Boersma, K. F., Jaffe, D. A., Olson, J. R., Bowman, K. W., Worden, J. R., Thompson, A. M., Avery, M. A., Cohen, R. C., Dibb, J. E., Flock, F. M., Fuelberg, H. E., Huey, L. G., McMillan, W. W., Singh, H. B., and Weinheimer, A. J.: Transpacific transport of ozone pollution and the effect of recent Asian emission increases on air quality in North America: an integrated analysis using satellite, aircraft, ozonesonde, and surface observations, Atmos. Chem. Phys., 8, 6117–6136, https://doi.org/10.5194/acp-8-6117-2008, 2008. a, b, c