the Creative Commons Attribution 4.0 License.
the Creative Commons Attribution 4.0 License.
 | 02 Jun 2022
Fast climate responses to emission reductions in aerosol and ozone precursors in China during 2013–2017
Jiyuan Gao
Hailong Wang
Pinya Wang
Huimin Li
Mengyun Li
Lili Ren
Hong Liao
China has been implementing a sequence of policies for clean air since the year 2013, and the aerosol pollution has been substantially improved, but ozone (O3)-related issues arose. Here, fast climate responses to emission reductions in aerosol and O3 precursors over China during 2013–2017 are investigated using the Community Earth System Model version 2 (CESM2). The overall decreases in aerosols produced an anomalous warming of 0.09 ± 0.10∘C in eastern China (22–40∘ N, 110–122.5∘ E), which is further intensified by the increase in O3 in the lower troposphere, resulting in an enhanced warming of 0.16 ± 0.15 ∘C in eastern China. Reductions in industrial emissions contributed the most to the aerosol-induced warming, while emission reductions from residential sector induced a cooling effect due to a substantial decrease in light-absorbing black carbon aerosols. This implies that switching the residential sector to cleaner energy is more effective to achieve climate and health benefits in China.
- Article
(6512 KB) - Full-text XML
-
Supplement
(1887 KB) - BibTeX
- EndNote


Aerosol and tropospheric ozone (O3) are two of the most critical air pollutants in the atmosphere, and they have adverse effects on the environment, human health, and ecosystems (Yang et al., 2014, 2017a). Due to increases in anthropogenic emissions associated with industrial development and economic growth (Zheng et al., 2018) and the intensification of unfavorable meteorological conditions (Yang et al., 2016), aerosol concentrations in China have dramatically escalated over the past several decades. To mitigate the serious air pollution, China issued the Air Pollution Prevention and Control Action Plan in 2013 (Clean Air Alliance of China, 2013), in which a decrease in PM2.5 (particulate matter with diameter less than 2.5 µm) by 15 %–25 % by the year 2017, compared to 2013, was proposed for various regions of China. The emissions of major air pollutants and precursors have been reduced since then, and aerosol concentrations have substantially decreased across China (H. Li et al., 2021). In 74 key cities in China, the annual average of observed PM2.5 concentrations decreased by 33.3 % from 2013 to 2017 (Huang et al., 2018). However, as the aerosol decreased, surface O3 pollution was getting worse partly because the decrease in aerosols slowed down the sink of hydroperoxy radicals and thus stimulated O3 production (K. Li et al., 2019). As also indicated from observations, the near-surface O3 concentration increased by approximately 20 % in China during 2013–2017 (Huang et al., 2018; Lu et al., 2018).
Both aerosols and O3 play crucial roles in climate (Charlson et al., 1992; Chen et al., 2019; Koch et al., 2011; B. Li et al., 2016; Shindell et al., 2008; Xie et al., 2018; Yang et al., 2019, 2020). Through interacting with radiation and clouds, aerosols affect regional and global climate (Albrecht, 1989; Chen et al., 2010; Yang et al., 2017a, b). Effective radiative forcing (ERF) quantifies the energy gained or lost by the Earth system following imposed perturbation and includes the instantaneous forcing plus adjustments from the atmosphere and surface (Smith et al., 2020). According to Forster et al. (2021), the total global aerosol ERF at the top of the atmosphere (TOA) estimated for 2019 relative to 1750 is −1.1 (−1.7 to −0.4) W m−2, with −0.22 (−0.47 to 0.04) W m−2 attributed to aerosol–radiation interactions and −0.84 (−1.45 to −0.25) W m−2 from the aerosol–cloud interactions. O3 has been recognized as one of the main contributors to radiative forcing, which exerts a global ERF of 0.47 (0.24 to 0.71) W m−2. Tropospheric O3 is a greenhouse gas and contributes the most to the O3 ERF. According to their ERF, aerosols and O3 changes from 1750 to 2019 induced a −0.50 (−0.22 to −0.96)∘C cooling and a 0.23 (0.11 to 0.39)∘C warming, respectively, to the global surface air temperature (Forster et al., 2021).
Given that aerosol and O3 are important short-lived climate forcers, a reduction in emissions of air pollutants for clean air always comes with climate consequences. The climate effects have been demonstrated in North America and Europe during the past decades when clean air actions were taken (Leibensperger et al., 2012a, b; Turnock et al., 2015). Reductions in aerosol emissions in the US exerted a direct radiative forcing (DRF) by 0.8 W m−2 and an indirect radiative forcing (IRF) by 1.0 W m−2 over eastern US, resulting in a 0.35 ∘C warming between 1980 and 2010 (Leibensperger et al., 2012a,b). Similarly, decreases in aerosols resulted in a DRF of 1.26 W m−2 over Europe between the 1980s and 2000s, and increases in O3 exerted a radiative forcing of 0.05 W m−2 in the meanwhile (Pozzoli et al., 2011). The clean air actions in Europe have been estimated to have warmed the surface air by 0.45 ± 0.11 ∘C between 1970 and 2010 (Turnock et al., 2015). Note that the radiative forcing (RF) in these studies only includes the adjustment due to stratospheric temperature change, while ERF consists of all tropospheric and land surface adjustments and has been commonly used recently.
The clean air actions in China have been reported to potentially affect radiative balance and regional climate in recent studies. Dang and Liao (2019) found that the reductions in aerosols led to a regional mean DRF of 1.18 W m−2 over eastern China in 2017 relative to 2012 using the chemical transport model GEOS-Chem. Zheng et al. (2020) also reported that the decrease in aerosol emissions in China from 2006 to 2017 exerted an anomalous ERF of 0.48 ± 0.11 W m−2 and further caused a warming of 0.12 ± 0.02 ∘C in East Asia. Along with the decline in aerosols, O3 concentrations also changed due to the clean air actions. The combined impacts of aerosol and O3 changes on regional climate over China associated with clean air actions have not been studied. In addition, for the physical basis of climate policy decision-making, it is valuable to know the relative roles of the sectoral sources contributing to the aerosol-induced climate change.
In this study, we examine the fast climate responses to emission reductions in air pollutants over China due to clean air actions from 2013 to 2017, with the consideration of both aerosols and O3 changes, using the Community Earth System Model version 2 (CESM2) with its atmospheric component Community Atmosphere Model version 6 (CAM6). The climate impacts of aerosol emission reductions from individual sectors are also investigated through emission perturbation experiments.
In this study, we perform simulations using CAM6, the atmospheric component of CESM2, with a horizontal resolution of 0.9∘ latitude × 1.25∘ longitude and 32 vertical layers (Danabasoglu et al., 2020). In CAM6 major aerosol species, including sulfate (SO), black carbon (BC), primary organic matter (POM), secondary organic aerosol (SOA), mineral dust, and sea salt, are represented by a modal aerosol scheme (Liu et al., 2016) with four lognormal modes (i.e., Aitken, accumulation, coarse, and primary carbon modes). PM2.5 is calculated as the sum of SO, BC, POM, and SOA in this study. A comprehensive consideration of aerosol–radiation, O3–radiation, and aerosol–cloud interactions is included in the model. The Morrison–Gettelman cloud microphysics scheme version 2 (MG2; Gettelman and Morrison, 2015) is applied to forecast mass and number concentrations of rain and snow. The mixed-phase ice nucleation depending on aerosols is also included (Hoose et al., 2010; Wang et al., 2014). The radiation transfer scheme uses the rapid radiative transfer model for general circulation models (RRTMG; Iacono et al., 2008). The ozone mixing ratio is prescribed for use in radiative transfer calculations. The ERF is decomposed into the forcing induced by aerosol–radiation interactions and aerosol–cloud interactions in this study based on the method proposed by Ghan et al. (2013) with an additional call to the radiation calculation.
Global three-dimensional tropospheric monthly O3 concentrations below 450 hPa for the years 2013 and 2017 are adopted from simulations using GEOS-Chem model v12.9.3, considering that it has a good performance in simulating O3 concentration changes during 2013–2017 (K. Li et al., 2019, 2021). GEOS-Chem is a global model of atmospheric chemistry with fully coupled O3–NOx–hydrocarbon–aerosol chemical mechanisms, which has a horizontal resolution of 2∘ latitude × 2.5∘ longitude and 47 vertical layers driven by the MERRA-2 (Modern-Era Retrospective Analysis for Research and Applications version 2) meteorological fields. The model simulations in 2013 and 2017 with a 1-year spin-up use the same aerosol and precursor gas emissions as used in CAM6, and the results are interpolated to the same resolution as in CAM6. The details of the GEOS-Chem model simulations can be found in H. Li et al. (2022) and Yang et al. (2022). Note that the GEOS-Chem model presents a strong decrease in O3 concentrations in the upper troposphere between 2013 and 2017 which is mainly attributed to the varying meteorological fields between 2013 and 2017. To minimize the impacts from the changes in meteorology, only O3 data below 450 hPa from GEOS-Chem are used in CESM2 simulations while keeping O3 above 450 hPa unchanged, and they are implemented by cycling the 1-year data as monthly climatological mean.
Default anthropogenic and open-biomass-burning emissions of aerosols, aerosol precursors, and O3 precursors are obtained from the CMIP6 (the Coupled Model Intercomparison Project Phase 6) (Hoesly et al., 2018; van Marle et al., 2017). Because CMIP6 emissions did not fully consider the emission reductions from clean air actions in China (Wang et al., 2021), anthropogenic emissions in China are replaced by the Multi-resolution Emission Inventory of China (MEIC) (Zheng et al., 2018) in both CESM2–CAM6 and GEOS-Chem simulations. The anthropogenic emission changes between 2013 and 2017 are shown in Fig. 1. Biogenic emissions are from the Model of Emissions of Gases and Aerosols from Nature version 2.1 (MEGAN v2.1; Guenther et al., 2012). All CAM6 experiments are forced by climatological mean sea surface temperatures (SSTs) and sea ice concentrations at the year 2000 to characterize fast climate responses to the changes in air pollutants. Simulations are run for 20 years, with the last 15 years used in our analysis.
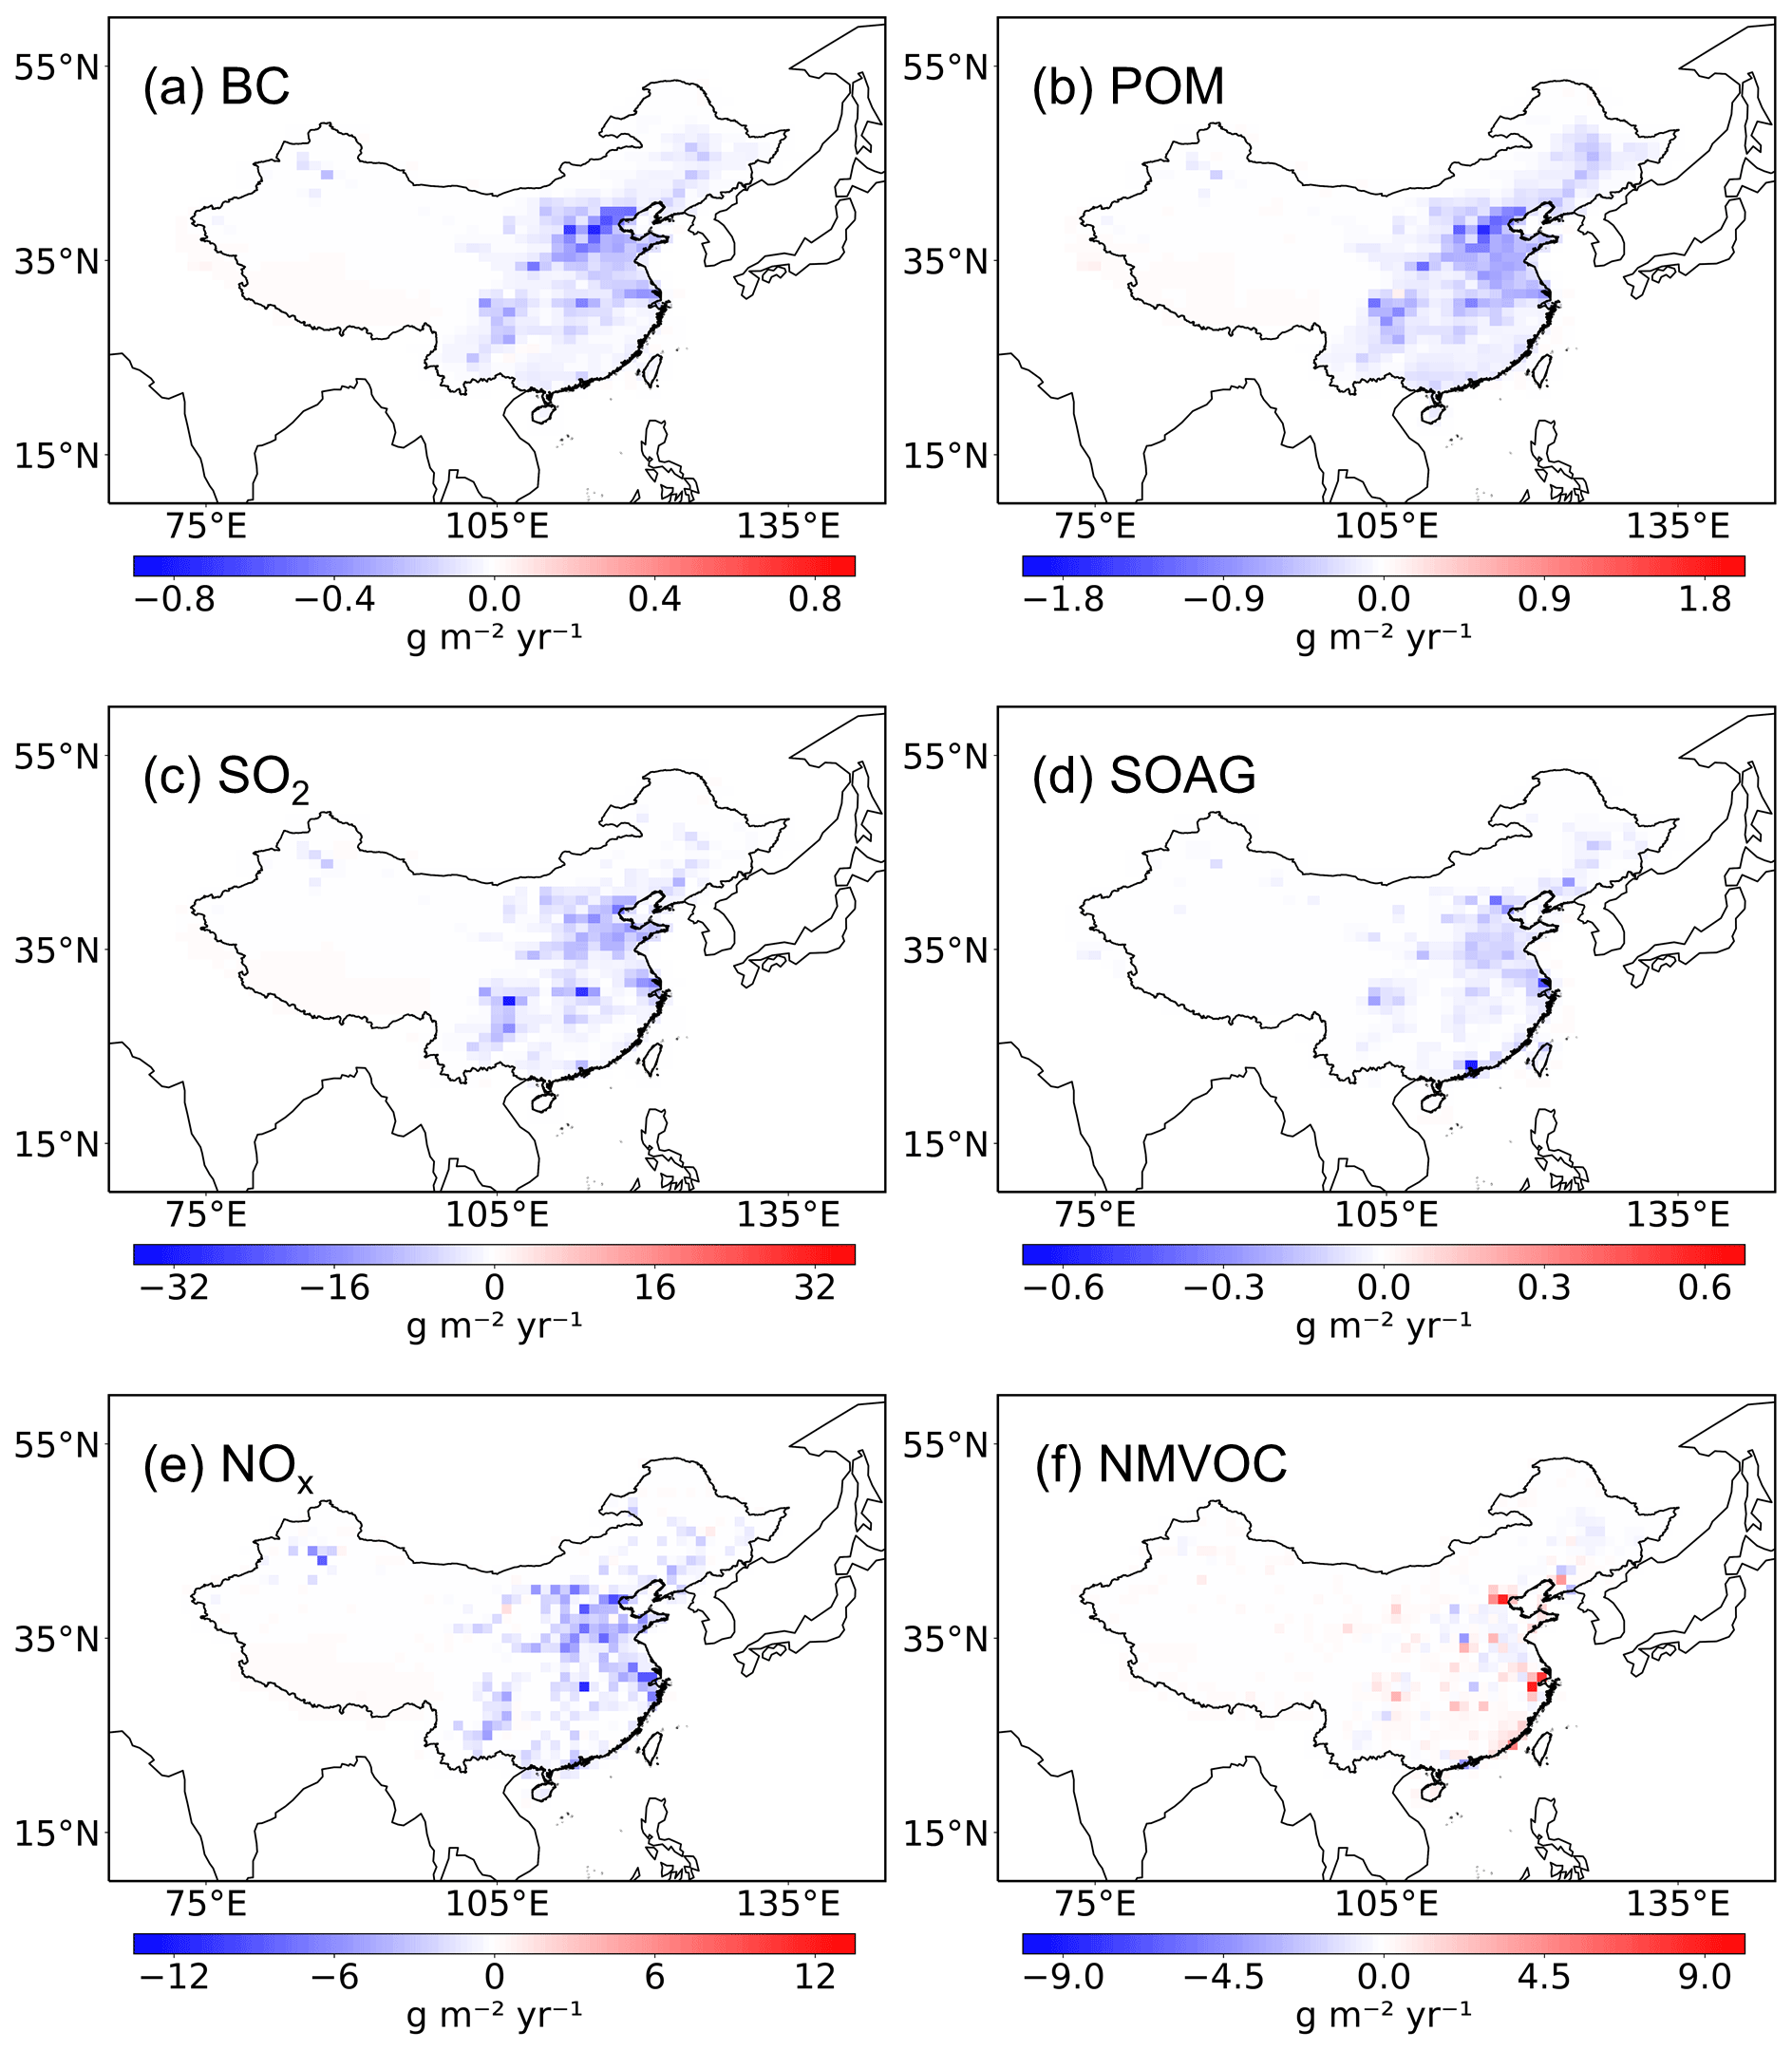
Figure 1Spatial distributions of emission differences of aerosol, aerosol precursors, and ozone precursors including black carbon (BC), primary organic matter (POM), sulfur dioxide (SO2), secondary organic aerosol gas (SOAG), nitrogen oxides (NOx), and non-methane volatile organic compounds (NMVOCs) between 2013 and 2017 (2017 minus 2013). The anthropogenic emission data are derived from MEIC.
To investigate how climate was changed by aerosol and O3 variations and sectoral contributions to aerosol-induced regional climate change during 2013–2017, the following experiments are conducted with CESM2–CAM6.
-
Base. Global anthropogenic and natural emissions of aerosols and precursors and O3 concentrations are fixed at the year 2013.
-
AClean. It is the same as Base, but anthropogenic emissions of aerosols and precursors over China are fixed at the year 2017.
-
AClean_O3. It is the same as Base, but both anthropogenic emissions of aerosols and precursors and tropospheric O3 concentrations over China are fixed at the year 2017.
-
AClean_ENE/IND/RCO/TRA/SLV/WST/SHP. It is the same as Base, but anthropogenic emissions of aerosols and their precursors from an individual sector, i.e., energy transformation and extraction (ENE), industrial combustion and processes (IND), residential, commercial, and other (RCO), surface transportation (TRA), solvents (SLV), waste disposal and handling (WST), or international shipping (SHP), over China are fixed at the year 2017.
The difference between Base and AClean is attributed to the impacts of aerosol emission reductions in China from 2013 to 2017, and the difference between Base and AClean_O3 illustrates the combined effects of aerosol emission reductions and changes in tropospheric O3 concentrations in China from 2013 to 2017. In addition, the comparison between Base and AClean_ENE/IND/RCO/TRA/SLV/WST/SHP quantifies the influences of aerosol emission reductions from the corresponding sector.
Hourly observations of PM2.5 and O3 concentrations across China between 2013 and 2017 derived from the China National Environmental Monitoring Centre (CNEMC) are applied to evaluate the model performance. The observations cover both urban and rural sites.
To evaluate the model performance in simulating the changes in aerosol concentrations in China, Fig. 2a compares the 2013-to-2017 changes in annual mean surface concentrations of PM2.5 between model simulations and ground measurements. The observed PM2.5 reduced tremendously over eastern China, with maximum decreases exceeding 30 µg m−3. CAM6 can reproduce the changes in spatial distribution of PM2.5 concentrations but strongly underestimates the magnitude of the concentration decreases with maximum decreases in the range of 12–18 µg m−3. The low biases in CAM6 are caused by many factors including strong aerosol wet removal, uncertainties in new particle formation, coarse model resolution in global climate models, and the uncertainty of anthropogenic emissions of aerosols and precursor gases, which have been reported in many previous studies (Yang et al., 2017a, b; Zeng et al., 2021; Ren et al., 2021; Fan et al., 2018, 2022). The model generally captures the percentage decreases in PM2.5 concentrations by about 20 %–40 % in seven subregions over central-eastern China (Fig. 2c).
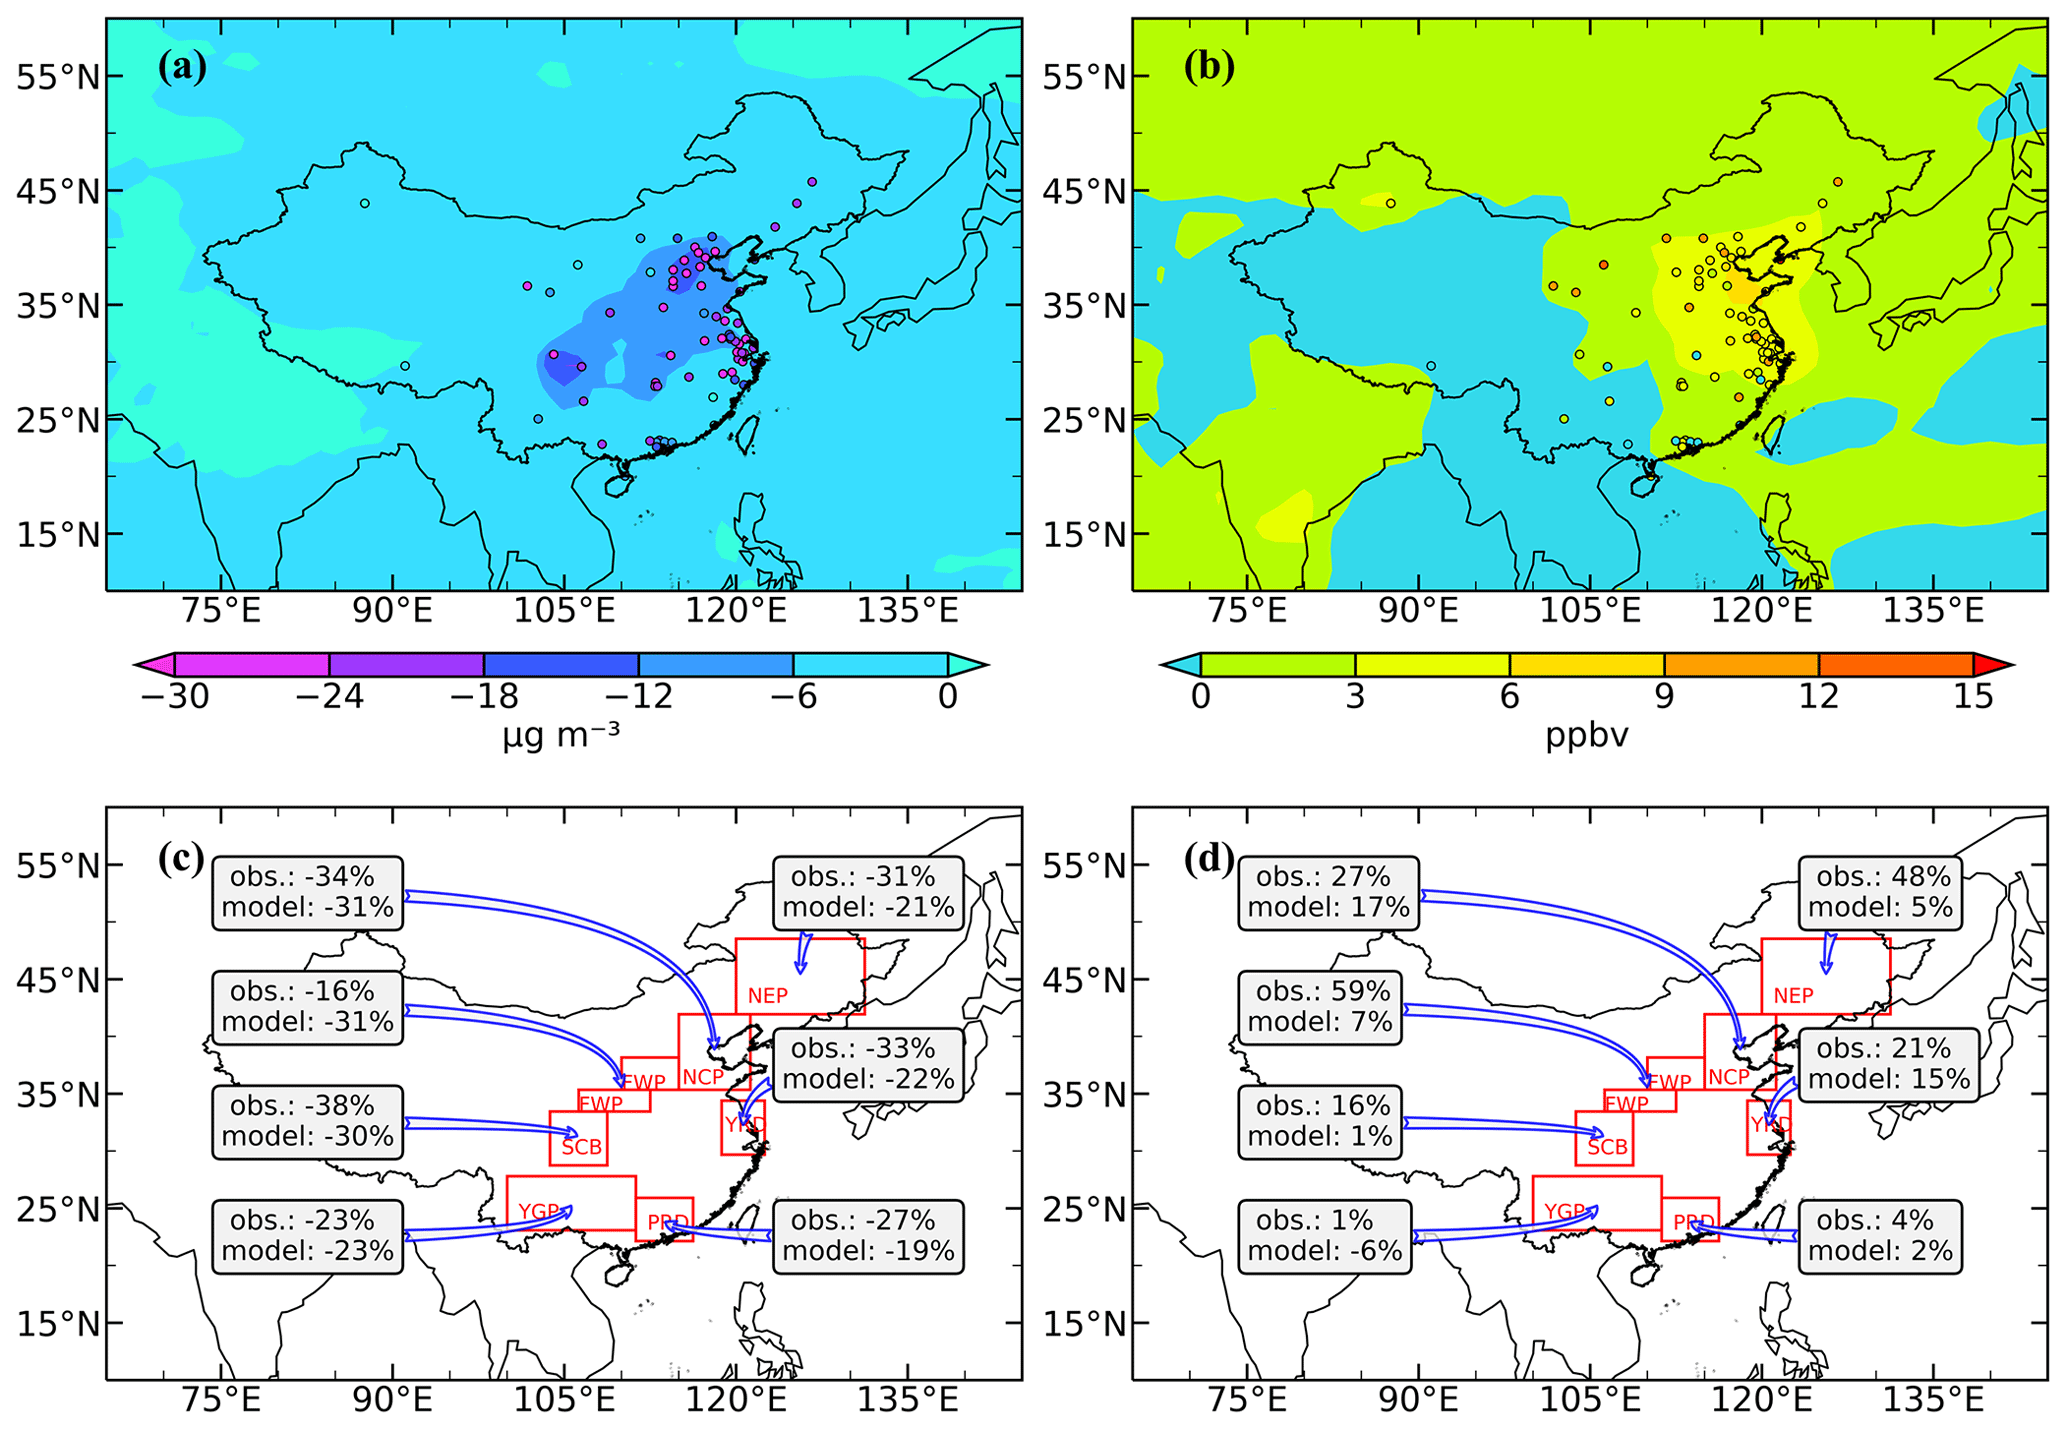
Figure 2Spatial distributions of differences in observed (obs., circles) and simulated (model, shades) annual mean near-surface (a) PM2.5 (µg m−3) and (b) O3 (ppbv) concentrations over China between 2013 and 2017 (2017–2013) and (c, d) the percentage changes averaged over seven subregions of China, including the North China Plain (NCP; 35–41∘ N, 114–120∘ E), Sichuan Basin (SCB; 28–33∘ N, 103–108∘ E), Yangtze River Delta (YRD; 29–34∘ N, 118–121.5∘ E), Pearl River Delta (PRD; 21.5–25∘ N, 111–116∘ E), Northeast Plain (NEP; 41–48∘ N, 120–130∘ E), the Yunnan–Guizhou Plateau (YGP; 23–27∘ N, 100–110∘ E), and the Fenwei Plain (FWP; 33–35∘ N, 106–112∘ E and 35–38∘ N, 110–114∘ E). The modeled changes in PM2.5 and O3 are the differences between Base and AClean simulations (AClean–Base) and between AClean and AClean_O3 (AClean_O3–AClean), respectively. Modeled PM2.5 data are from CESM2 simulations in (a) and (c), and modeled O3 data are from GEOS-Chem simulations in (b) and (d).
Accompanying the decreases in aerosols, annual mean near-surface O3 concentrations increased in eastern China from 2013 to 2017. The GEOS-Chem model catches the maximum increases of more than 12 ppb (parts per billion) (15 %–30 %) over the North China Plain (NCP) and Yangtze River Delta (YRD) (Fig. 2b and d), but it underestimates the O3 increases in other regions of China. The aerosol optical depth in central-eastern China also decreased from 2013 to 2017 in both model simulations and satellite retrievals, although the model still underestimates the decrease in satellite data (Fig. S1 in the Supplement). In general, the models can reasonably reproduce the PM2.5 decreases and O3 increases in China, which gives us the confidence in simulating climate impacts of emission reductions in air pollutants over China during 2013–2017. However, the larger changes in PM2.5 and O3 in observations than in model simulations imply underestimated climate responses to the emission reductions in this study.
Due to the implementation of clean air actions in China, PM2.5 concentrations decreased dramatically between 25 and 45∘ N averaged over 110–125.5∘ E in 2017 relative to 2013, and the PM2.5 decline extended from the surface to about 850 hPa in the atmosphere (Fig. 3a). Table S1 summarizes the regional and seasonal mean simulated PM2.5 column burdens in 2013 and 2017 over the seven subregions defined in Fig. 2. The annual mean column burden of PM2.5 had the largest decrease over Sichuan Basin (SCB) by 15.2 mg m−2 (30 % relative to 2013) from 2013 to 2017, followed by 9.6 mg m−2 (30 %) over the Fenwei Plain (FWP) and 9.3 mg m−2 (29 %) over NCP. PM2.5 burdens decreased by 6.5 mg m−2 (23 %) over YRD and by about 3–5 mg m−2 (20 %) over other subregions. The aerosol reductions in percentage did not show significant seasonal variations but similar values in all seasons over the seven subregions.
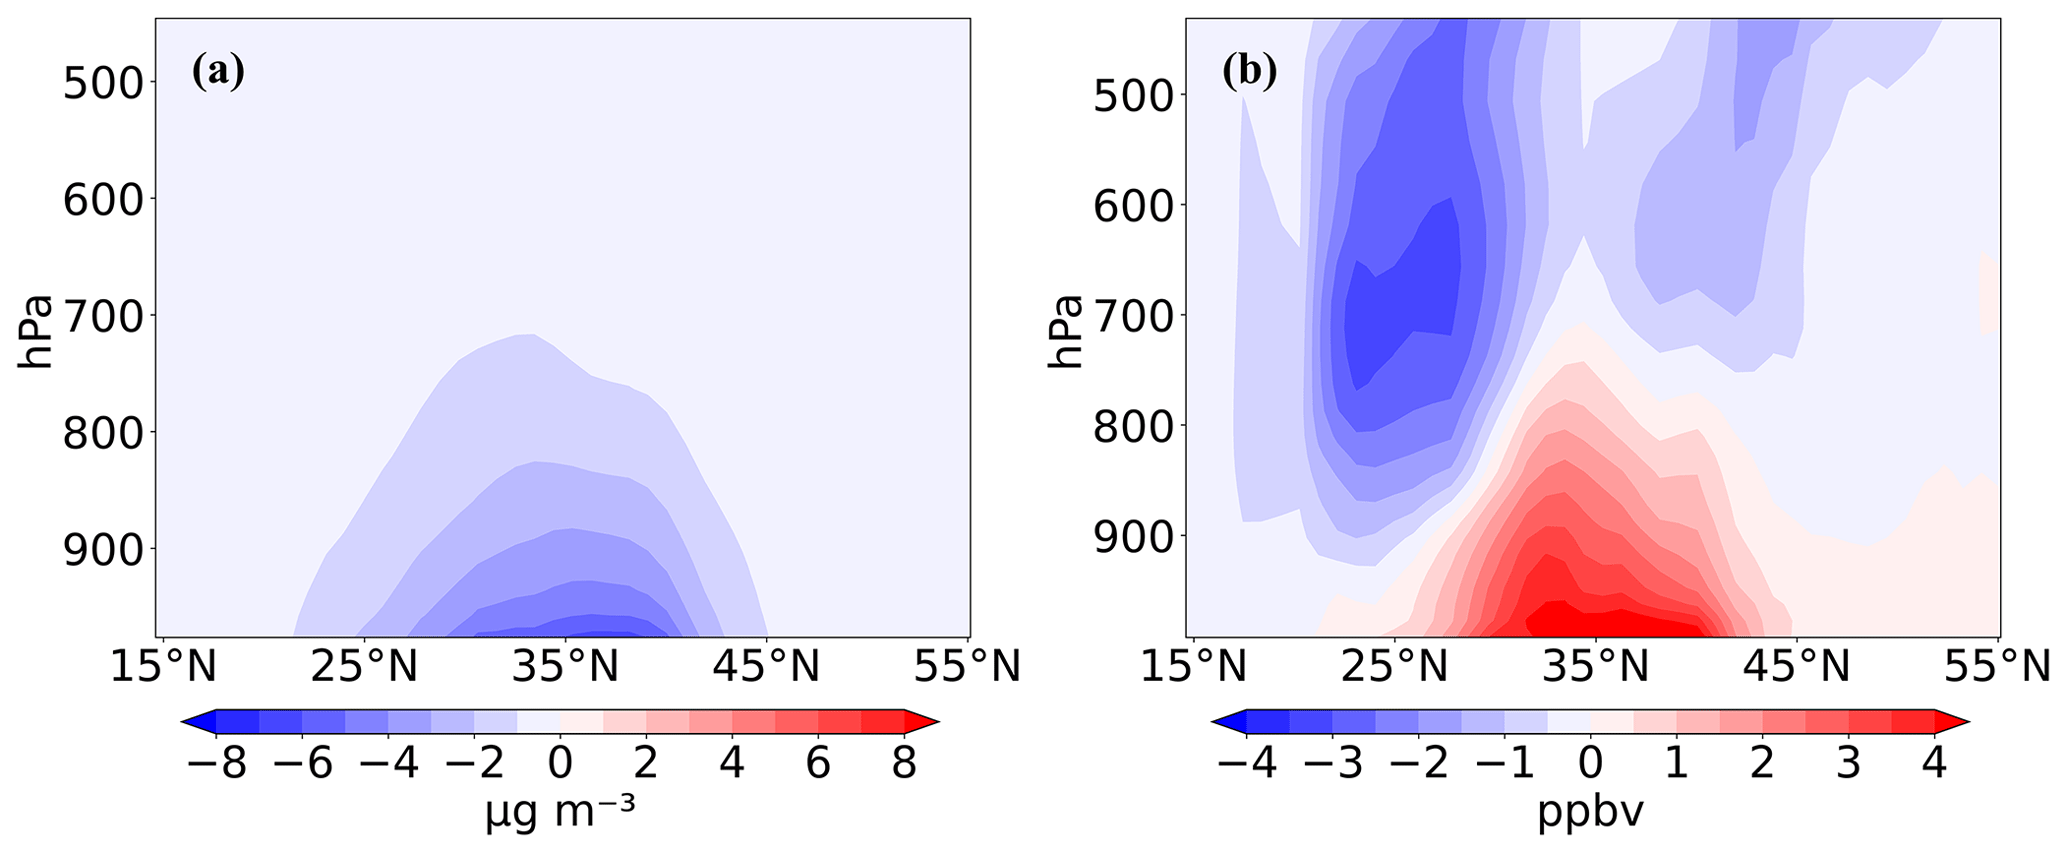
Figure 3Pressure–latitude cross-section averaged over 110–125.5∘ E for differences in simulated annual mean (a) PM2.5 (µg m−3) and (b) O3 (ppbv) concentrations due to emission reductions in aerosol pollutants between 2013 and 2017 (2017 minus 2013). Modeled PM2.5 data are from CESM2 simulations, and modeled O3 data are from GEOS-Chem simulations.
In contrast to the aerosol decreases, the simulated annual mean O3 concentrations increased the most between 25 and 45∘ N averaged over 110–125.5∘ E from 2013 to 2017 (Fig. 3b) partly because the reductions in aerosols can lead to a slowdown of the sink of HO2 radicals in aerosol chemical processes and thus to more radicals accelerating the O3 production (K. Li et al., 2019). Over eastern China, O3 concentration increased from the surface to about 800 hPa. Meanwhile, O3 concentrations decreased in the mid-troposphere in eastern China. It is because the mid-troposphere is relatively cleaner than near the surface, which is the NOx-limited regime, and O3 concentrations decreased as NOx emissions decreased (Dufour et al., 2018). However, in the lower troposphere over eastern China, O3 concentrations are limited by volatile organic compounds, which increased with reduced NOx emissions.
As short-lived climate forcers, aerosols and O3 exert considerable impacts on climate through perturbing the radiation budget of the Earth. Along with the reductions in aerosol and precursor gas emissions due to clean air actions in China, the decreases in aerosol concentrations led to an anomalous ERF of 1.18 ± 0.94 W m−2 at TOA over eastern China in the year 2017 relative to 2013 (Fig. 4a), which can potentially cause a regional warming effect. The anomalous ERF was largely induced by the aerosol–radiation interactions (ERFari; 0.79 ± 0.38 W m−2), and the aerosol–cloud interactions also contributed to the ERF anomaly (ERFaci; 0.44 ± 0.87 W m−2) (Fig. 5). Note that due to the large uncertainties involved in the aerosol–cloud interactions, changes in ERFaci and thus total aerosol ERF are not as statistically significant as ERFari.
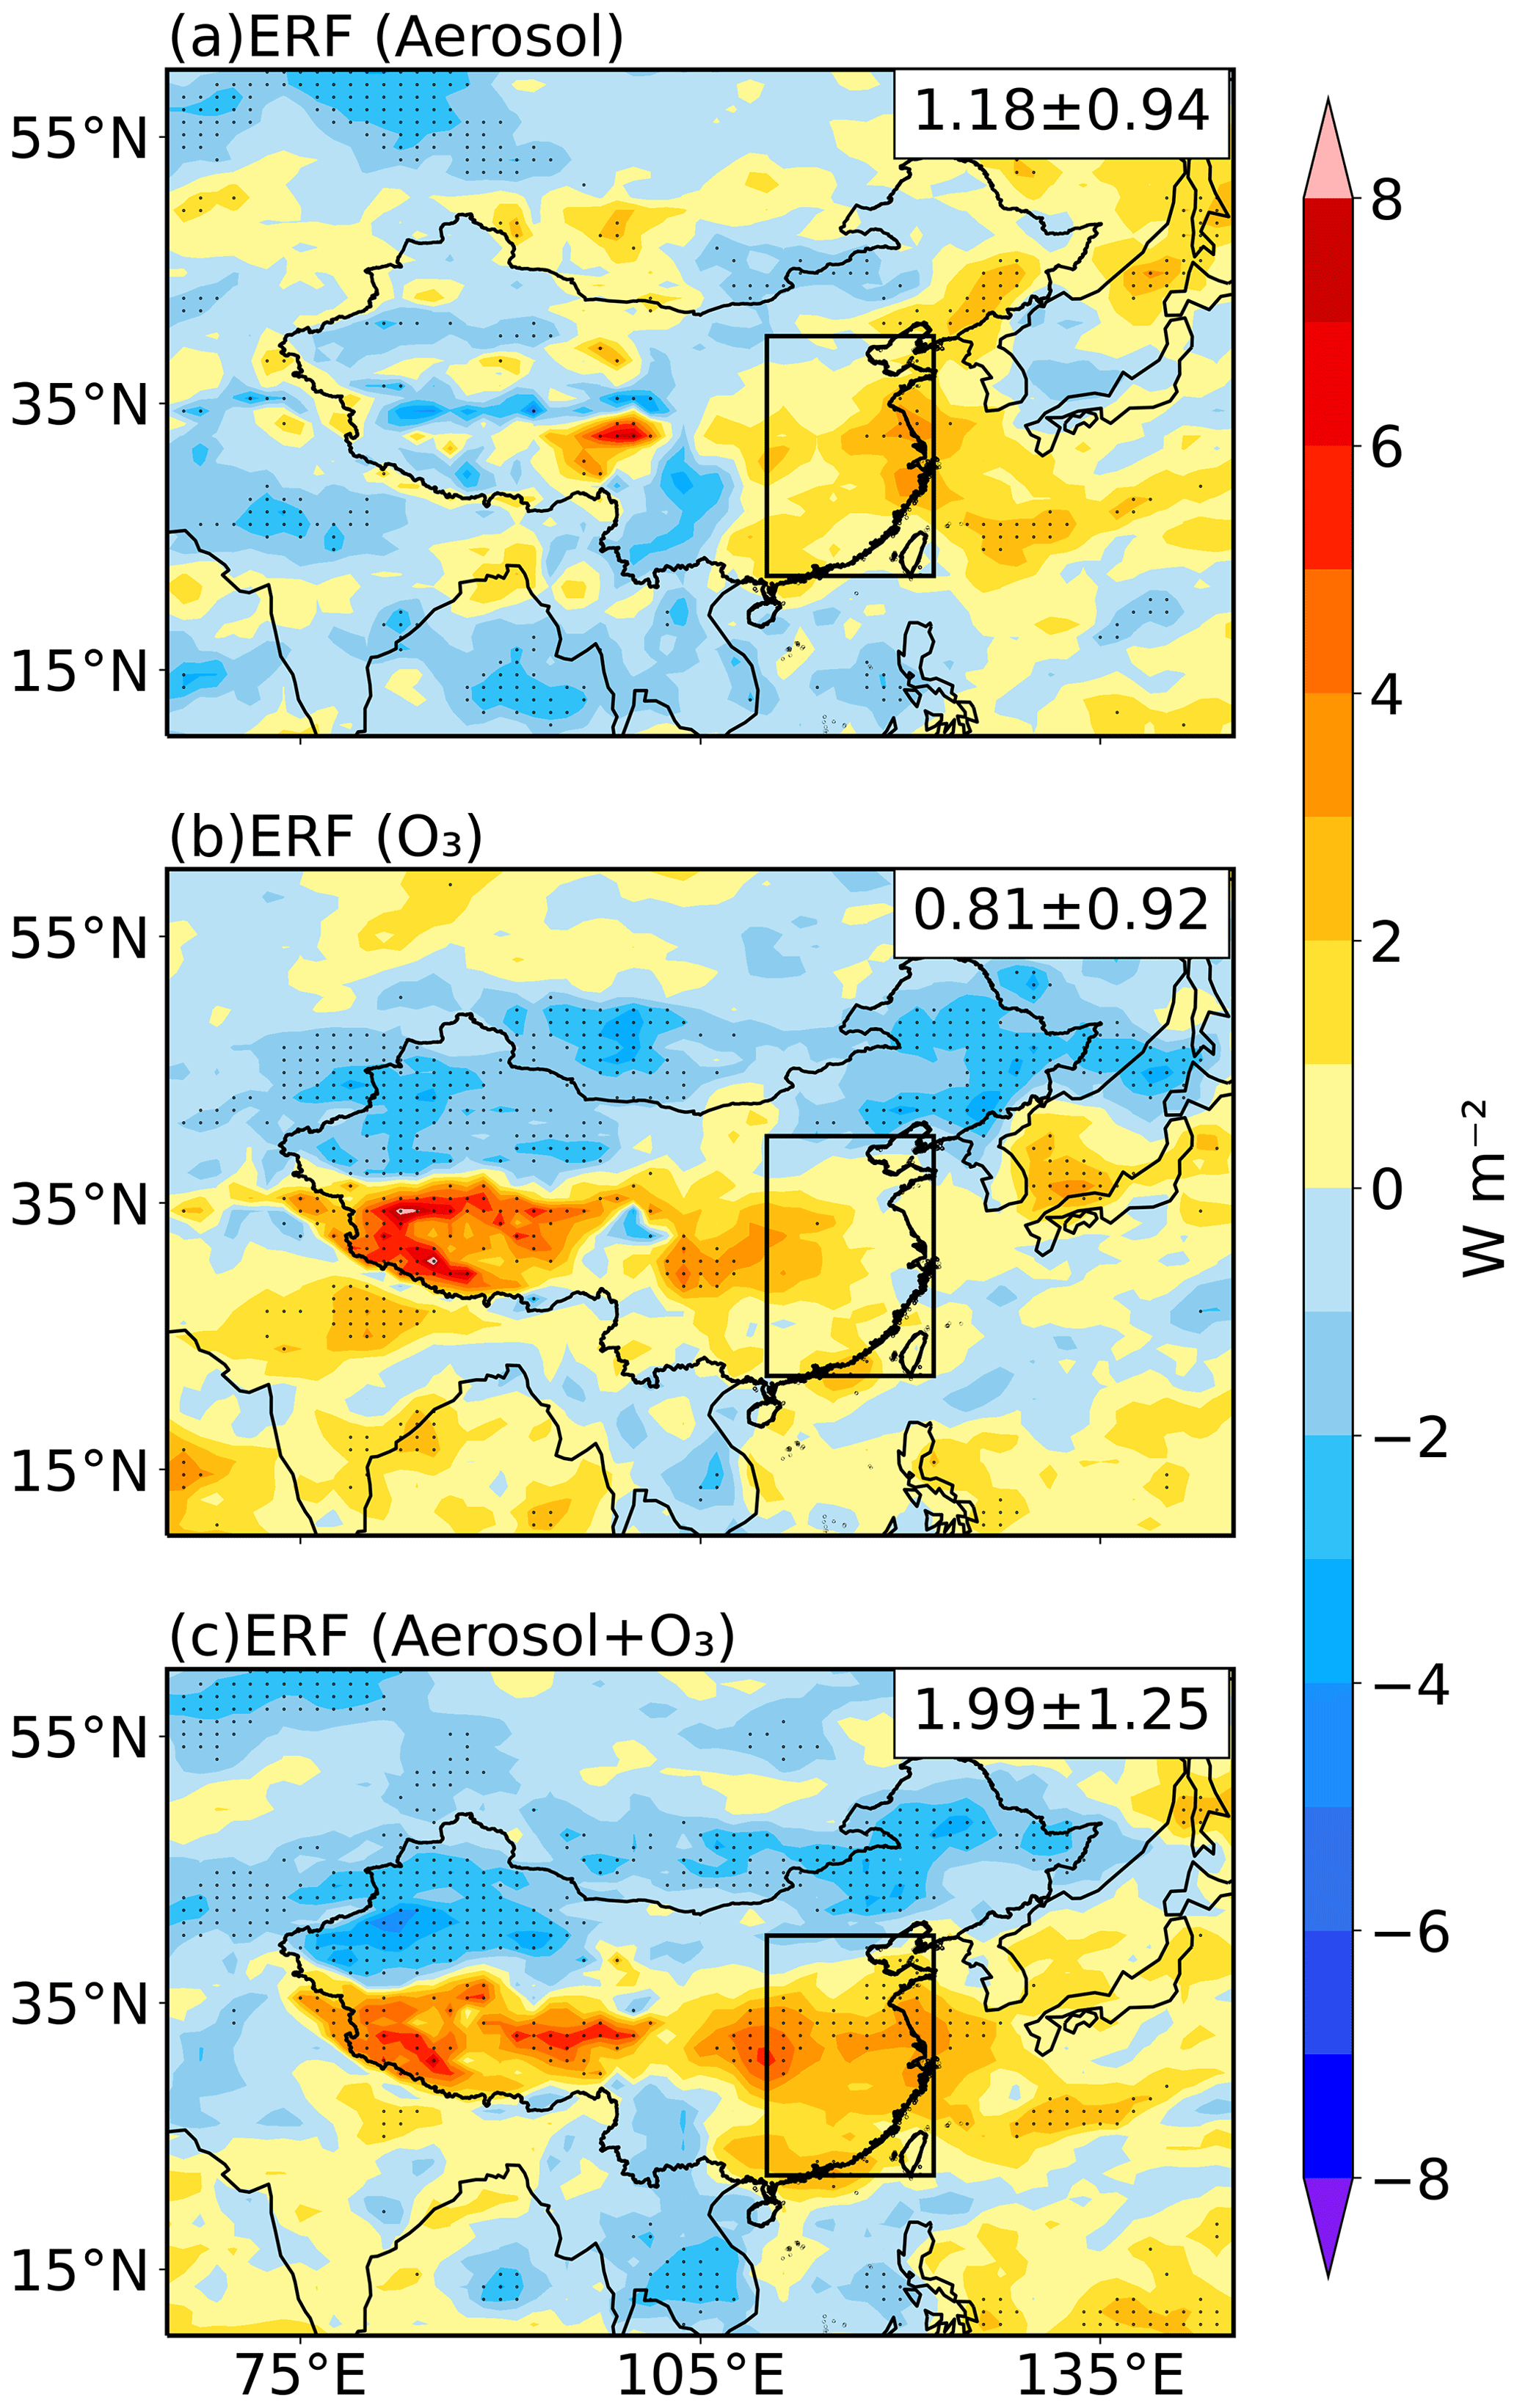
Figure 4Spatial distributions of changes in annual mean effective radiative forcing (ERF, W m−2) of (a) aerosols, (b) tropospheric O3, and (c) both aerosols and tropospheric O3 in 2017 relative to 2013. ERF of aerosols, O3, and both aerosols and O3 are calculated as the differences in net radiative fluxes at the top of the atmosphere between Base and AClean simulations (AClean–Base), between AClean and AClean_O3 (AClean_O3–AClean), and between Base and AClean_O3 (AClean_O3–Base), respectively. Differences in areas that are statistically significant at 90 % from a two-tailed t test are stippled. Regional average and standard deviation of the change in eastern China (22–40∘ N, 110–122.5∘ E) are noted at the upper-right corner of each panel.
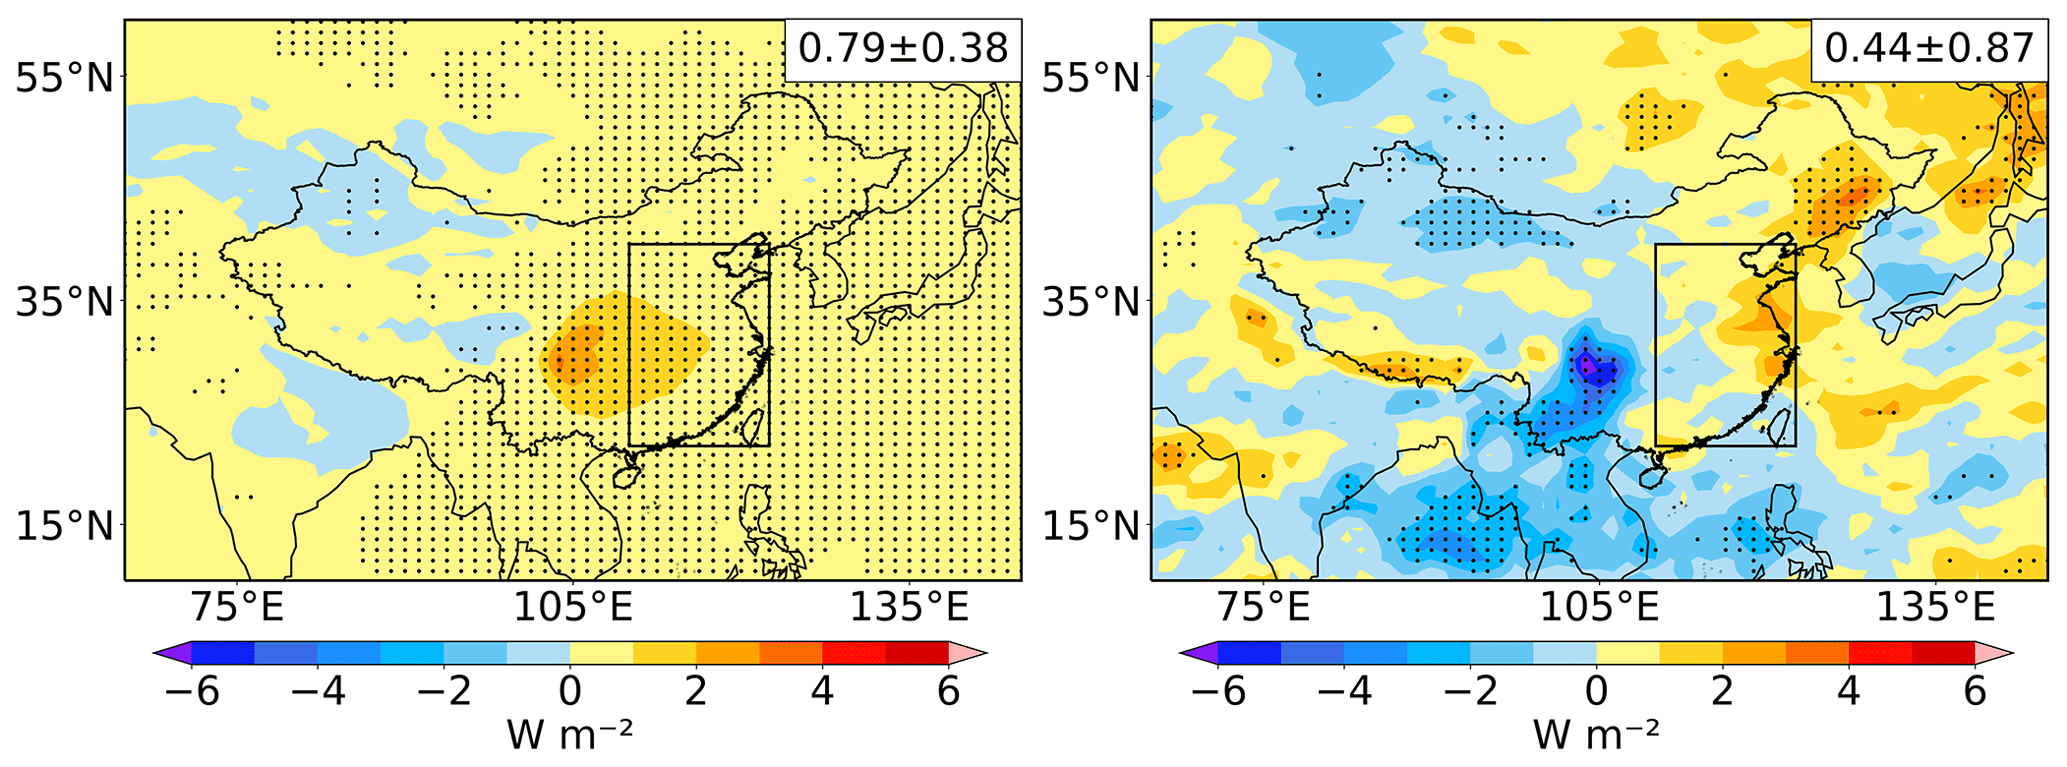
Figure 5Spatial distributions of ERFari (effective radiative forcing induced by aerosol–radiation interactions) (left) and ERFaci (effective radiative forcing induced by aerosol–cloud interactions) (right) differences between Base and AClean. The regional and annual mean differences in eastern China (22–40∘ N, 110–122.5∘ E) are indicated in the upper-right corner of each panel. Differences in areas that are statistically significant at 90 % from a two-tailed t test are stippled.
As a result of emission reductions in O3 precursors, the O3 concentrations increased in the lower troposphere and decreased in the mid-troposphere, resulting in a net ERF anomaly of 0.81 ± 0.92 W m−2 at TOA over eastern China during 2013–2017 (Fig. 4b). There is an anomalous positive ERF anomaly over the Tibetan Plateau which is due to the reduced surface albedo over this region (Fig. S2). The reduced surface albedo due to snow/ice melt over the Tibetan Plateau can amplify the O3-induced warming in China even though the O3 concentrations decreased over this particular region. The positive ERF anomaly related to the near-surface O3 increases enhanced the positive ERF produced by the aerosol decreases, leading to a total ERF anomaly of 1.99 ± 1.25 W m−2 over eastern China (Fig. 4c).
Owing to the emission reductions, surface air temperature increased in China during 2013–2017 as the consequence of less solar radiation reflected to space and more thermal radiation captured within the atmosphere. Over eastern China, surface air temperature increased by 0.09 ± 0.10∘C, induced by anthropogenic aerosol emission reductions alone from 2013 to 2017 (Fig. 6a), and the intensified O3 pollution exacerbated the temperature increase by 0.07 ± 0.09∘C in the meantime (Fig. 6b). The total aerosol and O3 emission reductions from 2013 to 2017 induced a 0.16 ± 0.15∘C warming over eastern China, with statistically significant warming in the range of 0.3–0.5∘C between 30 and 40∘ N (Fig. 6c).
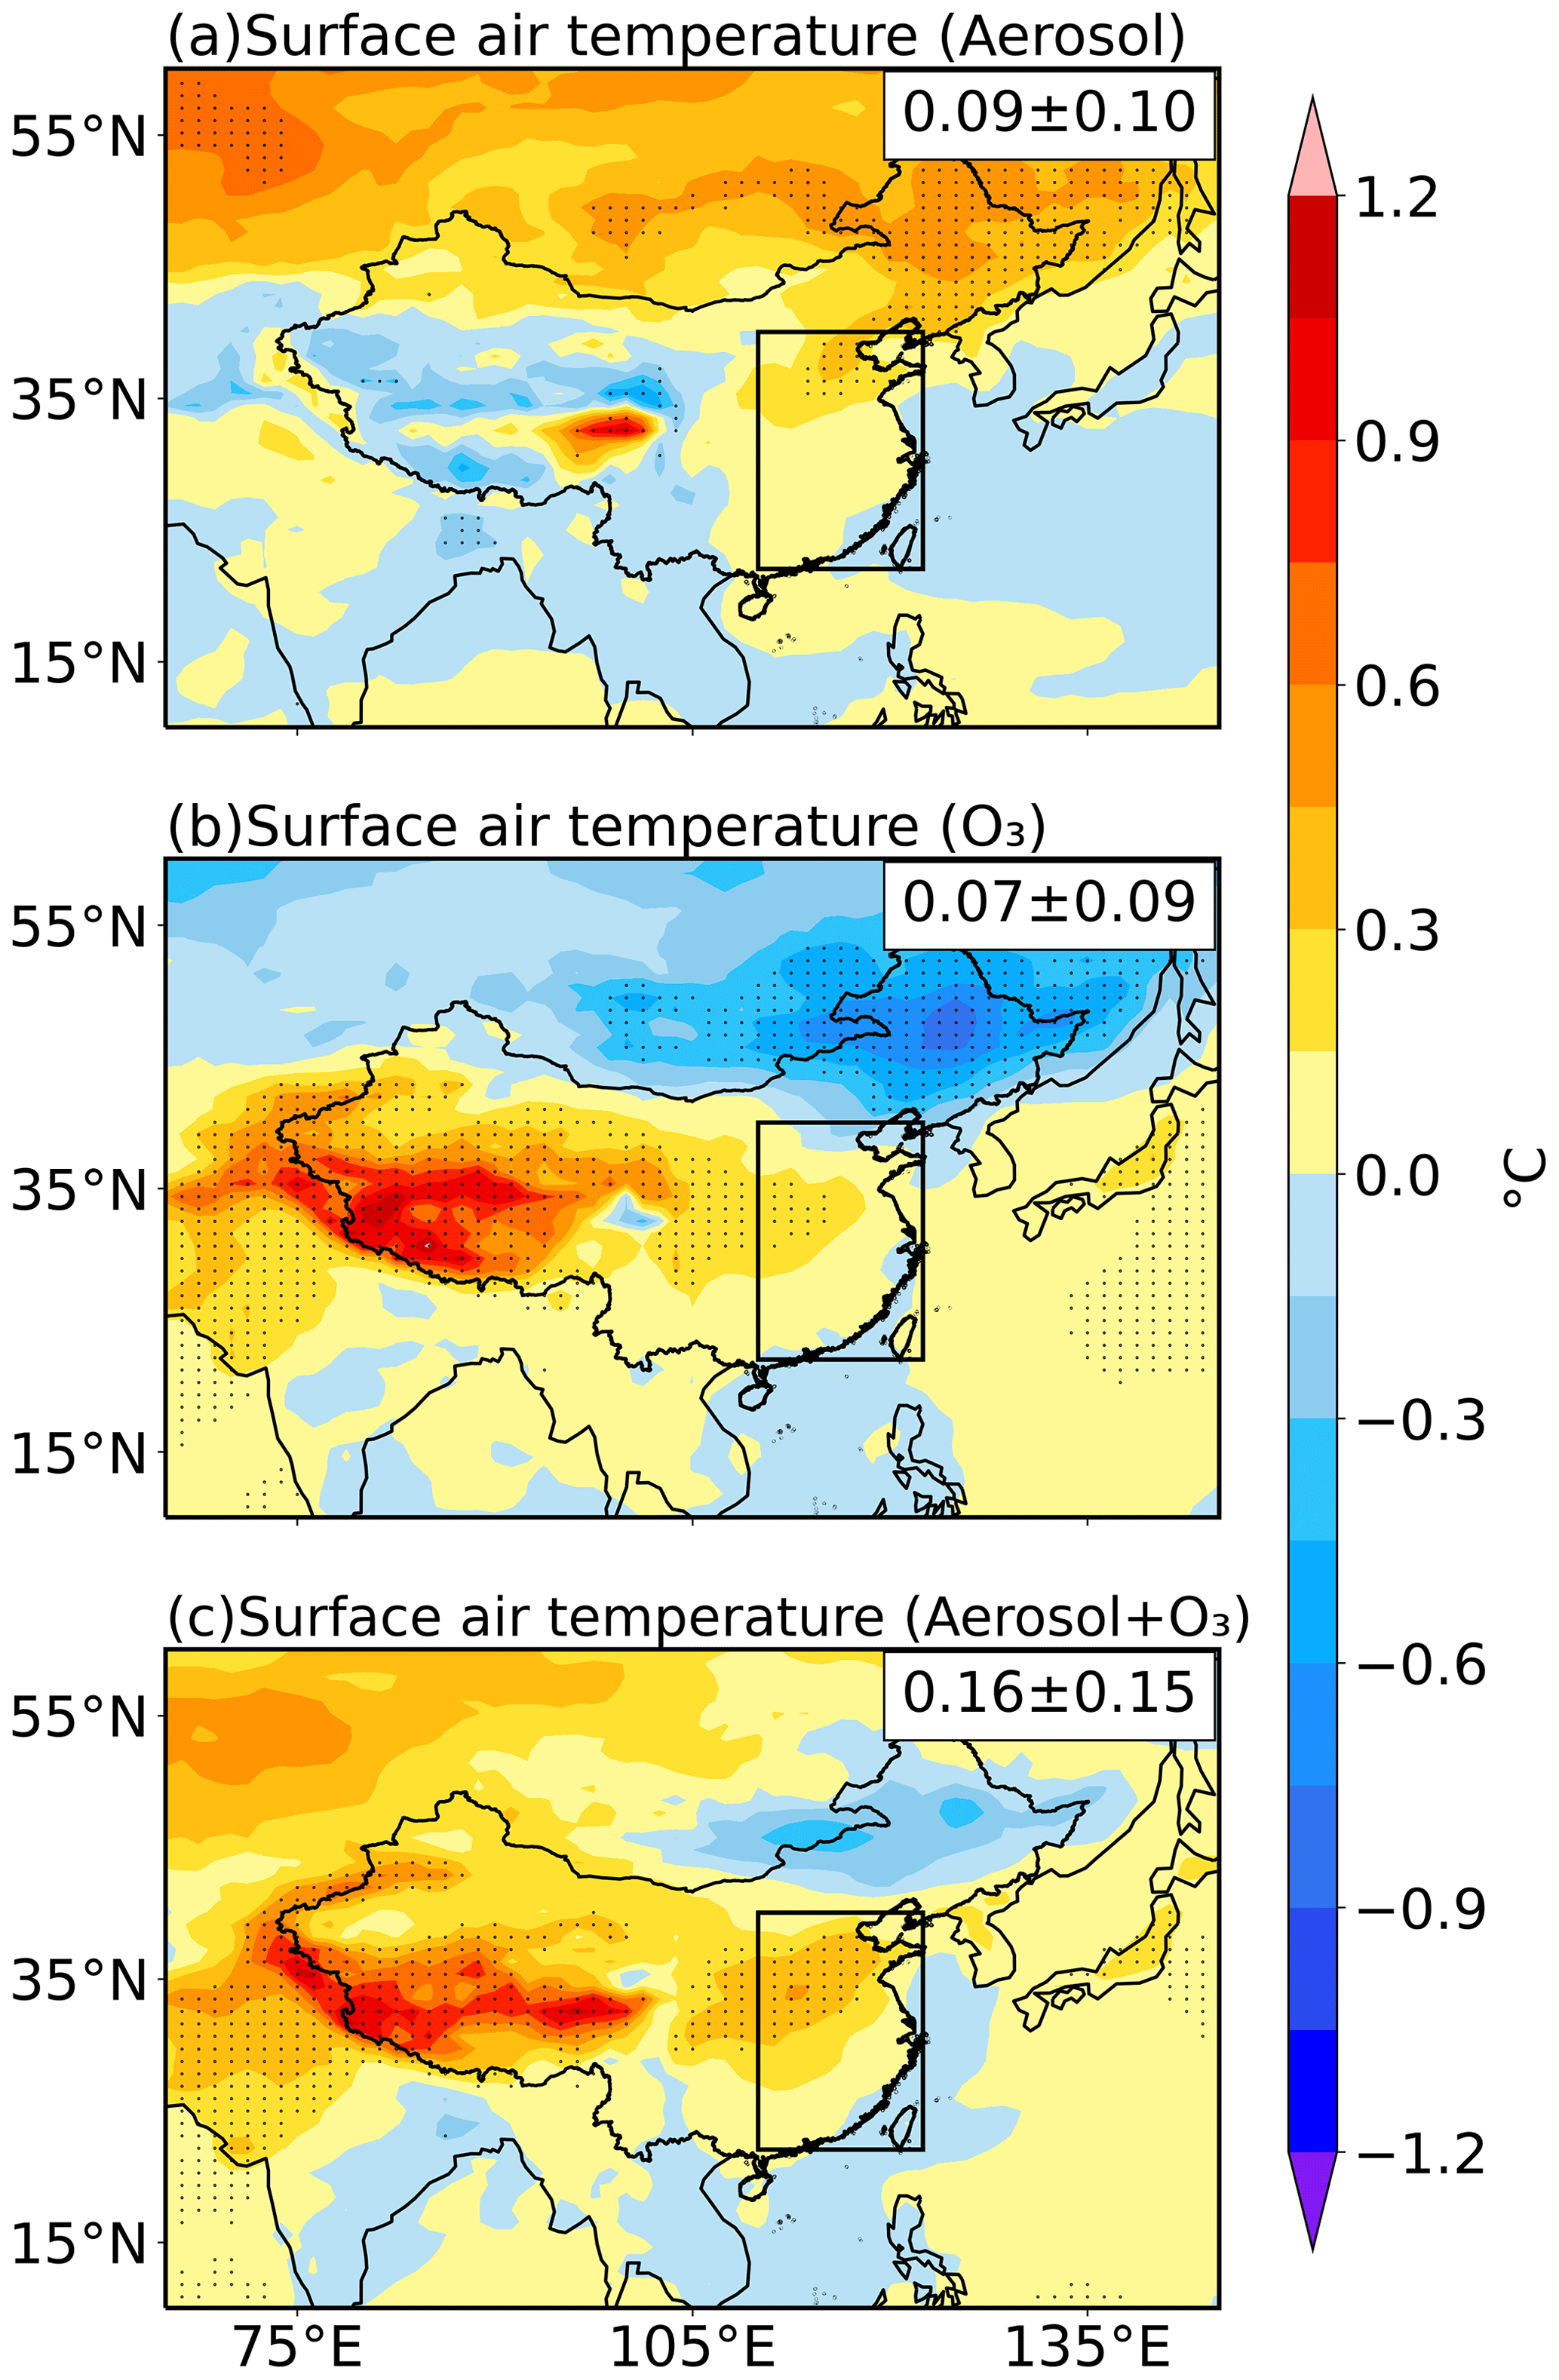
Figure 6Spatial distributions of differences in surface air temperature (∘C) due to the changes in (a) aerosols, (b) O3, and (c) both aerosols and O3 between 2013 and 2017, calculated as the differences between Base and AClean simulations (AClean–Base), between AClean and AClean_O3 (AClean_O3–AClean), and between Base and AClean_O3 (AClean_O3–Base), respectively. Differences in areas that are statistically significant at 90 % from a two-tailed t test are stippled. Regional average and standard deviation of the change in eastern China (22–40∘ N, 110–122.5∘ E) are noted in the upper-right corner of each panel.
The regional surface air temperature changes over the seven subregions in China due to emission reductions in air pollutants are provided in Table 1. In FWP, temperature increased by 0.35 ± 0.06∘C between 2013 and 2017, equally attributed to the changes in aerosols and O3. Temperature in NCP and SCB increased by 0.22 ± 0.09∘C and 0.26 ± 0.08∘C, largely attributed to changes in aerosols and O3, respectively. Decreases in both aerosols and tropospheric O3 above the surface caused a net surface cooling of 0.14 ± 0.12∘C in the Northeast Plain (NEP) in China. Note that in this study we only focus on the fast climate responses over central-eastern China. Although temperature also increased or decreased in western China and outside China likely related to feedbacks or natural variability, there are few observational sites of air pollutants over these regions to verify the simulated pollutant changes, and therefore large uncertainties exist in the simulated climate responses over these regions.
Table 1Regional and seasonal mean ERF (effective radiative forcing) (W m−2) and surface air temperature (∘C) changes induced by aerosol and/or O3 changes between 2013 and 2017.

Although the air pollutants can influence precipitation through multiple microphysical and dynamical ways, the complicated aerosol–cloud interactions produced large uncertainties in the precipitation responses to the changes in air pollutants. Over eastern China, the reductions in emissions of air pollutants between 2013 and 2017 led to the annual mean precipitation change by −0.06 ± 0.23 mm d−1 (Fig. S3). Neither the precipitation responses to changes in aerosols nor the O3 is statistically significant at 90 % confidence level over eastern China. In the simulations of this study, only fast climate responses are included with fixed SST at the climatological mean. Precipitation change is also driven by land–sea temperature differences over monsoon regions. Fixing SST in simulations can induce biases in the estimate of precipitation responses, which can be revisited using a fully coupled model configuration with both fast and slow climate responses included in future studies.
To explore which emission sector contributed the most to the aerosol-reduction-induced regional warming over eastern China, Fig. 7 shows the changes in column burden of PM2.5, ERFari, and surface air temperature averaged in eastern China due to emission reductions in anthropogenic aerosols and precursors from individual sectors, and Table S2 summarizes the values. Among all the sectors, industrial emissions contributed the most to the column burden decrease in PM2.5 in eastern China, accounting for 67 % of the total burden decrease, followed by 27 % due to emission reductions from the energy sector.
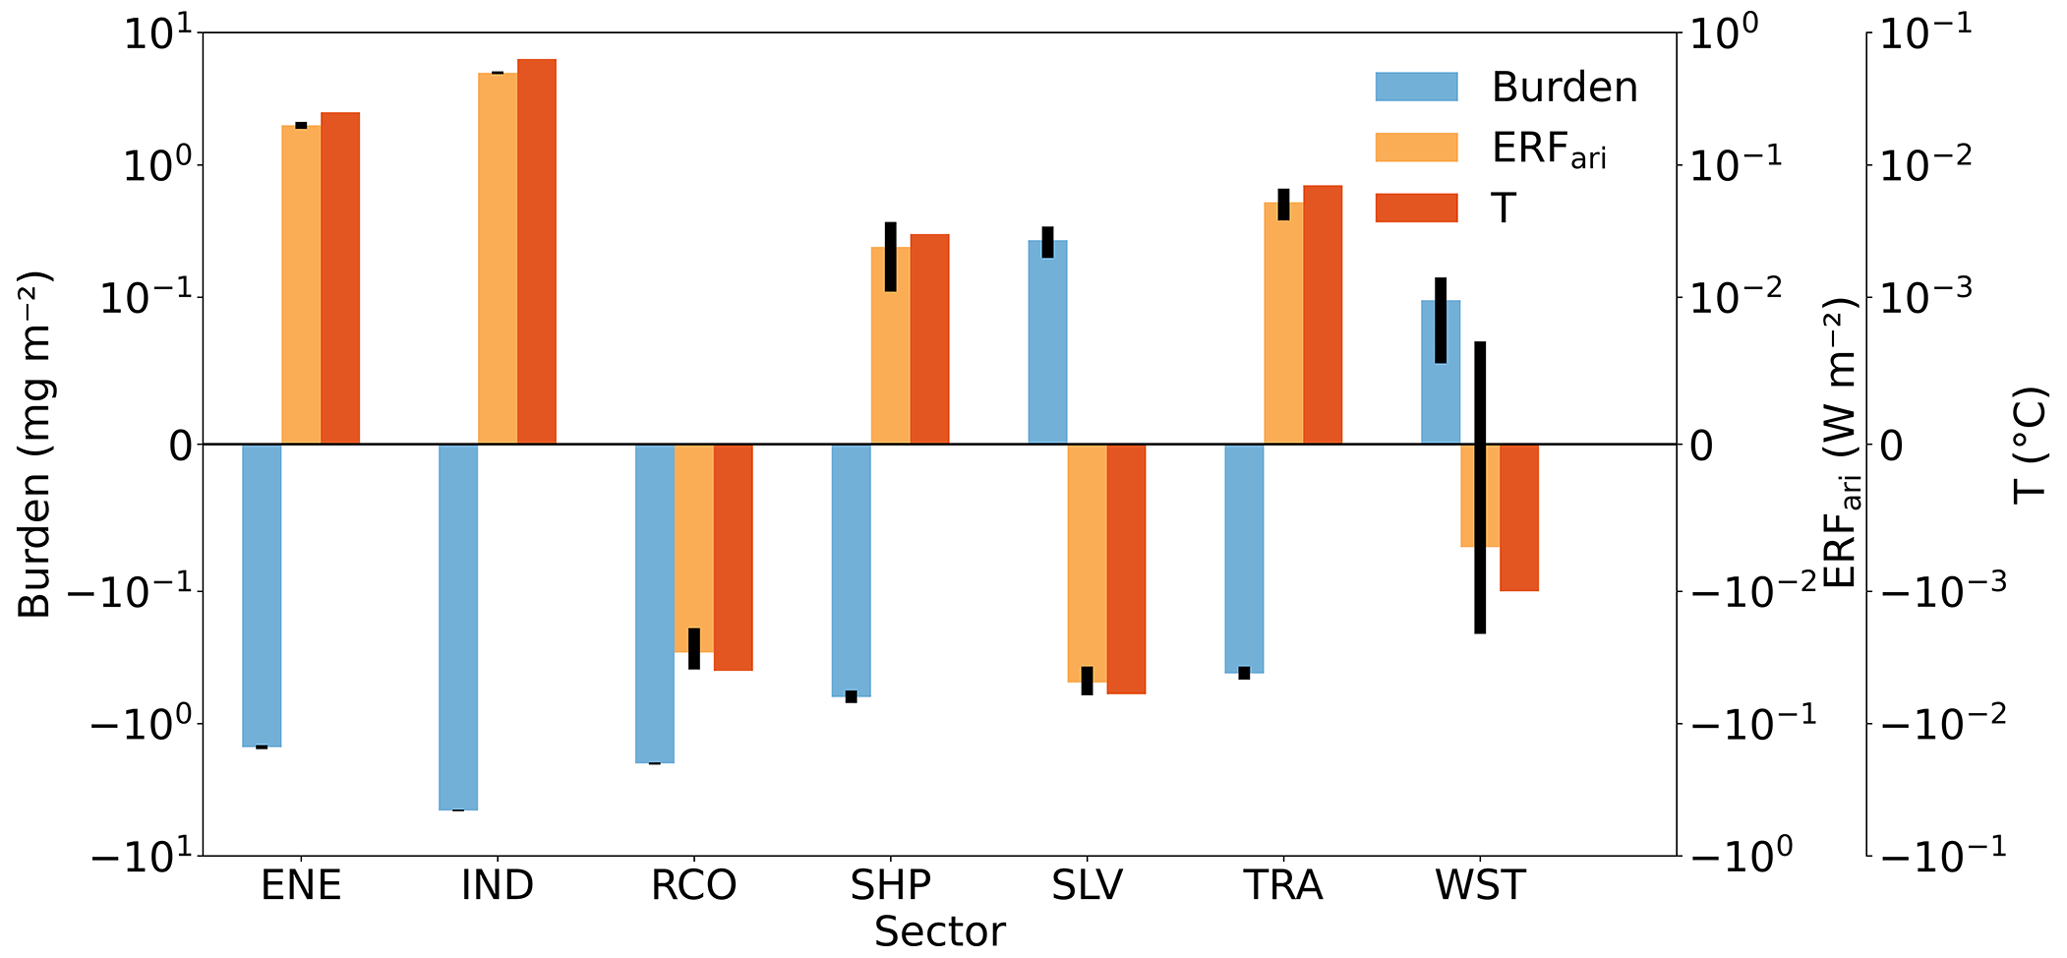
Figure 7Changes in aerosol column burden, effective radiative forcing due to aerosol–radiation interactions (ERFari), and surface air temperature (T) in 2017 relative to 2013 averaged over eastern China due to emission reductions in aerosols and precursors from individual sectors, including energy transformation and extraction (ENE), industrial combustion and processes (IND), residential, commercial, and other (RCO), surface transportation (TRA), solvents (SLV), waste disposal and handling (WST), and international shipping (SHP). Error bars of burden and ERFari indicate 1σ. Note that scales are logarithmic.
The ERFari changes due to aerosol emission reductions in individual sectors from 2013 to 2017 are roughly in linear proportion to the burden changes but in the opposite direction. Reductions in aerosols from industrial and energy sectors exerted ERFari anomalies of 0.50 W m−2 (72 % of the combined ERFari anomaly from all sectors) and 0.20 W m−2 (29 %) and temperature anomalies of 0.063 and 0.025∘C, respectively, over eastern China. Declined surface transportation emissions introduced an ERFari anomaly of 0.05 W m−2 (8 %) and a temperature anomaly of 0.007∘C, offset by the change in solvent usage. It is interesting that, different from most sectors, residential emission reductions led to a net cooling (−0.03 W m−2 and −0.004∘C) in the context of the aerosol burden decreases over eastern China. It is because the residential heating sector releases a large amount of BC aerosol, which absorbs solar radiation and warms the atmosphere. With residential emissions reduced, decreases in BC resulted in less radiation trapped in the atmosphere and a negative ERFari anomaly, although this effect was largely offset by the decreases in other scattering aerosols.
From 2013 to 2017, only about 10 % of anthropogenic BC emissions from the residential sector were reduced in eastern China (Fig. S4). Previous studies have found that switching residential energy to cleaner energy prevented millions of premature deaths in China (Zhang et al., 2021). We suggest that the use of cleaner energy in the residential sector with less BC emissions is more effective at achieving climate and health benefits in China in the near future.
Since the year 2013, China has implemented a sequence of policies for clean air, which could have led to climate impacts through interactions between the changing air pollutants, radiation, and clouds. In this study, the fast climate responses to emission reductions in air pollutants over China due to clean air actions from 2013 to 2017 are investigated based on CESM2–CAM6 simulations.
During 2013–2017, aerosol concentrations decreased significantly, whereas the simulated O3 concentrations had an increase in the lower troposphere and a decrease in the mid-troposphere over eastern China. The aerosol decline produced an anomalous ERF of 1.18 ± 0.94 W m−2 in eastern China, resulting in a 0.09 ± 0.10∘C warming during 2013–2017. An additional ERF of 0.81 ± 0.92 W m−2 through the increases in O3 in the lower troposphere enhanced the climate warming by 0.07 ± 0.09∘C, leading to an anomalous ERF of 1.99 ± 1.25 W m−2 and a total 0.16 ± 0.15∘C warming in eastern China due to the changes in aerosols and O3. It indicates that the recent growing O3 pollution has strengthened the climate warming caused by aerosol emission reductions. Among all emission sectors, emission reductions in the industry sector contributed the most to the aerosol-reduction-induced warming (72 %), followed by the energy sector (29 %). It is noteworthy that, associated with the reduced residential emissions, decreases in BC resulted in less solar radiation trapped in the atmosphere and caused a cooling effect, implying that switching the residential sector to cleaner energy with less BC emissions is more effective at improving air quality and mitigating climate warming.
Different models have different climate responses to emission reductions due to uncertainties associated with the different physical, chemical, and dynamical parameterizations and feedbacks. Table S3 compares the results in this study with those from previous studies in the literature. Dang and Liao (2019) reported that reductions in aerosols from 2012 to 2017 had led to a regional mean DRF of 1.18 W m−2 in eastern China using the GEOS-Chem model, which is higher than the ERFari of 0.79 ± 0.38 W m−2 in this study. They also showed a much weaker O3 DRF of 0.08 W m−2 than the ERF of 0.81 W m−2 estimated here, which is probably because we only adopted tropospheric O3 concentrations below 450 hPa from GEOS-Chem, but they used total column O3 for the radiation calculation with the influence of changing meteorological fields between 2013 and 2017 included. With the coupled climate model CESM1, Zheng et al. (2020) found that emission reductions exerted a smaller ERF anomaly of 0.48 ± 0.11 W m−2 and a stronger warming of 0.12 ∘C in East Asia during 2006–2017 compared to the 1.18 ± 0.94 W m−2 and 0.09 ± 0.10∘C in this study averaged over eastern China during 2013–2017 considering fast climate responses alone.
As shown in this study, aerosol emission reductions in 2017, compared to 2013, led to a regional warming in China, and the increased tropospheric O3 pollution further enhanced the warming, hindering climate warming mitigation goals. The connection between regional warming and emission reductions in air pollutants indicates the importance of a balance between air quality improvements and climate mitigations. Our results on sectoral contributions to climate impacts suggest that the residential sector is a good target for emission reduction to improve air quality and mitigate climate warming simultaneously, yet reducing aerosol emissions in other sectors, especially the industry sector, is likely to accelerate the regional warming in China.
There are some limitations and uncertainties in the study. Firstly, only fast climate responses are considered in our study, while the emission reductions could also influence climate response through slow oceanic processes and air–sea interactions, which can be improved by conducting fully coupled atmosphere–ocean simulations in future studies. Samset et al. (2016) showed that the fast precipitation response to changes in aerosols dominated the slow oceanic response over land in East Asia. However, to what extent the fast processes contributed to the temperature response needs further study. Neglecting the slow climate response here could lead to an incomplete aerosol climate effect. Secondly, the model significantly underestimates the PM2.5 decrease in China during 2013–2017, which is caused by many factors including strong aerosol wet removal, uncertainties in new particle formation, the coarse model resolution, and the uncertainty in anthropogenic emissions of aerosols and precursor gases (Yang et al., 2017a, b; Zeng et al., 2021; Ren et al., 2021; Fan et al., 2022, 2018). The low bias in estimated aerosol decreases may result in an underestimation of the simulated climate responses in CAM6. Thirdly, nitrate and ammonium aerosols, which are not treated in the current version of CESM2, also changed from 2013 to 2017 (Xu et al., 2019) and should have an impact on climate, although nitrate concentration in Beijing changed slightly during this time (Zhang et al., 2020). Fourthly, only 20-year simulations were performed in this study, and longer simulations with ensemble members may present a more robust result. Finally, only one model is used in our study, and a potential model dependence on climate responses to aerosol reductions needs further investigation using multi-model ensemble simulations. Furthermore, several interesting issues can be investigated in the future. For example, our results only illustrate the impacts of China's emission changes of air pollutants on China's regional climate, but regional climate changes in China can respond to emission changes outside China, e.g., South Asia, and remote climate responses to China's emission reductions deserve further studies as well.
Observed PM2.5 and O3 concentrations are available at https://doi.org/10.5281/zenodo.5833003 (Yang, 2022). The GEOS-Chem model is available at https://doi.org/10.5281/zenodo.3974569 (GEOS, 2020). The CESM2 model is available at https://www.cesm.ucar.edu/models/cesm2/release_download.html (last access: 27 May 2022) (NCAR, 2022). The MEIC inventory can be downloaded at http://meicmodel.org/?page_id=541&lang=en (last access: 27 May 2022) (MEIC, 2022). Our model results are available at https://doi.org/10.5281/zenodo.5833003 (Yang, 2022).
The supplement related to this article is available online at: https://doi.org/10.5194/acp-22-7131-2022-supplement.
YY designed the research; JG performed CESM2 simulations and analyzed the data. ML and HuL performed the GEOS-Chem simulation. All authors including HW, PW, LR, XY, and HoL discussed the results and wrote the paper.
The contact author has declared that neither they nor their co-authors have any competing interests.
Publisher’s note: Copernicus Publications remains neutral with regard to jurisdictional claims in published maps and institutional affiliations.
This study was supported by the National Key Research and Development Program of China (grant nos. 2019YFA0606800 and 2020YFA0607803), the National Natural Science Foundation of China (grant no. 41975159), and the Jiangsu Science Fund for Distinguished Young Scholars (grant no. BK20211541). Hailong Wang acknowledges the support of the U.S. Department of Energy (DOE), Office of Science, Office of Biological and Environmental Research (BER), as part of the Earth and Environmental System Modeling program. The Pacific Northwest National Laboratory (PNNL) is operated for DOE by the Battelle Memorial Institute under contract DE-AC05-76RLO1830.
This research has been supported by the National Key Research and Development Program of China (grant nos. 2019YFA0606800 and 2020YFA0607803), the National Natural Science Foundation of China (grant no. 41975159), and the Jiangsu Science Fund for Distinguished Young Scholars (grant no. BK20211541).
This paper was edited by Johannes Quaas and reviewed by two anonymous referees.
Albrecht, B. A.: Aerosols, Cloud Microphysics, and Fractional Cloudiness, Science, 245, 1227–1230, https://doi.org/10.1126/science.245.4923.1227, 1989.
Charlson, R. J., Schwartz, S. E., Hales, J. M., Cess, R. D., Coakley, J. A., Hansen, J. E., and Hofmann, D. J.: Climate Forcing by Anthropogenic Aerosols, Science, 255, 423–430, https://doi.org/10.1126/science.255.5043.423, 1992.
Chen, W., Dong, B., Wilcox, L., Luo, F., Dunstone, N., and Highwood, E. J.: Attribution of recent trends in temperature extremes over China: Role of changes in anthropogenic aerosol emissions over asia, J. Clim., 32, 7539–7560, https://doi.org/10.1175/JCLI-D-18-0777.1, 2019.
Chen, W. T., Nenes, A., Liao, H., Adams, P. J., Li, J. L. F., and Seinfeld, J. H.: Global climate response to anthropogenic aerosol indirect effects: Present day and year 2100, J. Geophys. Res.-Atmos., 115, 1–23, https://doi.org/10.1029/2008JD011619, 2010.
Clean Air Alliance of China: English Translation of Air Pollution Prevention and Control Action Plan, Clean Air Alliance of China, http://www.cleanairchina.org/product/6349.html (last access: 29 October 2021), 2013.
Danabasoglu, G., Lamarque, J. F., Bacmeister, J., Bailey, D. A., DuVivier, A. K., Edwards, J., Emmons, L. K., Fasullo, J., Garcia, R., Gettelman, A., Hannay, C., Holland, M. M., Large, W. G., Lauritzen, P. H., Lawrence, D. M., Lenaerts, J. T. M., Lindsay, K., Lipscomb, W. H., Mills, M. J., Neale, R., Oleson, K. W., Otto-Bliesner, B., Phillips, A. S., Sacks, W., Tilmes, S., van Kampenhout, L., Vertenstein, M., Bertini, A., Dennis, J., Deser, C., Fischer, C., Fox-Kemper, B., Kay, J. E., Kinnison, D., Kushner, P. J., Larson, V. E., Long, M. C., Mickelson, S., Moore, J. K., Nienhouse, E., Polvani, L., Rasch, P. J., and Strand, W. G.: The Community Earth System Model Version 2 (CESM2), J. Adv. Model. Earth Syst., 12, 1–35, https://doi.org/10.1029/2019MS001916, 2020.
Dang, R. and Liao, H.: Radiative Forcing and Health Impact of Aerosols and Ozone in China as the Consequence of Clean Air Actions over 2012–2017, Geophys. Res. Lett., 46, 12511–12519, https://doi.org/10.1029/2019GL084605, 2019.
Dufour, G., Eremenko, M., Beekmann, M., Cuesta, J., Foret, G., Fortems-Cheiney, A., Lachâtre, M., Lin, W., Liu, Y., Xu, X., and Zhang, Y.: Lower tropospheric ozone over the North China Plain: variability and trends revealed by IASI satellite observations for 2008–2016, Atmos. Chem. Phys., 18, 16439–16459, https://doi.org/10.5194/acp-18-16439-2018, 2018.
Fan, T., Liu, X., Ma, P.-L., Zhang, Q., Li, Z., Jiang, Y., Zhang, F., Zhao, C., Yang, X., Wu, F., and Wang, Y.: Emission or atmospheric processes? An attempt to attribute the source of large bias of aerosols in eastern China simulated by global climate models, Atmos. Chem. Phys., 18, 1395–1417, https://doi.org/10.5194/acp-18-1395-2018, 2018.
Fan, T., Liu, X., Wu, C., Zhang, Q., Zhao, C., Yang, X., Li, Y., Fan, T. Y., Liu, X. H., Wu, C. L., Zhang, Q., Zhao, C. F., Yang, X., and Li, Y. L.: Comparison of the Anthropogenic Emission Inventory for CMIP6 Models with a Country-Level Inventory over China and the Simulations of the Aerosol Properties, Adv. Atmos. Sci., 39, 80–96, https://doi.org/10.1007/S00376-021-1119-6, 2022.
Forster, P., Storelvmo, T., Armour, K., Collins, W., Dufresne, J.-L., Frame, D., Lunt, D. J., Mauritsen, T., Palmer, M. D., Watanabe, M., Wild, M., and Zhang, H.: The Earth’s Energy Budget, Climate Feedbacks, and Climate Sensitivity, in: Climate Change 2021: The Physical Science Basis, Contribution of Working Group I to the Sixth Assessment Report of the Intergovernmental Panel on Climate Change, edited by: Masson-Delmotte, V., Zhai, P., Pirani, A., Connors, S. L., Péan, C., Berger, S., Caud, N., Chen, Y., Goldfarb, L., Gomis, M. I., Huang, M., Leitzell, K., Lonnoy, E., Matthews, J. B. R., Maycock, T. K., Waterfield, T., Yelekçi, O., Yu, R., and Zhou, B., Cambridge University Press, 923–1054, https://doi.org/10.1017/9781009157896.009, 2021
GEOS – The International GEOS-Chem User Community: geoschem/geos-chem: GEOS-Chem 12.9.3 (12.9.3), Zenodo [code], https://doi.org/10.5281/zenodo.3974569, 2020.
Gettelman, A. and Morrison, H.: Advanced two-moment bulk microphysics for global models, Part I: Off-line tests and comparison with other schemes, J. Clim., 28, 1268–1287, https://doi.org/10.1175/JCLI-D-14-00102.1, 2015.
Ghan, S. J.: Technical Note: Estimating aerosol effects on cloud radiative forcing, Atmos. Chem. Phys., 13, 9971–9974, https://doi.org/10.5194/acp-13-9971-2013, 2013.
Guenther, A. B., Jiang, X., Heald, C. L., Sakulyanontvittaya, T., Duhl, T., Emmons, L. K., and Wang, X.: The Model of Emissions of Gases and Aerosols from Nature version 2.1 (MEGAN2.1): an extended and updated framework for modeling biogenic emissions, Geosci. Model Dev., 5, 1471–1492, https://doi.org/10.5194/gmd-5-1471-2012, 2012.
Hoesly, R. M., Smith, S. J., Feng, L., Klimont, Z., Janssens-Maenhout, G., Pitkanen, T., Seibert, J. J., Vu, L., Andres, R. J., Bolt, R. M., Bond, T. C., Dawidowski, L., Kholod, N., Kurokawa, J.-I., Li, M., Liu, L., Lu, Z., Moura, M. C. P., O'Rourke, P. R., and Zhang, Q.: Historical (1750–2014) anthropogenic emissions of reactive gases and aerosols from the Community Emissions Data System (CEDS), Geosci. Model Dev., 11, 369–408, https://doi.org/10.5194/gmd-11-369-2018, 2018.
Hoose, C., Kristjánsson, J. E., Chen, J.-P., and Hazra, A.: A classical-theory-based parameterization of heterogeneous ice nucleation by mineral dust, soot, and biological particles in a global climate model, J. Atmos. Sci., 67, 2483–2503, https://doi.org/10.1175/2010JAS3425.1, 2010.
Huang, J., Pan, X., Guo, X., and Li, G.: Health impact of China's Air Pollution Prevention and Control Action Plan: an analysis of national air quality monitoring and mortality data, Lancet Planet. Heal., 2, e313–e323, https://doi.org/10.1016/S2542-5196(18)30141-4, 2018.
Iacono, M. J., Delamere, J. S., Mlawer, E. J., Shephard, M. W., Clough, S. A., and Collins, W. D.: Radiative forcing by long-lived greenhouse gases: Calculations with the AER radiative transfer models, J. Geophys. Res.-Atmos., 113, D13103, https://doi.org/10.1029/2008JD009944, 2008.
Koch, D., Bauer, S. E., Del Genio, A., Faluvegi, G., McConnell, J. R., Menon, S., Miller, R. L., Rind, D., Ruedy, R., Schmidt, G. A., and Shindell, D.: Coupled aerosol-chemistry-climate twentieth-century transient model investigation: Trends in short-lived species and climate responses, J. Clim., 24, 2693–2714, https://doi.org/10.1175/2011JCLI3582.1, 2011.
Leibensperger, E. M., Mickley, L. J., Jacob, D. J., Chen, W.-T., Seinfeld, J. H., Nenes, A., Adams, P. J., Streets, D. G., Kumar, N., and Rind, D.: Climatic effects of 1950–2050 changes in US anthropogenic aerosols – Part 1: Aerosol trends and radiative forcing, Atmos. Chem. Phys., 12, 3333–3348, https://doi.org/10.5194/acp-12-3333-2012, 2012a.
Leibensperger, E. M., Mickley, L. J., Jacob, D. J., Chen, W.-T., Seinfeld, J. H., Nenes, A., Adams, P. J., Streets, D. G., Kumar, N., and Rind, D.: Climatic effects of 1950–2050 changes in US anthropogenic aerosols – Part 2: Climate response, Atmos. Chem. Phys., 12, 3349–3362, https://doi.org/10.5194/acp-12-3349-2012, 2012b.
Li, B., Gasser, T., Ciais, P., Piao, S., Tao, S., Balkanski, Y., Hauglustaine, D., Boisier, J. P., Chen, Z., Huang, M., Zhaoxin Li, L., Li, Y., Liu, H., Liu, J., Peng, S., Shen, Z., Sun, Z., Wang, R., Wang, T., Yin, G., Yin, Y., Zeng, H., Zeng, Z., and Zhou, F.: The contribution of China's emissions to global climate forcing, Nature, 531, 357–361, https://doi.org/10.1038/nature17165, 2016.
Li, H., Yang, Y, Wang, H., Li, B., Wang, P., Li, J., and Liao, H., Constructing a spatiotemporally coherent long-term PM2.5 concentration dataset over China during 1980–2019 using a machine learning approach, Sci. Total Environ., 765, 144263, https://doi.org/10.1016/j.scitotenv.2020.144263, 2021.
Li, H., Yang, Y., Wang, H., Wang, P., Yue, X., and Liao, H., Projected Aerosol Changes Driven by Emissions and Climate Change Using a Machine Learning Method, Environ. Sci. Technol., 56, 3884–3893, https://doi.org/10.1021/acs.est.1c04380, 2022.
Li, K., Jacob, D. J., Liao, H., Shen, L., Zhang, Q., and Bates, K. H.: Anthropogenic drivers of 2013–2017 trends in summer surface ozone in China, P. Natl. Acad. Sci. USA, 116, 422–427, https://doi.org/10.1073/PNAS.1812168116, 2019.
Li, K., Jacob, D. J., Liao, H., Qiu, Y., Shen, L., Zhai, S., Bates, K. H., Sulprizio, M. P., Song, S., Lu, X., Zhang, Q., Zheng, B., Zhang, Y., Zhang, J., Lee, H. C., and Kuk, S. K.: Ozone pollution in the North China Plain spreading into the late-winter haze season, P. Natl. Acad. Sci. USA, 118, e2015797118, https://doi.org/10.1073/pnas.2015797118, 2021.
Liu, X., Ma, P.-L., Wang, H., Tilmes, S., Singh, B., Easter, R. C., Ghan, S. J., and Rasch, P. J.: Description and evaluation of a new four-mode version of the Modal Aerosol Module (MAM4) within version 5.3 of the Community Atmosphere Model, Geosci. Model Dev., 9, 505–522, https://doi.org/10.5194/gmd-9-505-2016, 2016.
Lu, X., Hong, J., Zhang, L., Cooper, O. R., Schultz, M. G., Xu, X., Wang, T., Gao, M., Zhao, Y., and Zhang, Y.: Severe Surface Ozone Pollution in China: A Global Perspective, Environ. Sci. Technol. Lett., 5, 487–494, https://doi.org/10.1021/acs.estlett.8b00366, 2018.
MEIC: Tracking Anthropogenic Emissions in China, MEIC Model [data set], http://meicmodel.org/?page_id=541&lang=en, last access: 27 May 2022.
NCAR – Downloading CESM2 Instructions, [data set], https://www.cesm.ucar.edu/models/cesm2/release_download.html, last access: 26 May 2022.
Pozzoli, L., Janssens-Maenhout, G., Diehl, T., Bey, I., Schultz, M. G., Feichter, J., Vignati, E., and Dentener, F.: Re-analysis of tropospheric sulfate aerosol and ozone for the period 1980–2005 using the aerosol-chemistry-climate model ECHAM5-HAMMOZ, Atmos. Chem. Phys., 11, 9563–9594, https://doi.org/10.5194/acp-11-9563-2011, 2011.
Ren, L., Yang, Y., Wang, H., Wang, P., Chen, L., Zhu, J., and Liao, H.: Aerosol transport pathways and source attribution in China during the COVID-19 outbreak, Atmos. Chem. Phys., 21, 15431–15445, https://doi.org/10.5194/acp-21-15431-2021, 2021.
Samset, B. H., Myhre, G., Forster, P. M., Hodnebrog, Andrews, T., Faluvegi, G., Fläschner, D., Kasoar, M., Kharin, V., Kirkevåg, A., Lamarque, J. F., Olivié, D., Richardson, T., Shindell, D., Shine, K. P., Takemura, T., and Voulgarakis, A.: Fast and slow precipitation responses to individual climate forcers: A PDRMIP multimodel study, Geophys. Res. Lett., 43, 2782–2791, https://doi.org/10.1002/2016GL068064, 2016.
Shindell, D. T., Levy, H., Schwarzkopf, M. D., Horowitz, L. W., Lamarque, J. F., and Faluvegi, G.: Multimodel projections of climate change from short-lived emissions due to human activities, J. Geophys. Res.-Atmos., 113, 1–18, https://doi.org/10.1029/2007JD009152, 2008.
Smith, C. J., Kramer, R. J., Myhre, G., Alterskjær, K., Collins, W., Sima, A., Boucher, O., Dufresne, J.-L., Nabat, P., Michou, M., Yukimoto, S., Cole, J., Paynter, D., Shiogama, H., O'Connor, F. M., Robertson, E., Wiltshire, A., Andrews, T., Hannay, C., Miller, R., Nazarenko, L., Kirkevåg, A., Olivié, D., Fiedler, S., Lewinschal, A., Mackallah, C., Dix, M., Pincus, R., and Forster, P. M.: Effective radiative forcing and adjustments in CMIP6 models, Atmos. Chem. Phys., 20, 9591–9618, https://doi.org/10.5194/acp-20-9591-2020, 2020.
Turnock, S. T., Spracklen, D. V., Carslaw, K. S., Mann, G. W., Woodhouse, M. T., Forster, P. M., Haywood, J., Johnson, C. E., Dalvi, M., Bellouin, N., and Sanchez-Lorenzo, A.: Modelled and observed changes in aerosols and surface solar radiation over Europe between 1960 and 2009, Atmos. Chem. Phys., 15, 9477–9500, https://doi.org/10.5194/acp-15-9477-2015, 2015.
van Marle, M. J. E., Kloster, S., Magi, B. I., Marlon, J. R., Daniau, A.-L., Field, R. D., Arneth, A., Forrest, M., Hantson, S., Kehrwald, N. M., Knorr, W., Lasslop, G., Li, F., Man- geon, S., Yue, C., Kaiser, J. W., and van der Werf, G. R.: Historic global biomass burning emissions for CMIP6 (BB4CMIP) based on merging satellite observations with proxies and fire models (1750–2015), Geosci. Model Dev., 10, 3329–3357, https://doi.org/10.5194/gmd-10-3329-2017, 2017.
Wang, Y., Liu, X., Hoose, C., and Wang, B.: Different contact angle distributions for heterogeneous ice nucleation in the Community Atmospheric Model version 5, Atmos. Chem. Phys., 14, 10411–10430, https://doi.org/10.5194/acp-14-10411-2014, 2014.
Wang, Z., Lin, L., Xu, Y., Che, H., Zhang, X., Dong, W., Wang, C., Gui, K., and Xie, B.: Incorrect Asian aerosols affecting the attribution and projection of regional climate change in CMIP6 models, npj Clim. Atmos. Sci., 4, 2, https://doi.org/10.1038/s41612-020-00159-2, 2021.
Xie, F., Ma, X., Li, J., Huang, J., Tian, W., Zhang, J., Hu, Y., Sun, C., Zhou, X., Feng, J., and Yang, Y.: An advanced impact of Arctic stratospheric ozone changes on spring precipitation in China, Clim. Dynam., 51, 4029–4041, https://doi.org/10.1007/s00382-018-4402-1, 2018.
Xu, Q., Wang, S., Jiang, J., Bhattarai, N., Li, X., Chang, X., Qiu, X., Zheng, M., Hua, Y., and Hao, J.: Nitrate dominates the chemical composition of PM2.5 during haze event in Beijing, China, Sci. Total Environ., 689, 1293–1303, https://doi.org/10.1016/j.scitotenv.2019.06.294, 2019.
Yang, Y.: Data for “Climate impacts of emission reductions in China during 2013–2017”, Zenodo [data set], https://doi.org/10.5281/zenodo.5833003, 2022.
Yang, Y., Liao, H., and Li, J., Impacts of the East Asian summer monsoon on interannual variations of summertime surface-layer ozone concentrations over China, Atmos. Chem. Phys., 14, 6867–6880, https://doi.org/10.5194/acp-14-6867-2014, 2014.
Yang, Y., Liao, H., and Lou, S., Increase in winter haze over eastern China in recent decades: Roles of variations in meteorological parameters and anthropogenic emissions, J. Geophys. Res.-Atmos., 121, 13050–13065, https://doi.org/10.1002/2016JD025136, 2016.
Yang, Y., Wang, H., Smith, S. J., Easter, R., Ma, P.-L., Qian, Y., Yu, H., Li, C., and Rasch, P. J.: Global source attribution of sulfate concentration and direct and indirect radiative forcing, Atmos. Chem. Phys., 17, 8903–8922, https://doi.org/10.5194/acp-17-8903-2017, 2017a.
Yang, Y., Wang, H., Smith, S. J., Ma, P.-L., and Rasch, P. J., Source attribution of black carbon and its direct radiative forcing in China, Atmos. Chem. Phys., 17, 4319–4336, https://doi.org/10.5194/acp-17-4319-2017, 2017b.
Yang, Y., Smith, S. J., Wang, H., Mills, C. M., and Rasch, P. J., Variability, timescales, and nonlinearity in climate responses to black carbon emissions, Atmos. Chem. Phys., 19, 2405–2420, https://doi.org/10.5194/acp-19-2405-2019, 2019.
Yang, Y., Ren, L., Li, H., Wang, H., Wang, P., Chen, L., Yue, X., and Hong, L., Fast climate responses to aerosol emission reductions during the COVID-19 pandemic, Geophys. Res. Lett., 47, e2020GL089788, https://doi.org/10.1029/2020GL089788, 2020.
Yang, Y., Li, M., Wang, H., Li, H., Wang, P., Li, K., Gao, M., and Liao, H., ENSO modulation of summertime tropospheric ozone over China, Environ. Res. Lett., 17, 034020, https://doi.org/10.1088/1748-9326/ac54cd, 2022.
Zeng, L., Yang, Y., Wang, H., Wang, J., Li, J., Ren, L., Li, H., Zhou, Y., Wang, P., and Liao, H.: Intensified modulation of winter aerosol pollution in China by El Niño with short duration, Atmos. Chem. Phys., 21, 10745–10761, https://doi.org/10.5194/acp-21-10745-2021, 2021.
Zhang, W., Yun, X., Meng, W., Xu, H., Zhong, Q., Yu, X., Shen, H., Chen, Y., Shen, G., Ma, J., and Cheng, H.: Urban residential energy switching in China between 1980 and 2014 prevents 2.2 million premature deaths, One Earth, 4, 1602–1613, https://doi.org/10.1016/j.oneear.2021.10.013, 2021
Zhang, Z., Guan, H., Luo, L., Zheng, N., and Xiao, H.: Response of fine aerosol nitrate chemistry to Clean Air Action in winter Beijing: Insights from the oxygen isotope signatures, Sci. Total Environ., 746, 141210, https://doi.org/10.1016/J.SCITOTENV.2020.141210, 2020.
Zheng, B., Tong, D., Li, M., Liu, F., Hong, C., Geng, G., Li, H., Li, X., Peng, L., Qi, J., Yan, L., Zhang, Y., Zhao, H., Zheng, Y., He, K., and Zhang, Q.: Trends in China's anthropogenic emissions since 2010 as the consequence of clean air actions, Atmos. Chem. Phys., 18, 14095–14111, https://doi.org/10.5194/acp-18-14095-2018, 2018.
Zheng, Y., Zhang, Q., Tong, D., Davis, S. J., and Caldeira, K.: Climate effects of China's efforts to improve its air quality, Environ. Res. Lett., 15, 104052, https://doi.org/10.1088/1748-9326/ab9e21, 2020.
- Abstract
- Introduction
- Materials and methods
- Changes in aerosols and O3 in China from 2013 to 2017
- Fast climate responses to emission reductions in China
- Impacts of aerosol reductions from individual sectors
- Conclusions and discussions
- Code and data availability
- Author contributions
- Competing interests
- Disclaimer
- Acknowledgements
- Financial support
- Review statement
- References
- Supplement