the Creative Commons Attribution 4.0 License.
the Creative Commons Attribution 4.0 License.
 | 01 Jun 2022
Measurement report: Variations in surface SO2 and NOx mixing ratios from 2004 to 2016 at a background site in the North China Plain
Xueli Liu
Liang Ran
Xiaobin Xu
Zhiqiang Ma
Fan Dong
Di He
Liyan Zhou
Qingfeng Shi
Yao Wang
Strict air pollution control strategies have been implemented in recent decades in the North China Plain (NCP), previously one of the most polluted regions in the world, and have resulted in considerable changes in emissions of air pollutants. However, little is so far known about the long-term trends of the regional background level of NOx and SO2, along with the increase and decrease processes of regional emissions. In this study, the seasonal and diurnal variations of NOx and SO2 as well as their long-term trends at a regional background station in the NCP were characterized from 2004 to 2016. On average, SO2 and NOx mixing ratios were 5.7 ± 8.4 and 14.2 ± 12.4 ppb, respectively. The seasonal variations in SO2 and NOx mixing ratios showed a similar pattern, with a peak in winter and a valley in summer. However, the diurnal variations in SO2 and NOx mixing ratios greatly differed for all seasons, indicating different sources for SO2 and NOx and meteorological effects on their concentrations. Overall, the annual mean SO2 exhibited a significant decreasing trend of −6.1 % yr−1 (R = −0.84, P < 0.01) from 2004 to 2016, which is very close to −6.3 % yr−1 of the annual SO2 emission in Beijing, and a greater decreasing trend of −7.4 % yr−1 (R = −0.95, P < 0.01) from 2008 to 2016. The annual mean of NOx showed a fluctuating rise of +3.4 % yr−1 (R = 0.38, P = 0.40) from 2005 to 2010, reaching the peak value (16.9 ppb) in 2010, and then exhibited an extremely significant fluctuating downward trend of −4.5 % yr−1 (R = 0.95, P < 0.01) from 2010 to 2016. After 2010, the annual mean NOx mixing ratios correlated significantly (R = 0.94, P < 0.01) with the annual NOx emission in North China. The decreasing rate (−4.8 % yr−1, R = −0.92, P < 0.01) of the annual mean NOx mixing ratios from 2011 to 2016 at the Shangdianzi (SDZ) regional atmospheric background station is lower than the one (−8.8 % yr−1, R = −0.94, P < 0.01) for the annual NOx emission in the NCP and in Beijing (−9.0 % yr−1, R = −0.96, P < 0.01). This indicated that surface NOx mixing ratios at SDZ had a weaker influence than SO2 on the emission reduction in Beijing and its surrounding areas in the NCP. The increase in the number of motor vehicles led to an increase in traffic emissions for NOx. This study supported conclusions from previous studies that the measures taken for controlling NOx and SO2 in the NCP in the past decades were generally successful. However, NOx emission control should be strengthened in the future.
- Article
(5377 KB) - Full-text XML
-
Supplement
(2763 KB) - BibTeX
- EndNote


Acid gases sulfur dioxide (SO2) and nitrogen oxides (NOx) are closely related to climate, ecology, environment and human health. They are important gaseous pollutants in China (Xu et al., 2009) and also recommended by the Global Atmosphere Watch (GAW) of the World Meteorological Organization (WMO) for priority observation (WMO, 2001). They can also be transformed into nitrate and sulfate aerosols, which play an important role in the formation of aerosol pollution and acid rain (Yang et al., 2011; Cheng et al., 2013; Luo et al., 2016; Chen et al., 2017). Sulfate and nitrate constitute more than one-third of PM2.5 mass concentration and can cause serious respiratory diseases (S. Yang et al., 2010; F. Yang et al., 2011; Gao et al., 2012; Zhao et al., 2013; R. Liu et al., 2014).
With economic development, population growth and rapid urbanization, air pollution in China has exhibited the characteristics of regional pollution centering in urban areas in recent years (Shao et al., 2006; Xu et al., 2008). Many studies thereby focused on regional pollution (Qi et al., 2012; Li et al., 2015), instead of local and suburban pollution as previously done (Liu et al., 2008; Lin et al., 2009a). Local and suburban pollution is closely associated with air pollutants emitted locally and limited on a smaller scale, such as a town, a city or an urban area. Regional pollution occurs over the whole region and is usually associated with large-scale emissions and significantly influenced by transport and accompanying processes, such as chemical reactions and deposition. In China, city clusters have been formed for decades, and air pollution often shows regional characteristics. In particular, the North China Plain (NCP) region, a heavily industrialized and densely populated area with considerable agricultural activities, is one of the most polluted regions of the world. The strong emissions of SO2 and NOx in the NCP showed typical regional characteristics (Wu et al., 2010; Lin et al., 2012; X. Liu et al., 2014); i.e., similar changes in seasonal and diurnal patterns of NOx and SO2 had been observed at different types of sites in this region in previous studies. Previous studies have combined observations at the background site and the urban site for comparisons (X. Liu et al., 2014) or selected short-term observations (1–2 years or one to two seasons) for the comparative study before and after major activities, in order to quantitatively evaluate the effect of implementing control measures during the event (Cheng et al., 2015; Li et al., 2019; Lin et al., 2011a, 2012; Wei et al., 2016; Wu et al., 2010; Zhong et al., 2020). Most of the long-term studies (more than 10 years) evaluated the temporal and spatial variations of SO2 and NOx, based on satellite measurements of the vertical column density (Zhang et al., 2007; Cai et al., 2018; Shikwambana et al., 2020). However, there were few studies on the long-term trend of SO2 and NOx based on ground-level observations (Bai et al., 2015), especially in the background area of the NCP and with a time span of more than 10 years.
In this study, we analyzed the long-term variations in surface SO2 and NOx mixing ratios observed at a regional WMO GAW station in the NCP and discussed their influencing factors and their responses to pollution control measures, so as to provide scientific basis for designing further strategies for controlling SO2 and NOx on a regional scale.
Surface SO2 and NOx mixing ratios were measured at the Shangdianzi (SDZ) regional atmospheric background station (117∘07′ E, 40∘39′ N; 293.3 ). SDZ is located in Shangdianzi Village in Miyun District of Beijing, China. It is about 110 km northeast of urban Beijing. The measurements of air pollutants at this site could represent the background conditions in the NCP (Lin et al., 2008; Z. Meng et al., 2009).
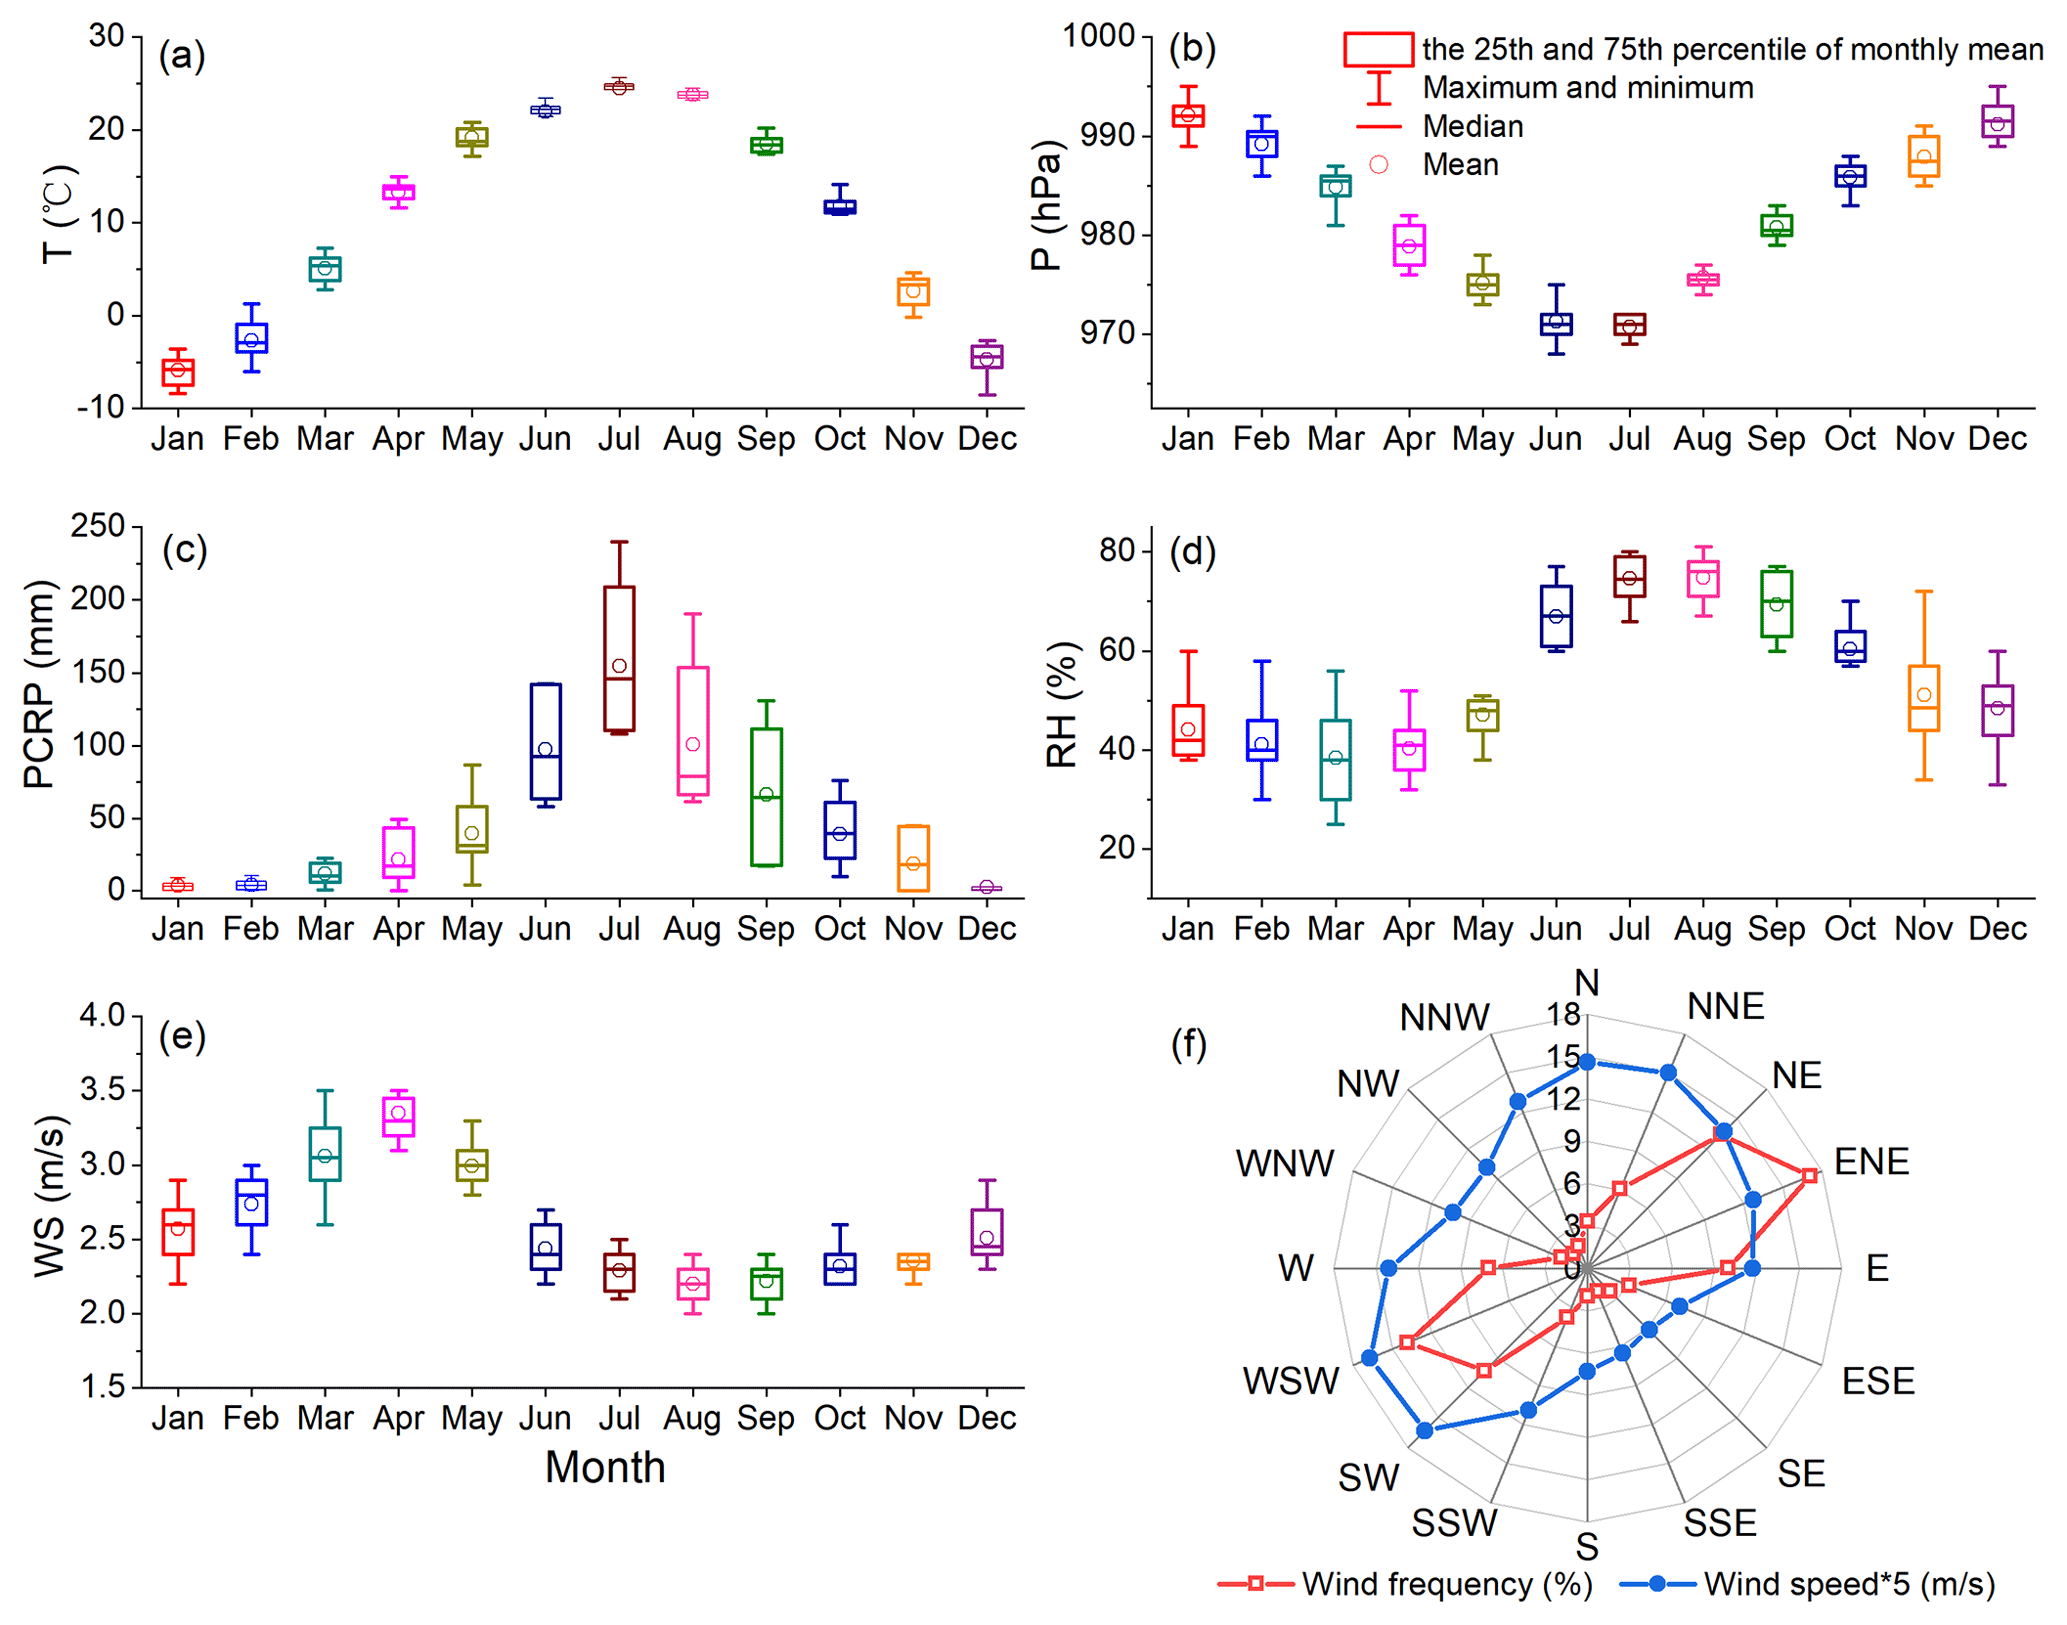
Figure 1Monthly variations in (a) air temperature, (b) atmospheric pressure, (c) precipitation, (d) relative humidity and (e) wind speed and (f) wind rose map at SDZ.
SDZ is situated on the north hill side of a northeast–southwest valley, with farmlands in the south. Corn and wheat were the main crops but were recently replaced by fruit trees. It lies in a warm temperate and semi-humid climate zone, with a short spring and autumn but a long winter and summer. Monthly averages of meteorological parameters such as temperature (T), pressure (P), precipitation (PRCP), relative humidity (RH), wind speed (WS) and wind direction are shown in Fig. 1. Precipitation occurs mainly in summer. The prevailing wind directions were from NE–ENE and WSW–SW. Stronger wind speeds appear in spring and weaker in summer.
In situ measurements of SO2 and NOx mixing ratios were made using a pulsed fluorescence SO2 analyzer (Model 43C-TL, Thermo Fisher Scientific, MA, USA) and a chemiluminescence NOx analyzer (Model 42C-TL, Thermo Fisher Scientific, MA, USA), respectively. The detection limits of the Model 43C-TL SO2 analyzer and the Model 42C-TL NOx analyzer are 0.05 ppb (300 s averaging time) and 0.05 ppb (120 s averaging time), respectively. In the Model 42C-TL NOx analyzer, NO2 is converted to NO by a molybdenum NO2-to-NO converter heated to about 325 ∘C. The conversion efficiency was checked annually using gas-phase titration of an NO standard with O3. The converter was replaced if the conversion efficiency was found lower than 96 %. The drawback in this NO2 converter was known to suffer from the interference of other NOy compounds such as PAN and HNO3 (Steinbacher et al., 2007; Jung et al., 2017), which was also discussed in Yin et al. (2022). As it is not possible in our case to remove the interference, the reported NO2 and NOx levels should be treated as upper limits. In order to obtain long-term trends of atmospheric components at a regional atmospheric background station, the observations are required to be accurate, reliable and comparable. Therefore, strict and effective quality control measures were implemented during the observation (Lin et al., 2019). Daily zero and span checks were routinely and automatically carried out. Multi-point calibrations were done monthly. The standard gases used at the site were compared against NIST-traceable standard gases to ensure data comparability (Lin et al., 2009b). During the period from January 2005 to May 2017, the percentages of effective hourly mean data of SO2 and NOx are 97.1 % and 96.7 %, respectively. The wind speed (WS), wind direction (WD), air temperature (T), precipitation (PRCP), relative humidity (RH) and atmospheric pressure (P) during the same period are from the routine meteorological observations. We used a hybrid single-particle Lagrangian integrated trajectory model (Hysplit4.9) from the National Oceanic and Atmospheric Administration, USA, with the NCEP–NCAR reanalysis meteorological data set (https://ready.arl.noaa.gov/archives.php, last access: 7 October 2021) to calculate the atmospheric mixed-layer heights.

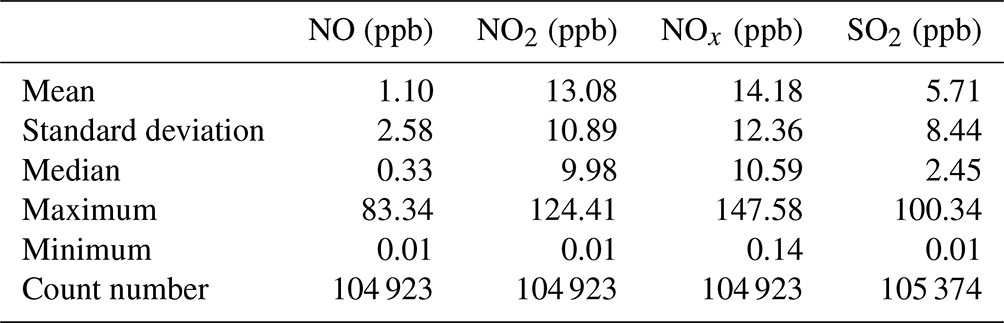
Table 1Statistics in the hourly mean of SO2 and NOx mixing ratios at SDZ.
3.1 Observational levels
The time series and statistic results of hourly mean SO2 and NOx mixing ratios during the observational period at SDZ are shown in Fig. 2 and Table 1, respectively. The hourly mean SO2 mixing ratios ranged from 0.01 to 100.34 ppb, with 193 h (0.18 %) exceeding the limit of 57 ppb set in China's National Ambient Air Quality Standards (GB3095-2012, Grade I). The hourly mean NO2 mixing ratios ranged from 0.01 to 124.4 ppb, with 5 h exceeding the limit of 106 ppb (GB3095-2012, Grade I). The SO2 mixing ratios exhibited an extremely significant downward trend (−0.37 ppb yr−1, R = −0.20, P < 0.01) during the measurement period and a higher downward trend (−1.10 ppb yr−1, R = −0.22, P < 0.01) from 2013 to 2017. The NOx mixing ratios exhibited a much smaller but significant downward trend (−0.03 ppb yr−1, R = −0.01, P < 0.05). Details of the trends and the influencing factors will be discussed in Sect. 3.4.
Table 2NOx and SO2 levels in the atmospheric background stations in China.
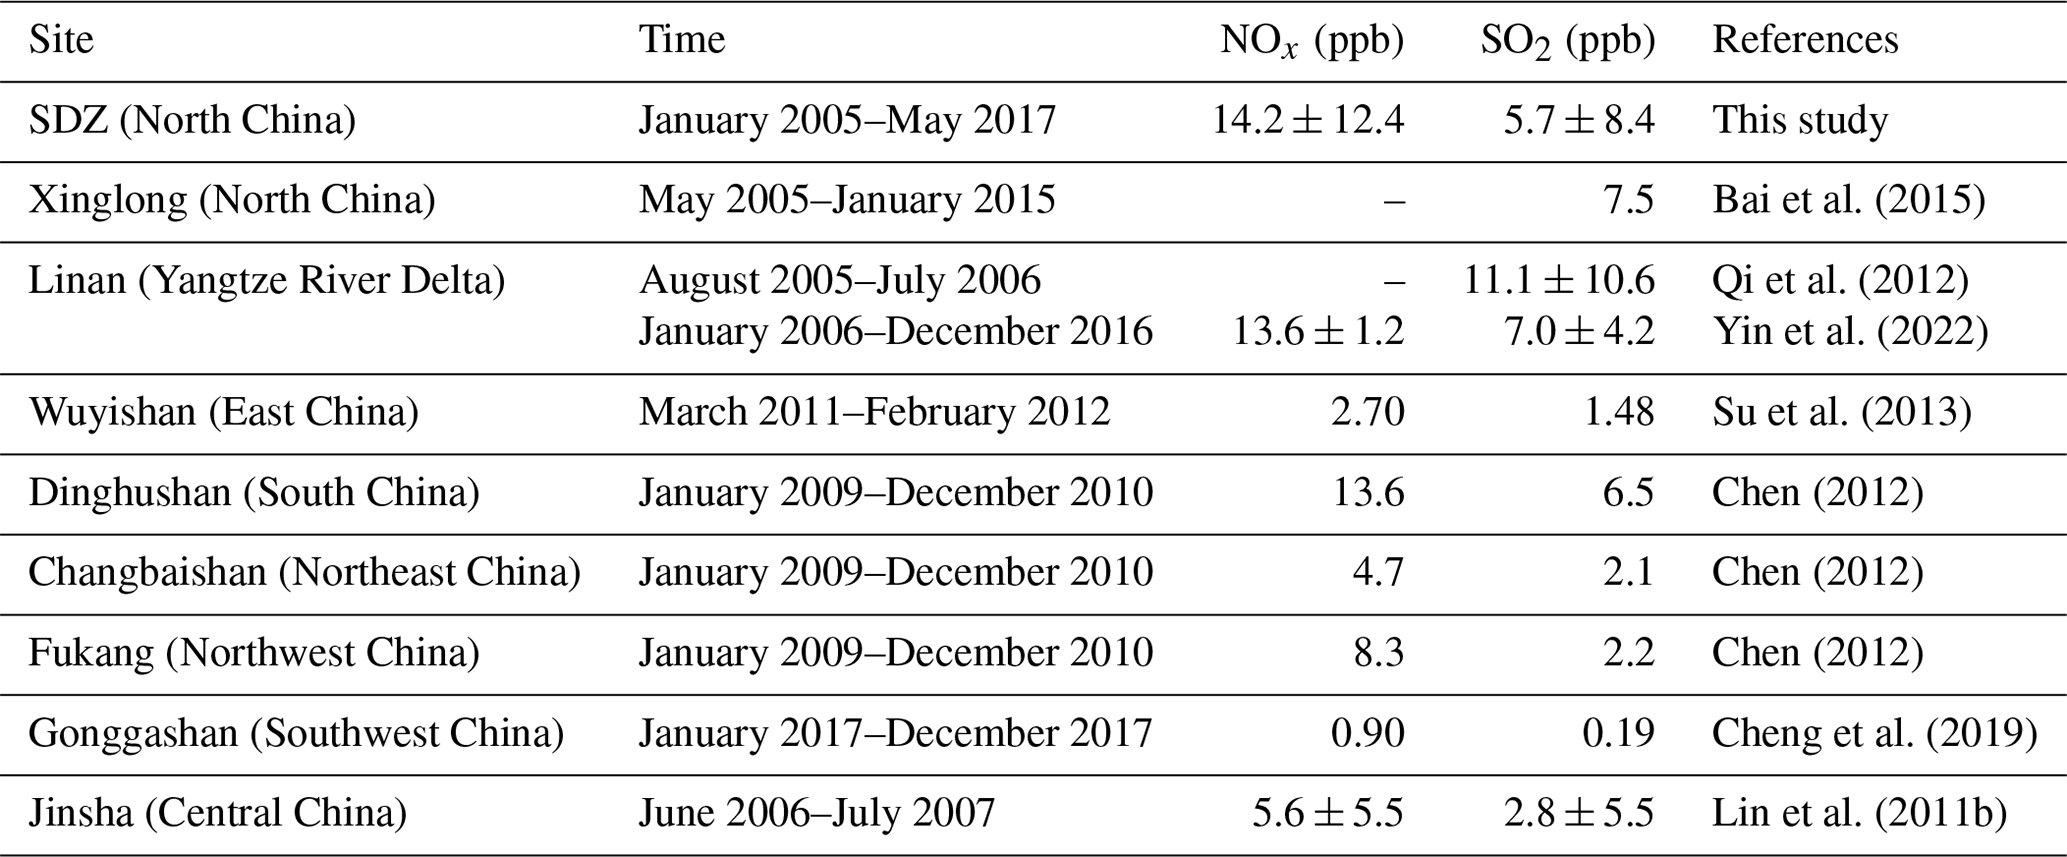
As shown in Table 1, the average values ± 1σ (standard deviation) of SO2, NO, NO2 and NOx concentrations are 5.7 ± 8.4, 1.1 ± 2.6, 13.1 ± 10.9 and 14.2 ± 12.4 ppb, respectively. The results were close to the annual average concentrations of SO2 (5.9 ± 10.0 ppb), NO (0.8 ± 2.0 ppb), NO2 (13.8 ± 13.1 ppb) and NOx (14.5 ± 14.0 ppb) at SDZ in 2004 reported by Z. Meng et al. (2009). Compared with other background stations in China (Table 2), the SO2 and NOx mixing ratios at SDZ are both at a relatively high level.
3.2 Monthly variations
Surface SO2 and NOx mixing ratios at SDZ showed a similar seasonal pattern with high values in winter and low values in summer (Fig. 3). The highest SO2 level appeared in winter (9.5 ppb), with the maximum monthly mean in February (10.6 ppb), followed by that in spring (7.3 ppb) and autumn (5.0 ppb), and the lowest in summer (2.1 ppb), with the minimum in July (1.5 ppb). The concentration of NOx was higher in winter (18.1 ppb) and autumn (16.5 ppb) and lower in spring (13.0 ppb) and summer (9.2 ppb). The maximum monthly mean NOx appeared in November (21.7 ppb) and the minimum one in August (8.7 ppb). The seasonal patterns of SO2 and NOx at SDZ were similar to those in urban and rural areas in North China (X. Meng et al., 2009; Lin et al., 2012; Song et al., 2016; Tang et al., 2016; Chen, 2017; Zhao et al., 2020), which were characterized by high levels in the heating period and low levels in summer.
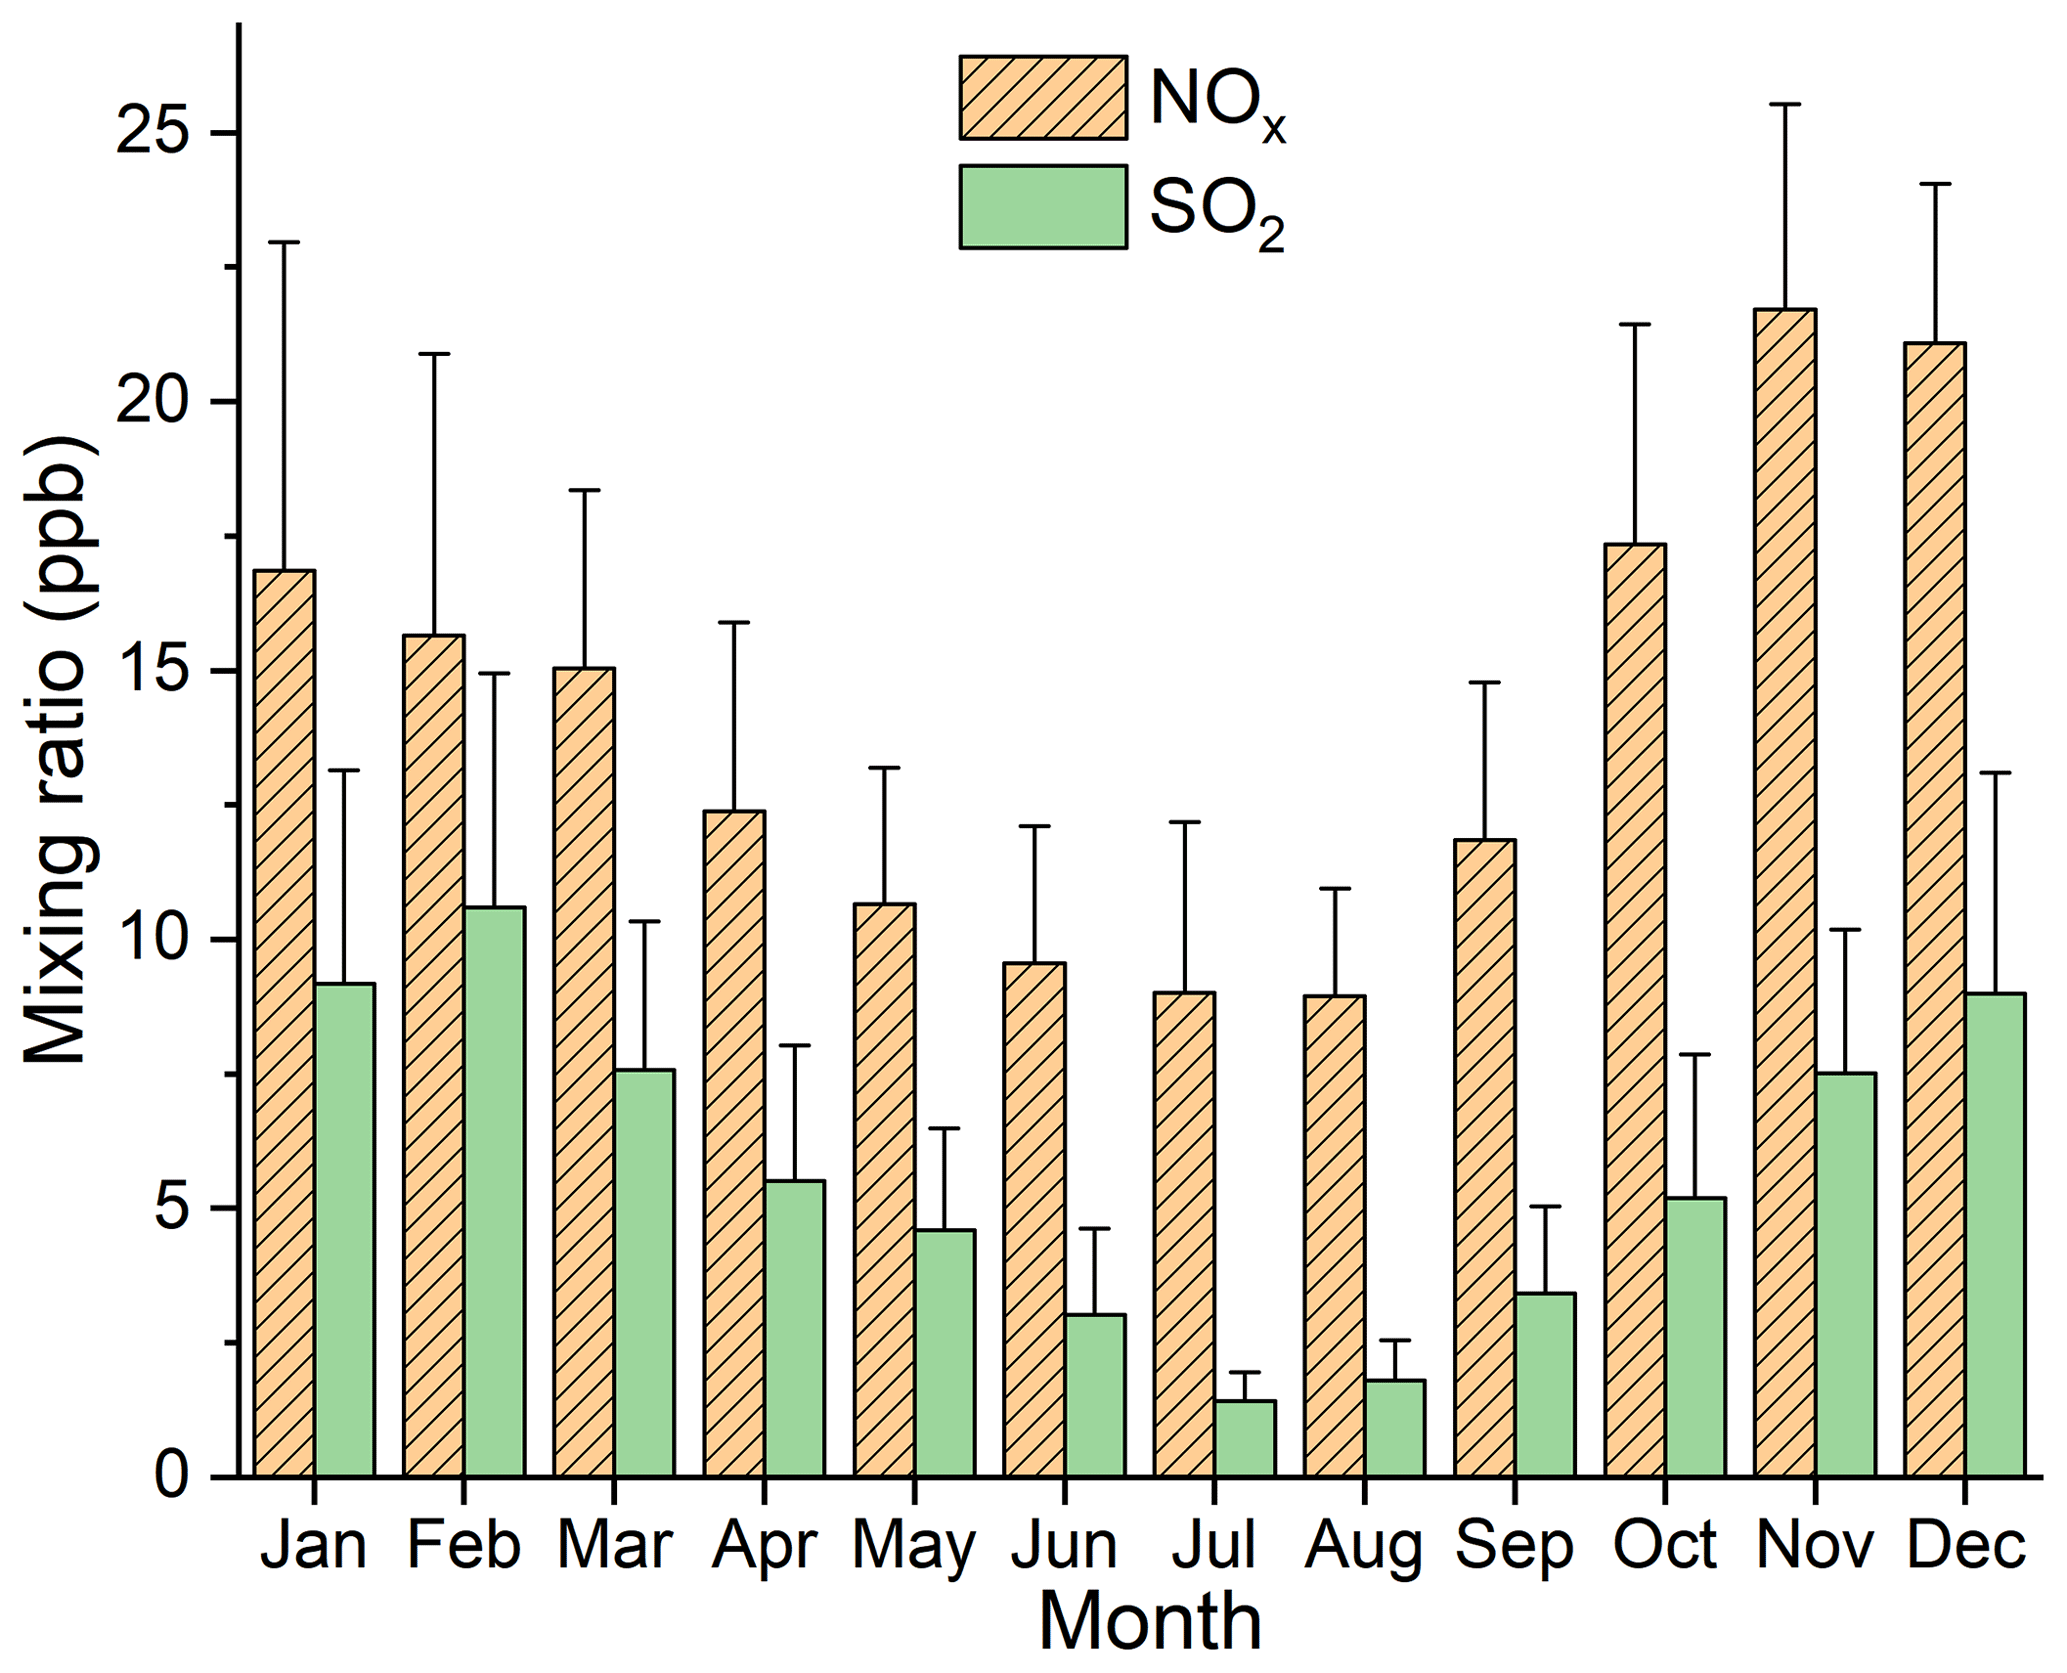
The heating period in North China was from November to March. Coal burning was used to be the major source for heating in the NCP, but it has been gradually substituted by natural gas since 2013 in urban areas. In the rural areas, however, there was still burning of coal and wood for heating. The emissions of SO2 and NOx in the heating period were higher than those in the non-heating periods. Compared with the non-heating period, lower temperature, drier air, weaker solar radiation, less precipitation and lower mixing depth heights were found in the heating period, resulting in lower atmospheric chemical reaction rate of SO2 and NOx, smaller removal effect of precipitation, weaker vertical diffusion, longer atmospheric lifetime and thus higher concentrations.
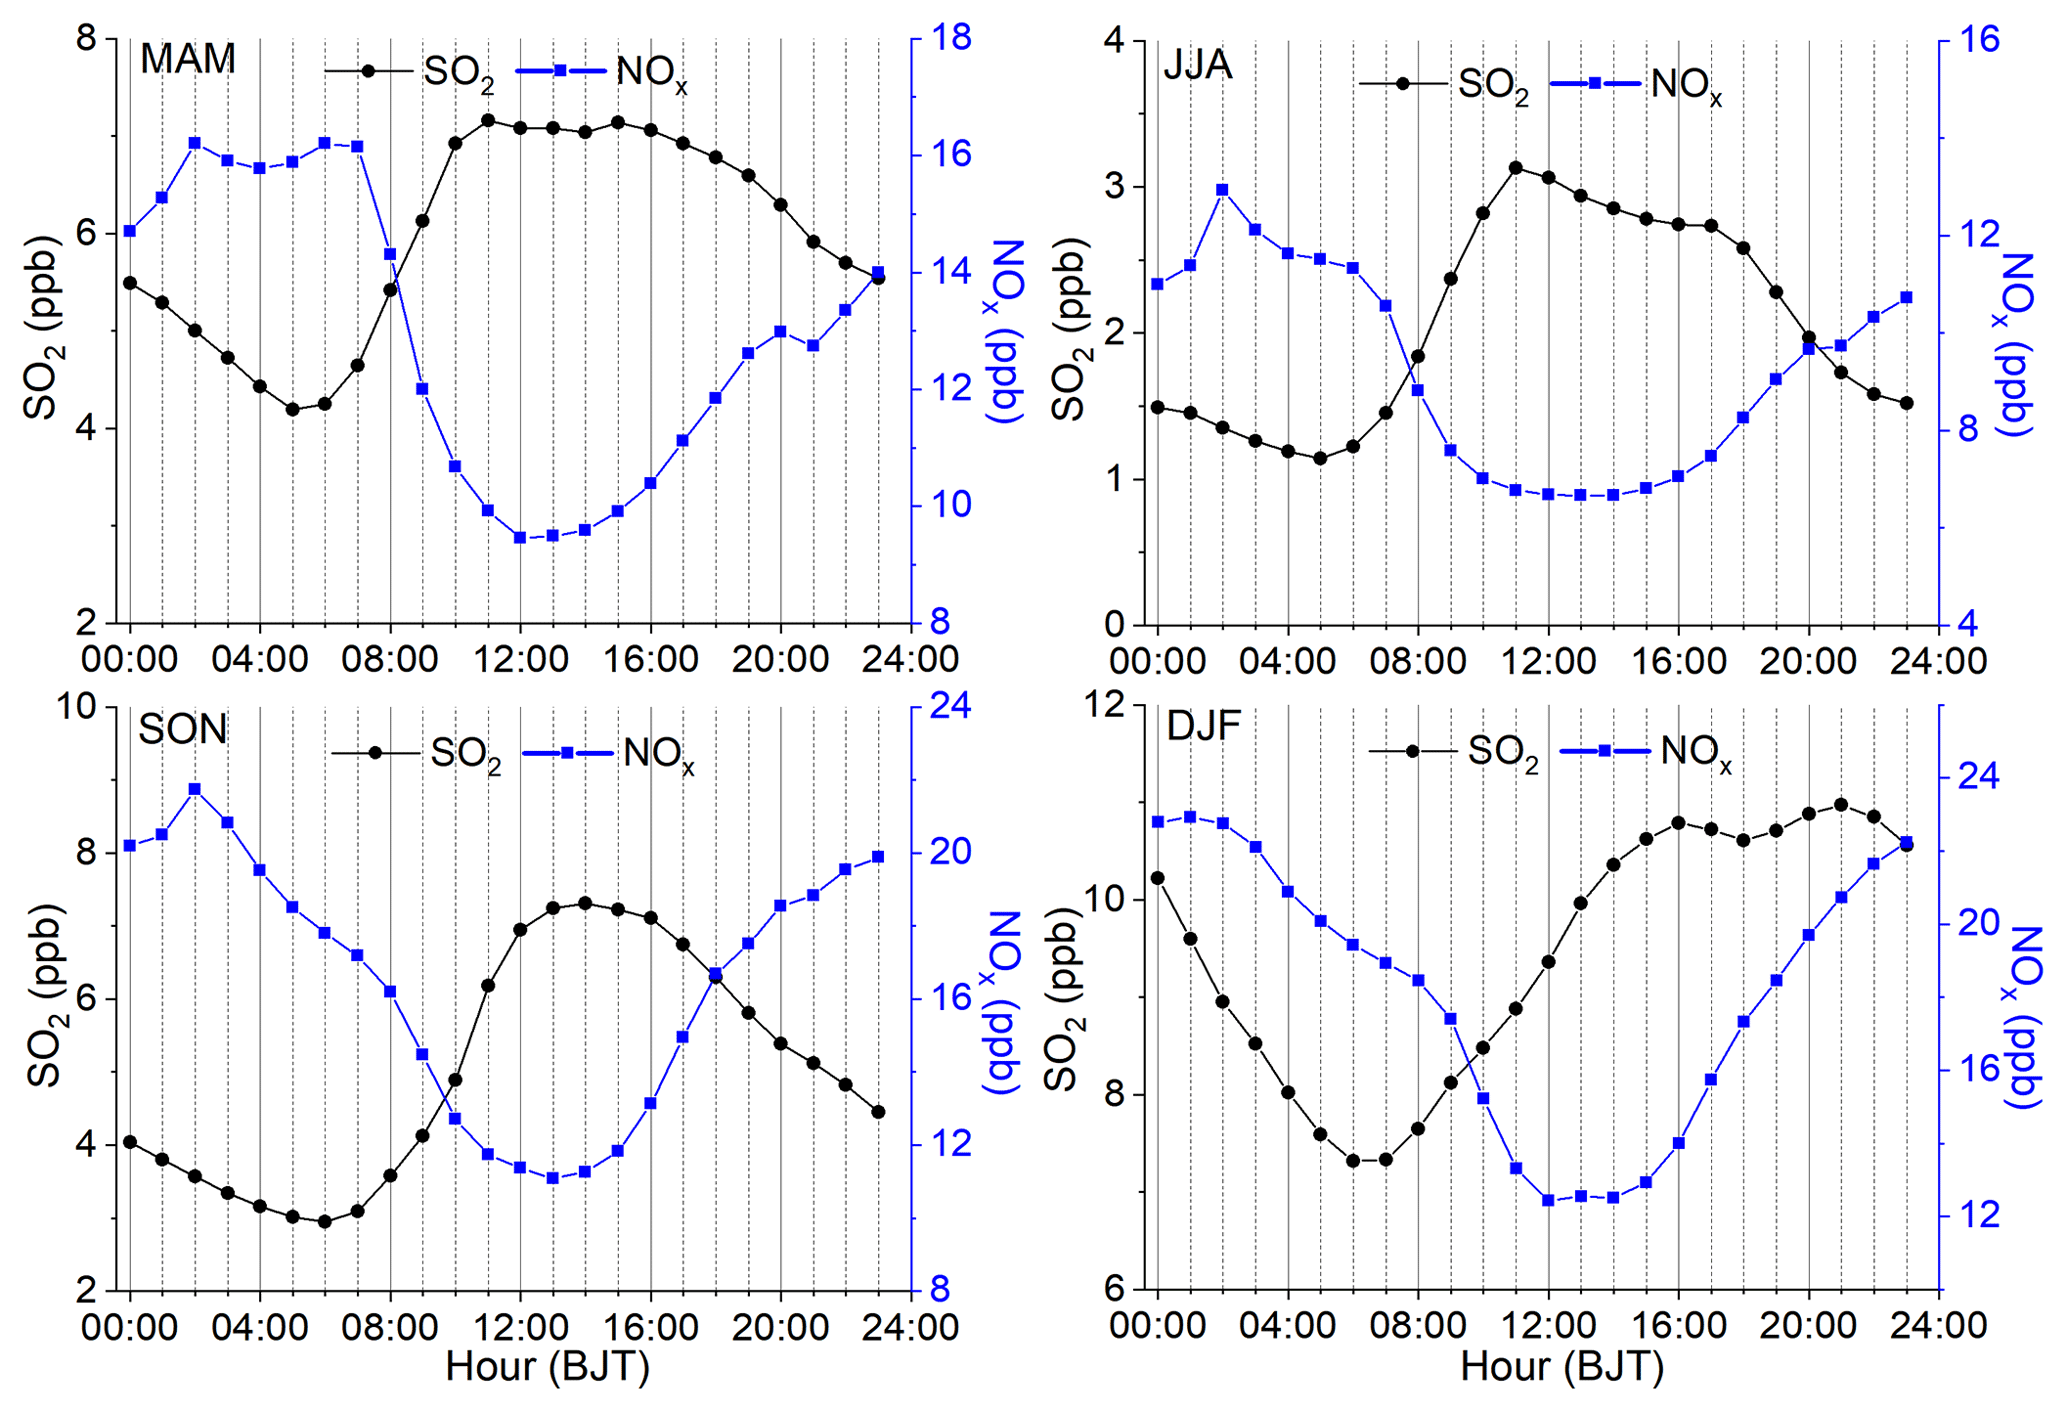
3.3 Diurnal variations
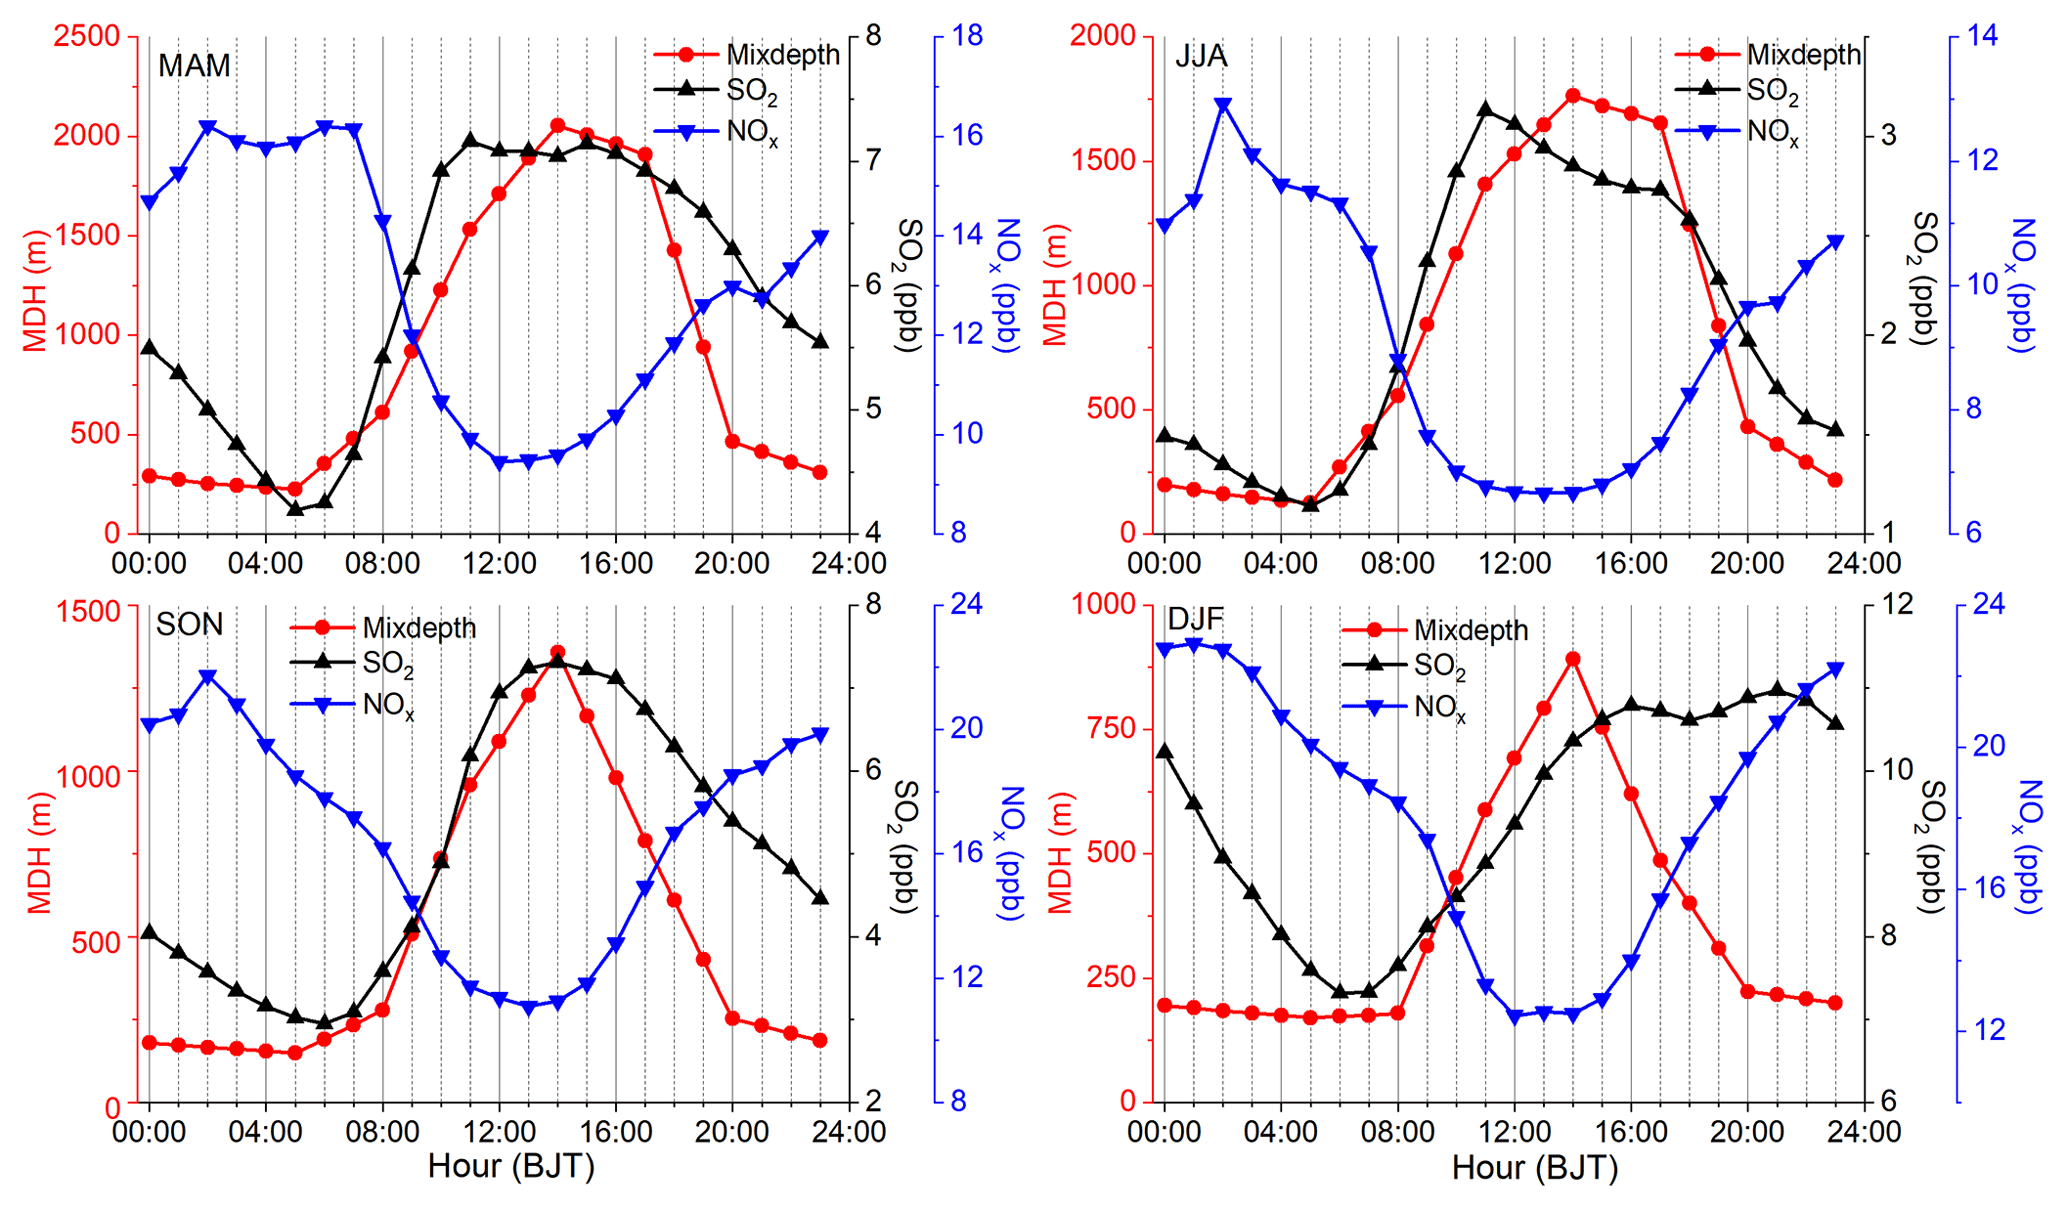
The average diurnal variations in SO2 and NOx mixing ratios at SDZ in different seasons are shown in Fig. 4. The SO2 mixing ratios peaked at 11:00 (all times are in UTC+8, Beijing time) in spring and summer, 14:00 in autumn and 21:00 in winter. The NOx mixing ratios peaked at 01:00 in winter and 02:00 in spring, autumn and summer. In addition, the valley of SO2 diurnal cycle appeared at 05:00 in spring and summer and 06:00 in autumn and winter, whereas for NOx it was at 12:00 in spring, 13:00 in summer, 13:00 in autumn and 12:00 in winter, respectively. The diurnal behaviors of NOx and SO2 mixing ratios are different. Generally, the average daily amplitudes of SO2 are 3.0 ppb in spring, 2.0 ppb in summer, 4.4 ppb in autumn and 3.7 ppb in winter, respectively, while the average daily amplitudes of NOx are 6.8 ppb in spring, 6.3 ppb in summer, 10.6 ppb in autumn and 10.5 ppb in winter, respectively.
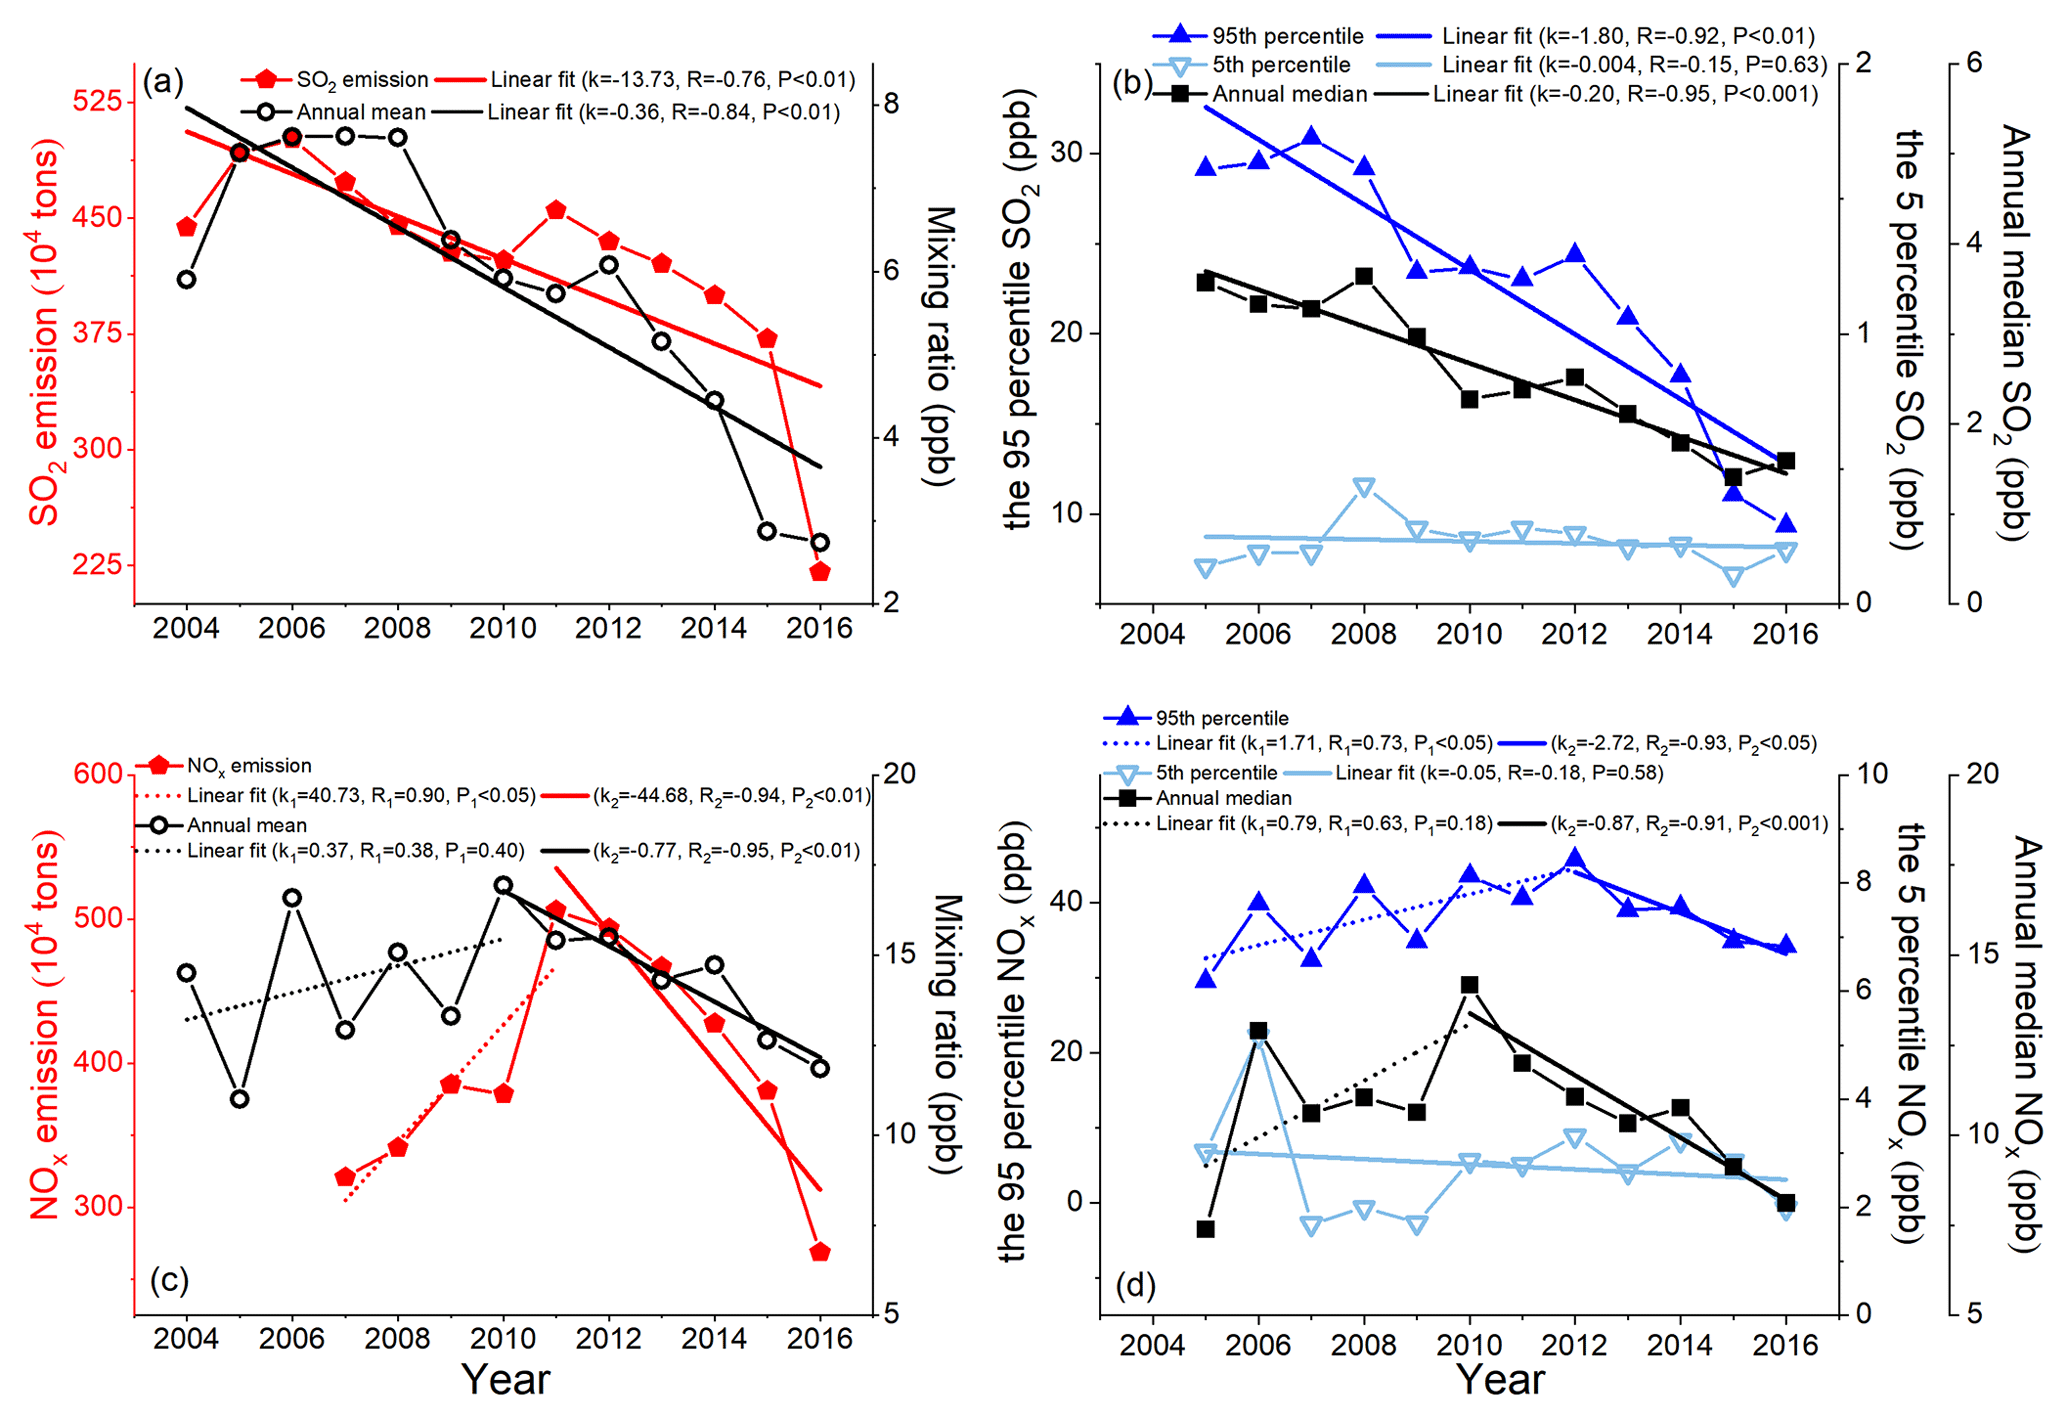
Figure 5Annual variations in (a) SO2 mixing ratios at SDZ and total SO2 emissions in North China, (b) the 5th and 95th percentile of the hourly mean and annual median of SO2 mixing ratios and SO2 emissions in North China, (c) NOx mixing ratios at SDZ and total NOx emissions in North China, and (d) the 5th and 95th percentile of the hourly mean and annual median of NOx mixing ratios and NOx emissions in North China. The emission data are from the 2005–2017 Yearbook of National Bureau of Statistics of China and the China Statistical Yearbook on Environment provided by the Ministry of Ecology and Environment of the People's Republic of China.
3.4 Long-term trends of SO2 and NOx mixing ratios
Figure 5a shows the annual mean SO2 mixing ratios from 2004 to 2016 at the SDZ site, as well as the annual SO2 emissions in North China (including Beijing, Tianjin, Hebei, Shanxi and Inner Mongolia). The annual mean SO2 mixing ratio in 2004 was from Z. Meng et al. (2009). The SO2 emission peaked in 2006 and then decreased in time. Meanwhile, the annual mean SO2 mixing ratio reached a high level around 7.6 ppb during 2006–2008 and then began to decline thereafter. A rebound in SO2 emission occurred in 2011, while a lagged rise of SO2 mixing ratio occurred in 2012. Overall, the annual mean SO2 exhibited a significant decreasing trend of −0.36 ppb yr−1 (−6.1 % yr−1, R = −0.84, P < 0.01) from 2004 to 2016 and a greater decreasing trend of −0.56 ppb yr−1 (−7.4 % yr−1, R = −0.95, P < 0.01) from 2008 to 2016.
Figure 5b shows the long-term variations in the annual 5th and 95th percentile values of the hourly mean and annual median of SO2 mixing ratios in different years. The 95th percentile indicated the influence of polluted air masses, while the 5th percentile indicated the influence of clean air masses. Similar to the trends of annual mean SO2 mixing ratios, the 95th percentile of SO2 reached its peak (30.87 ppb) in 2007 and a little decrease in 2008 (29.19 ppb). After 2008, it began to decline. Compared with the SO2 level in 2008, there was a great decrease (−19.8 %) in 2009, but from 2009 to 2012 there was no significant decline in annual mean and annual median of SO2. The most significant downward trend of the 95th percentile of SO2 was found from 2012 to 2016, with a rate of −3.98 ppb yr−1 (−16.3 % yr−1, R = −0.99, P < 0.01). However, the 5th percentile of SO2 mixing ratios did not change significantly of −0.05 ppb yr−1 (−2.6 % yr−1, R = −0.15, P = 0.6) from 2005 to 2016.
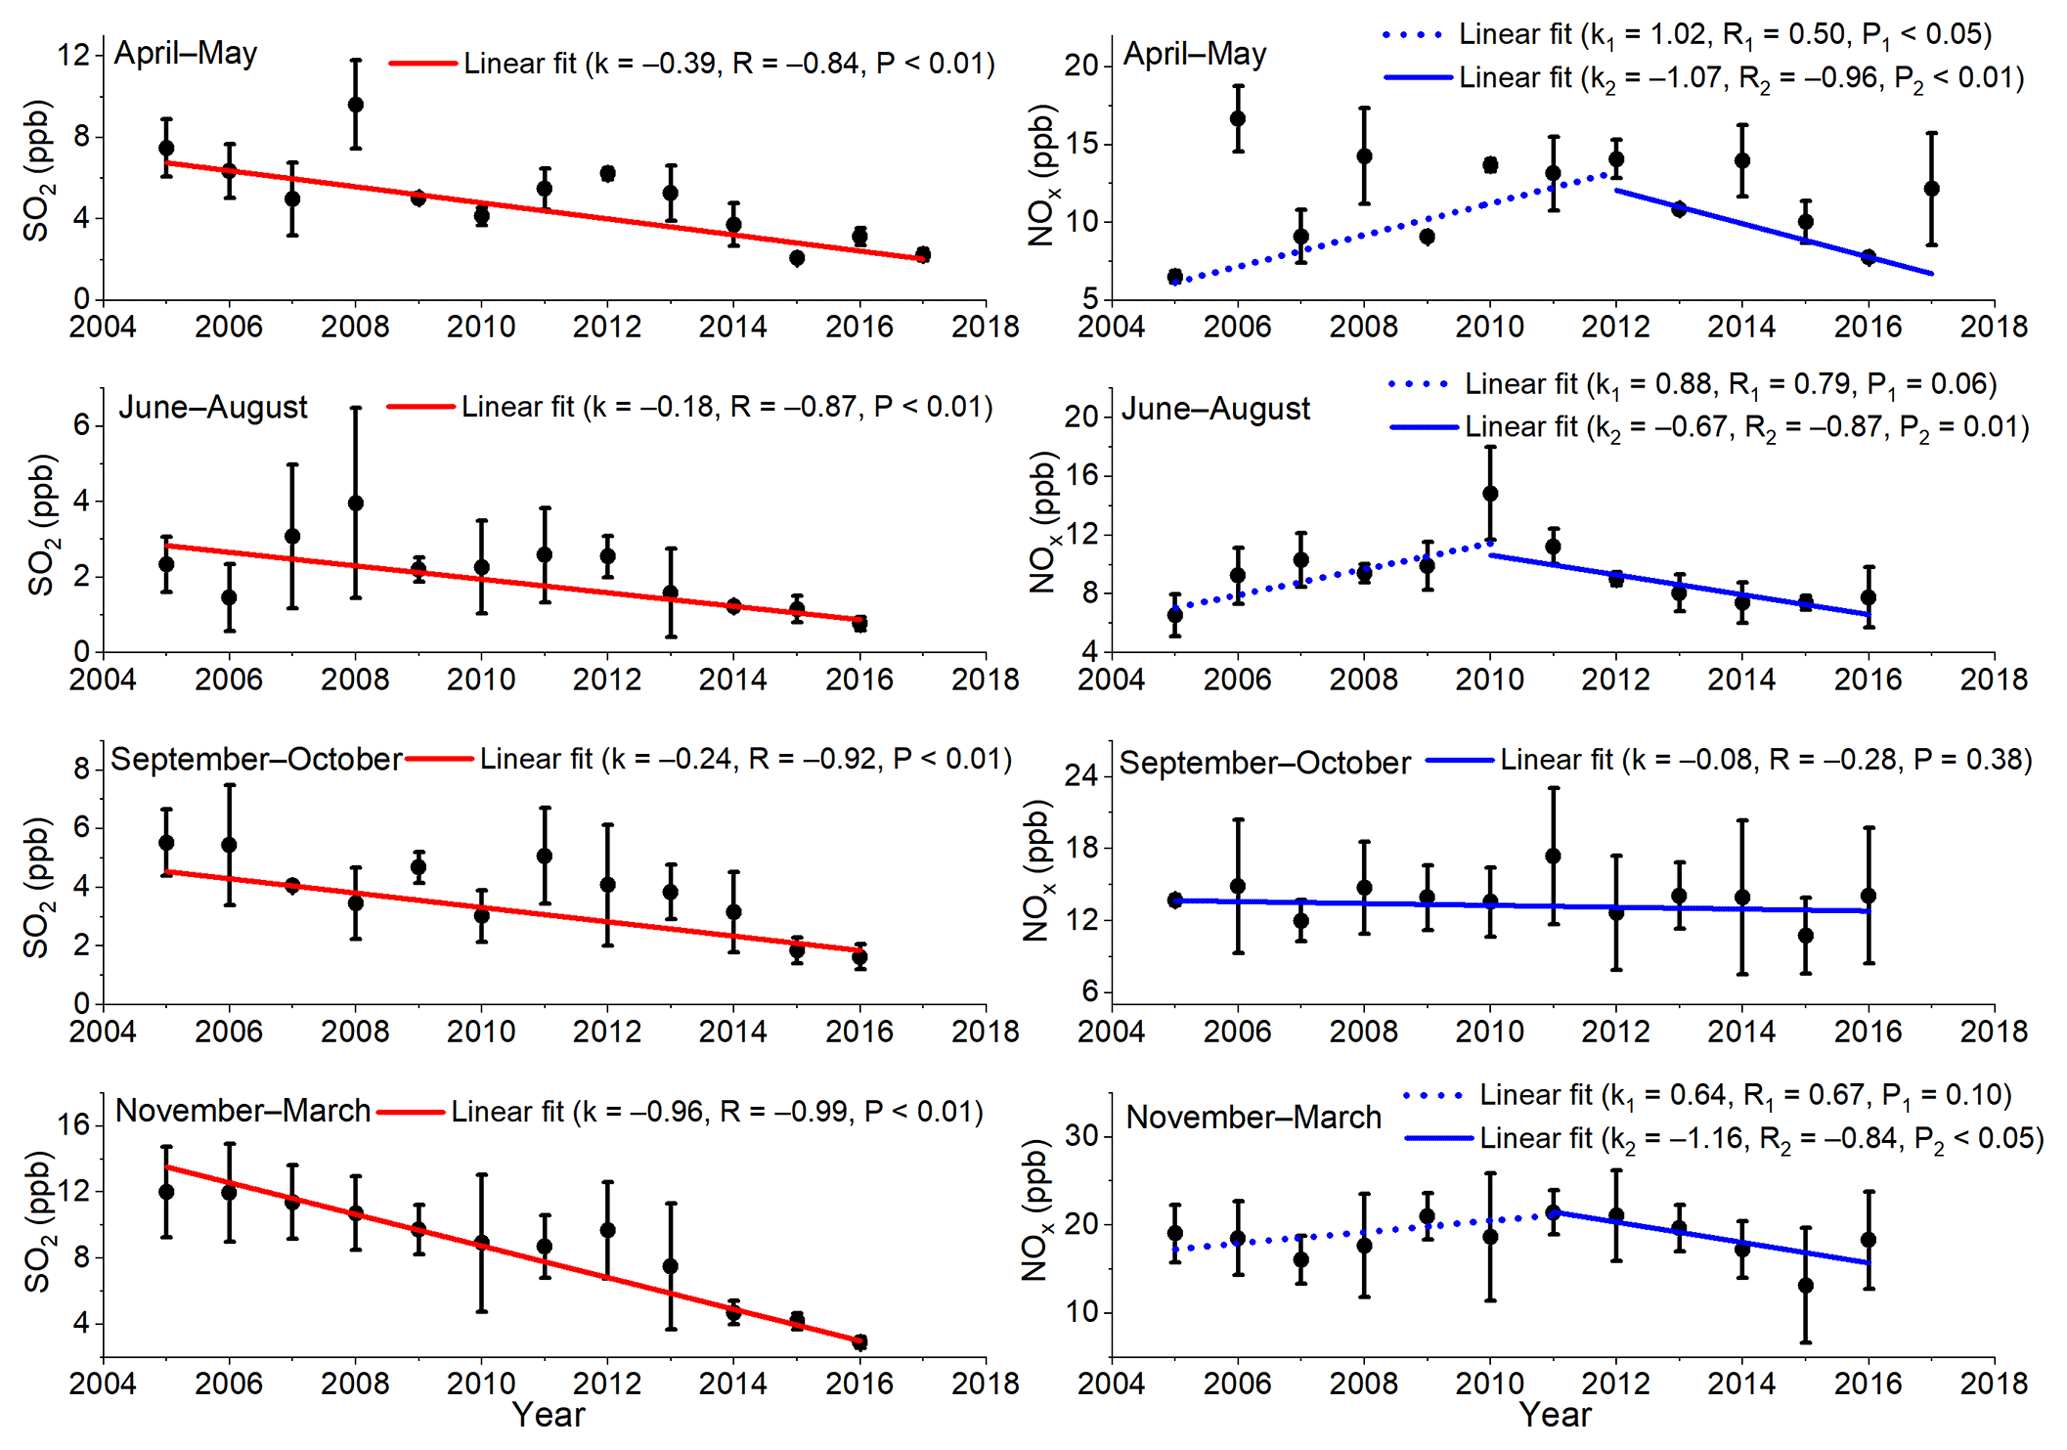
Figure 6Long-term variations in monthly mean SO2 and NOx mixing ratios with ± 1σ in different periods at SDZ: the heating period (November–March the following year), spring (April–May), summer (June–August) and autumn (September–October).
The annual mean of NOx shows an increasing trend of +0.37 ppb yr−1 (+3.4 % yr−1, R = 0.38, P = 0.40) from 2005 to 2010 with strong fluctuations (Fig. 5c and d). The annual NOx mean reached the peak value (16.93 ppb) in 2010 and exhibited a significant downward trend of −0.77 ppb yr−1 (−4.5 % yr−1, R = 0.95, P < 0.01) from 2010 to 2016 (Fig. 5c). The 95th percentile of the hourly mean of NOx firstly increased during 2005–2012 by +0.02 ppb yr−1 (+0.1 % yr−1, R = 0.73, P < 0.05) and then decreased during 2012–2016 by −0.03 ppb yr−1 (−4.7 % yr−1, R = 0.95, P < 0.05). Similar to SO2, the annual 5th percentile of NOx mixing ratios did not change significantly (−1.7 % yr−1, R = −0.18, P = 0.58) from 2005–2016 (Fig. 5d).
We regrouped NOx and SO2 data into four subsets according to the heating period (November–March), spring (April–May), summer (June–August) and autumn (September–October). The long-term trends of the four subsets are shown in Fig. 6. The SO2 mixing ratios showed significant downward trends of −0.96 ppb yr−1 (−8.0 % yr−1, R = −0.99, P < 0.01) in the heating period, −0.39 ppb yr−1 (−5.2 % yr−1, R = −0.84, P < 0.01) in spring, −0.24 ppb yr−1 (−4.3 % yr−1, R = −0.92, P < 0.01) in autumn and −0.18 ppb yr−1 (−7.7 % yr−1, R = −0.87, P < 0.01) in summer. The large reduction in the SO2 level in the heating period was largely related to burning natural gas instead of coal for domestic heating (Qiu et al., 2017; Li et al., 2020).
Except for autumn, the trends of the annual mean NOx mixing ratios in other seasons showed a similar pattern that NOx mixing ratio rose firstly and then declined significantly. The annual mean of NOx in autumn showed a downward but statistically insignificant trend of −0.08 ppb yr−1 (−0.6 % yr−1, R = −0.28, P = 0.38) from 2005 to 2016. In other seasons, the peaks of NOx appeared in different years. The NOx mixing ratios showed significant downward trends of −1.16 ppb yr−1 (−5.4 % yr−1, R = −0.84, P < 0.05) in the heating period during 2012–2016, −1.07 ppb yr−1 (−7.6 % yr−1, R = −0.96, P < 0.01) in spring during 2012–2017 and −0.67 ppb yr−1 (−4.5 % yr−1, R = −0.87, P = 0.01) in summer during 2011–2016.
4.1 The influence of emission control on long-term trends of NOx and SO2
The annual mean and the 95th percentile of SO2 mixing ratios at SDZ from 2004 to 2016 were significantly correlated with the annual SO2 emissions in North China with correlation coefficients of 0.85 (P < 0.01) and 0.88 (P < 0.01), respectively. The decreasing rates of annual mean and 95th percentile of SO2 mixing ratios from 2004 to 2016 at SDZ were −6.1 % yr−1 and −6.2 % yr−1, respectively, which were higher than the trend (−3.1 % yr−1) of the annual SO2 emission in the NCP but very close to the trend (−6.3 % yr−1) of the annual SO2 emission in Beijing. This indicated that surface SO2 mixing ratios at SDZ were more influenced by the emission in Beijing than other provinces in the NCP.
There seemed to be a lag between the variation of SO2 mixing ratios and the emissions (Figs. 5a, b and S1a, b in the Supplement), and the surface SO2 mixing ratio in 2012 was evidently inconsistent with the emission trend, which indicates the complexity of the effect of reducing SO2 emission on SO2 mixing ratios. The effectiveness and timing of pollution control policies, as well as the change of meteorology year by year, would have caused their asynchronous trends. China implemented a series of stringent Clean Air Actions from 2013 to 2017, and the Beijing 2013–2017 Clean Air Action Plan was the most comprehensive and systematic pollution control program in Beijing (UN Environment, 2019). Before 2013, there would have been some emissions that were not counted for some reason by local government, as the change in the 95 % percentile of SO2 mixing ratios did not show a similar decreasing trend of the mean SO2 mixing ratios from 2009 to 2011. Another reason could be that the change in SO2 mixing ratios at the SDZ regional background site was not as obvious as the change in Beijing urban and other polluted areas as Lin et al. (2012) had stated. Changes in meteorology would also lead to a decoupling of emissions and measured SO2 and NO2 values, but it cannot be quantified how much the changes contributed to this time shift.
Taking 2008 as the base year, a stronger decreasing trend of −7.4 % yr−1 (R = −0.95, P < 0.01) can be found from 2008 to 2016 for the annual mean SO2 mixing ratio, as well as a significant decreasing rate of −4.5 % yr−1 (R = −0.81, P < 0.01) for the annual 5 % percentile of SO2 mixing ratios. More strict emission control measures were implemented for the 2008 Beijing Olympic Games, for which the SO2 pollution control had long-term effects and benefits as Lin et al. (2012) pointed out. Surface SO2 mixing ratios in Beijing in the first half year of 2008 before the Olympic Games, held in August and September, showed higher values than in the rest of the year (Lin et al., 2012). We believe the higher emission before the Olympics was due to more activities in preparing for the Olympic Games. Although more reduction in SO2 was seen in the post-Olympics period, the SO2 mixing ratio showed a higher annual mean in 2008 than in 2009. Theoretically, the worldwide economic crisis in 2009 might have caused a lower level of SO2, but considering the economic stimulation measures implemented by the government, we do not think the economic crisis played a significant role. Moreover, the higher NOx emission in 2009 than in 2008 supports our view. The improvement of energy structure was sped up in Beijing from 2009, which might be a more important factor. An assessment by the United Nations Environment Programme reported that the significant decline in SO2 mixing ratios and emissions from 1997–2017 was largely due to the SO2 control measures in Beijing and the surrounding areas, especially the transformation of coal-fired boilers, energy structure adjustments and the end treatment of SO2 tail gas (UN Environment, 2019). The SO2 observation at SDZ background site confirmed the effect of SO2 reduction.
Before 2011, the annual mean NOx showed an increasing trend with fluctuation year by year. There is a steep increase in NOx in 2010 as well as in 2006. It is worth noting that the motor vehicles in Beijing in 2010 had increased significantly from the previous year (see Fig. S2), since the policy of purchase restriction on motor vehicles was implemented in 2011. In addition, NOx emissions from power plants and industrial sources were not strictly controlled before 2011. Therefore, more NOx would be emitted in years with a prosperous economy. According to the analysis by Krotkov et al. (2016) and Duncan et al. (2016), NO2 pollution over Northeast China reached its peak in 2011, and there have been large decreases over Beijing, Shanghai and the Pearl River Delta, which were likely associated with local emission control efforts. Beijing has adopted the policy of “new car purchase restriction” lottery number purchase since 1 January 2011 and has implemented the plan for further promoting the elimination and renewal of old cars since 1 August 2011. A new glass emission standard for air pollutants from the flat-glass industry (GB 26453-2011) was also implemented in this year. After 2010, the annual mean and 95th percentile of NOx mixing ratios correlated significantly (R = 0.94, P < 0.01 and R = 0.82, P < 0.05, respectively) with the annual NOx emission in North China, but the NOx mixing ratios exhibited more fluctuations than NOx emissions (Fig. 5c and d). As shown in Fig. S1c and d, the annual mean NOx mixing ratios were also significantly correlated with the NOx emission in Beijing (R = 0.93, P < 0.01) from 2010 to 2016 (Fig. S1c). However, the 95th percentile of NOx did not show a significant correlation (R = 0.80, P = 0.06) (Fig. S1d), indicating that high values of NOx at SDZ may be much more affected by NOx emissions from other North China regions than Beijing. The decreasing rates of −4.8 % yr−1 (R = −0.92, P < 0.01) for the annual mean and −4.5 % yr−1 (R = −0.82, P < 0.05) for the 95th percentile NOx mixing ratios from 2011 to 2016 at SDZ were lower than the one (−8.8 % yr−1, R = −0.94, P < 0.01) for the annual NOx emission in the NCP and in Beijing (−9.0 % yr−1, R = −0.96, P < 0.01). Unlike the annual mean or 95th percentile values, the 5th percentile of NOx mixing ratios from 2011 to 2016 did not exhibit a significant trend at SDZ (−5.0 % yr−1, R = −0.54, P = 0.27).
This indicated that surface NOx mixing ratios at SDZ were relatively weakly influenced by the emission reduction in Beijing and its surrounding areas in the NCP compared with the condition of SO2, probably because there were more emission sources for NOx than for SO2. For example, although the coal-burning source pollution control measures adopted in the Clean Air Action have helped to reduce NOx emissions, the increase in the number of motor vehicles led to an increase in NOx emission from the traffic (Fontes et al., 2018; Sun et al., 2018; Q. Zhang et al., 2019; M. Zhang et al., 2020). In addition, the change of atmospheric transport conditions and the expansion of urban scale may lead to the downward trend of NOx but not as obviously as that of SO2 at SDZ (Lin et al., 2012). Fortunately, NOx pollution control measures on coal-burning sources and vehicle pollution have also begun to achieve more significant outcomes since 2011 (Krotkov et al., 2016; UN Environment, 2019). In particular, vehicle pollution control was strengthened through the improvement of oil quality and promotion of new energy vehicles. As a result, Beijing's motor vehicle growth rate decreased from 19.7 % in 2010 to 3.6 % in 2011, and the number of new energy vehicles increased by 431 % from 2013 to 2016 (Fig. S2).
4.2 Variations in NOx and SO2 mixing ratios in different periods
We regrouped the NOx and SO2 data into four subsets in four different time stages (Stage I: 2005–2008, Stage II: 2009–2012, Stage III: 2013–2014 and Stage IV: 2015–2017). Key pollution control measures had been implemented in different stages, e.g., emission controls for the 2008 Beijing Olympic Games, the State Council Air Pollution Prevention and Control Action Plan (Action Plan 2013–2017), and the Beijing 2013–2017 Clean Air Action Plan. Details of the pollution prevention plans and its implementation can be found in UN Environment (2019) and in Zheng et al. (2018), in which control processes and specific measures for coal combustion and motor vehicles in Beijing from 1998 to 2017 and China's clean air policies implemented during 2010–2017 were reviewed. Since 2015, the government of the Beijing–Tianjin–Hebei region has promoted the application of electric energy substitution using electric energy instead of traditional fossil energy (Wang et al., 2020).
The average diurnal variations in SO2 and NOx at SDZ in four stages are shown in Figs. 7 and S3 in the Supplement. The SO2 levels and their amplitudes of the average diurnal variation continued to decrease with time. The differences in SO2 among the four different periods are significant (P < 0.001) from the one-way ANOVA test, and the differences between the two groups are also significant (P < 0.01) from the t test. The diurnal amplitude of SO2 was 4.16 ppb in Stage I and 0.94 ppb in Stage IV. The peak time of SO2 in Stage IV appeared at 11:00 instead of 16:00 formerly. The peak value decreased significantly, from 9.38 ppb in Stage I to 3.19 ppb in Stage IV, with a factor of −66.0 %. This phenomenon indicated that the control measures implemented in the period 2013–2017 not only had notable effects in reducing emissions from power plants, but also had a significant achievement in the emission control of non-electric industries such as industrial boilers and kilns (Zhang et al., 2019), which made the emission intensity of SO2 pollutants from elevated sources weaker than that in the Stage I.
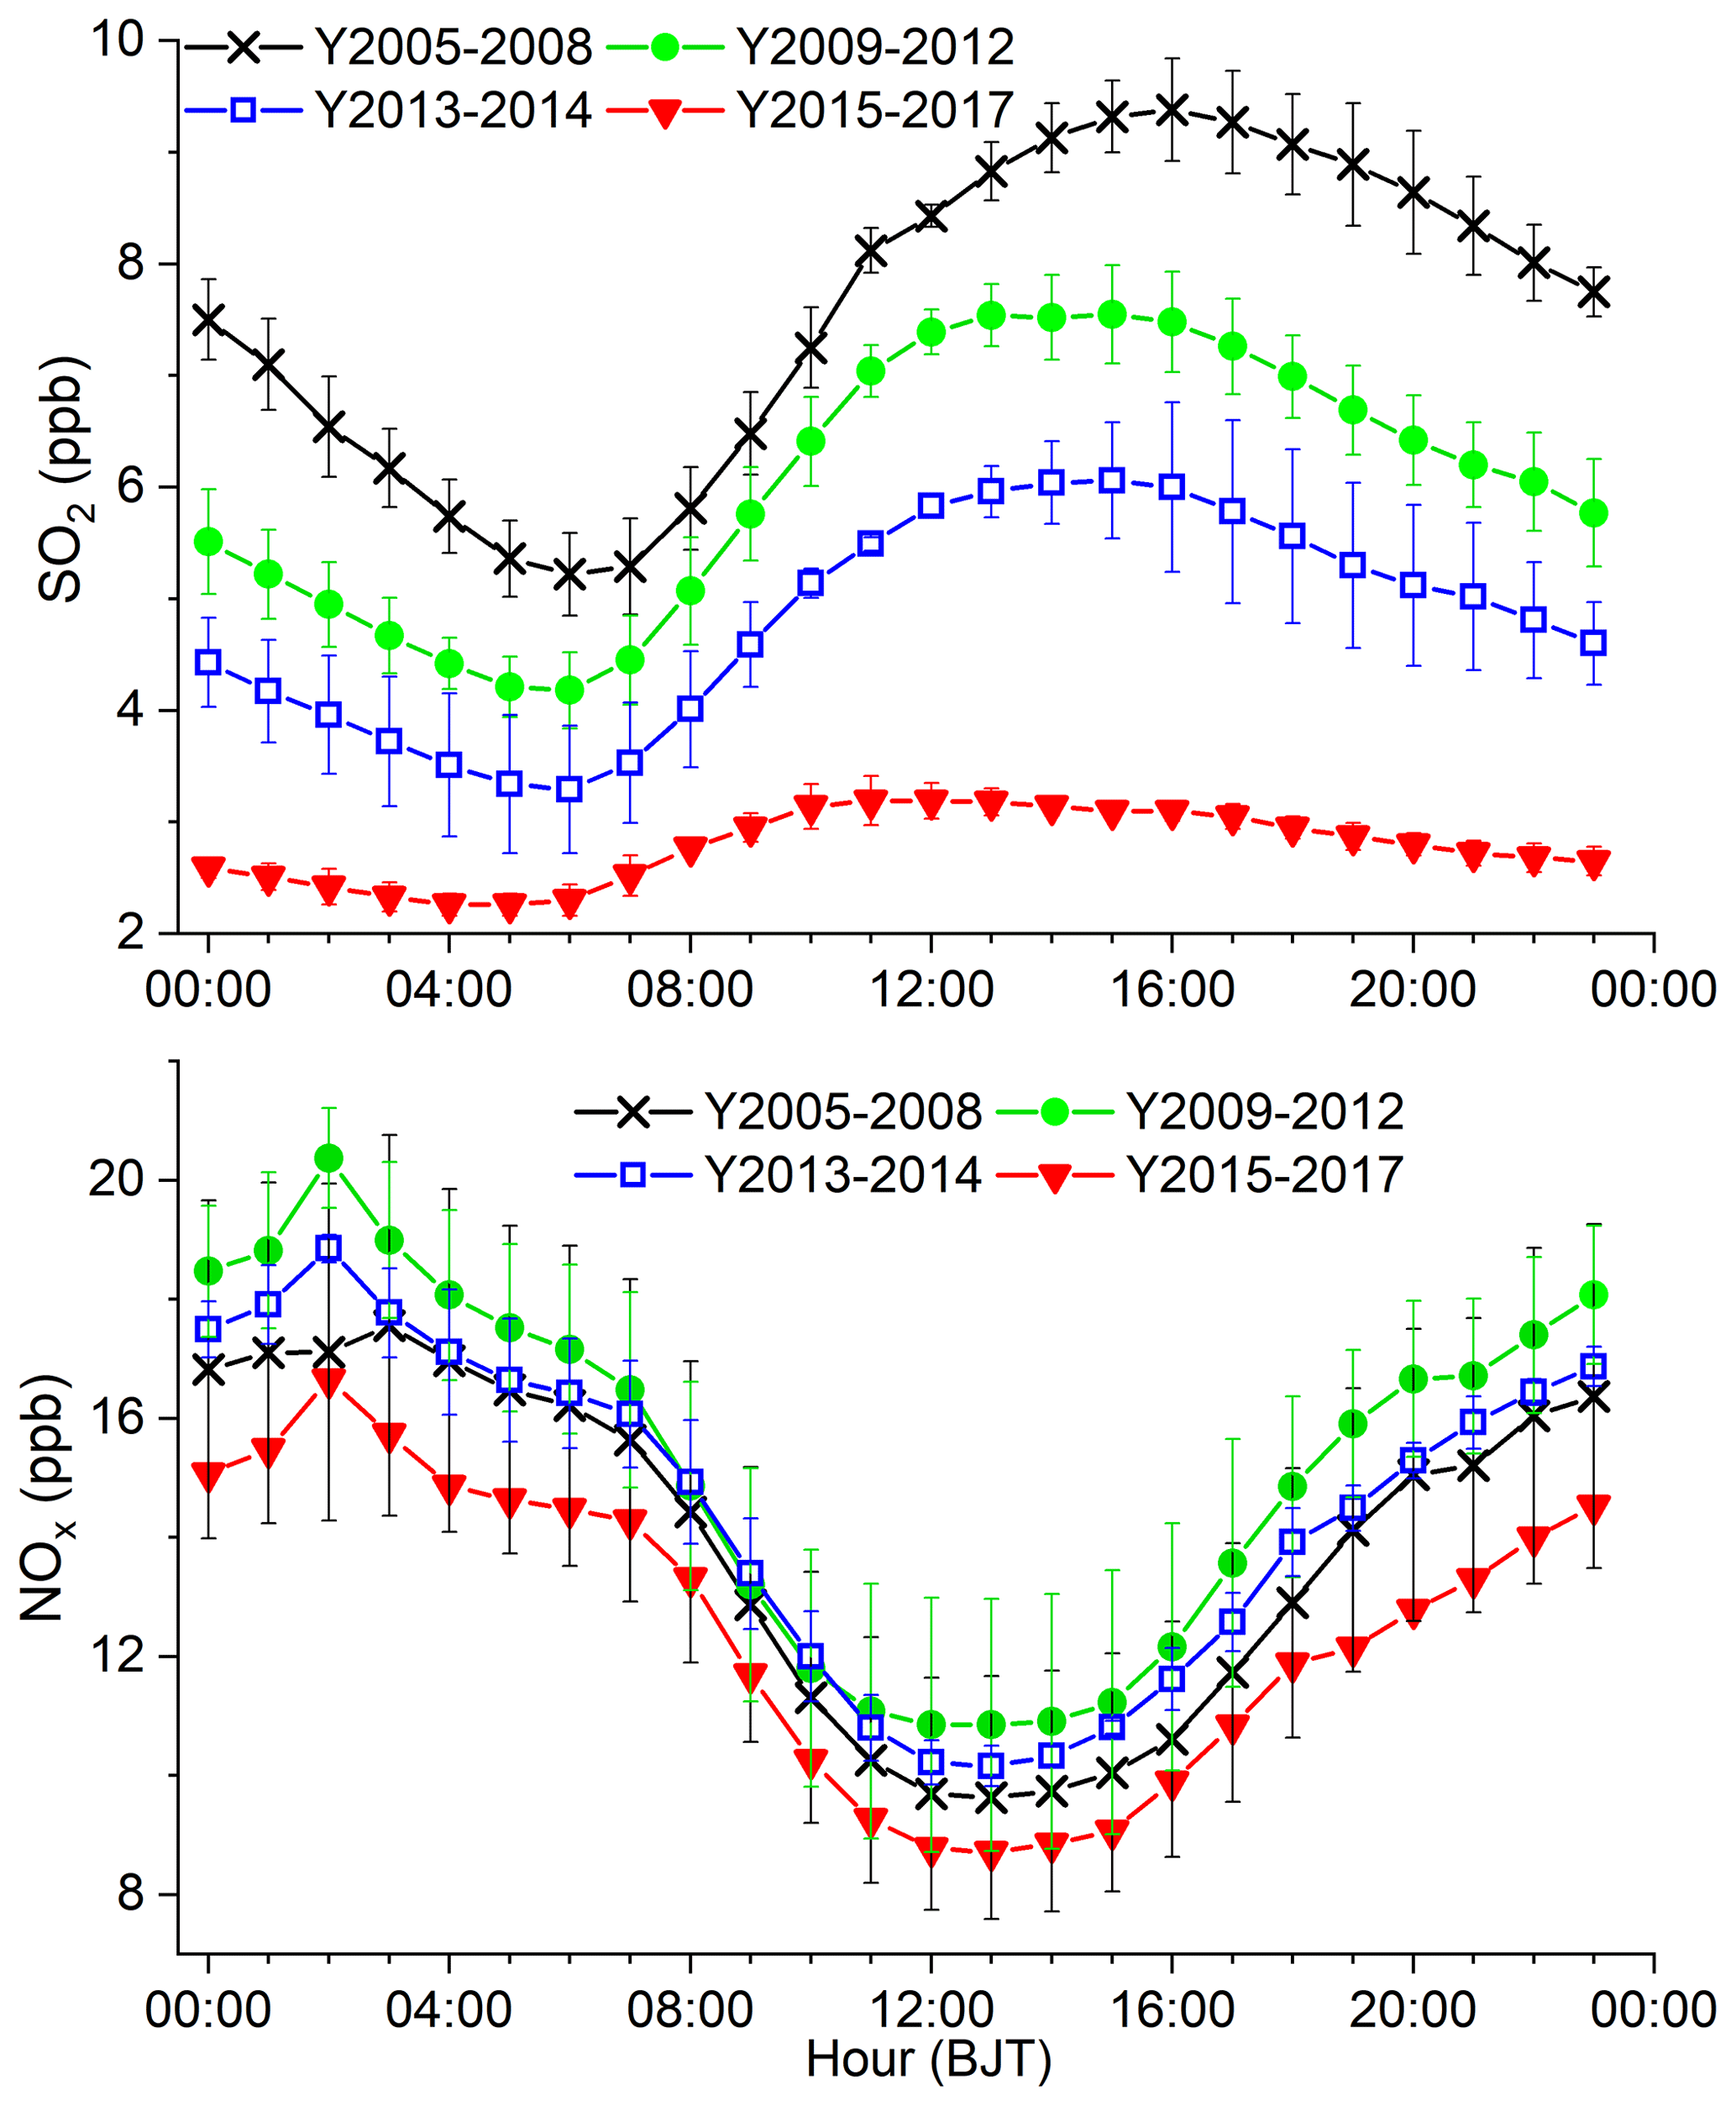
Figure 7The average diurnal variations in SO2 and NOx mixing ratios in four different stages at SDZ.
Different from SO2, the average diurnal NOx mixing ratios did not show a gradual decrease over time, with values of Stage II > Stage III > Stage I > Stage IV. For NOx, the differences among the four different periods are significant (P = 0.01) from the one-way ANOVA test, but the differences between the two groups are only significant (P < 0.01) between Y2009–2012 and Y2015–2017 from the t test. In addition, the diurnal variations and the diurnal amplitude of NOx did not change much, with the daily amplitude being about 8.52 ppb. The peak and valley appeared at about 02:00 and at about 13:00, respectively, in the four stages. The increase of NOx and the decrease of SO2 in Stage II demonstrates the fact of much more effective pollution control measures on SO2 rather than NOx implemented in Beijing and other places. China intensified its acid rain control in the beginning of this century by much more strict control of SO2 emissions from coal-fired power plants. However, the control of NOx emissions remained weak until the introduction of the new Emission Standard of Air Pollutants for Thermal Power Plants (GB13223-2011) (Wang et al., 2019). Such a major difference in SO2 and NOx emission control caused an earlier peak for SO2 (around 2006) and a later peak for NOx (around 2011–2012) (Li et al., 2017). The emission data for North China (Fig. 5) nearly resemble the nationwide situation, and the mixing ratio data at SDZ (Fig. 7) are consistent with the general trends of SO2 and NOx emissions. At the same time, the number of motor vehicles was rapidly increasing, resulting in an increase in NOx emissions from vehicle exhaust.
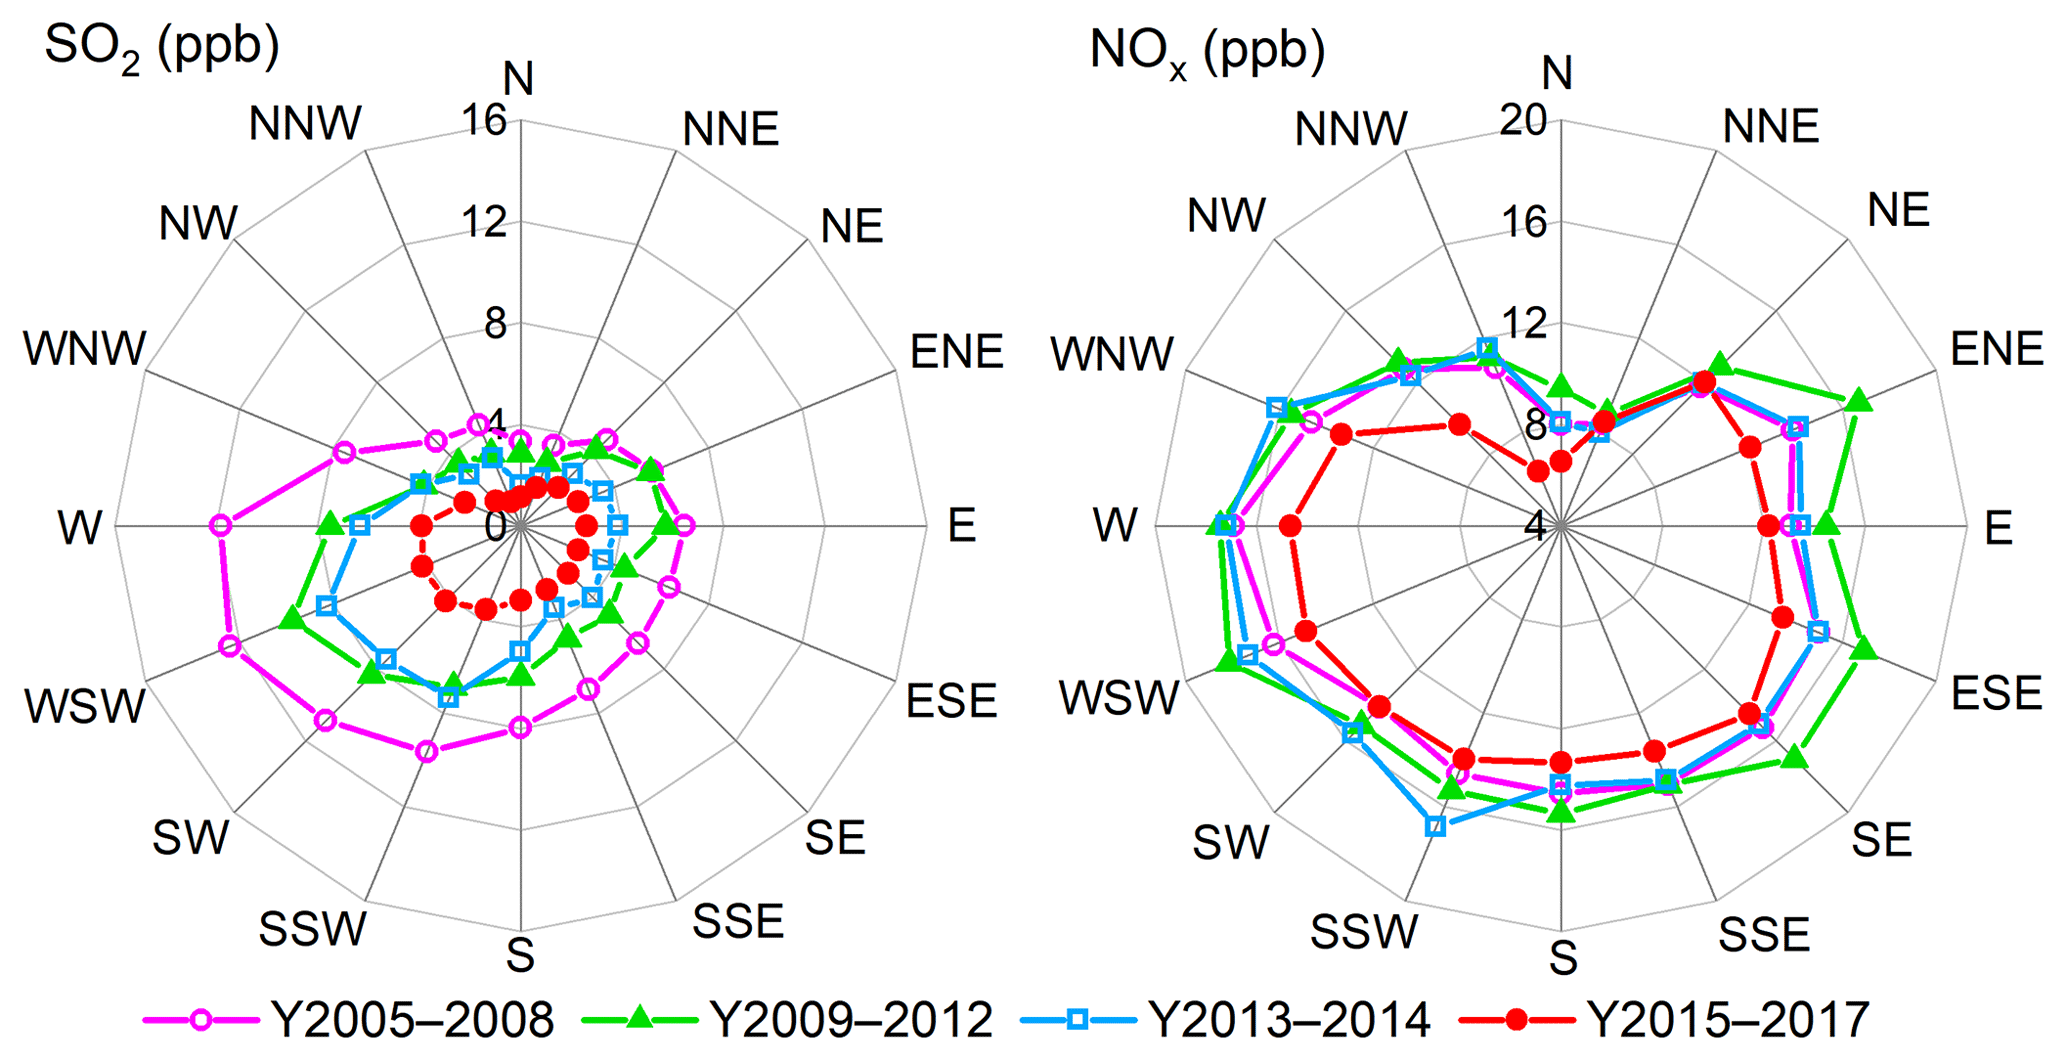
Figure 8Mixing ratios of SO2 and NOx during different stages as a function of wind direction at SDZ.
Table 3Trends of the hourly mean of the three sectors with the highest SO2 level, the hourly mean of the three sectors with the lowest SO2 level and their difference.
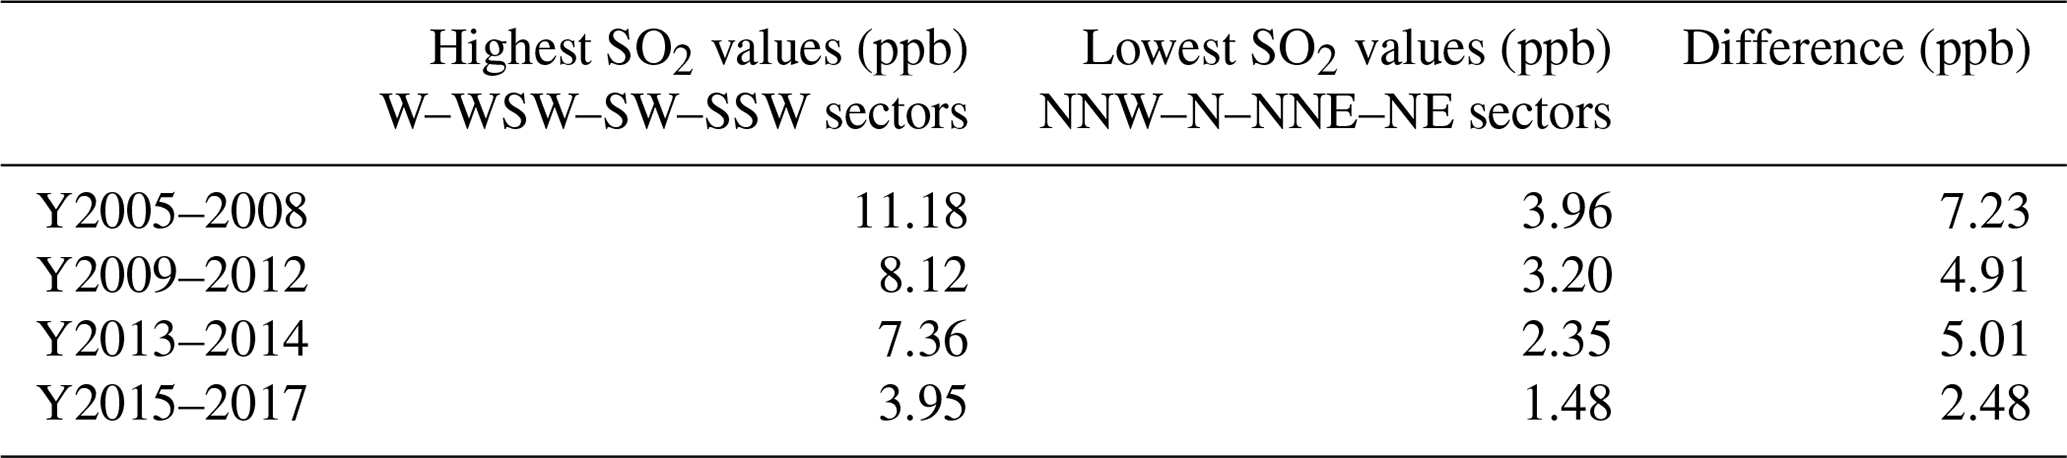
Figure 8 shows the rose maps of SO2 and NOx mixing ratios in four different time periods (Figs. S4 and S5 in the Supplement show rose maps in different seasons, and Table S1 in the Supplement shows frequency distributions of wind directions in different stages). High NOx values were in broader wind sectors except NW–NNW–N–NNE, whereas high SO2 values were mainly in W–WSW–SW–SSW sectors. Except for the SSW sector, SO2 mixing ratios in other wind directions showed a decreasing trend over stages. Both the severely polluted areas and the slightly polluted areas have the same characteristics of decreasing in SO2 level over time (Table 3). Unlike the highest SO2 mixing ratio being in Stage I (2005–2008), the highest NOx mixing ratio was in Stage II (2009–2012). The overall levels of SO2 and NOx in the Stage I reached the lowest values among the four stages. Compared with those at the stage with the highest mixing ratios of NOx and SO2, the reduction ranges in Stage IV are 52.2 %–76.4 % for SO2 and 3.8 %–45.3 % for NOx in different wind sectors. Much more reduction in SO2 than NOx indicates that the electric energy substitution policy in the Beijing–Tianjin–Hebei region has been much more effective in SO2 reduction than NOx.
The ratio, obtained from the reduced major axis regression of the daily mean SO2 and NOx mixing ratios, exhibited a significant change from 0.84 during 2005–2008 to 0.30 during 2015–2017. The possible reason for this phenomenon was that the control measures including the upgrading of end treatment facilities of coal-fired power plants, the conversion of coal to clean energy and the elimination of coal-fired boilers, which were taken in the early stage of the Clean Air Action, greatly reduced SO2 emissions rather than NOx. Another reason could be an increase in the number of motor vehicles (Fig. S2) and relatively more difficulties in emission control on the mobile sources. Unlike emissions from industries, emissions from automobiles are relatively more difficult to control. What supports this argument is the fact that emissions from industrial plants could be quantitatively measured; thus control measures that require a reduction of a certain percentage in emissions could be implemented. However, the estimation of emissions from automobiles bears large uncertainties in the first place. Though there are also strict control regulations, such as a certain number of cars with certain license plates not being allowed to be on the road on certain days, the actual reduction in emissions also depends on the usage of other cars.
In the period of 2005–2012, the construction of new power plants and the number of motor vehicles rapidly increased in the city. During this period, flue gas desulfurization devices were widely used (Zhao et al., 2008). However, the main management measures that required power plants to deploy denitrification devices for reducing NOx emissions, were not implemented until 2012, resulting in the increase of nitrogen oxide emissions (Wang et al., 2010; Wang and Hao, 2012; Liu et al., 2016) and the contribution to the transport of NOx to SDZ during this period.
4.3 The different diurnal behaviors in SO2 and NOx mixing ratios and their source origin
The seasonal variations in SO2 and NOx mixing ratios exhibited a similar pattern, with high values in winter and low values in summer, and their daily mean values had a significant correlation (R = 0.59, P < 0.01). However, the diurnal variations in SO2 and NOx mixing ratios were greatly different from each other (Fig. 9). Due to the increased emissions, lower mixing depth and slower chemical conversions in winter, SO2 values showed significant diurnal behavior in winter, which was different from other seasons. Except for the winter, the SO2 mixing ratios were higher during the daytime and lower during the nighttime in all seasons, while the NOx mixing ratios showed an opposite pattern. The different diurnal behaviors in SO2 and NOx at SDZ might indicate a different origin of SO2 and NOx.
Due to the diurnal variation in the boundary layer, the mixing depth is higher during the daytime, and the convective mixing is strong, which is conducive to the dilution and diffusion of pollutants. The photochemical reaction during the daytime is also conducive to the chemical transformation of pollutants. At night, the pollutants are easy to accumulate because of lower mixing depth and no photochemical processes. Therefore, the concentration of primary pollutants exhibits higher values during the nighttime and lower during the daytime in general. But the situation for SO2 at SDZ was different. The higher SO2 mixing ratios during the daytime suggested two possible mechanisms: (1) an elevated level of SO2 aloft, which could be mixed downward to the ground due to the evolution of atmospheric boundary layer, causing higher ground-level SO2 concentrations in the daytime, and (2) upwind SO2 sources and transport of plumes in the daytime.
Since the SDZ station is selected as a WMO/GAW regional station, local anthropogenic emissions are well avoided. As SDZ is located on the north side of a valley with a northeast–southwest orientation, its dominant wind directions were from southwest and northeast, with regular changes in diurnal wind directions (Fig. S6 in the Supplement). The southwest mouth of the valley is open to the NCP, so it is easily influenced by the air masses from the south polluted areas, like urban Beijing. As a result, the concentration rose maps of pollutants exhibited higher values in the southwest sectors than other sectors (Lin et al., 2008; Z. Meng et al., 2009). If only due to the influence by advection transport, the diurnal variations in SO2 and NOx at SDZ should be similar. However, the two show obvious differences. The higher SO2 mixing ratios during the daytime indicate an elevated level of SO2 in a high air layer, which can be exchanged to the surface under the evolution of atmospheric boundary layer, causing a higher SO2 value in the daytime. The “unusual” phenomenon of the diurnal change in SO2 has been noticed and explained by studies (Lin et al., 2008; Chen et al., 2009; Xu et al., 2014), but it lacked direct vertical profile measurements to support this explanation. The daytime peak of SO2 was not only found at SDZ, but also at different sites in urban and rural areas in North China (Lin et al., 2012) and in the background area of the Yangtze River Delta (Qi et al., 2012). This may be related to the fact that SO2 is mainly emitted from elevated sources (Lin et al., 2012; Xu et al., 2014). The daily maximum of SO2 concentrations was caused by the downward mixing of SO2 emitted by elevated sources in this region. As strict and effective control measures were continuously implemented, the contribution from such a source largely decreased and finally became negligible. Governed by the development of the planetary boundary layer, the diurnal variation of SO2 concentrations would peak around noon. This may be the cause of the shift in time of the SO2 maximum as mentioned in Sect. 4.2. Xu et al. (2014) have discussed the implications of this SO2 noontime-peak phenomenon in sulfur deposition and transformation. At night, a prevailing north wind transported clean air to SDZ. This process should be the major cause of the decreasing SO2 levels during nighttime, since surface SO2 mixing ratios depend on vertical air exchange. Enhanced relative humidity during nighttime should also be a loss effect since SO2 is a very soluble gas. In addition, dry deposition of SO2 in a shallow nocturnal boundary layer might lower the SO2 level as well.
It can be seen that the NOx mixing ratios began to rise around noontime when the mixing depth was still elevating (Fig. 9). Obviously, NOx was affected by the transport of pollutants in the southern polluted area during noontime when the WD changed into southwest wind (Fig. S6). Of course, motor vehicles running on the roads and dispersing human activities can emit NOx as well as the transport from the south. As seen in Fig. 8, the NOx rose map showed wider source origins than SO2. However, SO2 maintained a relatively high value instead of increasing significantly, indicating that SO2 mixing ratios were still mainly affected by downward mixing of SO2-richer air.
Measurements of surface NOx and SO2 mixing ratios at SDZ regional atmospheric background site in the North China Plain from the period 2005–2017, together with ancillary data, were summarized and used to study their long-term trends and influencing factors. The average values ± 1σ (standard deviation) of SO2 and NOx mixing ratios were 5.7 ± 8.4 and 14.2 ± 12.4 ppb, respectively. The seasonal variation in SO2 and NOx at SDZ showed a similar pattern with high values in winter and low values in summer, but the diurnal variations in SO2 and NOx mixing ratio exhibited large differences in all seasons. The SO2 mixing ratios were higher during the daytime and lower during the nighttime, while the NOx mixing ratios showed higher values during the nighttime and lower during the daytime. The different diurnal behaviors in SO2 and NOx at SDZ indicated a different origin of SO2 and NOx.
Overall, the annual mean SO2 exhibited a significant decreasing trend of −0.36 ppb yr−1 (−6.1 % yr−1, R = −0.84, P < 0.01) from 2004 to 2016 and a greater decreasing trend of −0.56 ppb yr−1 (−7.4 % yr−1, R = −0.95, P < 0.01) from 2008 to 2016. The decreasing rate of annual mean and the 95th percentile of SO2 mixing ratios from 2004 to 2016 at SDZ is very close to the one (−6.3 % yr−1) of the annual SO2 emission in Beijing. The annual mean of NOx showed a fluctuating rise of +0.37 ppb yr−1 (+3.4 % yr−1, R = 0.38, P = 0.40) from 2005 to 2010, reaching the peak value (16.93 ppb) in 2010, and then exhibited an extremely significant fluctuating downward trend of −0.77 ppb yr−1 (−4.5 % yr−1. R = 0.95, P < 0.01) from 2010 to 2016. After 2010, the annual mean and 95 % percentile of NOx mixing ratios correlated significantly (R = 0.94, P < 0.01 and R = 0.82, P < 0.05, respectively) with the annual NOx emission in North China. The decreasing rates of −4.8 % yr−1 (R = −0.92, P < 0.01) for the annual mean and −4.5 % yr−1 (R = −0.82, P < 0.05) for the 95th percentile NOx mixing ratios from 2011 to 2016 at SDZ are lower than the ones (−8.8 % yr−1, R = −0.94, P < 0.01) for the annual NOx emission in the NCP and in Beijing (−9.0 % yr−1, R = −0.96, P < 0.01). It indicated that surface NOx mixing ratios at SDZ had a weaker response to the emission reduction in Beijing and its surrounding areas in NCP than SO2. The increase in the number of motor vehicles and the low effectiveness of traffic restrictions have caused increased motor vehicle emissions of NOx.
The data in this study can be publicly accessed via https://doi.org/10.7910/DVN/YFVLHV (Liu et al., 2022).
The supplement related to this article is available online at: https://doi.org/10.5194/acp-22-7071-2022-supplement.
XL wrote the paper, and WL developed the idea, formulated the research goals and edited the paper. LR, XX and ZQ edited the paper. WL, FD, DH, LZ, QS and YW carried out the measurement of NOx and SO2 and analyzed the meteorological data.
The contact author has declared that neither they nor their co-authors have any competing interests.
Publisher's note: Copernicus Publications remains neutral with regard to jurisdictional claims in published maps and institutional affiliations.
The authors acknowledge the funding by the National Natural Science Foundation of China and the Open Fund of Shangdianzi Atmospheric Background Station.
This research has been supported by the National Natural Science Foundation of China (grant no. 91744206) and the Open Fund of Shangdianzi Atmospheric Background Station (SDZ2020615).
This paper was edited by Armin Sorooshian and reviewed by two anonymous referees.
Bai, J., Wu, Y., Chai, W., Wang, P., and Wang, G.: Long-term variation of trace gases and particulate matter at an atmospheric background station in North China (in Chinese), Adv. Geosci., 5, 248–263, https://doi.org/10.12677/AG.2015.53025, 2015.
Cai, K., Zhang, Q., Li, S., Li, Y., and Ge, W.: Spatial-temporal variations in NO2 and PM2.5 over the Chengdu-Chongqing economic zone in China during 2005–2015 based on satellite remote sensing, Sensors-Basel, 18, 3950, https://doi.org/10.3390/s18113950, 2018.
Chen, C.: Analysis of atmospheric pollutants characteristics in the typical suburban station of North China, Master thesis, Nanjing University of Information Science and Technology, https://kns.cnki.net/kcms/detail/detail.aspx?dbcode=CMFD& dbname=CMFD201801&filename=1017295870.nh&v=MTA0 NzJUM3FUcldNMUZyQ1VSN2lmWXVSckZ5RGdWcnJKV kYyNkdiR3hHOW5McjVFYlBJUjhlWDFMdXhZUzdEaDE=, last access: 5 June 2017 (in Chinese).
Chen, L.: Measure and study on the atmospheric pollutants in three typical regional background stations of China, Master thesis, Lanzhou University, https://kns.cnki.net/kcms/detail/detail.aspx?dbcode=CMFD& dbname=CMFD2012&filename=1012373772.nh&v=MzIx MDM2SExDL0hkYkxyWkViUElSOGVYMUx1eFlTN0RoM VQzcVRyV00xRnJDVVI3aWZZdVJyRkNua1VyL0JWRjI=, last access: 30 May 2012 (in Chinese).
Chen, T., Chang, K., and Tsai, C.: Modeling approach for emissions reduction of primary PM2.5 and secondary PM2.5 precursors to achieve the air quality target, Atmos. Res., 192, 11–18, https://doi.org/10.1016/j.atmosres.2017.03.018, 2017.
Chen, Y., Zhao, C., Qiang, Z., Deng, Z., Huang, M., and Ma, X.: Aircraft study of mountain chimney effect of Beijing, China, J. Geophys. Res.-Atmos., 114, D8306, https://doi.org/10.1029/2008JD010610, 2009.
Cheng, L., Ji, D., He, J., Li, L., Du, L., Cui, Y., Zhang, H., Zhou, L., Li, Z., and Zhou, Y.: Characteristics of air pollutants and greenhouse gases at a regional background station in Southwestern China, Aerosol Air Qual. Res., 19, 1007–1023, https://doi.org/10.4209/aaqr.2018.11.0397, 2019.
Cheng, M., Pan, Y., Wang, H., Liu, Q., and Wang, Y.: On-line measurement of water-soluble composition of particulate matter in Beijing (in Chinese), Environ. Sci., 34, 2943–2949, https://doi.org/10.13227/j.hjkx.2013.08.018, 2013,.
Cheng, N., Chen, T., Zhang, D., Li, Y., Sun, F., Wei, Q., Liu, J., Liu, B., and Sun, R.: Air quality characteristics in Beijing during Spring Festival in 2015, Environ. Sci., 36, 3150–3158, https://doi.org/10.13227/j.hjkx.2015.09.005, 2015 (in Chinese).
Duncan, B. N., Lamsal, L. N., Thompson, A. M., Yoshida, Y., Lu, Z., Streets, D. G., Hurwitz, M. M., and Pickering, K. E.: A space-based, high-resolution view of notable changes in urban NOx pollution around the world (2005–2014), J. Geophys. Res.-Atmos., 121, 976–996, https://doi.org/10.1002/2015JD024121, 2016.
Fontes, T., Li, P., Barros, N., and Zhao, P.: A proposed methodology for impact assessment of air quality traffic-related measures: The case of PM2.5 in Beijing, Environ. Pollut., 239, 818–828, https://doi.org/10.1016/j.envpol.2018.04.061, 2018.
Gao, J., Zhang, Y., Wang, S., Chai, F., and Chen, Y.: Study on the characteristics and formation of a multi-day haze in October 2011 in Beijing, Res. Environ. Sci., 25, 1201–1207, http://www.hjkxyj.org.cn/en/article/id/20121103, last access: 18 September 2012 (in Chinese).
Jung, J., Lee, J., Kim, B., and Oh, S.: Seasonal variations in the NO2 artifact from chemiluminescence measurements with a molybdenum converter at a suburban site in Korea (downwind of the Asian continental outflow) during 2015–2016, Atmos. Environ., 165, 290–300, https://doi.org/10.1016/j.atmosenv.2017.07.010, 2017.
Krotkov, N. A., McLinden, C. A., Li, C., Lamsal, L. N., Celarier, E. A., Marchenko, S. V., Swartz, W. H., Bucsela, E. J., Joiner, J., Duncan, B. N., Boersma, K. F., Veefkind, J. P., Levelt, P. F., Fioletov, V. E., Dickerson, R. R., He, H., Lu, Z., and Streets, D. G.: Aura OMI observations of regional SO2 and NO2 pollution changes from 2005 to 2015, Atmos. Chem. Phys., 16, 4605–4629, https://doi.org/10.5194/acp-16-4605-2016, 2016.
Li, F., Tan, H., Deng, X., Deng, T., Xu, W., Ran, L., and Zhao, C.: Characteristics analysis of sulfur dioxide in Pearl River Delta from 2006 to 2010, Environ. Sci., 5, 1530–1537, https://doi.org/10.13227/j.hjkx.2015.05.003, 2015 (in Chinese).
Li, M., Liu, H., Geng, G., Hong, C., Liu, F., Song, Y., Tong, D., Zheng, B., Cui, H., Man, H., Zhang, Q. and He, K.: Anthropogenic emission inventories in China: a review, Natl. Sci. Rev., 4, 834–866, https://doi.org/10.1093/nsr/nwx150, 2017.
Li, W., Shao, L., Wang, W., Li, H., Wang, X., Li, Y., Li, W., Jones, T., and Zhang, D.: Air quality improvement in response to intensified control strategies in Beijing during 2013–2019, Sci. Total. Environ., 744, 140776, https://doi.org/10.1016/j.scitotenv.2020.140776, 2020.
Li, Y., Wang, J., Han, T., Wang, Y., He, D., Quan, W., and Ma, Z.: Using multiple linear regression method to evaluate the impact of meteorological conditions and control measures on air quality in Beijing during APEC 2014, Environ. Sci., 40, 1024–1034, https://doi.org/10.13227/j.hjkx.201807044, 2019 (in Chinese).
Lin, W., Xu, X., Zhang, X., and Tang, J.: Contributions of pollutants from North China Plain to surface ozone at the Shangdianzi GAW Station, Atmos. Chem. Phys., 8, 5889–5898, https://doi.org/10.5194/acp-8-5889-2008, 2008.
Lin, W., Xu, X., Ge, B., and Zhang, X.: Characteristics of gaseous pollutants at Gucheng, a rural site southwest of Beijing, J. Geophys. Res.-Atmos., 114, D00G14, https://doi.org/10.1029/2008JD010339, 2009a.
Lin, W., Xu, X., Yu, D., Dai, X., Zhang, Z., Meng, Z., and Wang, Y.: Quality control for reactive gases observation at Longfengshan regional atmospheric background monitoring station, Meteorol. Mon., 35, 93–100, https://doi.org/10.7519/j.issn.1000-0526.2009.11.012, 2009b (in Chinese).
Lin, W., Xu, X., Ge, B., and Liu, X.: Gaseous pollutants in Beijing urban area during the heating period 2007–2008: variability, sources, meteorological, and chemical impacts, Atmos. Chem. Phys., 11, 8157–8170, https://doi.org/10.5194/acp-11-8157-2011, 2011a.
Lin, W., Xu, X., Sun, J., Li, Y., and Meng, Z.: Background concentrations of reactive gases and the impacts of long-range transport at the Jinsha regional atmospheric background station, Sci. China Earth Sci., 54, 1604–1613, https://doi.org/10.1007/s11430-011-4205-2, 2011b.
Lin, W., Xu, X., Ma, Z., Zhao, H., Liu, X., and Wang, Y.: Characteristics and recent trends of sulfur dioxide at urban, rural, and background sites in North China: Effectiveness of control measures, J. Environ. Sci., 24, 34–49, https://doi.org/10.1016/s1001-0742(11)60727-4, 2012.
Lin, W., Ma, Z., Pu, W., Gao, W., Ma, Q., and Yu, D.: Air Composition-Quality control for observation data-Reactive gases. Meteorological industry Standard of the People's Republic of China (QX/T 510-2019), http://zwgk.cma.gov.cn/zfxxgk/gknr/flfgbz/bz/202102/P020210210455752448985.pdf, last access: 30 September 2019.
Liu, F., Zhang, Q., Van, D. A. R. J., Zheng, B., Tong, D., Yan, L., Zheng, Y., and He, K.: Recent reduction in NOx emissions over China: synthesis of satellite observations and emission inventories, Environ. Res. Lett., 11, 3945–3950, https://doi.org/10.1088/1748-9326/11/11/114002, 2016.
Liu, J., Zhang, X., Xu, X., and Xu, H.: Comparison analysis of variation characteristics of SO2, NOx, O3 and PM2.5 between rural and urban areas, Beijing, Environ. Sci., 29, 1059–1065, https://doi.org/10.3321/j.issn:0250-3301.2008.04.036, 2008 (in Chinese).
Liu, R., Han, Z., and Li, J.: Analysis of meteorological characteristics during winter haze events in Beijing, Clim. Environ. Res., 19, 164–172, https://doi.org/10.3878/j.issn.1006-9585.2014.13224, 2014 (in Chinese).
Liu, X., Xu, X., Zhao, H., and Lin, W.: Characteristics of NOx and CO emission on the three sites in Beijing and its surrounding areas, J. Saf. Environ., 14, 252–257, https://doi.org/10.13637/j.issn.1009-6094.2014.06.056, 2014 (in Chinese).
Liu, X, Ran, L., Lin, W., Xu, X., Ma, Z., Dong, F., He, D., Zhou, L., Shi, Q., and Yao, W.: Replication Data for: Measurement report: Variations in surface SO2 and NOx mixing ratios from 2004 to 2016 at a background site in the North China Plain, V1, Harvard Dataverse [data set], https://doi.org/10.7910/DVN/YFVLHV, 2022.
Luo, X., Pan, Y., Goulding, K., Zhang, L., Liu, X., and Zhang, F.: Spatial and seasonal variations of atmospheric sulfur concentrations and dry deposition at 16 rural and suburban sites in China, Atmos. Environ., 146, 79–89, https://doi.org/10.1016/j.atmosenv.2016.07.038, 2016.
Meng, Z. Y., Xu, X. B., Yan, P., Ding, G. A., Tang, J., Lin, W. L., Xu, X. D., and Wang, S. F.: Characteristics of trace gaseous pollutants at a regional background station in Northern China, Atmos. Chem. Phys., 9, 927–936, https://doi.org/10.5194/acp-9-927-2009, 2009.
Meng, X., Wang, P., Wang, G., Yu, H., and Zong, X.: Variation and transportation characteristics of SO2 in winter over Beijing and its surrounding areas (in Chinese), Clim. Environ. Res., 14, 83–91, https://doi.org/10.3878/j.issn.1006-9585.2009.03.08, 2009.
Qi, H., Lin, W., Xu, X., and Yu, X.: Significant downward trend of SO2 observed from 2005 to 2010 at a background station in the Yangtze Delta region, China, Sci. China Chem., 55, 1451–7291, https://doi.org/10.1007/s11426-012-4524-y, 2012.
Qiu, X., Duan, L., Cai, S., Yu, Q., Wang, S., Chai, F., Gao, J., Li, Y., and Xu, Z.: Effect of current emission abatement strategies on air quality improvement in China: A case study of Baotou, a typical industrial city in Inner Mongolia, J. Environ. Sci.-China, 57, 383–390, https://doi.org/10.1016/j.jes.2016.12.014, 2017.
Shao, M., Tang, X., Zhang, Y., and Li, W.: City clusters in China: air and surface water pollution, Front. Ecol. Environ., 4, 353–361, https://doi.org/10.1890/1540-9295(2006)004[0353:CCICAA]2.0.CO, 2006.
Shikwambana, L., Mhangara, P., and Mbatha, N.: Trend analysis and first time observations of sulphur dioxide and nitrogen dioxide in South Africa using TROPOMI/Sentinel-5 P data, Int. J. Appl. Earth Obs., 91, 102130, https://doi.org/10.1016/j.jag.2020.102130, 2020.
Song, C., Li, R., Jianjun, H., Wu, L., and Mao, H.: Analysis of pollution characteristics of NO, NO2 and O3 at urban area of Langfang, Hebei, J. Environ. Sci.-China., 36, 2903–2912, https://doi.org/10.3969/j.issn.1000-6923.2016.10.004, 2016 (in Chinese).
Steinbacher, M., Zellweger, C., Schwarzenbach, B., Bugmann, S., Buchmann, B., Ordóñez, C., Prevot, A. S. H., and Hueglin, C.: Nitrogen oxide measurements at rural sites in Switzerland: Bias of conventional measurement techniques, J. Geophys. Res.-Atmos., 112, D11307, https://doi.org/10.1029/2006JD007971, 2007.
Su, B., Liu, X., and Tao, J.: Pollution characteristics of SO2, NOx and CO in forest and mountain background region of East China, Environ. Monit. China, 29, 15–21, https://doi.org/10.3969/j.issn.1002-6002.2013.06.004, 2013 (in Chinese).
Sun, C., Luo, Y., and Li, J.: Urban traffic infrastructure investment and air pollution: Evidence from the 83 cities in China, J. Clean. Prod., 172, 488–496, https://doi.org/10.1016/j.jclepro.2017.10.194, 2018.
Tang, Y., Zhang, X., Xu, J., Zhao, X., Ma, Z., and Meng, W.: Multi-temporal scale variations of atmospheric pollutants concentrations in rural and urban areas of Beijing, Acta Sci. Circumst., 36, 2783–2793, https://doi.org/10.13671/j.hjkxxb.2016.0003, 2016 (in Chinese).
UN Environment: A Review of 20 Years' Air Pollution Control in Beijing, United Nations Environment Programme, Nairobi, Kenya, http://sthjj.beijing.gov.cn/bjhrb/resource/cms/2019/04/2019041916301550241.pdf, last access: 1 March 2019.
Wang, N., Lyu, X., Deng, X., Huang, X., Jiang, F., Ding, A.: Aggravating O3 pollution due to NOx emission control in eastern China, Sci. Total Environ., 677, 732–744, https://doi.org/10.1016/j.scitotenv, 2019.
Wang, S. and Hao, J.: Air quality management in China: Issues, challenges, and options, J. Environ. Sci., 24, 2–13, https://doi.org/10.1016/S1001-0742(11)60724-9, 2012.
Wang, S., Streets, D. G., Zhang, Q., He, K., Chen, D., Kang, S., Lu, Z., and Wang, Y.: Satellite detection and model verification of NOx emissions from power plants in Northern China, Environ. Res. Lett., 5, 44007, https://doi.org/10.1088/1748-9326/5/4/044007, 2010.
Wang, Y., Wang, S., Song, F., Yang, J., Zhu, J., and Zhang, F.: Study on the forecast model of electricity substitution potential in Beijing-Tianjin-Hebei region considering the impact of electricity substitution policies, Energ. Policy, 144, 111686, https://doi.org/10.1016/j.enpol.2020.111686, 2020.
Wei, X., Gu, X., Chen, H., Cheng, T., Wang, Y., Guo, H., Bao, F., and Xiang, K.: Multi‒scale observations of atmosphere environment and aerosol properties over North China during APEC meeting periods, Atmosphere, 7, 4, https://doi.org/10.3390/atmos7010004, 2016.
WMO: Global Atmosphere Watch Measurements Guide (WMO TD No. 1073), GAW Report No. #171, World Meteorological Organization, Geneva, Switzerland, https://www.empa.ch/documents/56101/250799/8.pdf/18c896fa-72b3-4861-9cc3-f0524b2882c6 (last access: 2 April 2015), 2001.
Wu, D., Xin, J., Sun, Y., Wang, Y., and Wang, P.: Change and analysis of background concentration of air pollutants in North China during 2008 Olympic Games, Environ. Sci., 31, 1130–1138, https://doi.org/10.13227/j.hjkx.2010.05.001, 2010 (in Chinese).
Xu, X., Lin, W., Yan, P., Zhang, Z., and Yu, X.: Long-term changes of acidic gases in China's Yangtze Delta and Northeast Plain regions during 1994–2006, Adv. Clim. Chang. Res., 4, 195–201, https://doi.org/10.3969/j.issn.1673-1719.2008.04.001, 2008 (in Chinese).
Xu, X., Liu, X., and Lin, W.: Impacts of air parcel transport on the concentrations of trace gases at regional background stations, J. Appl. Meteorol. Sci., 20, 656–664, https://doi.org/10.3969/j.issn.1001-7313.2009.06.002, 2009 (in Chinese).
Xu, W. Y., Zhao, C. S., Ran, L., Lin, W. L., Yan, P., and Xu, X. B.: SO2 noontime-peak phenomenon in the North China Plain, Atmos. Chem. Phys., 14, 7757–7768, https://doi.org/10.5194/acp-14-7757-2014, 2014.
Yang, F., Tan, J., Zhao, Q., Du, Z., He, K., Ma, Y., Duan, F., Chen, G., and Zhao, Q.: Characteristics of PM2.5 speciation in representative megacities and across China, Atmos. Chem. Phys., 11, 5207–5219, https://doi.org/10.5194/acp-11-5207-2011, 2011.
Yang, S., Zhao, X., and Liu, N.: Impacting factors of a heavy air pollution process in autumn over Beijing, J. Meteorol. Environ, 13–16, https://doi.org/10.3969/j.issn.1673-503X.2010.05.003, 2010 (in Chinese).
Yin, Q., Ma, Q., Lin, W., Xu, X., and Yao, J.: Measurement report: Long-term variations in surface NOx and SO2 mixing ratios from 2006 to 2016 at a background site in the Yangtze River Delta region, China, Atmos. Chem. Phys., 22, 1015–1033, https://doi.org/10.5194/acp-22-1015-2022, 2022.
Zhang, M., Shan, C., Wang, W., Pang, J., and Guo, S.: Do driving restrictions improve air quality: Take Beijing–Tianjin for example?, Sci. Total Environ., 712, 136408, https://doi.org/10.1016/j.scitotenv.2019.136408, 2020.
Zhang, Q., Zheng, Y., Tong, D., Shao, M., Wang, S., Zhang, Y., Xu, X., Wang, J., He, H., Liu, W., Ding, Y., Lei, Y., Li, J., Wang, Z., Zhang, X., Wang, Y., Cheng, J., Liu, Y., Shi, Q., Yan, L., Geng, G., Hong, C., Li, M., Liu, F., Zheng, B., Cao, J., Ding, A., Gao, J., Fu, Q., Huo, J., Liu, B., Liu, Z., Yang, F., He, K., and Hao, J.: Drivers of improved PM2.5 air quality in China from 2013 to 2017, P. Natl. Acad. Sci. USA, 116, 24463–24469, https://doi.org/10.1073/pnas.1907956116, 2019.
Zhang, X., Zhang, P., Zhang, Y., Li, X., and Qiu, H.: The trend, seasonal cycle, and sources of tropospheric NO2 over China during 1997–2006 based on satellite measurement, Sci. China Earth Sci., 50, 8, https://doi.org/10.1007/s11430-007-0141-6, 2007.
Zhao, P. S., Dong, F., He, D., Zhao, X. J., Zhang, X. L., Zhang, W. Z., Yao, Q., and Liu, H. Y.: Characteristics of concentrations and chemical compositions for PM2.5 in the region of Beijing, Tianjin, and Hebei, China, Atmos. Chem. Phys., 13, 4631–4644, https://doi.org/10.5194/acp-13-4631-2013, 2013.
Zhao, S., Hu, B., Gao, W., Li, L., Huang, W., Wang, L., Yang, Y., Liu, J., Li, J., Ji, D., Zhang, R., Zhang, Y., and Wang, Y.: Effect of the “coal to gas” project on atmospheric NOx during the heating period at a suburban site between Beijing and Tianjin, Atmos. Res., 241, 104977, https://doi.org/10.1016/j.atmosres.2020.104977, 2020.
Zhao, Y., Wang, S., Duan, L., Lei, Y., Cao, P., and Hao, J.: Primary air pollutant emissions of coal-fired power plants in China: Current status and future prediction, Atmos. Environ., 42, 8442–8452, https://doi.org/10.1016/j.atmosenv.2008.08.021, 2008.
Zheng, B., Tong, D., Li, M., Liu, F., Hong, C., Geng, G., Li, H., Li, X., Peng, L., Qi, J., Yan, L., Zhang, Y., Zhao, H., Zheng, Y., He, K., and Zhang, Q.: Trends in China's anthropogenic emissions since 2010 as the consequence of clean air actions, Atmos. Chem. Phys., 18, 14095–14111, https://doi.org/10.5194/acp-18-14095-2018, 2018.
Zhong, Y., Zhou, Y., Cheng, S., Wang, X., and Shao, X.: Comparison analysis of the effect of emission reduction measures for major events and heavy air pollution in the capital, Environ. Sci., 41, 3449–3457, https://doi.org/10.13227/j.hjkx.201910166, 2020 (in Chinese).