the Creative Commons Attribution 4.0 License.
the Creative Commons Attribution 4.0 License.
 | 24 May 2022
Modeling impacts of ice-nucleating particles from marine aerosols on mixed-phase orographic clouds during 2015 ACAPEX field campaign
Pengfei Li
Lai-yung Ruby Leung
Paul J. DeMott
Lexie Goldberger
Jennifer Comstock
Ying Liu
Jong-Hoon Jeong
Jason Tomlinson
A large fraction of annual precipitation over the western United States comes from wintertime orographic clouds associated with atmospheric rivers (ARs). Transported African and Asian dust and marine aerosols from the Pacific Ocean may act as ice-nucleating particles (INPs) to affect cloud and precipitation properties over the region. Here we explored the effects of INPs from marine aerosols on orographic mixed-phase clouds and precipitation at different AR stages for an AR event observed during the 2015 ACAPEX field campaign under low dust (<0.02 cm−3) conditions. Simulations were conducted using the chemistry version of the Weather Research and Forecasting Model coupled with the spectral-bin microphysics at 1 km grid spacing, with ice nucleation connected with dust and marine aerosols. By comparing against airborne and ground-based observations, accounting for marine INP effects improves the simulation of AR-precipitation. The marine INPs enhance the formation of ice and snow, leading to less shallow warm clouds but more mixed-phase and deep clouds, as well as to a large spillover effect of precipitation after AR landfall. The responses of cloud and precipitation to marine INPs vary with the AR stages, with more significant effects before AR landfall and post-AR than after AR landfall, mainly because the moisture and temperature conditions change with the AR evolution. This work suggests weather and climate models need to consider the impacts of marine INPs since their contribution is notable under low dust conditions despite the much lower relative ice nucleation efficiency of marine INPs.
- Article
(11376 KB) - Full-text XML
-
Supplement
(1116 KB) - BibTeX
- EndNote


Atmospheric river (AR) events have great impacts on atmospheric and hydrological processes in the western United States during winter. On a long-term average, AR storms contribute to 20 %–50 % of California's precipitation total (Dettinger et al., 2011). Understanding the factors influencing different types of precipitation (rain vs. snow) associated with ARs is crucial for planning and managing regional water resources and hydrologic hazards and for improving atmospheric and hydrologic forecasting in the western United States. Rain and snow precipitation produced by orographic clouds over the Sierra Nevada is closely related to the partitioning between liquid and ice phases of clouds, which can be largely modified by aerosol particles (Rosenfeld et al., 2013; Fan et al., 2014, 2017b). However, aerosol–orography–precipitation relationships are complicated, depending on aerosol properties, mountain geometry, cloud phase, temperature, humidity, and flow patterns, as reviewed in Chouldhury et al. (2019).
Over the western United States, understanding the roles of aerosols, particularly those capable of initiating ice crystal formation, in altering clouds and precipitation is still limited and has motivated recent observational and modeling studies (Ault et al., 2011; Creamean et al., 2013, 2015; Rosenfeld et al., 2013; Fan et al., 2014, 2017b; Martin et al., 2019; Levin et al., 2019). While it has been found that long-range transported aerosols particularly dust particles as ice-nucleating particles (INPs) influence clouds and precipitation in the mountainous western United States (Uno et al., 2009; Ault et al., 2011; Creamean et al., 2013), it is also clear from measurements that clouds occurring in and around ARs can also be influenced by INPs with apparent sources from the ocean (Levin et al., 2019).
Previous studies showed that INPs can increase total precipitation through the “seeder feeder” mechanism (Choularton and Perry, 1986; Creamean et al., 2013), in which ice crystals that form in the upper portions of orographic clouds can collect droplets and grow to a larger size as they fall through a supercooled liquid layer before reaching the ground. Fan et al. (2014, 2017b) found that INPs such as dust particles can increase precipitation by enhancing riming and deposition processes in mixed-phase orographic clouds, consistent with other studies (e.g., Muhlbauer and Lohmann, 2009; Xiao et al., 2015; Hazra et al., 2016; Yang et al., 2020). Fan et al. (2017b) also noted that the relative importance of riming to deposition depends on the mixed-phase cloud temperatures. Despite the importance of INPs in cloud formation and precipitation, they typically have a low abundance and large variations in their nucleating characteristics, especially in terms of the temperatures over which they initiate ice crystal formation (Kanji et al., 2017; Levin et al., 2019). Hence, there is large uncertainty in evaluating the impact of INPs on mixed-phase and ice clouds as well as precipitation.
Dust and biological particles are known INPs. Biological particles can cause freezing at temperatures as warm as −5 ∘C (Murray et al., 2012). During ARs, the long-range transport of dust or biological particles is highly episodic (Creamean et al., 2013). Sea spray or marine aerosols consisting of sea salt and marine organic carbon resulting from wave breaking and bubble bursting at the ocean surface may also be a source of INPs (Burrows et al., 2013; Vergara-Temprado et al., 2017; McCluskey et al., 2018b; Levin et al., 2019). Recently, McCluskey et al. (2018a) derived an ice nucleation parameterization for INPs from sea spray aerosols based on observations collected at a North Atlantic coastal site and for the relation of INPs to the marine aerosol surface area. Given the distinct physiochemical characteristics and the different ice-nucleating efficiency (magnitudes lower than mineral dust; McCluskey et al., 2018a), the impact of marine INPs on cloud and precipitation could be very different from dust or biological particles (DeMott et al., 2016; Kanji et al., 2017). However, studies of marine-sourced INP effects on clouds and associated precipitation are limited (Kanji et al., 2017; Levin et al., 2019). A few previous studies investigated the impacts of marine INPs on precipitation and radiation with global climate models (Hoose et al., 2010; Burrows et al., 2013; Yun and Penner, 2013; Zhao et al., 2021; Burrows et al., 2022; Shi et al., 2022). Nevertheless, a detailed, process-level understanding of how marine INPs affect mixed-phase cloud processes and precipitation is lacking.
Following the CalWater campaigns in 2009, 2011, 2014, an interagency sponsored study, CalWater 2015, utilized a larger suite of instruments and measurement platforms to study ARs and aerosol–cloud interactions in AR environments (Ralph et al., 2016). As part of CalWater 2015, the U.S. Department of Energy-sponsored Atmospheric Radiation Measurement (ARM) Cloud Aerosol Precipitation Experiment (ACAPEX) field campaign aimed specifically at improving understanding and modeling of aerosol impacts on winter storms associated with landfalling ARs (Leung et al., 2016). The ACAPEX campaign conducted intensive sampling of clouds and aerosols using instruments on board the ARM Aerial Facility Gulfstream (G-1) aircraft and ARM Mobile Facility on board the research vessel Ron Brown. These measurements were made in conjunction with clouds and aerosols, including meteorological, hydrological, and oceanic measurements collected by instruments on three other aircraft and Ron Brown and at a coastal surface station. Collectively, these data provide a unique opportunity to examine the complex interactions among aerosols, orographic clouds, and ARs.
A major AR event spanning over 5–9 February 2015 occurred during the ACAPEX campaign, producing heavy rainfall with some regions receiving up to 400 mm of total precipitation during the event (Ralph et al., 2016; Cordeira et al., 2017). This AR event was extensively sampled by the G-1 aircraft (Schmid et al., 2014) for characterizing aerosol and cloud properties. During this event, marine aerosols were the main aerosol type and marine INPs were dominant at cloud activation temperatures. Aerosol sampled by G-1 indicated that dust and biological particles were rather scarce in and around ARs, which is in stark contrast to the dominance of dust INPs during the AR events in the CalWater 2011 campaign (Levin et al., 2019). Therefore, the AR event during the ACAPEX campaign provides a rather unique opportunity to explore the role of marine aerosols in the orographic clouds and precipitation associated with landfalling ARs in the western United States.
In our previous modeling studies (Fan et al., 2014, 2017b), we implemented an immersion freezing parameterization for dust particles (DeMott et al., 2015) in a spectral-bin microphysics (SBM) scheme to examine the long-range dust effects on AR-associated orographic mixed-phase clouds and precipitation during CalWater 2011. With marine INPs dominating in CalWater 2015/ACAPEX, in this study we implemented the recently developed ice immersion nucleation parameterization for sea spray aerosols by McCluskey et al. (2018b) in the SBM scheme. To explicitly simulate various aerosol types, different from Fan et al. (2014, 2017b), who prescribed aerosols based on observations, a chemistry version of the Weather Research and Forecasting Model (WRF-Chem) coupled with the SBM (Gao et al., 2016) was employed to predict aerosol properties and their interactions with clouds and radiation for the AR event on 6–9 February 2015. We focused on exploring the effects of INPs from sea spray aerosols, in competition with mineral dust INPs, on the orographic mixed-phase clouds and precipitation at different stages of the AR event as thermodynamic conditions evolved with the different AR stages.
The WRF-Chem version 3.6 coupled with SBM as described in Gao et al. (2016) is employed for model simulations in this study, in which SBM is coupled with the Model for Simulating Aerosol Interactions and Chemistry (MOSAIC; Fast et al., 2006; Zaveri et al., 2008). The SBM scheme is a fast version in which ice crystal and snow (aggregates) are represented with a single size distribution (low-density ice) with a separation at 150 µm in radius, and graupel or hail is for high-density ice represented with an additional size distribution (Khain et al., 2009, 2010; Fan et al., 2012, 2017a). Here we choose the graupel version since hail is not one of the major cloud hydrometeors in the case we simulate. The fall speed power-law relationships for ice and/or snow and graupel are depicted in Xue et al. (2017). The WRF-Chem-SBM model is particularly designed to improve simulations of aerosol effects on clouds for complicated aerosol compositions and heterogeneous spatial distribution of aerosols. It has been applied in several studies including warm stratocumulus clouds (Gao et al., 2016), thunderstorms (Fan et al., 2020; Zhang et al., 2021), and supercell storms (Lin et al., 2020). Here WRF-Chem-SBM is employed, different from our previous studies in Fan et al. (2014, 2017b) which used WRF-SBM with prescribed aerosols, in order to explicitly simulate various aerosol types including marine aerosols and dust particles.
The four-sector MOSAIC aerosol module is chosen for the simulations of aerosols and the CBMZ (Carbon Bond Mechanism version Z) is used for gas-phase chemistry. The MOSAIC module treats nine major aerosol species (sulfate, nitrate, chloride, ammonium, sodium, black carbon, primary organics, other inorganics (OIN), and water). OIN is used as a surrogate of dust and the production of dust is parameterized with the dust transport model DUSTRAN (Shaw et al., 2008). Sea salt aerosol (a combination of sodium and chloride), as a surrogate for all sea spray aerosol (SSA), is parameterized as a function of sea-surface wind speed (Gong et al., 1997b, a). The dry diameters of the particles over the four bins have a range of 0.039–0.156, 0.156–0.624, 0.624–2.5, and 2.5–10.0 µm, respectively. For the total aerosol, aerosol size distribution over each section is represented with a 2-moment approach that predicts aerosol mass and number following a log-normal distribution (Simmel and Wurzler, 2006). For each composition such as dust and sea salt, only the mass mixing ratio in each section is predicted and outputted. The aerosol number mixing ratio in each bin is only predicted for the total aerosol. Therefore, in this study, the dust and sea salt number mixing ratios used for ice nucleation parameterizations were derived based on their respective mass mixing ratios by assuming the same size and density of all particles over each bin, that is,
where i denotes the aerosol composition (sea salt or dust here), j denotes the jth aerosol bin, mj is the total mass mixing ratio of the jth bin, ρi is the assumed density (i.e., 2.6 g cm−3 for dust and 2.2 g cm−3 for sea salt), and Dj is the geometric mean diameter of jth bin. The approach for deriving the number mixing ratio for each aerosol component has been used in the literature (i.e., Zhao et al., 2013). We understand that the assumption that all particles have the same size over each bin may introduce some uncertainty. However, the size distribution of each aerosol component is unknown in the model and any assumption on the size distribution might introduce uncertainty.
2.1 Implementing immersion freezing parameterization for marine INPs
In the original SBM model, the ice nucleation accounting for both deposition ice nucleation and condensation-freezing is parameterized based on Meyers et al. (1992), and Bigg (1953) is employed for immersion and homogeneous drop freezing. Neither of the ice nucleation parameterizations is connected with aerosols. Bigg (1953) was formulated based on the stochastic hypothesis where the freezing probability is assumed proportional to drop mass and the freezing rate is a function of temperature without involving INPs. Fan et al. (2014, 2017b) implemented DeMott et al. (2015) as an immersion freezing parameterization to investigate the effects of dust INPs on orographic mixed-phase clouds and precipitation during CalWater 2011. We adapted this implementation to the WRF-Chem-SBM for this study in order to connect ice nucleation with dust particles. Developed on the basis both of laboratory data and of field measurements, DeMott et al. (2015) is an empirical parameterization for immersion freezing of natural mineral dust particles. INP concentrations are quantified as functions of temperature and the total number concentration of particles larger than 0.5 µm diameter. In our implementation, the dust number mixing ratio for each aerosol bin is derived from its mass, as detailed in the previous section. The total dust number mixing ratio inputted to DeMott et al. (2015) is the integration over 0.5–10 µm.
To connect ice nucleation with sea spray aerosols, we implemented McCluskey et al. (2018a, thereafter MC2018), which was developed for quantifying ice nucleating activity by marine organics over the North Atlantic Ocean, in SBM following a similar approach as the implementation of DeMott et al. (2015). The nucleation site density in MC2018 is described as
where ns is the nucleation site density (m−2) and T is the temperature (K). With ns determined by MC2018, the nucleated ice particle concentration is obtained following Niemand et al. (2012) as
where Sae,j is the surface area of individual sea spray aerosol particles in the jth bin, which is calculated from (Dj is the geometric mean diameter), Ntot,j is the total sea spray aerosol number in each bin, which is derived from its mass as detailed in the previous section, and Nj is the ice particle number in each bin. Sea salt particles are used as the surrogate of sea spray aerosols given that most marine organic aerosols exist with coating on the surface of sea salt particles in the size range that dominates surface area (e.g., Prather et al., 2013).
Bigg et al. (1953) is employed only for homogeneous drop freezing when the temperature is colder than −37∘C. As discussed in Fan et al. (2014), the deposition-condensation freezing is turned off because the simulation with deposition-condensation freezing produces a large number of small ice particles, which is not consistent with the observed mixed-phase cloud properties in the study region. Contact freezing is also turned off due to negligible contributions (Fan et al., 2014).
2.2 Experiment design
Simulations are configured with two nested domains using the nesting down approach (i.e., the inner domain is run separately driven by the outer domain), covering most of the western US (Fig. 1). The outer domain consists of 399 × 399 grid points with a horizontal grid spacing of 3 km and the inner domain consists of 498 × 390 grid points with a horizontal grid spacing of 1 km. A total of 50 vertical levels with stretched intervals are configured, with a grid spacing of 70 m at the lowest levels and ∼400 m at the model top. The dynamics time step is 15 s for the outer domain and 5 s for the inner domain.

Figure 1Two nested simulation domains: d01 and d02 centering over California. The color shading denotes the terrain elevation.
The simulation for the outer domain starts at 00:00 UTC on 3 February and runs for 48 h for chemistry spin-up using the WRF-Chem-SBM model, driven by global WRF-Chem simulation as the initial and boundary conditions of gas-phase species and aerosols and the Modern-Era Retrospective analysis for Research and Applications, Version 2 (MERRA2; spatial resolution of 0.5 by 0.5∘ and temporal resolution of 6 h) as the initial and boundary conditions of meteorological fields. Then the outer-domain simulation is reinitialized at 00:00 UTC on 5 February using the meteorological data from MERRA2 to avoid the large error growth in meteorology associated with long-time model integration, although the chemistry simulation is a continuation from the spin-up run and runs until 23:00 UTC on 8 February. Given that running the WRF-Chem-SBM fully coupled model is extremely computationally expensive for 1 km grid spacing in the inner domain, we interpolate aerosol-related quantities such as aerosol composition, hygroscopicity, and mass and number concentrations from the outer-domain simulations using bilinear interpolation for the inner-domain simulation to reduce computational cost. This means that we conduct the inner-domain simulation separately with chemistry turned off, and aerosol information is updated hourly using data from the outer-domain simulations. The inner-domain simulation is run from 00:00 UTC on 5 February to 23:00 UTC on 8 February, and the initial and boundary meteorological conditions are from MERRA2. To validate this approach, we compared the simulation with the fully coupled WRF-Chem-SBM for the inner-domain simulation and found that the two simulations resemble each other in terms of precipitation (Fig. S1 in the Supplement). Therefore, it is a valid approach that saves computation time by about 40 %.
For emissions data, the U. S. Environmental Protection Agency (EPA) National Emission Inventory (NEI) with a 4 km by 4 km horizontal resolution based on the year 2011 rates (NEI2011; EPA, 2014) is commonly used for anthropogenic emissions in the United States. However, using NEI2011 predicts too large anthropogenic aerosol mass compared with observations. Since the emissions of gaseous species and particulate matter decreased significantly from 2011 to 2015 in California (Table S1 in the Supplement), the California Air Resources Board emission inventory in 2015 (CARB2015; CARB, 2020) is used for anthropogenic emissions input for California, while NEI2011 is used for other states in the simulation domain. The use of NEI2011 for other states is acceptable since the lower and middle atmosphere in the simulation domain is dominated by southwesterly winds during the simulation period that transport air pollutants from coastal to inland regions. The use of CARB2015 reduces the simulation of aerosol number concentrations mainly below 2 km. The aerosol concentration averaged over 1–2 km altitudes is about 160 cm−3 with CARB2015 and 317 cm−3 with NEI2011, which is 26 % lower and 47 % higher than aircraft observations (215 cm−3), respectively. Thus, the simulated aerosol concentrations with CARB2015 are in better agreement with observations.
The Model of Emissions of Gases and Aerosols from Nature (MEGAN) with a monthly temporal and 1 km horizontal resolution (Guenther et al., 2012) is used for biogenic emissions. The Rapid Radiative Transfer Model for application to GCMs (RRTMG) is used for shortwave and longwave radiation schemes (Iacono et al., 2008), the Noah Land Surface Model for land surface physics (Chen and Dudhia, 2001), and the Mellor–Yamada–Janjić (MYJ) scheme for planetary boundary layer parameterization (Mellor and Yamada, 1982; Janjić, 2001). Cumulus parameterization is not considered for the simulations over both domains.
Three simulations were carried out over the inner domain for this study to investigate the impacts of marine INPs: (1) The reference case is Bigg, using the default immersion freezing parameterization of Bigg et al. (1953) in SBM which is temperature-dependent only; (2) DM15+MC18, in which both DeMott et al. (2015) and MC2018 parameterizations are used for ice nucleation from dust and marine aerosols, respectively; (3) DM15, using the parameterization of DeMott et al. (2015) for dust aerosols (diameter >0.5 µm) with MC2018 turned off. The impacts of marine INPs are derived by comparing the DM15+MC18 and DM15 simulations.
As introduced earlier, our study case is the AR event that occurred 5–9 February 2015 during the ACAPEX campaign and made landfall on the coast of Northern California, producing heavy rainfall. Marine aerosols were the main aerosol type. Dust and biological particles were rather scarce in and around the AR (Levin et al., 2019).
The AR evolution has three distinct stages: before AR landfall (from 06:00 UTC on 5 to 18:00 UTC on 6 February), after AR landfall (from 18:00 UTC on 6 to 12:00 UTC on 7 February), and post-AR (from 12:00 UTC on 7 to 09:00 UTC on 8 February). The three stages can be identified from the change of the integrated water vapor (IWV) with time during the event (Fig. 2a). Before AR landfall, IWV in most of California was relatively low (Fig. 2a, left). The IWV in Northern California increased as the AR made landfall at about 18:00 UTC on 6 February and brought ample water vapor to California (Fig. 2a, middle). Heavy orographic precipitation along the Sierra Nevada occurred during this period. At 12:00 UTC on 7 February, the AR started to retreat (Fig. 2a, right), and postfrontal cloud cells formed, with relatively small cloud fraction and precipitation.
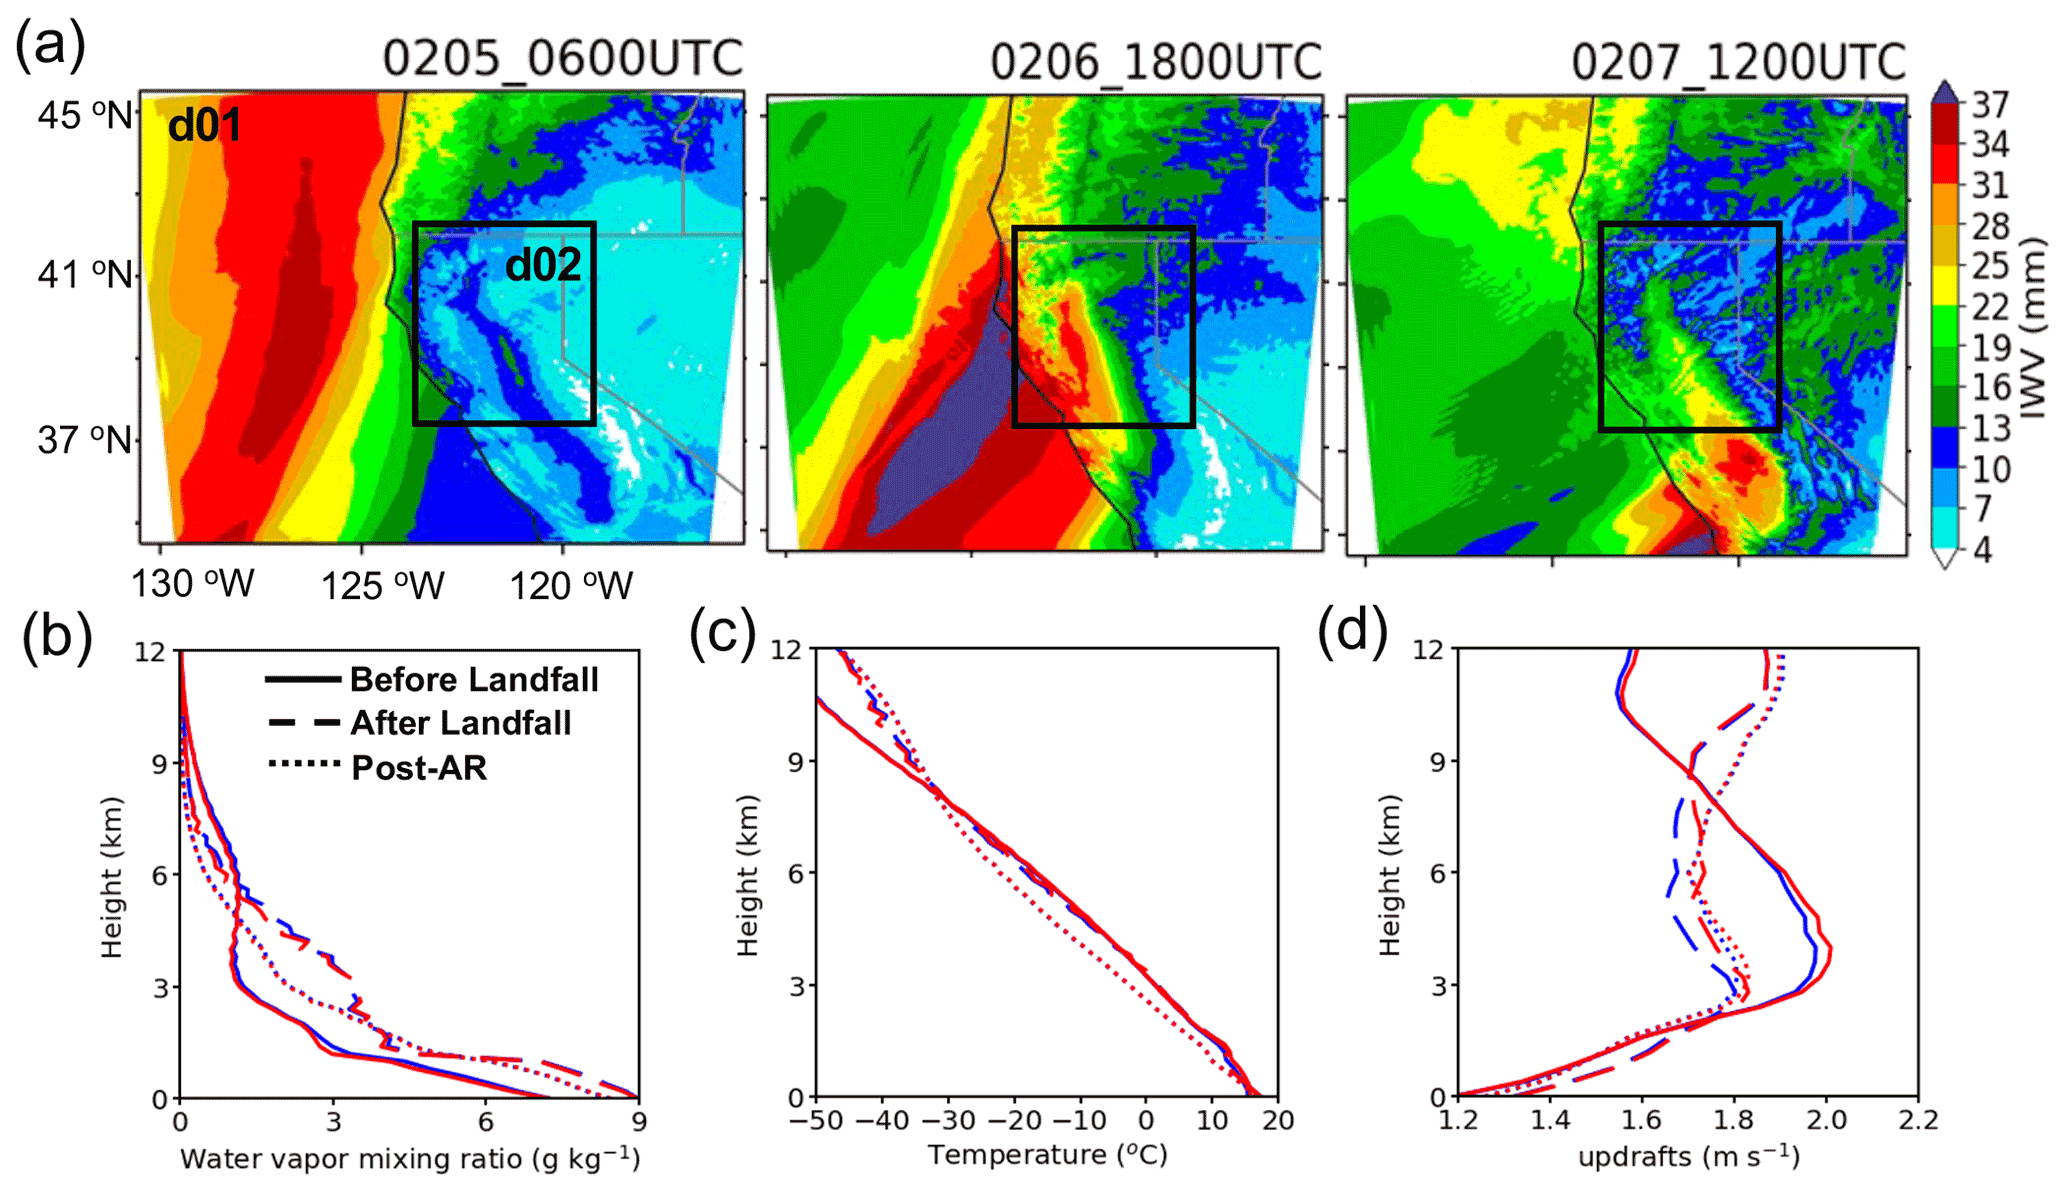
Figure 2(a) Evolution of integrated water vapor (IWV) at 06:00 UTC on 5 February (before AR landfall), 18:00 UTC on 6 February (after AR landfall), and 12:00 UTC on 7 February (post-AR). The black box (i.e., d02) in (a) is the domain of this study with the five lateral boundary grids excluded for analysis at each side. (b–d) The mean vertical profiles of (b) water vapor mixing ratio, (c) temperature, and (d) updraft velocity at the three AR stages, i.e., before (solid lines) and after (dashed lines) AR landfall and post-AR stages (dotted lines), for the simulations of DM15 (blue) and DM15+MC18 (red). The water vapor mixing ratio and temperature are averaged for cloud-free grids, and updraft velocity is averaged over the grids with a vertical velocity greater than 1 m s−1.
Vertical profiles of the thermodynamic and kinematic environments at the three stages are shown in Fig. 2b–d. The thermodynamic and kinematic environments significantly varied with the AR stages. After AR landfall, water vapor increased significantly in the lower atmosphere (below 5 km), but the middle and upper levels became drier (dashed lines, Fig. 2b) compared with the stage before AR landfall (solid lines). The vertical motion also weakened after AR landfall (Fig. 2d), suggesting that the atmosphere became more stable. At the post-AR stage, moisture above 2 km altitude was reduced compared to after AR landfall. Note that the temperature below 8 km was colder by up to 6 ∘C at the post-AR stage compared to the previous two stages (Fig. 2c). These differences in the meteorological conditions among the different stages are very important for understanding the cloud and precipitation properties and their responses to marine INPs.
Extensive in situ and remote-sensing measurements are used to understand aerosol and cloud properties and evaluate model results. The G-1 aircraft sampled the postfrontal clouds on 7 February during 20:20–20:30 UTC.
Aerosol instruments on board the G-1 aircraft included (1) a Droplet Measurement Technologies (DMT) ultrahigh sensitivity aerosol spectrometer (UHSAS), measuring dry fine-mode aerosol-size spectra of 55–800 nm with sizing uncertainty of 2.5 % (Uin, 2016); (2) a Passive Cavity Aerosol Spectrometer Probe (PCASP) for coarse model aerosol spectra (0.1–3 µm) with ± 20 % uncertainty in size and ± 16 % in concentration (Goldberger, 2020); and (3) aerosol time-of-flight mass spectrometry (ATOFMS) measurements provided the mean fractional number contributions of aerosol source classifications (Levin et al., 2019). Cloud instruments include an FCDP (1.5–50 µm) with ∼3µm uncertainty in size (Glienke and Mei, 2020), and the two-dimensional stereo (2DS) probe with ± 10 µm size uncertainty to provide cloud particle size spectra (Glienke and Mei, 2019). Uncertainty in the number concentration for both probes follows Poisson's counting statistics. The liquid water content (LWC) and ice water content (IWC) are derived from the Water Content Monitor (WCM) on board the G-1 aircraft, an instrument that uses the impact of water on several heated wires as the basis for measuring cloud total water content (TWC) and LWC from which the IWC can be derived (Baumgardner et al., 2011; Matthews et al., 2015). Wind tunnel measurements indicate that ice contributes <1 % to the LWC elements response.
The Next Generation Radar (NEXRAD) reflectivity measurements were processed and used for model evaluation. The original NEXRAD Level 2 data (polar coordinate) were downloaded from AWS-NOAA NEXRAD S3 data service (https://registry.opendata.aws/noaa-nexrad/, last access: 10 January 2022). We mapped the data to a Cartesian coordinate with 2 km horizontal resolution and approximately 5 min frequency using the Python ARM Radar Toolkit (Py-ART; Helmus and Colis, 2016). The operational NEXRAD radar reflectivity uncertainties are 2–3 dB (Gourley et al., 2003) and theoretical demonstrations with differing raindrop shape models yield radar reflectivity biases of 1.2 dB (Gourley et al., 2009). The observed precipitation rates are from the rain gauge measurements, provided by the NOAA Earth System Research Laboratory's Physical Sciences Division (https://psl.noaa.gov/data/obs/datadisplay, last access: 10 January 2022).
4.1 Model evaluation with observations
We evaluate the model simulations of aerosol and cloud properties and surface precipitation. Figure 3a shows a comparison of modeled aerosol properties including aerosol number concentration and chemical composition from the simulation of DM15+MC18 intended to represent the observed case, with the G-1 aircraft measurements on 7 February. Aerosol properties in all three simulations are similar, and thus only DM15+MC18 is shown. Overall, the simulated aerosol number concentration over the size range of 0.067–3 µm is comparable to the observations over the same size range estimated by combining data from UHSAS and PCASP at below 2 km altitude. The simulation overestimates the total aerosol number concentrations by ∼2 times averaged over the altitudes of 2.2–3.2 km. At 2.8 km, the difference between the simulation (219 cm−3) and observations (55 cm−3) is about 4 times. The mean fractional number contributions of aerosol composition classifications measured from ATOFMS are shown in Fig. 3b. For comparison with the model, the mean mass contributions of the corresponding aerosol source classifications are computed since the number concentrations of individual aerosol components are not predicted by WRF-Chem (Fig. 3c). Both the observed fractional number contributions and the simulated mass contributions show that marine aerosols are dominant during the AR event, accounting for more than 60 % of the total aerosol number on the basis of ATOFMS measurements and total aerosol mass based on the simulation. Although the simulated dust mass fraction is ∼14 %, the derived number concentration for sizes larger than 0.5 µm is very low (less than 0.02 cm−3, shown later). This is because the dust number concentration is dominated by small particles (14.71 cm−3 for the sizes smaller than 0.5 µm). The number concentrations of the sea salt aerosols are generally three orders of magnitude higher than those of dust, and these numbers populate smaller bins of the aerosol distribution (97 % from the first two aerosol size bins) even though the sea salt mass is predominately at larger sizes (96 % from the last two size bins).

Figure 3(a) Vertical distributions of aerosol number concentrations from aircraft observations (Obs, gray) and DM15+MC18 (black) for particles with a dry diameter over a range of 0.067–3 µm, (b) mean fractional number contributions of aerosol classifications based on measurements of single-particle mass spectra of aerosols and cloud particle residuals reported in Levin et al. (2019), and (c) mean fractional mass contributions of aerosols in DM15+MC18 (number concentration for each aerosol component is not predicted by WRF-Chem). The aerosol number concentration from aircraft observations in (a) consists of both measurements from UHSAS and PCASP. The modeled data in (a) and (c) are sampled along the aircraft route on 7 February 2015.
Figure 4 presents an evaluation of precipitation, showing the accumulated precipitation during the AR event from 06:00 UTC on 5 February to 09:00 UTC on 8 February 2015 (Fig. 4a–b) and the time series of mean precipitation rates averaged over the observation stations (Fig. 4c–d). The model generally captures the spatial pattern of the observed accumulated precipitation (Fig. 4a) and reproduces the temporal evolution of precipitation (Fig. 4b). Two major precipitation periods in the observations, including AR-induced orographic precipitation and postfrontal precipitation, are generally captured in the simulations, although the simulated postfrontal precipitation occurs several hours later in the simulations compared to the observations. All three simulations predict a narrower but higher peak precipitation compared with the observed wider peak with lower values (Fig. 4c). However, the overestimation of the peak value by DM15+MC18 is lower than the other two (30 % vs. 45 % for DM15 and 58 % for Bigg; Fig. 4c–d). The accumulated precipitation in the southern mountain range (the southern part of white boxes in Fig. 4a) is generally less than 100 mm in observations and less than 120 mm in DM15+MC18 but more than 140 mm in the other two simulations. The mean precipitation over the white box accumulated over the AR period is 89, 128, 130, and 116 mm for observations, Bigg, DM15, and DM15+MC18, respectively. Again, although all three simulations overestimate the precipitation, DM15+MC18 simulates the lowest value and is closer to observations. DM15+MC18 predicts more precipitation (i.e., 48 mm for the mean accumulated precipitation) than the other two simulations (i.e., 45 mm in Bigg and 42 mm in DM15). The simulated precipitation between Bigg and DM15 is very similar except for more precipitation in Bigg in the northern part of the domain (Fig. 4a–b), suggesting that in a low dust environment, the temperature-dependent Bigg (1953) parameterization simulates similar ice formation to DeMott et al. (2015). There is a clear spillover effect caused by marine INPs (Fig. 4a–b, right). That is, with marine INPs considered in DM15+MC18, there is a notable decrease in accumulated precipitation (∼30–50 mm) on the windward side but a large increase (∼50–70 cm) on the lee side (Fig. 4b, right). This is because more ice and/or snow that formed over the windward side falls slower than rain and more of it is transported to the lee side, which will be discussed more in Sect. 4.2.
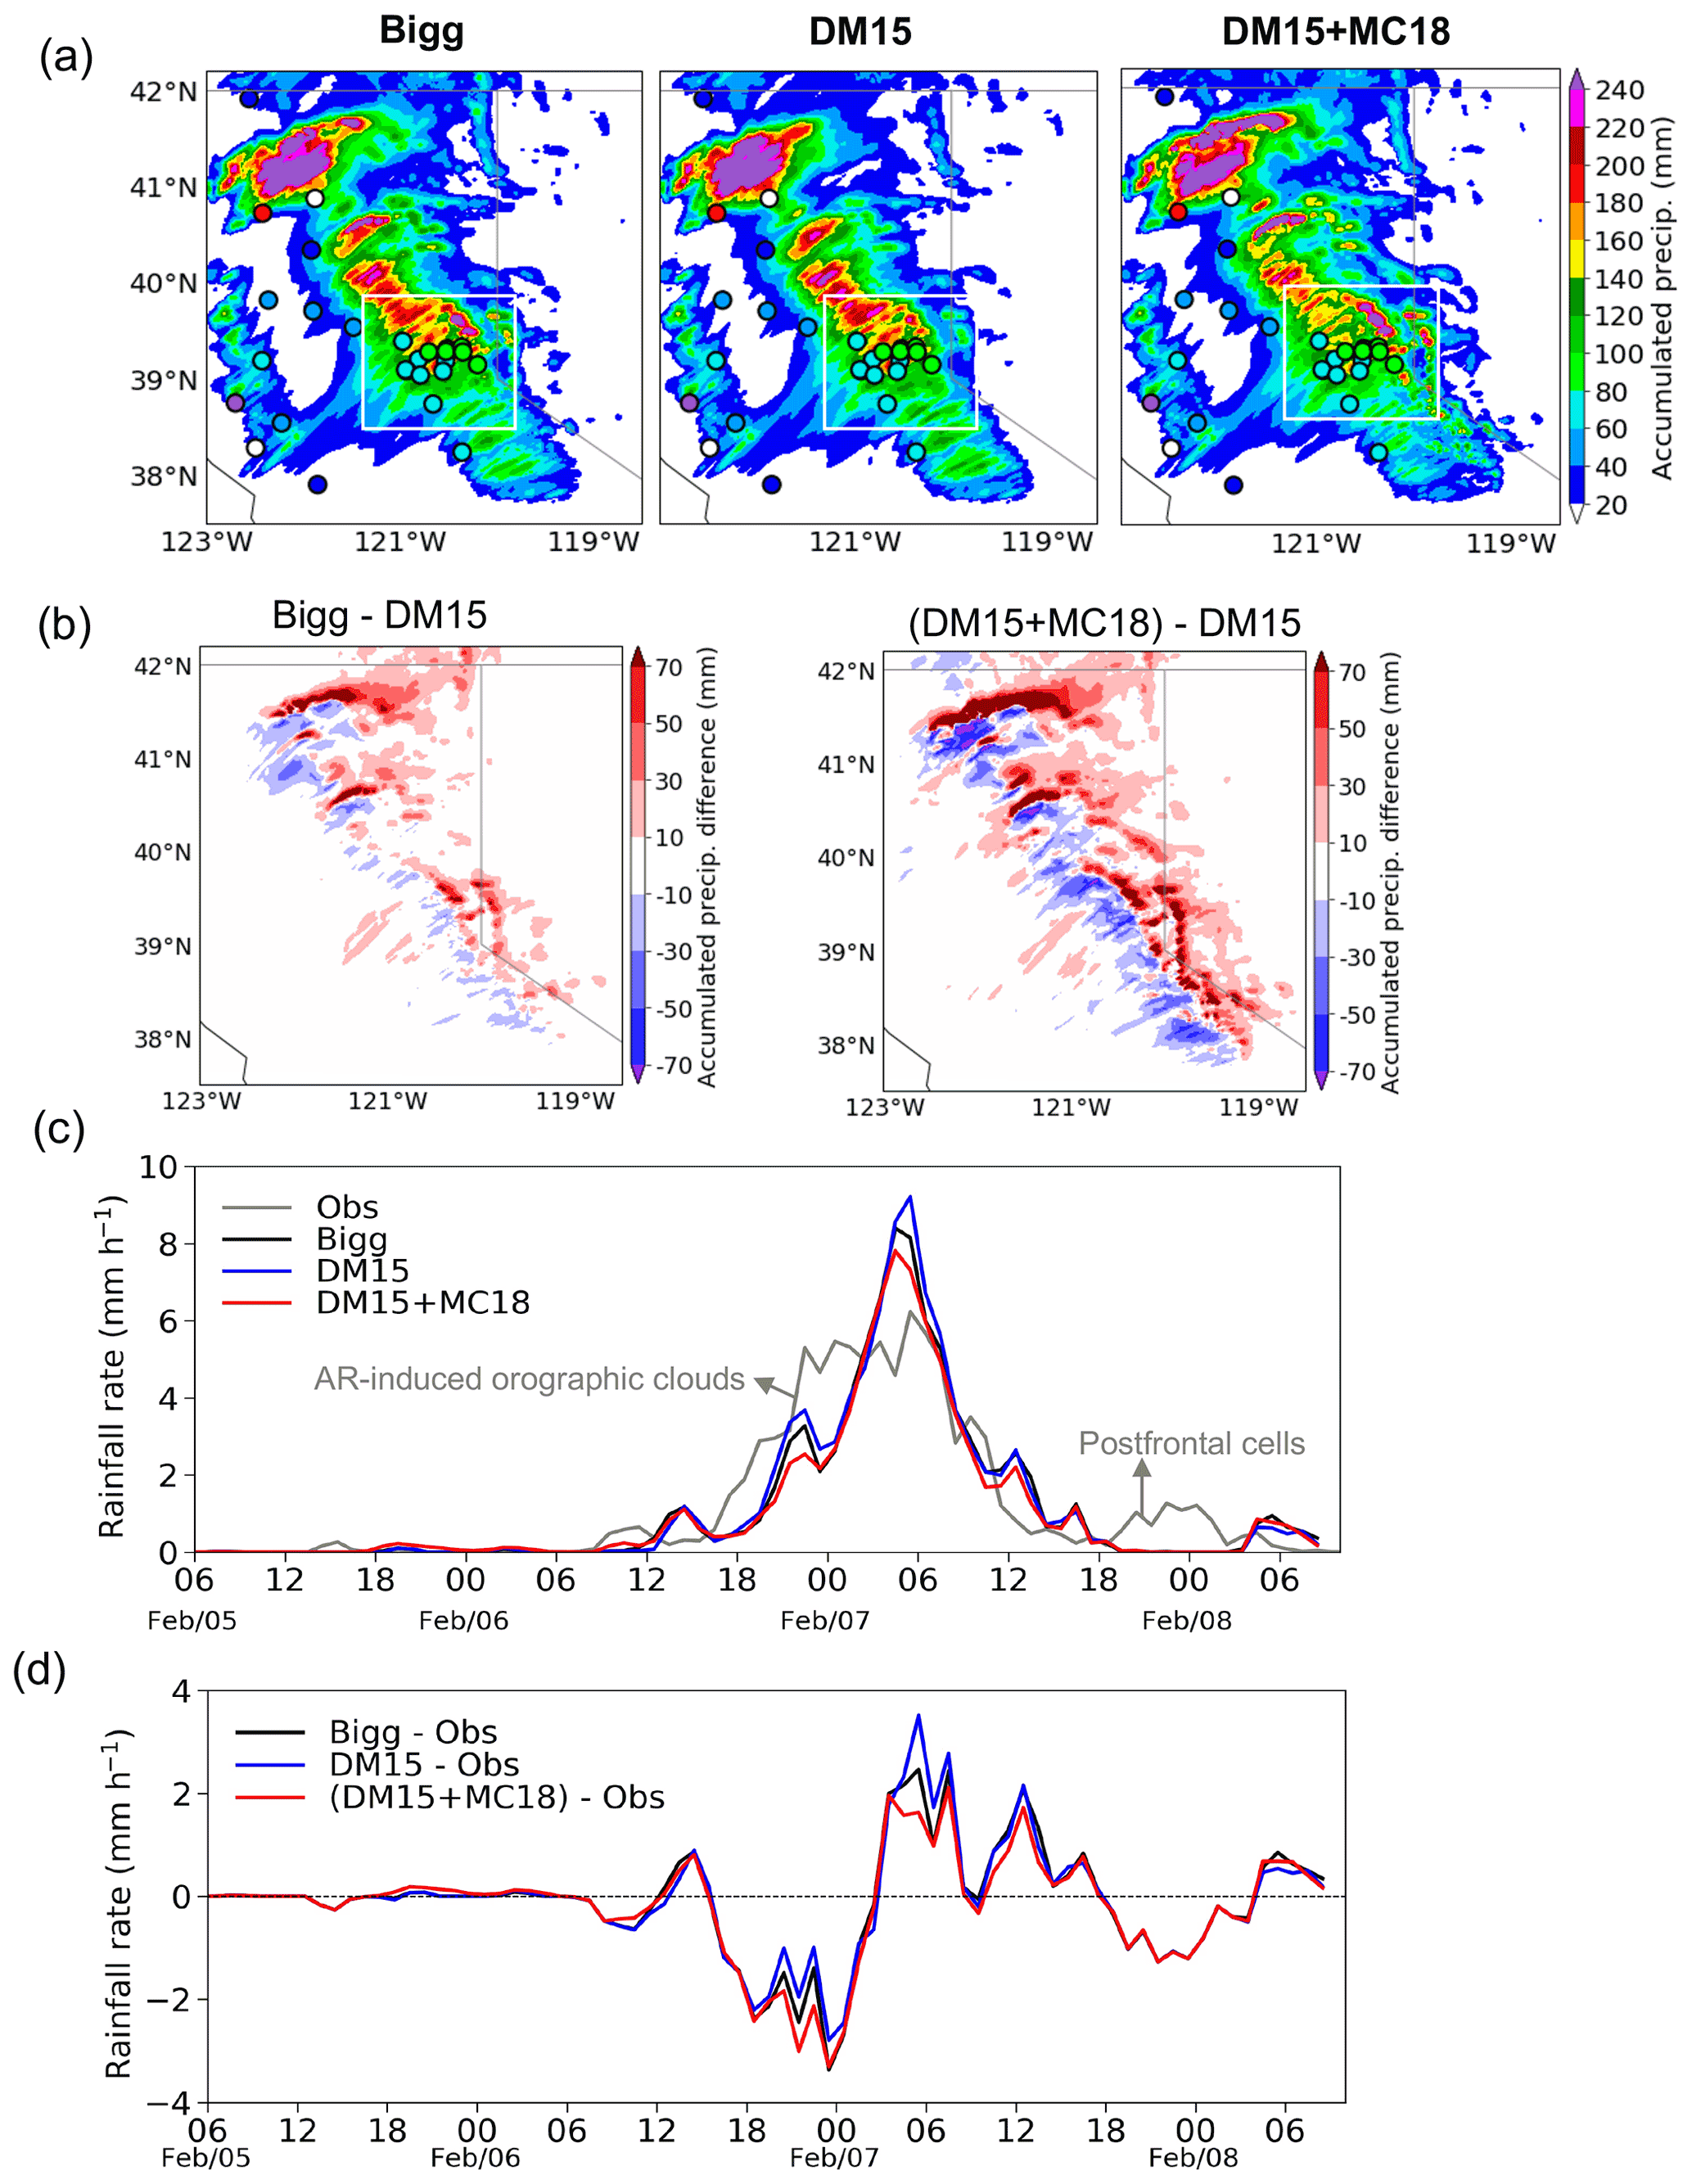
Figure 4(a) Spatial distributions of accumulated precipitation during the AR event (5 February 06:00 to 8 February 09:00 UTC) from Bigg, DM15, and DM15+MC18. The color shading is for simulations and the circles denote the rain gauge measurements provided by NOAA Physical Sciences Laboratory. (b) The same as (a) but for differences between Bigg and DM15 (left) and between DM15+MC18 and DM15 (right). (c) Time series of precipitation rates during the entire AR event for rain gauge observations (gray line), Bigg (black line), DM15 (blue line), and DM15+MC18 (red line). (d) Differences between the simulations and observations based on the data of (b). The precipitation rates in (b) are averaged over all the rain gauge sites shown in (a). The white boxes in (a) mark the region where the precipitation simulation is improved by adding marine INPs.
Cloud phase is crucial to radiation and precipitation for mixed-phase clouds, and the glaciation ratio is usually used to represent the cloud-phase states. The glaciation ratio is defined as IWC (IWC + LWC), where LWC and IWC denote liquid and ice water content, respectively. Values less than 0.1 and larger than 0.9 denote the liquid phase and ice phase, respectively, with values between 0.1 and 0.9 for the mixed phase (Korolev et al., 2003). The G-1 aircraft sampled the postfrontal clouds on 7 February as shown in Fig. 5a. All three simulations cannot capture the observed size of the precipitation cell (Figs. 5b and S2). In the simulations, precipitation is dominated by a few heavy precipitation clusters instead of the observed wide precipitation area. The simulated cells also do not reach the high altitudes found in the observations. The deviations of the simulation from observations for the postfrontal clouds could be attributed to various reasons such as (a) the long-time model integration time (the 4th day after model initiation) and (b) the spatial mismatch of simulated and observed clouds since these postfrontal clouds are small. Nevertheless, DM15+MC18 simulates the largest size of the precipitation cell, with the highest vertical extent among the three simulations.
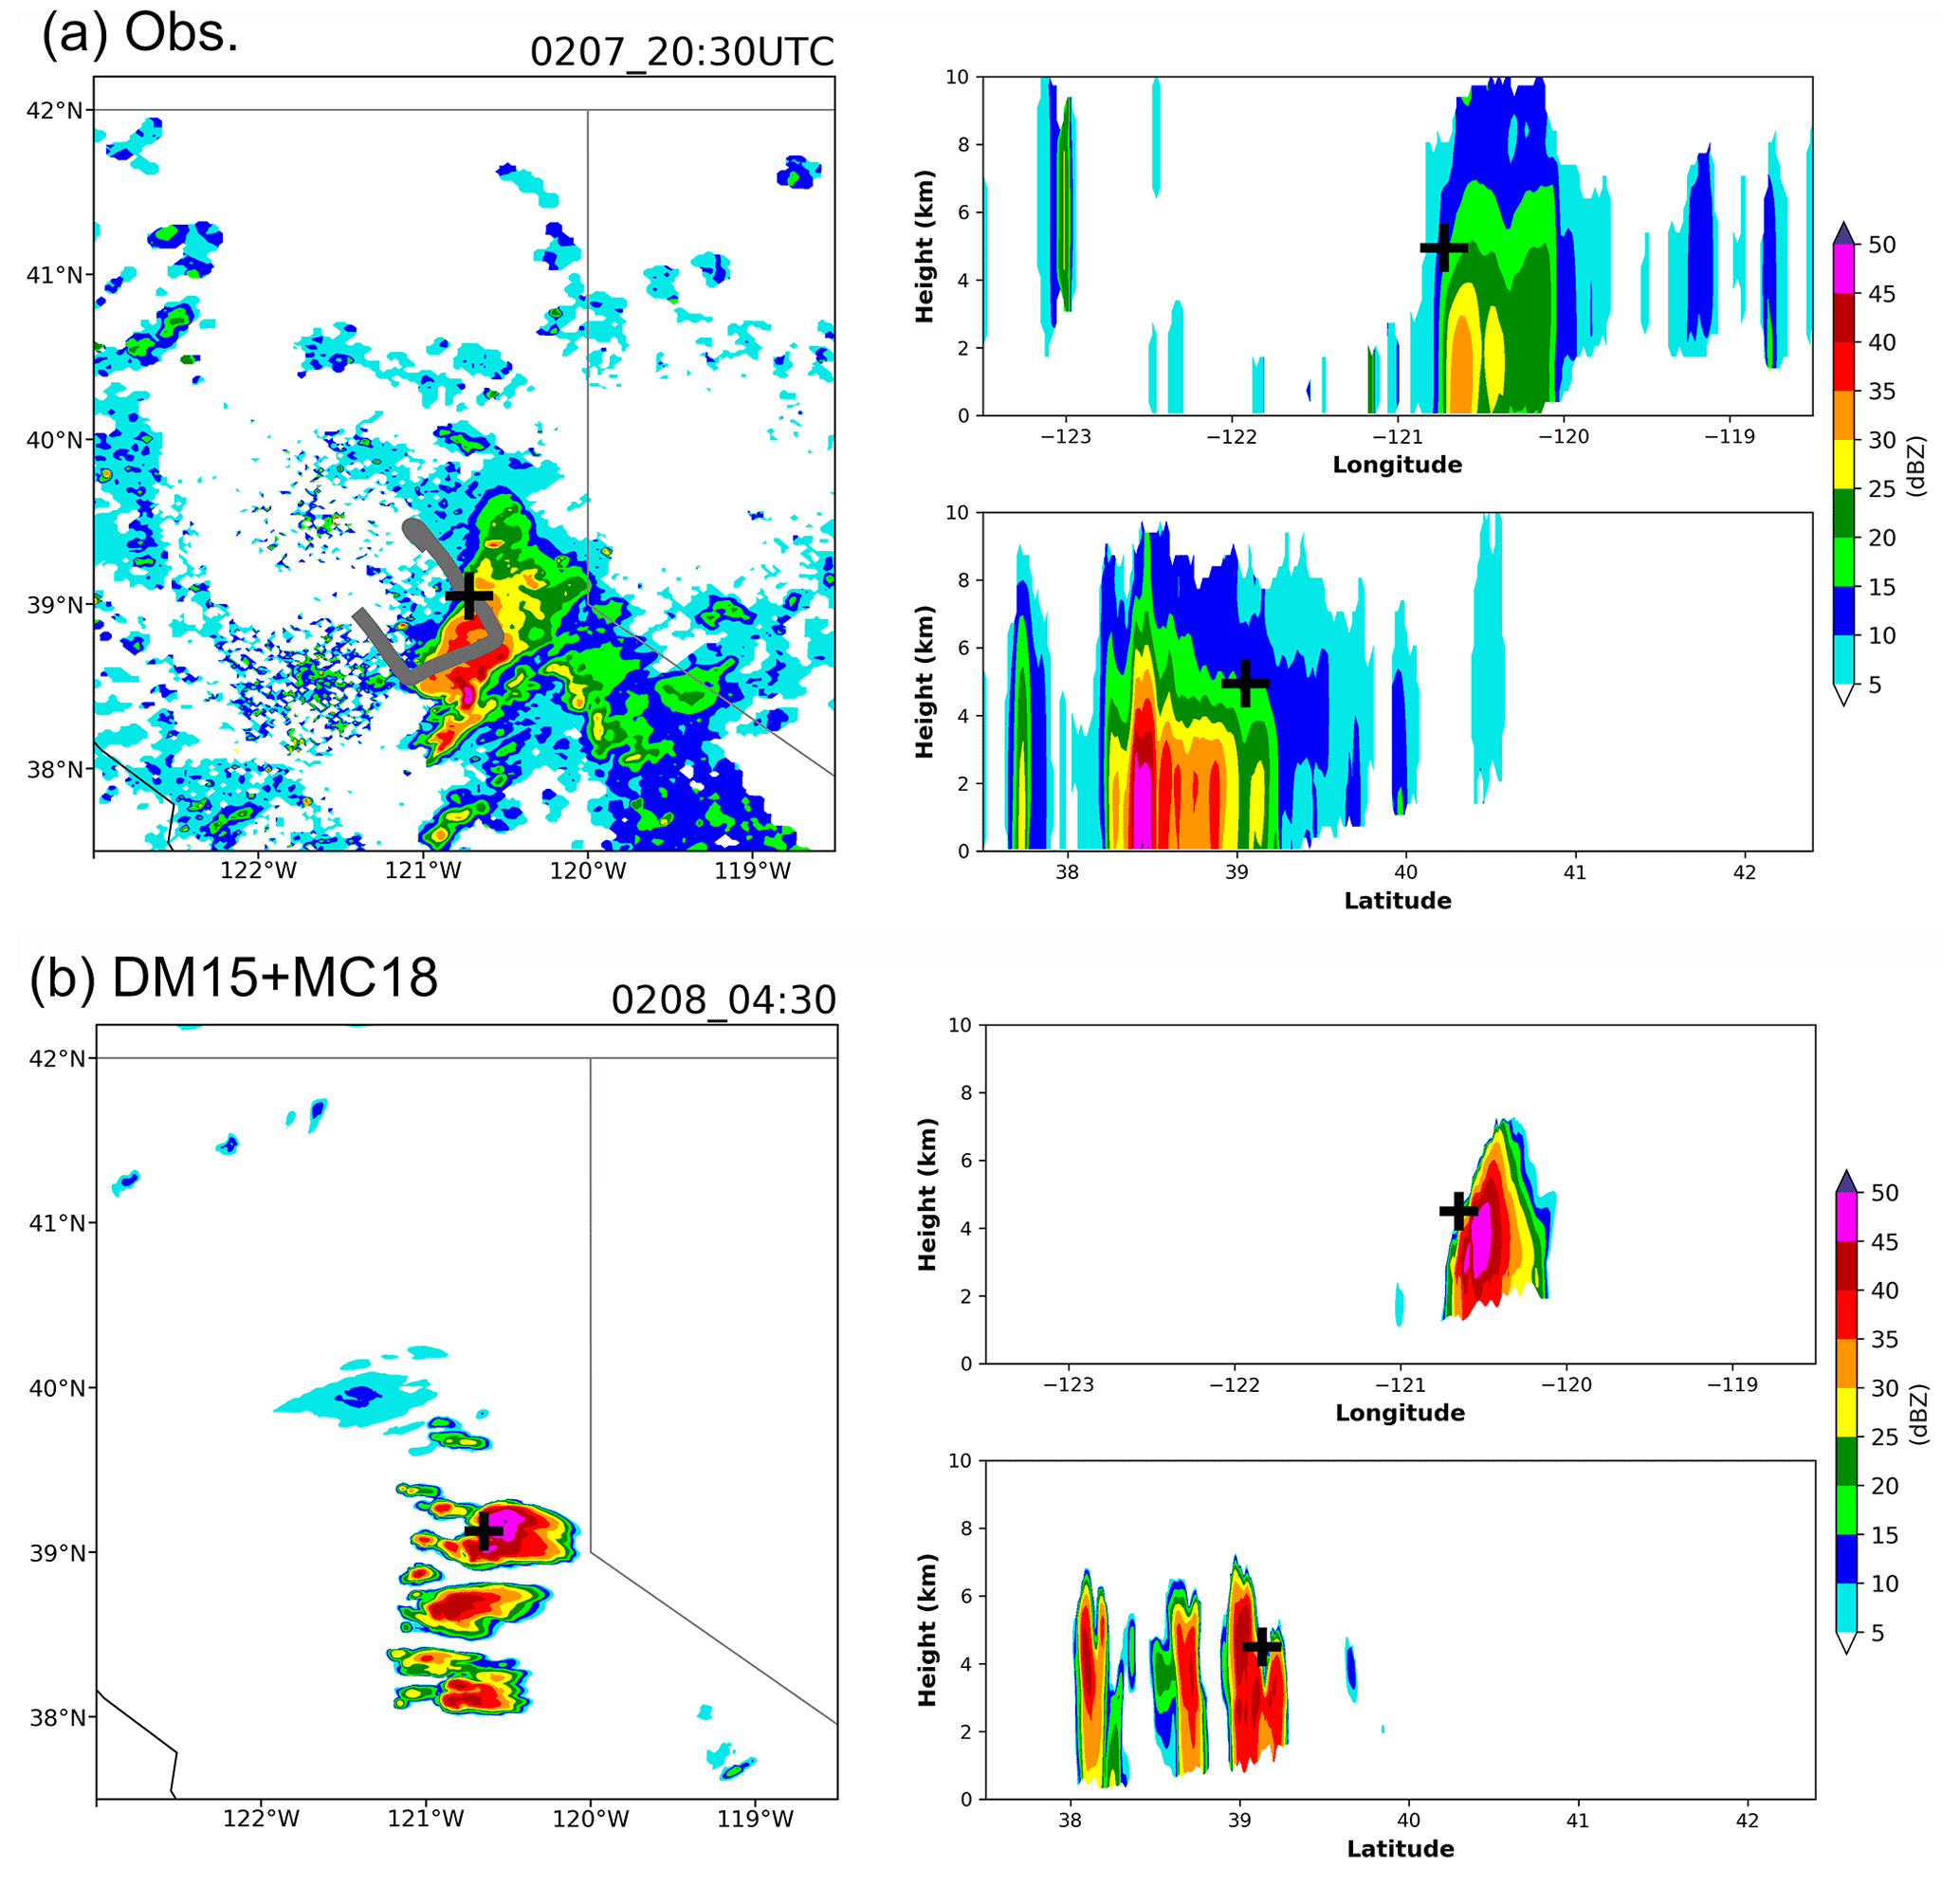
Figure 5(a) Composite reflectivity of NEXRAD for the postfrontal clouds that the G-1 aircraft sampled, (b) composite reflectivity from the simulation of DM15+MC18 for the postfrontal clouds. The observation and simulation are compared at the peak reflectivity time which is 20:30 UTC on 7 February for the observed clouds and 04:30 UTC on 8 February for the simulated clouds. The black crosses in the two left panels denote the positions where the longitude–height and latitude–height cross sections in the right panels are plotted. The gray line in the left panel of (a) shows the flight track of the G-1 aircraft.
LWC and IWC along both horizontal and vertical flight segments are displayed in Fig. 6a–b. IWC is generally 2–4 times larger than LWC in the postfrontal clouds. To compare with observations, the model data are processed by (a) selecting the grids at a distance from the simulated cell center similar to the distance of the airplane position from the observed postfrontal cell center, and sampling the data at a similar ambient temperature as observed by the aircraft (around −10 ∘C along the horizontal segment shown in Fig. 6a); (b) accounting for the location mismatch and increasing the sample size in the simulation to be more representative by extending the sampling area to include 20 grids at the front and back of a selected grid along the flight track, mimicking approximately the distance traveled by the G-1 airplane in 5 min; (c) filtering out the sampled grids with values of (LWC + IWC) below the detection limit of WCM (i.e., 0.02 g m−3, Thompson et al., 2016). Both horizontal and vertical flight segments are incorporated for comparison.

Figure 6Comparisons of the simulations with aircraft observations. The observed (a) LWC and (b) IWC along the flight track during 20:20–20:30 on 7 February when the aircraft flew through the mixed-phase regime of the postfrontal clouds. (c) LWC (solid) and IWC (dashed) and (d) the glaciation ratios of IWC (IWC + LWC) from the aircraft measurements (Obs, gray) and simulations of Bigg (black), DM15 (blue), and DM15+MC18 (red). The boxes show the 25th, median (horizontal lines in the box), and 75th percentiles of the data. The upper and lower whiskers show the 95th and 5th percentiles, respectively. The mean values are denoted by circles.
Figure 6c, d shows comparisons of LWC, IWC, and the glaciation ratio of IWC (IWC + LWC) between the simulations and aircraft measurements. The LWC is overestimated in all three simulations with DM15+MC18 of the largest overestimation (6 times higher than observations), while IWC is underestimated in Bigg and DM15 (nearly an order of magnitude lower in DM15 than in observations) (Fig. 6c). DM15+MC18 predicts much higher IWC than the other two simulations, with an overestimation of IWP by ∼3 times. The mean glaciation ratios fall in the range of 0.1–0.9 among the simulations (Fig. 6d), indicating that the observed mixed-phase cloud feature is simulated by the model. DM15+MC18 shows a mean ratio of ∼0.70, similar to the observed value of 0.74. This shows that the mixed-phase state is well captured when the marine INP effect is considered. By contrast, in Bigg and DM15 with a glaciation ratio of 0.41 or less, the mixed-phase state is liquid-dominated. The inclusion of the marine INP effect improves the simulation of cloud-phase states by enhancing heterogeneous ice formation through immersion freezing. But the overestimated LWC and IWC at this post-AR stage might have implications for marine INP effects. Here it is already indicated that the modeled postfrontal clouds are very sensitive to marine INPs. A detailed examination of how the marine INPs impact ice nucleation and cloud properties is discussed in the following section.
4.2 Marine INP effects under different AR stages
Impacts of the marine INPs transported from the Pacific Ocean on orographic clouds and precipitation are revealed by comparing the simulation of DM15+MC18 with the simulation of DM15.
As described in Sect. 3 on the AR evolution, before AR landfall (from 06:00 UTC on 5 February to 18:00 UTC on 6 February), precipitation occurred in Northern California. After AR landfall (from 18:00 UTC on 6 February to 12:00 UTC on 7 February), heavy orographic precipitation along the Sierra Nevada occurred (Fig. 7a). At the post-AR stage (from 12:00 UTC on 7 February to 09:00 UTC on 8 February), scattered postfrontal cloud cells formed, with relatively small cloud fractions and precipitation (Fig. 7a). The mean water vapor and temperature profiles are very different between the three AR stages, but the two simulations – DM15 (blue) and DM15+MC18 (red) – predict very similar results, as seen from the overlapping blue and red lines.
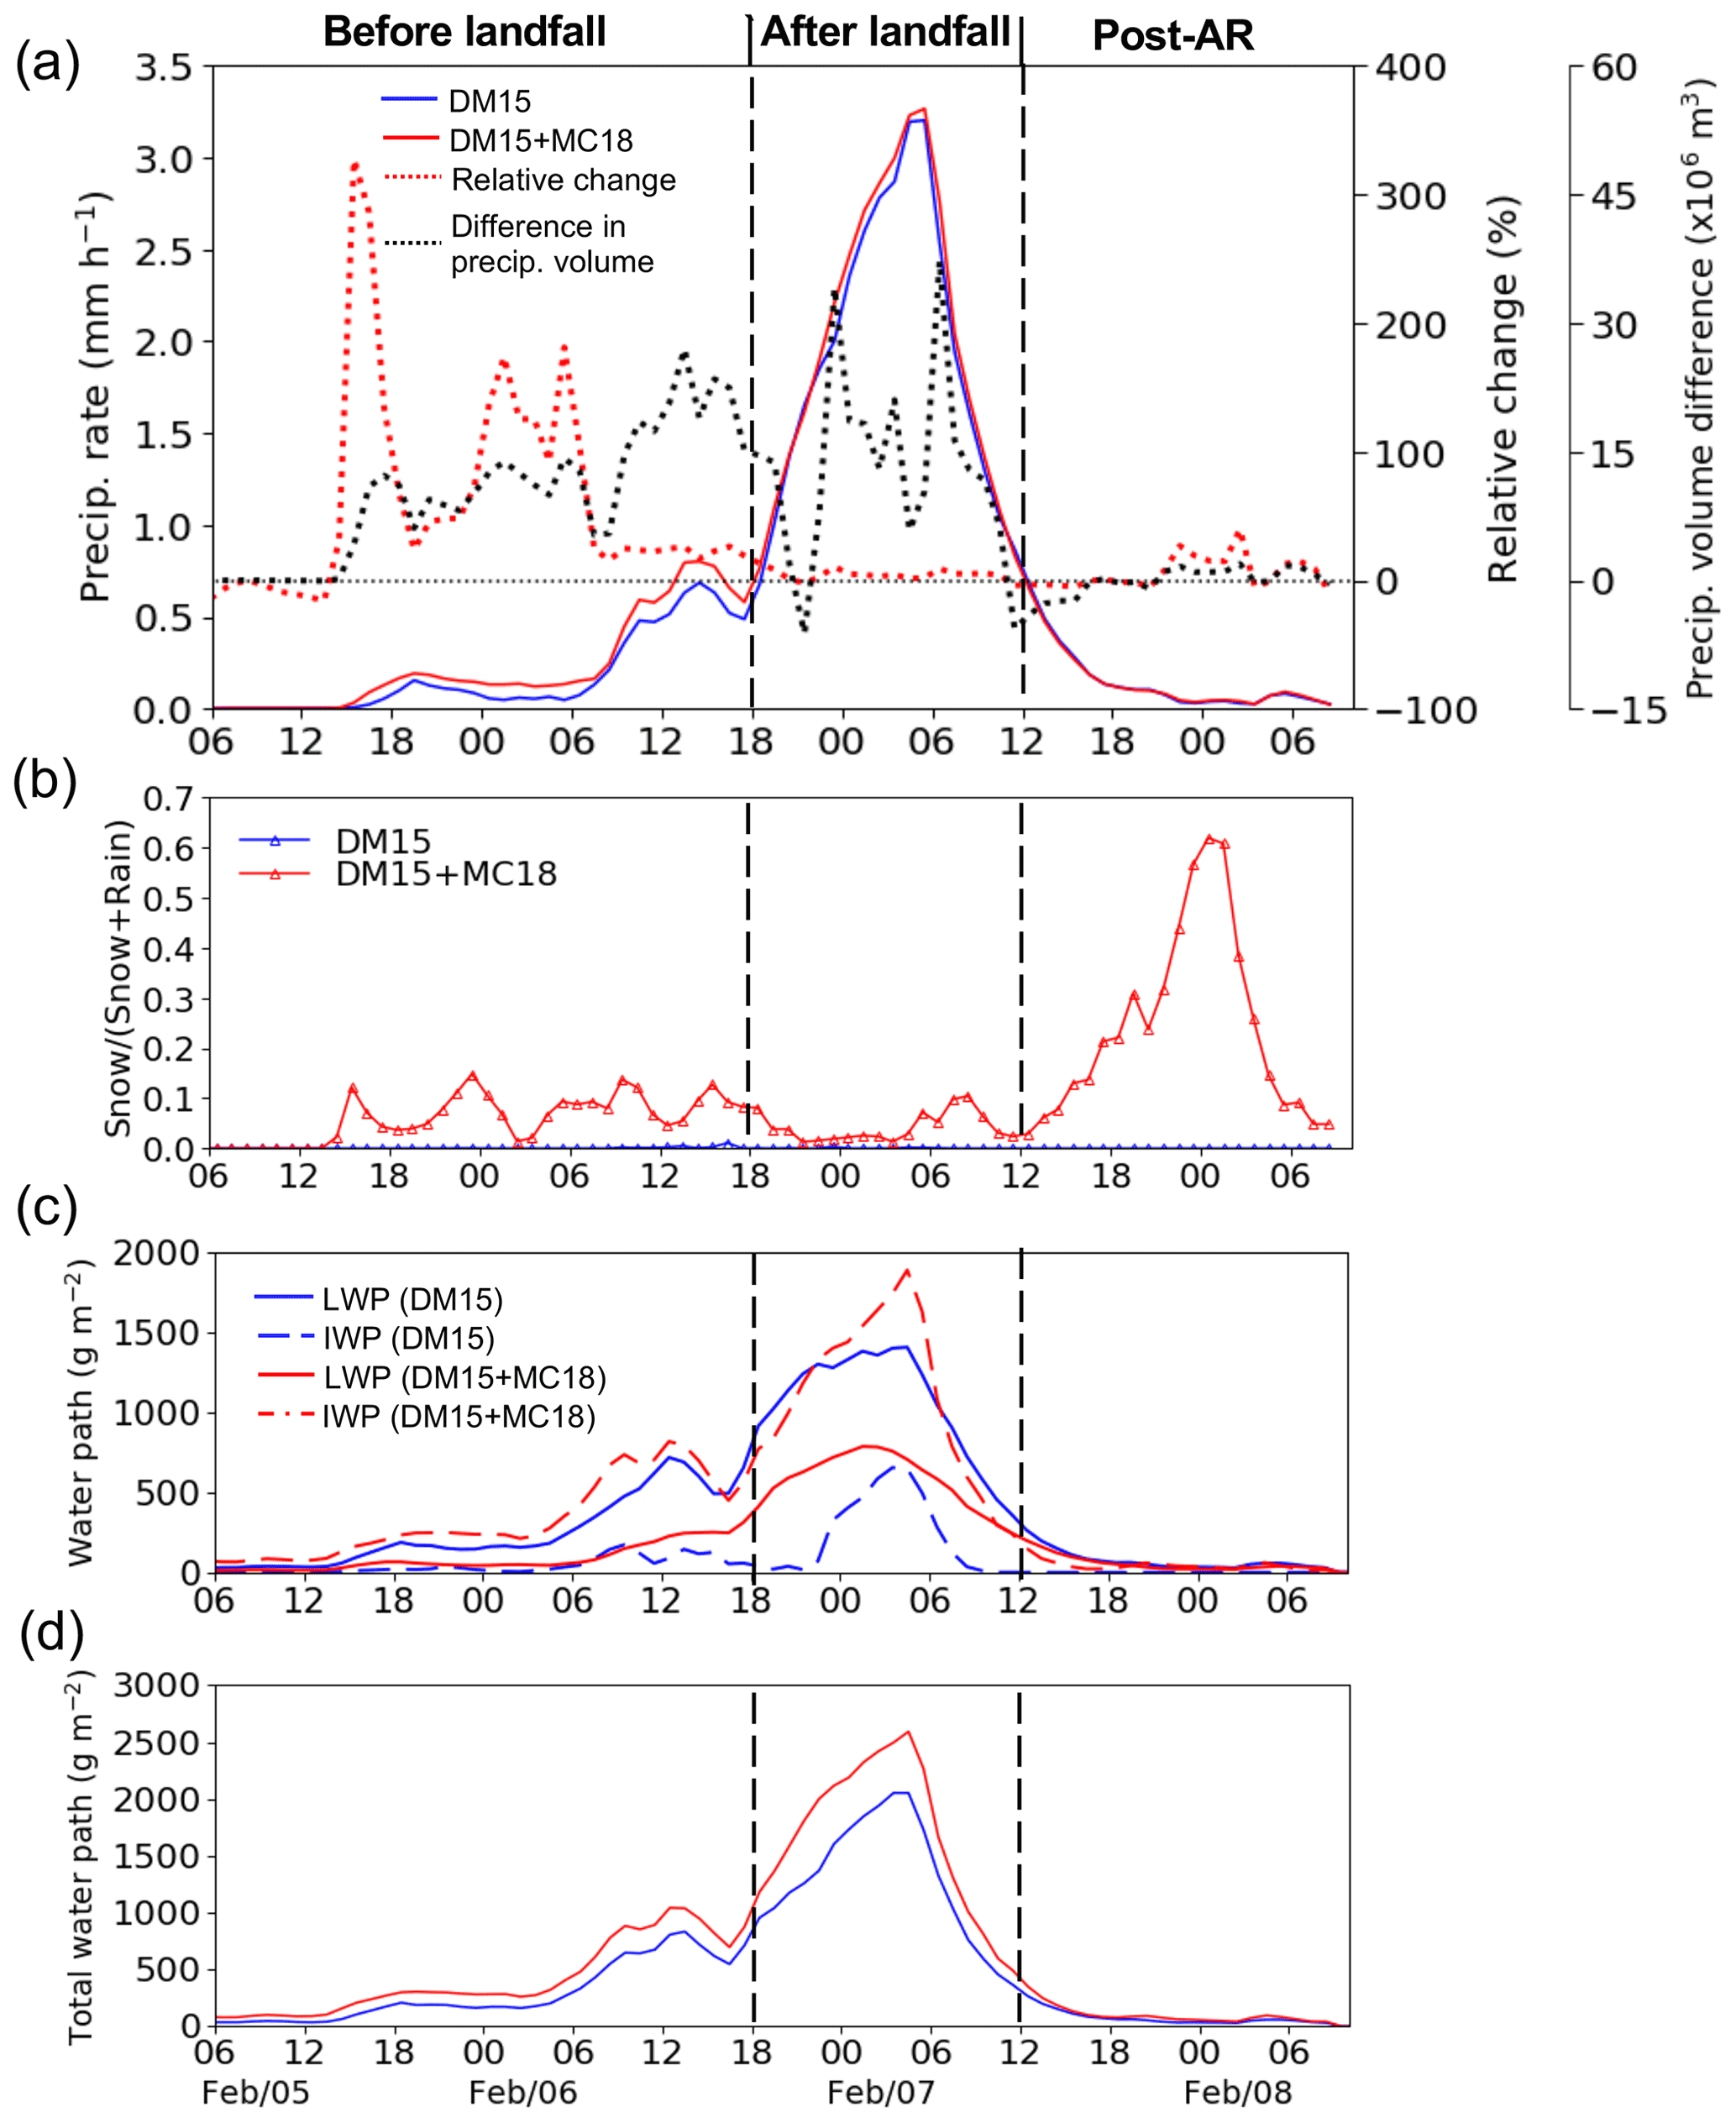
Figure 7Time series of (a) precipitation rate (solid lines, left y axis), (b) ratio of snow precipitation (i.e., snow (snow + rain) in mass mixing ratio) at the lowest model level, (c) LWP (solid lines) and IWP (dashed lines) for DM15 (blue) and DM15+MC18 (red), and (d) total condensate water path (TWP). The plot (a) also shows the percentage changes in precipitation rate (dotted red line, second y axis) and the absolute difference in precipitation volume (dotted black line, third y axis) from DM15 to DM15+MC18. The dashed vertical lines divide the three AR stages.
From the time series of average precipitation rates (Fig. 7a), the effect of marine INPs varies with the different AR stages, from the large increases of precipitation rates (over 50 % in general, the dotted red line) before AR landfall to no significant effects (a very small increase) after AR landfall. In the first stage (before AR landfall), the total precipitation increases by 36 % on average due to the marine INP effect (Fig. 7a and Table 1). There is only a 4 % increase in the total precipitation after AR landfall. Although the increase in total precipitation after AR landfall is small, the increase in the precipitation volume (precipitation rate multiplies surface area) is significant because of a large rain area (can be as high as 37.2 × 10⁶ m3, dotted black line in Fig. 7a). Both precipitation rate and volume at the post-AR stage are negligibly changed from DM15 and DM15+MC18. Thus, the marine INP effect significantly increases the total precipitation over the domain before AR landfall when a moderate amount of precipitation occurs in Northern California (Fig. 8a) and increases precipitation volumes notably at the stages both before and after AR landfall. After AR landfall, the total precipitation over the domain is not changed much by the marine INPs due to a compensation from the spillover effect featuring reduced precipitation on the windward slope of the mountains but increased precipitation over the lee side (Figs. 8b and 9e). This is because with the marine INPs, the larger amount of ice and/or snow that forms on the windward slope is transported to the lee side (Fig. 9d) and grows to a larger size and precipitates as snow. This spillover effect is accompanied by a large reduction of cloud water and rain over the windward side because of the conversion of liquid to ice (Fig. 9b–c). Since the water vapor transport along the cross section is very similar between DM15 and DM15+MC18 (Fig. 9a), the spillover effect by marine INPs is mainly the result of different cloud microphysical properties instead of meteorological conditions.
Table 1The changes in total precipitation, total condensate water path (TWP), liquid water path (LWP), and ice water path (IWP), and cloud fractions (CF), net cloud radiative forcing (CRF) at TOA from DM15 to DM15+MC18 (i.e., the marine INP effect), as well as the glaciation ratio, i.e., IWC (LWC + IWC), and the ratios of snow precipitation, i.e., snow (rain + snow) in mass mixing ratio at the lowest model level from DM15 to DM15+MC18, at the three AR stages. The percentage changes are calculated following ((DM15+MC18)–DM15) DM15 × 100 %.
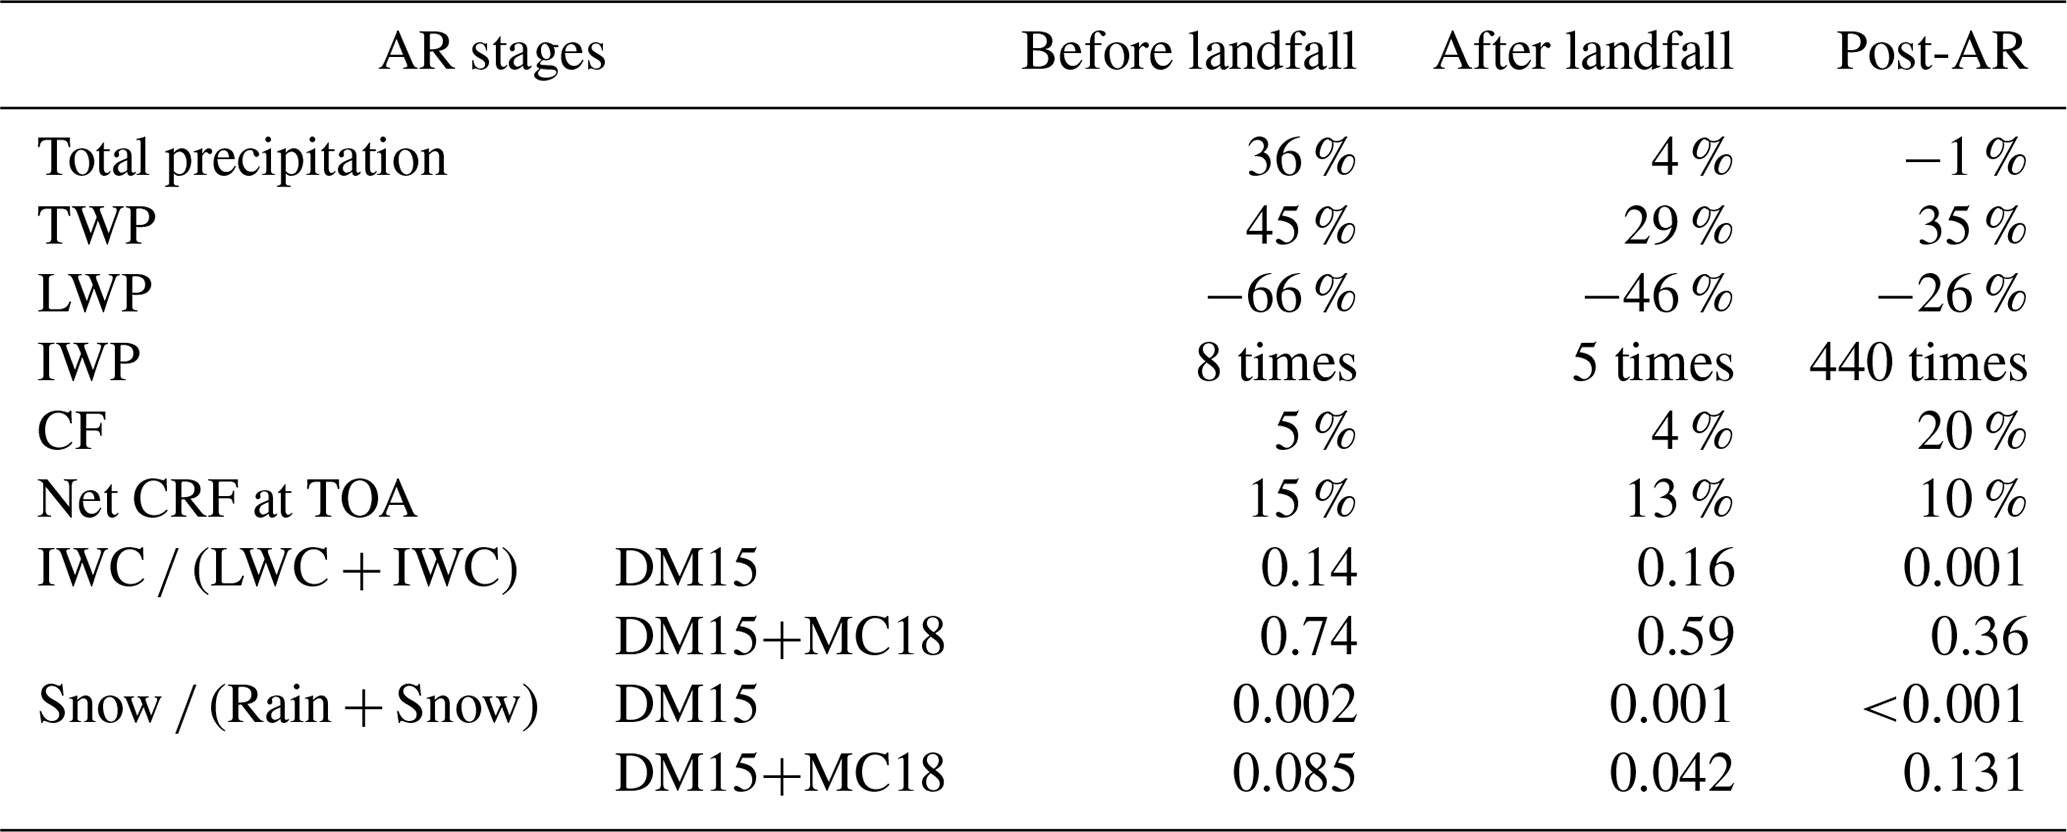
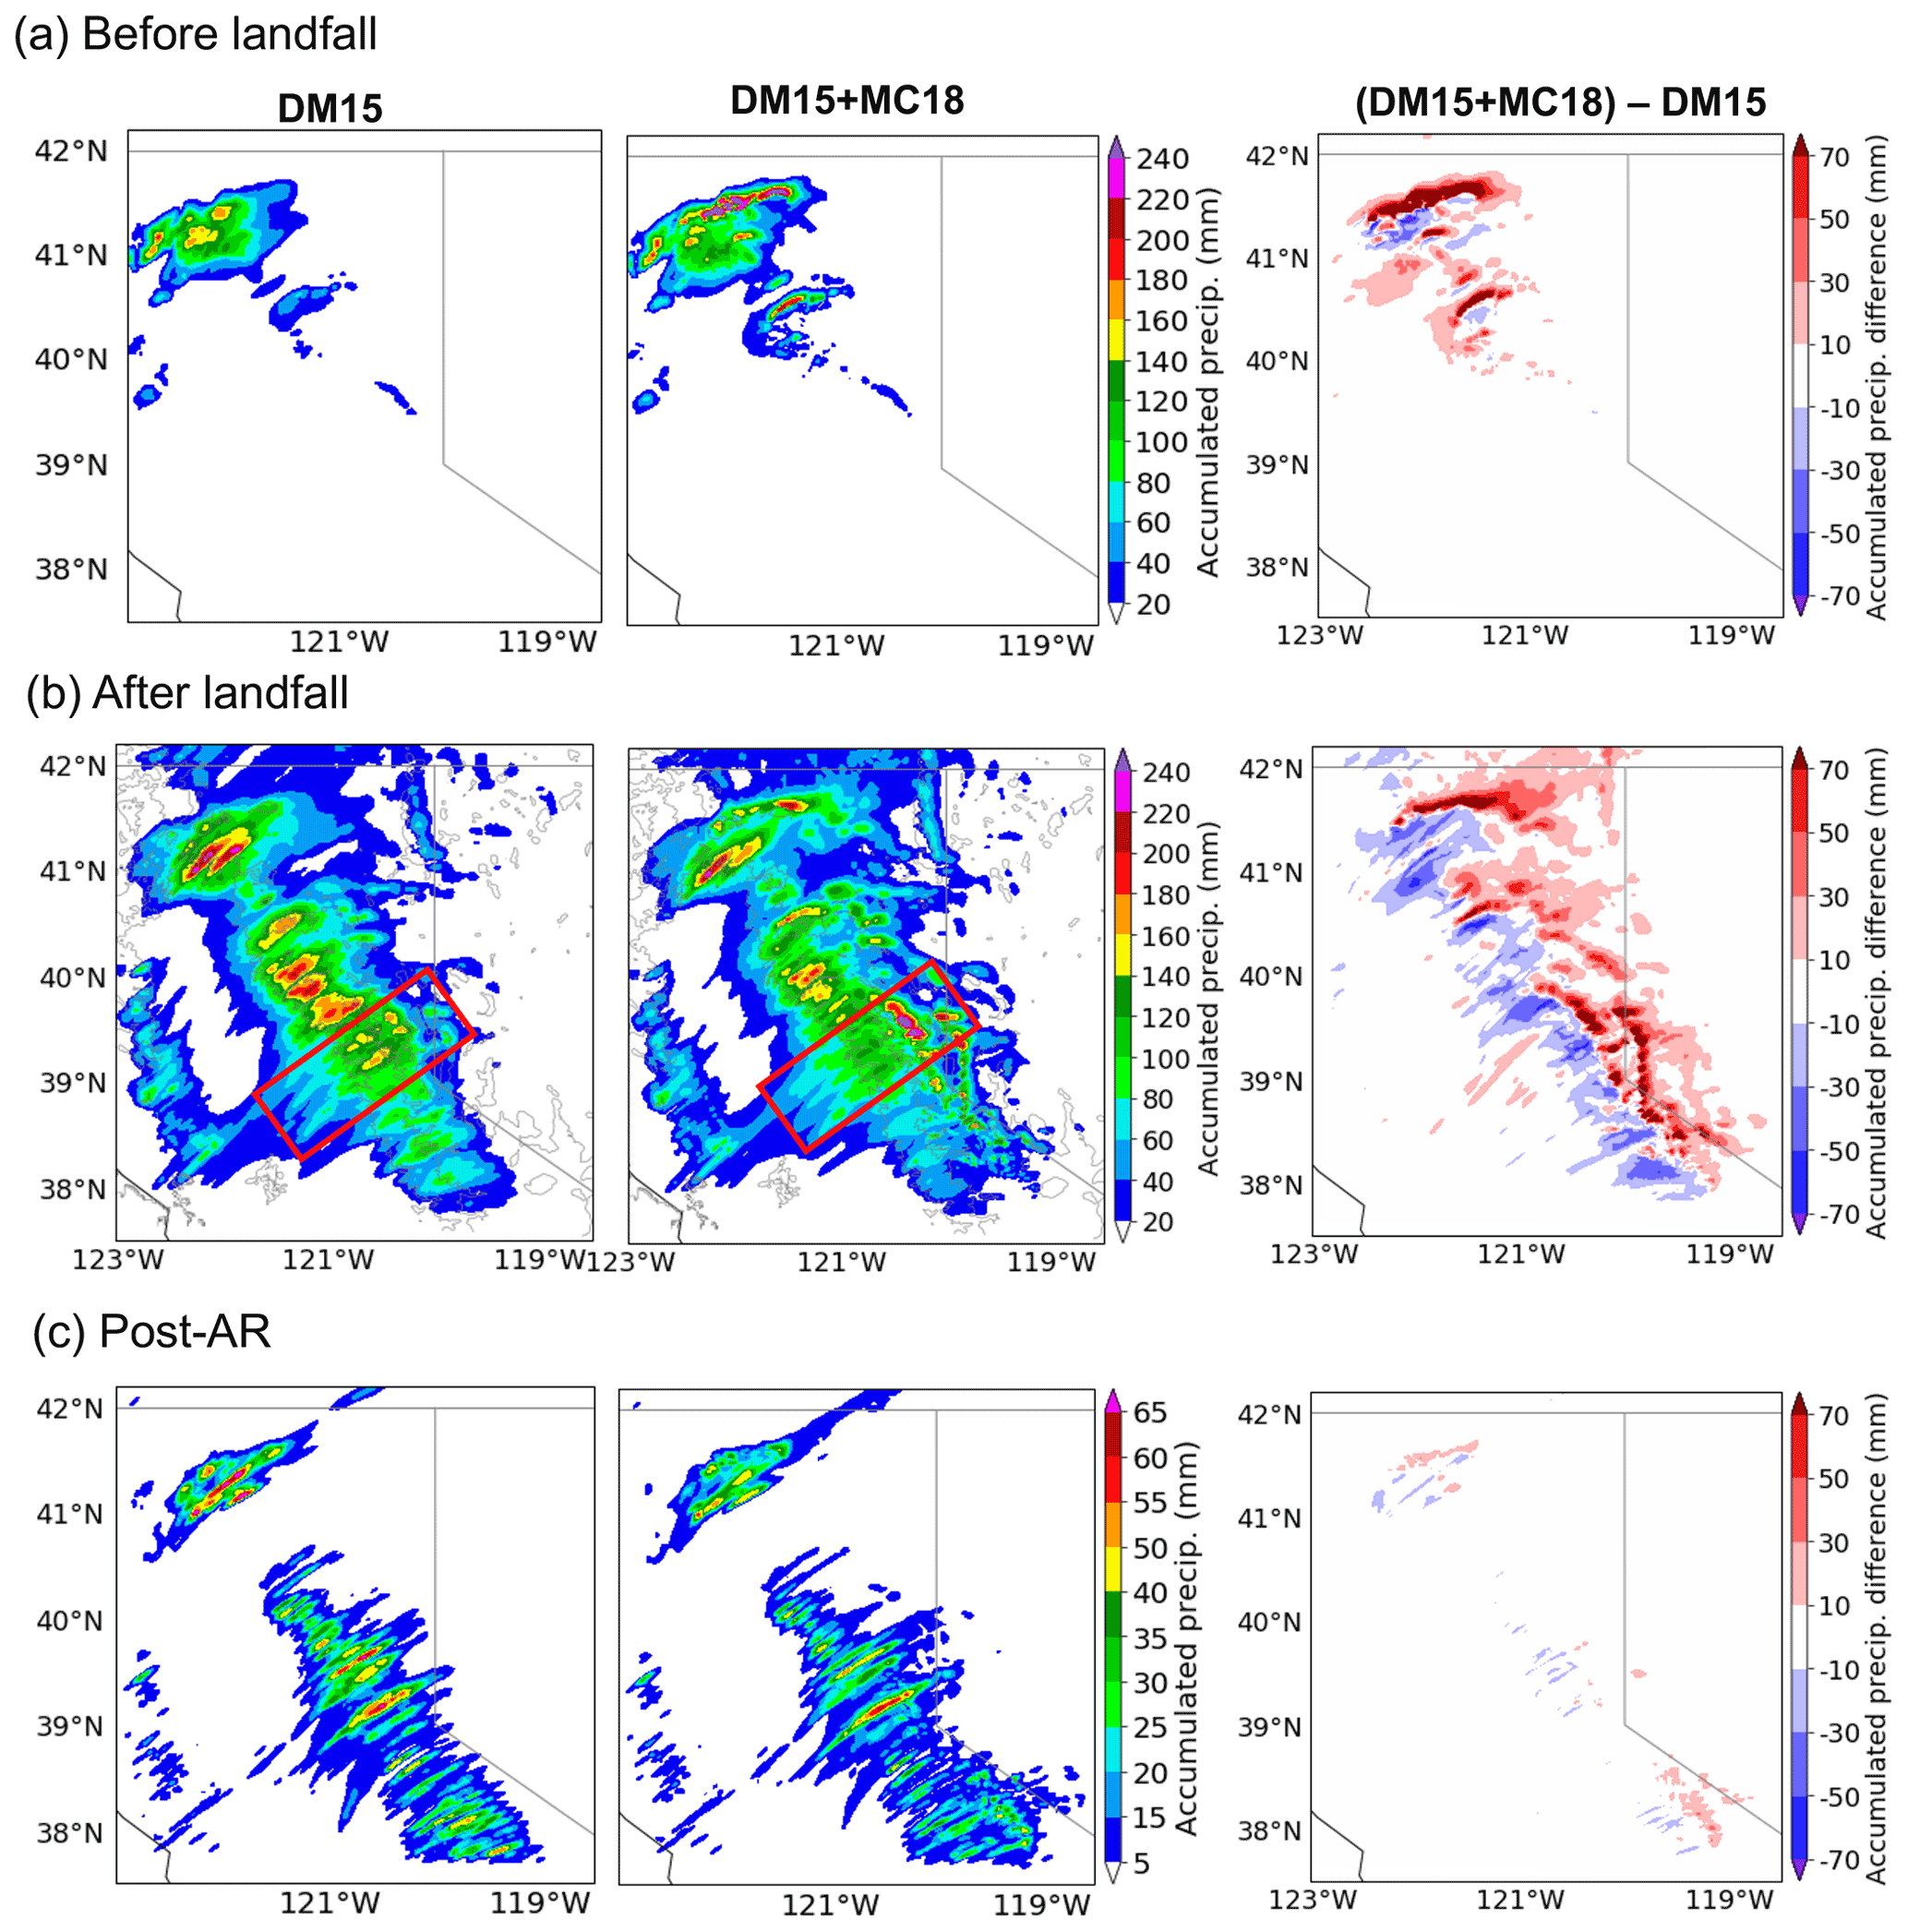
Figure 8Spatial distribution of accumulated precipitation during the stages (a) before AR landfall, (b) after AR landfall, and (c) post-AR in DM15 (left), DM15+MC18 (middle), and the difference between DM15+MC18 and DM15 (right). The rectangles marked in (b) denote the area for the east–west cross-sectional analysis shown in Fig. 9.
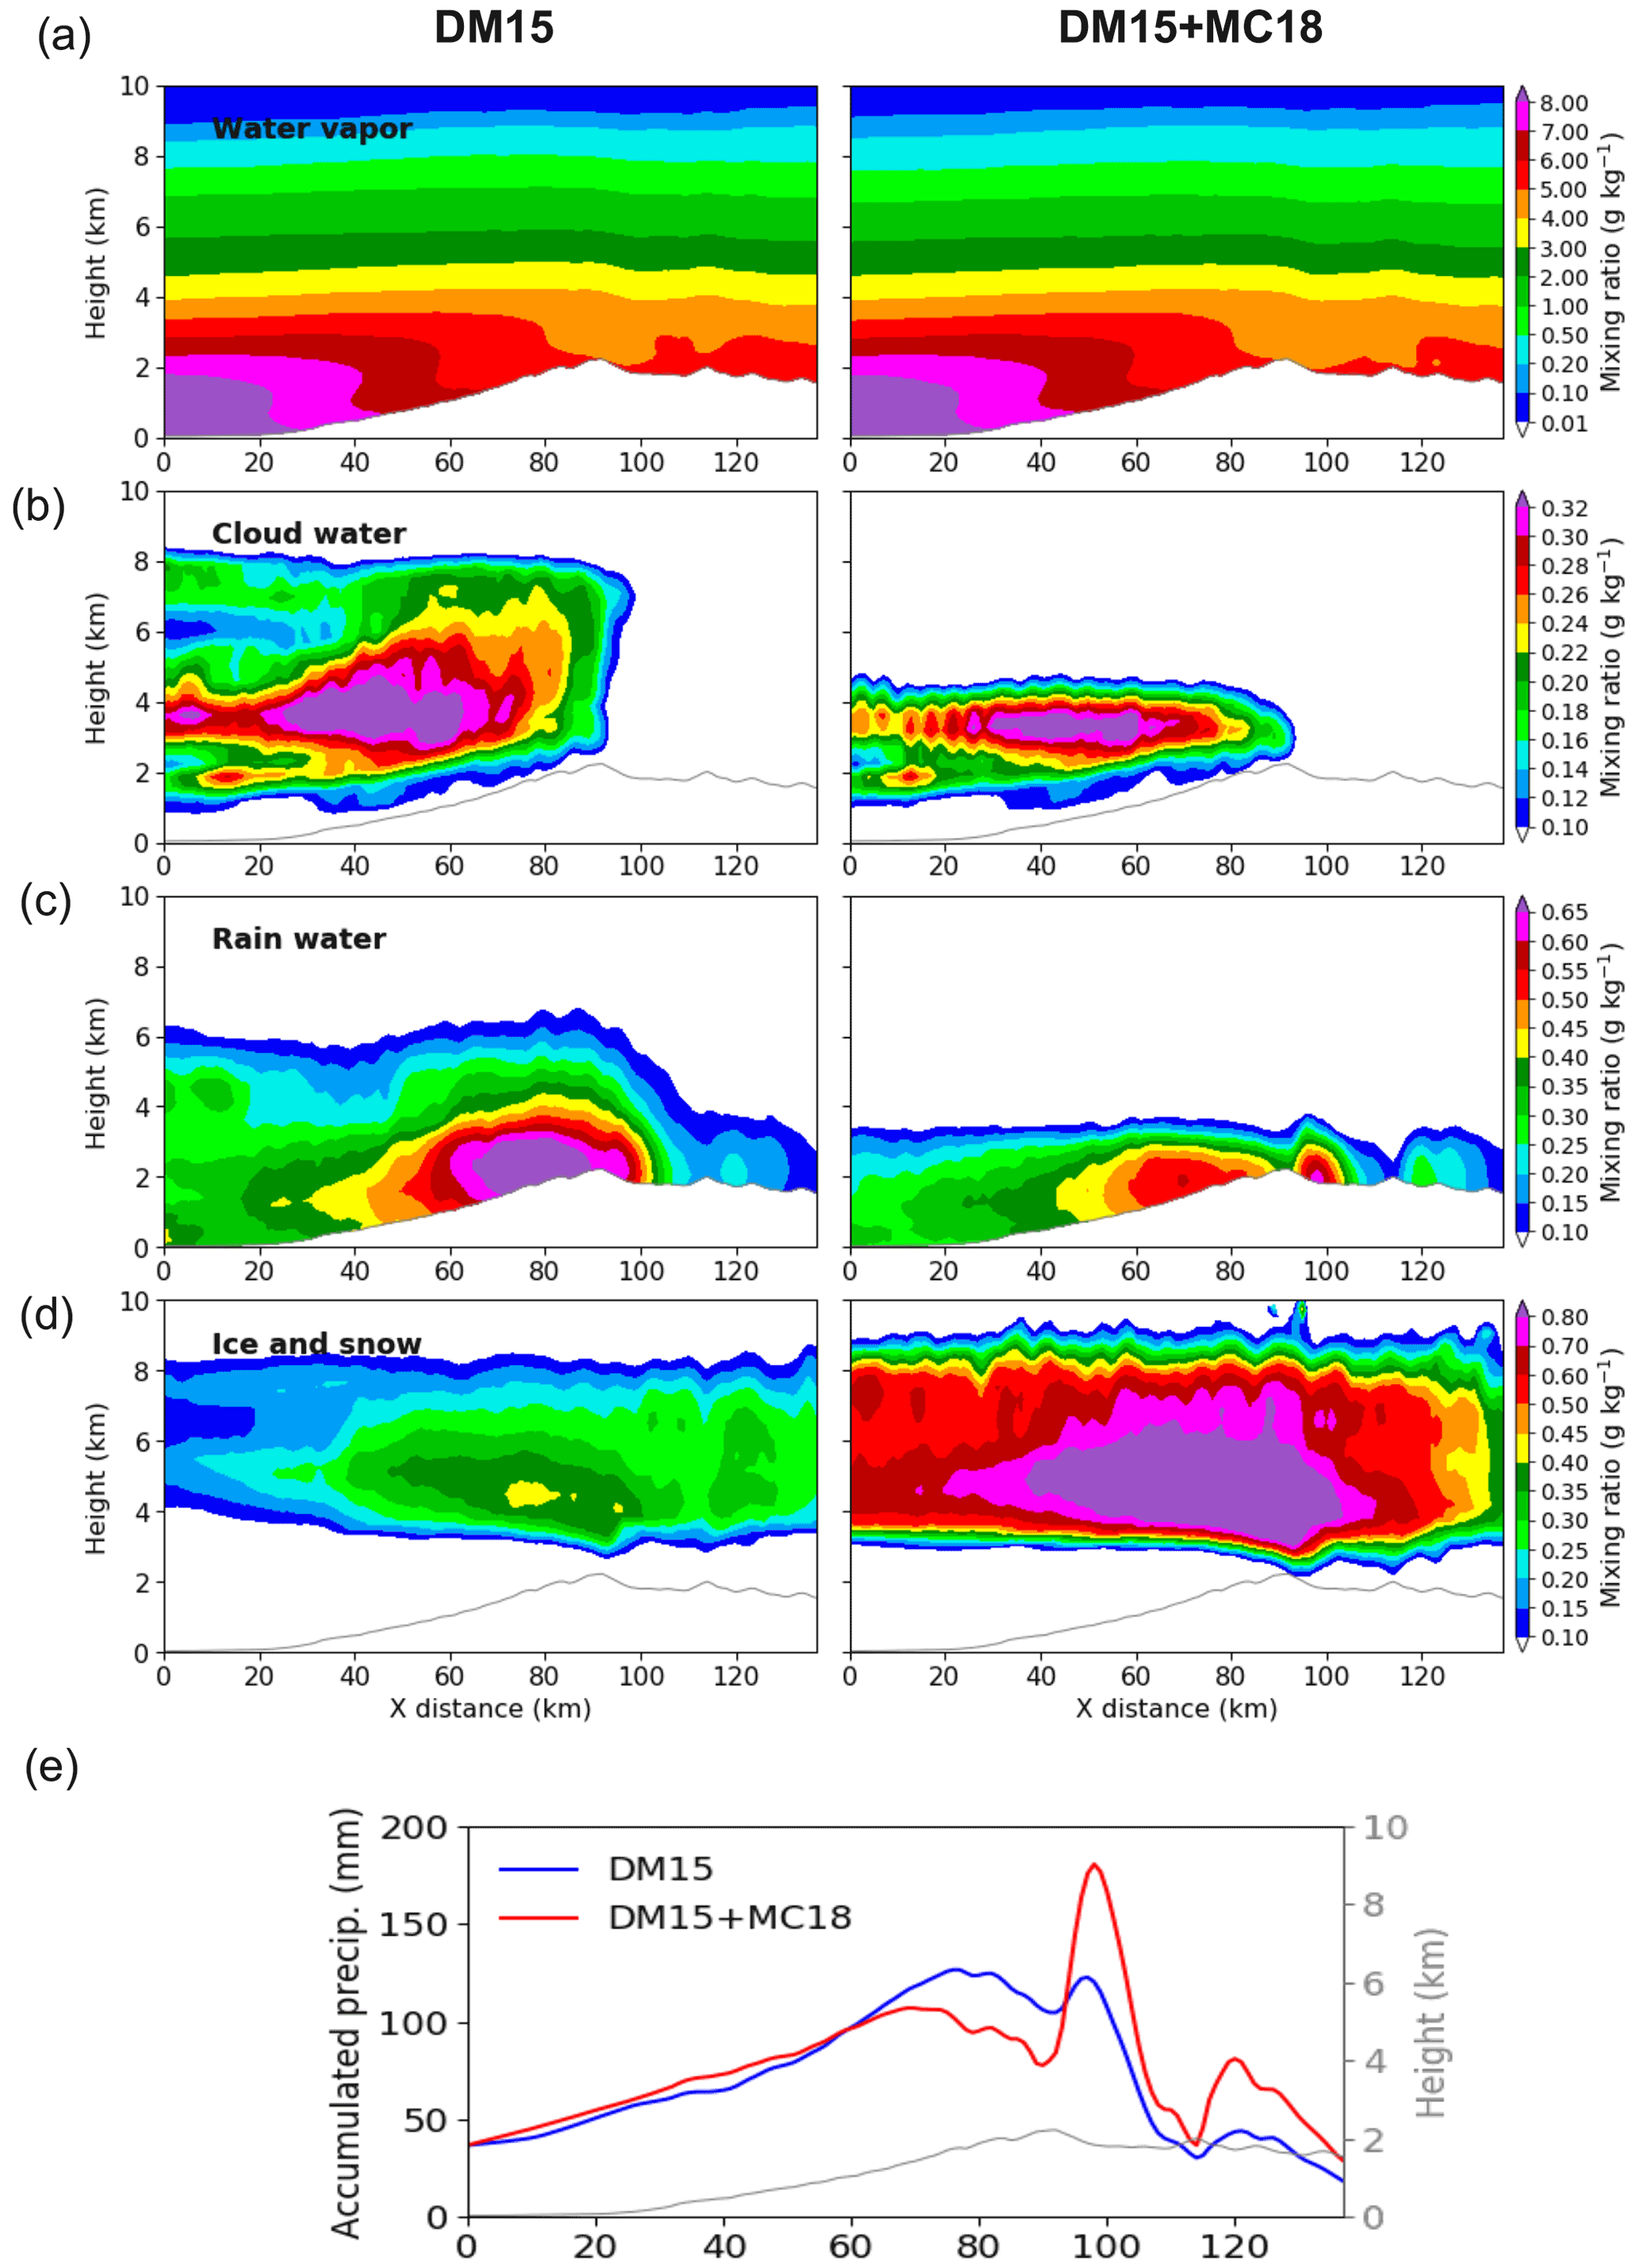
Figure 9Mean mixing ratios of (a) water vapor, (b) cloud water, (c) rainwater, (d) ice + snow, and (e) surface precipitation at the stage after AR landfall in DM15 and DM15+MC18. The vertical cross sections are averaged over the red boxes marked in Fig. 8b and the entire stage.
Even though the total domain precipitation is not changed much by the marine INPs at the latter two stages, the cloud phase and the near-surface precipitation type (i.e., rain or snow) are notably changed (Table 1). The mean glaciation ratio in the mixed phase is very low in DM15 (0.14, 0.16, and 0.001 for the first, second, and third stages, respectively) and is increased in DM15+MC18 to 0.74, 0.59, and 0.36, respectively. We examine the ratio of snow (rain + snow) in mass mixing ratio at the lowest model level for the changes of the near-surface precipitation type (Fig. 7b). There is negligible snow precipitation near the surface in DM15 and the ratios of snow precipitation are very small during the entire AR event. The snow precipitation ratios increase in DM15+MC18 and the magnitudes vary significantly with different AR stages. On average, the ratio of snow precipitation increases from 0.002, 0.001, <0.001 in DM15 to 0.08, 0.04, and 0.13 in DM15+MC18 before AR landfall, after AR landfall, and post-AR, respectively (Table 1). This shows that marine INPs increase snow precipitation and the effect is particularly significant before AR landfall and post-AR. Correspondingly, rain precipitation is reduced (Table 1). This has an important implication for the regional hydrological resources since more snow accumulation in winter increases freshwater resources in the summer while less rain reduces flood risks.
The increased snow and reduced rain at the surface correspond to the increased ice water path (IWP) and decreased liquid water path (LWP; Fig. 7c). The mean LWP in DM15+MC18 is reduced by 66 %, 46 %, and 26 % for the three stages relative to DM15, respectively (Table 1). We showed an increased LWC from DM15 to DM15+MC18 in Fig. 6c in the postfrontal cells. Here the decrease in LWC LWP averaged over the entire post-AR stage is dominated by the strong decrease over the time before the postfrontal cloud formed. Both LWC and IWC are increased by marine INPs as shown in Fig. 6 (see Sect. 4.3 for more discussion). IWP is greatly enhanced by about 8, 5, and 440 times at the three stages, respectively. Interestingly, the total condensate water path (TWP) is increased by the marine INPs (Fig. 7d). On average increases in TWP are 45 %, 29 %, and 35 % in DM15+MC18 at the three AR stages relative to DM15, respectively (Table 1). The increases in the total condensate water path and the increased surface precipitation (or no change) suggest that marine INPs enhance the conversion of water from the vapor phase to the condensate phase, which will be further discussed later. This is particularly the case before and after AR landfall, with water vapor content notably reduced in DM15+MC18 compared with DM15 (Fig. S3a–b).
Cloud cover is slightly increased during the first two stages (4 %–5 %) in the simulations considering marine INPs, but the change at the post-AR stage is ∼20 % on average, which is very significant. Because both TWP and cloud cover are increased due to the marine INP effect, the cloud radiative forcing (CRF) at the top of atmosphere (TOA) gets stronger by 15 %, 13 %, and 10 % for the three AR stages, respectively. Although the cloud phase, precipitation type, and cloud fraction at the post-AR stage have the largest changes among the three stages by the marine INP effect (Table 1), the CRF does not change drastically probably because of the offset between the increase resulting from the increased cloud fraction and TWP, and the decrease from the reduced cloud liquid is the largest.
Overall, the marine INP effects on TWP, IWP, and snow precipitation are more significant at the first and third stages (i.e., before AR landfall and post-AR) than the stage after AR landfall, but a notable spillover effect is seen after AR made landfall. Cloud and precipitation quantities are more sensitive to marine INPs before AR landfall than after AR landfall, and the responses of TWP IWP and snow precipitation are particularly drastic at the post-AR stage (Table 1). As noted earlier, we should not put much attention on the marine INP effects at the post-AR stage since our model does not seem to be able to capture those small cloud cells well. The reasons leading to the different responses at different AR stages are now examined.
4.3 Explaining different marine INP effects at different AR stages
We first examine the temporal evolution of dust and marine aerosol number concentrations, which are derived based on the predicted mass mixing ratios as described in Sect. 2 and used as input to the DeMott et al. (2015) and MC2018 parameterizations (Fig. 10a, b), as well as their corresponding immersion freezing (i.e., ice nucleation) rates (Fig. 10c, d). The dust concentrations and the corresponding ice nucleation rates (Fig. 10a, c) are about three orders of magnitude lower than those of the marine aerosols (Fig. 10b, d) during the AR events. Ice nucleation from dust is negligible at temperatures warmer than −15 ∘C but the ice nucleation from marine aerosols is notable. This is mainly because of three orders of magnitude higher marine aerosol number concentrations from the surface up to 8 km since ice nucleation efficiencies of marine aerosols are about three orders of magnitude lower than mineral dust at any temperature (MC2018). The deep marine aerosol layer during the AR enables notable ice nucleation at temperatures even higher than −15 ∘C. Homogeneous freezing (<−37 ∘C; Fig. 10d vs. 10c) occurs less in DM15+MC18 because of a larger consumption of liquid drops and supersaturation in the heterogeneous freezing regime. This is commonly seen in convective clouds (e.g., Zhao et al. 2019). The clear-sky marine aerosol number concentrations increase from before AR landfall to post-AR as the AR evolved (Fig. 10b). After the AR made landfall, marine aerosols increase significantly as AR strong winds near the ocean surface produce more aerosols and also transport more of them to the Sierra Nevada (Fig. 10b). Despite the significant increase in marine aerosols after AR landfall, the marine INP effects on clouds and precipitation are small at this stage, because the increase of marine aerosols does not increase ice nucleation rates (Fig. 10d). However, at the post-AR stage, the ice nucleation rates from the marine INPs are up to a few times larger than the earlier two stages (Fig. 10d), explaining why the effects on IWP and snow precipitation at the post-AR stage are largest among the three stages.
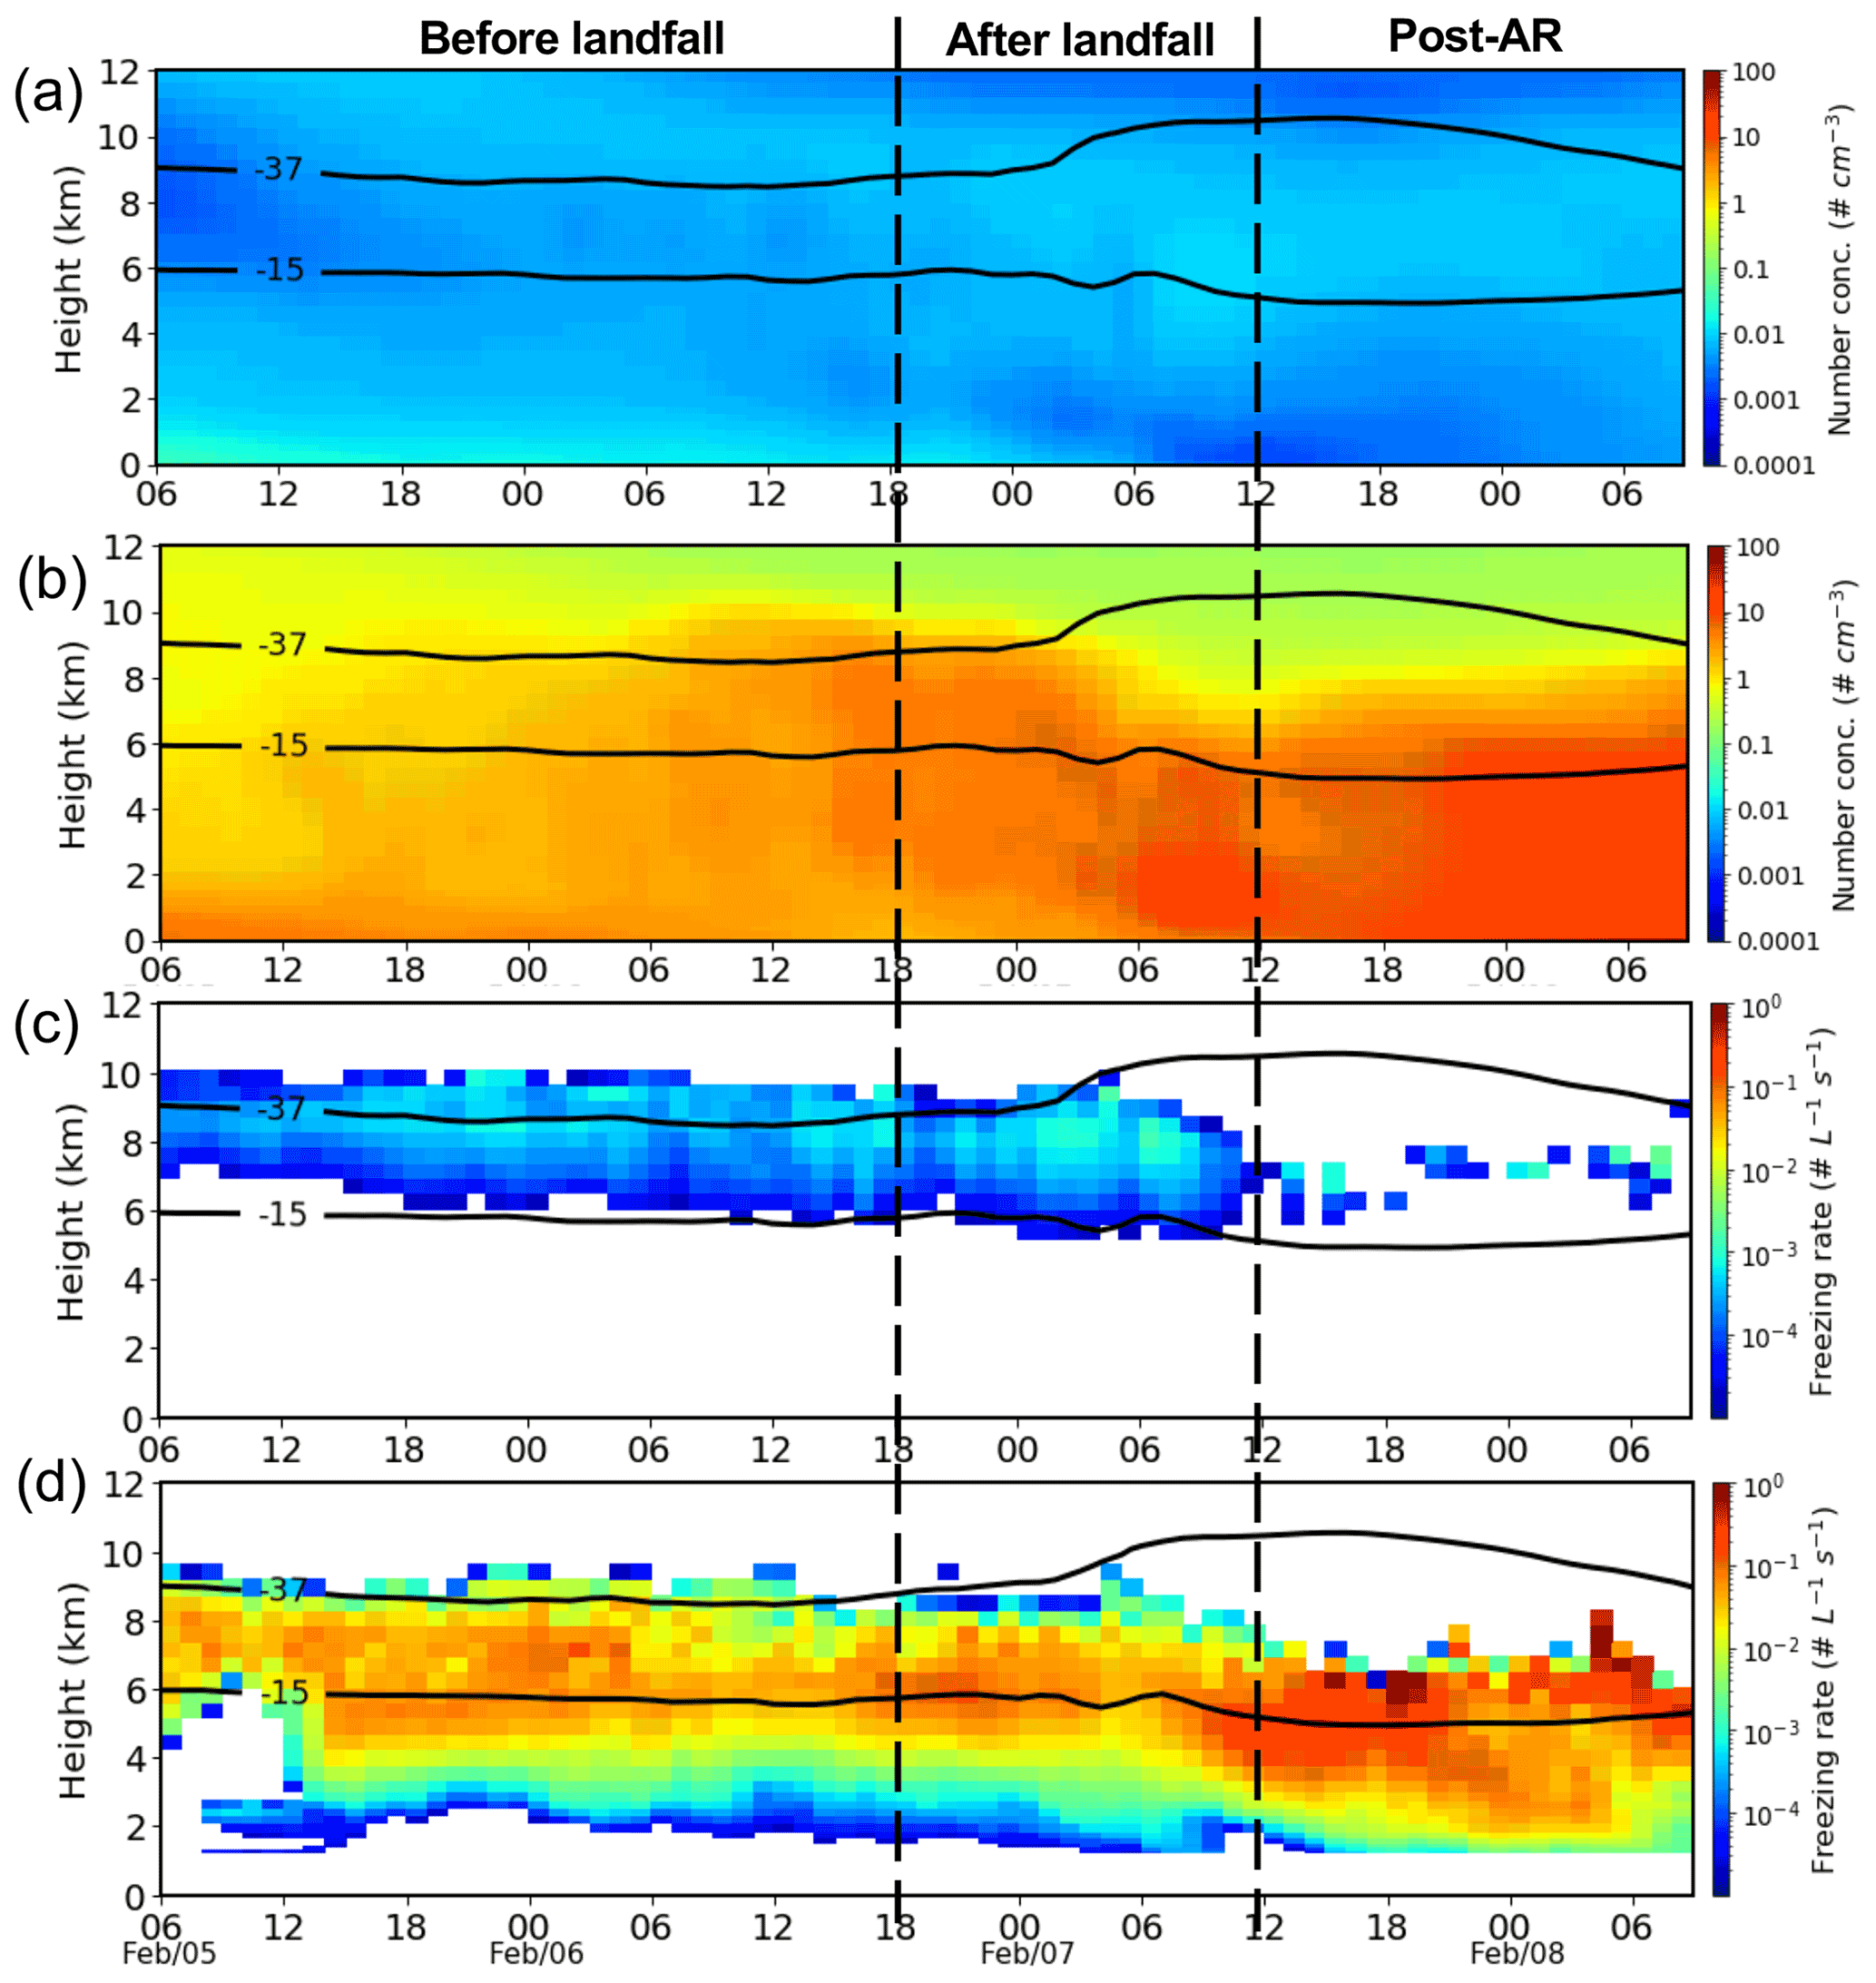
Figure 10Time–height cross sections of (a) dust particle (>0.5 µm) number concentration, (b) marine aerosol number concentration, (c) the freezing rate in DM15, and (d) the freezing rate in DM15+MC18. The number concentrations in (a) and (b) are derived from their corresponding mass mixing ratios under the clear-sky condition only. The freezing rates in (c) and (d) are the ice nucleation rates via immersion freezing at T>−37 ∘C and the drop homogeneous freezing rates at T<−37 ∘C, and the values are for cloudy-points only. The contour black lines in each panel mark the temperature levels of −15 and −37 ∘C, representing the efficient immersion freezing temperature in DM15+MC18 and the homogeneous freezing temperature in the model, respectively.
To further understand how and why cloud and precipitation responses to marine INPs are different at different AR stages, we separate clouds into three cloud regimes: a shallow warm cloud regime with cloud top temperature (CTT) warmer than 0 ∘C, a mixed-phase cloud regime with CTT between −30 and 0 ∘C, and a deep cloud regime having CTT colder than −30 ∘C and cloud base temperatures above 0 ∘C. Figure 11 shows that the marine INP effect consistently shifts the cloud occurrences from the shallow warm cloud regime to mixed-phase and/or deep cloud regimes among the three AR stages. It is noted that the deep cloud regime is enhanced much more at the first and third stages than the second stage, i.e., 22 % before AR landfall and 235 % at the post-AR stage but only 8 % after AR landfall. The post-AR stage also has the largest increase in mixed-phase cloud occurrences.
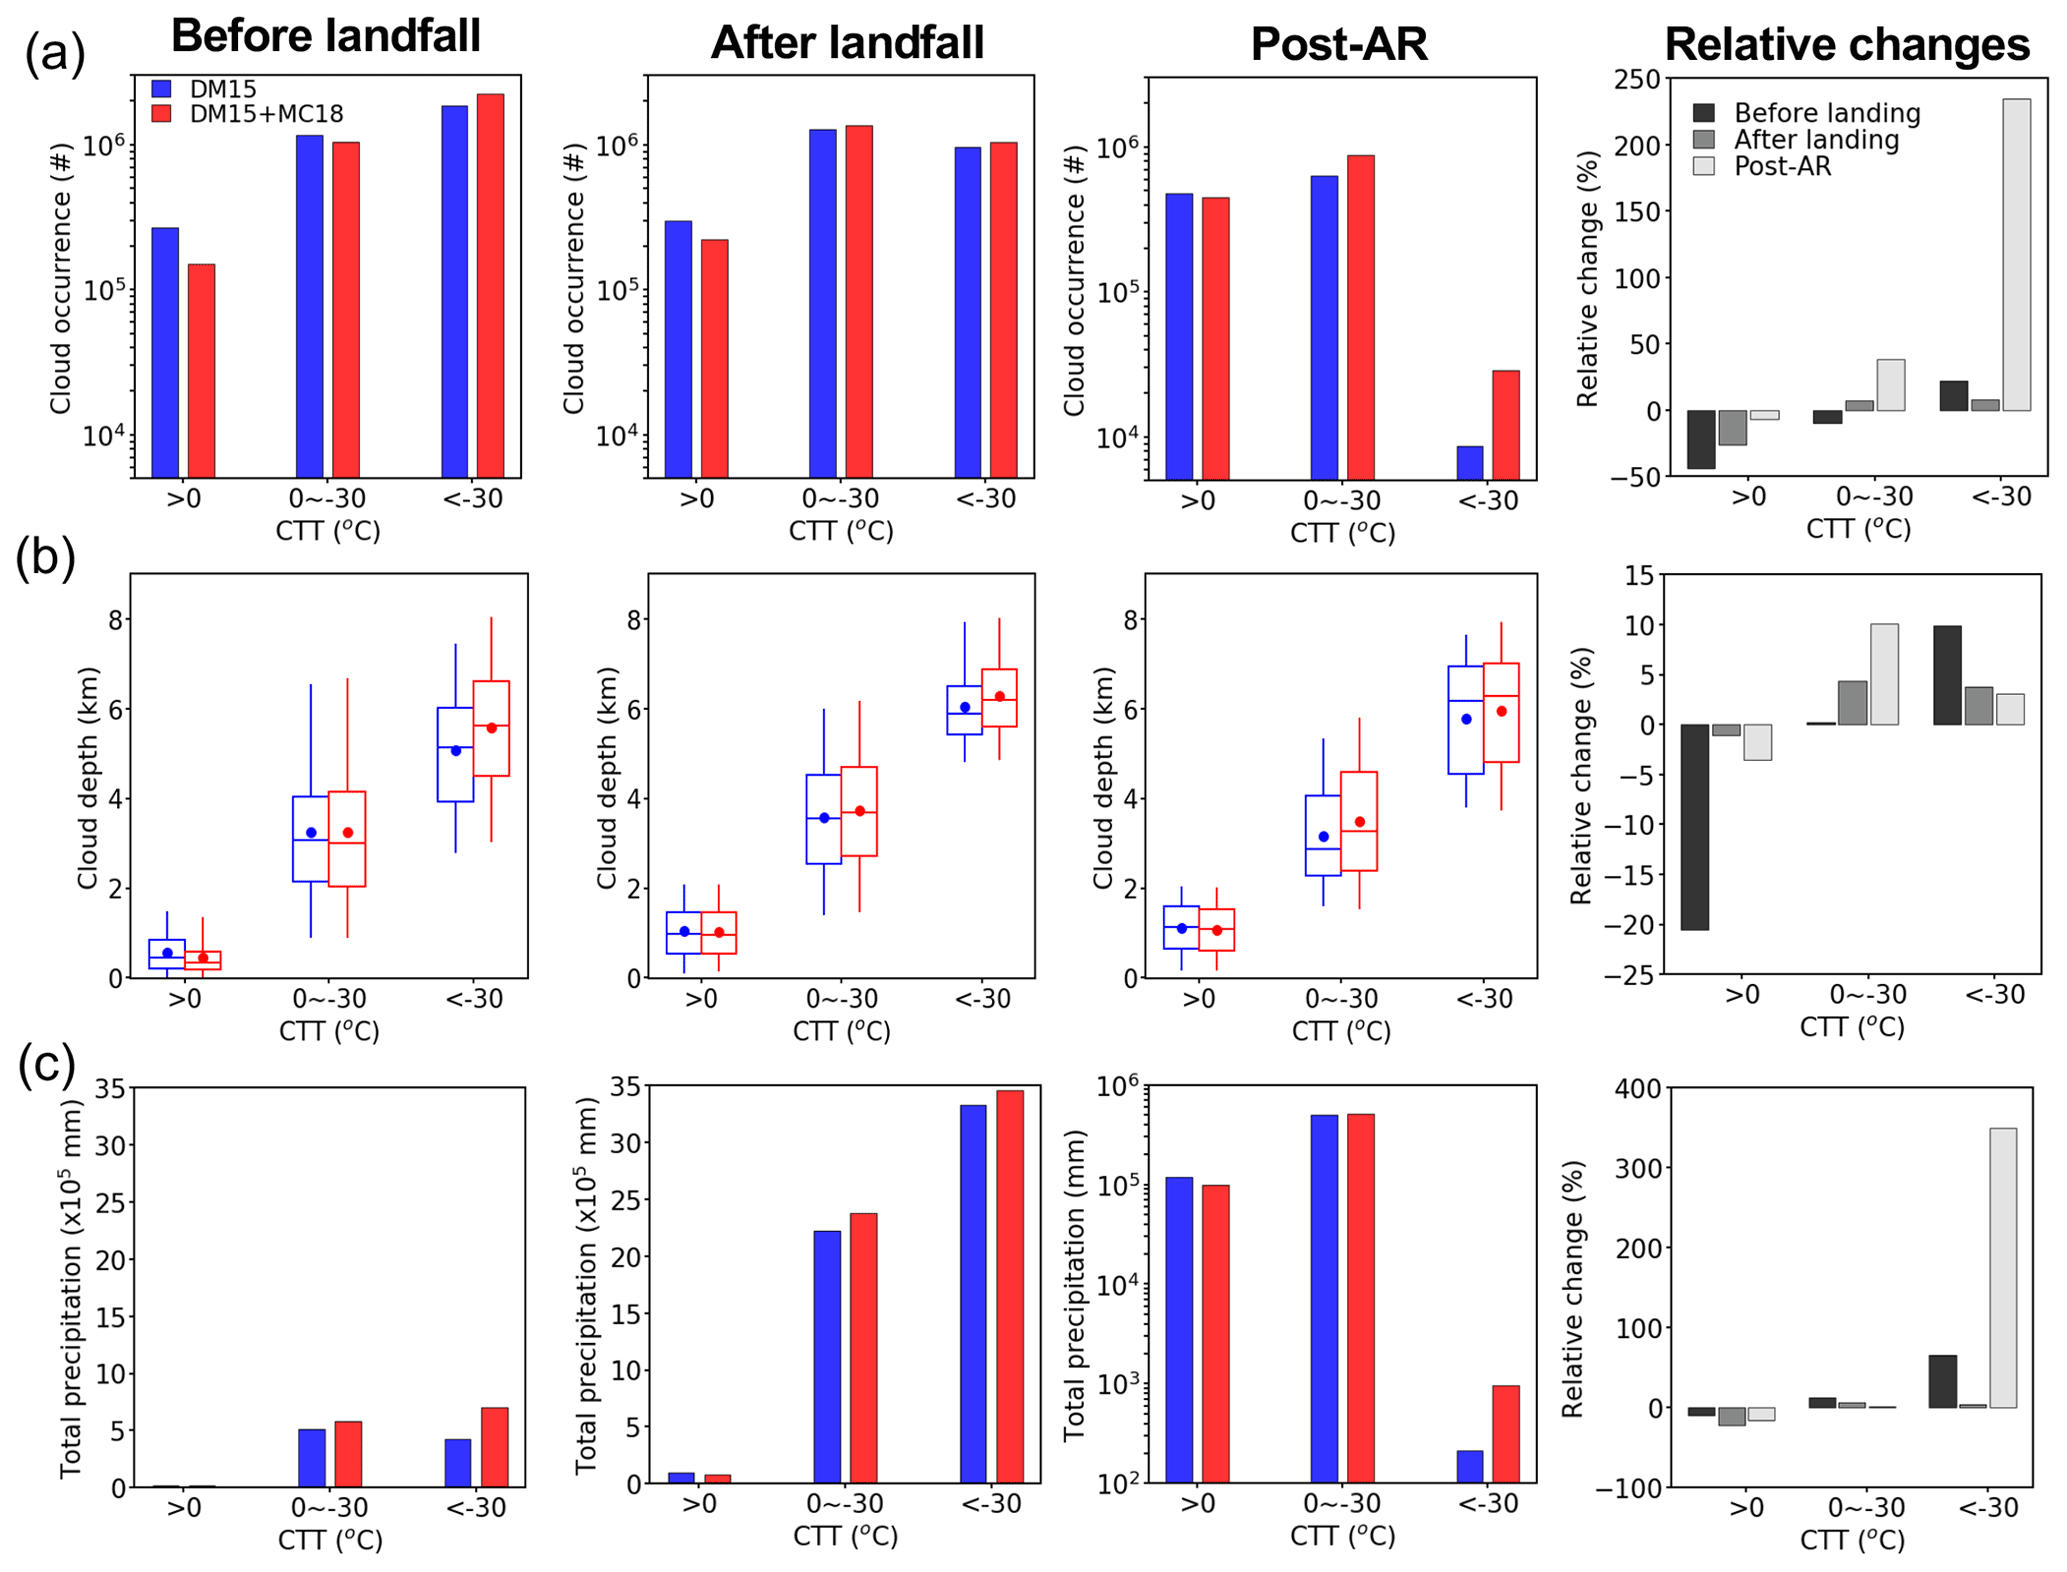
Figure 11(a) Cloud occurrences, (b) cloud depth, and (c) total precipitation for three cloud regimes in DM15 (blue) and DM15+MC18 (red) at three AR stages from left to right: before AR landfall, after AR landfall, post-AR. The last column shows the relative changes caused by the marine INP effect, which are calculated as [(DM15+MC18)–DM15] DM15 × 100 %. Note that the total precipitation at the post-AR stage uses a log scale for the y axis. The box–whisker plots follow the description in Fig. 5c.
Accordingly, the mean cloud depth for each cloud regime is changed by marine INPs, with a decrease for the shallow warm clouds and an increase for the mixed-phase and deep clouds (Fig. 11b). Before AR landfall, the increase in the deep cloud depth is largest while at the post-AR stage, the increase in the mixed-phase cloud depth is the largest. Consistent with a shift in cloud regimes, the total precipitation produced by shallow warm clouds is reduced by 9 %, 22 %, and 16 % while the total precipitation produced by deep clouds is increased by 66 %, 4 %, and 350 %, respectively, at the three AR stages (Fig. 11c). Therefore, the large increase in the surface-accumulated precipitation by marine INPs before AR landfall (36 %) is mainly because of the increase in deep cloud precipitation. The larger occurrence of deep clouds at this stage is consistent with a larger increase in TWP and reduction in moisture. Although the relative increases in deep cloud occurrences and precipitation by marine INPs are very large at the post-AR stage, their occurrences are so small that their contribution to the total precipitation is negligible. The effects of marine INPs on the postfrontal clouds might differ from the reality since based on very limited measurement data, the model seems not to be able to capture those clouds well. The overestimated supercooled LWC can allow for more riming growth which may lead to a larger sensitivity to marine INPs.
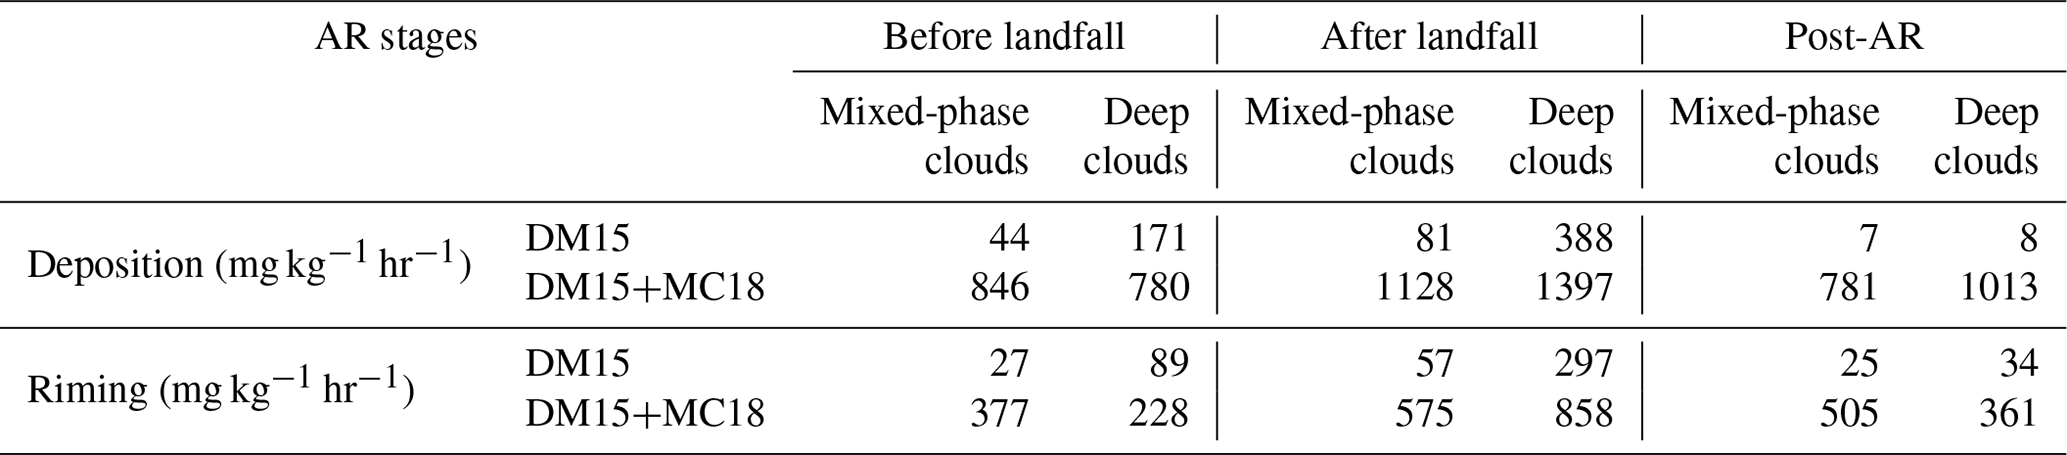
How do marine INPs reduce shallow warm clouds but increase mixed-phase and deep clouds and why is this effect larger at the first and third stages? Marine INPs greatly enhance ice and snow number concentrations and mass mixing ratios through immersion freezing, which converts drops to ice or snow particles (Figs. 12a and 13a). The mean number concentrations and mass mixing ratios of ice particles (ice + snow) in mixed-phase and deep cloud regimes are several orders of magnitude higher in DM15+MC18 than in DM15. As detailed by Fan et al. (2017b), who studied the same type of mixed-phase clouds in the same region, more ice and/or snow particles forming from the immersion freezing enhance the Wegener–Bergeron–Findeisen (WBF) and riming processes (Table 2), converting supercooled drops to ice or snow and leading to more ice and/or snow but fewer cloud droplets and raindrops (Figs. 12b, c and 13b, c). The reductions of cloud droplet and raindrop number concentrations and mass mixing ratios from DM15 to DM15+MC18 are larger before AR landfall and during post-AR relative to the stage after AR landfall, corresponding to a larger shift to the mixed-phase and deep clouds. Thus, the larger increases in deposition and/or WBF and riming rates are seen (Table 2).

Figure 12Hydrometeor number concentrations and their relative changes in three cloud regimes in DM15 (blue) and DM15+MC18 (red) at the three AR stages for (a) ice particles (sum of ice and snow), (b) cloud droplets, and (c) raindrops. The last column shows the relative changes caused by the marine INP effect, which are calculated as [(DM15+MC18)–DM15] DM15 × 100 %. Since ice particles are very limited at the post-AR stage in DM15, the percentage changes of ice particles from DM15 to DM15+MC18 are huge numbers that are omitted from the plots.
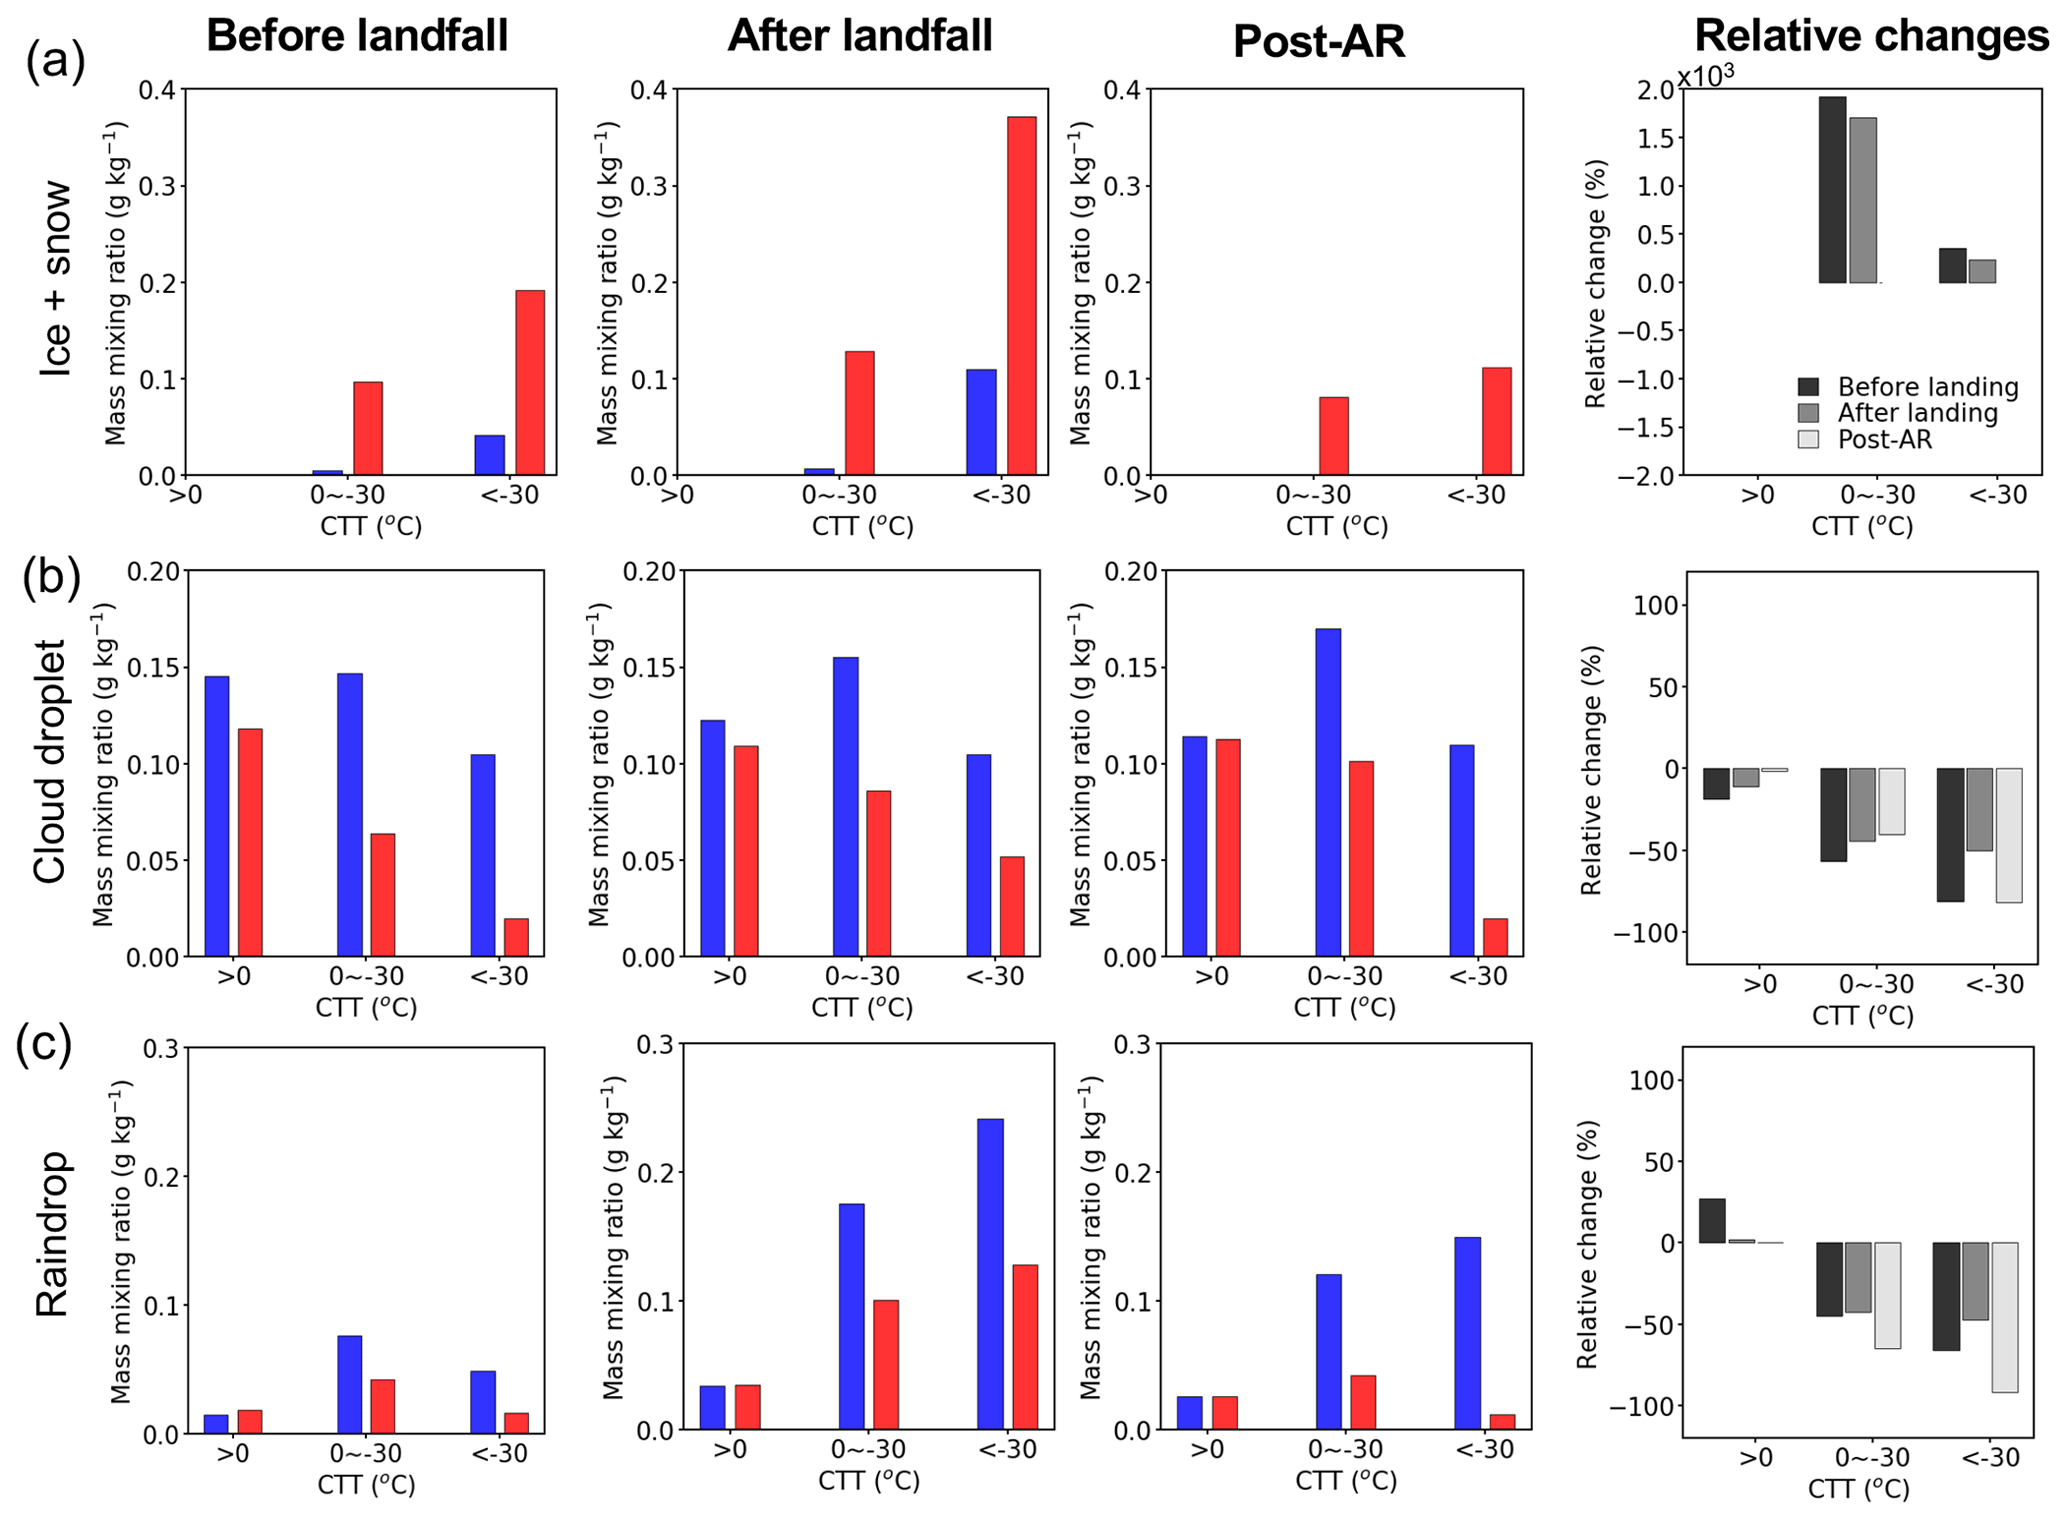
Figure 13Same as Fig. 12, except for the mass mixing ratios of (a) ice particles (sum of ice and snow), (b) cloud droplets, and (c) raindrops.
Table 2The domain-mean mass rates of deposition and riming in the mixed-phase and deep cloud regimes in DM15 and DM15+MC18 at the three AR stages.
As discussed earlier, the largest ice nucleation rates from marine aerosols at the post-AR stage explain the largest marine INP effects among the three stages. The factors contributing to the larger ice nucleation rates include the increased abundance of marine aerosols compared to the previous two stages (Fig. 10b). In addition, with the ∼6 ∘C colder temperatures below 8 km altitudes during the post-AR stage compared to the other two stages, ice nucleation from marine aerosols becomes more efficient (Fig. 10d). The increase in both LWC and IWC and a large increase in cloud fraction for postfrontal cloud cells by the marine INP effect might also be related to small-scale thermodynamic changes through the feedback of microphysical changes over the first two AR stages.
As for why increases of deep cloud occurrence and precipitation are less significant after AR landfall compared to before AR landfall, first, the moisture increase after AR landfall occurs in the lower atmosphere while the middle- and upper-level atmosphere is much drier than before AR landfall (Fig. 2d), which favors more warm clouds and rain but is less favorable to ice cloud development as indicated by the smallest ratio of snow precipitation (Fig. 7b). For more warm clouds and/ or rain-dominated situations, the enhancement of ice formation would have less influence. Furthermore, in the drier conditions aloft, more ice formation means less efficient growth, thus the impacts on IWC IWP and precipitation would be smaller. Cloud dynamics (vertical velocity) is not changed much by the marine INP effect at all three stages, indicating that the feedback from the increased latent heating resulting from enhanced deposition and riming does not play an important role here, likely because this is not a convective environment.
We explored the effects of INPs from sea spray aerosols transported from the Pacific Ocean on wintertime mixed-phase stratiform cloud properties and precipitation associated with atmospheric river (AR) events. This is done by carrying out simulations at a cloud-resolving scale (1 km) using WRF-Chem coupled with the spectral-bin microphysics (SBM) scheme for an AR event observed during the 2015 Atmospheric Radiation Measurement Cloud Aerosol Precipitation Experiment (ACAPEX). We implemented ice nucleation parameterization for sea spray aerosols (McCluskey et al. 2018a) into SBM to account for the marine INP effect. By comparing with ground-based observations, we show that considering the marine INP effect in the model improves the simulation of AR-precipitation. Based on the evaluation with limited data from aircraft measurements, it appears the marine INP effect improves the cloud phase states (i.e., increased glaciation ratio) in the post-AR but overestimates condensate mass.
Through enhancing ice and snow formation, marine INPs greatly enhance WBF and riming processes, which convert liquid clouds to mixed-phase and ice clouds. There is a notable shift in cloud occurrences with reduced shallow warm clouds (44 %, 26 %, and 7 % for before and after AR landfall and the post-AR stages, respectively) and increased mixed-phase (10 %, 7 %, and 38 %) and/or deep cloud regimes (∼22 %, 8 %, and 230 %) because of the marine INP effect. As a result, large increases in the ice water path (5 times or more), in the total condensate water path (29 % or more), and in the ratio of snow precipitation (40 times or more) are seen. There is an enhanced conversion of water from the vapor phase to the condensate phase and thus the water vapor is generally reduced with the marine INP effect considered.
The significance of the above-described marine INP effects varies with the AR stages, with a larger effect before AR landfall and post-AR than after AR landfall that has the dominant precipitation. Note that the marine INP effects on cloud properties and snow precipitation are still notable even at the stage after AR landfall. Although the total precipitation is not much changed, the drastic increase of snow precipitation and reduced rain precipitation at the surface have an important implication for the regional water resources and flood risks since more snow increases freshwater resources while less rain reduces flash flood risks. In addition, at this stage, the marine INPs produce a notable spillover effect with a precipitation decrease (up to 30 %) over the windward slope of the mountains but precipitation (snow) over the lee side is doubled, because more ice and/or snow that formed over the windward side falls slower than rain and is more easily transported to the lee side.
Several factors can be responsible for the smaller marine INP effects on cloud properties (particularly reduction of shallow warm clouds and increased mixed-phase and deep clouds) and snow precipitation after AR landfall compared with before AR landfall. First, after AR landfall, the moisture is heavily concentrated at the lower atmosphere while the middle- and upper-level atmosphere is much drier than before AR landfall. Therefore, the environment is more warm cloud and rain dominated, limiting the effects of enhanced ice formation. Furthermore, in drier conditions, more ice formation means less efficient growth, thus the impacts on IWC IWP and precipitation would be smaller.
The post-AR stage has the largest response of the cloud regime shift and snow precipitation among the three stages, because of the largest ice nucleation rates from the marine aerosols. The larger ice nucleation rates compared with the other two stages are probably because the abundance of marine aerosols is increased, and also with ∼6 ∘C colder temperatures below 8 km altitudes than the other two stages, ice nucleation from the deep marine aerosol layer is more efficient. Since our model may not simulate clouds well at the post-AR stage based on very limited measurement data, we emphasize that the large responses to marine INPs simulated at this stage might not reflect the effect in reality.
This study suggests that the inclusion of marine INPs enhances orographic precipitation mainly through more efficient growth (deposition and riming) of a larger number of ice particles than liquid droplets, which is consistent with literature studies (Mühlbauer and Lohmann, 2009; Fan et al., 2014, 2017b; Xiao et al., 2015). The spillover effect by the increase of CCN has been presented in several previous studies (e.g., Mühlbauer and Lohmann, 2008, 2009; Saleeby et al., 2011, 2013; Carrió and Cotton, 2014; Letcher and Cotton, 2014). To our knowledge, this study is the first to show the spillover effect associated with the INP effect. The prominent spillover effect by the marine INP is different from Fan et al. (2014, 2017b), who did not find such an effect by dust INPs. There are a couple of factors that might be responsible for the difference. First, marine INPs are mainly brought by ARs and thus the windward side gets INP first, while dust INPs are not associated with AR and therefore there is no temporal sequence to have dust between the windward and lee sides. Second, the AR event is different with a different wind direction and speed, which makes the transport of ice and/or snow to the lee side easier in this case.
The marine INP effect revealed in this study is clearly manifested due to the very low dust INP concentrations for this particular situation and the high abundance of marine aerosols during the AR, which enables notable ice nucleation even at temperatures higher than −15 ∘C. This higher abundance of marine aerosols overcomes the fundamental lower efficiency of marine INPs compared to dust INPs. With high dust INPs, the effects of marine INPs might not be as significant since they compete for supercooled liquid drops. Although this is a single case study, the AR event and its evolution are representative. Thus, the study suggests the importance of accounting for marine aerosols as INPs, in addition to long-range transported mineral dust, to simulate winter clouds and precipitation in the western United States in regional and global climate models. We employ an empirical parameterization for marine INPs developed from the data collected over the northern Atlantic Ocean and use sea salt aerosols as a surrogate of sea spray aerosols, which might produce some uncertainties. Nevertheless, the marine INP parameterization appears representative of this region, based on Levin et al. (2019). More observational data particularly on the extended spatial and temporal coverage are needed in the western United States for (a) evaluating model simulations more robustly, (b) developing ice nucleation parameterizations for potentially variable marine organics, and (c) understanding marine organics emission and chemical mechanisms and accurately simulating marine organics in the model. As discussed earlier, the conversion of mass to number concentrations over each aerosol bin might introduce some uncertainty to this study, which calls for model developments in predicting the number concentration of each aerosol component.
The observation data from the 2015 Atmospheric Radiation Measurement (ARM) Cloud Aerosol Precipitation Experiment (ACAPEX) campaign can be accessed via the ACAPEX data site: https://www.arm.gov/research/campaigns/amf2015apex (ARM, 2015). The model data can be accessed at: https://portal.nersc.gov/project/m2977/linetal2022 (Lin, 2022).
The supplement related to this article is available online at: https://doi.org/10.5194/acp-22-6749-2022-supplement.
JF designed the study and model experiments. YuL, JF, and PL performed numerical simulations and analyses. JF and YuL wrote the paper and other authors commented on it. LRL, PJD, LG, JC, JF, JT, YiL, and JHJ contributed by either processing data including model input and observational data or participating in the discussion of results.
The contact author has declared that neither they nor their co-authors have any competing interests.
Publisher’s note: Copernicus Publications remains neutral with regard to jurisdictional claims in published maps and institutional affiliations.
This research used resources of the PNNL Institutional Computing (PIC), and National Energy Research Scientific Computing Center (NERSC). NERSC is a U.S. DOE Office of Science User Facility operated under Contract No. DE-AC02-05CH11231. Funding for ACAPEX that provides data collected on the G-1 aircraft was supported by the Atmospheric Radiation Measurement (ARM) user facility, a U.S. Department of Energy (DOE) Office of Science user facility managed by the Office of Biological and Environmental Research. The deployment of the G-1 also involved the assistance of many PNNL/ARM field staff including Mike Hubbell and Clayton Eveland who flew the G-1 during ACAPEX. The authors acknowledge the California Air Resources Board for providing the 2015 emission inventory data and Allen White from NOAA's Physical Sciences Laboratory for providing rainfall gauge data, and thank Alyssa Matthews and Jingyu Wang at PNNL and Yuan Wang at JPL for technical/data discussion.
This study was supported by the Office of Science of U.S. Department of Energy Biological and Environmental Research through the Regional and Global Model Analysis program area that supports the Water Cycle and Climate Extremes Modeling (WACCEM) Science Focus Area at PNNL (grant no. 63041) and the DOE Early Career Research Program (grant no. 70071). PNNL is operated for the U.S. Department of Energy (DOE) by Battelle Memorial Institute under contract DE-AC05-76RL01830.
This paper was edited by Xiaohong Liu and reviewed by two anonymous referees.
ARM: The Atmospheric Radiation Measurement (ARM) user facility: ARMCloud Aerosol Precipitation Experiment (ACAPEX) [data set], https://www.arm.gov/research/campaigns/amf2015apex (last access: 10 January 2022), 2015.
Ault, A. P., Williams, C. R., White, A. B., Neiman, P. J., Creamean, J. M., Gaston, C. J., Ralph, F. M., and Prather, K. A.: Detection of Asian dust in California orographic precipitation, J. Geophys. Res.-Atmos., 116, 1–15, https://doi.org/10.1029/2010JD015351, 2011.
Baumgardner, D., Brenguier, J. L., Bucholtz, A., Coe, H., DeMott, P., Garrett, T. J., Gayet, J. F., Hermann, M., Heymsfield, A., Korolev, A., Kramer, M., Petzold, A., Strapp, W., Pilewskie, P., Taylor, J., Twohy, C., Wendisch, M., Bachalo, W., and Chuang, P.: Airborne instruments to measure atmospheric aerosol particles, clouds and radiation: A cook's tour of mature and emerging technology, Atmos. Res., 102, 10–29, https://doi.org/10.1016/j.atmosres.2011.06.021, 2011.
Bigg, E. K.: The Formation of Atmospheric Ice Crystals by the Freezing of Droplets, Q. J. Roy. Meteorol. Soc., 79, 510–519, https://doi.org/10.1002/qj.49707934207, 1953.
Burrows, S. M., Hoose, C., Pöschl, U., and Lawrence, M. G.: Ice nuclei in marine air: biogenic particles or dust?, Atmos. Chem. Phys., 13, 245–267, https://doi.org/10.5194/acp-13-245-2013, 2013.
Burrows, S. M., Easter, R. C., Liu, X., Ma, P.-L., Wang, H., Elliott, S. M., Singh, B., Zhang, K., and Rasch, P. J.: OCEANFILMS (Organic Compounds from Ecosystems to Aerosols: Natural Films and Interfaces via Langmuir Molecular Surfactants) sea spray organic aerosol emissions – implementation in a global climate model and impacts on clouds, Atmos. Chem. Phys., 22, 5223–5251, https://doi.org/10.5194/acp-22-5223-2022, 2022.
CARB (California Air Resources Board): the 2015 emission data for California State, https://ww2.arb.ca.gov/applications (last access: 10 January 2022), 2020.
Carrió, G. G. and Cotton, W. R.: On the buffering of CCN impacts on wintertime orographic clouds: an idealized examination, Atmos. Res., 137, 136–144, 2014.
Chen, F. and Dudhia, J.: Coupling an Advanced Land Surface–Hydrology Model with the Penn State–NCAR MM5 Modeling System. Part I: Model Implementation and Sensitivity, Mon. Weather Rev., 129, 569–585, https://doi.org/https://doi.org/10.1175/1520-0493(2001)129<0569:Caalsh>2.0.Co;2, 2001.
Choudhury, G., Tyagi, B., Singh, J., Sarangi, C., and Tripathi, S. N.: Aerosol-orography-precipitation – a critical assessment, Atmos. Environ., 214, 1–19, https://doi.org/10.1016/j.atmosenv.2019.116831.
Choularton, T. W. and Perry, S. J.: A model of the orographic enhancement of snowfall by the seeder-feeder mechanism, Q. J. Roy. Meteorol. Soc., 112, 335–345, https://doi.org/https://doi.org/10.1002/qj.49711247204, 1986.
Cordeira, J. M., Ralph, F. M., Martin, A., Gaggini, N., Spackman, J. R., Neiman, P. J., Rutz, J. J., and Pierce, R.: Forecasting atmospheric rivers during CalWater 2015, B. Am. Meteorol. Soc., 98, 449–459, https://doi.org/10.1175/BAMS-D-15-00245.1, 2017.
Creamean, J. M., Suski, K. J., Rosenfeld, D., Cazorla, A., DeMott, P. J., Sullivan, R. C., White, A. B., Ralph, F. M., Minnis, P., Comstock, J. M., Tomlinson, J. M., and Prather, K. A.: Dust and Biological Aerosols from the Sahara and Asia Influence Precipitation in the Western U.S, Science, 339, 1572–1578, https://doi.org/10.1126/science.1227279, 2013.
Creamean, J. M., Ault, A. P., White, A. B., Neiman, P. J., Ralph, F. M., Minnis, P., and Prather, K. A.: Impact of interannual variations in sources of insoluble aerosol species on orographic precipitation over California's central Sierra Nevada, Atmos. Chem. Phys., 15, 6535–6548, https://doi.org/10.5194/acp-15-6535-2015, 2015.
DeMott, P. J., Prenni, A. J., McMeeking, G. R., Sullivan, R. C., Petters, M. D., Tobo, Y., Niemand, M., Möhler, O., Snider, J. R., Wang, Z., and Kreidenweis, S. M.: Integrating laboratory and field data to quantify the immersion freezing ice nucleation activity of mineral dust particles, Atmos. Chem. Phys., 15, 393–409, https://doi.org/10.5194/acp-15-393-2015, 2015.
DeMott, P. J., Hill, T. C. J., McCluskey, C. S., Prather, K. A., Collins, D. B., Sullivan, R. C., Ruppel, M. J., Mason, R. H., Irish, V. E., Lee, T., Hwang, C. Y., Rhee, T. S., Snider, J. R., McMeeking, G. R., Dhaniyala, S., Lewis, E. R., Wentzell, J. J. B., Abbatt, J., Lee, C., Sultana, C. M., Ault, A. P., Axson, J. L., Martinez, M. D., Venero, I., Santos-Figueroa, G., Stokes, M. D., Deane, G. B., Mayol-Bracero, O. L., Grassian, V. H., Bertram, T. H., Bertram, A. K., Moffett, B. F., and Franc, G. D.: Sea spray aerosol as a unique source of ice nucleating particles, P. Natl. Acad. Sci. USA., 113, 5797–5803, https://doi.org/10.1073/pnas.1514034112, 2016.
Dettinger, M. D., Ralph, F. M., Das, T., Neiman, P. J., and Cayan, D. R.: Atmospheric Rivers, Floods and the Water Resources of California, Water-Sup., 3, 445–478, https://doi.org/10.3390/w3020445, 2011.
EPA (US Environmental Protection Agency): the 2011 National Emissions Inventory (NEI), https://www.epa.gov/air-emissions-inventories/2011-national-emissions-inventory-nei-data (last access: 10 January 2022), 2014.
Fan, J., Leung, L. R., Li, Z., Morrison, H., Chen, H., Zhou, Y., Qian, Y., and Wang, Y.: Aerosol impacts on clouds and precipitation in eastern China: Results from bin and bulk microphysics, J. Geophys. Res., 117, D00K36, https://doi.org/https://doi.org/10.1029/2011jd016537, 2012.
Fan, J., Leung, L. R., DeMott, P. J., Comstock, J. M., Singh, B., Rosenfeld, D., Tomlinson, J. M., White, A., Prather, K. A., Minnis, P., Ayers, J. K., and Min, Q.: Aerosol impacts on California winter clouds and precipitation during CalWater 2011: local pollution versus long-range transported dust, Atmos. Chem. Phys., 14, 81–101, https://doi.org/10.5194/acp-14-81-2014, 2014.
Fan, J., Han, B., Varble, A., Morrison, H., North, K., Kollias, P., Chen, B., Dong, X., Giangrande, S. E., Khain, A., Lin, Y., Mansell, E., Milbrandt, J. A., Stenz, R., Thompson, G., and Wang, Y.: Cloud-resolving model intercomparison of an MC3E squall line case: Part I – Convective updrafts, J. Geophys. Res.-Atmos., 122, 9351–9378, https://doi.org/10.1002/2017JD026622, 2017a.
Fan, J., Leung, L. R., Rosenfeld, D., and DeMott, P. J.: Effects of cloud condensation nuclei and ice nucleating particles on precipitation processes and supercooled liquid in mixed-phase orographic clouds, Atmos. Chem. Phys., 17, 1017–1035, https://doi.org/10.5194/acp-17-1017-2017, 2017b.
Fan, J., Zhang, Y., Li, Z., Hu, J., and Rosenfeld, D.: Urbanization-induced land and aerosol impacts on sea-breeze circulation and convective precipitation, Atmos. Chem. Phys., 20, 14163–14182, https://doi.org/10.5194/acp-20-14163-2020, 2020.
Fast, J. D., Gustafson Jr., W. I., Easter, R. C., Zaveri, R. A., Barnard, J. C., Chapman, E. G., Grell, G. A., and Peckham, S. E.: Evolution of ozone, particulates, and aerosol direct radiative forcing in the vicinity of Houston using a fully coupled meteorology-chemistry-aerosol model, J. Geophys. Res.-Atmos., 111, D21305, https://doi.org/https://doi.org/10.1029/2005jd006721, 2006.
Gao, W., Fan, J., Easter, R. C., Yang, Q., Zhao, C., and Ghan, S. J.: Coupling spectral-bin cloud microphysics with the MOSAIC aerosol model in WRF-Chem: Methodology and results for marine stratocumulus clouds, J. Adv. Model. Earth Syst., 8, 1289–1309, https://doi.org/10.1002/2016MS000676, 2016.
Glienke, S. and Mei, F.: Two-Dimensional Stereo (2D-S) Probe Instrument Handbook, Technical Report, DOE/SC-ARM-TR-233, https://doi.org/10.2172/1597436, 2019.
Glienke, S. and Mei, F.: Fast Cloud Droplet Probe (FCDP) Instrument Handbook, Technical Report, DOE/SC-ARM-TR-238. https://doi.org/10.2172/1597469, 2020.
Goldberger, L. A.: Passive Cavity Aerosol Spectrometer Probe Aboard Aircraft (PCASP-AIR) with Signal Processing Package 200 Instrument Handbook, Technical Report, DOE/SC-ARM-TR-241, 2020.
Gong, S. L., Barrie, L. A., and Blanchet, J. P.: Modeling sea-salt aerosols in the atmosphere 1. Model development, J. Geophys. Res.-Atmos., 102, 3805–3818, https://doi.org/10.1029/96jd02953, 1997a.
Gong, S. L., Barrie, L. A., Prospero, J. M., Savoie, D. L., Ayers, G. P., Blanchet, J. P., and Spacek, L.: Modeling sea-salt aerosols in the atmosphere 2. Atmospheric concentrations and fluxes, J. Geophys. Res.-Atmos., 102, 3819–3830, https://doi.org/10.1029/96jd03401, 1997b.
Gourley, J., B. Kaney, and Maddox, R.: Evaluating the calibrations of radars: A software approach, Preprints, 31st Int. Conf. on Radar Meteorology, Seattle, WA, 3 August 2003, Amer. Meteor. Soc., 459–462, 2003.
Gourley, J. J., Illingworth, A. J., and Tabary, P: Absolute Calibration of Radar Reflectivity Using Redundancy of the Polarization Observations and Implied Constraints on Drop Shapes, J. Atmos. Ocean Technol., 26, 689–703, 2009
Guenther, A. B., Jiang, X., Heald, C. L., Sakulyanontvittaya, T., Duhl, T., Emmons, L. K., and Wang, X.: The Model of Emissions of Gases and Aerosols from Nature version 2.1 (MEGAN2.1): an extended and updated framework for modeling biogenic emissions, Geosci. Model Dev., 5, 1471–1492, https://doi.org/10.5194/gmd-5-1471-2012, 2012.
Hazra, A., Padmakumari, B., Maheskumar, R. S., and Chen, J. P.: The effect of mineral dust and soot aerosols on ice microphysics near the foothills of the Himalayas: A numerical investigation, Atmos. Res., 171, 41–55, https://doi.org/10.1016/j.atmosres.2015.12.005, 2016.
Helmus, J. J. and Collis, S. M.: The Python ARM Radar Toolkit (Py-ART), a library for working with weather radar data in the Python programming language, J. Open Res. Software, 4, e25, https://doi.org/10.5334/jors.119, 2016
Hoose, C., Kristjánsson, J. E., and Burrows, S. M.: How important is biological ice nucleation in clouds on a global scale?, Environ. Res. Lett., 5, 24009, https://doi.org/10.1088/1748-9326/5/2/024009, 2010.
Iacono, M. J., Delamere, J. S., Mlawer, E. J., Shephard, M. W., Clough, S. A., and Collins, W. D.: Radiative forcing by long-lived greenhouse gases: Calculations with the AER radiative transfer models, J. Geophys. Res.-Atmos., 113, D13103, https://doi.org/10.1029/2008jd009944, 2008.
Janjić, Z. I.: Nonsingular Implementation of the Mellor-Yamada Level 2.5 Scheme in the NCEP Meso Model, National Centers for Environmental Prediction (NCEP, U.S.) office note, No. 437, https://repository.library.noaa.gov/view/noaa/11409 (last access:10 Jnauary 2022), 2001.
Kanji, Z. A., Ladino, L. A., Wex, H., Boose, Y., Burkert-Kohn, M., Cziczo, D. J., and Krämer, M.: Overview of Ice Nucleating Particles, Meteorol. Monogr., 58, 1.1–1.33, https://doi.org/10.1175/amsmonographs-d-16-0006.1, 2017.
Khain, A., Lynn, B., and Dudhia, J.: Aerosol Effects on Intensity of Landfalling Hurricanes as Seen from Simulations with the WRF Model with Spectral Bin Microphysics, J. Atmos. Sci., 67, 365–384, https://doi.org/10.1175/2009JAS3210.1, 2010.
Khain, A. P., Leung, L. R., Lynn, B., and Ghan, S.: Effects of aerosols on the dynamics and microphysics of squall lines simulated by spectral bin and bulk parameterization schemes, J. Geophys. Res.-Atmos., 114, D22203, https://doi.org/10.1029/2009jd011902, 2009.
Korolev, A. V., Isaac, G. A., Cober, S. G., Strapp, J. W., and Hallett, J.: Microphysical characterization of mixed-phase clouds, Q. J. Roy. Meteorol. Soc., 129, 39–65, https://doi.org/10.1256/qj.01.204, 2003.
Letcher, T. and Cotton, W. R.: The effect of pollution aerosol on wintertime orographic precipitation in the Colorado Rockies using a simplified emissions scheme to predict CCN concentrations, J. Appl. Meteorol. Climatol., 53, 859–872, 2014.
Leung, L. R.: ARM Cloud-Aerosol-Precipitation Experiment (ACAPEX) field campaign report, the U.S. Department of Energy (DOE)’s Atmospheric Radiation Measurement (ARM) Climate Research Facility, DOE/SC-ARM-16-012, https://www.osti.gov/servlets/purl/1251152 (last access:18 May 2022), 2016.
Levin, E. J. T., DeMott, P. J., Suski, K. J., Boose, Y., Hill, T. C. J., McCluskey, C. S., Schill, G. P., Rocci, K., Al-Mashat, H., Kristensen, L. J., Cornwell, G., Prather, K., Tomlinson, J., Mei, F., Hubbe, J., Pekour, M., Sullivan, R., Leung, L. R., and Kreidenweis, S. M.: Characteristics of Ice Nucleating Particles in and Around California Winter Storms, J. Geophys. Res.-Atmos., 124, 11530–11551, https://doi.org/10.1029/2019JD030831, 2019.
Lin, Y., Fan, J., Jeong, J.-H., Zhang, Y., Homeyer, C. R., and Wang, J.: Urbanization-Induced Land and Aerosol Impacts on Storm Propagation and Hail Characteristics, J. Atmos. Sci., 78, 925–947, https://doi.org/10.1175/jas-d-20-0106.1, 2020.
Lin, Y.: The model simulation data for CalWater/ACAPEX project, National Energy Research Scientific Computing Center (NERSC) [data set], https://portal.nersc.gov/project/m2977/linetal2022, last access: 16 May 2022.
Martin, A. C., Cornwell, G., Beall, C. M., Cannon, F., Reilly, S., Schaap, B., Lucero, D., Creamean, J., Ralph, F. M., Mix, H. T., and Prather, K.: Contrasting local and long-range-transported warm ice-nucleating particles during an atmospheric river in coastal California, USA, Atmos. Chem. Phys., 19, 4193–4210, https://doi.org/10.5194/acp-19-4193-2019, 2019.
Matthews, A., Mei, F., and Comstock, J.: Water content monitor (WCM-2000), ARM Airborne Facility (AAF). Atmospheric Radiation Measurement (ARM) Climate Research Facility Data Archive, https://iop.archive.arm.gov/arm-iop/2015/acx/acapexaaf/matthews-wcm/?ticket=ST-59370-S2pYNFm3ObQIl7-S-dbLgh8jfBMsso (last access: 10 January 2022), 2015.
McCluskey, C. S., Ovadnevaite, J., Rinaldi, M., Atkinson, J., Belosi, F., Ceburnis, D., Marullo, S., Hill, T. C. J., Lohmann, U., Kanji, Z. A., O'Dowd, C., Kreidenweis, S. M., and DeMott, P. J.: Marine and Terrestrial Organic Ice-Nucleating Particles in Pristine Marine to Continentally Influenced Northeast Atlantic Air Masses, J. Geophys. Res.-Atmos., 123, 6196–6212, https://doi.org/10.1029/2017JD028033, 2018a.
McCluskey, C. S., Hill, T. C. J., Humphries, R. S., Rauker, A. M., Moreau, S., Strutton, P. G., Chambers, S. D., Williams, A. G., McRobert, I., Ward, J., Keywood, M. D., Harnwell, J., Ponsonby, W., Loh, Z. M., Krummel, P. B., Protat, A., Kreidenweis, S. M., and DeMott, P. J.: Observations of Ice Nucleating Particles Over Southern Ocean Waters, Geophys. Res. Lett., 45, 11989–11997, https://doi.org/10.1029/2018GL079981, 2018b.
Mellor, G. L. and Yamada, T.: Development of a turbulence closure model for geophysical fluid problems, Rev. Geophys., 20, 851–875, https://doi.org/10.1029/RG020i004p00851, 1982.
Meyers, M. P., DeMott, P. J., and Cotton, W. R.: New Primary Ice-Nucleation Parameterizations in an Explicit Cloud Model, J. Appl. Meteorol., 31, 708–721, https://doi.org/10.1175/1520-0450(1992)031<0708:NPINPI>2.0.CO;2, 1992.
Muhlbauer, A. and Lohmann, U.: Sensitivity studies of the role of aerosols in warm- phase orographic precipitation in different dynamical flow regimes, J. Atmos. Sci., 65, 2522–2542, 2008.
Muhlbauer, A. and Lohmann, U.: Sensitivity studies of aerosol-cloud interactions in mixed-phase orographic precipitation, J. Atmos. Sci., 66, 2517–2538, https://doi.org/10.1175/2009JAS3001.1, 2009.
Murray, B. J., O'Sullivan, D., Atkinson, J. D., and Webb, M. E.: Ice nucleation by particles immersed in supercooled cloud droplets, Chem. Soc. Rev., 41, 6519–6554, https://doi.org/10.1039/c2cs35200a, 2012.
Niemand, M., Möhler, O., Vogel, B., Vogel, H., Hoose, C., Connolly, P., Klein, H., Bingemer, H., DeMott, P., Skrotzki, J., and Leisner, T.: A Particle-Surface-Area-Based Parameterization of Immersion Freezing on Desert Dust Particles, J. Atmos. Sci., 69, 3077–3092, https://doi.org/10.1175/jas-d-11-0249.1, 2012.
Prather, K. A., Bertram, T. H., Grassian, V. H., Deane, G. B., Stokes, M. D., DeMott, P. J., Aluwihare, L. I., Palenik, B. P., Azam, F., Seinfeld, J. H., Moffet, R. C., Molina, M. J., Cappa, C. D., Geiger, F. M., Roberts, G. C., Russell, L. M., Ault, A. P., Baltrusaitis, J., Collins, D. B., Corrigan, C. E., Cuadra-Rodriguez, L. A., Ebben, C. J., Forestieri, S. D., Guasco, T. L., Hersey, S. P., Kim, M. J., Lambert, W. F., Modini, R. L., Mui, W., Pedler, B. E., Ruppel, M. J., Ryder, O. S., Schoepp, N. G., Sullivan, R. C., and Zhao, D.: Bringing the ocean into the laboratory to probe the chemical complexity of sea spray aerosol, P. Natl. Acad. Sci. USA, 110, 7550–7555, https://doi.org/10.1073/pnas.1300262110, 2013.
Ralph, F. M., Prather, K. A., Cayan, D., Spackman, J. R., DeMott, P., Dettinger, M., Fairall, C., Leung, R., Rosenfeld, D., Rutledge, S., Waliser, D., White, A. B., Cordeira, J., Martin, A., Helly, J., and Intrieri, J.: CalWater Field Studies Designed to Quantify the Roles of Atmospheric Rivers and Aerosols in Modulating U.S. West Coast Precipitation in a Changing Climate, B. Am. Meteorol. Soc., 97, 1209–1228, https://doi.org/10.1175/bams-d-14-00043.1, 2016.
Rosenfeld, D., Chemke, R., Demott, P., Sullivan, R. C., Rasmussen, R., McDonough, F., Comstock, J., Schmid, B., Tomlinson, J., Jonsson, H., Suski, K., Cazorla, A., and Prather, K.: The common occurrence of highly supercooled drizzle and rain near the coastal regions of the western United States, J. Geophys. Res.-Atmos., 118, 9819–9833, https://doi.org/10.1002/jgrd.50529, 2013.
Saleeby, S. M., Cotton, W. R., and Fuller, J. D.: The cumulative impact of cloud droplet nucleating aerosols on orographic snowfall in Colorado, J. Appl. Meteorol. Climatol., 50, 604–625, 2011.
Saleeby, S. M., Cotton, W. R., Lowenthal, D., and Messina, J.: Aerosol impacts on the microphysical growth processes of orographic snowfall, J. Appl. Meteorol. Climatol., 52, 834–852, 2013.
Schmid, B., Tomlinson, J. M., Hubbe, J. M., Comstock, J. M., Mei, F., Chand, D., Pekour, M. S., Kluzek, C. D., Andrews, E., Biraud, S. C., and McFarquhar, G. M.: The DOE arm aerial facility, B. Am. Meteorol. Soc., 95, 723–742, https://doi.org/10.1175/BAMS-D-13-00040.1, 2014.
Shaw, W. J., Jerry Allwine, K., Fritz, B. G., Rutz, F. C., Rishel, J. P., and Chapman, E. G.: An evaluation of the wind erosion module in DUSTRAN, Atmos. Environ., 42, 1907–1921, https://doi.org/10.1016/j.atmosenv.2007.11.022, 2008.
Shi, Y., Liu, X., Wu, M., Zhao, X., Ke, Z., and Brown, H.: Relative importance of high-latitude local and long-range-transported dust for Arctic ice-nucleating particles and impacts on Arctic mixed-phase clouds, Atmos. Chem. Phys., 22, 2909–2935, https://doi.org/10.5194/acp-22-2909-2022, 2022.
Simmel, M. and Wurzler, S.: Condensation and activation in sectional cloud microphysical models, Atmos. Res., 80, 218–236, https://doi.org/10.1016/j.atmosres.2005.08.002, 2006.
Thompson, D. R., McCubbin, I., Gao, B. C., Green, R. O., Matthews, A. A., Mei, F., Meyer, K. G., Platnick, S., Schmid, B., Tomlinson, J., and Wilcox, E.: Measuring cloud thermodynamic phase with shortwave infrared imaging spectroscopy, J. Geophys. Res.-Atmos., 121, 9174–9190, https://doi.org/10.1002/2016JD024999, 2016.
Uin, J.: Ultra-High-Sensitivity Aerosol Spectrometer (UHSAS) Instrument Handbook, Technical Report, DOE/SC-ARM-TR-163, https://doi.org/10.2172/1251410, 2016.
Uno, I., Eguchi, K., Yumimoto, K., Takemura, T., Shimizu, A., Uematsu, M., Liu, Z., Wang, Z., Hara, Y., and Sugimoto, N.: Asian dust transported one full circuit around the globe, Nat. Geosci., 2, 557–560, https://doi.org/10.1038/ngeo583, 2009.
Vergara-Temprado, J., Murray, B. J., Wilson, T. W., O'Sullivan, D., Browse, J., Pringle, K. J., Ardon-Dryer, K., Bertram, A. K., Burrows, S. M., Ceburnis, D., DeMott, P. J., Mason, R. H., O'Dowd, C. D., Rinaldi, M., and Carslaw, K. S.: Contribution of feldspar and marine organic aerosols to global ice nucleating particle concentrations, Atmos. Chem. Phys., 17, 3637–3658, https://doi.org/10.5194/acp-17-3637-2017, 2017.
Xiao, H., Yin, Y., Jin, L., Chen, Q., and Chen, J.: Simulation of the effects of aerosol on mixed-phase orographic clouds using the WRF model with a detailed bin microphysics scheme, Atmos. Sci. Lett., 120, 8345–8358, https://doi.org/10.1002/2014JD022988, 2015.
Xue, L. L., Fan, J. W., Lebo, Z. J., Wu, W., Morrison, H., Grabowski, W. W., Chu, X., Geresdi, I., North, K., Stenz, R., Gao, Y., Lou, X. F., Bansemer, A., Heymsfield, A. J., Mcfarquhar, G. M., and Rasmussen, R. M.: Idealized Simulations of a Squall Line from the MC3E Field Campaign Applying Three Bin Microphysics Schemes: Dynamic and Thermodynamic Structure, Mon. Weather Rev., 145, 4789–4812, https://doi.org/10.1175/Mwr-D-16-0385.1, 2017.
Yang, Y., Sun, J., Zhu, Y., and Zhang, T.: Examination of the impacts of ice nuclei aerosol particles on microphysics, precipitation and electrification in a 1.5D aerosol-cloud bin model, J. Aerosol Sci., 140, 105440, https://doi.org/10.1016/j.jaerosci.2019.105440, 2020.
Yun, Y. and Penner, J. E.: An evaluation of the potential radiative forcing and climatic impact of marine organic aerosols as heterogeneous ice nuclei, Geophys. Res. Lett., 40, 4121–4126, https://doi.org/10.1002/grl.50794, 2013.
Zaveri, R. A., Easter, R. C., Fast, J. D., and Peters, L. K.: Model for Simulating Aerosol Interactions and Chemistry (MOSAIC), J. Geophys. Res.-Atmos., 113, D13204, https://doi.org/10.1029/2007jd008782, 2008.
Zhang, Y., Fan, J., Li, Z., and Rosenfeld, D.: Impacts of cloud microphysics parameterizations on simulated aerosol–cloud interactions for deep convective clouds over Houston, Atmos. Chem. Phys., 21, 2363–2381, https://doi.org/10.5194/acp-21-2363-2021, 2021.
Zhao, B., Wang, Y., Gu,Y., Liou, K.-N., Jiang, J. H., Fan, J., Liu, X., Huang, L., and Yung, Y. L.: Ice nucleation by aerosols from anthropogenic pollution, Nat. Geosci., 12, 602–608, https://doi.org/10.1038/s41561-019-0389-4, 2019.
Zhao, C., Chen, S., Leung, L. R., Qian, Y., Kok, J. F., Zaveri, R. A., and Huang, J.: Uncertainty in modeling dust mass balance and radiative forcing from size parameterization, Atmos. Chem. Phys., 13, 10733–10753, https://doi.org/10.5194/acp-13-10733-2013, 2013.
Zhao, X., Liu, X., Burrows, S. M., and Shi, Y.: Effects of marine organic aerosols as sources of immersion-mode ice-nucleating particles on high-latitude mixed-phase clouds, Atmos. Chem. Phys., 21, 2305–2327, https://doi.org/10.5194/acp-21-2305-2021, 2021.