the Creative Commons Attribution 4.0 License.
the Creative Commons Attribution 4.0 License.
 | 24 May 2022
Exceptional middle latitude electron precipitation detected by balloon observations: implications for atmospheric composition
Irina Mironova
Miriam Sinnhuber
Galina Bazilevskaya
Mark Clilverd
Bernd Funke
Vladimir Makhmutov
Eugene Rozanov
Michelle L. Santee
Timofei Sukhodolov
Thomas Ulich
Energetic particle precipitation leads to ionization in the Earth's atmosphere, initiating the formation of active chemical species which destroy ozone and have the potential to impact atmospheric composition and dynamics down to the troposphere. We report on one exceptionally strong high-energy electron precipitation event detected by balloon measurements in geomagnetic midlatitudes on 14 December 2009, with ionization rates locally comparable to strong solar proton events. This electron precipitation was possibly caused by wave–particle interactions in the slot region between the inner and outer radiation belts, connected with still poorly understood natural phenomena in the magnetosphere. Satellite observations of odd nitrogen and nitric acid are consistent with widespread electron precipitation into magnetic midlatitudes. Simulations with a 3D chemistry–climate model indicate the almost complete destruction of ozone in the upper mesosphere over the region where high-energy electron precipitation occurred. Such an extraordinary type of energetic particle precipitation can have major implications for the atmosphere, and their frequency and strength should be carefully studied.
- Article
(2770 KB) - Full-text XML
- BibTeX
- EndNote


Energetic particle precipitation into the atmosphere initiates a chain of reactions, starting with atmospheric ionization, leading to large changes in middle atmosphere composition, including the formation of hydrogen and nitrogen oxides, followed by ozone loss in the stratosphere and mesosphere over ∼30–80 km, and with potential relevance even for tropospheric weather systems and regional climate (e.g., Seppälä et al., 2009; Mironova et al., 2015; Arsenovic et al., 2016; Tsurutani et al., 2016; Sinnhuber and Funke, 2019; Mironova et al., 2021a). Permanent sources of atmospheric ionization are galactic cosmic rays and solar UV radiation, but the flux of energetic particles can increase by orders of magnitude through the episodic precipitation of solar or magnetospheric energetic particles. The precipitation of electrons from the outer radiation belt is a consequence of the violation of the adiabatic motion of the trapped electrons, mostly as a result of the wave–particle interactions (e.g., Millan and Thorne, 2007). Precipitation mainly occurs at high latitudes, in the zone of the auroral oval corresponding to geomagnetic latitudes of ∼65–70∘ or a McIlwain parameter of L∼5–6. Comprehensive measurements of midlatitude electron precipitation from a slot between the outer and inner radiation belts at L∼2–4 have been made on the Van Allen Probes (e.g., Su et al., 2017; Foster et al., 2016). The first results of observations of bremsstrahlung in the atmosphere from precipitating electrons at the geomagnetic latitude 53.9∘ N were recently published (Aplin et al., 2021).
Energetic electron precipitation (EEP) leads to the enhancement of odd nitrogen NOx and odd hydrogen HOx, which play a key role in the ozone balance of the middle atmosphere (e.g., Sinnhuber et al., 2012). The effect of high-latitude EEP on atmospheric composition and ozone is confirmed by various observations (e.g., Newnham et al., 2011; Andersson et al., 2014; Newnham et al., 2013; Sinnhuber et al., 2016; Randall et al., 2006) and 3D chemistry–climate models (e.g. Rozanov et al., 2012; Arsenovic et al., 2016; Verronen et al., 2016; Sinnhuber et al., 2018) that account for EEP-induced ionization.
Here, we present an exceptional case of high-energy electron precipitation (with stratospheric and mesospheric ionization rates locally exceeding those of large solar proton events) from the slot region () observed over Moscow (55.96∘ N, 37.51∘ E; geomagnetic latitude ∼52∘ N; L=2.7) on 14 December 2009. To confirm the balloon observations, and to bring those essentially point measurements into a broader context, Polar-orbiting Operational Environmental Satellites (POES) and very low frequency VLF observations are studied as well. Energetic electrons precipitating into the atmosphere decelerate by collisions with the most abundant species. In the middle atmosphere below ∼90 km, these are N2 and O2, which are either ionized or dissociated, starting a complex ion–chemistry reaction chain which ultimately leads to the formation of nitric oxide NO and nitric acid HNO3 (see Sinnhuber and Funke, 2019, for a recent review). The EEP-induced ionization and consequent enhancement of NOx (N, NO) and HNO3 are confirmed by chemical composition observations from the Microwave Limb Sounder (MLS; Waters et al., 2006) and the Michelson Interferometer for Passive Atmospheric Sounding (MIPAS; Funke et al., 2014). Model studies with the 1D atmospheric chemistry model ExoTIC (Exoplanetary Terrestrial Ion Chemistry model; Herbst et al., 2019) and the 3D chemistry–climate model HAMMONIA (Hamburg Model of the Neutral and Ionized Atmosphere; Schmidt et al., 2006; Meraner et al., 2016), using the ionization rates derived from the balloon observations, demonstrate the formation and loss rates of a wide range of neutral species and ozone in the upper mesosphere.
2.1 Local view: balloon observations
Balloon observations of energetic particle precipitation in the atmosphere are an important independent source of information for the evaluation of satellite-observed particle flux and energy used in chemistry–climate models, extending the useful energy range from hundreds of kilo electron volts (keV) to several mega electron volts (MeV).
The balloon measurements are performed by the radiosonde lifted up to the heights of 30–35 km and returning information on the ionizing particle fluxes at different levels of the atmosphere. The radiosonde sensor consists of two Geiger–Müller tubes arranged as a telescope, with a 2 mm Al interlayer between the tubes (Fig. 1b). The device returns the count rates of the upper single tube and the telescope. The single tube is sensitive to X-rays and charged particles (electrons, protons and muons), while a telescope measures only energetic charged particles but does not respond to the X-ray flux by the atmosphere. During quiet conditions, the radiosonde records the fluxes of secondary cosmic rays. Precipitating electrons are absorbed at altitudes above 50 km, but they generate X-rays via bremsstrahlung, which penetrates into the atmosphere down to altitudes of ∼20 km and can be recorded only by single tube. Intrusion into the atmosphere of solar particles causes a count rate enhancement for both the single tube and the telescope, which enables us to distinguish between solar proton and magnetospheric electron precipitation. In the case of the smooth growth of the Geiger–Müller tube count rates with altitude, we assume that it is caused by X-ray absorption in air rather than by temporal variations in X-ray flux. Taking the data of a previous balloon flight in quiet conditions as the background and subtracting it from the data of the flight that observed precipitating electrons, we obtain the X-ray flux vs. atmospheric pressure. The method of evaluation of the energy spectrum of electrons impinging on the atmosphere from the X-ray flux absorption in air was developed on the basis of the Geant4 simulation (Makhmutov et al., 2016).
In this study, we use observations from the balloon experiment that have been performed by the Lebedev Physical Institute (LPI) every few days since 1957 (Stozhkov et al., 2009), which has so far recorded 589 EEP events at polar latitudes, , over 1961–2019 (Makhmutov et al., 2016; Mironova et al., 2019a, b; Bazilevskaya et al., 2020), and is complemented by regular balloon launches at midlatitudes. Observations of EEP events in midlatitudes are very rare. However, several candidates have been found since the beginning of the 2000s which have not been studied properly yet. Here we present the most outstanding EEP event recorded in the Moscow region so far.
Data from the LPI balloon observation at 13:26–13:45 UT on 14 December 2009 (Fig. 1c; curve 1) demonstrate a substantial enhancement in the count rate of the single Geiger–Müller tube above ∼20 km (residual pressure ∼55 hPa). This count rate increase in the single Geiger–Müller tube was due to X-ray bremsstrahlung generated by precipitating electrons in the atmosphere at altitudes above 50 km. Note that X-ray radiation from the Sun does not penetrate to heights below 90 km (Mironova et al., 2015). A typical quiet day result, derived on 11 December, shows only the background in the count rate of the single Geiger–Müller tube (Fig. 1c; curve 2). The telescopes (Fig. 1c; curves 3 and 4), which are not sensitive to X-rays, recorded the background due to secondary cosmic rays, confirming particle precipitation as the source of the single tube count rate increase. The precipitation of electrons is characterized by strong variations, sometimes on a scale of several minutes (Mironova et al., 2019b, a). The spatial dimensions of the precipitation area are poorly understood but can be of the order of hundreds of kilometers (Millan and Thorne, 2007). Therefore, we checked whether the precipitation observed on 14 December were at high latitudes both from observations on balloons and on satellites. At the polar station Apatity (67.57∘ N, 33.56∘ E; L=5.3), a radiosonde was aloft ∼5 h before the Moscow observation and did not observe enhanced electron precipitation.
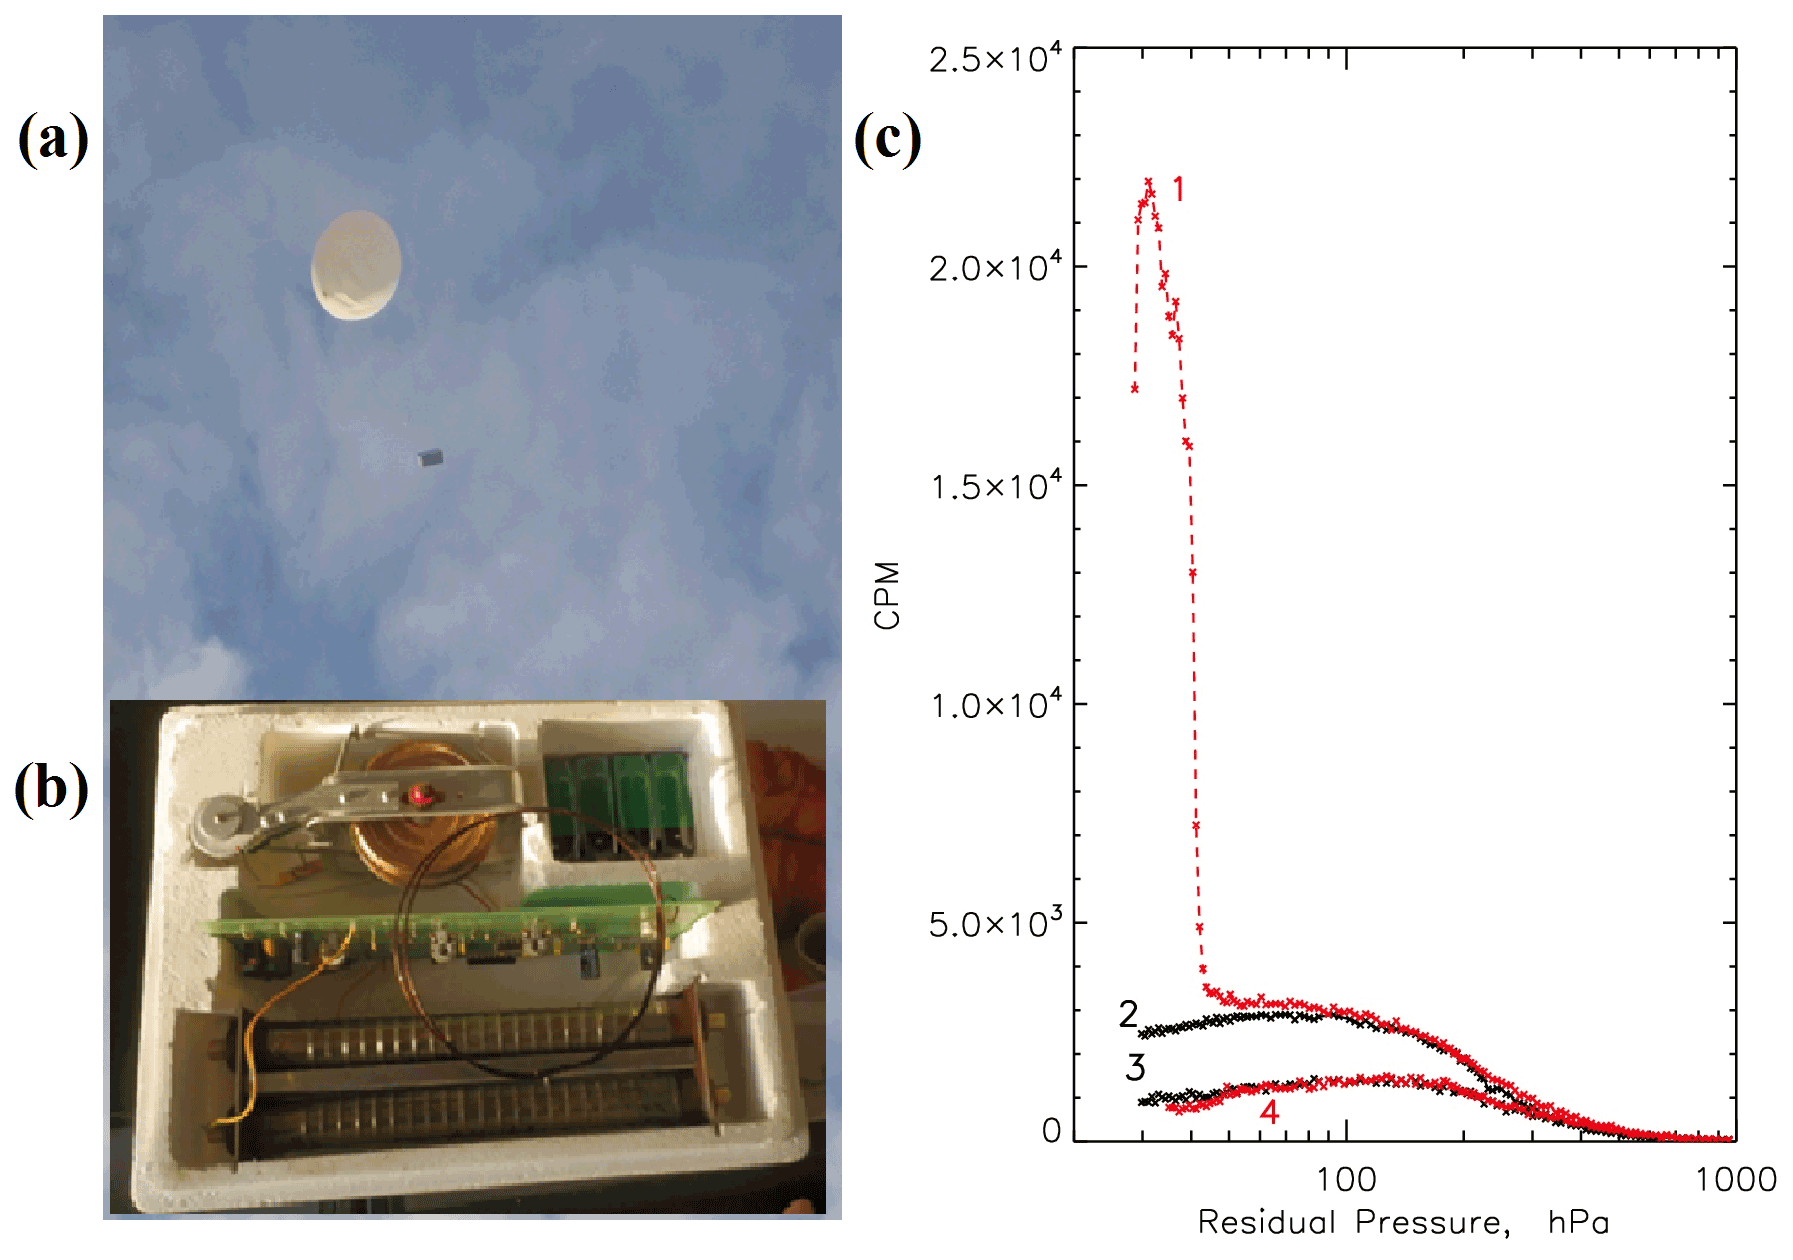
Figure 1A balloon in flight (a) and a radiosonde layout (b) showing two Geiger–Müller tubes (a top counter referred to as a single tube and telescope, arranged as a telescope detecting particles passing through both tubes and the filter between). Panel (c) shows the results (CPM, count rates per minute, of two Geiger–Müller tubes) of observations in the Moscow region on 14 December 2009 (curves 1 and 4) and on 11 December 2009 (curves 2 and 3). Curves 1 and 2 are the single Geiger–Müller tube count rates, which are sensitive to X-rays. The telescope (sensitive to charged particles) count rate (curves 3 and 4) is multiplied by 3.
2.2 Regional view: POES observations
NOAA's Polar-orbiting Operational Environmental Satellites (POES) carry a suite of instruments that measure the flux of energetic protons and electrons at the altitude of the satellite. The Medium Energy Proton and Electron Detector (MEPED) on board POES consists of telescopes pointing close to zenith (0∘) and in the horizontal plane (90∘). At polar latitudes, where most precipitation occurs, the vertical telescope registers the precipitated particles, and the horizontal telescope, trapped in the radiation belt. However, the pitch angle distribution of particles precipitating at midlatitudes has not been studied. Moreover, the POES angular response functions are not fully understood (Selesnick et al., 2020). We have examined the POES data around the Moscow and Apatity regions for December 2009 with the following limitations: (i) McIlwain parameter (L=2–3; foot-of-field-line latitudes – Flat = 52–60∘ N; foot-of-field-line longitudes – Flon = 30–55∘) and (ii) L<8, Flat = 60–70∘ N and Flon = 30–55∘. The >30, >100 and >300 keV electron channels, as well as both the horizontal (90∘) and vertical (0∘) telescopes, were checked.
Throughout December 2009, the only significant precipitation of >30 and >100 keV electrons in polar latitudes at the longitude of Moscow was recorded on 14 December by the POES 16 vertical telescope, as can be seen in Fig. 2a. The precipitation was observed at polar latitudes close to the Apatity region at 05:34–05:35 UT (POES 16) and at 07:25–07:26 UT (POES 17) and 13:07–13:08 UT (POES 15). At the midlatitudes, there was no electron flux enhancement in the POES 16 vertical telescope data at this time, but the horizontal telescope data shows increased particle flux on this day (Fig. 2b) and on 6 and 23 December. Results of POES 15–18 and MetOp-02 (Meteorological Operational satellite) measurements by horizontal telescopes on 14 December 2009 are given in the insert to Fig. 2b.
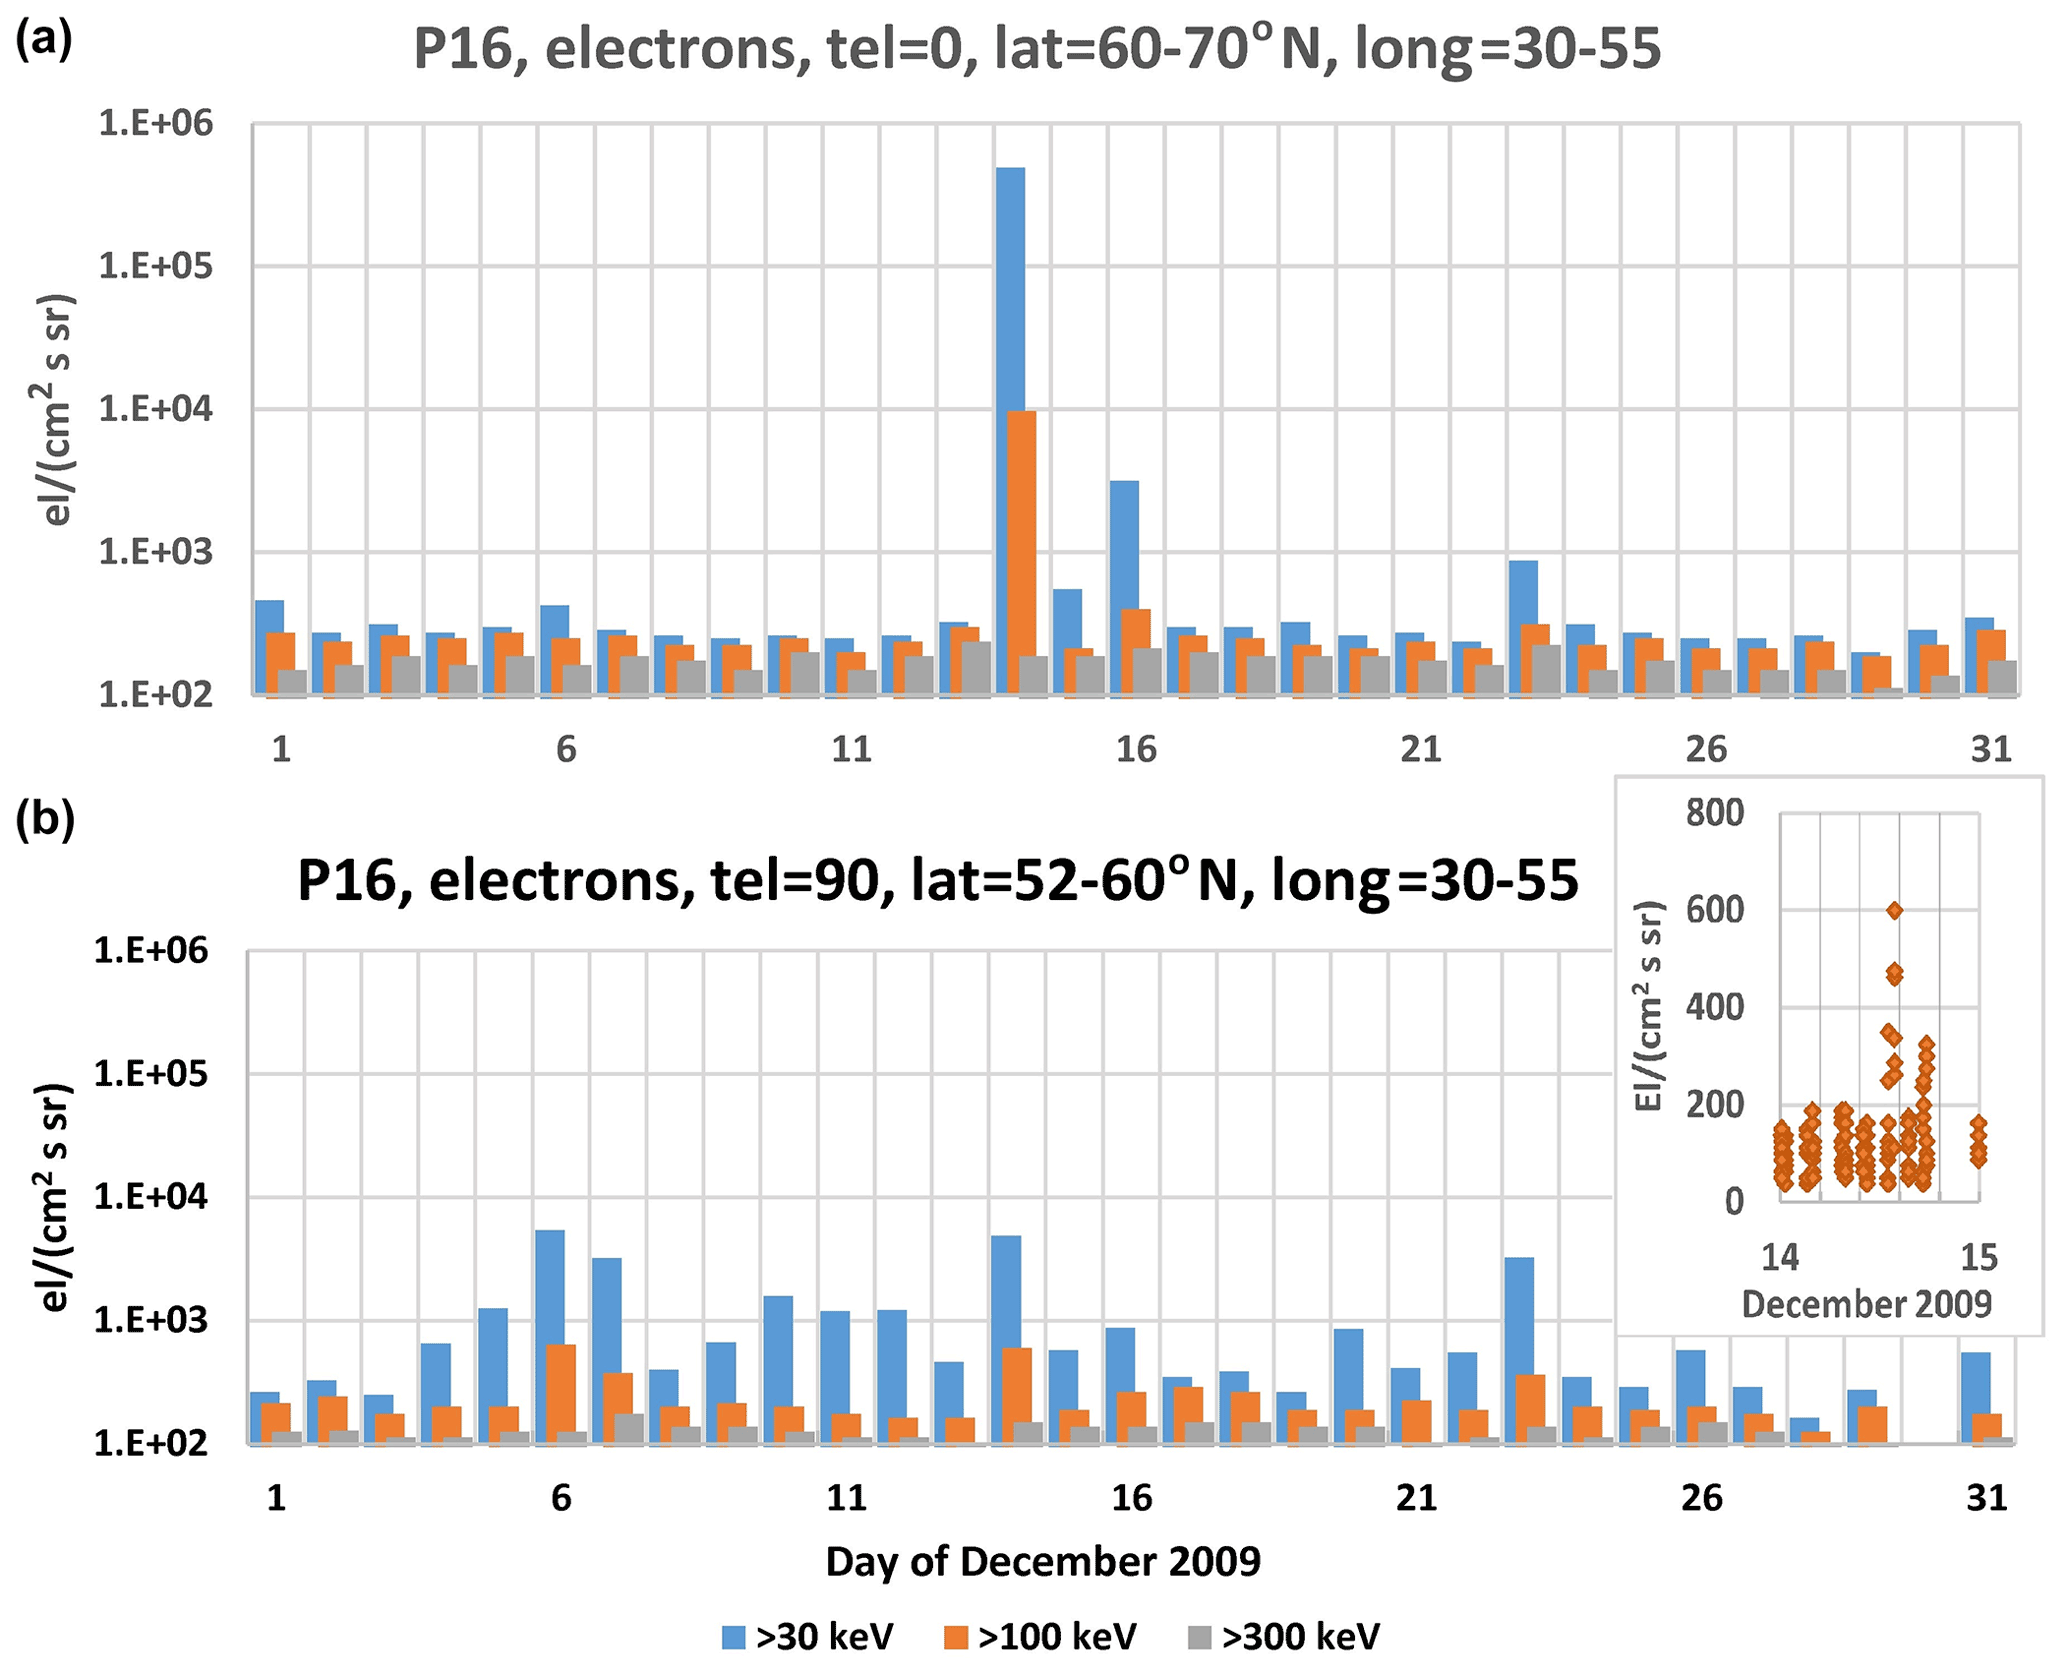
Figure 2Daily data of POES 16 in December 2009. (a) Data on electrons recorded by the vertical telescope at the polar latitudes. (b) The same as panel (a) but for the horizontal telescope at the midlatitudes (see Sect. 2.2). The inset in panel (b) is the same as (b) but for 14 December, including the data of POES 15–18 and MetOp02.
2.3 Hemispheric view: VLF observations
Artificial, narrow-band radio waves are transmitted in the very low frequency (VLF) range from several, mainly midlatitude, locations around the world, particularly in the Northern Hemisphere. The radio waves can propagate very long distances subionospherically and are systematically recorded using a network of VLF receivers known as the Antarctic–Arctic Radiation-belt (Dynamic) Deposition–VLF Atmospheric Research Konsortium (AARDDVARK). Each receiver site is able to log the amplitude and phase of 10 or more transmitter signals, with a time resolution typically of 0.1–1 s. Perturbations to the phase and amplitude of the signals are caused by changes in ionization levels at altitudes close to the lower boundary of the D region (50–85 km). Such perturbations can be caused by energetic particle precipitation (electron or proton) and solar flares. Determination of energetic particle precipitation characteristics from VLF perturbation levels requires knowledge of either the flux of particles or the spectrum of energy deposition involved. Knowing one of these parameters allows the other to be calculated (see Rodger et al., 2012, for a detailed description of the calculations required and VLF perturbation responses that are likely to arise).

Figure 3The amplitude variation in the NML VLF transmitter (LaMoure, North Dakota; 25.2 kHz) received at two receivers in Finland on 14 December 2009. Panels (a) and (b) show data from Kilpisjärvi, while (c) and (d) show data from Sodankylä. A representative quiet day curve for each site (QDC; blue line) is shown using data from 11 December 2009. The difference in amplitude between the signal from 14 December 2009, and the QDC is shown in the right-hand panels. A vertical dash-dotted line indicates the start of a perturbation at 13:15 UT.
Subionospheric VLF propagation measurements from several receivers from the AARDDVARK located in the region of Scandinavia (Clilverd et al., 2009) showed a clear burst of precipitation from 13:30–15:00 UT, although the field of view did not include the region around Moscow. The propagation paths impacted by the precipitation spanned the range, near the geomagnetic latitude of Moscow, although much further west. Figure 3 shows the amplitude variation in the NML VLF transmitter (LaMoure, North Dakota; 25.2 kHz) during 14 December 2009, received at two sites in northern Finland. Both Kilpisjärvi and Sodankylä data show deviations from a representative quiet day curve (QDC) taken from 11 December 2009, with the amplitude difference shown in the right-hand panels. Negative deviations from the QDC can be seen around 05:00 and 08:00 UT, while a positive deviation is observed after 13:00 UT. The deviations are consistent with the effect of excess ionization on the propagation conditions experienced by the subionospheric radio waves at altitudes between 50–90 km (Clilverd et al., 2009).
While solar flares and their ionospheric D-region enhancements are known to reach well below 90 km altitude (Thomson et al., 2005), no M- or X-class flares occurred in December 2009, and there was no flare on 14 December 2009.
3.1 Hemispheric observations: geomagnetic disturbances
The main driver of energetic electron injection in the Earth environment is the solar wind interaction with Earth's magnetosphere and related geomagnetic disturbances. Electron precipitation at polar latitudes is usually accompanied by enhanced auroral activity indicated by the auroral electrojet (AE) index, a substantial variation of the disturbance storm time index (Dst), and the southward excursion of the Bz component of the interplanetary magnetic field (IMF; Dungey, 1961). For this reason, we took into account the behavior of AE, Dst and Bz during December 2009. All these hourly averaged parameters used in our study are collected by the low-resolution OMNI data set (King and Papitashvili, 2005).
In December 2009, conditions in the interplanetary space were calm. The magnetic field strength did not exceed 10 nT, and the solar wind speed was <450 km s−1. On December 14, the field strength was 6 nT, and the solar wind speed was 270 km s−1. The general geomagnetic situation in December 2009 was slightly disturbed, as shown in Figs. 4 and 5a. In the period of 13–14 December, the AE index reached a value of up to 300 nT (see the upper left panel of Fig. 5a), and the Dst value reached −12 nT, which can be considered as a geomagnetic substorm well below the threshold for a geomagnetic storm (Gonzalez et al., 1994; Tsurutani et al., 1990). It is true that, at this time, the negative Bz excursion was longest and strongest throughout the month, but it was not extraordinary. However, a detailed examination reveals features that could lead to the precipitation of electrons at midlatitudes. Figure 4 presents the geomagnetic activity on 14 December with 1 min resolution. The SYM-H index is similar to Dst but with a higher time resolution, and it is obtained with more geomagnetic stations. The SuperMAG auroral electrojet index (SME) is an equivalent to the electrojet index AE but at 1 min resolution (Bergin et al., 2020).
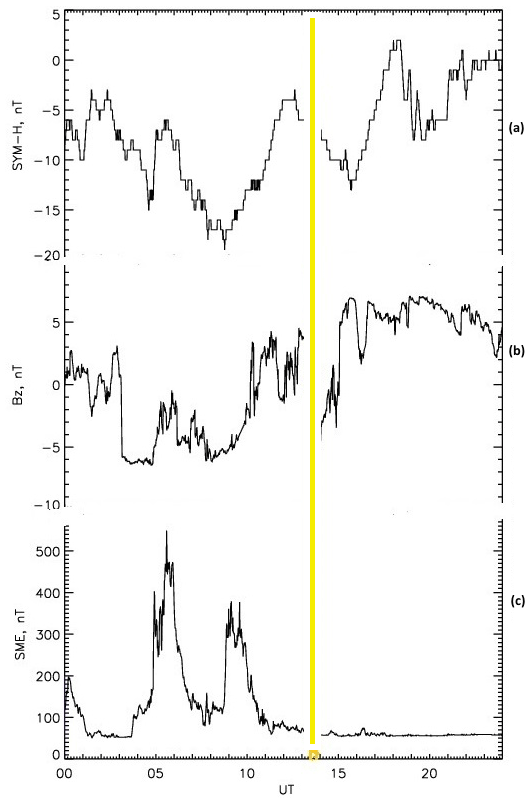
Figure 4Geomagnetic disturbances during 14 December 2009. (a) SYM-H index variability. (b) IMF Bz variability. (c) SME index variability. The yellow line marks the time of balloon observation.
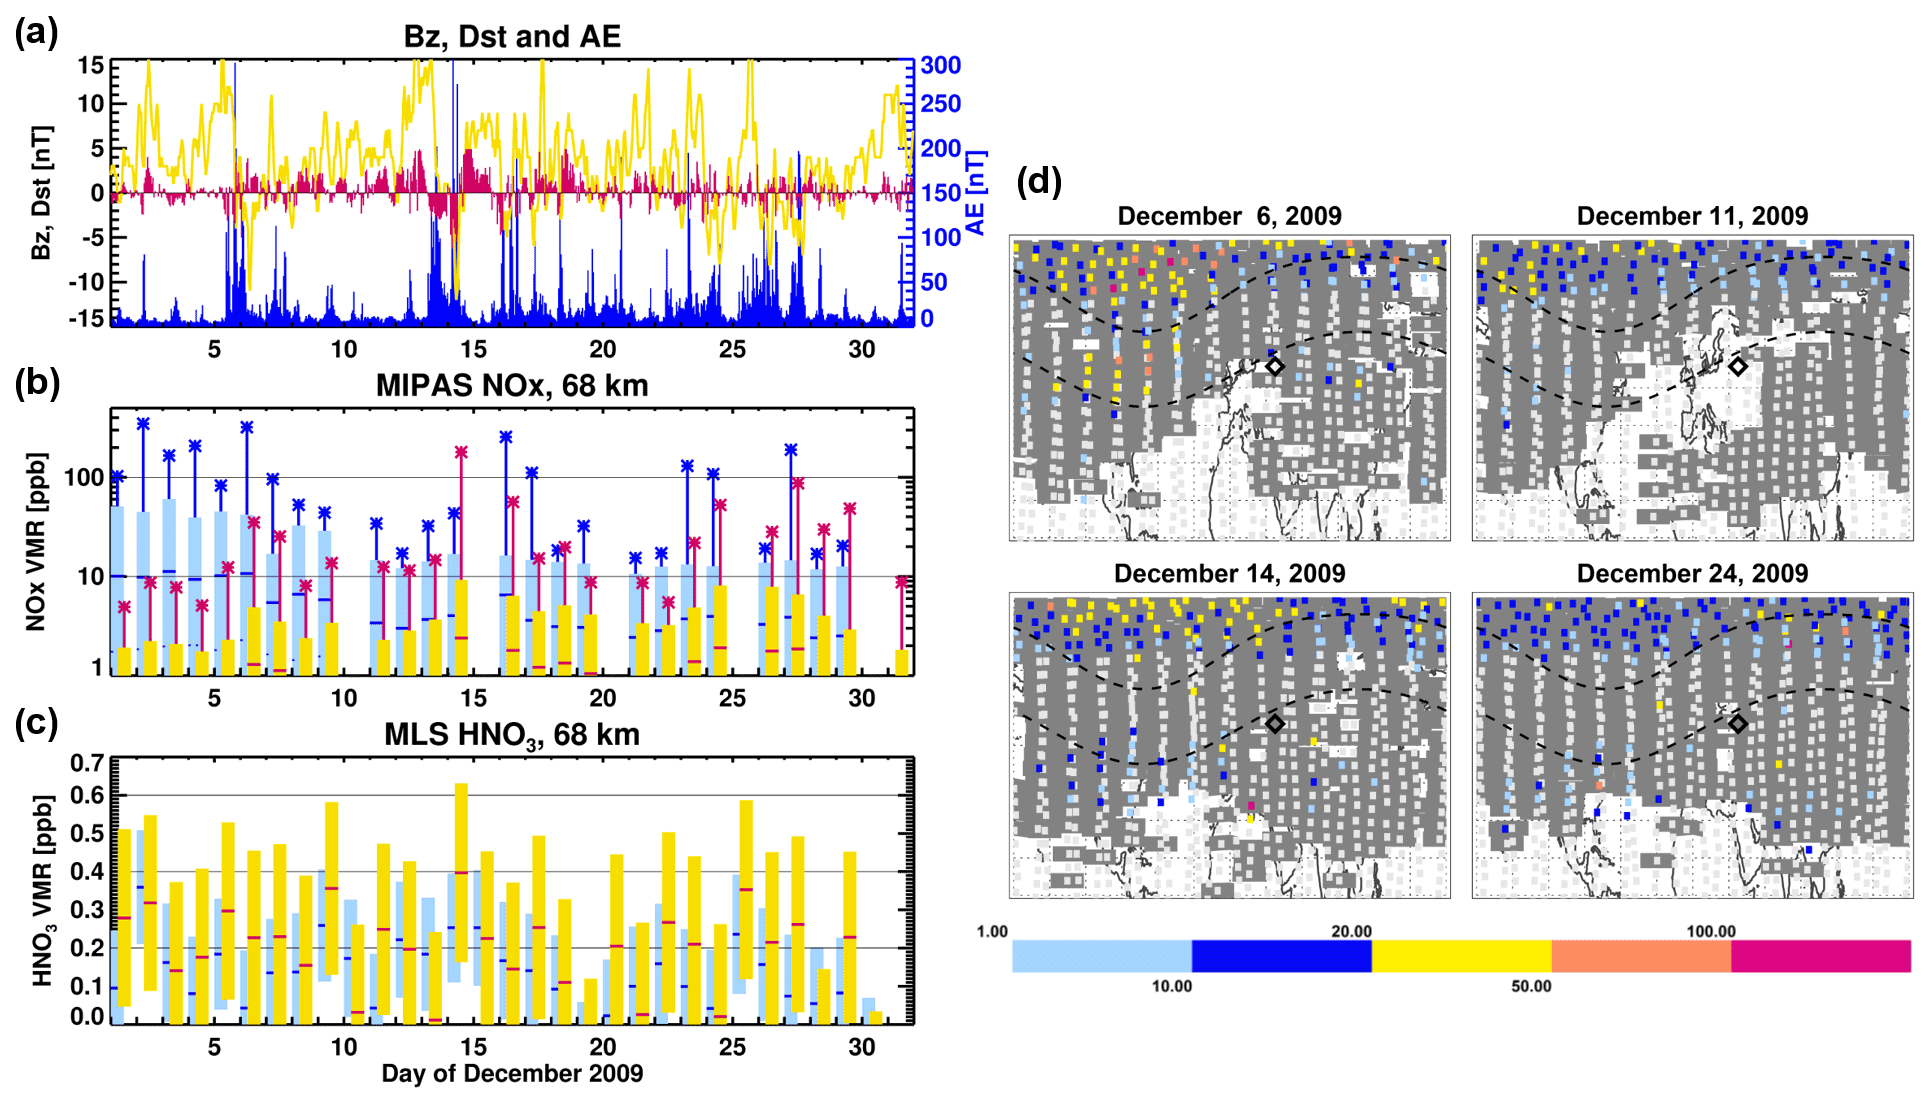
Figure 5(a) Bz (red), Dst index (yellow) and AE index (blue). (b) MIPAS NOx (NO+NO2) at 68 km altitude at high latitudes (50–81∘ N; blue) and at geomagnetic midlatitudes (10–55∘ geomagnetic latitude; red). Horizontal line segments mark the mean values, the error bars are the 95 % percentile, and the stars are the maximal values of the day. (c) MLS HNO3 at 68 km altitude at high latitudes (50–81∘ N; blue) and at geomagnetic midlatitudes (10–55∘ geomagnetic latitude; red). Horizontal line segments mark the mean values and the error bars the 2σ standard error of the mean. (d) MIPAS NOx on the satellite overpass footprints on 4 d (6, 11, 14 and 23 December) at 68 km altitude in the Northern Hemisphere. The dashed lines mark geomagnetic latitudes of 50 and 75∘. The diamonds mark the position of Moscow. Colored symbols mark observations larger than the monthly mean plus one standard error. Dark gray areas mark MIPAS footprints, where carbon monoxide CO at 70 km is larger than 1.5 ppm (parts per million).
The event on 14 December 2009, was preceded by two episodes of a negative polarity of Bz, which were observed at about 04:00 and 08:00 UTC and caused two geomagnetic substorms (Tsurutani and Meng, 1972), with the SME index reaching up to 500 and 350 nT (see Fig. 4). The episodes could lead to the injection of low-energy electrons into the midnight sector of the magnetosphere, the subsequent electron drift to the noon sector and the generation of chorus waves, which effectively accelerate the electrons to relativistic energies (Horne et al., 2005; Tsurutani et al., 2010, 2016). The precipitation of electrons in the slot region was most likely associated with the interaction with the plasmaspheric hiss that is usually present in the noon sector, which lead to a rapid scattering of particles into the loss cone (e.g. Abel and Thorne, 1998). This is in agreement with the specific features of the 14 December 2009 event, especially when considering the fact that it was observed at midlatitudes, in the afternoon sector, and in the absence of strong geomagnetic activity. Such properties correspond to the scenario proposed by Tsurutani et al. (2019).
3.2 Hemispheric observations: satellite observations of trace gases (MLS and MIPAS)
The Earth Observing System (EOS) Microwave Limb Sounder (MLS; Waters et al., 2006) is an instrument on NASA's Aura satellite, launched in July 2004. MLS observes millimeter and sub-millimeter wavelength thermal emissions, vertically scanning Earth's limb in the orbit plane from the ground to about 90 km to give daily near-global (82∘ S–82∘ N latitude) coverage, with ∼15 orbits per day, making measurements during both day and night. Aura is in a sun-synchronous orbit, with an ascending (north-going) Equator-crossing time of 13:45 LT; it therefore passes the latitude of Moscow shortly after noon at local time. One of the important MLS retrieval products that controls stratospheric ozone depletion is nitric acid (HNO3). As HNO3 is a longer-lived reservoir for NOx and HOx, the formation of HNO3 can prolong ozone loss and also enhance the stratospheric impact by downward transport in the polar winter (indirect effect). Here we take into account HNO3 mainly because it is formed very efficiently by ion chemistry reactions, and is, therefore, a good tracer for particle precipitation impacts. However, due to the relatively poor precision of HNO3 in the upper stratosphere and lower mesosphere, only zonal average data can be used. Here we use the latest (version 5) MLS HNO3 measurements (Livesey et al., 2020).
The Michelson Interferometer for Passive Atmospheric Sounding (MIPAS) on board ENVISAT measured mid-infrared emission spectra in the middle and upper atmosphere during 2002–2012, enabling the retrieval of temperature and a large number of trace species with daily global coverage (Fischer et al., 2008). In this study, we use MIPAS NOx (NO2, NO) data (version V5R XX 220; XX = NO, NO2; Funke et al., 2014) retrieved at the Institute of Meteorology and Climate Research, Karlsruhe Institute of Technology, and the Instituto de Astrofisica de Andalucia. ENVISAT was in a sun-synchronous orbit with an Equator-crossing time of h local standard time (LST); it therefore passed over Moscow several hours before and several hours after the balloon observation of the electron precipitation on 14 December. Because of the fast horizontal transport in the mesosphere, as shown in Fig. 5d, a direct observation of the impact of a localized, short-lived event is unlikely.
We analyzed MIPAS NOx and MLS HNO3 at 68 km altitude at high latitudes (50–81∘ N) and at geomagnetic midlatitudes (10–55∘ geomagnetic latitude; see Fig. 5b and c). Selection of these latitudinal–longitudinal regions and the altitude of the observations was based on balloon energetic electron precipitation observations and HAMMONIA chemistry–climate model results. MIPAS ozone at 68 km shows minimal values below the detection limit of the instrument on 15 and 24 December, consistent with the enhanced NOx and HNO3, but with no statistically significant variation in the mean values (not shown). MLS ozone data are noisier and would have to be averaged over a larger area than the MIPAS observations.
Daily mean values at geomagnetic midlatitudes are highest for both species on 14 December. Given that the detection of a localized transient event is unlikely, an increase in NOx that was observed by MIPAS (and an increase in average HNO3 by MLS) thus suggests that there were either a number of events in different locations on this day or there was an event covering a larger area not observable by balloon observations alone. For NOx, maximal values were also much higher than on any other day in December 2009; for HNO3, a very noisy observation with a large spread, maximal values were not conclusive (not shown). Slightly higher values than on average in either NOx or HNO3 (or both) were also observed during the periods of negative Bz and substorm activity on 5–6 and 23–27 December. While these enhancements could not be attributed clearly to the location of Moscow and were not statistically significant, the coincidence in both species with negative Bz and substorm activity suggests that electron precipitation into geomagnetic midlatitudes on these days was strongest on 14 December (see Fig. 5). A closer view of the distribution of enhanced NOx values on 6, 14 and 24 December (Fig. 5d) shows enhanced values mostly within the auroral oval (over North America) on 6 December, as expected from a period of auroral substorm activity; on 14 and 24 December, the enhanced values occurred mostly southward of the auroral oval in an area reaching from North America over the Atlantic to northern Europe, with a spread indicating either sporadic precipitation hot spots at very low latitudes or fast horizontal transport within the mesospheric polar vortex. The latter possibility is investigated in Fig. 5c by including MIPAS CO observations with volume mixing ratios >1.5 ppmv (parts per million by volume) in 70 km altitude as tracers of vortex air, indicating highest NO values at the edge of the area of enhanced CO. The date of 11 December is shown as a reference for a quiet day without precipitation.
To estimate the potential impact of the Moscow event on atmospheric composition, we used the 1D atmospheric chemistry model ExoTIC (Herbst et al., 2019) and the 3D chemistry–climate model HAMMONIA (Schmidt et al., 2006; Meraner et al., 2016). Using the ionization rates derived from the balloon observations (Fig. 6a), a model experiment was carried out with the ExoTIC ion chemistry model for the Moscow region, considering ionization from 12:00–20:00 UT, to provide formation and loss rates of a wide range of neutral species (Fig. 6b).
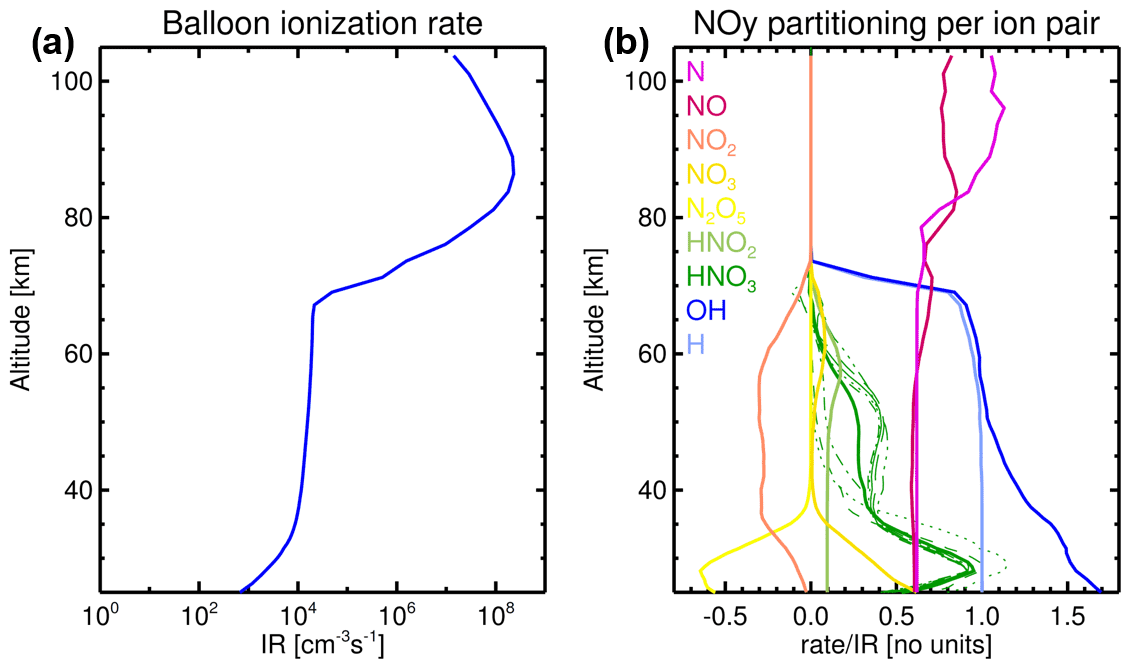
Figure 6(a) The atmospheric ionization profile derived from the balloon observations on 14 December 2009 over Moscow. (b) Mean formation and loss rates of NOy species due to ion chemistry calculated hourly from 12:00–20:00 UTC over Moscow with the ExoTIC ion chemistry model, showing the formation of N, NO, H and OH, as well as the repartitioning of NOy species from NO2 and N2O5 to NO3, HNO2 and HNO3. For HNO3, individual hourly values are also shown in different line styles to highlight the strong diurnal variability, with distinctly higher values in the 35–60 km region during nighttime.
4.1 Local impact: ionization rates calculations
Computation of the ionization rate (IR) requires knowledge of the energy spectra and parameterization of ion production via ionization yield functions. The ionization yield function at the atmospheric depth is the number of ion pairs created by one precipitating electron with the initial energy, E, at the upper boundary of the atmosphere. The ionization rates (ion pairs g−1 s−1) are computed as IR, where Y(x,E) are yield functions, F(E) is a flux of precipitating electrons at the top of atmosphere, x is atmospheric depth and E is the energy of the considered particles. The limits of integration are defined by the maximum and minimum energy of the considered electrons. During the EEP event observed over Moscow, ionization rates (IRs; see Fig. 6a) are computed using a look-up table Y(x,E), with ion production for isotropic flux of precipitating monoenergetic electrons (Mironova et al., 2021b) and electron energy distribution F(E) proposed by balloon-borne observations (see Fig. 1c; curve 1). The background-prescribed ionization rates used during December 2009 in the HAMMONIA model are based on the EEP spectra obtained by POES satellites and computed by Atmospheric Ionization Module Osnabrück (AIMOS v1.6, Wissing and Kallenrode, 2009).
4.2 Local impact: ExoTIC ion chemistry model results
The Exoplanetary Terrestrial Ion Chemistry model, ExoTIC, is a 1D stacked-box model of atmospheric neutral and ion composition. It is based on the University of Bremen Ion Chemistry model (UBIC) model developed for the terrestrial middle atmosphere (Winkler et al., 2009) but has recently been generalized to planetary atmospheres with a wide range of orbital parameters, stellar systems and base compositions (Herbst et al., 2019). Temperature, pressure, an initial atmospheric composition and particle impact ionization rates are prescribed externally. The particle energy is distributed to primary ions and excited species based on the atmospheric composition; 60 neutral and 120 charged species are considered, which interact due to neutral, neutral–ion and ion–ion gas-phase reactions, as well as photolysis and photoelectron attachment and detachment reactions (Sinnhuber et al., 2012). The ion chemistry module, called hourly from the base model, uses an iterative chemical equilibrium approach and provides formation and loss rates of all neutral species due to primary ionization and positive and negative ion chemistry which can be used as a parameterization for global chemistry–climate models (Nieder et al., 2014).
The ExoTIC results indicate a strong formation of NOx (N and NO) throughout the middle atmosphere, the formation of HOx (H and OH) and repartitioning of NOy species in the altitude range, where large positive and negative cluster ions form (below 75 km), with strong HNO3 production in the upper stratosphere and lower mesosphere, particularly during nighttime (see Fig. 6b). These formation and loss rates were provided as input for the HAMMONIA global chemistry–climate model, which does not include a detailed description of the ionospheric D layer, thus allowing consideration of, e.g., the direct HNO3 production from ion chemistry. As detailed information about the spatial and temporal characteristics of the event comes mainly from the balloon observations over Moscow, we limited the 3D model experiment to forcing by the available information; i.e., the ionization rates were applied only in the model profile above Moscow and only at the 6 h prescribed by the balloon and POES observations.
4.3 Hemispheric impact: HAMMONIA chemistry–climate model results
The Hamburg Model for the Neutral and Ionized Atmosphere, HAMMONIA, is a revised version of the general atmospheric circulation model ECHAM5 (Roeckner et al., 2006), in which the upper boundary is raised to ∼200–250 km or 1.7e−7 hPa. A detailed description of the model can be found in Schmidt et al. (2006) and Meraner et al. (2016). The system of hydro-thermodynamic equations in the model is solved by the spectral method with the triangular truncation T63, which approximately corresponds to a horizontal resolution of in latitude and longitude. The vertical resolution is 119 levels. Here we use the model in specified dynamics mode, assimilating ECMWF ERA-Interim data up to 1 hPa. HAMMONIA includes the MOZART3 (Model for Ozone and Related Chemical Tracers, version 3) package to describe atmospheric chemistry (Kinnison et al., 2007). Background ionization rates from auroral and medium-energy electrons and solar protons, as well as heavier ions, are provided by the Atmospheric Ionization Module Osnabrück, AIMOS v1.6 (Wissing and Kallenrode, 2009), with a 2 h resolution. Ionization effects are described by the five-ion chemistry scheme in the thermosphere (Kieser, 2011) and by the parameterization of NOx and HOx production by energetic particles in the middle atmosphere (Jackman et al., 2005) below ∼90 km. Since HAMMONIA does not have a detailed ion chemistry treatment in the ionospheric D layer, the parameterization of Jackman et al. (2005) has been supplemented here by the formation and loss rates of neutral species estimated for the event from the 1D ExoTIC model. In total, two experiments were conducted with HAMMONIA, i.e., with just the background ionization rates from AIMOS and with the background plus the ionization rates estimated from the balloon observations over Moscow on 14 December 2009.
Since we are interested in determining the maximum potential atmospheric impact of the observed midlatitudinal EEP, we estimate the effects with the HAMMONIA model (see Fig. 7), applying spatial extreme statistics (global or zonal maximum and minimum values) instead of averaging globally or over a certain region. This approach is justified by the forcing localization and the 3D dynamics of the middle atmosphere, which quickly transports the anomalies induced in chemical species away from their source region. NOx produced during the event is 1–2 orders of magnitude larger than the unperturbed maximum values in the middle and upper mesosphere above ∼60 km (Fig. 7a). The HNO3 mixing ratio in the lower mesosphere reaches values of up to 2 ppbv (parts per billion by volume) during the event (Fig. 7b) at 55–68 km, which is 2–2.5 orders of magnitude larger than the unperturbed maximum values at those altitudes. Modeled HNO3 is additionally plotted at 68 km as maximum zonal values (Fig. 7d) to illustrate the meridional transport of the plume. Transport is mainly defined by the position and shape of the polar vortex, which in the model is an oval with vertices extending to Europe and Alaska (not shown). The initial location of the plume is within the modeled vortex, and it circled the globe in about 3 d, after which it became indiscernible. The downward propagation of the odd nitrogen produced by energetic particles in the mesosphere is an important contributor to the stratospheric high-latitude ozone budget (Sinnhuber and Funke, 2019). However, because the event is so localized in the model, this effect is indistinguishable in the global average. The modeled ozone response is caused, therefore, almost completely by the mesospheric HOx enhancement, leading to the destruction of as much as 95 % of the ozone in the upper mesosphere above 68 km around Moscow during and shortly after the event (Fig. 7c). The negative ozone anomaly quickly disappears over the next few days, but our modeling results suggest that, magnitude-wise and in terms of the vertical distribution of the ozone signal, the Moscow event is comparable to the solar proton event of January 2005 (Jackman et al., 2011). However, it is not as pronounced in the MLS ozone data as it was in January 2005, suggesting that, in our case, the precipitation coverage was not as spread out as it occurs during usual precipitation events.
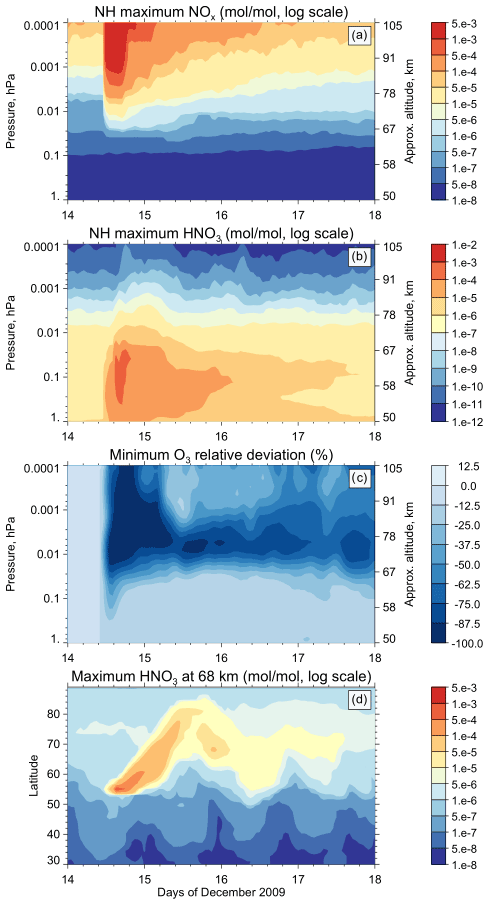
Figure 7HAMMONIA results for the (a) northern hemispheric (NH) maximum value of NOx volume mixing ratio (VMR). (b) NH maximum value of HNO3VMR. (c) NH minimum ozone value of the relative difference between runs with and without the event and (d) zonal maximum value of HNO3 VMR at 68 km.
On 14 December 2009, surprisingly strong high-energy electron precipitation was observed clearly by midlatitude balloon measurements. Satellite POES data and VLF receivers confirm these electron precipitations and show that the EEP event extended over a larger area and continued for some time after the observed balloon event, moving northward. Although relatively weak geomagnetic disturbances were observed in December 2009, two substorms occurred on 14 December, one after another, which could lead to the precipitation of energetic electrons. Midlatitude energetic electron precipitation can be triggered by wave–particle interactions in the slot region () between the inner and outer radiation belts. Inside the magnetosphere, the generation of waves called plasmaspheric hiss is especially intense near the plasmasphere boundary (plasmapause). Here the electron scattering dominates the inward radial diffusion, resulting in an “impenetrable barrier” for electrons (Baker et al., 2014; Foster et al., 2016), which precipitate into the atmosphere. It is commonly accepted that the slot between the belts (L∼3) arises from electron scattering by the waves which can be either of natural or artificial origin, as initiated by VLF emission of artificial transmitters (e.g., Gombosi et al., 2017; Frolov et al., 2020; Zhao et al., 2019). However, natural or anthropogenic phenomena in the magnetosphere resulting in midlatitude electron precipitation are still not well understood.
The energetic electron precipitation occurred during a period of rather low geomagnetic activity, with a southward orientation of the interplanetary magnetic field in the near-Earth space. The atmospheric energy deposition during this event was much larger than expected for midlatitude precipitation due to, e.g., hiss forcing, and resembled in strength and altitude the coverage of large solar proton events. While the perturbations evident in the balloon observations are too short and localized to be directly detectable in the coarser resolution satellite measurements, the hemispheric response of atmospheric species like NOx and HNO3 are in agreement with a midlatitude precipitation event on this day. Analysis of VLF subionospheric propagation perturbations shows evidence of precipitation during 04:00–16:00 UT on 14 December, with several bursts observed within , including one at the time of the event observed over Moscow.
Both POES and VLF data on 14 December, and NOx and HNO3 observations throughout December, suggest that events indeed lasted for a few hours and covered extended areas during this time and that high-energy electron precipitation can occur even during relatively quiet periods without a geomagnetic storm.
Satellite observations of NOx and HNO3 are consistent with precipitation into midlatitudes on several days in December 2009, with the strongest response on 14 December, highlighting that this was an exceptionally strong high-energy electron precipitation with ionization rates locally comparable to strong solar proton events. In the daily mean average (50–81∘ N; 10–55∘ geomagnetic latitude) the increase is very small and not statistically significant when considering the 95 % percentile (NOx) or 2σ standard error (HNO3). However, averaging over large areas/large numbers of data (few hundreds to > 1000 profiles) mutes the maxima; thus, increases in hotspots could be much larger. This is indicated in NOx measurements, where maximal values of about 200 ppb (parts per billion) are observed on 14 December, compared to a mean value of 2–3 ppb, and by the results of the HAMMONIA model experiments. Complete destruction of ozone in the upper mesosphere over the region where high-energy electron precipitation occurred is also shown by HAMMONIA numerical experiments. The predicted ozone losses are largest in the range 68–90 km around Moscow region during and after the EEP event.
The frequency, duration and spatial coverage of these newly discovered electron precipitation events are as yet unknown, but results from first model simulations indicate a potentially large impact on atmospheric composition. If such EEP occur frequently and in a larger area over the middle latitudinal region, they could have an accumulated impact that is much larger than our model results (which assumed only one short, highly localized, event) suggest. Such midlatitudinal EEP events with ionization rates locally comparable to strong solar proton events could be recurrent and have major implications for the atmosphere. Thus, their frequency and strength should be carefully studied.
This conclusion inspires further studies involving a wider network of the balloon-based instruments.
The HAMMONIA chemistry–climate model code and simulation results can be obtained by contacting Timofei Sukhodolov (timofei.sukhodolov@pmodwrc.ch). The ExoTIC ion chemistry model code and simulation results can be obtained by contacting Miriam Sinnhuber (miriam.sinnhuber@kit.edu).
Balloon observations are available at https://sites.lebedev.ru/ru/sites/DNS_FIAN/479.html (Solar and Cosmic Ray Physics Laboratory, 2022). POES can be accessed from http://www.ngdc.noaa.gov/stp/satellite/poes (National Centers for Environmental Information, 2022). OMNI data are available at https://omniweb.gsfc.nasa.gov/form/dx1.html (NASA Goddard Space Flight Centre, 2022). The SYM-H index can be found at http://wdc.kugi.kyoto-u.ac.jp/aeasy/index.html (World Data Center for Geomagnetism, 2022). The SuperMAG electrojet index SME is available from https://supermag.jhuapl.edu/indices/ (Gjerloev, 2022). MLS data can be accessed at https://acdisc.gesdisc.eosdis.nasa.gov/data/Aura_MLS_Level2/ML2HNO3.004/ (NASA Earth Observing System Data and Information System, 2022). MIPAS data are available from https://www.imk-asf.kit.edu/english/308.php (Institute of Meteorology and Climate Research, 2022). AARDDVARK data can be accessed via http://psddb.nerc-bas.ac.uk/data/access/ (British Antarctic Survey Data Access System, 2022).
IM, MS, GB, VM, ER and TS discussed the idea and wrote the paper. GB and VM were responsible for the balloon measurements and spectra retrieval. GB, IM and VM led the EEP events selection. IM calculated the ionization rates. MS worked on the code and simulation results for the ExoTIC ion chemistry model. ER and TS worked on the code and simulation results for the HAMMONIA chemistry–climate model. GB prepared and analyzed the POES data. IM and VM analyzed the geomagnetic indexes. MS and BF prepared and analyzed the MIPAS data. IM and MLS prepared and analyzed the MLS data. MC and TU prepared and analyzed the VLF data. All authors discussed the results and commented on the paper.
At least one of the (co-)authors is a member of the editorial board of Atmospheric Chemistry and Physics. The peer-review process was guided by an independent editor, and the authors also have no other competing interests to declare.
Publisher’s note: Copernicus Publications remains neutral with regard to jurisdictional claims in published maps and institutional affiliations.
This work has been done in the frame of the German–Russian cooperation project, H-EPIC. Work at the Jet Propulsion Laboratory, California Institute of Technology, was carried out under a contract with the National Aeronautics and Space Administration. Extreme EEP event selection, ionization rates calculation and numerical experiments with HAMMONIA model was done in the frame of the Russian Science Foundation grant. Analysis of MLS data and numerical experiment results were done in the SPBU Ozone Layer and Upper Atmosphere Research Laboratory, supported by the Ministry of Science and Higher Education of the Russian Federation.
This research has been supported by the Russian Foundation for Basic Research (grant no. 20-55-12020), the Deutsche Forschungsgemeinschaft (grant no. SI 1088/7-1), the Russian Science Foundation (grant no. 20-67-46016) and the Ministry of Science and Higher Education of the Russian Federation (grant no. 075-15-2021-583).
The article processing charges for this open-access publication were covered by the Karlsruhe Institute of Technology (KIT).
This paper was edited by William Ward and reviewed by two anonymous referees.
Abel, B. and Thorne, R. M.: Electron scattering loss in Earth's inner magnetosphere 1. Dominant physical processes, J. Geophys. Res., 103, 2385–2396, https://doi.org/10.1029/97JA02919, 1998. a
Andersson, M. E., Verronen, P. T., Rodger, C. J., Clilverd, M. A., and Seppälä, A.: Missing driver in the Sun-Earth connection from energetic electron precipitation impacts mesospheric ozone, Nat. Commun., 5, 5197, https://doi.org/10.1038/ncomms6197, 2014. a
Aplin, K. L., Marlton, G. J., and Race, V.: Stratospheric X-Rays Detected at Midlatitudes With a Miniaturized Balloon-Borne Microscintillator-PiN Diode System, Space Weather, 19, e02809, https://doi.org/10.1029/2021SW002809, 2021. a
Arsenovic, P., Rozanov, E., Stenke, A., Funke, B., Wissing, J. M., Mursula, K., Tummon, F., and Peter, T.: The influence of Middle Range Energy Electrons on atmospheric chemistry and regional climate, J. Atmos. Sol.-Terr. Phys., 149, 180–190, https://doi.org/10.1016/j.jastp.2016.04.008, 2016. a, b
Baker, D. N., Jaynes, A. N., Hoxie, V. C., Thorne, R. M., Foster, J. C., Li, X., Fennell, J. F., Wygant, J. R., Kanekal, S. G., Erickson, P. J., Kurth, W., Li, W., Ma, Q., Schiller, Q., Blum, L., Malaspina, D. M., Gerrard, A., and Lanzerotti, L. J.: An impenetrable barrier to ultrarelativistic electrons in the Van Allen radiation belts, Nature, 515, 531–534, https://doi.org/10.1038/nature13956, 2014. a
Bazilevskaya, G. A., Kalinin, M. S., Krainev, M. B., Makhmutov, V. S., Stozhkov, Y. I., Svirzhevskaya, A. K., Svirzhevsky, N. S., and Gvozdevsky, B. B.: Temporal Characteristics of Energetic Magnetospheric Electron Precipitation as Observed During Long-Term Balloon Observations, J. Geophys. Res.-Space, 125, e28033, https://doi.org/10.1029/2020JA028033, 2020. a
Bergin, A., Chapman, S. C., and Gjerloev, J. W.: AE, Dst, and Their SuperMAG Counterparts: The Effect of Improved Spatial Resolution in Geomagnetic Indices, J. Geophys. Res.-Space, 125, e27828, https://doi.org/10.1029/2020JA027828, 2020. a
British Antarctic Survey Data Access System: http://psddb.nerc-bas.ac.uk/data/access/, last access: 18 May 2022.
Clilverd, M. A., Rodger, C. J., Thomson, N. R., Brundell, J. B., Ulich, T., Lichtenberger, J., Cobbett, N., Collier, A. B., Menk, F. W., Seppälä, A., Verronen, P. T., and Turunen, E.: Remote sensing space weather events: Antarctic-Arctic Radiation-belt (Dynamic) Deposition-VLF Atmospheric Research Konsortium network, Space Weather, 7, 04001, https://doi.org/10.1029/2008SW000412, 2009. a, b
Dungey, J. W.: Interplanetary Magnetic Field and the Auroral Zones, Phys. Rev. Lett., 6, 47–48, https://doi.org/10.1103/PhysRevLett.6.47, 1961. a
Fischer, H., Birk, M., Blom, C., Carli, B., Carlotti, M., von Clarmann, T., Delbouille, L., Dudhia, A., Ehhalt, D., Endemann, M., Flaud, J. M., Gessner, R., Kleinert, A., Koopman, R., Langen, J., López-Puertas, M., Mosner, P., Nett, H., Oelhaf, H., Perron, G., Remedios, J., Ridolfi, M., Stiller, G., and Zander, R.: MIPAS: an instrument for atmospheric and climate research, Atmos. Chem. Phys., 8, 2151–2188, https://doi.org/10.5194/acp-8-2151-2008, 2008. a
Foster, J. C., Erickson, P. J., Baker, D. N., Jaynes, A. N., Mishin, E. V., Fennel, J. F., Li, X., Henderson, M. G., and Kanekal, S. G.: Observations of the impenetrable barrier, the plasmapause, and the VLF bubble during the 17 March 2015 storm, J. Geophys. Res.-Space, 121, 5537–5548, https://doi.org/10.1002/2016JA022509, 2016. a, b
Frolov, V. L., Akchurin, A. D., Bolotin, I. A., Ryabov, A. O., Berthelier, J. J., and Parrot, M.: Precipitation of Energetic Electrons from the Earth's Radiation Belt Stimulated by High-Power HF Radio Waves for Modification of the Midlatitude Ionosphere, Radiophys. Quantum El., 62, 571–590, https://doi.org/10.1007/s11141-020-10004-4, 2020. a
Funke, B., López-Puertas, M., Stiller, G. P., and von Clarmann, T.: Mesospheric and stratospheric NOy produced by energetic particle precipitation during 2002-2012, J. Geophys. Res.-Atmos., 119, 4429–4446, https://doi.org/10.1002/2013JD021404, 2014. a, b
Gjerloev, J. W.: Magnetic Indices, SuperMag, https://supermag.jhuapl.edu/indices/, last access: 18 May 2022.
Gombosi, T. I., Baker, D. N., Balogh, A., Erickson, P. J., Huba, J. D., and Lanzerotti, L. J.: Anthropogenic Space Weather, Space Sci. Rev., 212, 985–1039, https://doi.org/10.1007/s11214-017-0357-5, 2017. a
Gonzalez, W. D., Joselyn, J. A., Kamide, Y., Kroehl, H. W., Rostoker, G., Tsurutani, B. T., and Vasyliunas, V. M.: What is a geomagnetic storm?, J. Geophys. Res., 99, 5771–5792, https://doi.org/10.1029/93JA02867, 1994. a
Herbst, K., Grenfell, J. L., Sinnhuber, M., Rauer, H., Heber, B., Banjac, S., Scheucher, M., Schmidt, V., Gebauer, S., Lehmann, R., and Schreier, F.: A new model suite to determine the influence of cosmic rays on (exo)planetary atmospheric biosignatures. Validation based on modern Earth, Astron. Astrophys., 631, A101, https://doi.org/10.1051/0004-6361/201935888, 2019. a, b, c
Horne, R. B., Thorne, R. M., Shprits, Y. Y., Meredith, N. P., Glauert, S. A., Smith, A. J., Kanekal, S. G., Baker, D. N., Engebretson, M. J., Posch, J. L., Spasojevic, M., Inan, U. S., Pickett, J. S., and Decreau, P. M. E.: Wave acceleration of electrons in the Van Allen radiation belts, Nature, 437, 227–230, https://doi.org/10.1038/nature03939, 2005. a
Institute of Meteorology and Climate Research – Atmospheric Trace Gases and Remote Sensing: IMK/IAA generated MIPAS/ENVISAT data, Karlsruhe Institute of Technology [data set], https://www.imk-asf.kit.edu/english/308.php, last access: 18 May 2022.
Jackman, C. H., Deland, M. T., Labow, G. J., Fleming, E. L., Weisenstein, D. K., Ko, M. K. W., Sinnhuber, M., and Russell, J. M.: Neutral atmospheric influences of the solar proton events in October-November 2003, J. Geophys. Res.-Space, 110, A09S27, https://doi.org/10.1029/2004JA010888, 2005. a, b
Jackman, C. H., Marsh, D. R., Vitt, F. M., Roble, R. G., Randall, C. E., Bernath, P. F., Funke, B., López-Puertas, M., Versick, S., Stiller, G. P., Tylka, A. J., and Fleming, E. L.: Northern Hemisphere atmospheric influence of the solar proton events and ground level enhancement in January 2005, Atmos. Chem. Phys., 11, 6153–6166, https://doi.org/10.5194/acp-11-6153-2011, 2011. a
Kieser, J.: The influence of precipitating solar and magnetospheric energetic charged particles on the entire atmosphere Simulations with HAMMONIA, PhD Thesis, University of Hamburg, Hamburg, https://doi.org/10.17617/2.1212560, 2011. a
King, J. H. and Papitashvili, N. E.: Solar wind spatial scales in and comparisons of hourly Wind and ACE plasma and magnetic field data, J. Geophys. Res.-Space, 110, A02104, https://doi.org/10.1029/2004JA010649, 2005. a
Kinnison, D. E., Brasseur, G. P., Walters, S., Garcia, R. R., Marsh, D. R., Sassi, F., Harvey, V. L., Randall, C. E., Emmons, L., Lamarque, J. F., Hess, P., Orlando, J. J., Tie, X. X., Randel, W., Pan, L. L., Gettelman, A., Granier, C., Diehl, T., Niemeier, U., and Simmons, A. J.: Sensitivity of chemical tracers to meteorological parameters in the MOZART-3 chemical transport model, J. Geophys. Res.-Atmos., 112, D20302, https://doi.org/10.1029/2006JD007879, 2007. a
Livesey, N. J., Read, W. G., Wagner, P. A., Froidevaux, L., Lambert, A., Manney, G. L., Fuller, R. A., Jarnot, R. F., Knosp, B. W., and Lay, R. R.: EOS MLS version 5.0x Level 2 and 3 data quality and description document, Jet Propulsion Laboratory, Tech. Rep. JPL D-105336 Rev. A, https://mls.jpl.nasa.gov/data/v5-0_data_quality_document.pdf (last access: 18 May 2022), 2020. a
Makhmutov, V. S., Bazilevskaya, G. A., Stozhkov, Y. I., Svirzhevskaya, A. K., and Svirzhevsky, N. S.: Catalogue of electron precipitation events as observed in the long-duration cosmic ray balloon experiment, J. Atmos. Sol.-Terr. Phys., 149, 258–276, https://doi.org/10.1016/j.jastp.2015.12.006, 2016. a, b
Meraner, K., Schmidt, H., Manzini, E., Funke, B., and Gardini, A.: Sensitivity of simulated mesospheric transport of nitrogen oxides to parameterized gravity waves, J. Geophys. Res.-Atmos., 121, 12045–12061, https://doi.org/10.1002/2016JD025012, 2016. a, b, c
Millan, R. M. and Thorne, R. M.: Review of radiation belt relativistic electron losses, J. Atmos. Sol.-Terr. Phys., 69, 362–377, https://doi.org/10.1016/j.jastp.2006.06.019, 2007. a, b
Mironova, I., Bazilevskaya, G., Kovaltsov, G., Artamonov, A., Rozanov, E., Mishev, A., Makhmutov, V., Karagodin, A., and Golubenko, K.: Spectra of high energy electron precipitation and atmospheric ionization rates retrieval from balloon measurements, Sci. Total Environ., 693, 133242, https://doi.org/10.1016/j.scitotenv.2019.07.048, 2019a. a, b
Mironova, I., Karagodin-Doyennel, A., and Rozanov, E.: The effect of Forbush decreases on the polar-night HOx concentration affecting stratospheric ozone, Front. Earth Sci., 8, 669, https://doi.org/10.3389/feart.2020.618583, 2021a. a
Mironova, I., Kovaltsov, G., Mishev, A., and Artamonov, A.: Ionization in the Earth's Atmosphere Due to Isotropic Energetic Electron Precipitation: Ion Production and Primary Electron Spectra, Remote Sens., 13, 4161, https://doi.org/10.3390/rs13204161, 2021b. a
Mironova, I. A., Aplin, K. L., Arnold, F., Bazilevskaya, G. A., Harrison, R. G., Krivolutsky, A. A., Nicoll, K. A., Rozanov, E. V., Turunen, E., and Usoskin, I. G.: Energetic Particle Influence on the Earth's Atmosphere, Space Sci. Rev., https://doi.org/10.1007/s11214-015-0185-4, 2015. a, b
Mironova, I. A., Artamonov, A. A., Bazilevskaya, G. A., Rozanov, E. V., Kovaltsov, G. A., Makhmutov, V. S., Mishev, A. L., and Karagodin, A. V.: Ionization of the Polar Atmosphere by Energetic Electron Precipitation Retrieved From Balloon Measurements, Geophys. Res. Lett., 46, 990–996, https://doi.org/10.1029/2018GL079421, 2019b. a, b
National Centers for Environmental Information: NOAA/POES Space Environment Monitor, NOAA [data set], http://www.ngdc.noaa.gov/stp/satellite/poes, last access: 18 May 2022.
NASA Earth Observing System Data and Information System: MLS/Aura data, NASA [data set], https://acdisc.gesdisc.eosdis.nasa.gov/data/Aura_MLS_Level2/ML2HNO3.004, last access: 18 May 2022.
NASA Goddard Space Flight Centre: Interface to produce plots, listings or output files from OMNI 2, Magnetic field, Plasma, Energetic particle data relevant to heliospheric studies, https://omniweb.gsfc.nasa.gov/form/dx1.html, last access 18 May 2022.
Newnham, D. A., Espy, P. J., Clilverd, M. A., Rodger, C. J., Seppälä, A., Maxfield, D. J., Hartogh, P., Holmén, K., and Horne, R. B.: Direct observations of nitric oxide produced by energetic electron precipitation into the Antarctic middle atmosphere, Geophys. Res. Lett., 38, L20104, https://doi.org/10.1029/2011GL048666, 2011. a
Newnham, D. A., Espy, P. J., Clilverd, M. A., Rodger, C. J., Seppälä, A., Maxfield, D. J., Hartogh, P., Straub, C., Holmén, K., and Horne, R. B.: Observations of nitric oxide in the Antarctic middle atmosphere during recurrent geomagnetic storms, J. Geophys. Res.-Space, 118, 7874–7885, https://doi.org/10.1002/2013JA019056, 2013. a
Nieder, H., Winkler, H., Marsh, D. R., and Sinnhuber, M.: NOx production due to energetic particle precipitation in the MLT region: Results from ion chemistry model studies, J. Geophys. Res.-Space, 119, 2137–2148, https://doi.org/10.1002/2013JA019044, 2014. a
Randall, C. E., Harvey, V. L., Singleton, C. S., Bernath, P. F., Boone, C. D., and Kozyra, J. U.: Enhanced NOx in 2006 linked to strong upper stratospheric Arctic vortex, Geophys. Res. Lett., 33, L18811, https://doi.org/10.1029/2006GL027160, 2006. a
Rodger, C. J., Clilverd, M. A., Kavanagh, A. J., Watt, C. E. J., Verronen, P. T., and Raita, T.: Contrasting the responses of three different ground-based instruments to energetic electron precipitation, Radio Sci., 47, RS2021, https://doi.org/10.1029/2011RS004971, 2012. a
Roeckner, E., Brokopf, R., Esch, M., Giorgetta, M., Hagemann, S., Kornblueh, L., Manzini, E., Schlese, U., and Schulzweida, U.: Sensitivity of Simulated Climate to Horizontal and Vertical Resolution in the ECHAM5 Atmosphere Model, J. Climate, 19, 3771, https://doi.org/10.1175/JCLI3824.1, 2006. a
Rozanov, E., Calisto, M., Egorova, T., Peter, T., and Schmutz, W.: Influence of the Precipitating Energetic Particles on Atmospheric Chemistry and Climate, Surv. Geophys., 33, 483–501, https://doi.org/10.1007/s10712-012-9192-0, 2012. a
Schmidt, H., Brasseur, G. P., Charron, M., Manzini, E., Giorgetta, M. A., Diehl, T., Fomichev, V. I., Kinnison, D., Marsh, D., and Walters, S.: The HAMMONIA Chemistry Climate Model: Sensitivity of the Mesopause Region to the 11-Year Solar Cycle and CO2 Doubling, J. Climate, 19, 3903, https://doi.org/10.1175/JCLI3829.1, 2006. a, b, c
Selesnick, R. S., Tu, W., Yando, K., Millan, R. M., and Redmon, R. J.: POES/MEPED Angular Response Functions and the Precipitating Radiation Belt Electron Flux, J. Geophys. Res.-Space, 125, e28240, https://doi.org/10.1029/2020JA028240, 2020. a
Seppälä, A., Randall, C. E., Clilverd, M. A., Rozanov, E., and Rodger, C. J.: Geomagnetic activity and polar surface air temperature variability, J. Geophys. Res.-Space, 114, A10312, https://doi.org/10.1029/2008JA014029, 2009. a
Sinnhuber, M. and Funke, B.: Energetic electron precipitation into the atmosphere, in: The Dynamic Loss of Earth's Radiation Belts, 1st edn., edited by: Jaynes, A. N. and Usanova, M. E., Elsevier, 279–321, https://doi.org/10.1016/C2016-0-04771-X, 2019. a, b, c
Sinnhuber, M., Nieder, H., and Wieters, N.: Energetic Particle Precipitation and the Chemistry of the Mesosphere/Lower Thermosphere, Surv. Geophys., 33, 1281–1334, https://doi.org/10.1007/s10712-012-9201-3, 2012. a, b
Sinnhuber, M., Friederich, F., Bender, S., and Burrows, J. P.: The response of mesospheric NO to geomagnetic forcing in 2002–2012 as seen by SCIAMACHY, J. Geophys. Res.-Space, 121, 3603–3620, https://doi.org/10.1002/2015JA022284, 2016. a
Sinnhuber, M., Berger, U., Funke, B., Nieder, H., Reddmann, T., Stiller, G., Versick, S., von Clarmann, T., and Wissing, J. M.: NOy production, ozone loss and changes in net radiative heating due to energetic particle precipitation in 2002–2010, Atmos. Chem. Phys., 18, 1115–1147, https://doi.org/10.5194/acp-18-1115-2018, 2018. a
Solar and Cosmic Ray Physics Laboratory (Lebedev Physical Institute of the Russian Academy of Sciences): Study of precipitation of relativistic electrons, Lebedev, https://sites.lebedev.ru/ru/sites/DNS_FIAN/479.html, last access: 18 May 2022.
Stozhkov, Y. I., Svirzhevsky, N. S., Bazilevskaya, G. A., Kvashnin, A. N., Makhmutov, V. S., and Svirzhevskaya, A. K.: Long-term (50 years) measurements of cosmic ray fluxes in the atmosphere, Adv. Space Res., 44, 1124–1137, https://doi.org/10.1016/j.asr.2008.10.038, 2009. a
Su, Z., Gao, Z., Zheng, H., Wang, Y., Wang, S., Spence, H. E., Reeves, G. D., Baker, D. N., and Wygant, J. R.: Rapid Loss of Radiation Belt Relativistic Electrons by EMIC Waves, J. Geophys. Res.-Space, 122, 9880–9897, https://doi.org/10.1002/2017JA024169, 2017. a
Thomson, N. R., Rodger, C. J., and Clilverd, M. A.: Large solar flares and their ionospheric D region enhancements, J. Geophys. Res.-Space, 110, A06306, https://doi.org/10.1029/2005JA011008, 2005. a
Tsurutani, B. T. and Meng, C. I.: Interplanetary magnetic-field variations and substorm activity, J. Geophys. Res., 77, 2964, https://doi.org/10.1029/JA077i016p02964, 1972. a
Tsurutani, B. T., Gould, T., Goldstein, B. E., Gonzalez, W. D., and Sugiura, M.: Interplanetary Alfvén waves and auroral (substorm) activity: IMP 8, J. Geophys. Res., 95, 2241–2252, https://doi.org/10.1029/JA095iA03p02241, 1990. a
Tsurutani, B. T., Horne, R. B., Pickett, J. S., Santolik, O., Schriver, D., and Verkhoglyadova, O. P.: Introduction to the special section on Chorus: Chorus and its role in space weather, J. Geophys. Res.-Space, 115, A00F01, https://doi.org/10.1029/2010JA015870, 2010. a
Tsurutani, B. T., Hajra, R., Tanimori, T., Takada, A., Bhanu, R., Mannucci, A. J., Lakhina, G. S., Kozyra, J. U., Shiokawa, K., Lee, L. C., Echer, E., Reddy, R. V., and Gonzalez, W. D.: Heliospheric plasma sheet (HPS) impingement onto the magnetosphere as a cause of relativistic electron dropouts (REDs) via coherent EMIC wave scattering with possible consequences for climate change mechanisms, J. Geophys. Res.-Space, 121, 10130–10156, https://doi.org/10.1002/2016JA022499, 2016. a, b
Tsurutani, B. T., Park, S. A., Falkowski, B. J., Bortnik, J., Lakhina, G. S., Sen, A., Pickett, J. S., Hajra, R., Parrot, M., and Henri, P.: Low Frequency (f<200 Hz) Polar Plasmaspheric Hiss: Coherent and Intense, J. Geophys. Res.-Space, 124, 10063–10084, https://doi.org/10.1029/2019JA027102, 2019. a
Verronen, P. T., Andersson, M. E., Marsh, D. R., Kovács, T., and Plane, J. M. C.: WACCM-D – Whole Atmosphere Community Climate Model with D-region ion chemistry, J. Adv. Model Earth. Sy., 8, 954–975, https://doi.org/10.1002/2015MS000592, 2016. a
Waters, J. W., Froidevaux, L., Harwood, R. S., Jarnot, R. F., Pickett, H. M., Read, W. G., Siegel, P. H., Cofield, R. E., Filipiak, M. J., Flower, D. A., Holden, J. R., Lau, G. K., Livesey, N. J., Manney, G. L., Pumphrey, H. C., Santee, M. L., Wu, D. L., Cuddy, D. T., Lay, R. R., Loo, M. S., Perun, V. S., Schwartz, M. J., Stek, P. C., Thurstans, R. P., Boyles, M. A., Chandra, K. M., Chavez, M. C., Chen, G. S., Chudasama, B. V., Dodge, R., Fuller, R. A., Girard, M. A., Jiang, J. H., Jiang, Y., Knosp, B. W., Labelle, R. C., Lam, J. C., Lee, A. K., Miller, D., Oswald, J. E., Patel, N. C., Pukala, D. M., Quintero, O., Scaff, D. M., Vansnyder, W., Tope, M. C., Wagner, P. A., and Walch, M. J.: The Earth Observing System Microwave Limb Sounder (EOS MLS) on the Aura Satellite, IEEE Trans. Geosci. Remote Sens., 44, 1075–1092, https://doi.org/10.1109/TGRS.2006.873771, 2006. a, b
Winkler, H., Kazeminejad, S., Sinnhuber, M., Kallenrode, M. B., and Notholt, J.: Conversion of mesospheric HCl into active chlorine during the solar proton event in July 2000 in the northern polar region, J. Geophys. Res.-Atmos., 114, D00I03, https://doi.org/10.1029/2008JD011587, 2009. a
Wissing, J. M. and Kallenrode, M. B.: Atmospheric Ionization Module Osnabrück (AIMOS): A 3-D model to determine atmospheric ionization by energetic charged particles from different populations, J. Geophys. Res.-Space, 114, A06104, https://doi.org/10.1029/2008JA013884, 2009. a, b
World Data Center for Geomagnetism: Plot and data output of ASY/SYM and AE indices, Kyoto University, https://wdc.kugi.kyoto-u.ac.jp/aeasy/index.html, last access: 18 May 2022.
Zhao, S., Zhou, C., Shen, X., and Zhima, Z.: Investigation of VLF Transmitter Signals in the Ionosphere by ZH-1 Observations and Full-Wave Simulation, J. Geophys. Res.-Space, 124, 4697–4709, https://doi.org/10.1029/2019JA026593, 2019. a
- Abstract
- Introduction
- Observations of middle latitude electron precipitation
- Observations of atmospheric response during the disturbed period
- Model studies: potential impact of the midlatitude electron precipitation event on mesospheric ozone
- Discussion and conclusions
- Code availability
- Data availability
- Author contributions
- Competing interests
- Disclaimer
- Acknowledgements
- Financial support
- Review statement
- References