the Creative Commons Attribution 4.0 License.
the Creative Commons Attribution 4.0 License.
 | 23 May 2022
A global view on stratospheric ice clouds: assessment of processes related to their occurrence based on satellite observations
Ling Zou
Sabine Griessbach
Lars Hoffmann
Reinhold Spang
Ice clouds play an important role in regulating water vapor and influencing the radiative budget in the atmosphere. This study investigates stratospheric ice clouds (SICs) in the latitude range between based on the Cloud–Aerosol Lidar and Infrared Pathfinder Satellite Observations (CALIPSO). As polar stratospheric clouds include other particles, they are not discussed in this work. Tropopause temperature, double tropopauses, clouds in the upper troposphere and lower stratosphere (UTLS), gravity waves, and stratospheric aerosols are analyzed to investigate their relationships with the occurrence of and variability in SICs in the tropics and at midlatitudes.
We found that SICs with cloud-top heights of 250 m above the first lapse rate tropopause are mainly detected in the tropics. Monthly time series of SICs from 2007 to 2019 show that high occurrence frequencies of SICs follow the Intertropical Convergence Zone (ITCZ) over time in the tropics and that SICs vary interannually at different latitudes. Results show that SICs associated with double tropopauses, which are related to poleward isentropic transport, are mostly found at midlatitudes. More than 80 % of the SICs around 30∘ N/S are associated with double tropopauses.
Correlation coefficients of SICs and all the other abovementioned processes confirm that the occurrence of and variability in SICs are mainly associated with the tropopause temperature in the tropics and at midlatitudes. UTLS clouds, which are retrieved from the Atmospheric Infrared Sounder (AIRS) and used as a proxy for deep convection in the tropics and high-altitude ice cloud sources at midlatitudes, have the highest correlations with SICs in the monsoon regions and the central United States. Gravity waves are mostly related to SICs at midlatitudes, especially over Patagonia and the Drake Passage. However, the second-highest correlation coefficients show that the cold tropopause temperature, the occurrence of double tropopauses, high stratospheric aerosol loading, frequent UTLS clouds, and gravity waves are highly correlated with the SICs locally. The long-term anomaly analyses show that interannual anomalies of SICs are correlated with the tropopause temperature and stratospheric aerosols instead of the UTLS clouds and gravity waves.
The overlapping and similar correlation coefficients between SICs and all processes mentioned above indicate strong associations between those processes themselves. Due to their high inherent correlations, it is challenging to disentangle and evaluate their contributions to the occurrence of SICs on a global scale. However, the correlation coefficient analyses between SICs and all abovementioned processes (tropopause temperature, double tropopauses, clouds in the upper troposphere and lower stratosphere (UTLS), gravity waves, and stratospheric aerosols) in this study help us better understand the sources of SICs on a global scale.
- Article
(20462 KB) - Full-text XML
- BibTeX
- EndNote


Stratospheric ice clouds (SICs) play an important role in regulating the water vapor in the upper troposphere and lower stratosphere (UTLS), i.e., ice cloud formation and sedimentation may dehydrate the UTLS (Jensen and Pfister, 2004; Schoeberl and Dessler, 2011; Schoeberl et al., 2019), while the injection of convective clouds and sublimation of ice in the lower stratosphere would hydrate the stratosphere (Dinh et al., 2012; Jain et al., 2013; Avery et al., 2017). Ice clouds in the UTLS region produce net radiative heating by trapping outgoing longwave radiation (Zhou et al., 2014; Lolli et al., 2018). SICs are also important indicators for understanding the vertical temperature structure in the UTLS, transport between the troposphere and stratosphere, and the intensity and dynamics of deep convection better (Liou, 1986; Corti et al., 2006; Mace et al., 2006; Jensen et al., 2011; Kärcher, 2017). Therefore, understanding the micro- and macrophysical properties of SICs is of importance for global atmospheric modeling and future climate prediction.
Global occurrence of ice clouds in the UTLS is about 20 %– 40 % over the world (Liou, 1986; Wylie et al., 1994, 2005). The earliest discoveries of stratospheric ice clouds were reported in Murgatroyd and Goldsmith (1956) and Clodman (1957) from in situ observations. Since then, more and more studies demonstrated the existence of SICs from in situ measurements, satellite measurements, and ground-based lidar observations (Wang et al., 1996; Keckhut et al., 2005; De Reus et al., 2009; Dessler, 2009; Bartolome Garcia et al., 2021). On a global scale, the worldwide distribution of SICs is detected from Cloud–Aerosol Lidar and Infrared Pathfinder Satellite Observations (CALIPSO) measurements (Pan and Munchak, 2011; Zou et al., 2020). More SICs are observed over the tropics than at midlatitudes. The SICs are more often distributed over tropical continents with occurrence frequencies as large as 24 % to 36 %. It is critical to have a better understanding of the potential formation mechanisms and maintenance of ice clouds in the UTLS.
Temperature, atmospheric aerosol particles, and water vapor are important factors for the formation of ice clouds (Holton and Gettelman, 2001; Pruppacher et al., 1998; Cziczo et al., 2013). The variability in vertical velocities caused by convective systems and gravity waves, which could induce temperature fluctuation and transport atmospheric aerosols, also plays a crucial role in affecting the formation and distribution of ice clouds (Massie et al., 2002; Kärcher and Ström, 2003; Podglajen et al., 2018).
Cold temperatures, and temperature fluctuations caused by gravity waves and wave breaking, have a significant impact on the occurrence of ice clouds (Schoeberl et al., 2015; Jensen et al., 2016; Wang et al., 2016). SICs lasting 5 d observed at 18.6 km over Gadanki, India, in March 2014 were found to be produced by wave-induced cold temperatures (Sandhya et al., 2015). Over the tropics, approximately 80 % of the cirrus clouds at an altitude above 14.5 km were detected in the cold phase of gravity waves and a wave-induced air parcel cooling process (Chang and L'Ecuyer, 2020). Another study showed that low temperatures excited by an extra-tropical intrusion also produced a large-scale cirrus cloud over the eastern Pacific (Taylor et al., 2011).
Convective systems form ice clouds directly from anvil outflow and indirectly from updrafts and wave-induced cooling (Homeyer et al., 2017). Deep convection was responsible for 47 % of the cirrus clouds observed at 10–15 km on Manus Island in 1999 (Mace et al., 2006). During the Deep Convective Clouds and Chemistry (DC3) experiment, cirrus observed at altitudes of 1–2 km above the tropopause evolved from enhanced deep convection over the continental United States in May–June 2012 (Homeyer et al., 2014).
Uplifted aerosol particles, such as sulfate aerosol, organic aerosol, and dust from volcanic eruptions or biomass burning, are effective ice nuclei for cirrus cloud formation and variation (Lee and Penner, 2010; Jensen et al., 2010; Froyd et al., 2010; Cziczo et al., 2013). For example, the ice crystal numbers were found to increase maximally by 50 % in the tropics after the Mount Pinatubo eruption by the ECHAM4 general circulation model in a scenario of aerosol number concentrations rising by 10–25 cm−3 (Lohmann et al., 2003). Major wildfire events in July and August 2019 were the origin of 30 km high cloud and aerosol layers in the Northern Hemisphere (Ohneiser et al., 2021).
Moreover, the flow of moist air from the tropical upper troposphere to the extra-tropical stratosphere at isentropic levels is important for the occurrence of SICs. Based on Cryogenic Infrared Spectrometers and Telescopes for the Atmosphere (CRISTA) measurements in August 1997, the quasi-isentropic transport of high-humidity air was found to be a source for the occurrence of SICs over northern middle and high latitudes (Spang et al., 2015).
The individual and combined effects of the above-stated factors and processes, i.e., atmospheric temperature, atmospheric aerosols, atmospheric processes including convection systems, gravity waves, and isentropic transport, are significantly influencing the formation and evolution of ice clouds (Haag and Kärcher, 2004; Homeyer et al., 2017; Schoeberl et al., 2015; Jensen et al., 2016). However, studies on the potential formation mechanisms of high-altitude ice clouds have typically been constrained by short-term observations with a particular focus and mainly over small regions or in specific cases. A global study of the relationship between the occurrence of SICs and these processes will contribute to a better understanding of the formation of and variability in SICs.
The objectives of this study are to (1) examine the distribution and long-term variation in stratospheric ice clouds and (2) investigate potential effects of atmospheric temperature, stratospheric aerosols, UTLS clouds, and gravity waves on the occurrence and distribution of SICs on a global scale. The individual relationships between SICs and different processes were evaluated globally. In Sect. 2, we give information on data sources and detection methods for SICs, stratospheric aerosol, UTLS clouds, and gravity waves. Section 3 presents the global SICs and relationship analyses between SICs and double tropopause, tropopause temperature, UTLS clouds, gravity waves, and stratospheric aerosols. Section 4 discusses the data uncertainties and relationship uncertainties between SICs and abovementioned processes. Conclusions are presented in Sect. 5.
2.1 Tropopause data from the ERA5 reanalysis
The first lapse rate tropopause (LRT1) is determined based on the World Meteorological Organization (WMO) definition (WMO, 1957) as being the lowest level at which the lapse rate decreases to 2 K km−1 or lower, provided the average lapse rate between this level and all higher levels within 2 km does not exceed 2 K km−1. If the average lapse rate at any level and at all higher levels within 1 km exceeds 3 K km−1 above the LRT1, then the second tropopause (LRT2) is defined by the same criterion as the first tropopause. The first thermal tropopause is a globally applicable tropopause definition to identify the transition between the troposphere and stratosphere (Munchak and Pan, 2014; Xian and Homeyer, 2019). Therefore, thermal tropopauses (LRT1 and LRT2) are analyzed in this work to identify stratospheric ice clouds on a global scale.
Tropopause heights are derived from the fifth generation European Centre for Medium-Range Weather Forecasts (ECMWF) reanalysis – ERA5, which is produced using 4-dimensional variational assimilation (4D-Var) data and model forecasts in CY41R2 of the ECMWF Integrated Forecast System (IFS; Hersbach et al., 2020). ERA5 provides hourly high-resolution data from 1979 to the present, with a horizontal grid resolution of 0.3∘ and 137 hybrid sigma/pressure levels vertically from the surface to 0.01 hPa. The vertical resolution of ERA5 data is about 300–360 m around the first tropopause level at the altitude range from 8 to 17 km. In our study, the vertical resolution of tropopause heights is improved by interpolating the ERA5 data to a much finer vertical grid with a cubic spline interpolation method (Hoffmann and Spang, 2022).
Tegtmeier et al. (2020a) found that LRT1 height differences between ERA5 and Global Navigation Satellite System Radio Occultation (GNSS-RO) observations are less than 200 m in the tropics. Based on USA high vertical resolution radiosonde data (HVRRD) data and coarser-resolution global positioning system (GPS) data, Hoffmann and Spang (2022) also showed that the uncertainty of the LRT1 heights of ERA5 is in the range of ±200 m at different latitudes. Therefore, a height difference of 250 m with respect to the tropopause is used as a threshold for ERA5 data to identify stratospheric ice clouds in this study. One should keep in mind that gravity waves and deep convection are generally important factors influencing the height of and variability in the tropopause (Sherwood et al., 2003; de la Torre et al., 2004; Hoffmann and Spang, 2022).
2.2 Stratospheric ice clouds and stratospheric aerosols from CALIPSO observations
The Cloud–Aerosol Lidar with Orthogonal Polarization (CALIOP), which is a dual-wavelength polarization-sensitive lidar instrument loaded on the CALIPSO satellite, has probed high-resolution vertical structures and properties of thin clouds and aerosols on a near-global scale since June 2006 (Winker et al., 2007, 2009). CALIPSO equatorial crossing times are at 01:30 local time (LT) for the descending orbit and 13:30 LT for ascending orbit sections. The vertical resolution of CALIPSO observations varies as a function of altitude. It is 60 m in the altitude range from 8.2 to 20.2 km. In the horizontal, the profiles are averaged over 1 km along-track distance between 8.2 and 20.2 km in altitude.
Ice clouds and aerosol are extracted from the vertical feature mask data (CAL_LID_L2_VFMStandardV4) in this study. According to the cloud and aerosol subtype classifications determined by CALIPSO's cloud–aerosol discrimination (CAD) algorithm and the International Satellite Cloud Climatology Project (ISCCP) definitions, ice clouds in this work include both cirrus clouds and deep convective clouds. Aerosol includes dust, contaminated dust, and volcanic ash. Samples marked with a high feature-type quality (the absolute value of the CAD score is ≥70) are used to ensure high reliability of the data. Only nighttime data are investigated due to their higher signal-to-noise ratios and detection sensitivity (Getzewich et al., 2018; Gasparini et al., 2018).
The highest samples of clouds and aerosols in each vertical profile are extracted to identify stratospheric ice clouds (SICs) and stratospheric aerosols (SAs), whose top heights are at least 250 m above the LRT1 in ERA5. The occurrence frequency of SICs and SAs is defined as the ratio of SICSA detections to the total profile numbers in a specific region. In this study, analyses are limited to the tropics and midlatitudes () to avoid interferences with the polar stratospheric clouds (PSCs).
2.3 UTLS clouds, gravity waves, and SO2 in AIRS
The Atmospheric Infrared Sounder (AIRS; Aumann et al., 2003; Chahine et al., 2006) is carried by NASA's Aqua satellite. AIRS has the same equatorial crossing time as CALIPSO. AIRS measures the thermal emissions of atmospheric constituents in the nadir and sublimb viewing geometry. It has a total of 2378 spectral channels covering the spectral ranges of 3.74 to 4.61, 6.20 to 8.22, and 8.8 to 15.4 µm. The absolute accuracy of each spectral channel is better than 3 % over the full dynamic range from 190 to 325 K, and noise is less than 0.2 K at 250 K scene temperature (Aumann et al., 2000).
2.3.1 UTLS clouds
Aumann et al. (2006) and Aumann et al. (2011) retrieved deep convective clouds from AIRS at 8.1 µm (the 1231 cm−1 atmospheric window channel) in the tropics. The term “deep convective clouds” in their studies refers to clouds tops of thunderstorms in non-polar regions with a brightness temperature (BT) of less than 210 K. When the top of the anvil of thunderstorms has a brightness temperature of less than 210 K, the deep convective clouds are considered to reach the tropopause region in the tropics (Aumann et al., 2006). However, the threshold of 210 K is too low for midlatitude convective events (Hoffmann and Alexander, 2010), and a constant brightness temperature threshold for convective event detection may produce ambiguous results at different latitudes and seasons (Hoffmann et al., 2013).
In this study, temperature differences between AIRS brightness temperatures (BTAIRS) and tropopause temperatures (TTP) from ERA5 are employed to detect high-altitude clouds in the tropics and at midlatitudes. In the following, a threshold of +7 K above TTP,
was chosen to identify possible high-altitude clouds with tops in the upper troposphere and lower stratosphere, also referred to as UTLS clouds (Zou et al., 2021). In the tropics, most tropopause-reaching clouds with large optical thickness could be related to a deep convection origin (Gettelman et al., 2002; Tzella and Legras, 2011). At midlatitudes, high-altitude clouds could also be related to frontal systems (warm front uplifting), mesoscale convective systems, and mesoscale convective complexes, jet stream, mountain wave, and contrails (Field and Wood, 2007; Trier and Sharman, 2016; Trier et al., 2020). UTLS clouds are considered here as a proxy for deep convection in the tropics and other high-altitude ice cloud sources at midlatitudes.
The choice of the temperature threshold strongly influences the absolute values of the occurrence frequencies of the UTLS clouds but has no fundamental effect on the spatial and temporal patterns of UTLS clouds events (Zou et al., 2021). Similar to Hoffmann et al. (2013), monthly mean brightness temperatures at midlatitudes are applied to filter cases with low surface temperatures. Observations are removed if monthly mean brightness temperatures are below 250 K over regions with latitude >25∘ N/S.
Next to the occurrence frequencies, the event frequency is defined in this work as the ratio of the number of days on which UTLS clouds or SICs (≥1 detection) occur to the total number of days in a given time period over a given region. The event frequency helps overcome some of the limitations related to cloud geometries for UTLS clouds and SICs. The occurrence frequency of UTLS clouds, which is the ratio of profiles with UTLS clouds to the total profile number in a specific grid box (Appendix B), is not discussed in detail in this work.
2.3.2 Gravity waves
In this study, mean variances of detrended brightness temperatures in the 4.3 µm carbon dioxide waveband are used to identify stratospheric gravity waves from AIRS observations (Hoffmann and Alexander, 2010; Hoffmann et al., 2013). Measurements of 42 AIRS channels from 2322.6 to 2345.9 and 2352.5 to 2366.9 cm−1 are averaged to reduce noise and improve the detection sensitivity of the gravity wave observations. Even though the AIRS observations have the highest sensitivity at an altitude range of 30–40 km (Hoffmann et al., 2018), the averaged BT variance can provide gravity wave information for the lower stratosphere as gravity waves typically propagate upward from the tropospheric sources into the stratosphere. It is also important to keep in mind that, like most satellite instruments, AIRS is only capable of observing a specific part of the full wavelength spectrum of gravity waves. AIRS is most sensitive to short horizontal and long vertical wavelength waves (Ern et al., 2017; Meyer et al., 2018).
The observed BT variance is strongly dependent on both the gravity wave sources and the background winds in the stratosphere, and as events are highly intermittent in time, monthly or seasonal mean values can smooth the statistics. Instead of setting a variance threshold to identify gravity wave events (Hoffmann and Alexander, 2010; Zou et al., 2021), here we use mean BT variances directly as a proxy for gravity wave activity. A higher mean BT variance indicates a larger amplitude of the gravity waves. However, it is important to note that BT variances should not be confused with atmospheric temperature variances. The AIRS nadir observation geometry significantly reduces the sensitivity of the BT measurements compared to real atmospheric temperature fluctuations for short vertical wavelength waves. For the BT variances, the response to atmospheric temperature variances is near zero below 30 km of vertical wavelength and increases to about 50 % at 65 km of vertical wavelength Hoffmann et al. (2014a). With these measurement characteristics, AIRS is mostly sensitive to short horizontal and long vertical wavelengths waves, which are expected to propagate from the tropopause to the upper stratosphere within less than 1–2 h and horizontal propagation distances less than a few hundred kilometers. The AIRS BT measurements should be seen as a proxy of gravity wave activity.
2.3.3 Sulfur dioxide (SO2)
As brightness temperature differences are an effective method for detecting volcanic SO2 from AIRS observations (Hoffmann et al., 2014b, 2016), spectral features of SO2 at 1407.2 and 1371.5 cm−1 are used to calculate the SO2 index (SI), as follows:
The SI represents the SO2 column density from the midtroposphere to the stratosphere, where a high SI indicates a high SO2 column density. The SI is most sensitive to SO2 layers at an altitude range from 8 to 13 km, and an SI >4 K is most likely related to volcanic emissions (Hoffmann et al., 2014b). In this work, an SI threshold of 10 K is applied to detect strong explosive volcanic eruptions with injections into the UTLS region.
3.1 Global stratospheric ice clouds
Figure 1a–d present the global distribution and mean occurrence frequency of SICs from 2007 to 2019 in December–January–February (DJF), March–April–May (MAM), June–July–August (JJA), and September–October–November (SON). Similar to the results of previous studies (Pan and Munchak, 2011; Zou et al., 2020; Dauhut et al., 2020), increased occurrences of SICs are observed over the tropical continents. The highest SIC occurrence frequencies over the tropics are detected in boreal winter (DJF; ∼0.36), with the regional mean of ∼0.15. The lowest occurrence frequency of SICs over the tropics occurs in boreal summer (JJA), when the hotspots of SICs are shifted to the north of the Equator over the Asian Monsoon and North American Monsoon. At midlatitudes, more SICs are observed in the Northern Hemisphere (NH) over the northern Atlantic and Europe in DJF. In JJA, only the region over central North America presents relatively high SIC occurrence frequencies (0.08–0.12). In the Southern Hemisphere (SH), SICs are observed continuously along midlatitude belts in JJA. MAM and SON have similar features to DJF and JJA. Vertically, ice cloud-top heights (CTHs) observed in CALIPSO are mostly found in the tropopause region (±500 m around the tropopause). Seasonally and regionally averaged occurrence frequencies of ice cloud-top heights as a function of altitude are shown in Fig. 1e–h for the tropics (20∘ S–20∘ N) and midlatitudes (40–60∘ N/S). Most ice cloud-top heights are observed around the tropopause in the tropics and at midlatitudes. In the tropics, about 1 % of ice clouds have cloud tops 1 km above the tropopause in DJF, MAM, and SON. But very few ice clouds are found at midlatitudes with cloud tops 1 km above the tropopause. In JJA, relative low-occurrence frequencies of ice clouds above the tropopause in the tropics can be affected by the location of ice cloud hotspots, as we presented the averaged values in the latitude range between 20∘ S–20∘ N.
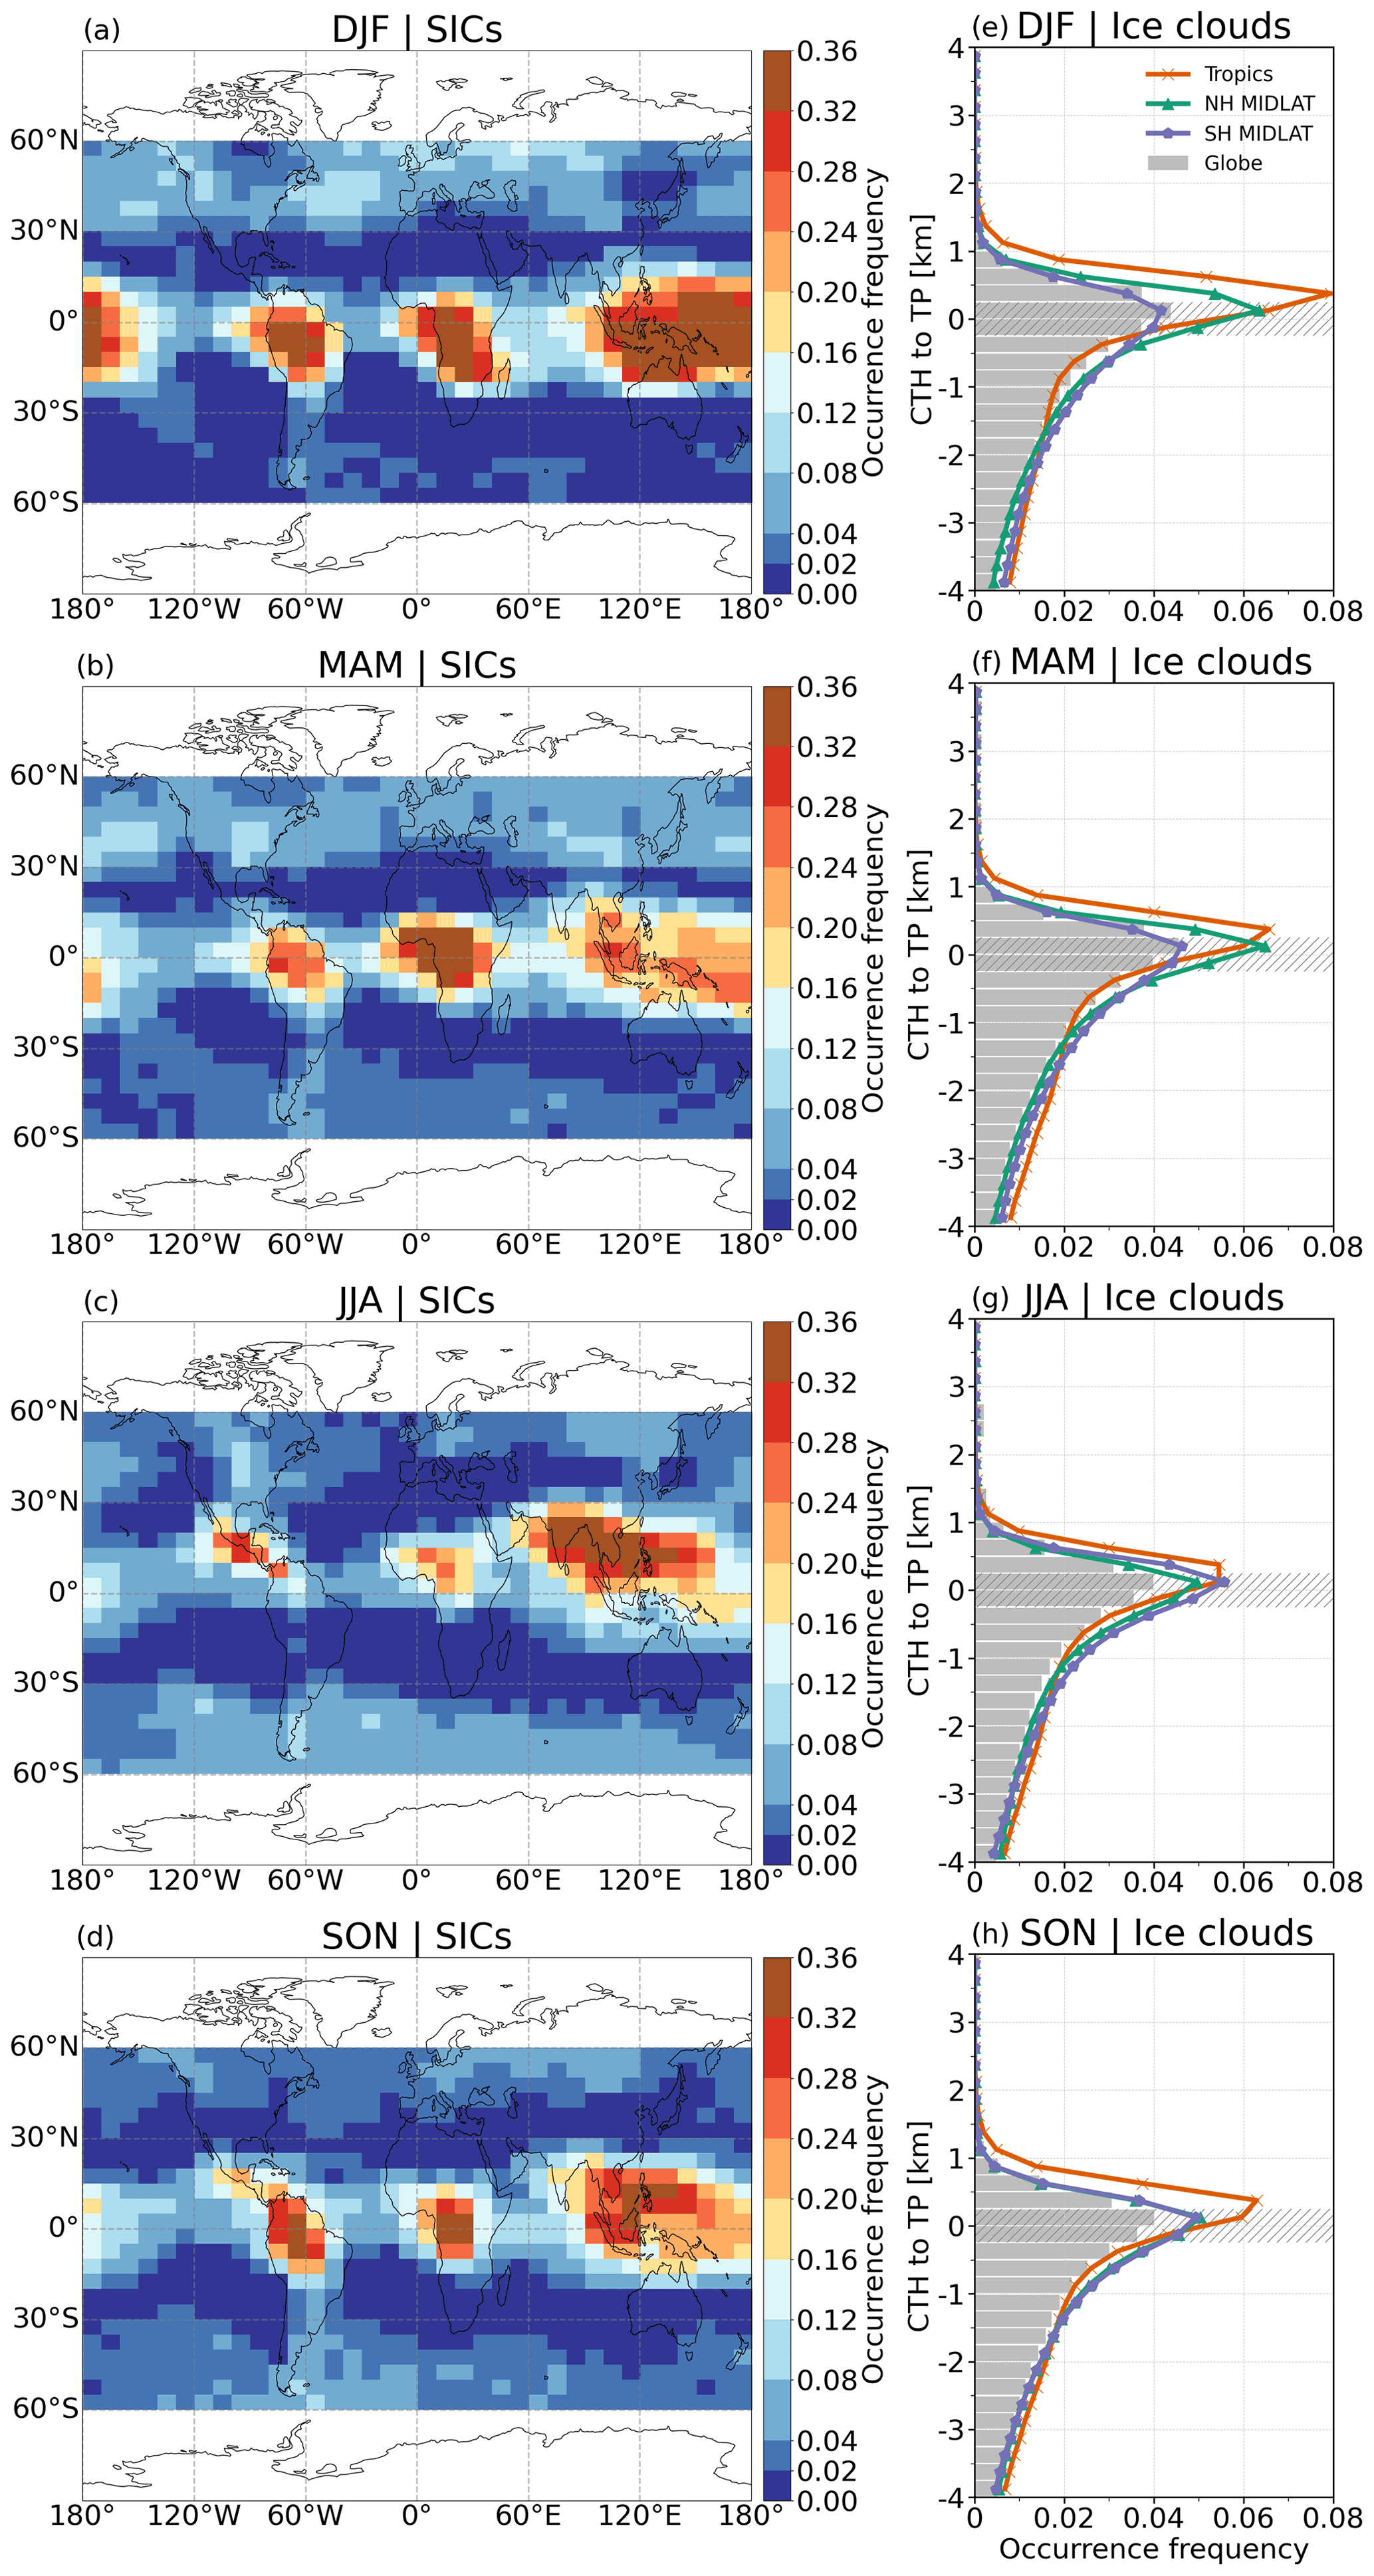
Figure 1Occurrence frequencies of SICs on a (latitude × longitude) grid (a–d) and occurrence frequencies of ice cloud-top heights (CTHs) in the altitude range from −4 to 4 km with respect to the first thermal tropopause (e–h) in DJF, MAM, JJA, and SON from CALIPSO measurements. In panels (e)–(h), the data are shown as zonal averages, globally (gray bars), for the tropics (20∘ S–20∘ N; orange lines) and midlatitudes (40–60∘; green lines for NH and purple lines for SH). The hatched areas are tropopause uncertainties of ±250 m.
To investigate the spatial and temporal variations in SICs, monthly 5∘ latitude band averaged occurrence frequencies of SICs from 2007 to 2019 are shown in Fig. 2. Seasonal cycles of SICs are observed in the tropics and at midlatitudes. SICs in the tropics follow the Intertropical Convergence Zone (ITCZ) over time, i.e., high SIC occurrence frequencies in the latitude range of 20∘ S–20∘ N move from south to north from the boreal winter to summer and north to south from the boreal summer to winter. The correlation with the ITCZ suggests that there is a strong correlation with deep convection. Most SICs are observed between 15∘ S–5∘ N, which show higher SIC occurrence frequencies (>0.24) and longer occurrence times (November to March of the following year). The SIC occurrence frequencies are stronger in the SH tropics, whereas SICs extend to higher latitudes in the Northern Hemisphere. Some SICs are identified at 25–30∘ N from June to August, absent in the Southern Hemisphere, which would relate to the uplift of the Tibetan Plateau and the Asian Monsoon region. Figure 2 presents pronounced high SIC occurrence frequencies from November 2010 to January 2011 and relatively low values in 2015–2016 in the tropics. For more a detailed look at the interannual variability in SIC occurrence frequencies, please see Fig. 11a.
At midlatitudes, SICs are observed at least 2 times less frequently than in the tropics. However, we can still notice variation in SICs at midlatitudes where SICs are more often observed in winters/early springs. It suggests other sources for the occurrence of SICs at midlatitudes besides deep convection. Therefore, we investigate the correlation of different processes with respect to SIC occurrences in the following sections, including tropopause temperature, double tropopauses, UTLS clouds, gravity waves, and stratospheric aerosol, which are expected to have an impact on cloud formation.

Figure 2Monthly occurrence frequencies of SICs in the latitude band of 5∘ from 2007 to 2019.
3.2 Double tropopauses and SICs
Following the definition of the WMO, a second tropopause is identified if the average lapse rate at any level and at all higher levels within 1 km exceeds 3 K km−1 above the first tropopause. The existence of a second tropopause indicates a less stable temperature structure in the UTLS region (Homeyer et al., 2014). Randel et al. (2007) discovered that the double tropopause indicates a region of enhanced transport from the tropics to higher latitudes. Thin ice clouds observed in the low stratosphere over the northern middle and high latitudes in August 1997 originated from tropical, high-humidity air (Spang et al., 2015). Therefore, SICs detected in the vicinity of double tropopauses are probably related to the quasi-isentropic transport of humid air from the tropics to the extratropics.
SICs with cloud-top heights 250 m above the first tropopause but below the second tropopause are shown in Fig. 3a–d. SICs associated with double tropopauses are mostly observed at midlatitudes, e.g., over the northern Pacific Ocean, northern Atlantic near the United States, Tibetan Plateau in DJF and MAM, and over central North America and southern South America in JJA and SON. In the tropics, there are about 2 %–4 % of the SICs associated with double tropopauses, mainly located over the Maritime Continent in DJF, equatorial Africa in MAM, and the northeastern Indian Ocean in JJA and SON. The patterns of SICs associated with double tropopauses in Fig. 3a–d resemble the patterns of double tropopauses occurrence in Peevey et al. (2012) and Schwartz et al. (2015).
In addition, Fig. 3e–h show the fraction of SICs associated with double tropopauses to the total SICs. Up to 80 %–100 % of all SICs around a latitude band of 30∘ in both hemispheres during local winter and autumn are associated with double tropopauses. However, the highest correlations are found in regions with low SIC occurrence frequencies. In the tropics over the Maritime Continent in DJF, equatorial Africa in MAM, and the northeastern Indian Ocean in SON, less than 40 % of the SICs coincide with double tropopauses. Only over the northwestern Indian Ocean in JJA are up to 60 % of the SICs associated with double tropopauses. The double tropopauses, which enhance convective overshooting (Homeyer et al., 2014) and isentropic transport (Randel et al., 2007), have a non-negligible impact on the occurrence of SICs at midlatitudes, especially in and around the subtropical jet stream.
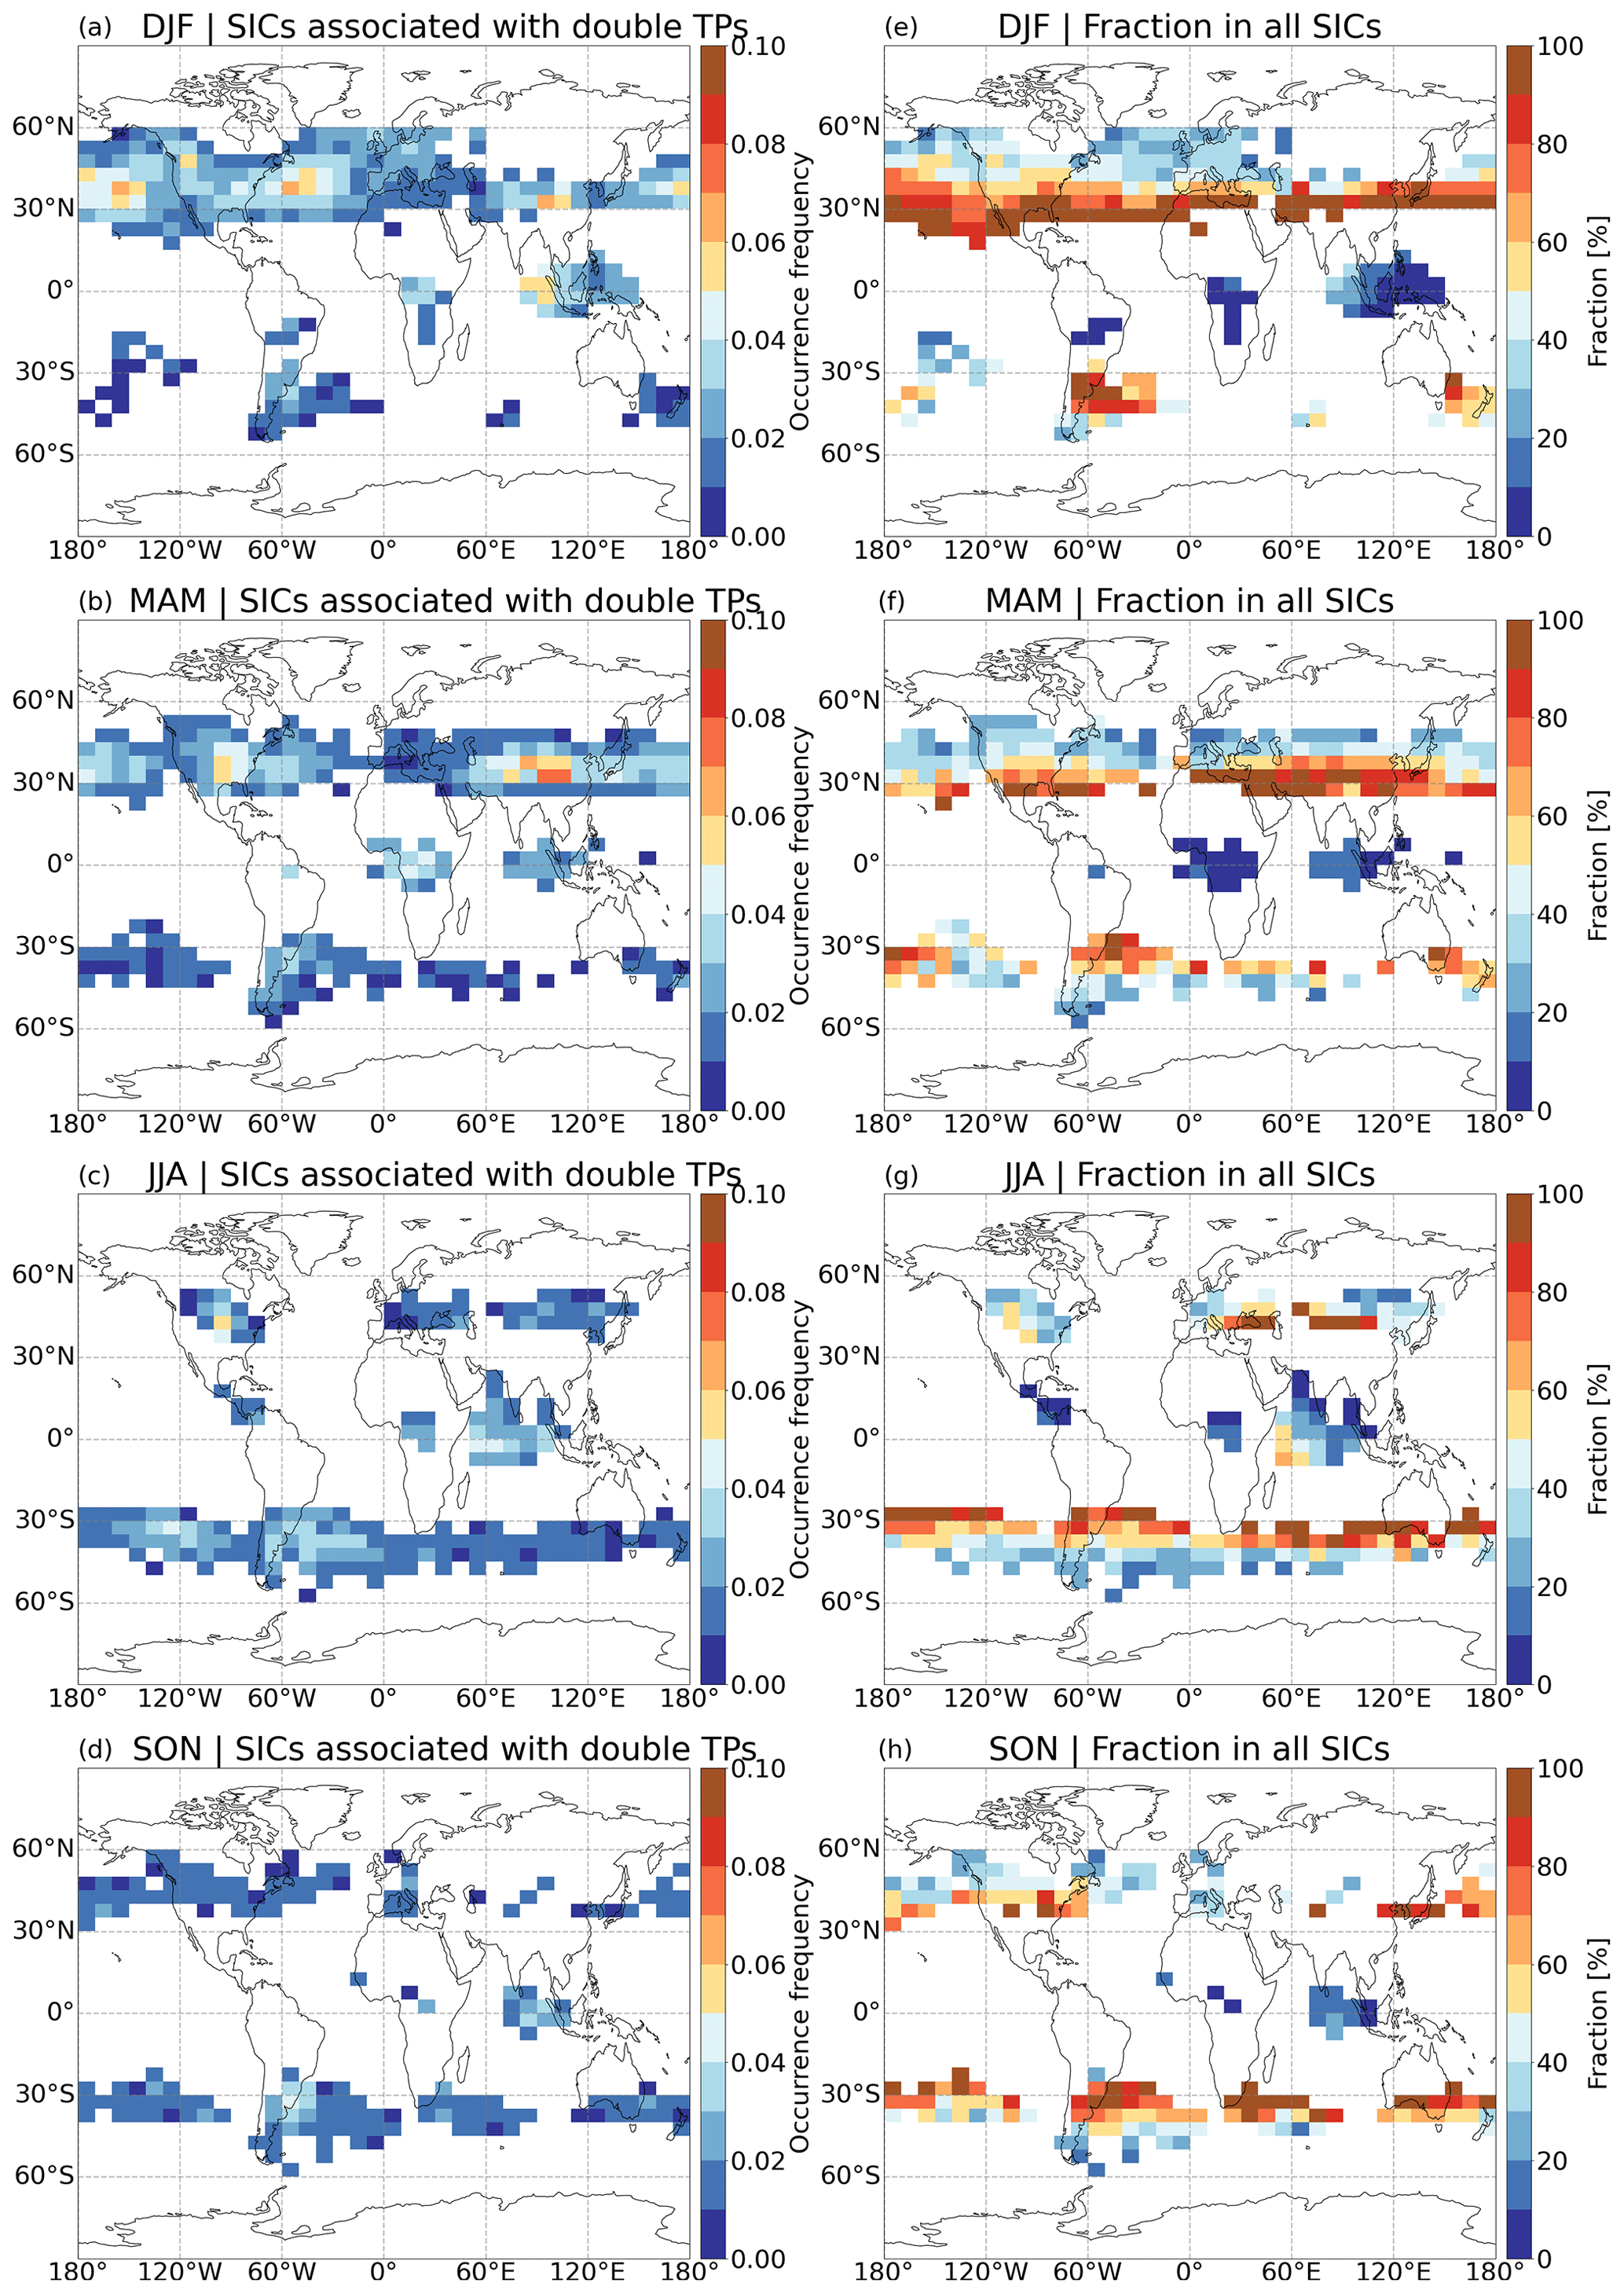
Figure 3Occurrence frequencies of SICs associated with double tropopauses with respect to all profiles (a–d), and the fraction of SICs associated with double tropopauses to total SICs (e–h).
3.3 Tropopause temperature and SICs
The tropopause temperature plays a vital role in influencing ice clouds and regulating water vapor in the lower stratosphere. Low temperatures and cooling processes are more favorable for ice formation, and temperature normally has a negative correlation with cirrus cloud frequency (Eguchi and Shiotani, 2004; Kim et al., 2016). To better understand the effects of tropopause temperature on the global distribution and occurrence of SICs, seasonal mean LRT1 temperature (LRT1-T) and SIC occurrence frequencies are presented in Fig. 4. Low tropopause temperatures are characteristic of the tropics, where large-scale updrafts, convection, and waves cause its cooling. As already noted by Chae and Sherwood (2007), tropopause temperatures over the tropics are colder in boreal winter than in summer, and we can find higher occurrence frequencies of SICs over the tropics in DJF than in JJA (Fig. 4). In general, regions with low tropopause temperatures are colocated with high occurrence frequencies of SICs. However, at midlatitudes, regions with an SIC occurrence frequency larger than 0.06 are found for warmer tropopause temperatures than in the tropics. The differences with respect to tropopause temperatures in the tropics and at midlatitudes suggest that the processes leading to SIC formation are inherently different in the tropics (deep convection) and at midlatitudes (e.g., isentropic transport through double tropopauses, gravity waves, mesoscale convective systems, and frontal systems).
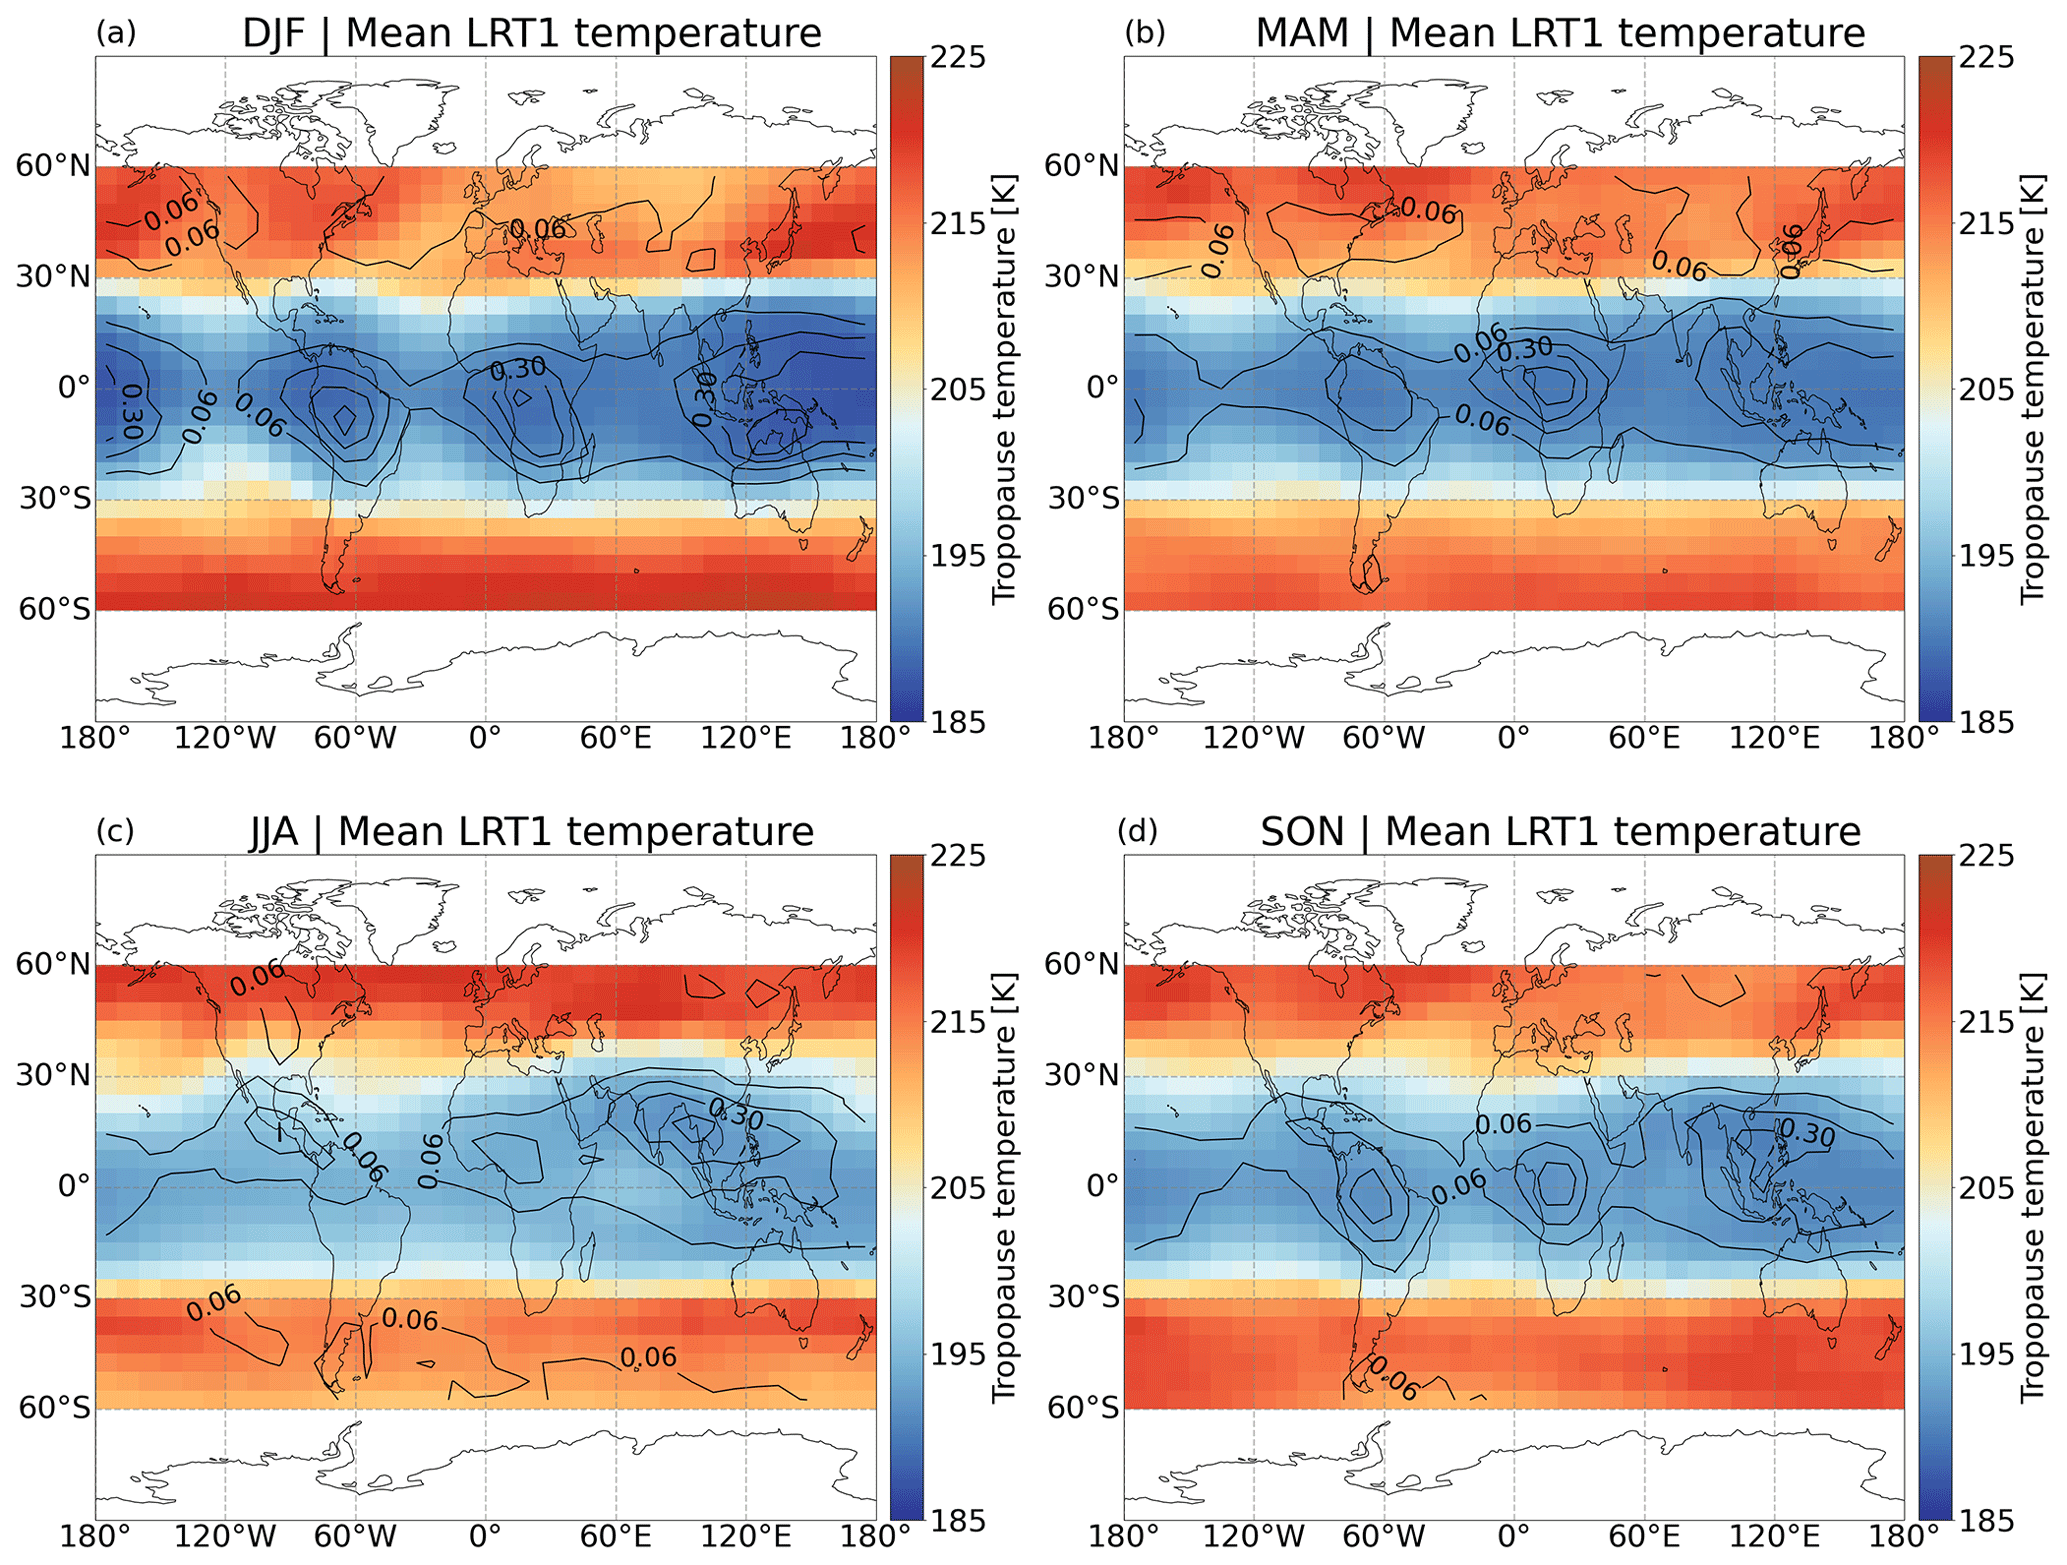
Figure 4Seasonal mean first tropopause temperature from ERA5 (colored boxes) and occurrence frequencies of SICs from CALIPSO, as shown in Fig. 1a–d (contour lines with an interval of 0.12).
3.4 UTLS clouds and SICs
Deep convection can inject water vapor and ice particles into the lower stratosphere and, hence, provides a source of humidity for in situ nucleation above anvil tops (Cooney et al., 2018). This study uses UTLS clouds retrieved from AIRS as a proxy for deep convection in the tropics and other high-altitude cloud sources at midlatitudes. Compared to the occurrence frequency of UTLS clouds (Fig. B1), similar patterns are observed for the event frequency of UTLS clouds in Fig. 5. However, event frequencies are much higher than the occurrence frequencies and the results given in Hoffmann et al. (2013). This is due to different analysis methods and detection thresholds. In the tropics, the highest event frequencies follow the ITCZ and are the strongest over the continents and southeastern Asia. At midlatitudes, the highest event frequencies are found over the oceans and southern South America in DJF, and the highest event frequencies are observed over the continents in JJA (Fig. 5).
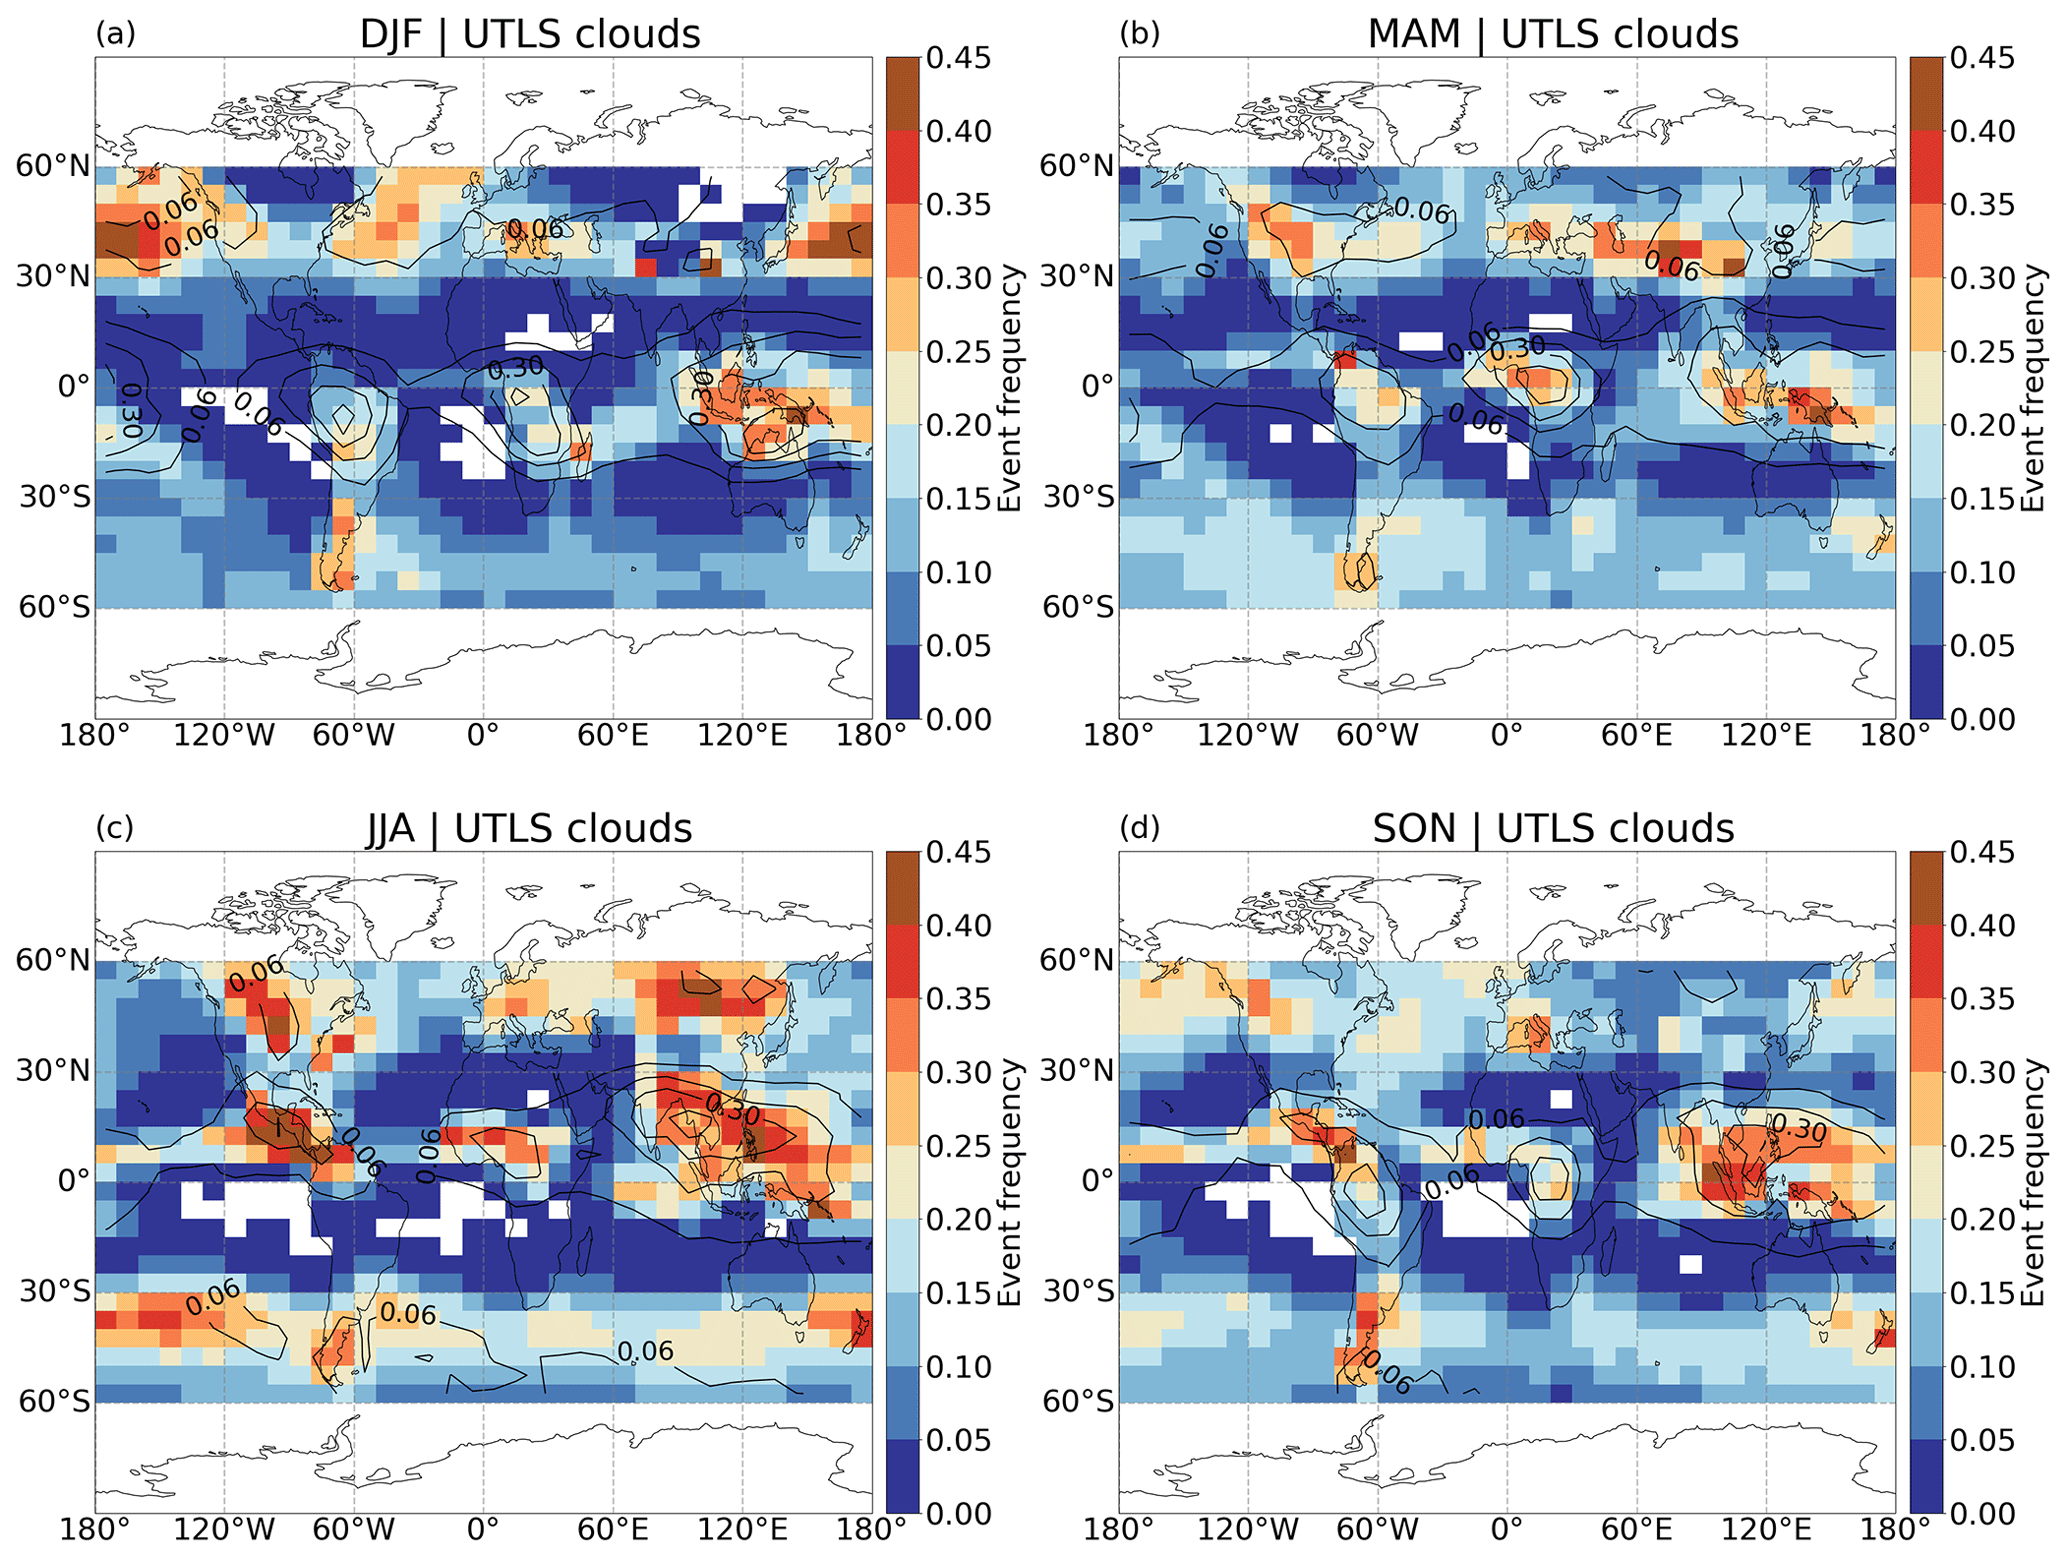
Figure 5Seasonal event frequency of UTLS clouds derived from AIRS during 2007–2019. Occurrence frequencies of SICs (data in Fig. 1a–d) are shown as black contours with an interval of 0.12.
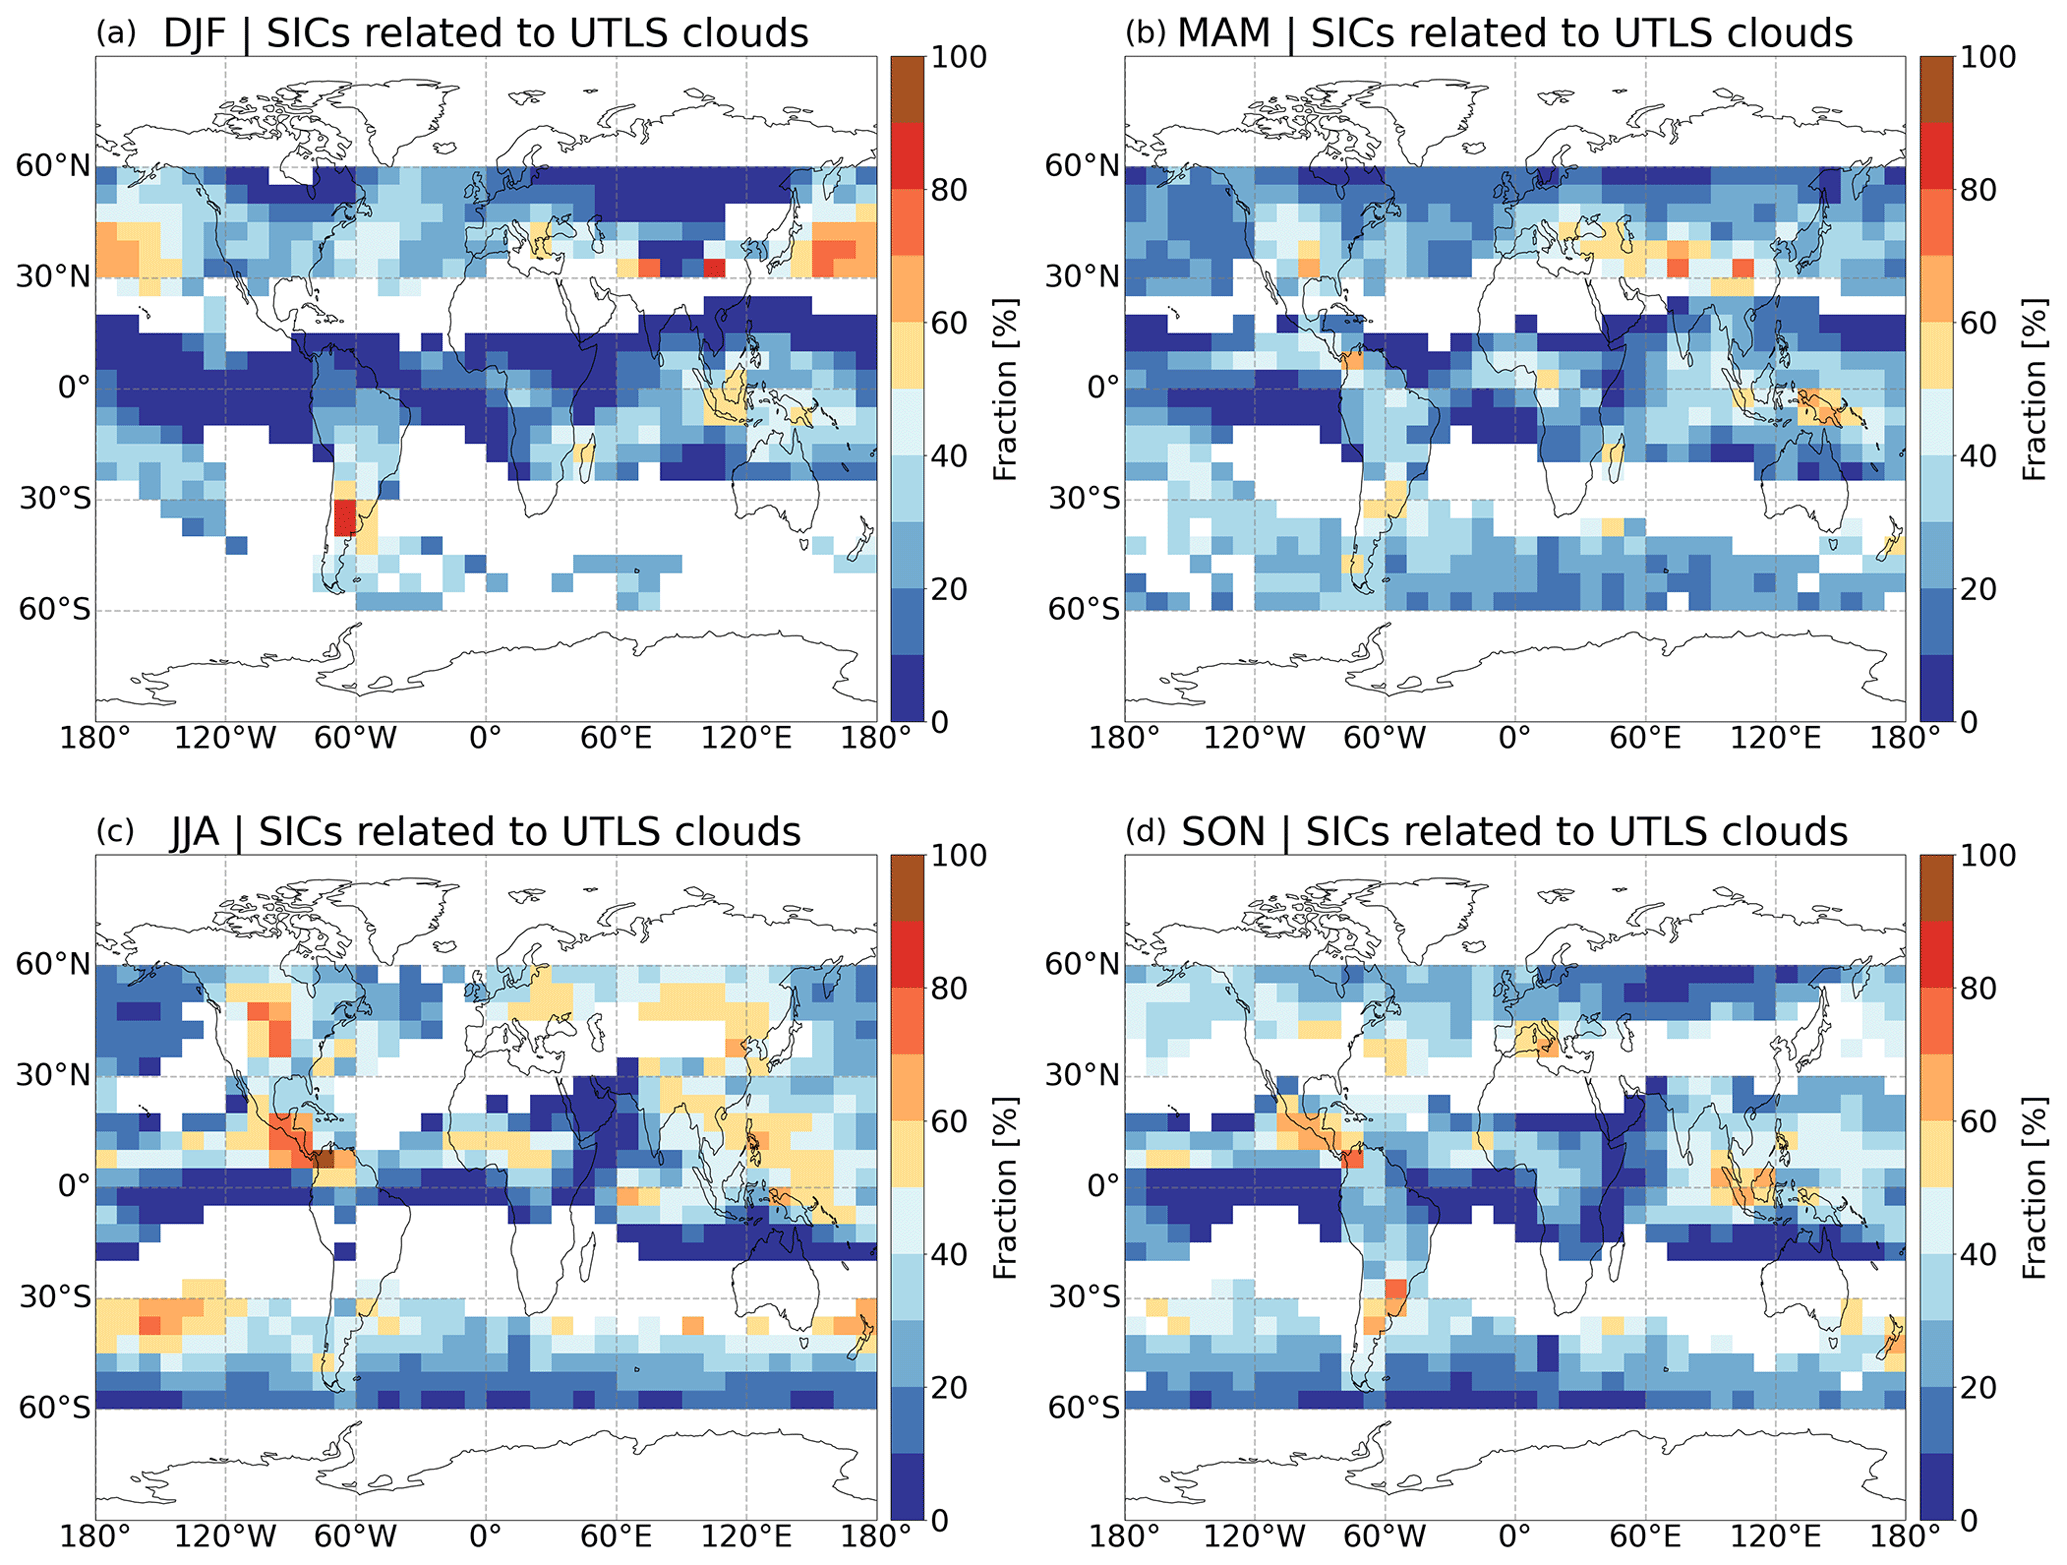
Figure 6The fraction of SICs associated with UTLS clouds at the same local time (0 LTD).
To investigate the effects of UTLS clouds, we analyzed the fraction of SICs related to UTLS clouds (Fig. 6), which is defined as the ratio of the number of days with the co-occurrence of SICs and UTLS clouds to the number of days with the occurrence of SICs in each grid box. Observations at the same local time (LT) for SICs and UTLS clouds, which is named a 0 local time difference (0 LTD), are presented in Fig. 6. In DJF (Fig. 6a), more than 50 % of the SICs are correlated with UTLS clouds over Argentina and southern Brazil, the eastern Tibetan Plateau (with a maximum fraction of 80 %–90 %), the northern Pacific Ocean (maximally 70 %–80 %), and the maritime continent. In JJA (Fig. 6c), the highest correlations between SIC and UTLS clouds are observed over the Great Plains (maximally 70 %–80 %), central America (with the highest fraction of 90 %–100 %), central Africa (about 50 %–60 %), eastern and southern Asia, Europe and the western Pacific Ocean, and over a latitudinal band along 30–45∘S (40 %–80 %). During the boreal summer, more than 40 % of SICs over the NH midlatitude continents and SH midlatitude oceans are correlated with UTLS clouds. In MAM (Fig. 6b), regions with the largest correlations are similar to JJA but with lower statistics. In SON, regions with the highest correlations between SICs and UTLS clouds are similar to JJA and DJF (Fig. 6d). The pattern of high fractions is similar to patterns of positive vertical velocity within cirrus clouds for corresponding months in Barahona et al. (2017, Fig. 6). Overall, the influence of UTLS clouds on the occurrence of SICs follows the ITCZ in the tropics. SICs detected in the tropics, over the Great Plains, the North American Monsoon, and the Asian Monsoon regions in JJA are mainly attributed to UTLS clouds, which are mainly related to deep convection origin. The high fractions in the northern Pacific and southern South America in DJF and in the southern Pacific in JJA are associated with other UTLS cloud sources.
3.5 Gravity waves and SICs
Gravity waves are crucial factors locally affecting the pressure, temperature, and vertical velocity of an air parcel. As the cold phase and cooling effects of gravity waves have significant influence on cirrus cloud occurrence (Chang and L'Ecuyer, 2020; Ansmann et al., 2018), it is essential to investigate the relation between gravity waves and the occurrence of SICs. Mean variances in brightness temperatures (BT) at 4.3 µm from AIRS observations are applied to identify gravity wave events. Note that, due to the wind filtering and visibility effects, gravity waves are not significantly observed in the tropics in AIRS (Hoffmann et al., 2013).
In JJA, hotspots of large-amplitude waves (mean BT variance >0.1 K2) are observed at midlatitudes in the Southern Hemisphere, especially over Patagonia and the Drake Passage. In the Northern Hemisphere, high variance is found over southern and southeastern Asia, the Great Plains, Florida, and northern Africa in Fig. 7c. In DJF (Fig. 7a), high variance (>0.1 K2) is observed over the northern Atlantic, eastern Canada and the United States, and Europe. The mean variances of all regions north of 40∘ N, except for the northern Pacific Ocean, are greater than >0.03 K2. In the Southern Hemisphere, several gravity wave hotspots have been detected over southern Africa and Madagascar, northern Australia and the Coral Sea, and southern Brazil. In MAM, gravity waves are observed mainly over the Southern Hemisphere, with a similar pattern to that in JJA, but with weaker signals (Fig. 7b). Similar patterns with weaker signals to DJF are observed in SON over the Northern Hemisphere, and an intense center is detected over Patagonia and the Drake Passage at this time (Fig. 7d).
At midlatitudes, SICs are colocated with high BT variance in DJF and JJA, suggesting an important role of gravity waves in the formation and occurrence of SICs. However, in the tropics, regions with high mean BT variance are in agreement with low LRT1 temperature (Fig. 4) and UTLS clouds (Fig. 5). Those overlaps suggest strong correlations between tropopause temperature, UTLS clouds, gravity waves, and the occurrence of SICs.
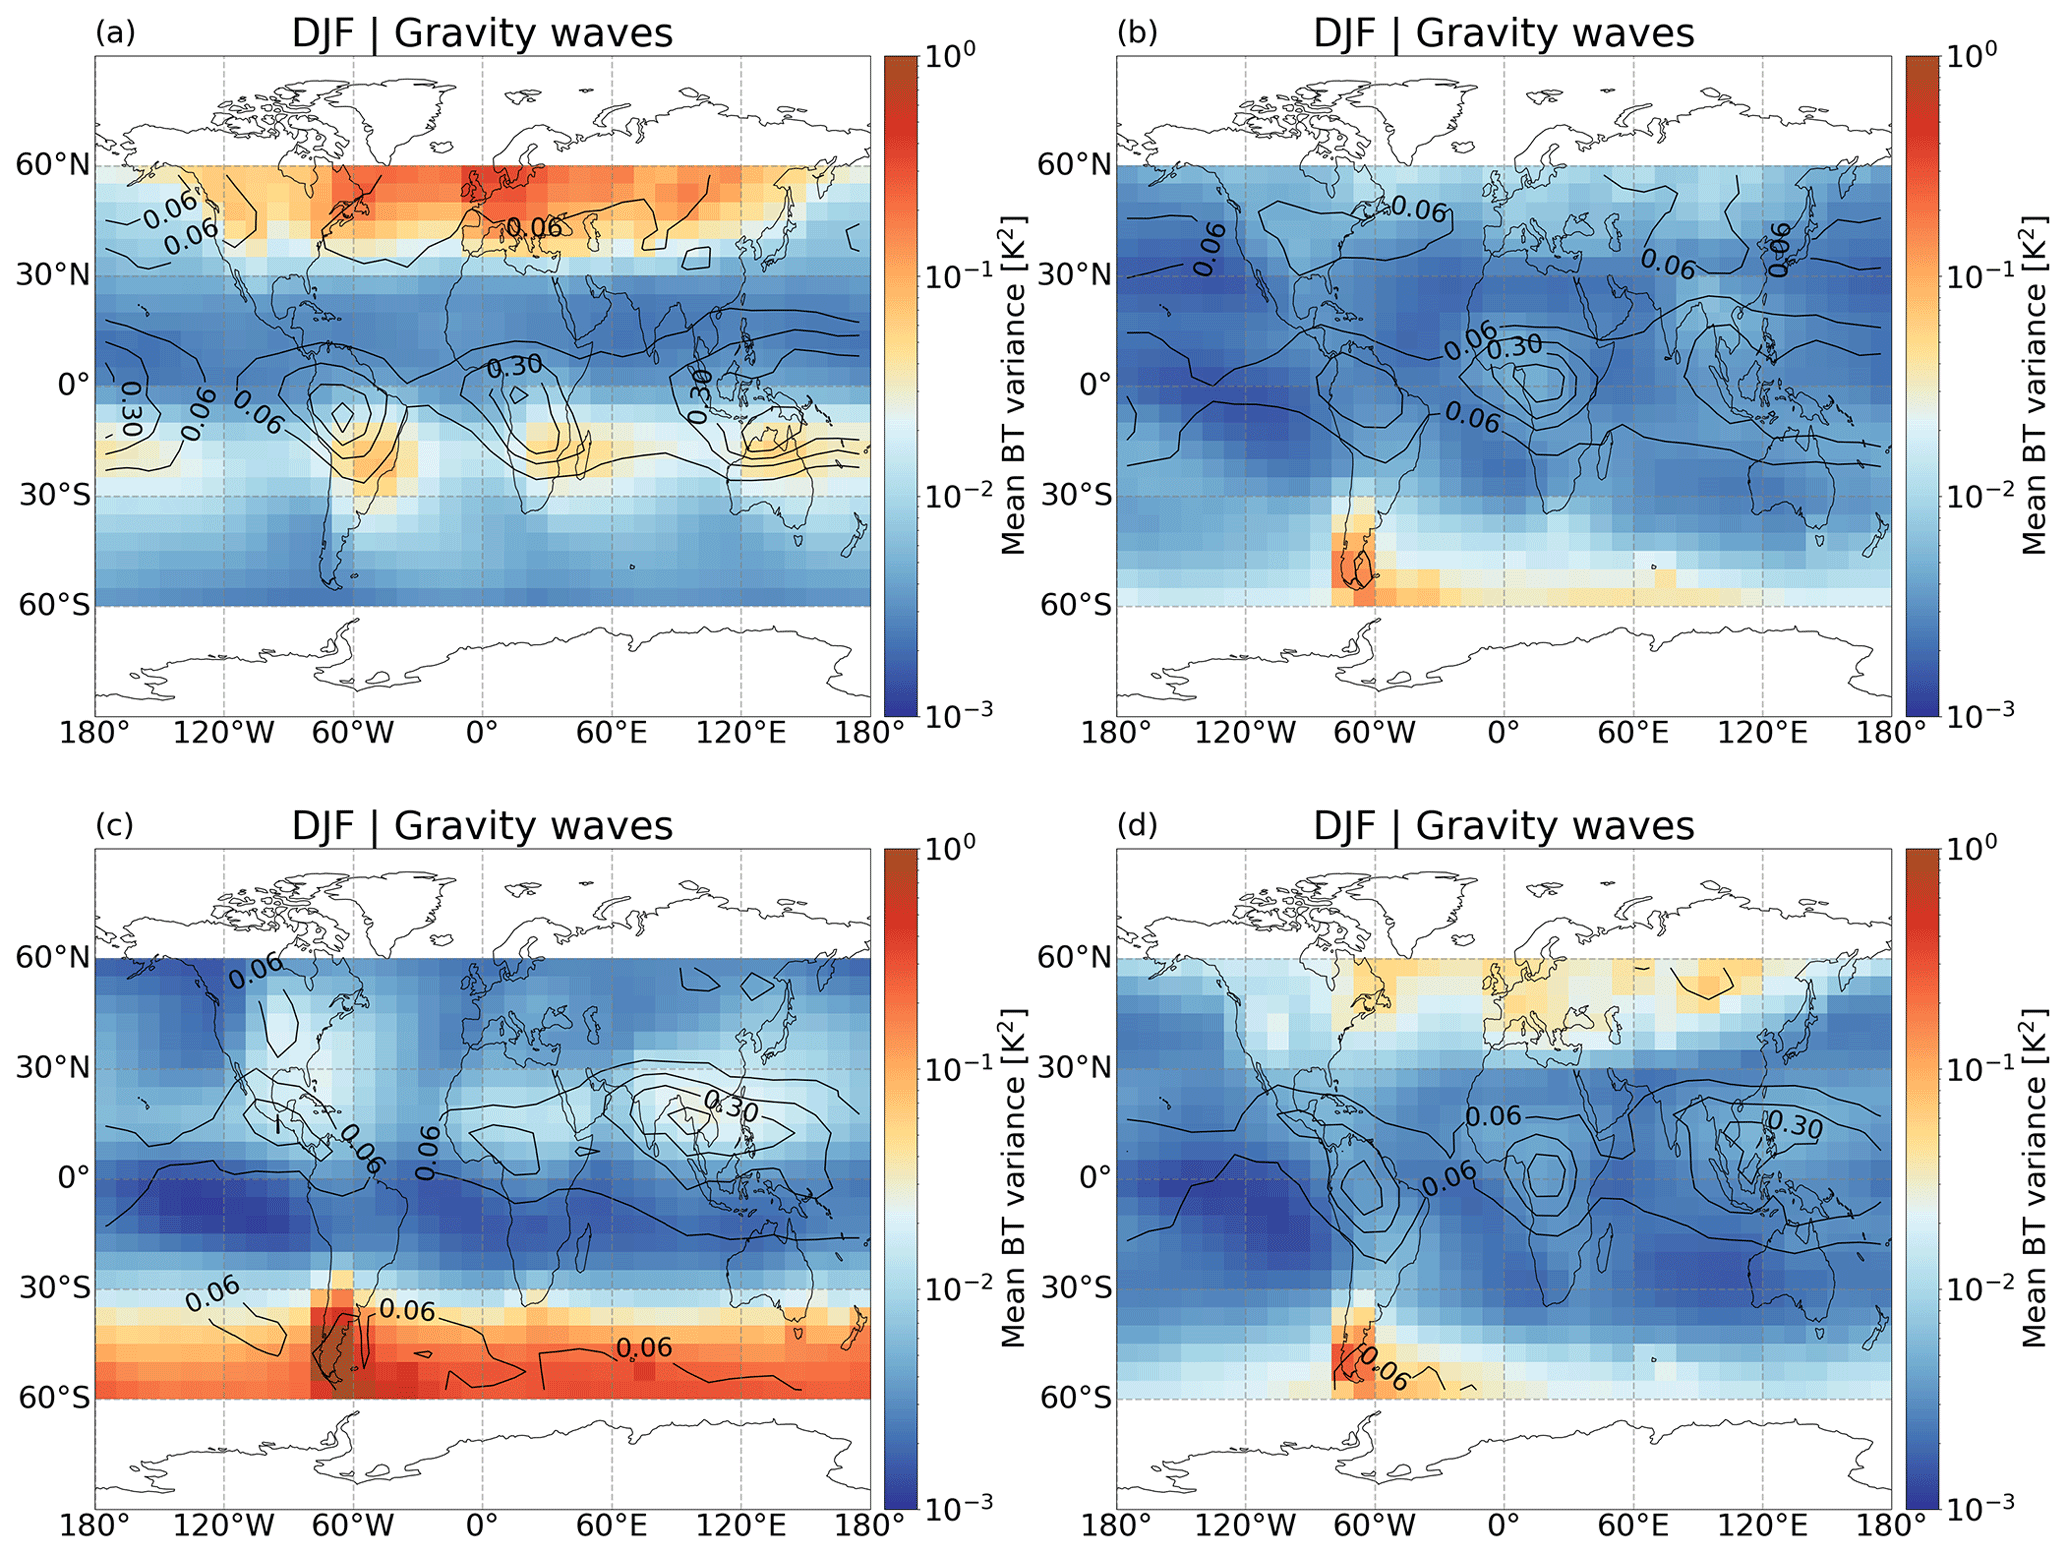
Figure 7Mean brightness temperature variance at 4.3 µm from AIRS measurements, which correlates with the amplitude of gravity waves. Black contours are the occurrence frequencies of SICs, as shown in Fig. 1a–d.
3.6 Stratospheric aerosols and SICs
As aerosol particles provide cloud condensation nuclei and ice nuclei, the occurrence of SICs is expected to correlate with aerosols (Lohmann and Feichter, 2005). Seasonal occurrence and distribution of SAs in CALIPSO are presented in Fig. 8. Significantly higher SA occurrence frequencies are found at northern midlatitudes and over South America, which are associated with strong volcanic eruptions, such as Kasatochi Island (August 2008, 52∘ N), Mount Redoubt (March 2009, 60∘ N), and Raikoke (June 2019, 48∘ N) at northern midlatitudes and Puyehue-Cordón Caulle (June 2011, 41∘ S) and Calbuco (April/May 2015, 41∘ S) in South America, where high-occurrence frequencies can be affected by the South Atlantic Anomaly (Noel et al., 2014). No significant correlation can be seen with the long-term averaged SIC occurrence frequencies in those regions. However, high-occurrence frequencies of SICs are consistent with SAs in all seasons over continents in the tropics in DJF, MAM, and SON and over the North American Monsoon, Asian Monsoon regions, and equatorial Africa in JJA. Those are known regions with large-scale upwelling and tropopause-penetrating convection that indicate interconnections between the occurrence of SAs, UTLS clouds, and gravity waves.
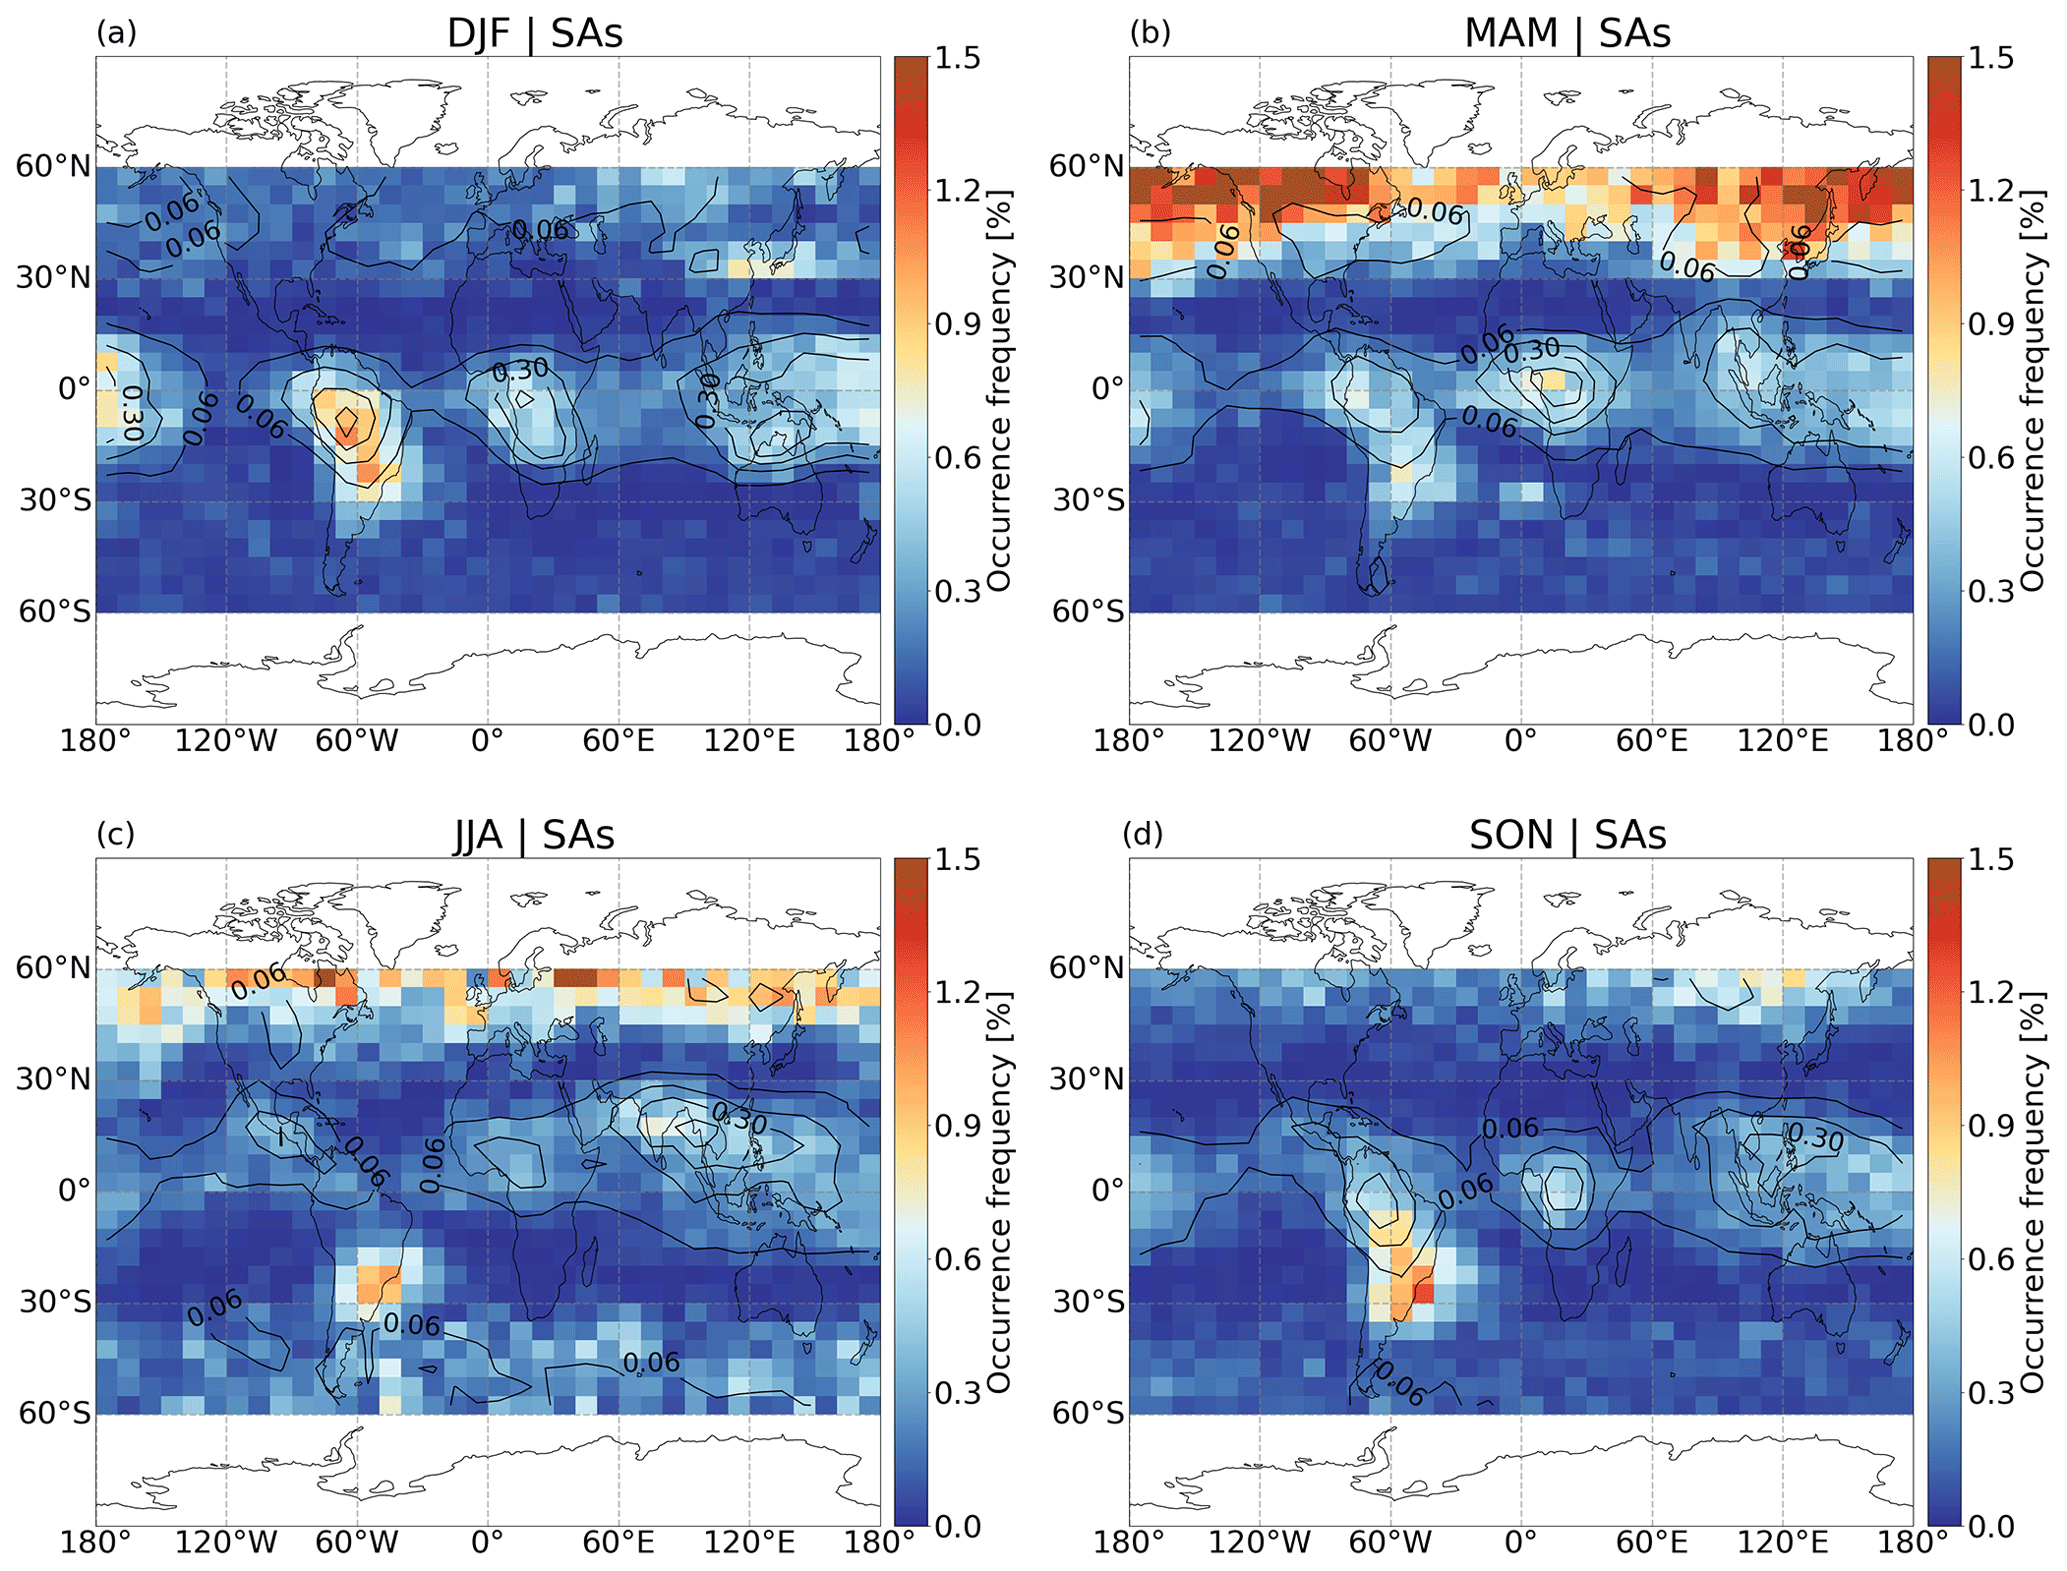
Figure 8Seasonal occurrence frequency of stratospheric aerosols from CALIPSO during 2007–2019. Black contours are the occurrence frequencies of SICs, as shown in Fig. 1a–d.
3.7 Assessment of processes related to SIC occurrence
Individual relationships between the occurrence of SICs and tropopause temperature, UTLS clouds, gravity waves, and stratospheric aerosols were analyzed in the above sections. To better understand the global distribution of SICs, Spearman correlation coefficients were calculated. Figure 9 presents the correlation coefficients between monthly averaged tropopause temperatures, UTLS clouds, gravity waves, stratospheric aerosols, and SICs. The occurrence of SICs has a general negative correlation with tropopause temperature, while SICs have positive correlations with UTLS clouds, gravity waves, and stratospheric aerosols. The highest negative and positive correlations are mostly observed over the tropical continents and the western Pacific, with correlation coefficients of between SICs and LRT1-T and >0.8 between SICs and UTLS clouds, gravity waves, and stratospheric aerosols. High positive correlations are also found over the Asian Monsoon and the North American Monsoon regions between SICs and UTLS clouds, gravity waves, and aerosol. While the LRT1-T shows a general negative correlation, there are strong positive correlations over central America and the Caribbean Sea, Philippines and South China Sea, and the Tibetan Plateau to the Caspian Sea. The highest correlation coefficients are as large as 0.8–1.0 in the North American Monsoon region, even for LRT1-T. In the Asian Monsoon region, negative correlations are detected over the Tibetan Plateau, but positive correlations are seen over southern Asia and India between SICs and LRT1-T. High correlation coefficients imply the important role of tropopause temperature, UTLS clouds, gravity waves, and stratospheric aerosols for the occurrence of SICs. However, overlapping high correlation coefficients also indicate strong connections between the tropopause temperature, UTLS clouds, gravity waves, and stratospheric aerosols themselves.

Figure 9Spearman correlation coefficients of the SIC occurrence frequency and the first tropopause temperature, UTLS cloud event frequency, gravity waves, and stratospheric aerosol occurrence frequency from 2007 to 2019 with a grid cell in 5∘ latitude longitude. Only grid boxes with a SIC occurrence frequency >0.02 and ≥80 data points in each grid box and at 99 % significance level are presented. Occurrence frequencies of SICs are shown in black contours with an interval of 0.12.
To further investigate the source of SICs, the highest and second-highest correlation coefficients between SICs and all processes for each grid box are shown in Fig. 10. Over the tropical continents, the highest correlation coefficients of SICs relate to tropopause temperature. The highest correlation coefficients are found between UTLS clouds and SICs in the monsoon domains in the latitude range between 15 and 30∘, e.g., the North American Monsoon, the Asian Monsoon, the southern African Monsoon regions, and the Río de la Plata basin. In the central United States, tropopause temperature and UTLS clouds have the highest correlations with SICs. Over Patagonia and the Drake Passage, tropopause temperature and gravity waves have the highest correlation with the occurrence of SICs.In the latitude range between 45 and 60∘, the strongest correlations are found between SICs and tropopause temperature and gravity waves. However, the second-highest correlation coefficients of SICs are related to stratospheric aerosols, UTLS clouds, and gravity waves over the tropical continents, the North American Monsoon, and the Asian Monsoon regions. The rather similar correlation coefficients of SICs with all processes indicate high correlations between all processes themselves.
For all processes, increased tropopause-penetrating convection may result in a cooler tropopause across the tropics (Gettelman et al., 2002). Gravity waves and wave breaking will cause a colder temperature in the atmosphere and air cooling locally (Dinh et al., 2016). High correlations were found between deep convection and gravity waves (Hoffmann et al., 2013), and the vertical motion of air will transport aerosols into the stratosphere (Bourassa et al., 2012). The inherent correlations between all processes may help to explain the positive correlations between SICs and LRT1-T in the North American Monsoon and the Asian Monsoon regions. Even if the tropopause temperature is warm, UTLS clouds, gravity waves, and stratospheric aerosol could all contribute to the high occurrence frequency of SICs. For example, Fu et al. (2006) discovered that deep convection in the Asian Monsoon injected more ice and water vapor into the stratosphere with warmer tropopause temperatures. However, their strong correlation also makes it challenging to disentangle all processes' effects on the occurrence of SICs.
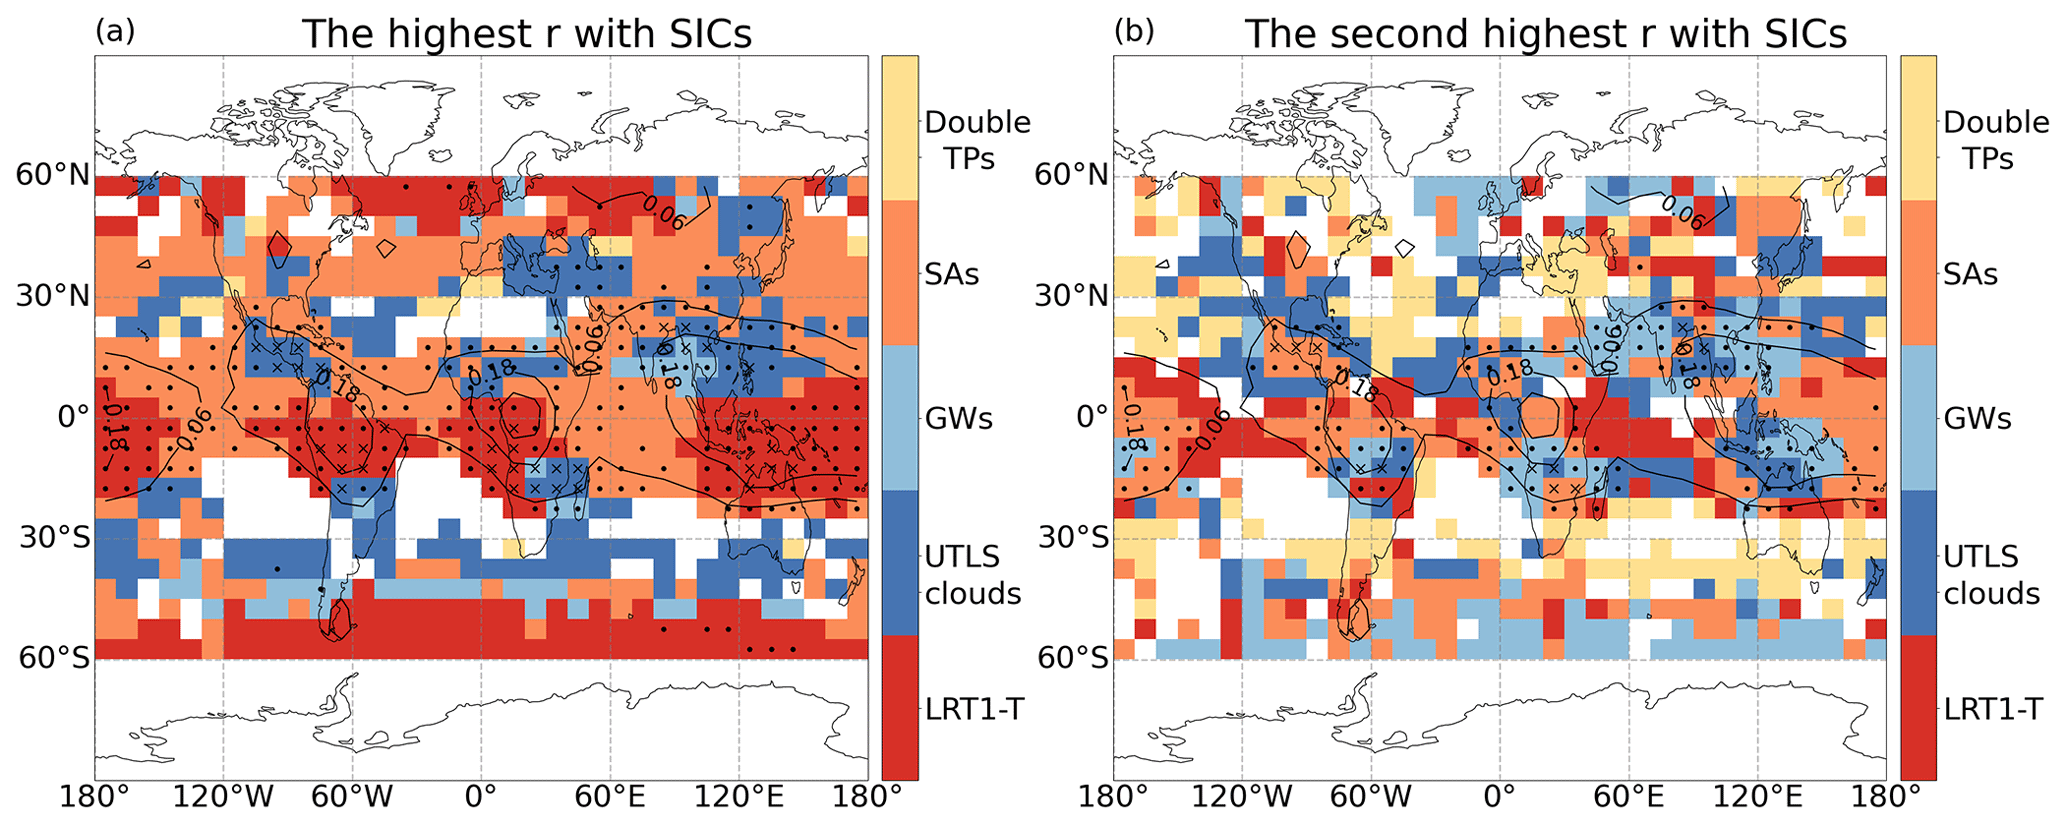
Figure 10The highest and second-highest correlation coefficients between SIC occurrence frequency and all processes (LRT1-T, UTLS clouds, gravity waves (GWs), stratospheric aerosols (SAs), and double tropopauses (double TPs)). Only grid boxes with absolute r≥0.3 are presented, and grid boxes with a dot have 0.6≤ absolute r<0.8, while grid boxes with a cross (x) have 0.8≤ absolute r<1.0. Black contours are the occurrence frequencies of SICs.
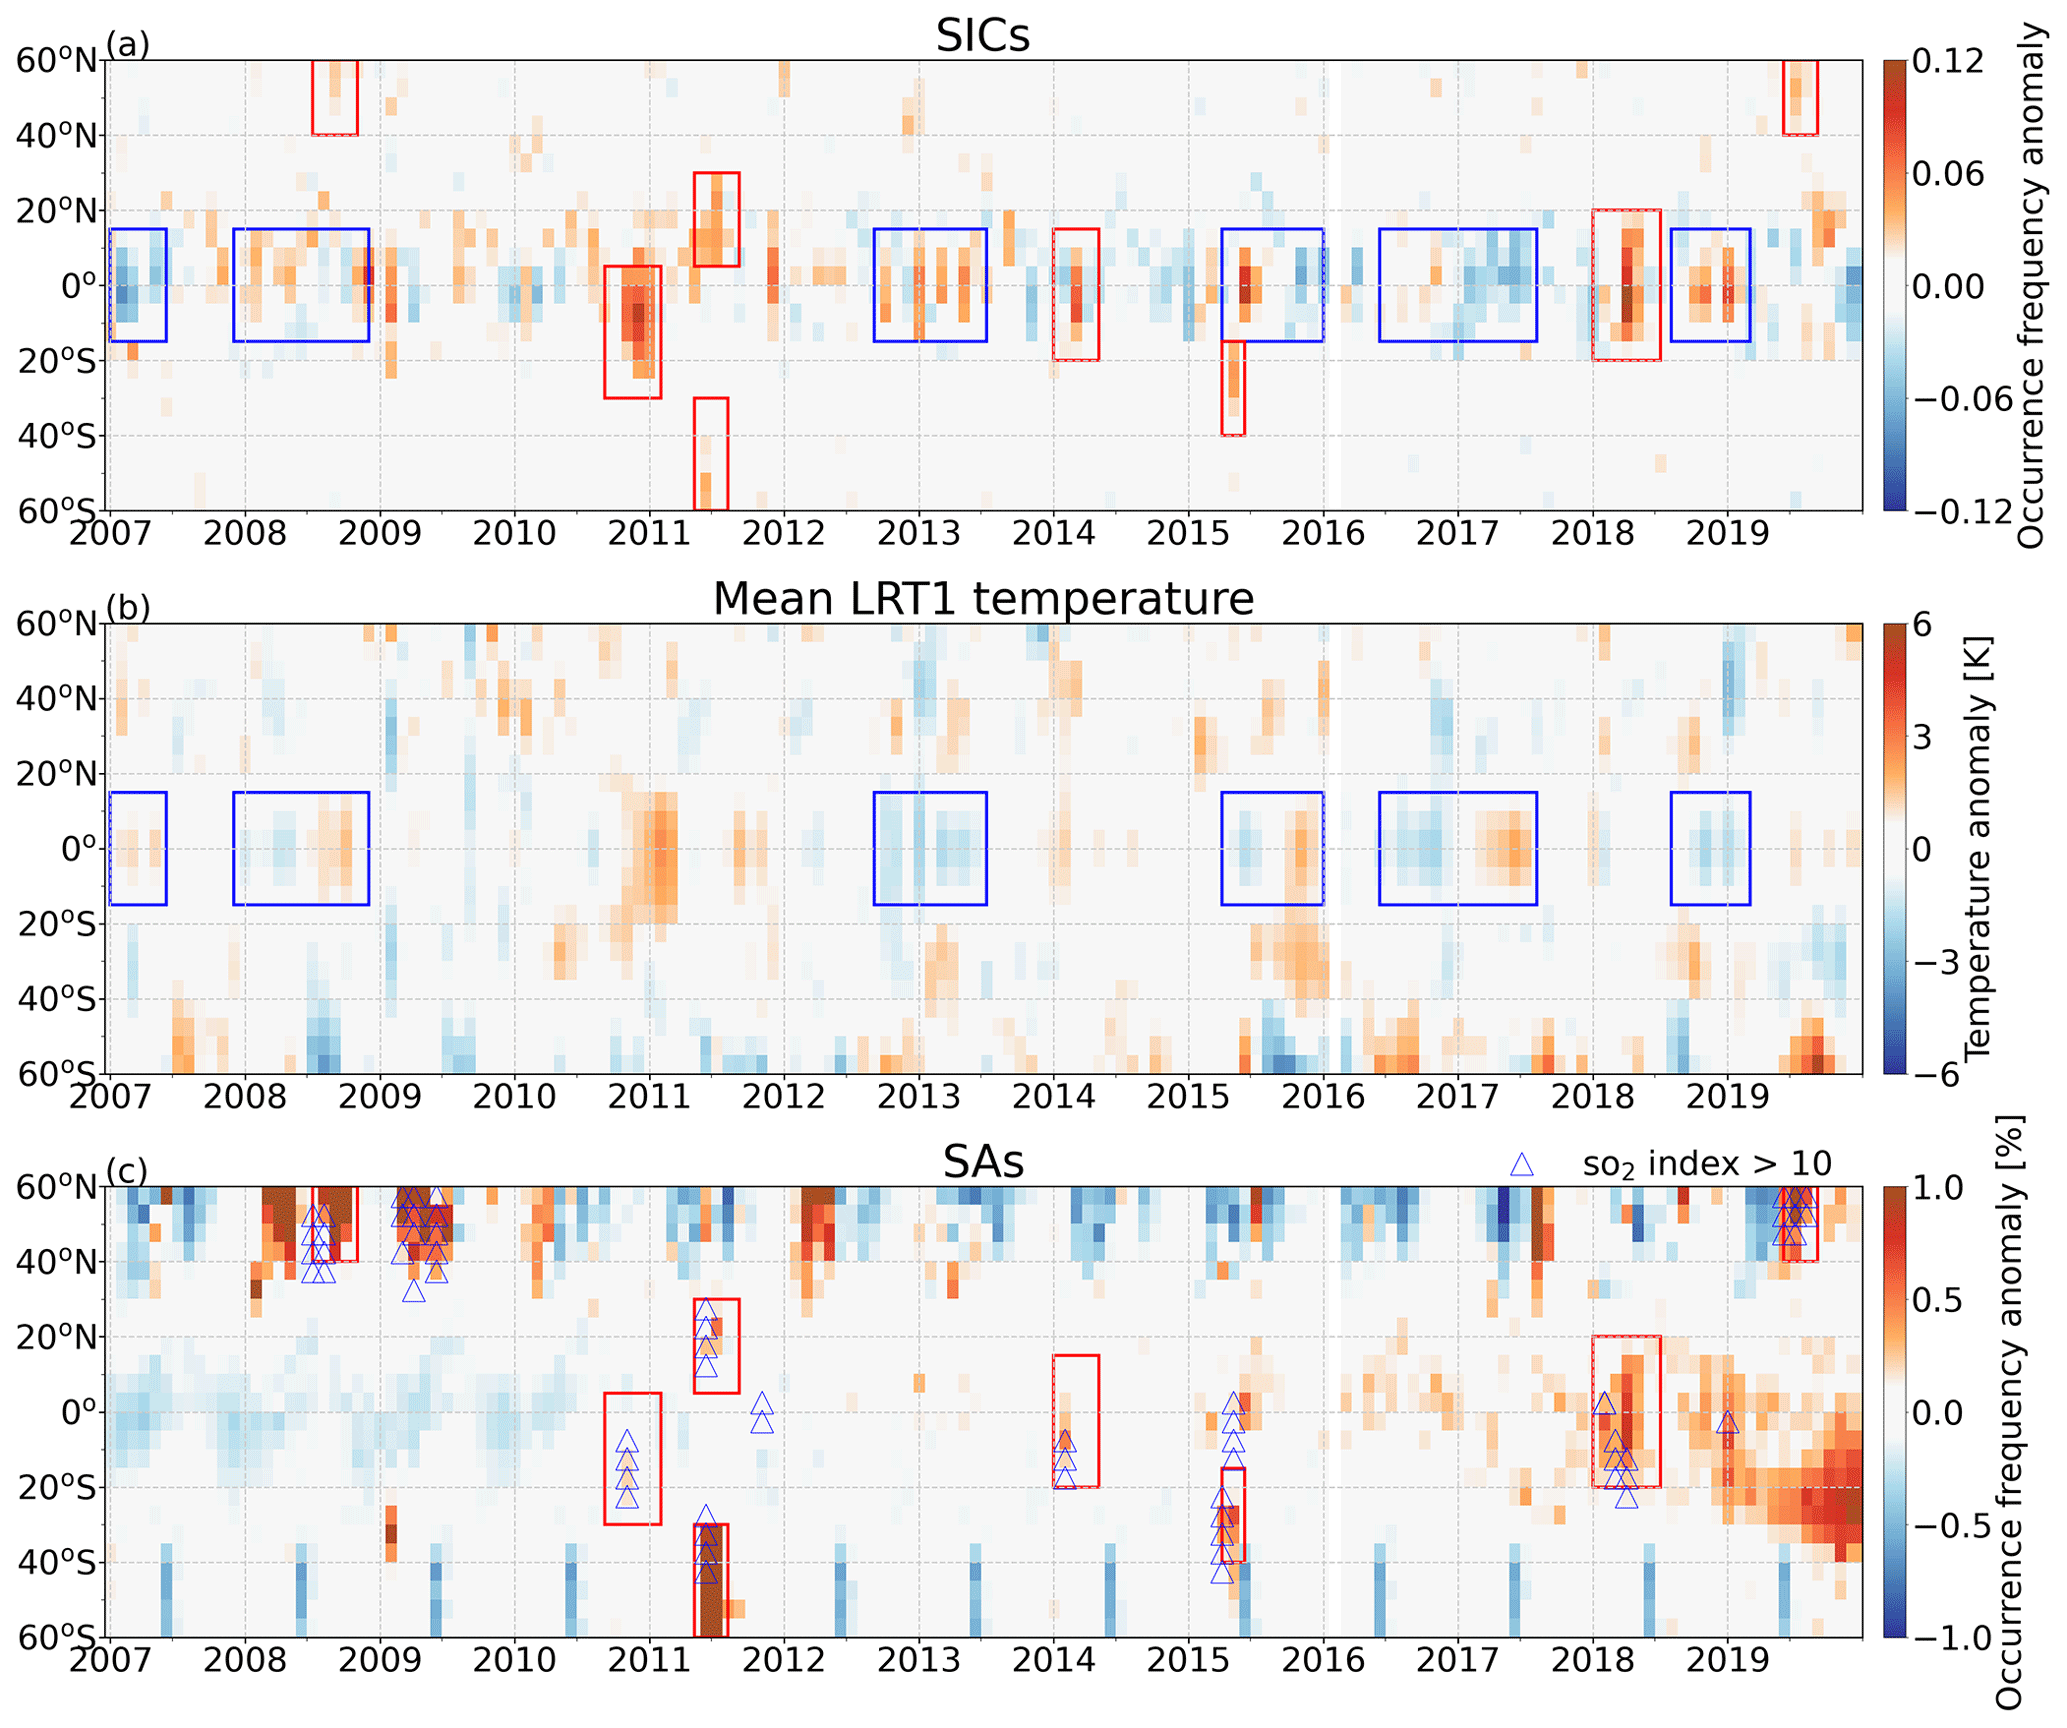
Figure 11Monthly anomalies of SIC occurrence frequency, LRT1 temperature, and stratospheric aerosol occurrence frequency from 2007 to 2019. Blue triangles indicate a high SIC occurrence frequency related to strong volcanic events, as identified by an SI >10 K derived from AIRS observations. SIC anomalies that are negatively correlated with LRT1 temperatures are marked with blue boxes (shown in panels a and b), and those positively correlated with SAs are marked with red boxes (a and c).
To explain the interannual variation in SICs, anomalies of SIC frequencies, LRT1 temperature, and SAs at different latitude bands (5∘ for each band) from 2007 to 2019 are presented in Fig. 11. The anomalies were computed as the difference between the monthly zonal mean values and the interannual mean of the monthly zonal mean values, which excludes seasonal cycles of parameters. The regionally averaged monthly anomalies of SIC occurrence frequencies and all processes with seasonal cycles over the tropics (20∘ S–20∘ N), northern midlatitudes (40–60∘ N), and southern midlatitude (40–60∘ S) can be found in Appendix D.
For global-scale anomalies excluding the effect of seasonal cycles, significant anomalies in SIC occurrence frequency can be observed in the tropics. Anomalies of SIC occurrence frequencies at generally demonstrate contrary features to the LRT1 temperature. Blue boxes in Fig. 11a and b present the negative correlations between SIC anomalies and LRT1 temperature anomalies, for instance, in February 2007 to July 2007, January–October in 2008, October 2012 to June 2013, June 2015 to January 2016, June 2016 to August 2017, and October 2018 to February 2019. During those periods, tropopause temperature variations are important for the anomalous variability in SICs in the tropics. However, tropopause temperatures cannot explain some remarkable positive anomalies in SIC occurrence frequencies, for example, the high SICs in November 2010 to January 2011, December 2011, March 2014, and April–May 2018 over the Equator and high SIC anomalies in April–July 2011 at 5–20∘ N (Fig. 11a). We need to note that the cold temperature and the cooling of the atmosphere (Kim et al., 2016) are important for the variation in SICs. And the uplifting motions, gravity waves, the El Niño–Southern Oscillation (ENSO) and quasi-biennial oscillation (QBO), and potentially other effects would all impact the temperature and temperature variations (Abhik et al., 2019; Feng and Lin, 2019; Tegtmeier et al., 2020b) associated with SIC variability.
Moreover, enhanced stratospheric aerosols due to volcanic eruptions coincide with the high SIC anomalies that are marked in red boxes in Fig. 11a and c, for example, in November 2010 to January 2011 (Merapi volcano), April–July 2011 (Nabro Volcano), March 2014 (Kelud volcano), and April–May 2018 (Ambae volcano) (Global Volcanism Program, 2013; Hoffmann, 2021b). In the extra-tropics, the most pronounced positive anomalies in SIC occurrence frequency correlate with the ash-rich volcanic eruptions of Kasatochi Island (August 2008, 52∘ N), Puyehue-Cordón Caulle (June 2011, 41∘ S), Calbuco in April–May 2015 (41∘ S), and Raikoke (June 2019, 48∘ N; Fig. 11a and c; compare with AIRS ash and SO2 index; Hoffmann, 2021b). There are no substantial interannual correlations between SICs and UTLS clouds and gravity waves. The spatiotemporal analyses of LRT1 temperature and stratospheric aerosols provide explicit awareness of processes on the occurrence of and variability in SIC anomalies at different latitude bands and time ranges.
4.1 SICs identification and tropopause uncertainty
In this study, a tropopause threshold of 250 m was applied to identify stratospheric ice clouds and stratospheric aerosols. As mentioned in Sect. 2.1, the vertical resolution of tropopause heights in ERA5 was improved by applying a cubic spline interpolation method (Hoffmann and Spang, 2022). When compared to radiosonde and GPS data, the height uncertainty for the LRT1 in ERA5 is less than 200 m (Tegtmeier et al., 2020a; Hoffmann and Spang, 2022). In the tropics, the SIC occurrence frequencies using ERA5 tropopauses with a threshold of 250 m are very similar to the SIC occurrence frequencies using the ERA-Interim reanalysis with a threshold of 500 m (Zou et al., 2020). Although one would expect a higher SIC occurrence frequency when using a smaller distance to the tropopause, the results remain similar. The major reason for this finding is that the ERA5 tropopauses in the tropics are on average 100 to 150 m higher than the ERA-Interim tropopauses (Hoffmann and Spang, 2022, Fig. 6a, at 0∘) and, hence, compensate for most of the effect of a lower distance to the tropopause. At midlatitudes, however, about 3 times more SICs are detected in this study when using ERA5 tropopauses (Fig. 1) compared to Zou et al. (2020, Fig. 3) using ERA-Interim tropopauses. The statistical analysis of ERA-Interim and ERA5 tropopause heights shows that the mean midlatitude tropopause in ERA5 is between 100 m lower and 80 m higher than the ERA-Interim tropopause, depending on the season and hemisphere (Hoffmann and Spang, 2022, Fig. 6a, at 45∘). Hence, the ERA5 tropopause at midlatitudes remains approximately the same as in ERA-Interim, and lowering the threshold distance to the tropopause results in more cloud detections, as one would expect.
As for the possible impacts of gravity waves and deep convection on the tropopause, Hoffmann and Spang (2022) found much more pronounced effects of gravity waves on the variability in tropopause heights and temperatures for ERA5 than ERA-Interim. However, convection-associated tropopause uplifts are not commonly represented, even in ERA5, due to the limited horizontal resolution of the reanalyses data sets. Since we used the same tropopause data set as Hoffmann and Spang (2022), tropopause uncertainties related to unresolved deep convection would exist in our study.
4.2 UTLS clouds and SIC uncertainties
UTLS clouds observed in AIRS are used here as a proxy for deep convection in the tropics. At midlatitudes they represent high-altitude clouds from mesoscale convective and storm sources when the cloud-top brightness temperatures are close to the tropopause temperature with an offset of 7 K. Event frequency is used in this work to demonstrate the relationships between SICs and UTLS clouds, which can help eliminate the morphological effects of UTLS clouds. Even though large quantitative differences are observed between the event frequency and the occurrence frequency of UTLS clouds, the global patterns of the event frequency and occurrence frequency are comparable (Figs. 5 and B1). The event frequencies are greater than 40 % over the northern Pacific in DJF and over Central America, the Great Plains, Maritime continent in JJA, but the occurrence frequencies are only about 3 %. The event frequency can reduce the effects of the intensity, spatial extent, and duration of UTLS clouds. For example, the occurrence frequencies (Fig. B1) over the tropics are much weaker than the event frequencies (Fig. 5). It means that UTLS clouds at midlatitudes occur as frequently as over the tropics, but the spatial extents are smaller, and the intensities are weaker than in the tropics.
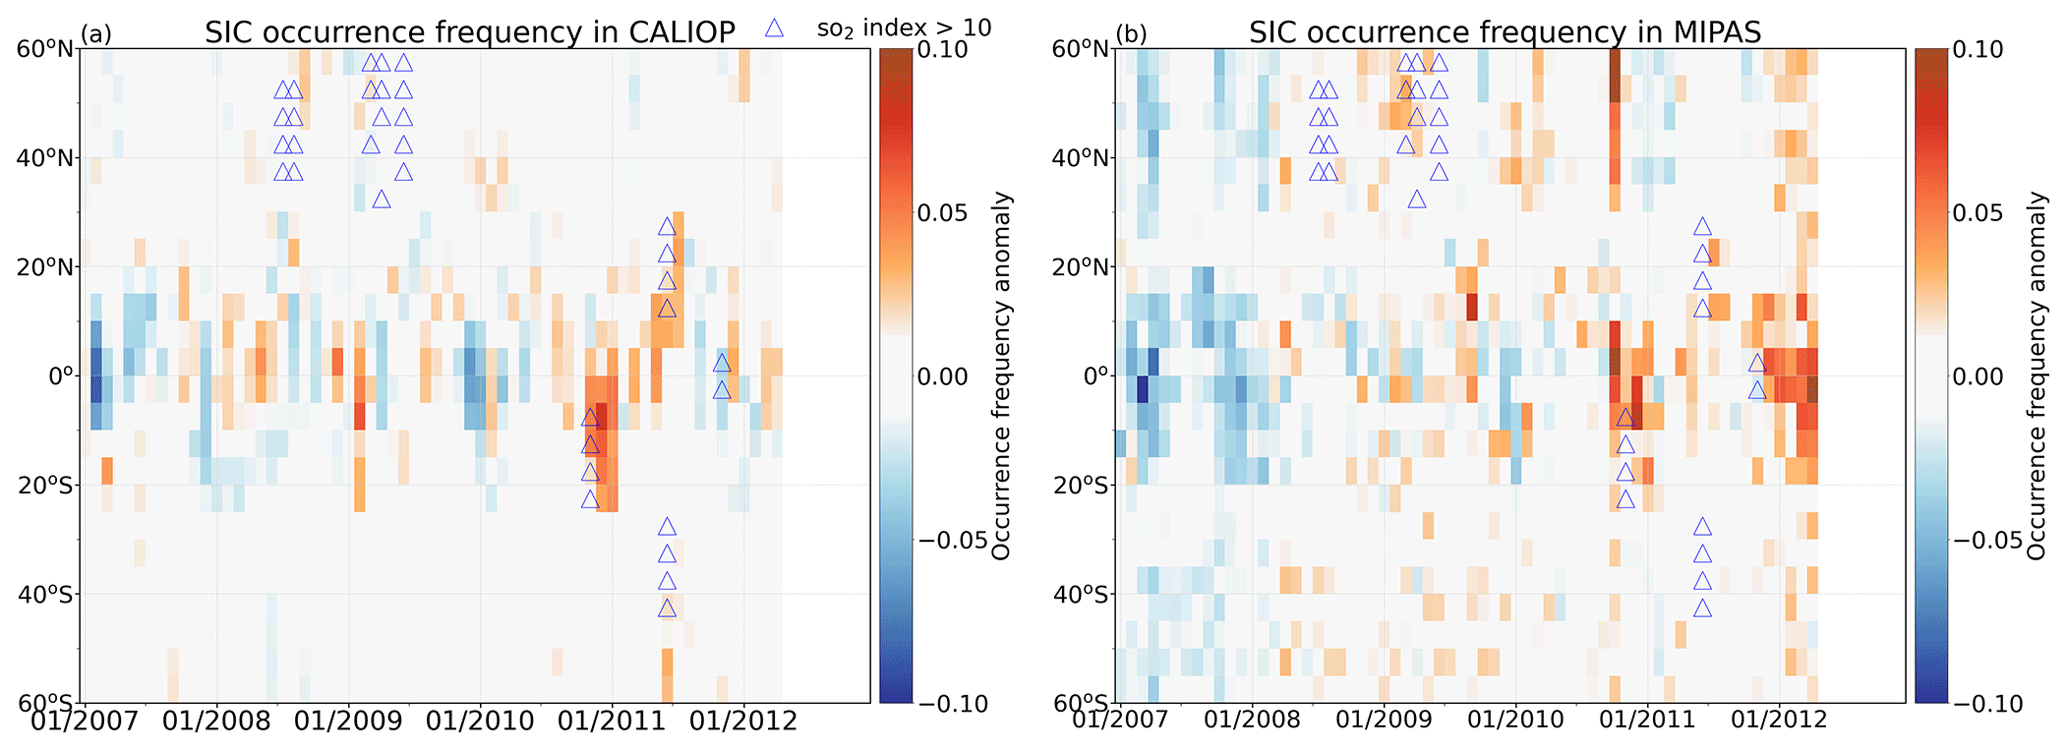
Figure 12Monthly anomalies of SIC occurrence frequencies from CALIOP (a) and MIPAS (b) measurements. Blue triangles are data with SI >10 K, as derived from AIRS observations.
As the lifetime of tropical tropopause layer (TTL) cirrus may be as long as 12–24 h (Jensen et al., 2011), we also analyzed the correlation with UTLS clouds observed by AIRS measurements 12 h (−12 LTD) and 24 h (−24 LTD) before the SIC detection (Appendix C). The left column of Fig. C1 shows fractions of SICs related to UTLS clouds, which are detected at 0 and −12 LTD (UTLS clouds at −12 ∪ 0 LTD) to SICs, and the right column (Fig. C1) are fractions of SICs related to UTLS clouds detected at 0, −12, and −24 LTD (UTLS clouds at −24 ∪ 0 LTD) in different seasons. We find that fractions of SICs related to UTLS clouds generally increase by 10 % when another 12 h time period is included. More SIC occurrences can be traced back to UTLS clouds if the lifetime of SICs is taken into account. However, the higher fractions could simply be produced by only involving more time steps and data. Further analysis would require knowledge on the lifetime of SICs.
The sampling time of CALIOP may have an impact on the results presented here. While the diurnal cycle of high-altitude reaching convection is well known (Hendon and Woodberry, 1993; Tian et al., 2006; Hohenegger and Stevens, 2013), little is known about the lifetime and diurnal cycle of SICs (Dauhut et al., 2020). At midlatitudes, over the central United States, the largest average fraction of overshoots was observed during the late afternoon to early evening at local time (Cooney et al., 2018; Solomon et al., 2016), whereas CALIOP samples this area during the local minimum. In the tropics, the maximum precipitation from large mesoscale convective systems occurred in the local afternoon over land (Nesbitt and Zipser, 2003), but CALIPSO passes by the tropics after midnight (around 01:30 LT). Stratospheric clouds in the tropics have two peaks at 19:00–20:00 LT and the 00:00–01:00 LT from Cloud–Aerosol Transport System (CATS) lidar measurements. The expansion of convective clouds, the spread of winds, and the propagation of convective-generated gravity waves can all play a role in the high percentages of stratospheric clouds observed later (Dauhut et al., 2020). Since only measurements at 01:30 LT were used in this study, it is important to keep in mind the possible limitations associated with the diurnal cycles of deep convection and SICs.
4.3 Stratospheric aerosols and SIC uncertainties
Stratospheric aerosols (dust, contaminated dust, and volcanic ash) were extracted from CALIPSO measurements to investigate their correlation with SICs. High correlation coefficients of SICs and SAs (Fig. 9d) and some high SIC occurrence frequencies co-occurring immediately with or with a 1–2 month lag after large volcanic eruptions or wildfires (Fig. 11) indicate the potential effects of volcanic aerosol and biomass burning on the observation of SICs with CALIPSO.
Despite the recent improvements in CALIOP aerosol and cloud discrimination (Liu et al., 2019), we investigated potential aerosol cloud misclassifications further by comparing the SIC anomalies of CALIOP and Michelson Interferometer for Passive Atmospheric Sounding (MIPAS) measurements from January 2007 to April 2012 (Fig. 12). As MIPAS is an infrared limb emission instrument and its algorithm for classification between ice, volcanic ash, and sulfate aerosol is entirely different to CALIPSO, as it relies on spectral signatures (Griessbach et al., 2014, 2016), we assumed that it does not necessarily show the same anomalies. At SH midlatitudes one (June 2011, 40–65∘ S) out of two positive SIC anomalies between 2007 and 2012 in the CALIOP data coincides with the volcanic plume after the eruption of Puyehue-Cordón Caulle in June 2011. In the MIPAS data, this anomaly is not visible. The eruption of Puyehue-Cordón Caulle is known to have injected significant amounts of volcanic ash (Klüser et al., 2013; Hoffmann et al., 2014a). Moreover, Klüser et al. (2013) show that “the ash plume is transported very close to and potentially partly within or beneath ice clouds”. In such a case, the CALIOP cloud fringe amelioration algorithm might rather classify these detections as ice clouds instead of aerosol (Liu et al., 2019). Moreover, Liu et al. (2019) point out that the aerosol cloud classification for this volcanic plume was particularly challenging due to the dense and depolarizing aerosol.
At NH midlatitudes, one significant positive SIC anomaly (August to October 2008, 45–60∘ N) in the CALIOP data also coincides with the volcanic plume after the eruption of Kasatochi Island in June 2008. In MIPAS, this anomaly is not visible, but starting from November 2008, a positive anomaly is visible. The Kasatochi Island eruption is known to have mainly injected SO2 (1.21 Tg) and some ash (0.31 Tg; e.g., Prata et al., 2010). However, the volcanic aerosol plume following the eruption of the Sarychev Peak volcano in June 2009, which injected somewhat less SO2 (1 Tg; Clarisse et al., 2012) and a slightly smaller fraction of ash (Andersson et al., 2013), does not coincide with a positive SIC anomaly. The major difference between both plumes is that the Kasatochi Island plume was distributed around the tropopause at altitudes between 9.1–13.7 km (Corradini et al., 2010), whereas the Sarychev Peak plume was distributed over a larger altitude range and reached higher into the stratosphere, with plume heights between 8.5 and 17.5 km (e.g., Doeringer et al., 2012). Especially the higher plume height makes it less likely to be interpreted as an ice cloud in the lowermost stratosphere.
In the tropics, the two strongest anomalies for CALIOP are correlated with the volcanic eruptions of Merapi in November 2010 (November 2010 to January 2011; SH tropics) and the Nabro Volcano in June 2011 (May to July 2011; NH tropics; Figs. 11 and 12). In both cases, the MIPAS data also show a positive, but weaker, anomaly. As volcanic aerosol is known to induce ice cloud formation, and although the MIPAS data are more noisy and also show some (not discussed) significant anomalies which are not present in the CALIOP data, we consider that the analysis of positive correlations between SICs and aerosol requires a more in-depth investigation to separate causal correlations from potential misclassifications in CALIPSO data.
In this study, we conducted relationship analyses between stratospheric ice clouds and lapse rate tropopause temperature, UTLS clouds, gravity waves, and stratospheric aerosols based on 13 years (2007–2019) of satellite observations by CALIPSO and AIRS, together with tropopause data from the ERA5 reanalyses.
SICs are mainly detected over the tropical continents. Spatial and temporal variations in SICs from 2007 to 2019 indicate that SICs in the tropics follow the ITCZ over time. Monthly time series in Fig. 2 show the interannual variability in SICs at different latitudes, for example, pronounced high SICs at 15∘ S–5∘ N in November 2010 to January 2011, 20–40∘ S in May 2015, and low SIC occurrence frequencies over the tropics in 2015–2016. The highest occurrence frequencies of SICs at midlatitudes are more often observed in local winters.
Several processes and parameters, i.e., double tropopauses, tropopause temperature, UTLS clouds, gravity waves, and stratospheric aerosols are investigated individually with respect to the occurrence of SICs in the tropics and at midlatitudes. We found that SICs associated with the double tropopauses are mostly located at midlatitudes (between 25–60∘) in wintertime. During local winter and autumn, nearly 80 %–100 % of the SICs associated with double tropopauses are observed around 30∘ N/S, which are closely related to the poleward isentropic transport and mixing of water vapor in the lowermost stratosphere (Randel et al., 2007; Peevey et al., 2012; Spang et al., 2015). SIC occurrences are inversely correlated with tropopause temperatures; the coldest LRT1 coincides with the highest occurrence frequencies of SICs over the tropical continents. Patterns of high event frequencies of UTLS clouds, occurrence frequencies of gravity waves, and stratospheric aerosols have high consistency with the SICs over the tropical continents, the northern Pacific, central North America, and southern South America in different seasons.
We found that, over the tropical continents, the highest correlation coefficients of SICs are with tropopause temperature. UTLS clouds have the highest correlations with SICs in the monsoon domains and over the central United States. At midlatitudes, in the latitude range between 45 and 60∘, especially over Patagonia and the Drake Passage, tropopause temperature and gravity waves have the highest correlation with the occurrence of SICs. However, the second-highest correlation coefficients of SICs are mixed with all other processes. The overlapping high correlation coefficients and relatively close correlation coefficients (0.6≤ absolute r<0.8 or 0.8≤ absolute r<1.0.) of SICs with all discussed processes indicate strong associations between the tropopause temperature, UTLS clouds, gravity waves, and stratospheric aerosols (Gettelman et al., 2002; Bourassa et al., 2012; Hoffmann et al., 2013; Dinh et al., 2016), which increases the challenge of separating their effects on the occurrence of SICs.
Monthly anomaly analyses of SICs and the abovementioned processes for 5∘ latitude bands reveal more explicit influences of processes on the interannual variability in SIC anomalies. The anomalous SICs are mostly in line with the tropopause temperature. Volcanic eruptions that produce high stratospheric aerosol loads can largely influence the scale- and time-limited high SIC occurrence frequencies, such as some strong volcanoes like Merapi, Nabro Volcano, and Puyehue-Cordón Caulle in 2011, Calbuco in 2015, and Raikoke in 2019. The possible misclassification of clouds and aerosols by CALIOP should be noted. However, the contributions of UTLS clouds and gravity waves to the interannual variability in SIC anomalies are negligible.
We investigated the distribution and time series of stratospheric ice clouds and assessed their relationships with tropopause temperature, UTLS clouds, gravity waves, and stratospheric aerosols. All processes have high correlations with the occurrence of and variability in SICs. However, the high inherent correlations of all processes make it difficult to disentangle their contributions. The occurrence of and variability in SICs show a substantial spatial and temporal dependency on different processes. To further explore the formation mechanisms and precisely elucidate the origin of SICs, specific regional analyses, Lagrangian modeling, and microphysical simulations are required in future studies.
Figure A1 shows the seasonal event frequencies of SICs, which is the ratio of the number of days on which SICs (≥1 detection) occur to the total number of days in a given time period. Global features are similar to occurrence frequencies in Fig. 1. Hotspots of SICs are located over the tropical continents. However, event frequencies are lower than occurrence frequencies in the tropics but higher than occurrence frequencies at midlatitudes. High latitudes will not be discussed here in detail, as high event frequencies may relate to the occurrence of PSCs. From Figs. A1 and 1, we can find that SICs are more frequently detected over the tropics than at midlatitudes, and the horizontal extent of SICs over the tropics is much wider than that at midlatitudes.
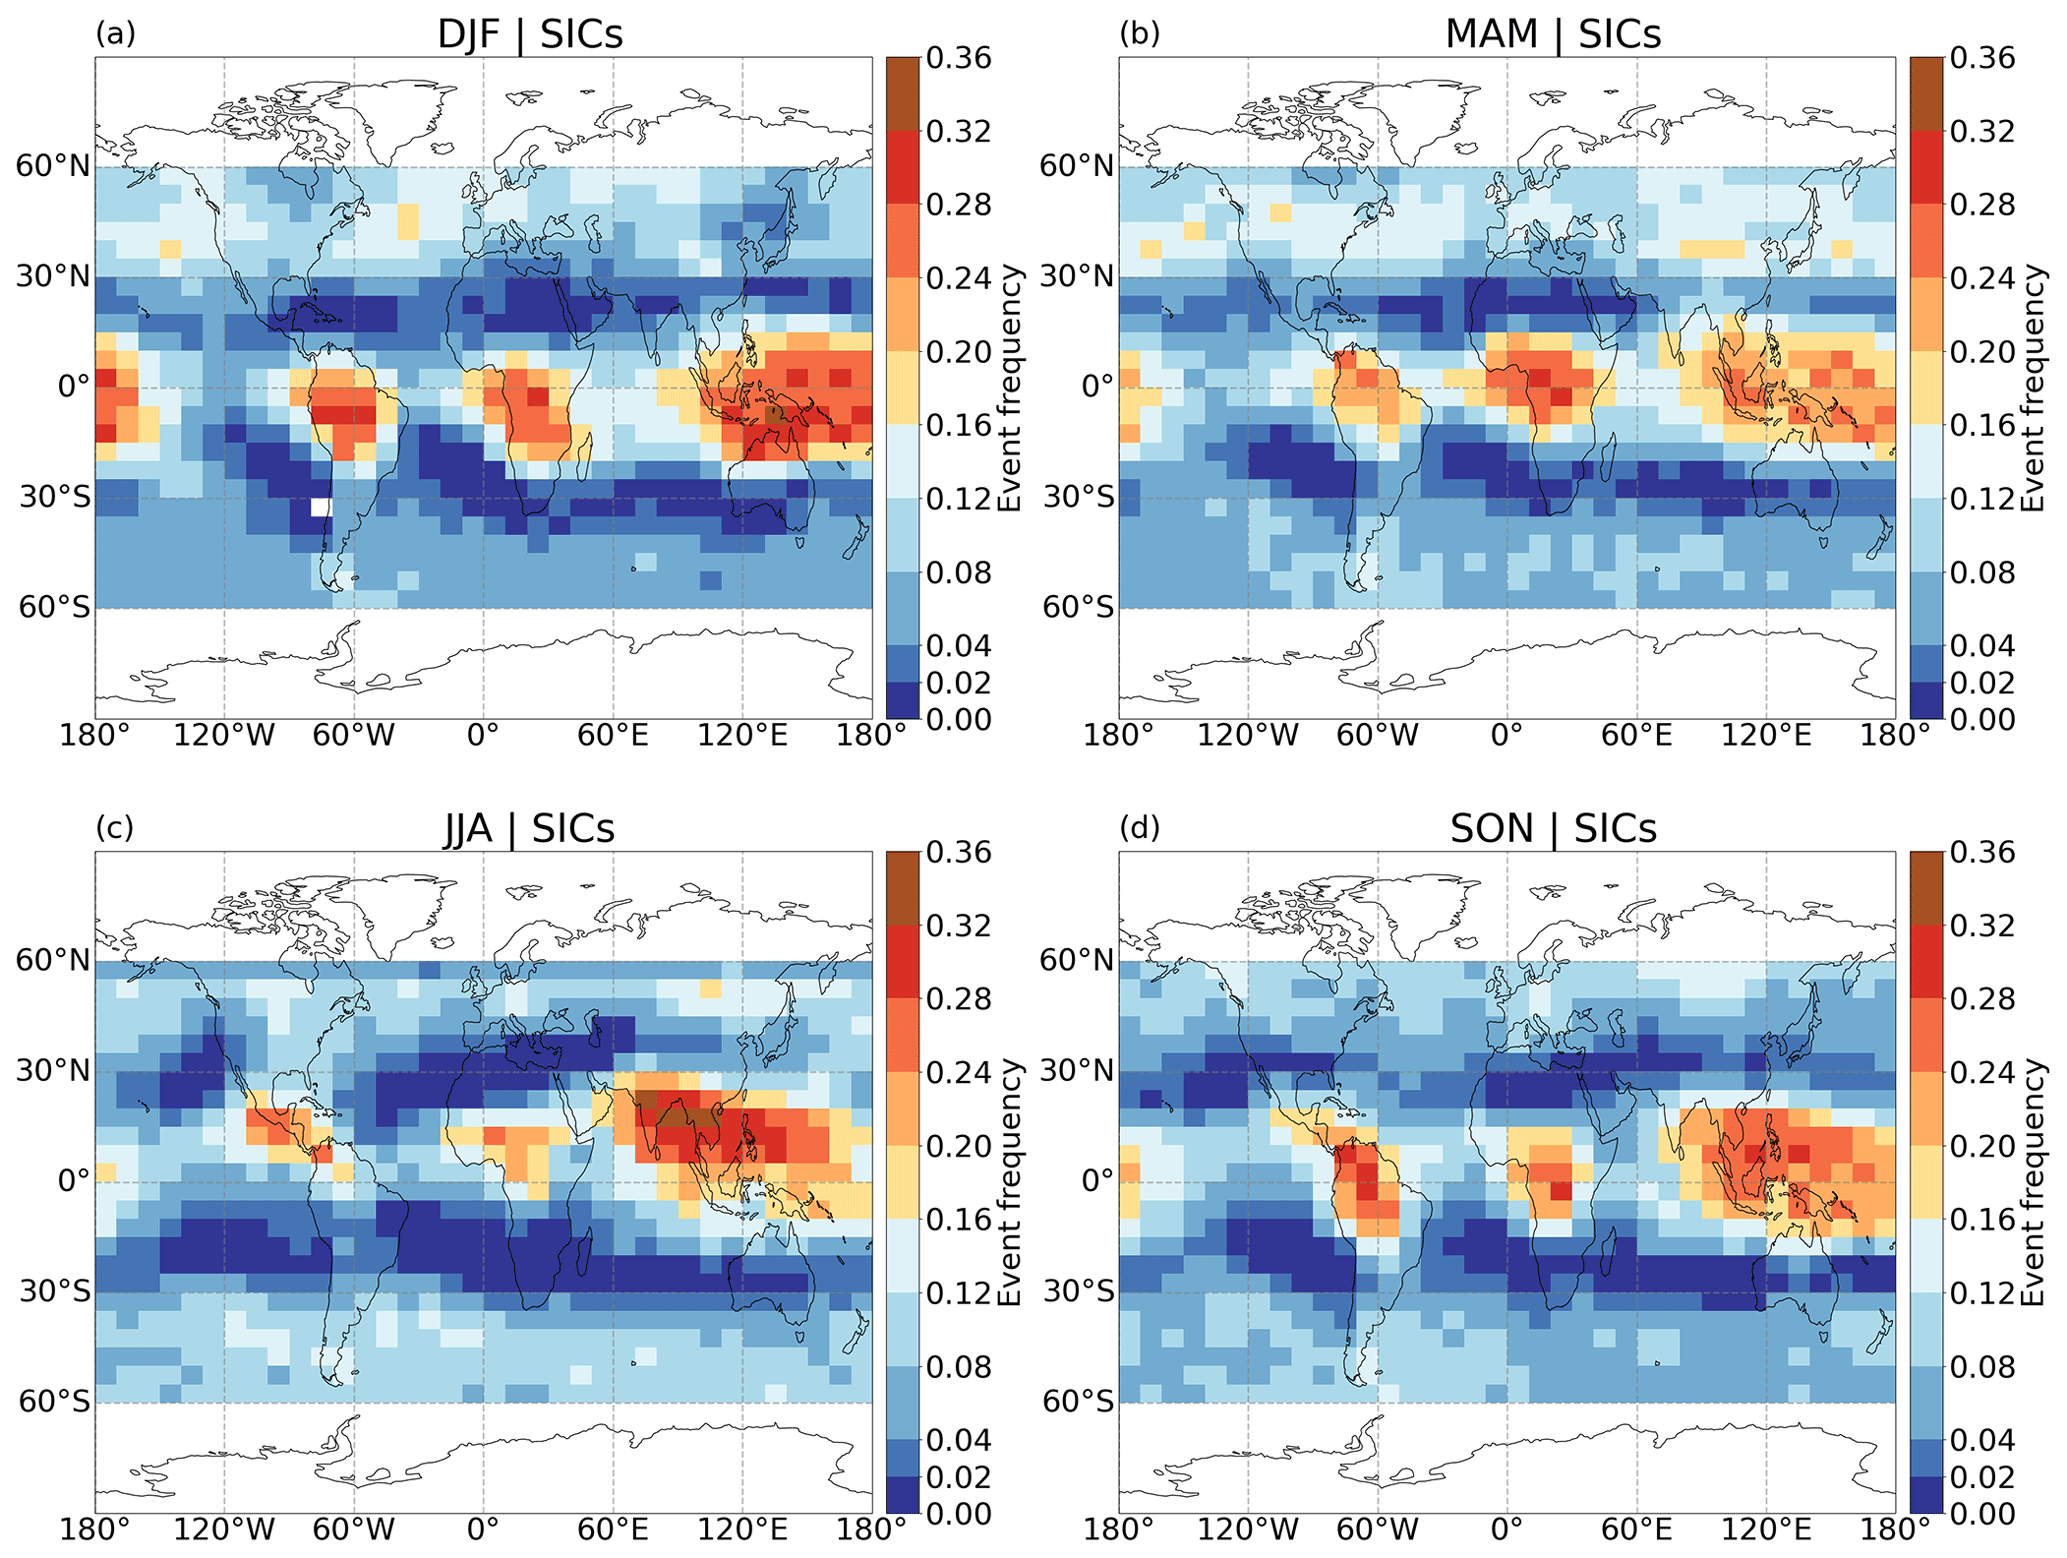
Figure A1Event frequencies of SICs on a (latitude × longitude) grid box from CALIPSO measurements during 2007–2019.
The occurrence frequency of UTLS clouds in AIRS is presented in Fig. B1. In DJF, high occurrence frequencies of UTLS clouds are found over the northern Pacific, Alaska, western Canada, the northern Atlantic close to the United States, the eastern and western side of the Tibetan plateau, Argentina and southern Brazil, northern Australia, the Mediterranean, and the Black Sea region. In JJA, hotspots of UTLS clouds are located over central North America (Great Plains), central America, central Africa, southern Asia, the western Pacific Ocean, over southern Brazil, and the latitudinal band at 30–45∘ S. MAM and SON are intermediate seasons which have similar regions of high UTLS cloud frequency as DJF and JJA. The seasonal patterns and magnitudes of UTLS cloud frequency are overall similar to the results shown in Hoffmann et al. (2013). Similar patterns can be found both in the event frequency and occurrence frequency of UTLS clouds, but signals in Fig. 5 are much stronger than those in Fig. B1.
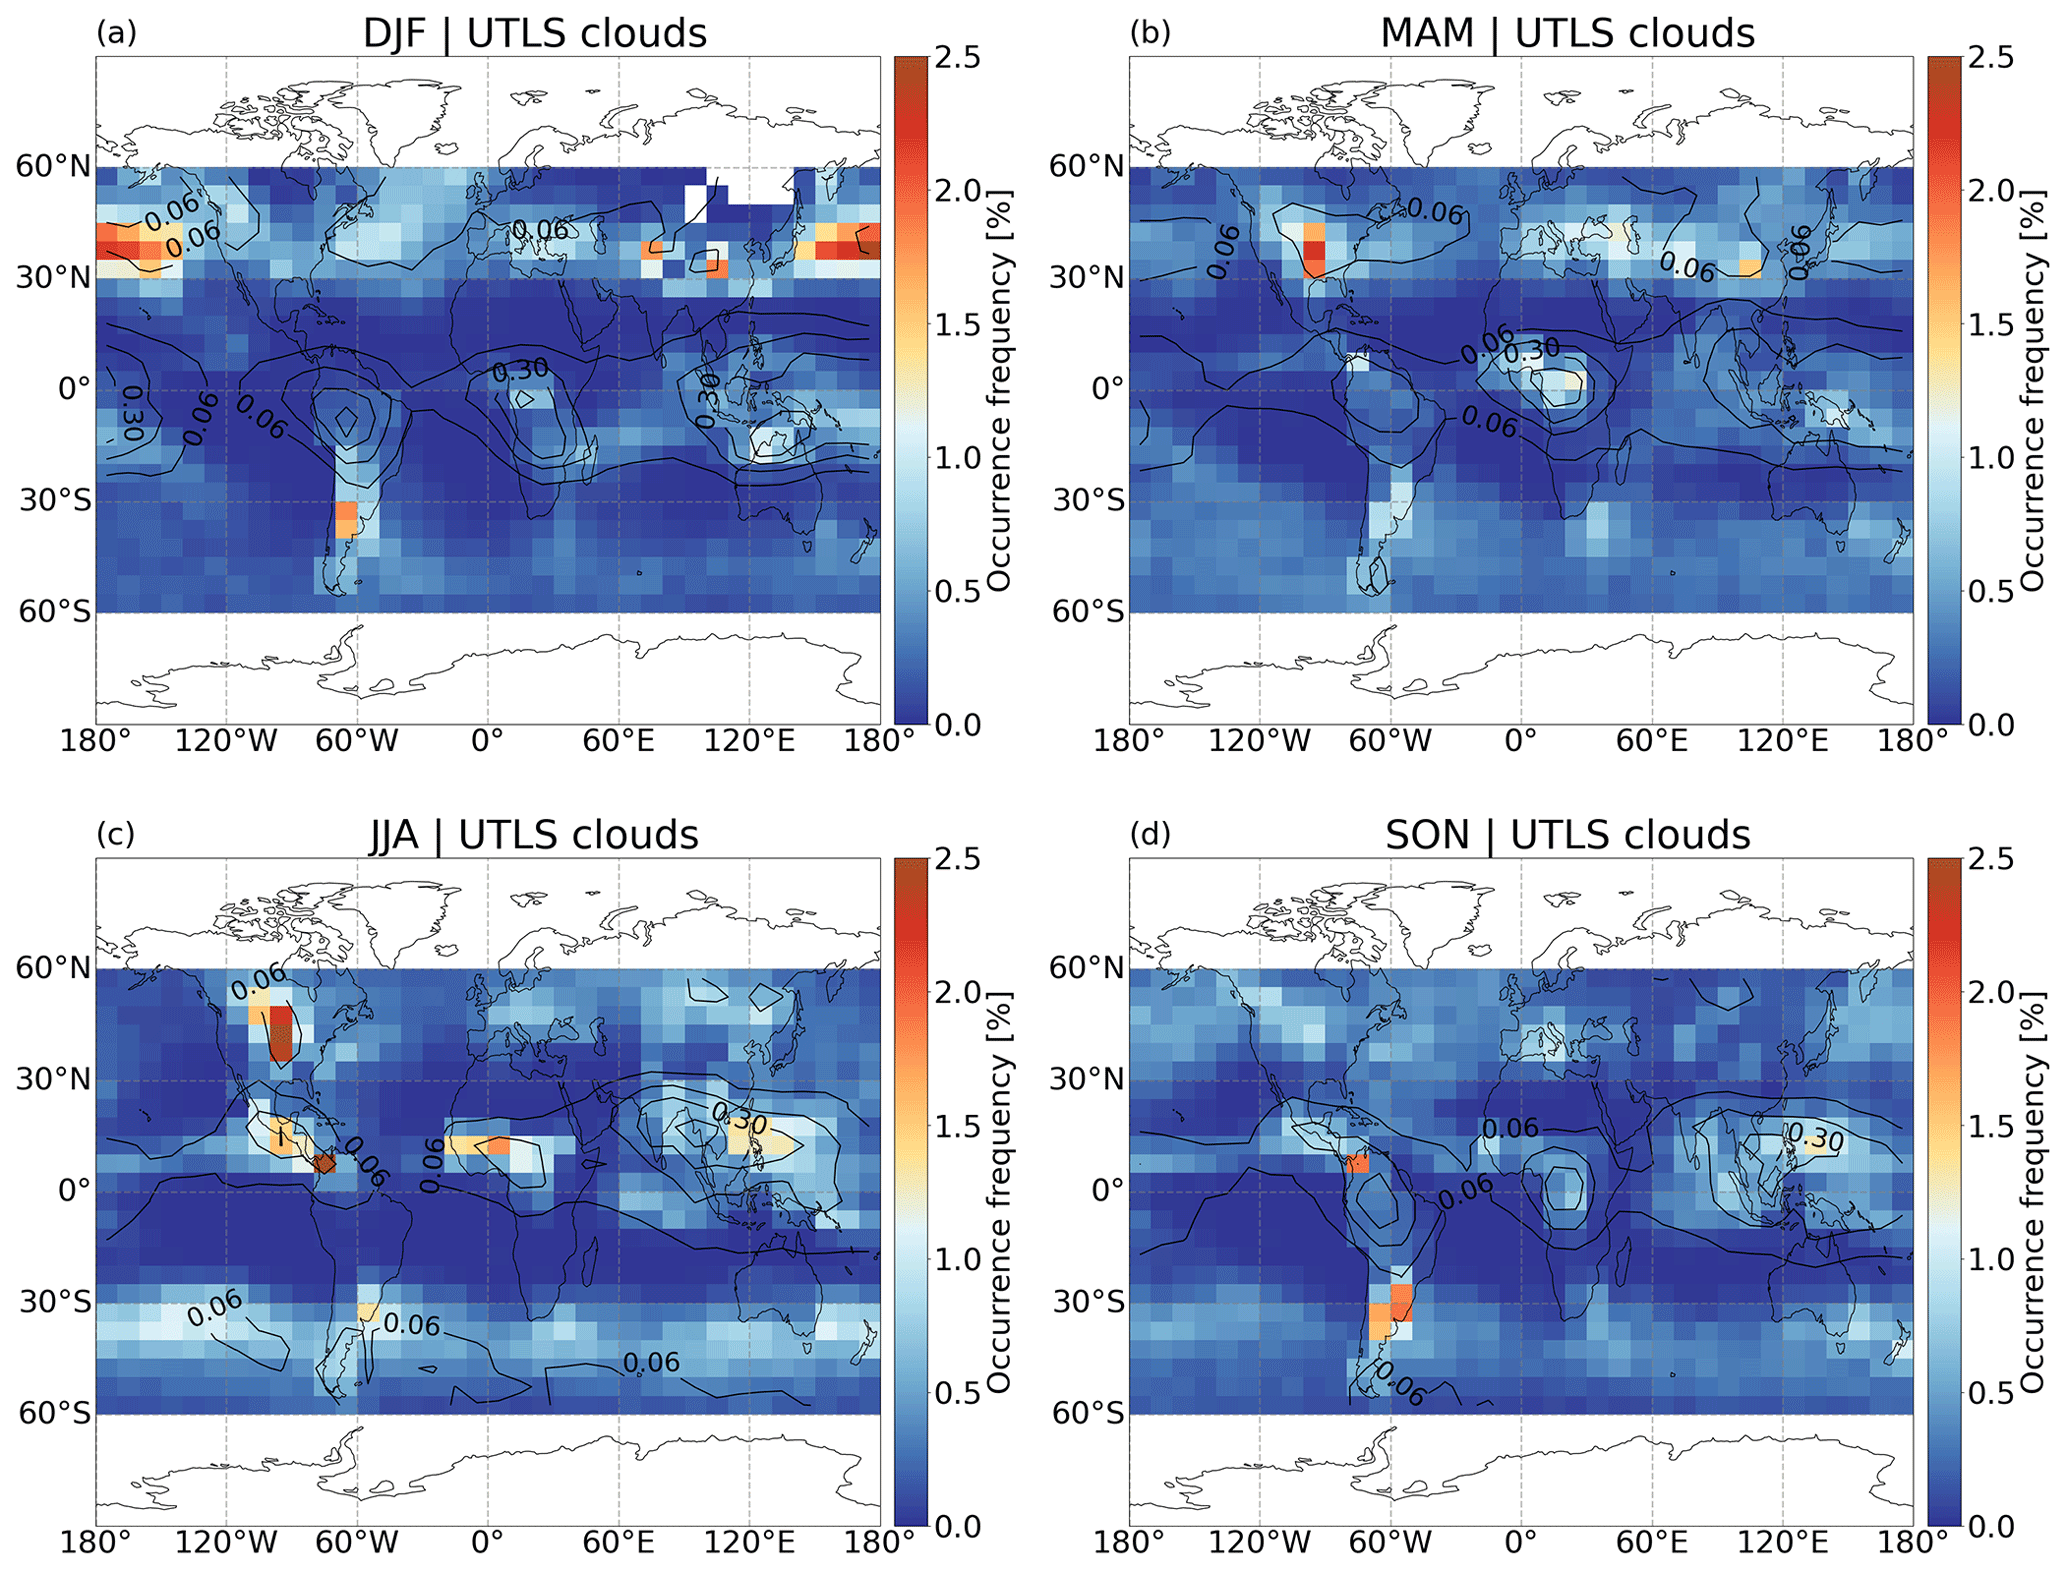
Figure B1Seasonal mean occurrence frequency of UTLS clouds derived from AIRS measurements during 2007–2019. Black contours are the occurrence frequencies of SICs, as shown in Fig. 1a–d.
Considering the possible effects of UTLS clouds that occurred before the detection time of the SICs, we analyzed UTLS clouds from AIRS observations 12 h (−12 LTD) and 24 h (−24 LTD) before the SIC detections in Fig. C1. The left column shows fractions of SICs related to UTLS clouds, which are detected at 0 LTD and −12 LTD (UTLS clouds at −12 ∪ 0 LTD) to SICs, and the right column (Fig. C1) has fractions of SICs related to UTLS clouds detected at 0, −12, and −24 LTD (UTLS clouds at −24 ∪ 0 LTD) in difference seasons. By comparing the results in Figs. 6 and C1, we find that about 10 % more SICs are related to the UTLS clouds when another 12 h time period is included. It is found that more SIC occurrences can be traced back to UTLS clouds if the longer lifetimes of SICs are considered. However, the higher fractions could also only be produced by involving more time steps and data in the analysis.
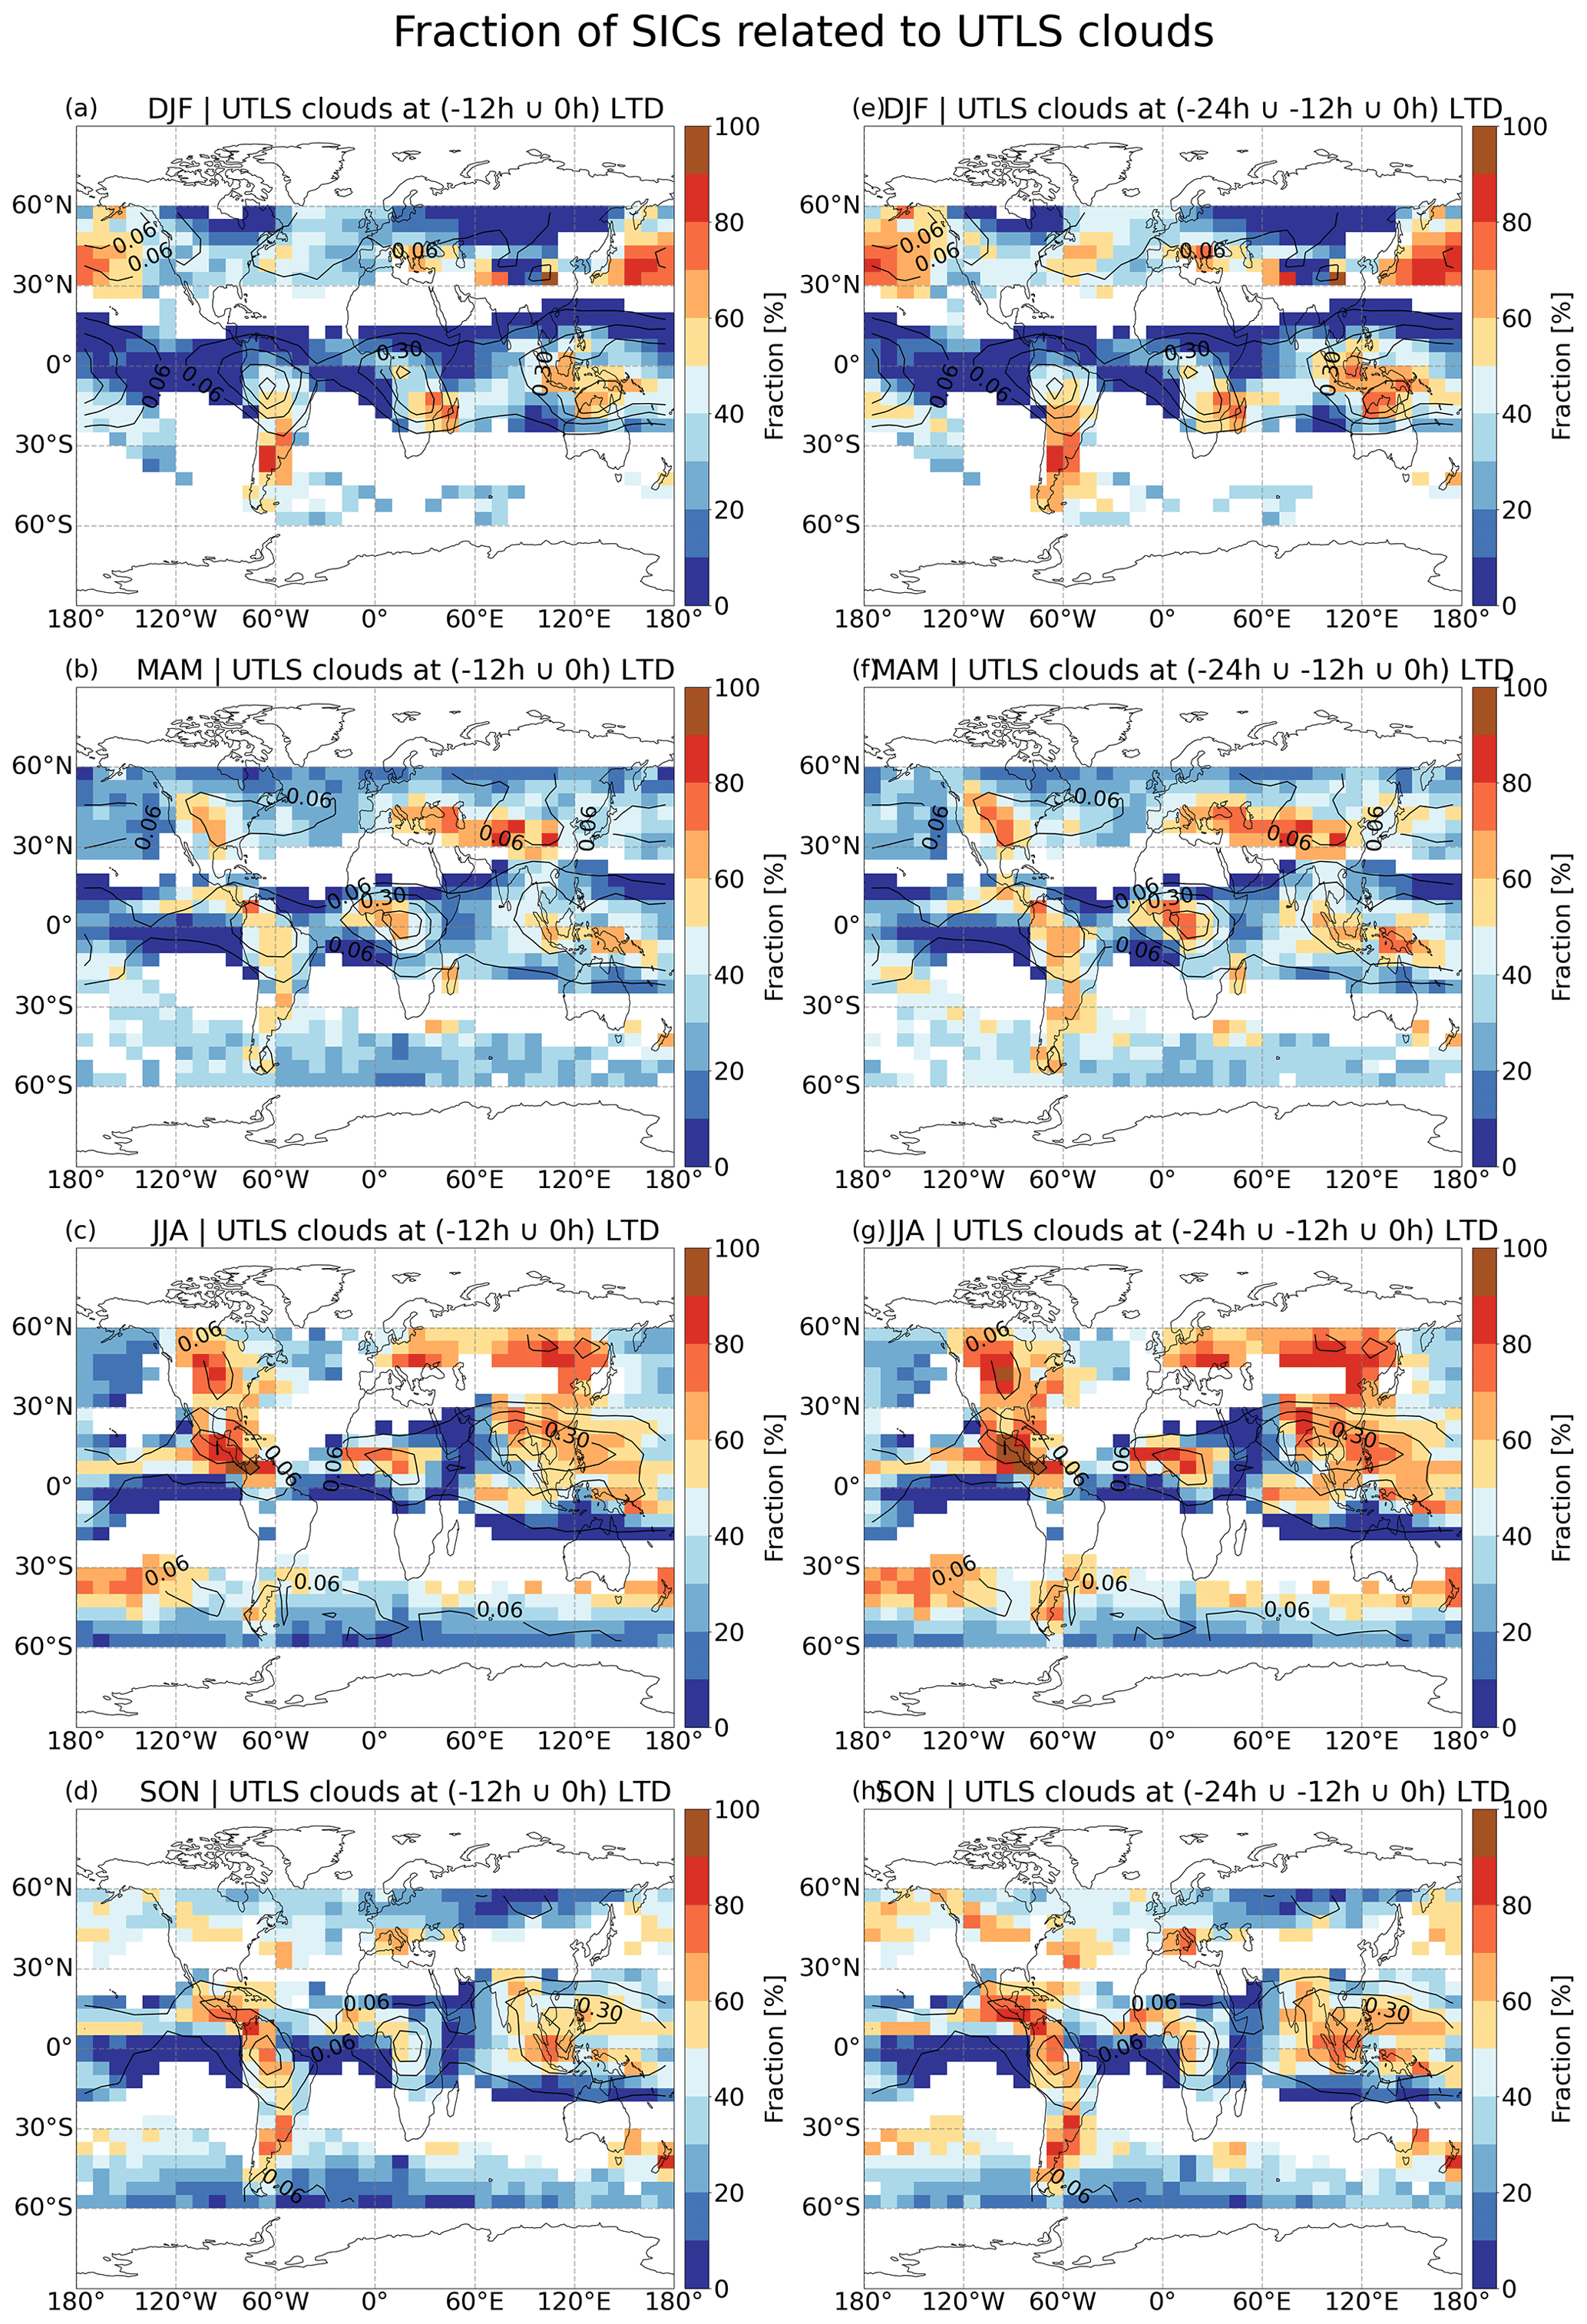
Figure C1Fraction of SICs related to UTLS clouds, with UTLS clouds observed by AIRS measurements 12 h (−12 LTD) and 24 h (−24 LTD) before the SIC detection. The occurrence frequency of SICs shown in the black contours are based on the data presented in Fig. 1a–d.
Anomalies for regional means over the tropics (20∘ S–20∘ N), northern midlatitudes (40–60∘ N), and southern midlatitudes (40–60∘ S) are shown as lines in Fig. D1, which are the differences between the monthly mean and all-year mean values. Seasonal cycles of parameters are included in the linear anomalies over three latitude bands. For the linear mean anomalies, SICs, LRT1-T, UTLS clouds, and gravity waves show seasonal cycles in the tropics and at midlatitudes. In the tropics and at NH midlatitudes, high SIC occurrence frequencies are detected during the boreal winter, and low-occurrence frequencies are seen during the boreal summer, in contrast to the situation at SH midlatitudes. Seasonal cycles of SIC occurrence frequencies are generally consistent with UTLS clouds and gravity waves but opposite to tropopause temperatures. No obvious seasonal cycles can be found in stratospheric aerosols over all regions. However, the regional mean abnormal high SAs influence the variability in SICs, i.e., September 2008 and August 2017 in NH midlatitudes, April 2018 and January 2019 in the tropics, and June 2011 at SH midlatitudes.
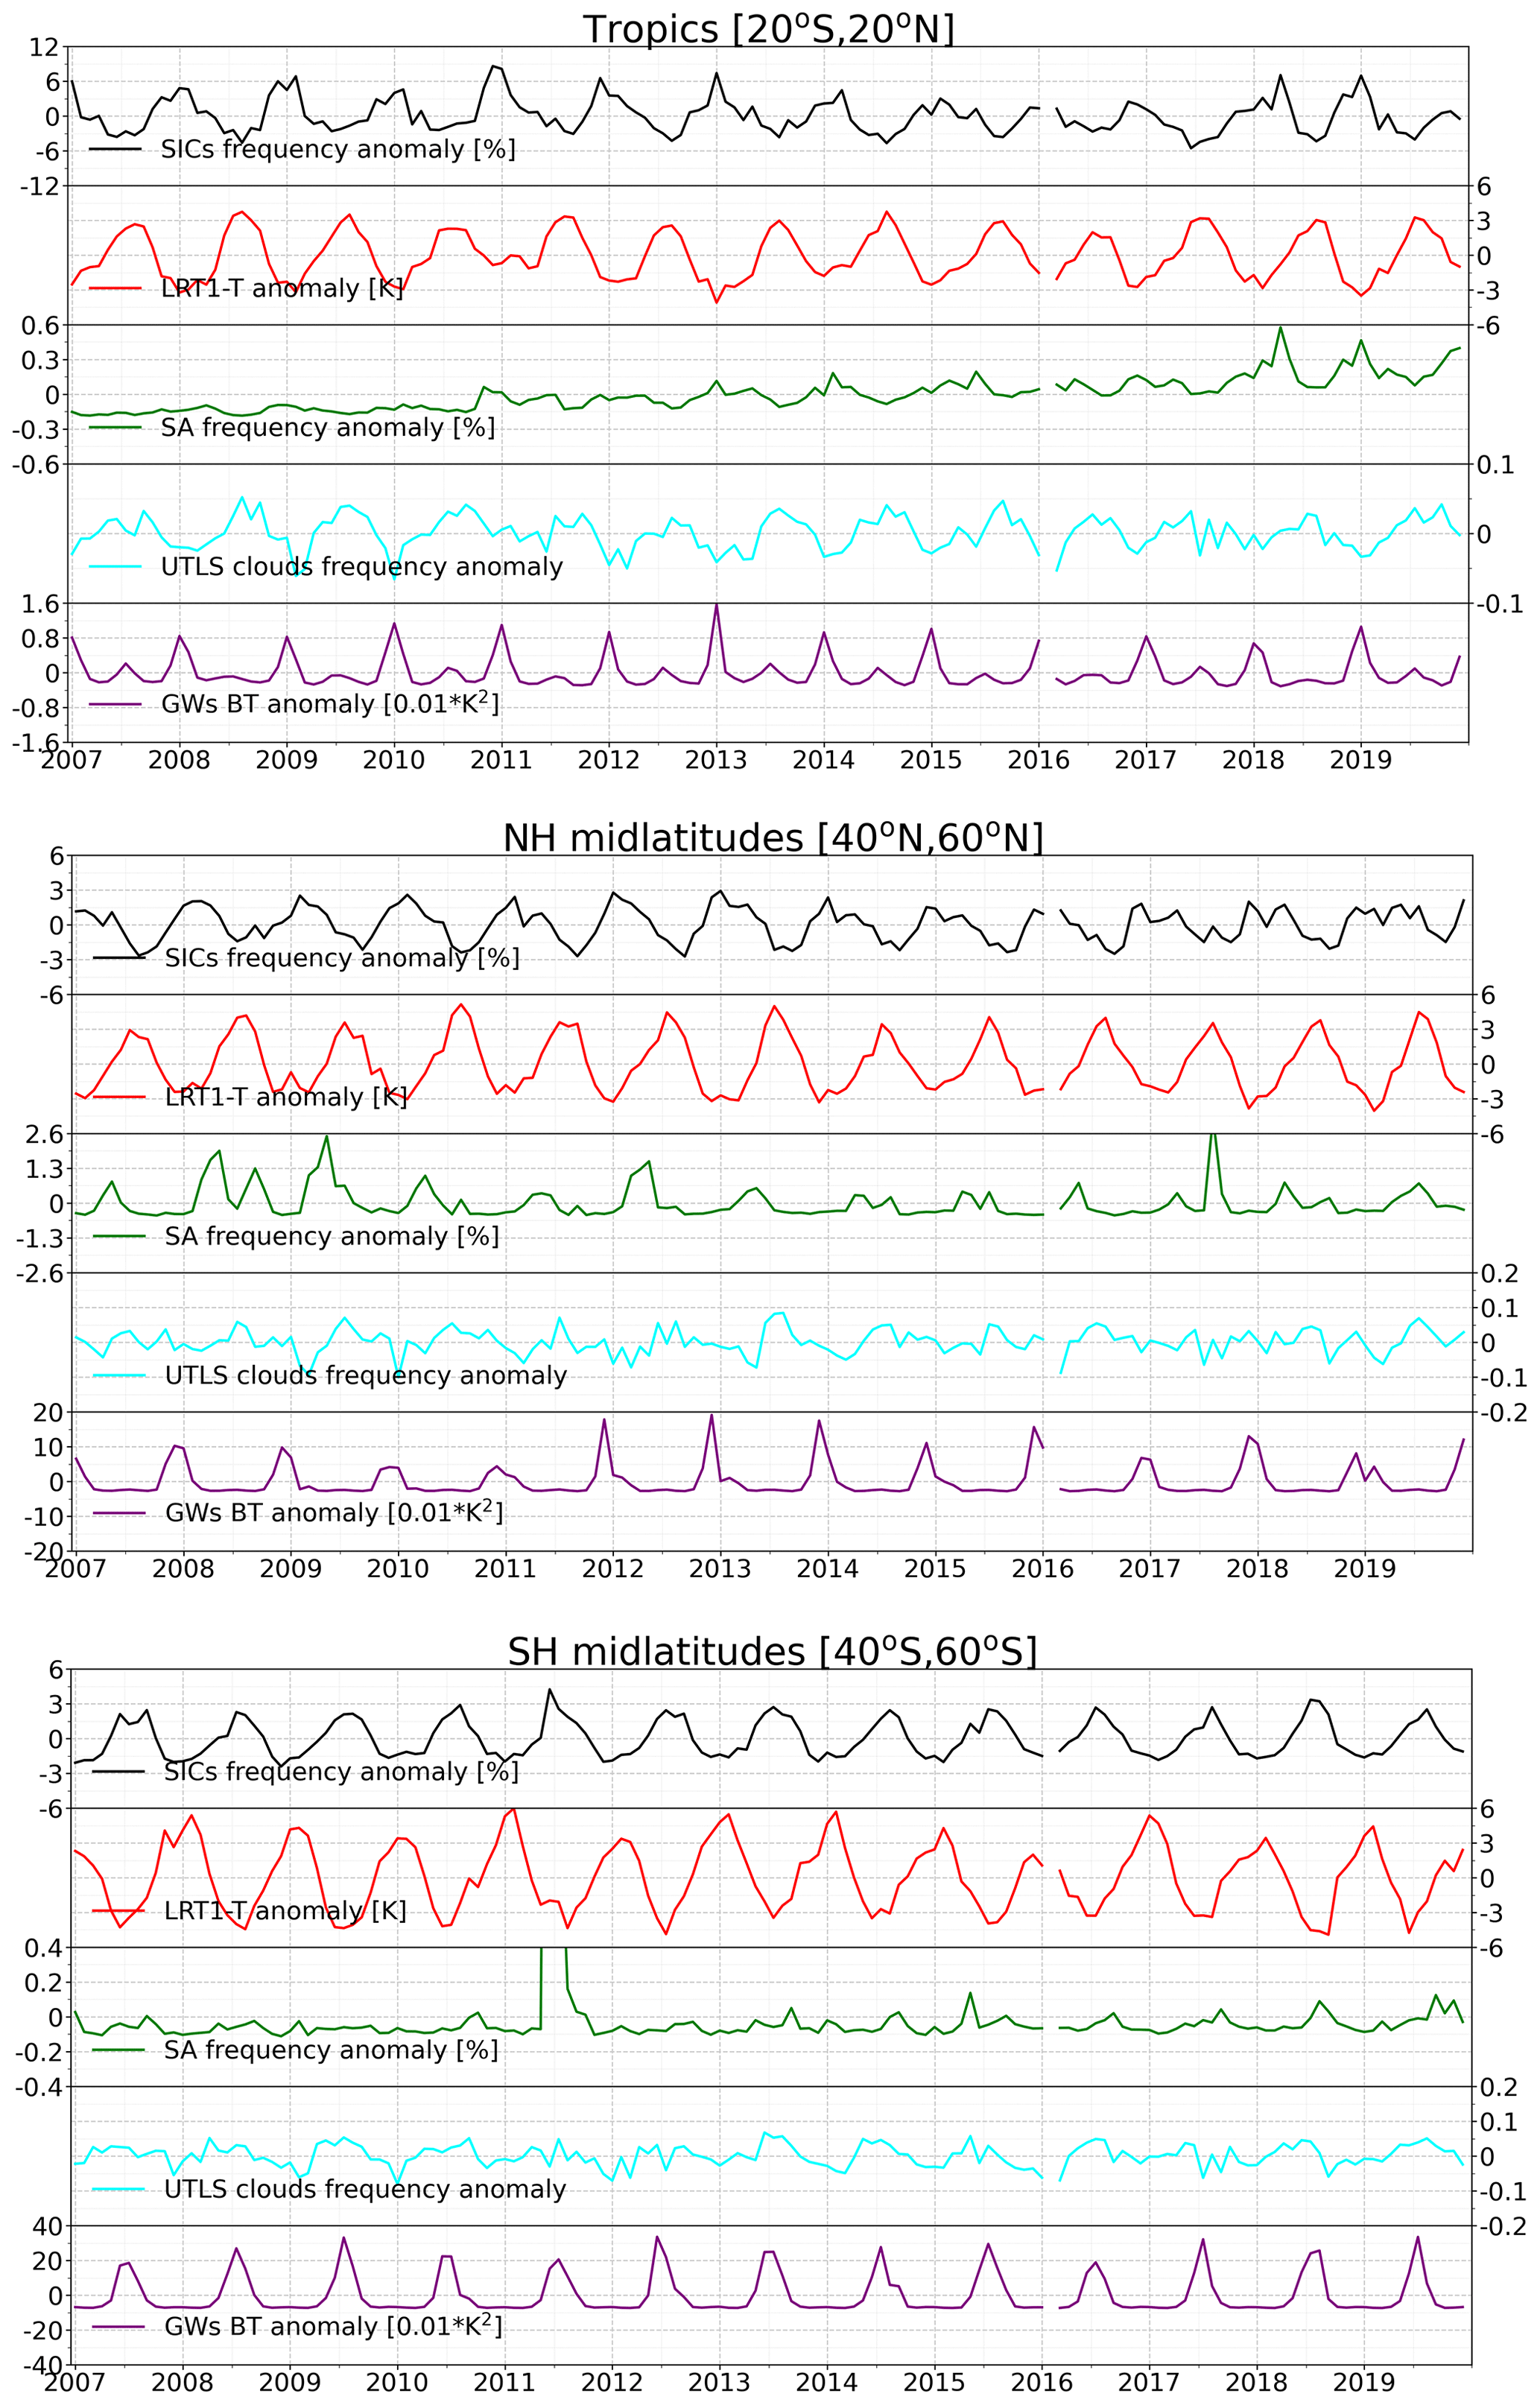
Figure D1Regional averaged monthly anomalies of SIC occurrence frequency, LRT1 temperature, stratospheric aerosol occurrence frequency, UTLS clouds, and gravity waves from 2007 to 2019 over the tropics (20∘ S–20∘ N), northern midlatitudes (40–60∘ N), and southern midlatitudes (40–60∘ S).
Convection and gravity wave data from AIRS used in this study are available at https://doi.org/10.17616/R34J42 (Hoffmann, 2020). ERA5 tropopause data are available at https://doi.org/10.17616/R31NJMOH (Hoffmann, 2021a). The AIRS volcanic data are available at https://doi.org/10.26165/JUELICH-DATA/VPHA3R (Hoffmann, 2021b). Cirrus cloud-top heights from CALIPSO are available upon request from the contact author, Ling Zou (l.zou@fz-juelich.de; cheryl_zou@whu.edu.cn).
LZ, LH, SG, and RS conceived the study design. LH provided the AIRS data and the ERA5 tropopause data. SG provided the MIPAS data. LZ processed the CALIPSO data and compiled all results. LZ wrote the paper with contributions from all authors.
The contact author has declared that neither they nor their co-authors have any competing interests
Publisher’s note: Copernicus Publications remains neutral with regard to jurisdictional claims in published maps and institutional affiliations.
Ling Zou was supported by the National Natural Science Foundation of China under (grant no. 41801021). We gratefully acknowledge the computing time granted on the supercomputers JURECA and JUWELS at Forschungszentrum Jülich. CALIPSO data are obtained from the NASA Langley Research Center Atmospheric Science Data Center. The AIRS data were distributed by the NASA Goddard Earth Sciences Data Information and Services Center. The ERA5 data were obtained from the European Centre for Medium-Range Weather Forecasts. The MIPAS data were provided by the European Space Agency.
This research has been supported by the Deutsche Forschungsgemeinschaft (grant no. DFG HO5102/1-1).
The article processing charges for this open-access publication were covered by the Forschungszentrum Jülich.
This paper was edited by Matthias Tesche and reviewed by three anonymous referees.
Abhik, S., Hendon, H. H., and Wheeler, M. C.: On the Sensitivity of Convectively Coupled Equatorial Waves to the Quasi-Biennial Oscillation, J. Climate, 32, 5833–5847, https://doi.org/10.1175/JCLI-D-19-0010.1, 2019. a
Andersson, S. M., Martinsson, B. G., Friberg, J., Brenninkmeijer, C. A. M., Rauthe-Schöch, A., Hermann, M., van Velthoven, P. F. J., and Zahn, A.: Composition and evolution of volcanic aerosol from eruptions of Kasatochi, Sarychev and Eyjafjallajökull in 2008–2010 based on CARIBIC observations, Atmos. Chem. Phys., 13, 1781–1796, https://doi.org/10.5194/acp-13-1781-2013, 2013. a
Ansmann, A., Baars, H., Chudnovsky, A., Mattis, I., Veselovskii, I., Haarig, M., Seifert, P., Engelmann, R., and Wandinger, U.: Extreme levels of Canadian wildfire smoke in the stratosphere over central Europe on 21–22 August 2017, Atmos. Chem. Phys., 18, 11831–11845, https://doi.org/10.5194/acp-18-11831-2018, 2018. a
Aumann, H. H., Gregorich, D., Gaiser, S., Hagan, D., Pagano, T., Strow, L., and Ting, D.: AIRS Algorithm Theoretical Basis Document Level 1B Part 1: Infrared Spectrometer, Tech. rep., NASA, https://eospso.gsfc.nasa.gov/sites/default/files/atbd/AIRS_L1B_ATBD_Part_1.pdf (last access: 1 March 2021), 2000. a
Aumann, H. H., Chahine, M. T., Gautier, C., Goldberg, M. D., Kalnay, E., McMillin, L. M., Revercomb, H., Rosenkranz, P. W., Smith, W. L., Staelin, D. H., Strow, L. L., and Susskind, J.: AIRS/AMSU/HSB on the aqua mission: Design, science objectives, data products, and processing systems, IEEE T. Geosci. Remote, 41, 253–263, https://doi.org/10.1109/TGRS.2002.808356, 2003. a
Aumann, H. H., Gregorich, D., and De Souza-Machado, S. M.: AIRS observations of deep convective clouds, in: Atmospheric and Environmental Remote Sensing Data Processing and Utilization II: Perspective on Calibration/Validation Initiatives and Strategies, 6301, 63010J, SPIE, https://doi.org/10.1117/12.681201, 2006. a, b
Aumann, H. H., DeSouza-Machado, S. G., and Behrangi, A.: Deep convective clouds at the tropopause, Atmos. Chem. Phys., 11, 1167–1176, https://doi.org/10.5194/acp-11-1167-2011, 2011. a
Avery, M. A., Davis, S. M., Rosenlof, K. H., Ye, H., and Dessler, A. E.: Large anomalies in lower stratospheric water vapour and ice during the 2015–2016 El Niño, Nature Geosci., 10, 405–409, https://doi.org/10.1038/ngeo2961, 2017. a
Barahona, D., Molod, A., and Kalesse, H.: Direct estimation of the global distribution of vertical velocity within cirrus clouds, Sci. Rep., 7, 1–11, https://doi.org/10.1038/s41598-017-07038-6, 2017. a
Bartolome Garcia, I., Spang, R., Ungermann, J., Griessbach, S., Krämer, M., Höpfner, M., and Riese, M.: Observation of cirrus clouds with GLORIA during the WISE campaign: detection methods and cirrus characterization, Atmos. Meas. Tech., 14, 3153–3168, https://doi.org/10.5194/amt-14-3153-2021, 2021. a
Bourassa, A. E., Robock, A., Randel, W. J., Deshler, T., Rieger, L. A., Lloyd, N. D., Llewellyn, E. J. T., and Degenstein, D. A.: Large Volcanic Aerosol Load in the Stratosphere Linked to Asian Monsoon Transport, Science, 337, 78–81, https://doi.org/10.1126/science.1219371, 2012. a, b
Chae, J. H. and Sherwood, S. C.: Annual temperature cycle of the tropical tropopause: A simple model study, J. Geophys. Res.-Atmos., 112, D19111, https://doi.org/10.1029/2006JD007956, 2007. a
Chahine, M. T., Pagano, T. S., Aumann, H. H., Atlas, R., Barnet, C., Blaisdell, J., Chen, L., Divakarla, M., Fetzer, E. J., Goldberg, M., Gautier, C., Granger, S., Hannon, S., Irion, F. W., Kakar, R., Kalnay, E., Lambrigtsen, B. H., Lee, S. Y., Le Marshall, J., Mcmillan, W. W., Mcmillin, L., Olsen, E. T., Revercomb, H., Rosenkranz, P., Smith, W. L., Staelin, D., Strow, L. L., Susskind, J., Tobin, D., Wolf, W., and Zhou, L.: Improving weather forecasting and providing new data on greenhouse gases, B. Am. Meteorol. Soc., 87, 911–926, https://doi.org/10.1175/BAMS-87-7-911, 2006. a
Chang, K.-W. and L'Ecuyer, T.: Influence of gravity wave temperature anomalies and their vertical gradients on cirrus clouds in the tropical tropopause layer – a satellite-based view, Atmos. Chem. Phys., 20, 12499–12514, https://doi.org/10.5194/acp-20-12499-2020, 2020. a, b
Clarisse, L., Hurtmans, D., Clerbaux, C., Hadji-Lazaro, J., Ngadi, Y., and Coheur, P.-F.: Retrieval of sulphur dioxide from the infrared atmospheric sounding interferometer (IASI), Atmos. Meas. Tech., 5, 581–594, https://doi.org/10.5194/amt-5-581-2012, 2012. a
Clodman, J.: Some statistical aspects of cirrus cloud, Mon. Weather Rev., 85, 37–41, https://doi.org/10.1175/1520-0493(1957)085<0037:SSAOCC>2.0.CO;2, 1957. a
Cooney, J. W., Bowman, K. P., Homeyer, C. R., and Fenske, T. M.: Ten Year Analysis of Tropopause-Overshooting Convection Using GridRad Data, J. Geophys. Res.-Atmos., 123, 329–343, https://doi.org/10.1002/2017JD027718, 2018. a, b
Corradini, S., Merucci, L., Prata, A. J., and Piscini, A.: Volcanic ash and SO2 in the 2008 Kasatochi eruption: Retrievals comparison from different IR satellite sensors, J. Geophys. Res.-Atmos., 115, D00L21, https://doi.org/10.1029/2009JD013634, 2010. a
Corti, T., Luo, B. P., Fu, Q., Vömel, H., and Peter, T.: The impact of cirrus clouds on tropical troposphere-to-stratosphere transport, Atmos. Chem. Phys., 6, 2539–2547, https://doi.org/10.5194/acp-6-2539-2006, 2006. a
Cziczo, D. J., Froyd, K. D., Hoose, C., Jensen, E. J., Diao, M., Zondlo, M. A., Smith, J. B., Twohy, C. H., and Murphy, D. M.: Clarifying the Dominant Sources and Mechanisms of Cirrus Cloud Formation, Science, 340, 1320–1324, https://doi.org/10.1126/science.1234145, 2013. a, b
Dauhut, T., Noel, V., and Dion, I.-A.: The diurnal cycle of the clouds extending above the tropical tropopause observed by spaceborne lidar, Atmos. Chem. Phys., 20, 3921–3929, https://doi.org/10.5194/acp-20-3921-2020, 2020. a, b, c
de la Torre, A., Tsuda, T., Hajj, G., and Wickert, J.: A Global Distribution of the Stratospheric Gravity Wave Activity from GPS Occultation Profiles with SAC-C and CHAMP, J. Meteorol. Soc. Jpn., 82, 407–417, https://doi.org/10.2151/jmsj.2004.407, 2004. a
De Reus, M., Borrmann, S., Bansemer, A., Heymsfield, A. J., Weigel, R., Schiller, C., Mitev, V., Frey, W., Kunkel, D., Kürten, A., Curtius, J., Sitnikov, N. M., Ulanovsky, A., and Ravegnani, F.: Evidence for ice particles in the tropical stratosphere from in-situ measurements, Atmos. Chem. Phys., 9, 6775–6792, https://doi.org/10.5194/acp-9-6775-2009, 2009. a
Dessler, A. E.: Clouds and water vapor in the Northern Hemisphere summertime stratosphere, J. Geophys. Res.-Atmos., 114, D00H09, https://doi.org/10.1029/2009JD012075, 2009. a
Dinh, T., Durran, D. R., and Ackerman, T.: Cirrus and water vapor transport in the tropical tropopause layer – Part 1: A specific case modeling study, Atmos. Chem. Phys., 12, 9799–9815, https://doi.org/10.5194/acp-12-9799-2012, 2012. a
Dinh, T., Podglajen, A., Hertzog, A., Legras, B., and Plougonven, R.: Effect of gravity wave temperature fluctuations on homogeneous ice nucleation in the tropical tropopause layer, Atmos. Chem. Phys., 16, 35–46, https://doi.org/10.5194/acp-16-35-2016, 2016. a, b
Doeringer, D., Eldering, A., Boone, C. D., González Abad, G., and Bernath, P. F.: Observation of sulfate aerosols and SO2 from the Sarychev volcanic eruption using data from the Atmospheric Chemistry Experiment (ACE), J. Geophys. Res.-Atmos., 117, D03203, https://doi.org/10.1029/2011JD016556, 2012. a
Eguchi, N. and Shiotani, M.: Intraseasonal variations of water vapor and cirrus clouds in the tropical upper troposphere, J. Geophys. Res.-Atmos., 109, D12106, https://doi.org/10.1029/2003JD004314, 2004. a
Ern, M., Hoffmann, L., and Preusse, P.: Directional gravity wave momentum fluxes in the stratosphere derived from high-resolution AIRS temperature data, Geophys. Res. Lett., 44, 475–485, https://doi.org/10.1002/2016GL072007, 2017. a
Feng, P.-N. and Lin, H.: Modulation of the MJO-Related Teleconnections by the QBO, J. Geophys. Res.-Atmos., 124, 12022–12033, https://doi.org/10.1029/2019JD030878, 2019. a
Field, P. R. and Wood, R.: Precipitation and Cloud Structure in Midlatitude Cyclones, J. Climate, 20, 233–254, https://doi.org/10.1175/JCLI3998.1, 2007. a
Froyd, K. D., Murphy, D. M., Lawson, P., Baumgardner, D., and Herman, R. L.: Aerosols that form subvisible cirrus at the tropical tropopause, Atmos. Chem. Phys., 10, 209–218, https://doi.org/10.5194/acp-10-209-2010, 2010. a
Fu, R., Hu, Y., Wright, J. S., Jiang, J. H., Dickinson, R. E., Chen, M., Filipiak, M., Read, W. G., Waters, J. W., and Wu, D. L.: Short circuit of water vapor and polluted air to the global stratosphere by convective transport over the Tibetan Plateau, P. Natl. Acad. Sci. USA, 103, 5664–5669, https://doi.org/10.1073/pnas.0601584103, 2006. a
Gasparini, B., Meyer, A., Neubauer, D., Münch, S., and Lohmann, U.: Cirrus Cloud Properties as Seen by the CALIPSO Satellite and ECHAM-HAM Global Climate Model, J. Climate, 31, 1983 – 2003, https://doi.org/10.1175/JCLI-D-16-0608.1, 2018. a
Gettelman, A., Salby, M. L., and Sassi, F.: Distribution and influence of convection in the tropical tropopause region, J. Geophys. Res.-Atmos., 107, D10, https://doi.org/10.1029/2001JD001048, 2002. a, b, c
Getzewich, B. J., Vaughan, M. A., Hunt, W. H., Avery, M. A., Powell, K. A., Tackett, J. L., Winker, D. M., Kar, J., Lee, K.-P., and Toth, T. D.: CALIPSO lidar calibration at 532 nm: version 4 daytime algorithm, Atmos. Meas. Tech., 11, 6309–6326, https://doi.org/10.5194/amt-11-6309-2018, 2018. a
Global Volcanism Program: Volcanoes of the World, v. 4.10.0 (14 May 2021), https://doi.org/10.5479/si.GVP.VOTW4-2013, 2013. a
Griessbach, S., Hoffmann, L., Spang, R., and Riese, M.: Volcanic ash detection with infrared limb sounding: MIPAS observations and radiative transfer simulations, Atmos. Meas. Tech., 7, 1487–1507, https://doi.org/10.5194/amt-7-1487-2014, 2014. a
Griessbach, S., Hoffmann, L., Spang, R., von Hobe, M., Müller, R., and Riese, M.: Infrared limb emission measurements of aerosol in the troposphere and stratosphere, Atmos. Meas. Tech., 9, 4399–4423, https://doi.org/10.5194/amt-9-4399-2016, 2016. a
Haag, W. and Kärcher, B.: The impact of aerosols and gravity waves on cirrus clouds at midlatitudes, J. Geophys. Res.-Atmos., 109, D12202, https://doi.org/10.1029/2004JD004579, 2004. a
Hendon, H. H. and Woodberry, K.: The diurnal cycle of tropical convection, J. Geophys. Res.-Atmos., 98, 16623–16637, https://doi.org/10.1029/93JD00525, 1993. a
Hersbach, H., Bell, B., Berrisford, P., Hirahara, S., Horányi, A., Muñoz-Sabater, J., Nicolas, J., Peubey, C., Radu, R., Schepers, D., Simmons, A., Soci, C., Abdalla, S., Abellan, X., Balsamo, G., Bechtold, P., Biavati, G., Bidlot, J., Bonavita, M., De Chiara, G., Dahlgren, P., Dee, D., Diamantakis, M., Dragani, R., Flemming, J., Forbes, R., Fuentes, M., Geer, A., Haimberger, L., Healy, S., Hogan, R. J., Hólm, E., Janisková, M., Keeley, S., Laloyaux, P., Lopez, P., Lupu, C., Radnoti, G., de Rosnay, P., Rozum, I., Vamborg, F., Villaume, S., and Thépaut, J.-N.: The ERA5 global reanalysis, Q. J. Roy. Meteor. Soc., 146, 1999–2049, https://doi.org/10.1002/qj.3803, 2020. a
Hoffmann, L.: AIRS/Aqua Observations of Gravity Waves, re3data.org – Registry of Research Data Repositories [data set], https://doi.org/10.17616/R34J42, 2020. a
Hoffmann, L.: Reanalysis Tropopause Data Repository, re3data.org – Registry of Research Data Repositories [data set], https://doi.org/10.17616/R31NJMOH, 2021a. a
Hoffmann, L.: AIRS/Aqua Observations of Volcanic Emissions, Forschungszentrum Jülich [data set], https://doi.org/10.26165/JUELICH-DATA/VPHA3R, 2021b. a, b, c
Hoffmann, L. and Alexander, M. J.: Occurrence frequency of convective gravity waves during the North American thunderstorm season, J. Geophys. Res.-Atmos., 115, 20111, https://doi.org/10.1029/2010JD014401, 2010. a, b, c
Hoffmann, L. and Spang, R.: An assessment of tropopause characteristics of the ERA5 and ERA-Interim meteorological reanalyses, Atmos. Chem. Phys., 22, 4019–4046, https://doi.org/10.5194/acp-22-4019-2022, 2022. a, b, c, d, e, f, g, h, i
Hoffmann, L., Xue, X., and Alexander, M. J.: A global view of stratospheric gravity wave hotspots located with Atmospheric Infrared Sounder observations, J. Geophys. Res.-Atmos., 118, 416–434, https://doi.org/10.1029/2012JD018658, 2013. a, b, c, d, e, f, g, h
Hoffmann, L., Alexander, M. J., Clerbaux, C., Grimsdell, A. W., Meyer, C. I., Rößler, T., and Tournier, B.: Intercomparison of stratospheric gravity wave observations with AIRS and IASI, Atmos. Meas. Tech., 7, 4517–4537, https://doi.org/10.5194/amt-7-4517-2014, 2014a. a, b
Hoffmann, L., Griessbach, S., and Meyer, C. I.: Volcanic emissions from AIRS observations: detection methods, case study, and statistical analysis, in: Remote Sensing of Clouds and the Atmosphere XIX; and Optics in Atmospheric Propagation and Adaptive Systems XVII, SPIE, 9242, 924214, https://doi.org/10.1117/12.2066326, 2014b. a, b
Hoffmann, L., Rößler, T., Griessbach, S., Heng, Y., and Stein, O.: Lagrangian transport simulations of volcanic sulfur dioxide emissions: Impact of meteorological data products, J. Geophys. Res., 121, 4651–4673, https://doi.org/10.1002/2015JD023749, 2016. a
Hoffmann, L., Wu, X., and Alexander, M. J.: Satellite Observations of Stratospheric Gravity Waves Associated With the Intensification of Tropical Cyclones, Geophys. Res. Lett., 45, 1692–1700, https://doi.org/10.1002/2017GL076123, 2018. a
Hohenegger, C. and Stevens, B.: Controls on and impacts of the diurnal cycle of deep convective precipitation, J. Adv. Model. Earth Sy., 5, 801–815, https://doi.org/10.1002/2012MS000216, 2013. a
Holton, J. R. and Gettelman, A.: Horizontal transport and the dehydration of the stratosphere, Geophys. Res. Lett., 28, 2799–2802, https://doi.org/10.1029/2001GL013148, 2001. a
Homeyer, C. R., Pan, L. L., and Barth, M. C.: Transport from convective overshooting of the extratropical tropopause and the role of large-scale lower stratosphere stability, J. Geophys. Res.-Atmos., 119, 2220–2240, https://doi.org/10.1002/2013JD020931, 2014. a, b, c
Homeyer, C. R., McAuliffe, J. D., and Bedka, K. M.: On the Development of Above-Anvil Cirrus Plumes in Extratropical Convection, J. Atmos. Sci., 74, 1617–1633, https://doi.org/10.1175/JAS-D-16-0269.1, 2017. a, b
Jain, S., Jain, A. R., and Mandal, T. K.: Role of convection in hydration of tropical UTLS: implication of AURA MLS long-term observations, Ann. Geophys., 31, 967–981, https://doi.org/10.5194/angeo-31-967-2013, 2013. a
Jensen, E. and Pfister, L.: Transport and freeze-drying in the tropical tropopause layer, J. Geophys. Res.-Atmos., 109, D02207, https://doi.org/10.1029/2003JD004022, 2004. a
Jensen, E. J., Pfister, L., Bui, T.-P., Lawson, P., and Baumgardner, D.: Ice nucleation and cloud microphysical properties in tropical tropopause layer cirrus, Atmos. Chem. Phys., 10, 1369–1384, https://doi.org/10.5194/acp-10-1369-2010, 2010. a
Jensen, E. J., Pfister, L., and Toon, O. B.: Impact of radiative heating, wind shear, temperature variability, and microphysical processes on the structure and evolution of thin cirrus in the tropical tropopause layer, J. Geophys. Res.-Atmos., 116, D12209, https://doi.org/10.1029/2010JD015417, 2011. a, b
Jensen, E. J., Ueyama, R., Pfister, L., Bui, T. V., Alexander, M. J., Podglajen, A., Hertzog, A., Woods, S., Lawson, R. P., Kim, J.-E., and Schoeberl, M. R.: High-frequency gravity waves and homogeneous ice nucleation in tropical tropopause layer cirrus, Geophys. Res. Lett., 43, 6629–6635, https://doi.org/10.1002/2016GL069426, 2016. a, b
Kärcher, B.: Cirrus Clouds and Their Response to Anthropogenic Activities, Curr. Clim. Change Rep., 3, 45–57, https://doi.org/10.1007/s40641-017-0060-3, 2017. a
Kärcher, B. and Ström, J.: The roles of dynamical variability and aerosols in cirrus cloud formation, Atmos. Chem. Phys., 3, 823–838, https://doi.org/10.5194/acp-3-823-2003, 2003. a
Keckhut, P., Hauchecorne, A., Bekki, S., Colette, A., David, C., and Jumelet, J.: Indications of thin cirrus clouds in the stratosphere at mid-latitudes, Atmos. Chem. Phys., 5, 3407–3414, https://doi.org/10.5194/acp-5-3407-2005, 2005. a
Kim, J.-E., Alexander, M. J., Bui, T. P., Dean-Day, J. M., Lawson, R. P., Woods, S., Hlavka, D., Pfister, L., and Jensen, E. J.: Ubiquitous influence of waves on tropical high cirrus clouds, Geophys. Res. Lett., 43, 5895–5901, https://doi.org/10.1002/2016GL069293, 2016. a, b
Klüser, L., Erbertseder, T., and Meyer-Arnek, J.: Observation of volcanic ash from Puyehue–Cordón Caulle with IASI, Atmos. Meas. Tech., 6, 35–46, https://doi.org/10.5194/amt-6-35-2013, 2013. a, b
Lee, S. S. and Penner, J. E.: Aerosol effects on ice clouds: can the traditional concept of aerosol indirect effects be applied to aerosol-cloud interactions in cirrus clouds?, Atmos. Chem. Phys., 10, 10345–10358, https://doi.org/10.5194/acp-10-10345-2010, 2010. a
Liou, K.-N.: Influence of Cirrus Clouds on Weather and Climate Processes: A Global Perspective, Mon. Weather Rev., 114, 1167–1199, https://doi.org/10.1175/1520-0493(1986)114<1167:ioccow>2.0.co;2, 1986. a, b
Liu, Z., Kar, J., Zeng, S., Tackett, J., Vaughan, M., Avery, M., Pelon, J., Getzewich, B., Lee, K.-P., Magill, B., Omar, A., Lucker, P., Trepte, C., and Winker, D.: Discriminating between clouds and aerosols in the CALIOP version 4.1 data products, Atmos. Meas. Tech., 12, 703–734, https://doi.org/10.5194/amt-12-703-2019, 2019. a, b, c
Lohmann, U. and Feichter, J.: Global indirect aerosol effects: a review, Atmos. Chem. Phys., 5, 715–737, https://doi.org/10.5194/acp-5-715-2005, 2005. a
Lohmann, U., Kärcher, B., and Timmreck, C.: Impact of the Mount Pinatubo eruption on cirrus clouds formed by homogeneous freezing in the ECHAM4 GCM, J. Geophys. Res.-Atmos., 108, D18, https://doi.org/10.1029/2002JD003185, 2003. a
Lolli, S., Madonna, F., Rosoldi, M., Campbell, J. R., Welton, E. J., Lewis, J. R., Gu, Y., and Pappalardo, G.: Impact of varying lidar measurement and data processing techniques in evaluating cirrus cloud and aerosol direct radiative effects, Atmos. Meas. Tech., 11, 1639–1651, https://doi.org/10.5194/amt-11-1639-2018, 2018. a
Mace, G. G., Deng, M., Soden, B., and Zipser, E.: Association of Tropical Cirrus in the 10–15-km Layer with Deep Convective Sources: An Observational Study Combining Millimeter Radar Data and Satellite-Derived Trajectories, J. Atmos. Sci., 63, 480–503, https://doi.org/10.1175/JAS3627.1, 2006. a, b
Massie, S., Gettelman, A., Randel, W., and Baumgardner, D.: Distribution of tropical cirrus in relation to convection, J. Geophys. Res.-Atmos., 107, 4591, https://doi.org/10.1029/2001JD001293, 2002. a
Meyer, C. I., Ern, M., Hoffmann, L., Trinh, Q. T., and Alexander, M. J.: Intercomparison of AIRS and HIRDLS stratospheric gravity wave observations, Atmos. Meas. Tech., 11, 215–232, https://doi.org/10.5194/amt-11-215-2018, 2018. a
Munchak, L. A. and Pan, L. L.: Separation of the lapse rate and the cold point tropopauses in the tropics and the resulting impact on cloud top-tropopause relationships, J. Geophys. Res.-Atmos., 119, 7963–7978, https://doi.org/10.1002/2013JD021189, 2014. a
Murgatroyd, R. J. and Goldsmith, P.: High cloud over southern England, Nature, 178, 788, https://doi.org/10.1038/178788a0, 1956. a
Nesbitt, S. W. and Zipser, E. J.: The Diurnal Cycle of Rainfall and Convective Intensity according to Three Years of TRMM Measurements, J. Climate, 16, 1456–1475, https://doi.org/10.1175/1520-0442(2003)016<1456:TDCORA>2.0.CO;2, 2003. a
Noel, V., Chepfer, H., Hoareau, C., Reverdy, M., and Cesana, G.: Effects of solar activity on noise in CALIOP profiles above the South Atlantic Anomaly, Atmos. Meas. Tech., 7, 1597–1603, https://doi.org/10.5194/amt-7-1597-2014, 2014. a
Ohneiser, K., Ansmann, A., Engelmann, R., Ritter, C., Chudnovsky, A., Veselovskii, I., Baars, H., Gebauer, H., Griesche, H., Radenz, M., Hofer, J., Althausen, D., Dahlke, S., and Maturilli, M.: Siberian fire smoke in the High-Arctic winter stratosphere observed during MOSAiC 2019–2020, Atmos. Chem. Phys. Discussions, 2021, 1–36, https://doi.org/10.5194/acp-2021-117, 2021. a
Pan, L. L. and Munchak, L. A.: Relationship of cloud top to the tropopause and jet structure from CALIPSO data, J. Geophys. Res.-Atmos., 116, 1–17, https://doi.org/10.1029/2010JD015462, 2011. a, b
Peevey, T. R., Gille, J. C., Randall, C. E., and Kunz, A.: Investigation of double tropopause spatial and temporal global variability utilizing High Resolution Dynamics Limb Sounder temperature observations, J. Geophys. Res.-Atmos., 117, D01105, https://doi.org/10.1029/2011JD016443, 2012. a, b
Podglajen, A., Plougonven, R., Hertzog, A., and Jensen, E.: Impact of gravity waves on the motion and distribution of atmospheric ice particles, Atmos. Chem. Phys., 18, 10799–10823, https://doi.org/10.5194/acp-18-10799-2018, 2018. a
Prata, A. J., Gangale, G., Clarisse, L., and Karagulian, F.: Ash and sulfur dioxide in the 2008 eruptions of Okmok and Kasatochi: Insights from high spectral resolution satellite measurements, J. Geophys. Res.-Atmos., 115, D00L18, https://doi.org/10.1029/2009JD013556, 2010. a
Pruppacher, H. R., Klett, J. D., and Wang, P. K.: Microphysics of Clouds and Precipitation, Aerosol Sci. Tech., 28, 381–382, https://doi.org/10.1080/02786829808965531, 1998. a
Randel, W. J., Seidel, D. J., and Pan, L. L.: Observational characteristics of double tropopauses, J. Geophys. Res.-Atmos., 112, D07309, https://doi.org/10.1029/2006JD007904, 2007. a, b, c
Sandhya, M., Sridharan, S., Indira Devi, M., Niranjan, K., and Jayaraman, A.: A case study of formation and maintenance of a lower stratospheric cirrus cloud over the tropics, Ann. Geophys., 33, 599–608, https://doi.org/10.5194/angeo-33-599-2015, 2015. a
Schoeberl, M. R. and Dessler, A. E.: Dehydration of the stratosphere, Atmos. Chem. Phys., 11, 8433–8446, https://doi.org/10.5194/acp-11-8433-2011, 2011. a
Schoeberl, M. R., Jensen, E. J., and Woods, S.: Gravity waves amplify upper tropospheric dehydration by clouds, Earth Space Sci., 2, 485–500, https://doi.org/10.1002/2015EA000127, 2015. a, b
Schoeberl, M. R., Jensen, E. J., Pfister, L., Ueyama, R., Wang, T., Selkirk, H., Avery, M., Thornberry, T., and Dessler, A. E.: Water Vapor, Clouds, and Saturation in the Tropical Tropopause Layer, J. Geophys. Res.-Atmos., 124, 3984–4003, https://doi.org/10.1029/2018JD029849, 2019. a
Schwartz, M. J., Manney, G. L., Hegglin, M. I., Livesey, N. J., Santee, M. L., and Daffer, W. H.: Climatology and variability of trace gases in extratropical double-tropopause regions from MLS, HIRDLS, and ACE-FTS measurements, J. Geophys. Res.-Atmos., 120, 843–867, https://doi.org/10.1002/2014JD021964, 2015. a
Sherwood, S. C., Horinouchi, T., and Zeleznik, H. A.: Convective Impact on Temperatures Observed near the Tropical Tropopause, J. Atmos. Sci., 60, 1847–1856, https://doi.org/10.1175/1520-0469(2003)060<1847:CIOTON>2.0.CO;2, 2003. a
Solomon, D. L., Bowman, K. P., and Homeyer, C. R.: Tropopause-Penetrating Convection from Three-Dimensional Gridded NEXRAD Data, J. Appl. Meteorol. Clim., 55, 465–478, https://doi.org/10.1175/JAMC-D-15-0190.1, 2016. a
Spang, R., Günther, G., Riese, M., Hoffmann, L., Müller, R., and Griessbach, S.: Satellite observations of cirrus clouds in the Northern Hemisphere lowermost stratosphere, Atmos. Chem. Phys., 15, 927–950, https://doi.org/10.5194/acp-15-927-2015, 2015. a, b, c
Taylor, J. R., Randel, W. J., and Jensen, E. J.: Cirrus cloud-temperature interactions in the tropical tropopause layer: a case study, Atmos. Chem. Phys., 11, 10085–10095, https://doi.org/10.5194/acp-11-10085-2011, 2011. a
Tegtmeier, S., Anstey, J., Davis, S., Dragani, R., Harada, Y., Ivanciu, I., Pilch Kedzierski, R., Krüger, K., Legras, B., Long, C., Wang, J. S., Wargan, K., and Wright, J. S.: Temperature and tropopause characteristics from reanalyses data in the tropical tropopause layer, Atmos. Chem. Phys., 20, 753–770, https://doi.org/10.5194/acp-20-753-2020, 2020a. a, b
Tegtmeier, S., Anstey, J., Davis, S., Ivanciu, I., Jia, Y., McPhee, D., and Pilch Kedzierski, R.: Zonal Asymmetry of the QBO Temperature Signal in the Tropical Tropopause Region, Geophys. Res. Lett., 47, e2020GL089533, https://doi.org/10.1029/2020GL089533, 2020b. a
Tian, B., Waliser, D. E., and Fetzer, E. J.: Modulation of the diurnal cycle of tropical deep convective clouds by the MJO, Geophys. Res. Lett., 33, L20704, https://doi.org/10.1029/2006GL027752, 2006. a
Trier, S. B. and Sharman, R. D.: Mechanisms Influencing Cirrus Banding and Aviation Turbulence near a Convectively Enhanced Upper-Level Jet Stream, Mon. Weather Rev., 144, 3003–3027, https://doi.org/10.1175/MWR-D-16-0094.1, 2016. a
Trier, S. B., Sharman, R. D., Muñoz-Esparza, D., and Lane, T. P.: Environment and Mechanisms of Severe Turbulence in a Midlatitude Cyclone, J. Atmos. Sci., 77, 3869–3889, https://doi.org/10.1175/JAS-D-20-0095.1, 2020. a
Tzella, A. and Legras, B.: A Lagrangian view of convective sources for transport of air across the Tropical Tropopause Layer: distribution, times and the radiative influence of clouds, Atmos. Chem. Phys., 11, 12517–12534, https://doi.org/10.5194/acp-11-12517-2011, 2011. a
Wang, P. H., Minnis, P., McCormick, M. P., Kent, G. S., and Skeens, K. M.: A 6-year climatology of cloud occurrence frequency from Stratospheric Aerosol and Gas Experiment II observations (1985–1990), J. Geophys. Res.-Atmos., 101, 29407–29429, https://doi.org/10.1029/96jd01780, 1996. a
Wang, P. K., Cheng, K.-Y., Setvak, M., and Wang, C.-K.: The origin of the gullwing-shaped cirrus above an Argentinian thunderstorm as seen in CALIPSO images, J. Geophys. Res.-Atmos., 121, 3729–3738, https://doi.org/10.1002/2015JD024111, 2016. a
Winker, D. M., Hunt, W. H., and McGill, M. J.: Initial performance assessment of CALIOP, Geophys. Res. Lett., 34, L19803, https://doi.org/10.1029/2007GL030135, 2007. a
Winker, D. M., Vaughan, M. A., Omar, A., Hu, Y., Powell, K. A., Liu, Z., Hunt, W. H., and Young, S. A.: Overview of the CALIPSO mission and CALIOP data processing algorithms, J. Atmos. Ocean. Tech., 26, 2310–2323, https://doi.org/10.1175/2009JTECHA1281.1, 2009. a
WMO: Meteorology – a three-dimensional science: Second session for the commisstion for aerology, WMO Bulletin, 6, 134–138, https://library.wmo.int/doc_num.php?explnum_id=6960 (last access: 20 August 2021), 1957. a
Wylie, D., Jackson, D. L., Menzel, W. P., and Bates, J. J.: Trends in global cloud cover in two decades of HIRS observations, J. Climate, 18, 3021–3031, https://doi.org/10.1175/JCLI3461.1, 2005. a
Wylie, D. P., Menzel, W. P., Woolf, H. M., and Strabala, K. I.: Four years of global cirrus cloud statistics using HIRS, J. Climate, 7, 1972–1986, https://doi.org/10.1175/1520-0442(1994)007<1972:FYOGCC>2.0.CO;2, 1994. a
Xian, T. and Homeyer, C. R.: Global tropopause altitudes in radiosondes and reanalyses, Atmos. Chem. Phys., 19, 5661–5678, https://doi.org/10.5194/acp-19-5661-2019, 2019. a
Zhou, C., Dessler, A. E., Zelinka, M. D., Yang, P., and Wang, T.: Cirrus feedback on interannual climate fluctuations, Geophys. Res. Lett., 41, 9166–9173, https://doi.org/10.1002/2014GL062095, 2014. a
Zou, L., Griessbach, S., Hoffmann, L., Gong, B., and Wang, L.: Revisiting global satellite observations of stratospheric cirrus clouds, Atmos. Chem. Phys., 20, 9939–9959, https://doi.org/10.5194/acp-20-9939-2020, 2020. a, b, c, d
Zou, L., Hoffmann, L., Griessbach, S., Spang, R., and Wang, L.: Empirical evidence for deep convection being a major source of stratospheric ice clouds over North America, Atmos. Chem. Phys., 21, 10457–10475, https://doi.org/10.5194/acp-21-10457-2021, 2021. a, b, c
- Abstract
- Introduction
- Data and method
- Results
- Discussion
- Conclusions
- Appendix A: Event frequency of SICs
- Appendix B: Occurrence frequency of UTLS clouds
- Appendix C: Fraction of SICs related to UTLS clouds
- Appendix D: The regional averaged monthly anomalies.
- Data availability
- Author contributions
- Competing interests
- Disclaimer
- Acknowledgements
- Financial support
- Review statement
- References