the Creative Commons Attribution 4.0 License.
the Creative Commons Attribution 4.0 License.
 | 19 May 2022
The impact of large-scale circulation on daily fine particulate matter (PM2.5) over major populated regions of China in winter
Zixuan Jia
Ruth M. Doherty
Carlos Ordóñez
Chaofan Li
Oliver Wild
Shipra Jain
Xiao Tang
Using a new high-resolution air quality reanalysis dataset for China for five winters from December 2013 to February 2018, we examine the influence of large-scale circulation on daily PM2.5 variability through its direct effect on key regional meteorological variables over three major populated regions of China: Beijing–Tianjin–Hebei (BTH), the Yangtze River Delta (YRD) and the Pearl River Delta (PRD). In BTH, a shallow East Asian trough curbs northerly cold and dry air from the Siberian High, enhancing PM2.5 pollution levels. Weak southerly winds in eastern and southern China, associated with a weakened Siberian High, suppress horizontal dispersion, contributing to air pollution accumulation over YRD. In PRD, weak southerly winds and precipitation deficits over southern China are conducive to high PM2.5 pollution levels. To account for these dominant large-scale circulation–PM2.5 relationships, we propose three new circulation-based indices for predicting different levels of air pollution based on regional PM2.5 concentrations in each region: a 500 hPa geopotential height-based index for BTH, a sea level pressure-based index for YRD and an 850 hPa meridional wind-based index for PRD. These three indices can effectively distinguish clean days from heavily polluted days in these regions, assuming variation is solely due to meteorology. We also find that including the most important regional meteorological variable in each region improves the performance of the circulation-based indices in predicting daily PM2.5 concentrations on the regional scale. These results are beneficial to understanding and forecasting the occurrence of heavily polluted PM2.5 days in BTH, YRD and PRD from a large-scale perspective.
- Article
(13182 KB) - Full-text XML
-
Supplement
(2519 KB) - BibTeX
- EndNote


Over the past few decades, rapid economic progress and urbanisation in China have raised a number of environmental challenges. These challenges include sharp increases in the atmospheric concentrations of particulate matter with an aerodynamic diameter of 2.5 µm or less (PM2.5), and are of the utmost concern for public health (Xu et al., 2013; Zheng et al., 2015). Episodes of haze and smog pollution with high levels of PM2.5, in particular during winter, have become common in the most developed and highly populated city clusters in China (Zhang et al., 2007; Chan and Yao, 2008; Zhang et al., 2014). Although emissions of pollutant precursors strongly influence air pollution levels, meteorology also plays a major role in air quality variability and trends through a combination of transport, transformation and deposition processes (e.g. Wang et al., 2009; Hou et al., 2018, 2020). For instance, the extreme haze event in January 2013 in Beijing when the maximum instantaneous PM2.5 value exceeded 500 µg m−3, one of the worst air pollution events on record in China, has been attributed to unfavourable atmospheric dispersion conditions with weak surface winds and high humidity (Wang et al., 2014; Yang et al., 2015). In contrast, during winter and spring in 2015, PM2.5 concentrations were much lower at most Chinese monitoring stations because of more favourable atmospheric dispersion conditions compared with those of the previous year (Wang et al., 2016).
While regional meteorological conditions are known to strongly influence air pollution levels, the responses of PM2.5 concentrations to different meteorological variables are complex (e.g. Tai et al., 2010; Barmpadimos et al., 2012; Dawson et al., 2014; Han et al., 2016; Garrido-Perez et al., 2017, 2021). Key processes and the relevant regional meteorological variables influencing PM2.5 levels have been identified in recent studies. These processes include: (a) secondary aerosol formation and hygroscopic growth associated with high relative humidity (RH; Sun et al., 2013; Wang et al., 2014); (b) sulphate and secondary organic aerosol formation and the volatilisation of ammonium nitrate and semi-volatile organics favoured by high temperature (Dawson et al., 2007; Aksoyoglu et al., 2011); (c) wet deposition due to precipitation (Koch et al., 2003; Tai et al., 2010); (d) horizontal dispersion of polluted air under high wind speeds (WSPD; Wang et al., 2012; Zhang et al., 2014); and (e) vertical ventilation and dilution of the boundary layer via mechanically generated turbulence associated with strong wind shear (WSHR; Wang et al., 2018, 2019a) and via thermodynamically generated turbulence as measured by inversion intensity (INV; Zhao et al., 2013; Wang et al., 2014). Specifically, high temperature and RH, weak WSPD, strong INV and weak WSHR have been found to contribute to the accumulation and growth of pollutants in a shallow and stable boundary layer over the North China Plain (e.g. Wang et al., 2014; Leung et al., 2018). However, RH can also be associated with precipitation and therefore removal of aerosols by wet deposition (Zhu et al., 2012; Leung et al., 2018), and may also be an indicator of air masses from different origins.
These key regional meteorological factors have been found to be affected by circulation patterns at larger scales over different regions of the globe (Tai et al., 2012; Garrido-Perez et al., 2017; Pei et al., 2018). Prominent large-scale circulation patterns over China during winter include the East Asian winter monsoon (EAWM; Chang et al., 2006; Wang and Chen, 2010) and El Niño–Southern Oscillation (ENSO; Wang et al., 2000; Zhang et al., 2017). The EAWM resulting from the development of the cold-core Siberian High system is mainly characterised by dry cold low-level northerlies along the East Asian coast, the mid-tropospheric East Asian trough and the upper-tropospheric westerly jet stream (Jhun and Lee, 2004; Li and Yang, 2010; Wang and Lu, 2017). The EAWM has a significant impact on China's regional meteorological conditions, including air temperature, wind speed, RH and atmospheric stability (Jeong and Park, 2017; Wang et al., 2019b), and hence influences PM2.5 levels as noted above. ENSO, as the dominant mode of global ocean-atmosphere interaction, also substantially modulates regional meteorological conditions in China, through changes in atmospheric circulation patterns. The regional meteorological variables affected include RH and precipitation over southeastern China, and wind speed over northern China (Sun et al., 2018; He et al., 2019).
Previous studies of how the large-scale winter circulation modulates air quality in China through its effect on regional meteorology have been primarily focused on Beijing and the North China Plain, the regions with the most severe PM2.5 pollution (e.g. Wang et al., 2014, 2019b; Zhang et al., 2019). Broader regions in northern and southern China also show clear relationships between PM2.5 concentrations and the EAWM intensity (e.g. Jeong and Park, 2017), aerosol optical depth and the position of the Siberian High (Jia et al., 2015), as well as the number of haze days and ENSO intensity (e.g. He et al., 2019). However, the major city clusters in northern, eastern and southern China, i.e. Beijing–Tianjin–Hebei (BTH), the Yangtze River Delta (YRD) and the Pearl River Delta (PRD), respectively, have been considered jointly only in a few studies (e.g. Leung et al., 2018; Hou et al., 2019). Furthermore, most of the existing large-scale circulation indices, such as the EAWM indices (Wang et al., 2010), the Siberian High index (Wu and Wang, 2002) and the Haze Weather index (Cai et al., 2017), have been proposed for the North China Plain. Consequently, they do not reflect the link between the large-scale circulation and PM2.5 levels over YRD and PRD. Indeed, Leung et al. (2018) found that different distinct meteorological modes could explain the variability of PM2.5 in BTH, YRD and PRD, but simple large-scale circulation indices have not been defined for the latter two regions as yet.
Understanding the impact of the large-scale circulation on PM2.5 air quality in these three major populated regions of China during winter, therefore, requires consideration of regional differences in the dominant large-scale circulation features. In order to understand and predict the occurrence of days with high PM2.5 concentrations, it is critical to investigate the relationship between the large-scale circulation and PM2.5 levels on daily timescales. This study examines the dominant large-scale circulation–PM2.5 relationships separately for BTH, YRD and PRD during winter, and further proposes novel circulation-based indices to explain the day-to-day variability of PM2.5 levels in each region. We first explore the relationship of daily PM2.5 concentrations with specific regional meteorological variables across BTH, YRD and PRD (Sect. 3). We then identify the dominant large-scale circulation associated with heavily polluted days for the three regions through its effect on the most important regional meteorological variables, and propose specific circulation-based indices for these three regions (Sect. 4). Furthermore, we assess the performance of these circulation-based indices in distinguishing different levels of air pollution (Sect. 5) and examine the joint effect of the circulation-based indices and regional meteorology on the day-to-day variability of PM2.5 (Sect. 6). Finally, Sect. 7 summarises the main results.
We use daily meteorological data from the fifth-generation atmospheric reanalysis ERA5 provided by the European Centre for Medium-Range Weather Forecasts at a spatial resolution of 0.25∘ (Copernicus Climate Change Service, 2017; Hersbach et al., 2020). These data include zonal wind at 300, 900 and 1000 hPa (U300, U900, U1000); meridional wind at 850, 900 and 1000 hPa (V850, V900, V1000); geopotential height at 500 hPa (Z500); air temperature at 900 and 1000 hPa; RH at 900 and 1000 hPa; sea level pressure (SLP) and sea surface temperatures (SSTs). Hourly data are used to calculate daily averages for 450 d during the five winters from 1 December 2013–28 February 2014 to 1 December 2017–28 February 2018 (hereafter referred to as DJF 2013–2017). Daily precipitation is from the Global Precipitation Climatology Project (GPCP; Huffman et al., 2001) 1∘ daily precipitation product. These meteorological fields are used to investigate both the large-scale circulation features and regional meteorological conditions modulating PM2.5 concentrations. Four meteorological fields representing relevant processes affecting PM2.5 in the boundary layer (RH, WSPD, WSHR and INV) are evaluated, following Ge et al. (2019). RH and WSPD are used at 1000 hPa. Wind shear, WSHR, is calculated as
Inversion intensity, INV, is calculated as
where θν is virtual potential temperature and the subscripts 900 hPa and 1000 hPa specify the vertical levels at which θν is evaluated from air temperature and RH.
The 6-year-long high-resolution Chinese air quality reanalysis dataset (CAQRA; Kong et al., 2021) is the latest long-term air quality reanalysis for China. It contains surface fields of conventional pollutants, including PM2.5, at high spatial (15 km × 15 km) and temporal (1 h) resolution for the period 2013–2018. This dataset has been developed by assimilating pollutant concentrations from over 1000 surface air quality monitoring sites from the China National Environmental Monitoring Centre. CAQRA has been validated against independent datasets, yielding a good performance in reproducing the magnitude and variability of surface air pollutants in China on a regional scale (Kong et al., 2021). We use PM2.5 hourly concentrations from this dataset to calculate daily averages for the same time period as the daily meteorological data (DJF 2013–2017, 450 d). PM2.5 concentrations show a decreasing trend over the period of analysis, consistent with the primary emission reductions and PM2.5 concentration decreases reported by many previous studies (e.g. Li et al., 2019; Cheng et al., 2019). Therefore, to eliminate the influence of changing anthropogenic emissions, the daily PM2.5 data are de-trended by removing the linear trend from the December 2013–February 2018 (1550 d) time series. To understand how meteorology drives clean vs. polluted conditions in a consistent way, percentile thresholds of the de-trended daily PM2.5 data are used. We choose the 10th percentile (p10) of PM2.5 concentrations as the clean threshold and the 90th percentile (p90) of PM2.5 concentrations as the heavily polluted threshold. We then group all the days below p10 and above p90 and classify them as clean or heavily polluted days (45 d each).
Statistical significance is assessed at the 95 % confidence level throughout this paper, unless otherwise stated. The effective numbers of degrees of freedom are calculated in order to assess the significance of correlations considering the effect of temporal autocorrelation (Allen and Smith, 1994; Hu et al., 2017). A non-parametric bootstrap resampling method is used to assess the significance of differences between meteorological variables under heavily polluted and average conditions, as these variables do not necessarily follow normal distributions. This bootstrap resampling method generates random samples of meteorological variables for the whole period of analysis. Each random sample comprises 45 d, i.e. the total number of heavily polluted days. Then the difference between the mean of each sample and all the data is calculated. This procedure is repeated 10 000 times to create a random distribution of meteorological variable differences. Following this, differences calculated for heavily polluted days are compared with the distribution of meteorological variable differences. The differences calculated for heavily polluted days are considered significantly negative or positive (at 95 % confidence level) when they are below or above the 2.5 % and 97.5 % tails, respectively.
We first identify the meteorologically coherent regions representing BTH, YRD and PRD by searching for reanalysis grid cells where the daily PM2.5 concentrations are highly correlated (r ≥ 0.7) with those in the grid cells corresponding to Beijing, Shanghai and Guangzhou, respectively (Fig. 1). This accounts for the regional nature of PM2.5 pollution and provides a more robust result than using the closest grid cells containing the cities or some arbitrary rectangular regions as previous studies have done (e.g. Leung et al., 2018; Hou et al., 2019). Daily regional PM2.5 concentrations are then calculated by averaging the data over these three homogeneous regions. Note that, as the 90th percentiles (p90) of daily average PM2.5 differ for the three regions, heavily polluted days defined on p90 correspond to concentrations >97 µg m−3 for BTH, >110 µg m−3 for YRD and >68 µg m−3 for PRD. The value of p90 PM2.5 is higher in YRD than in BTH, because the smaller size of YRD is more representative of a coherent urban environment (Fig. 1). For consistency, the gridded meteorological fields described in Sect. 2 are averaged over the same regions to construct daily regional meteorological variables.
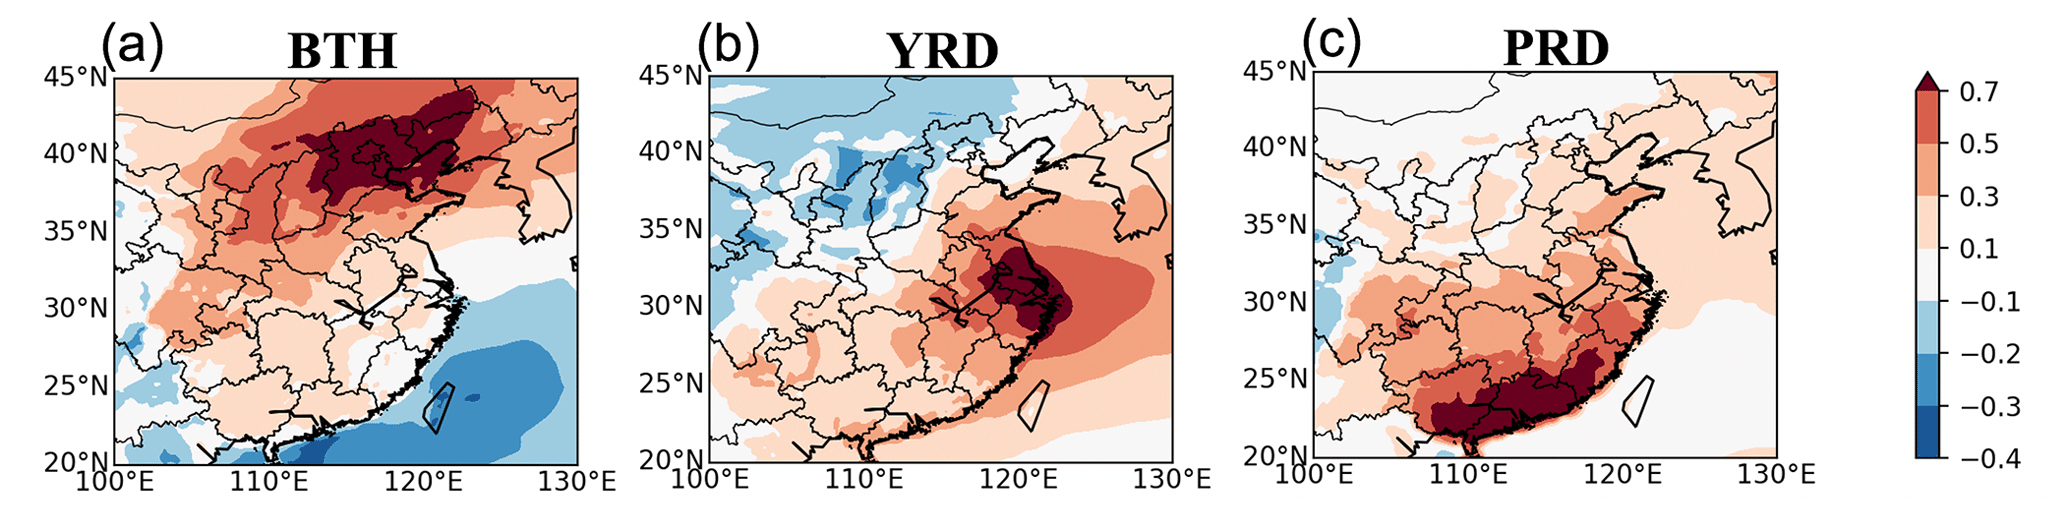
Figure 1Correlation coefficients of daily mean PM2.5 concentrations over all reanalysis grid cells with those in the grid cells corresponding to (a) Beijing, (b) Shanghai and (c) Guangzhou during DJF 2013–2017. Regions where correlations are higher than 0.7 (dark red shading) are selected to represent the Beijing–Tianjin–Hebei (BTH), Yangtze River Delta (YRD) and Pearl River Delta (PRD) regions, separately.
Figure 2 shows the lagged relationship of daily regional PM2.5 concentrations with specific regional meteorological variables in these three homogeneous regions for the entire DJF 2013–2017 period. There are positive correlations for INV and negative correlations for WSHR and WSPD with PM2.5 concentrations for all three regions. This occurs even when daily PM2.5 concentrations are lagged by a few days. This suggests that high PM2.5 days are associated with poor vertical ventilation (increased INV and reduced WSHR) and reduced horizontal dispersion (weak WSPD) for several days preceding the high PM2.5 levels. In particular, WSPD is the variable with the highest correlation with PM2.5 concentrations in YRD, appearing for a 1 d lag () (Fig. 2b). Unlike the other three variables considered, the relationship between RH and PM2.5 concentration varies across BTH, YRD and PRD. A positive correlation is seen between RH and PM2.5 concentrations for BTH, with the highest value at zero lag (r=0.66) (Fig. 2a). This highlights the general contrast between clean, dry air reaching BTH from the northwest and more polluted, humid air reaching BTH from central and eastern China. However, RH is negatively correlated with PM2.5 concentrations in the other two regions, with larger correlations in PRD than in YRD. The high correlations in PRD persist over the previous 4 d (with the highest value of for a 2 d lag) (Fig. 2c). This reflects the association of high RH with cleaner oceanic air and precipitation, and hence wet deposition in PRD (e.g. Zhu et al., 2012; Jeong and Park, 2017). RH is the meteorological variable presenting the highest correlation value with PM2.5 concentrations over both BTH and PRD. These results are consistent with previous findings of the different patterns in PM2.5–RH relationships over northern and southern China (Leung et al., 2018; He et al., 2019).
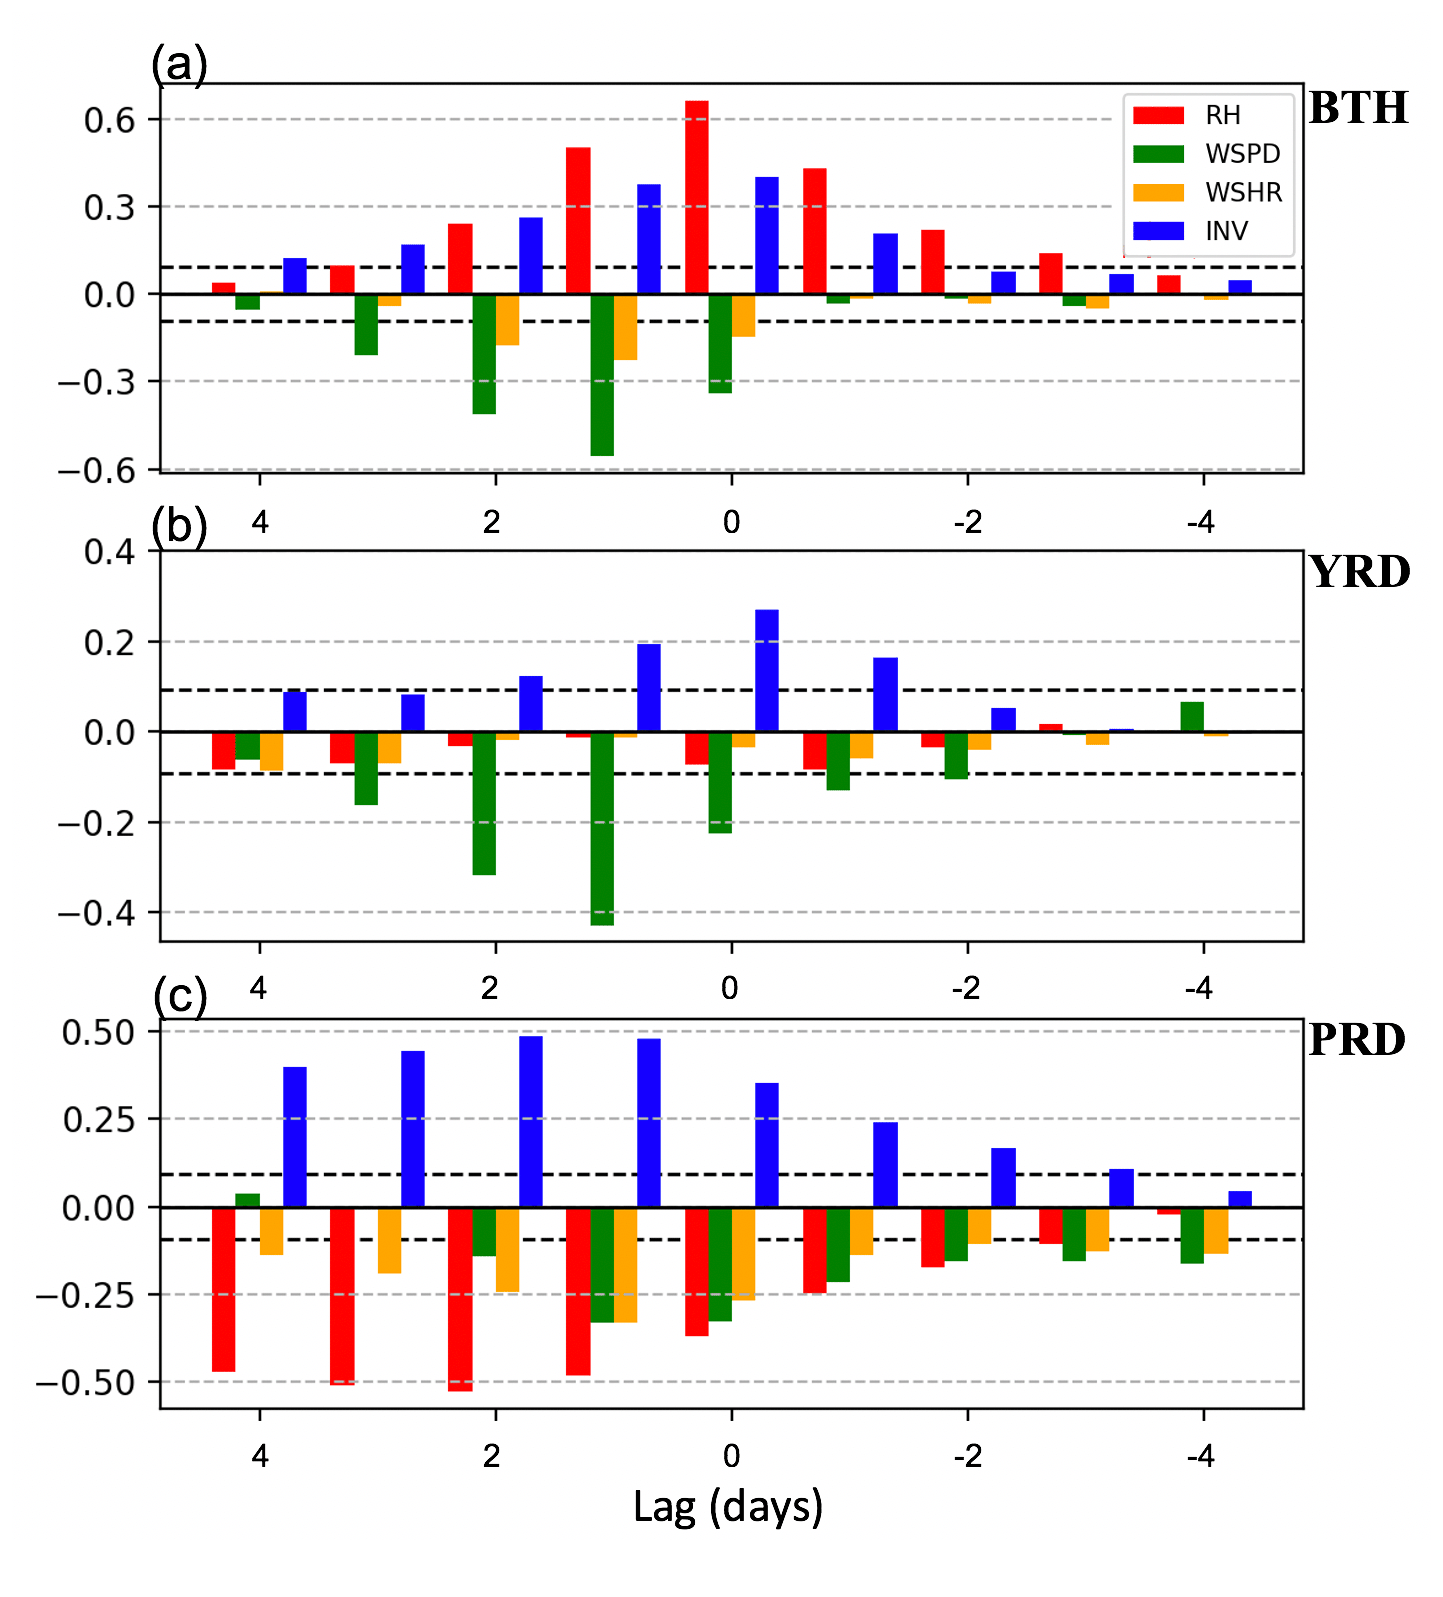
Figure 2Lagged correlations between daily mean PM2.5 concentrations and regional meteorological variables including relative humidity (RH; red bars), wind speed (WSPD; green bars), vertical wind shear (WSHR; gold bars) and inversion intensity (INV; blue bars) over (a) BTH, (b) YRD and (c) PRD during DJF 2013–2017. Horizontal dashed black lines indicate the 95 % confidence level using the two-tailed Student's t test.
Consequently, RH on the same day (r=0.66), WSPD 1 d before () and RH 2 d before () are identified as the most important regional meteorological variables contributing to the day-to-day variability of PM2.5 concentrations over BTH, YRD and PRD, respectively. Among the second most relevant meteorological variables, WSPD and INV stand out for BTH and PRD, respectively, with absolute correlation coefficients close to 0.5 for some time lags. Following previous analyses (e.g. Tai et al., 2010, 2012; Leung et al., 2018; Ge et al., 2019), we now investigate how the relationships between PM2.5 concentrations and the most important regional meteorological variables described above, and considering the same time lags, are caused by common association with large-scale circulation systems.
Using ERA-5 reanalysis data for DJF 2013–2017, we find that the winter large-scale circulation over East Asia is dominated by the Siberian High as seen from the high sea level pressure (SLP) values centred over northwestern Mongolia (Fig. 3a). The Siberian High induces northerly near-surface winds along its eastern edge, which bring cold, clean air to northern and central China as indicated by negative values of meridional wind at 850 hPa (V850) (Fig. 3b). This northerly near-surface flow is also associated with the middle tropospheric East Asian trough, characterised by low geopotential heights at 500 hPa (Z500) over Northeast China as seen in Fig. 3c. Over eastern and southern China, wet and warm southerly winds blow from the South China Sea (Fig. 3b), bringing precipitation (Fig. 3d).
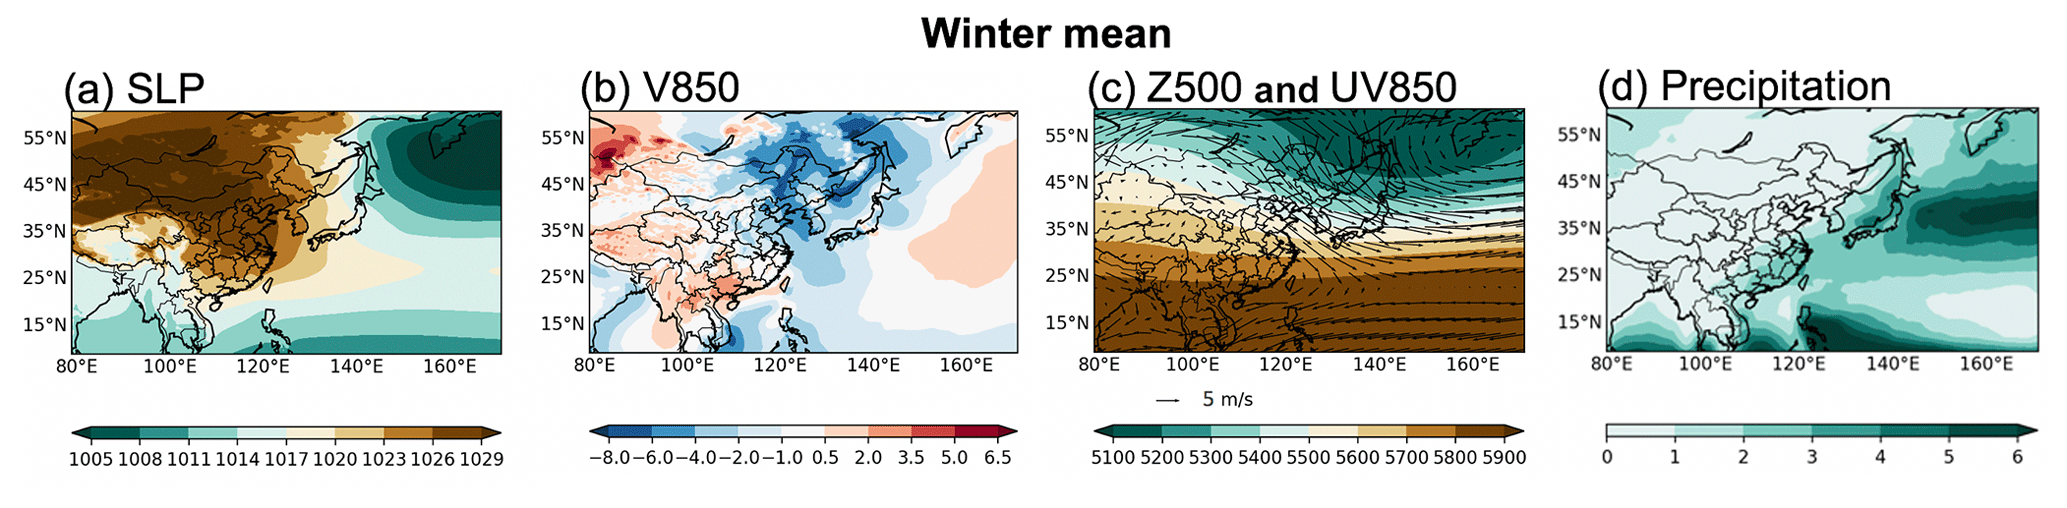
Figure 3Winter mean (a) sea level pressure (SLP; hPa), (b) 850 hPa meridional wind (V850; m s−1), (c) 500 hPa geopotential height (Z500; m, green and brown shading) and 850 hPa wind (arrows), and (d) precipitation (mm d−1) during DJF 2013–2017.
Previous studies have introduced a variety of large-scale circulation indices to characterise atmospheric circulation in East Asia. Here we apply three commonly used EAWM indices (IYang (V850): Yang et al., 2002; ISun (Z500): Sun and Li, 1997; and IJhun (U300): Jhun and Lee, 2004) and a widely used Siberian High index (ISH; Wu and Wang, 2002) to test their relationship with daily PM2.5 concentrations separately for the three meteorologically coherent regions using reanalysis data (Table S1 in the Supplement). We reverse IYang and ISun by multiplying them by −1 so that a high index value represents a strong EAWM. The three EAWM indices have been selected because they reflect the circulation characteristics of the EAWM in the lower, middle and upper troposphere, respectively (e.g. Wang et al., 2019b). Linear correlations of all three EAWM indices with the daily PM2.5 concentrations for the whole period of analysis are significant (at 99 % confidence level) only for BTH (r ranging from −0.54 to −0.36), whereas absolute correlation coefficients do not exceed 0.12 for YRD and PRD. This suggests that these three typical EAWM indices do not capture well the relationship between the large-scale circulation and daily PM2.5 concentrations over the YRD and PRD regions used in this study. The Siberian High index (ISH) is significantly correlated with daily PM2.5 concentrations for all three regions, although the correlations are not strong (r ranging from −0.19 to −0.13).
As the correlations of the daily PM2.5 concentrations with the mentioned indices are low for YRD and PRD, we further investigate the influence of large-scale circulation on daily PM2.5 variability through its direct effect on the most important regional meteorological variables identified separately for the three regions. For this purpose, we first examine the dominant large-scale circulation features associated with heavily polluted days for each region, then identify the correlation patterns of daily PM2.5 concentrations with these circulation variables for the whole period of analysis and define circulation-based indices separately for the three regions. These analyses will be carried out considering the same time lags as those for the most important regional meteorological variables identified in Sect. 3. The daily meteorological reanalysis data are normalised by subtracting the means of individual variables and dividing by their standard deviations to yield fields with zero means and unit variance before calculating these indices.
4.1 Beijing–Tianjin–Hebei (BTH)
As shown in Fig. 2a, the strongest correlations between daily PM2.5 concentrations and regional meteorological variables over BTH are found for RH with no time lag. In this section, we examine circulation variables during heavily polluted days (PM2.5 above p90; daily PM2.5 concentrations >97 µg m−3 for BTH) over this region. Figure 4 shows the average composites of circulation variables (SLP, V850 and Z500) for heavily polluted days over BTH (upper panels), along with the difference (lower panels) between heavily polluted days and the winter (DJF) mean (as displayed in Fig. 3) during 2013–2017. Heavily polluted days are characterised by a weak and eastward-extended Siberian High, weak northerly winds at 850 hPa over North China and a shallow East Asian trough at 500 hPa, reflecting a weak EAWM circulation (Jia et al., 2015; Ge et al., 2019). Following these results, we calculate daily correlations of the PM2.5 concentrations with SLP, V850 and Z500 for the whole period of analysis to assess to what extent the observed circulation anomalies can be used to represent the day-to-day variability of PM2.5. The resulting circulation–PM2.5 correlation patterns are displayed in Fig. 5. The daily PM2.5 concentrations for BTH have negative correlations with SLP over mainland China (and positive correlations centred over Japan; Fig. 5a), positive correlations with V850 over eastern China (Fig. 5b) and positive correlations with Z500 centred over Northeast China (Fig. 5c), in accord with the observed departures of heavily polluted days from the winter mean.

Figure 4Average (a) SLP (hPa), (b) V850 (m s−1), (c) Z500 (m, shading) and 850 hPa wind (m s−1, vector) on heavily polluted days (24 h PM2.5 above the regional 90th percentile), and the difference (heavily polluted days minus winter mean) for (d) SLP, (e) V850 and (f) Z500 and 850 hPa wind during DJF 2013–2017 over BTH. For V850 (b, e), blue regions represent northerlies and red regions represent southerlies. Dotted regions in (d–f) mark statistically significant differences at the 95 % level (determined through a bootstrap resampling method). Grey shading represents the BTH region.
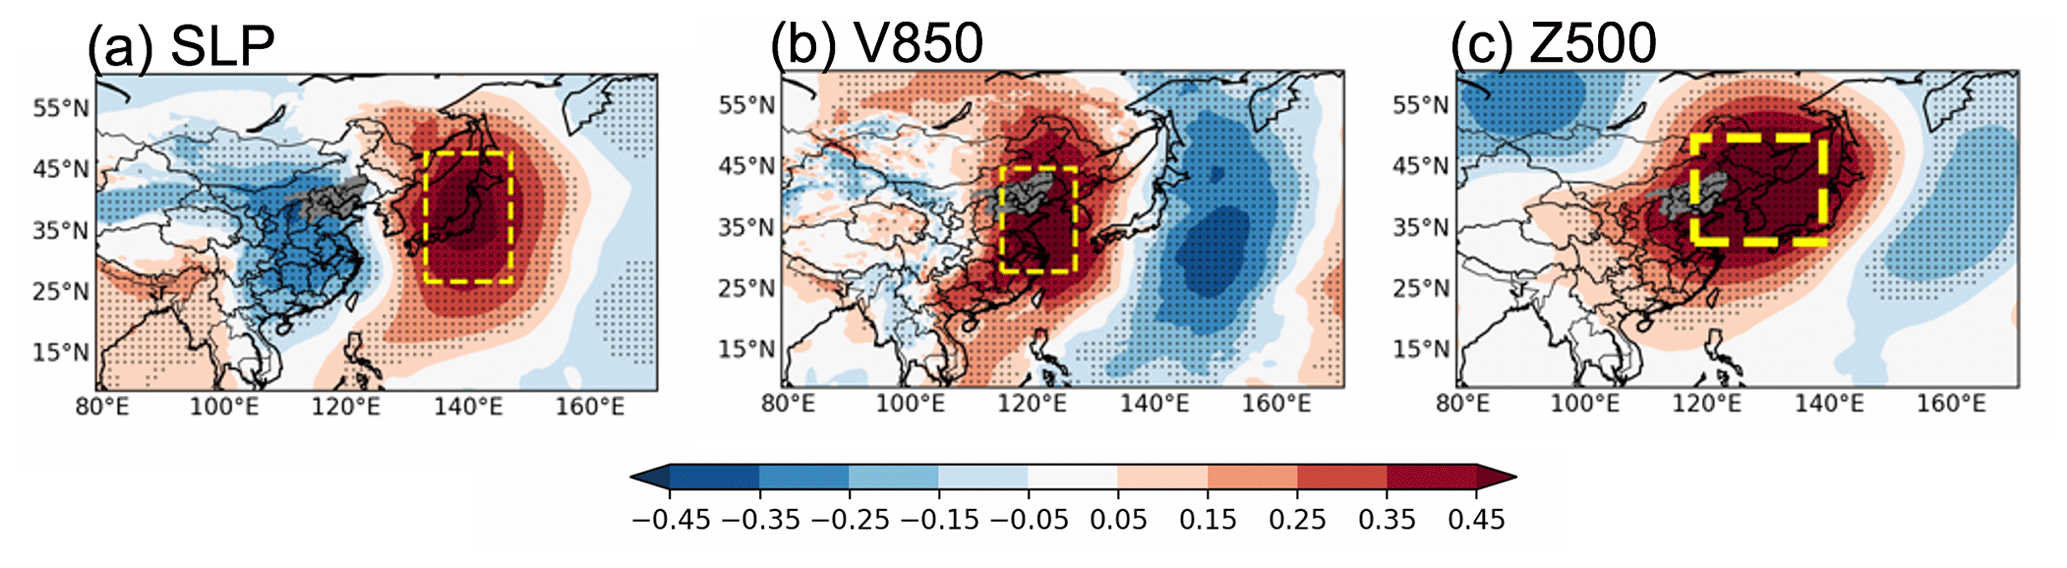
Figure 5Correlation coefficients of daily PM2.5 concentrations in BTH with (a) SLP, (b) V850 and (c) Z500 during DJF 2013–2017 (dotted regions indicate significant correlations at the 95 % level from the two-tailed Student's t test). Grey shading represents the BTH region. The broad region presenting the highest correlation with BTH is marked by a yellow rectangle in each panel. The region used for the definition of a circulation-based index (Eq. 3) is marked by a thick yellow rectangle in (c).
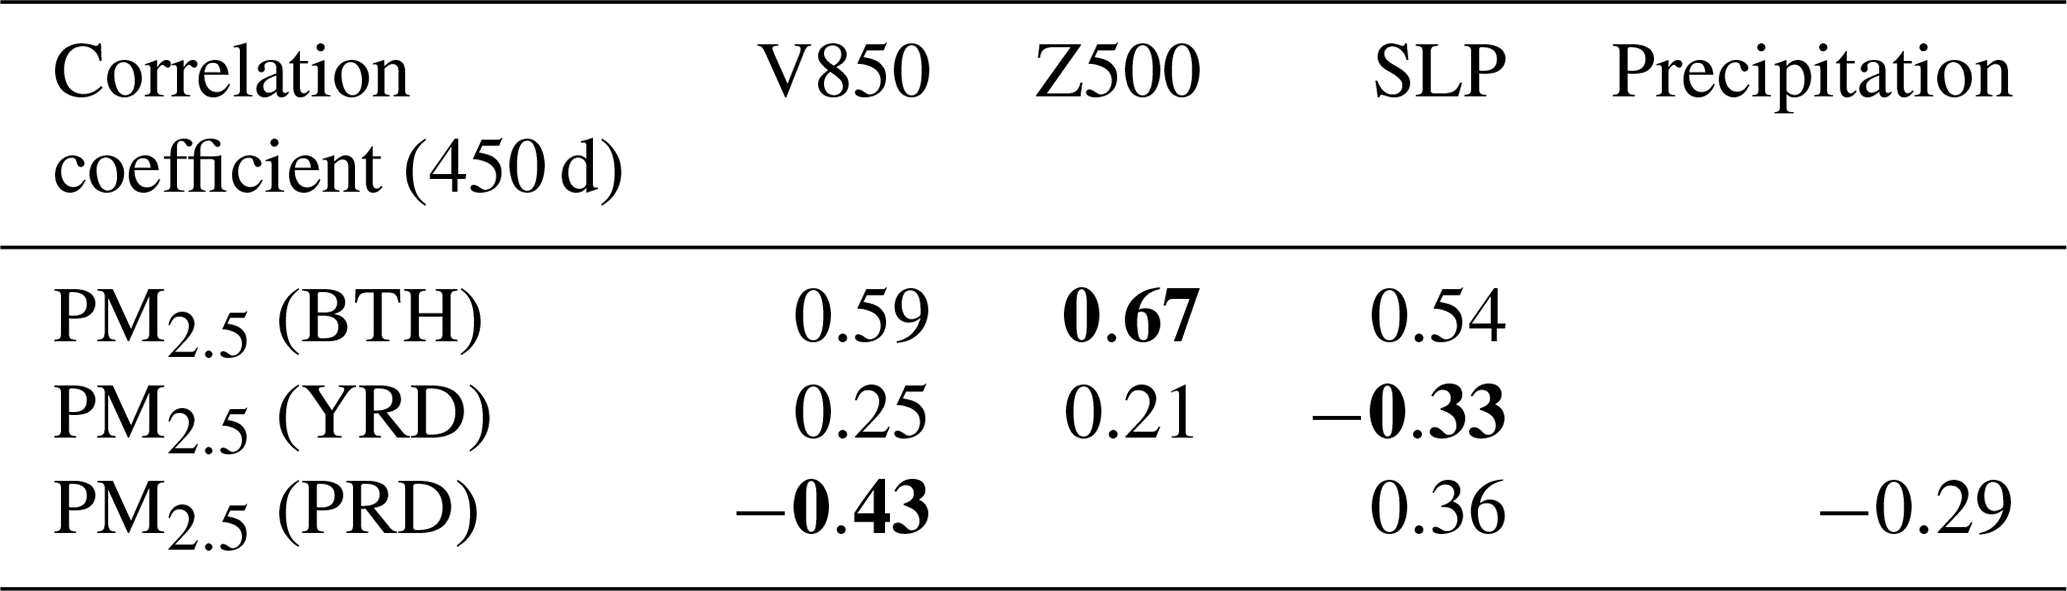
Based on these circulation-PM2.5 correlation patterns, we now select broad regions (yellow rectangles in Fig. 5) which represent the highest correlations with PM2.5 concentrations in BTH and then construct spatial averages of the daily meteorological fields over these regions. The area-weighted averages of daily normalised SLP, V850 and Z500 show significant correlations with daily PM2.5 concentrations in BTH (at 99 % confidence level), especially for Z500 (r=0.67), followed by V850 (r=0.59) and SLP (r=0.54) (Table 1). Note that these correlations are stronger than those using the EAWM indices and the Siberian High index from the literature (see Table S1). We therefore use Z500 averaged over Northeast China, Korea and the Sea of Japan [118–139∘ E, 33–50∘ N] (rectangle in Fig. 5c) to build a Z500-based index for BTH (IZ500_BTH) for all days in DJF 2013–17). IZ500_BTH is calculated as the mean of daily normalised Z500 in that region with a reversed sign (Eq. 3) so that negative values of IZ500_BTH indicate a shallow East Asian trough:
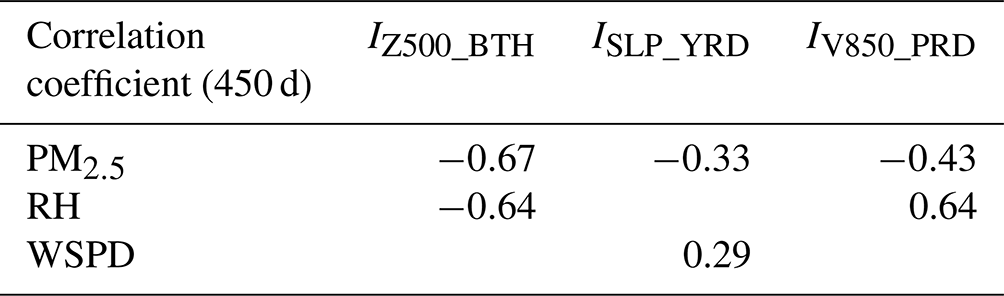
IZ500_BTH is significantly correlated both with PM2.5 concentrations ( in Table 2) and with RH ( in Table 2) in BTH on daily timescales. These results point to a shallow East Asian trough as the dominant large-scale circulation pattern favouring high PM2.5 concentrations and high RH in BTH. The shallow East Asian trough in the middle troposphere inhibits the invasion of northerly cold air from the rear of the trough to northern and central China, yielding southerly wind anomalies (Fig. 4e, f), as found in other studies (e.g. Zhang et al., 2014). This anomalous warm and humid air from the south therefore creates appropriate conditions for the accumulation and possibly the growth of fine aerosols and also suppresses the southward transport of aerosols away from BTH. (See positive correlations for RH and negative correlations for WSPD in Fig. 2a.)
Table 1Correlation of the area-weighted averages of daily normalised circulation variables over the regions marked by yellow rectangles in Figs. 5, 7 and 9 with daily PM2.5 concentrations over BTH, YRD and PRD, respectively, during DJF 2013–2017. All correlation values are significant at the 99 % confidence level. The highest correlation (absolute value) for each region is shown in bold.
4.2 Yangtze River Delta (YRD)
As shown in Fig. 2b, the correlations between daily PM2.5 concentrations and regional meteorological variables over YRD are highest for the most important regional meteorological variable (WSPD) when daily PM2.5 concentrations are lagged by 1 d. Hence, in this section, we focus on the circulation variables (SLP, V850 and Z500) 1 d before heavily polluted days over this region. Heavily polluted days in YRD (PM2.5 above p90; daily PM2.5 concentrations >110 µg m−3) are mainly characterised by reduced SLP over eastern China, indicating a weak Siberian High (Fig. 6a and d) and a shallow East Asian trough with positive Z500 anomalies centred over Japan (Fig. 6c and f). This weakened intensity of the Siberian High is associated with a northerly wind anomaly over both North and South China, as well as a significant southerly wind anomaly over Northeast China and Japan (Fig. 6e). The northerly wind anomaly implies a weakening of the winter mean southerly wind over southern China and a strengthening of the winter mean northerly wind over northern China (Fig. 6b, e). This different pattern in southern vs. northern China is further supported by the daily wind speed at 850 hPa (WSPD850)–PM2.5 correlation features for the whole period of analysis, where daily PM2.5 concentrations in YRD are negatively correlated with WSPD850 over southern China and positively correlated over northern China (Fig. S1). Furthermore, the daily PM2.5 concentrations for YRD have negative correlations with SLP centred over Northeast China (Fig. 7a), negative correlations with V850 over both southern China and northern China (and positive correlations over Northeast China and Japan; Fig. 7b), and positive correlations with Z500 centred over Northwest China (Fig. 7c). These circulation-PM2.5 correlation patterns for the whole period of analysis are consistent with the circulation anomalies shown for heavily polluted days in Fig. 6.
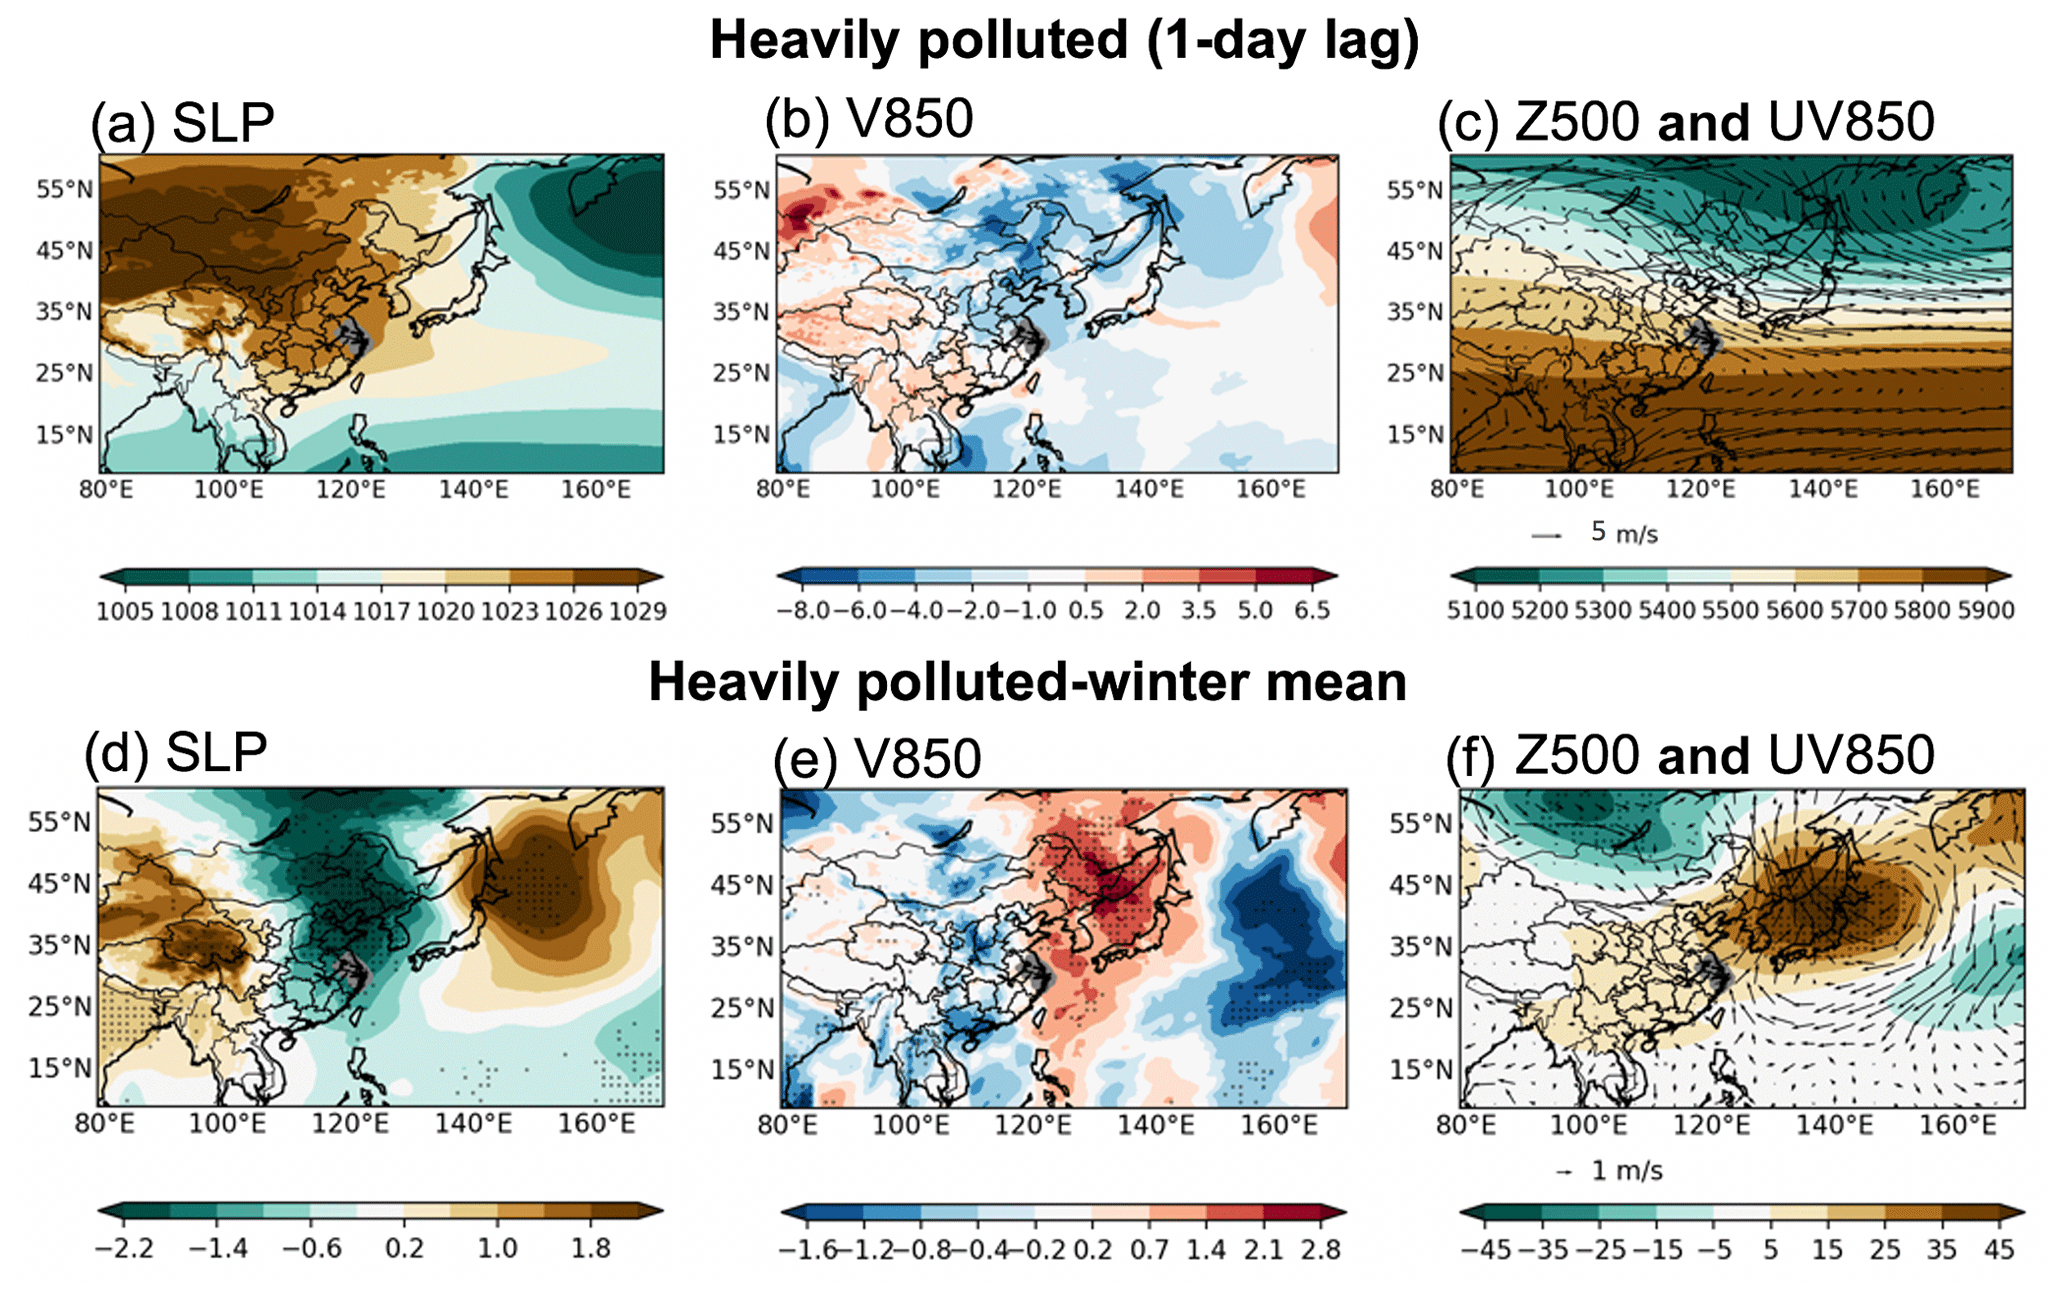
Figure 6Average (a) SLP (hPa), (b) V850 (m s−1), (c) Z500 (m, shading) and 850 hPa wind (m s−1, vector) 1 d before heavily polluted days (24 h PM2.5 above the regional 90th percentile), and difference (1 d before heavily polluted days minus winter mean) for (d) SLP, (e) V850, (f) Z500 and 850 hPa wind during DJF 2013–2017 over YRD. For V850 (b, e), blue regions represent northerlies and red regions represent southerlies. Dotted regions in (d–f) mark statistically significant differences at the 95 % level (determined through a bootstrap resampling method). Grey shading represents the YRD region.
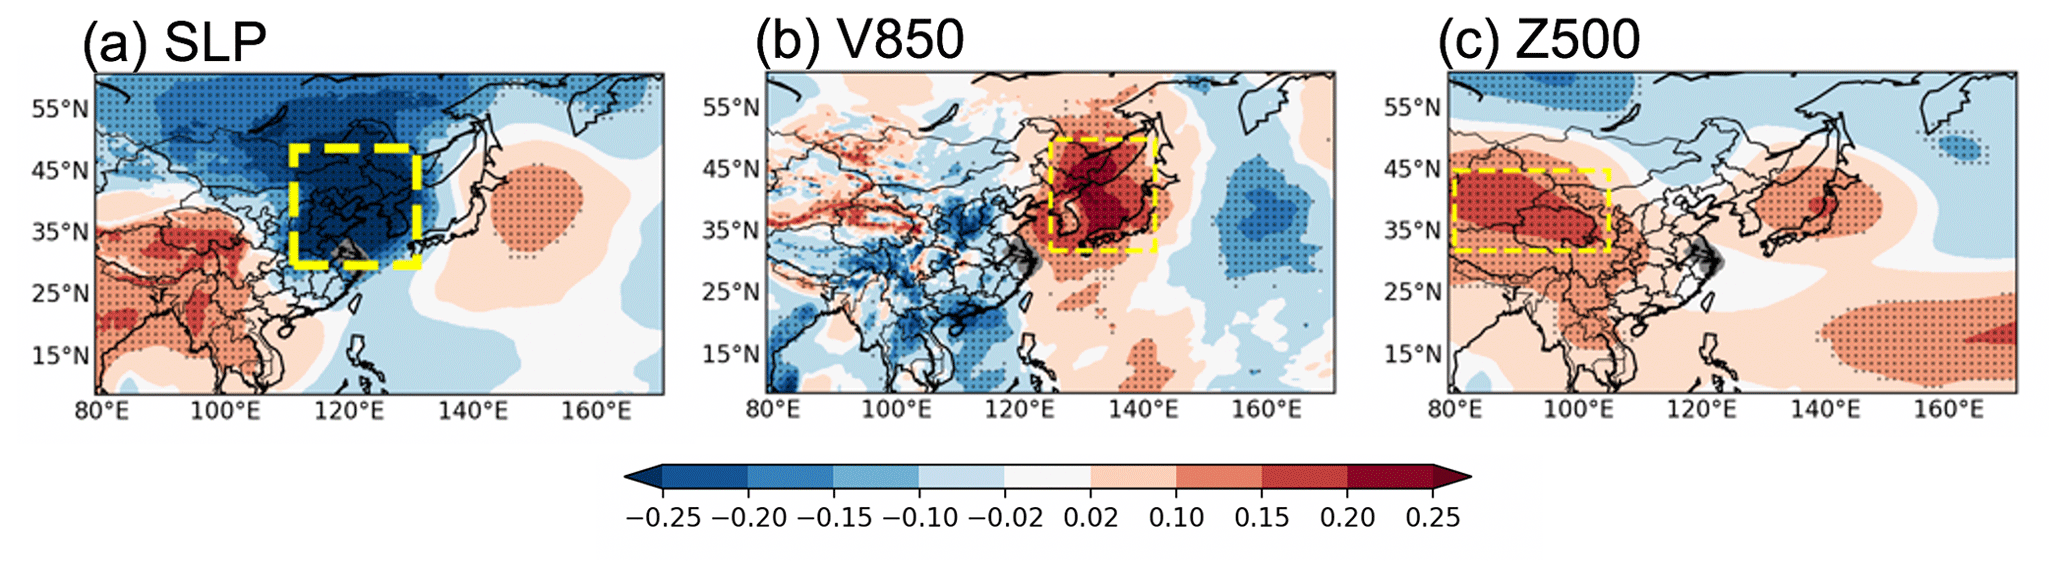
Figure 7Correlation coefficients of daily PM2.5 concentrations in YRD with 1 d before (a) SLP, (b) V850 and (c) Z500 during DJF 2013–2017 (dotted regions indicate significant correlations at the 95 % level from the two-tailed Student's t test). Grey shading represents the YRD region. The broad region presenting the highest correlation with YRD is marked by a yellow rectangle in each panel. The region used for the definition of a circulation-based index (Eq. 4) is marked by a yellow thick rectangle in (a).
We then identify the regions with the highest correlations of area-weighted average daily normalised meteorological fields with daily PM2.5 concentrations in YRD. Among these three meteorological fields (i.e. SLP, V850 and Z500), for the regions that show the highest correlations with PM2.5 concentrations in YRD (yellow rectangles in Fig. 7), SLP is found to have the highest correlation () (Table 1). We therefore use SLP averaged over Northeast China [30–49∘ N, 111–131∘ E] (rectangle in Fig. 7a) to build a normalised SLP-based index for YRD (ISLP_YRD) for all days in DJF 2013–17 (Eq. 4). Negative values of ISLP_YRD indicate a weak Siberian High:
ISLP_YRD is significantly correlated both with PM2.5 concentrations ( in Table 2) and with WSPD (r=0.29 in Table 2) in YRD on daily timescales. This suggests a weakened Siberian High as the dominant large-scale circulation pattern contributing to higher concentrations of PM2.5 and reduced WSPD in YRD. The associated reduction in the southerly wind reported above for southern and eastern China together with reduced WSPD implies a greater suppression of horizontal dispersion, contributing to air pollution accumulation over YRD. Moreover, strengthened northerly winds in northern China may lead to southward transport of aerosols emitted from sources over northern China to YRD, as also indicated by previous studies (Li et al., 2012; Jeong and Park, 2017).
Table 2Correlation of circulation-based indices defined in this study (Eqs. 3–5) with daily PM2.5 concentrations over BTH, YRD and PRD, and with the most important regional meteorological variable in each region during DJF 2013–2017. All correlations are significant at the 99 % confidence level.
We repeated the analysis above to examine the sensitivity to different time lags. The observed circulation anomaly patterns without a lag resemble those found for a 1 d lag, although they are displaced to the east because of the eastward movement of synoptic systems in the midlatitudes (Fig. S2 in the Supplement). The region that shows the highest correlations with PM2.5 concentrations in YRD on the SLP-PM2.5 correlation pattern is slightly less significant without a lag, again with an eastward shift (Fig. S3 in the Supplement).
4.3 Pearl River Delta (PRD)
In contrast to BTH and YRD, the highest correlations of daily PM2.5 concentrations over PRD with the two most important regional meteorological variables (RH and INV) persist when PM2.5 is lagged by several days (Fig. 2c). As the maximum correlations are found with a lag of 2 d, we examine composites of two circulation variables (SLP and V850) and precipitation 2 d before the occurrence of heavily polluted days over PRD (PM2.5 above p90; daily PM2.5 concentrations >68 µg m−3) (Fig. 8). These variables are mainly characterised by reduced SLP centred over northern China and increased SLP over southwestern China, weak southerly winds at 850 hPa over South China, as well as precipitation deficits over southern China. Correlation patterns of PM2.5 with the same fields (Fig. 9) for the whole period of analysis further support these circulation anomalies for heavily polluted days. Daily PM2.5 concentrations over PRD have negative correlations with SLP over northern China (and positive correlations over southern China; Fig. 9a) and negative correlations with V850 over South China and the South China Sea (Fig. 9b), as well as with precipitation over southern China (Fig. 9c). There are also negative correlations between daily PM2.5 concentrations and SSTs over the central and eastern equatorial Pacific (and positive correlations over the western equatorial Pacific), as well as negative correlations for SLP over the western North Pacific (Fig. S4). These circulation–PM2.5 correlation features display characteristic ENSO-related patterns over the Pacific and East Asia (e.g. Wang et al., 2000). La Niña events are associated with warm SSTs in the western Pacific and cold SSTs in the central and eastern equatorial Pacific, reduced SLP over the western North Pacific and descending motion on the northwestern flank of this reduced SLP. The opposite relationships are seen for El Niño (Fig. S4 in the Supplement). This anomalous subsidence with suppressed precipitation (Fig. 9) has been found to play a major role in high PM2.5 concentrations over southern China (e.g. He et al., 2019; Sun et al., 2018). We also found that more than 80 % (37 out of 45) of heavily polluted days in PRD are in La Niña years, considered here as those when the Niño 3.4 index (area-weighted averages of SSTs anomaly over 5∘ S–5∘ N, 120–170∘ W) is less than −0.5. Nonetheless, these results should be treated with caution because of the relatively short time series considered (only five winters with PM2.5 data).
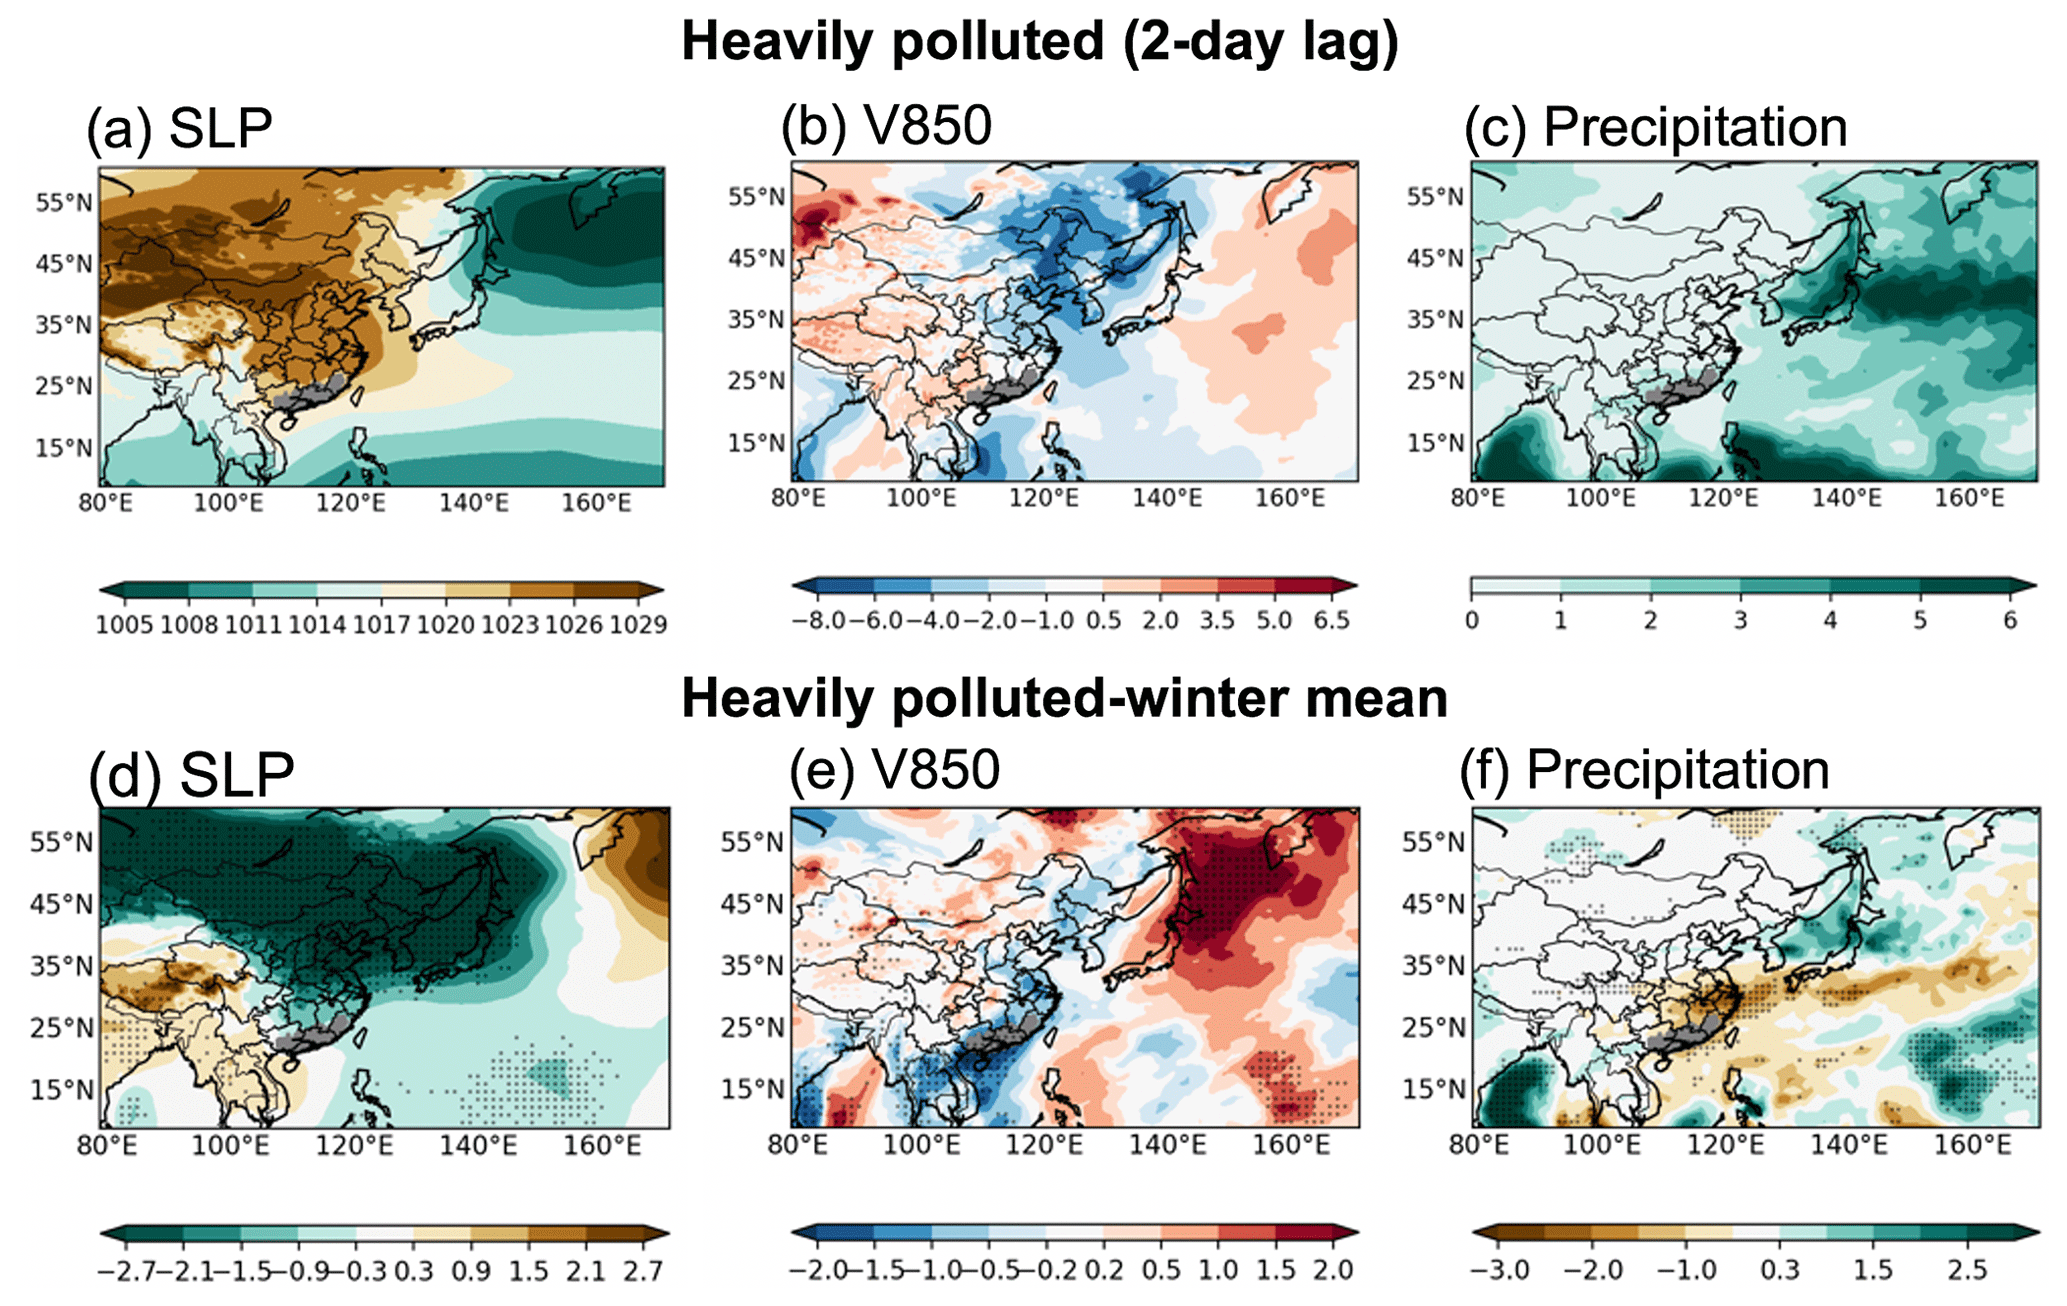
Figure 8Average (a) SLP (hPa), (b) V850 (m s−1) and (c) precipitation (mm d−1) 2 d before heavily polluted days, and the difference (2 d before heavily polluted days minus winter mean) for (d) SLP, (e) V850 and (f) precipitation during DJF 2013–2017 over PRD. For V850 (b, e), blue regions represent northerlies and red regions represent southerlies. Dotted regions in (d–f) mark statistically significant differences at the 95 % level (determined through a bootstrap resampling method). Grey shading represents the PRD region.
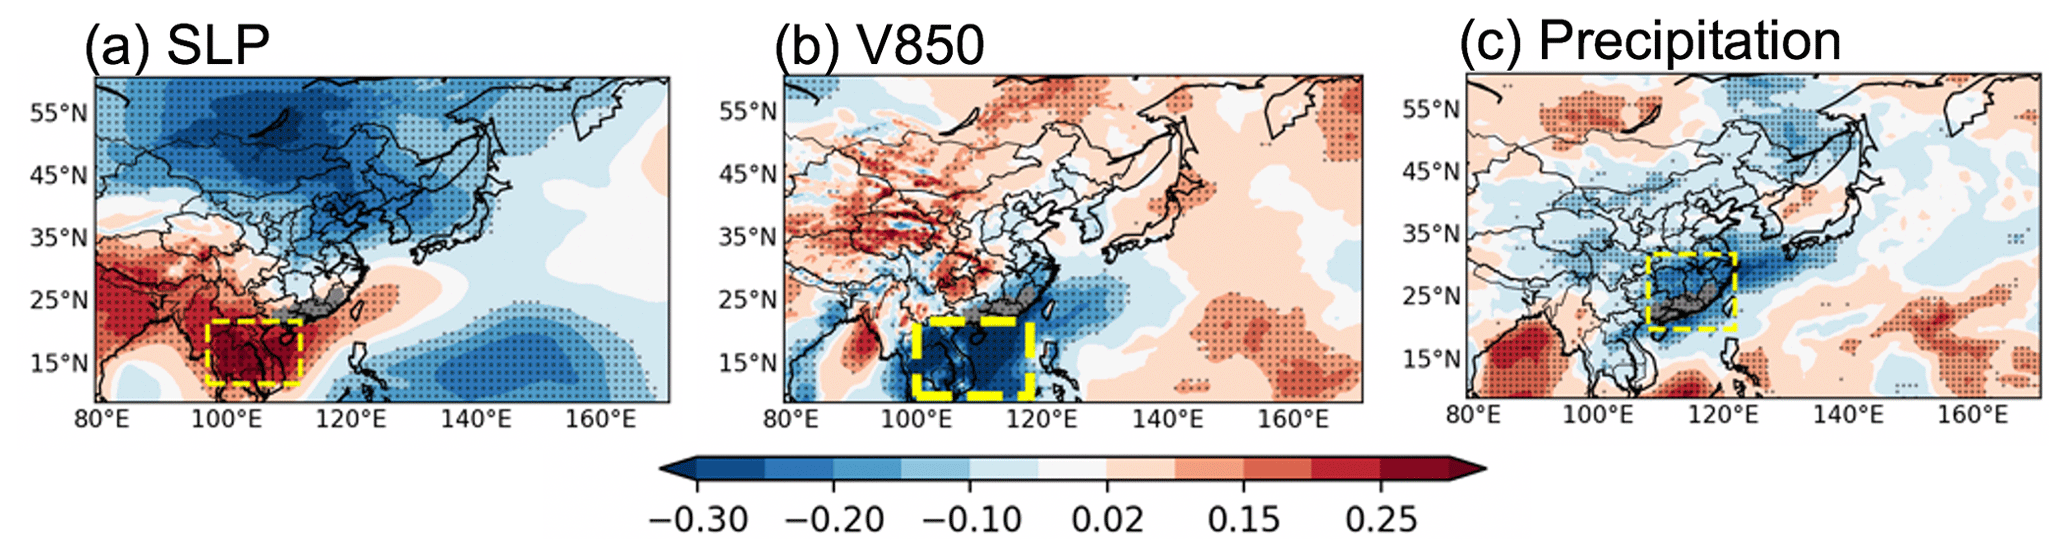
Figure 9Correlation coefficients of daily PM2.5 concentrations in PRD with 2 d before (a) SLP, (b) V850 and (c) precipitation during DJF 2013–2017 (dotted regions indicate significant correlations at the 95 % level from the two-tailed Student's t test). Grey shading represents the PRD region. The broad region presenting the highest correlation with PRD is marked by a yellow rectangle in each panel. The region used for the definition of a circulation-based index (Eq. 5) is marked by a thick yellow rectangle in (b).
Comparing the correlations of the area-weighted average daily normalised meteorological fields with daily PM2.5 concentrations, V850 is found to have the highest value ( in Table 1), followed by SLP and precipitation (r<0.4) over the regions showing the highest correlation with PM2.5 concentrations in PRD (yellow rectangles in Fig. 9). We therefore build a normalised daily V850-based index for PRD (IV850_PRD) by averaging V850 over the region of South China and the South China Sea [100–118∘ E, 10–22∘ N] (rectangle in Fig. 9b) (Eq. 5). Negative values of IV850_PRD indicate weak southerly winds over South China:
Weak southerly winds over southern China as the dominant large-scale circulation pattern are associated with greater polluted continental flow and precipitation deficits under weak cleaner oceanic winds (Fig. 8e, f) that are conducive to air pollution over PRD via reduced wet deposition. Consequently, IV850_PRD is not only negatively correlated with PM2.5 concentrations ( in Table 2) but also positively correlated with regional RH in PRD (r=0.64 in Table 2). The anomalous subsidence yielding precipitation deficits over southern China is also associated with a shallow and stable boundary layer where the vertical dilution capacity of the lower atmosphere decreases (see negative correlations for RH and positive correlations for INV in Fig. 2c). Overall, the observed circulation patterns for smaller and zero lag are broadly similar to those found for a 2 d lag (Fig. S5 in the Supplement), although the V850-PM2.5 correlations weaken as the lag is reduced (Fig. S6 in the Supplement).
Our analyses confirm that the proposed circulation-based indices are significantly correlated with the most important regional meteorological variables and the PM2.5 concentrations on daily timescales during DJF 2013–2017. The correlations are significant at the 99 % confidence level (Table 2). To further examine the performance of circulation-based indices for distinguishing different levels of air quality, we show the distributions of IZ500_BTH, ISLP_YRD and IV850_PRD for several percentile thresholds of daily PM2.5: above p90 (heavily polluted), p50–90 (moderately polluted), p10–50 (moderately clean) and below p10 (clean) (Fig. 10). Note that the sample size for moderate events is larger than for heavily polluted or clean events and also that daily PM2.5 concentrations are lagged by 1 and 2 d in the case of YRD and PRD, respectively, for consistency with the previous analysis.
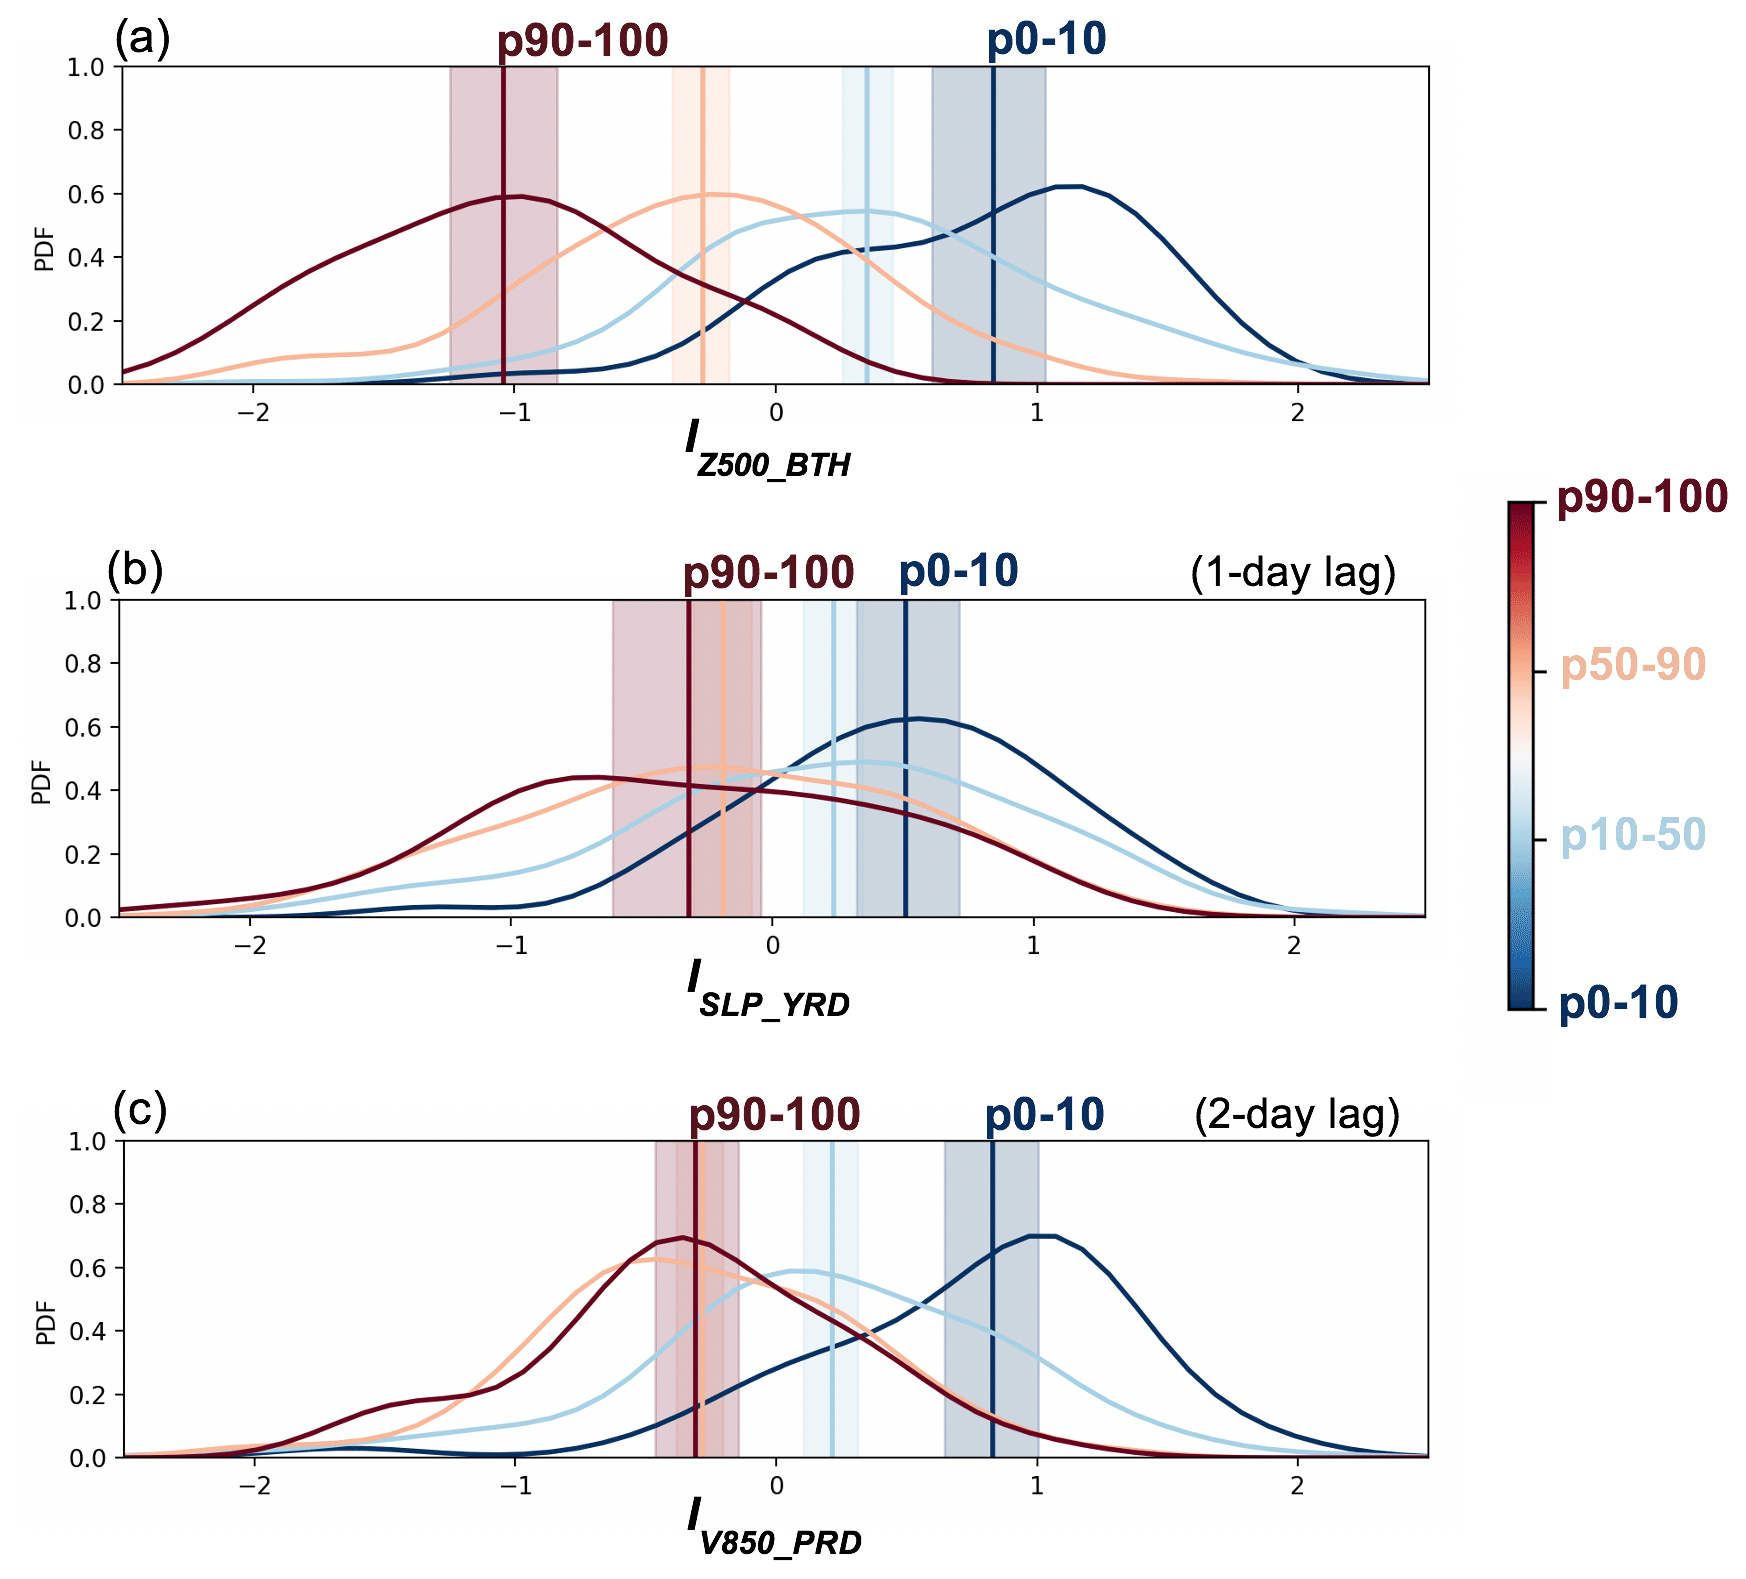
Figure 10Frequency distributions of circulation-based indices for different percentile thresholds of daily mean PM2.5 concentrations over (a) BTH, (b) YRD and (c) PRD during DJF 2013–2017. PM2.5 concentration data are lagged by 1 and 2 d with respect to the circulation indices for YRD and PRD, respectively. The vertical lines and shading represent the averages and the associated 95 % confidence intervals, respectively. Averages are calculated using Tukey's trimean (e.g. Ge et al., 2019): , where Q1 is the lower quartile, Q2 is the median, and Q3 is the upper quartile. The confidence intervals for these averages are estimated by using bootstrap resampling (e.g. Wang, 2001). This method generates samples by randomly choosing daily values of circulation-based indices (resampling with replacement) and then calculating Tukey's trimean. This process is repeated 10 000 times to get robust replicates of the mean. Ultimately, the lower and upper limits of the 95 % confidence intervals are calculated as the values corresponding to the 2.5th and 97.5th percentiles.
For BTH, the average value of IZ500_BTH with associated 95 % confidence intervals are for heavily polluted days, for moderately polluted days, for moderately clean days and for clean days (Fig. 10a). The values of IZ500_BTH for these four categories differ (i.e. the confidence intervals do not overlap) at the 95 % confidence level and IZ500_BTH can distinguish between different levels of air quality, not just extreme heavily polluted or clean conditions. Ge et al. (2019) used a Siberian High index (ISH; Wu and Wang, 2002), which we tested as described in Sect. 4, and a potential vorticity-based EAWM index (IPV; Huang et al., 2016) to distinguish different PM2.5 pollution levels in Beijing. They found that ISH can effectively distinguish clean days (daily PM2.5 concentrations ≤75 µg m−3) from polluted days (daily PM2.5 concentrations ≥75 µg m−3), but could not distinguish between moderate and severe (daily concentrations PM2.5≥150 µg m−3) PM2.5 pollution. The IPV index exhibited the reverse problem. This shows that IZ500_BTH performs better than existing circulation indices, both in capturing the relationship between the dominant large-scale circulation and daily PM2.5 concentrations (Tables 2 and S1) and in distinguishing pollution levels in BTH (Fig. 10a). In the case of YRD (Fig. 10b), ISLP_YRD can effectively distinguish heavily polluted days () from clean days (). However, differences are not significant between heavily and moderately polluted days () and are not highly significant between clean and moderately clean days (). For PRD (Fig. 10c), IV850_PRD can distinguish well between heavily polluted days (), moderately clean days () and clean days (), but not between heavily polluted and moderately polluted days ().
To further illustrate the relationships between the dominant large-scale circulation, as represented by these circulation-based indices, and the severity of PM2.5 pollution at daily timescales, we show the joint frequency distributions of daily values of circulation-based indices compared with daily PM2.5 concentrations (Fig. 11). We show the linear relationship between each respective index and PM2.5 concentrations, as given in Table 2, with higher PM2.5 concentrations and smaller (negative) index values on heavily polluted days, and vice versa. Moderately polluted days (PM2.5 above p50; daily PM2.5 concentrations >43µg m−3 for BTH, >59 µg m−3 for YRD and >39 µg m−3 for PRD) tend to occur when the circulation-based indices are negative. This is more often the case for heavily polluted days (PM2.5 above p90; daily PM2.5 concentrations >97 µg m−3 for BTH, >110 µg m−3 for YRD and >68 µg m−3 for PRD), in particular for BTH where 98 % (44 of 45) of those days have negative values of IZ500_BTH compared with 66 % (119 of 180) of moderately polluted days (p50–90 PM2.5). However, there is no such apparent distinction in the other two regions, since around 62 % of both heavily and moderately polluted days in YRD have negative values of ISLP_YRD, and 70 % of these days in PRD have negative values of IV850_PRD. Alternatively, 51 % (23 of 45), 16 % (7 of 45) and 13 % (6 of 45) of heavily polluted days in BTH, YRD and PRD, respectively, occur when circulation-based indices are below −1.

Figure 11Joint distributions of circulation-based indices against de-trended daily PM2.5 concentrations for different percentile thresholds (colour coded), including the corresponding linear fits with 95 % prediction intervals, over (a) BTH, (b) YRD and (c) PRD during DJF 2013–2017. PM2.5 concentrations data are lagged by 1 and 2 d behind the circulation indices in the case of YRD and PRD, respectively.
By contrast, moderately clean days (PM2.5 below p50) and, to a greater extent, clean days (PM2.5 below p10; daily PM2.5 concentrations <16 µg m−3 for BTH, <29 µg m−3 for YRD and <15 µg m−3 for PRD) tend to occur when circulation-based indices are positive. About 91 % (41 of 45), 80 % (36 of 45) and 89 % (40 of 45) of clean days in BTH, YRD and PRD have positive indices values. As expected, this tendency is even more pronounced for larger values of the indices, as 93 % (52 of 56), 88 % (37 of 42) and 93 % (37 of 40) of days with IZ500_BTH, ISLP_YRD and IV850_PRD exceeding 1 are classified as moderately clean or clean. The share of days with positive values of the circulation indices generally decreases with increasing PM2.5 pollution levels for all three regions, especially for PRD where the percentage of days with positive values of IV850_PRD decreases from 89 % of clean days to only 61 % (110 of 180) of moderately clean days. The results of the analyses conducted so far show that the daily circulation-based indices proposed in this study can capture most of the day-to-day variability of PM2.5 and also identify days with different pollution levels, although with poorer performance for YRD than for the other two regions.
The relatively moderate correlation between daily circulation-based index and daily PM2.5 concentrations in YRD reflects the complex mix of factors affecting the day-to-day variability of this pollutant. We have also found that regional meteorological variables (the most relevant ones are identified in Sect. 3) influence the PM2.5 concentrations for the three regions (e.g. r=0.66 for RH in BTH, for WSPD in YRD and for RH in PRD). On the other hand, there are significant correlations between the circulation-based indices and the most relevant regional meteorological variables in each region, indicating that the effect of circulation on PM2.5 occurs through modulation of the regional meteorology. The relationship between the daily circulation-based index and the most important daily regional meteorological variable is weaker in YRD (r=0.29) than for the other two regions ( for BTH; r=0.64 for PRD) (Table 2). This shows that the daily circulation-based index is not solely capable of capturing the regional meteorological variability driving day-to-day PM2.5 changes in YRD.
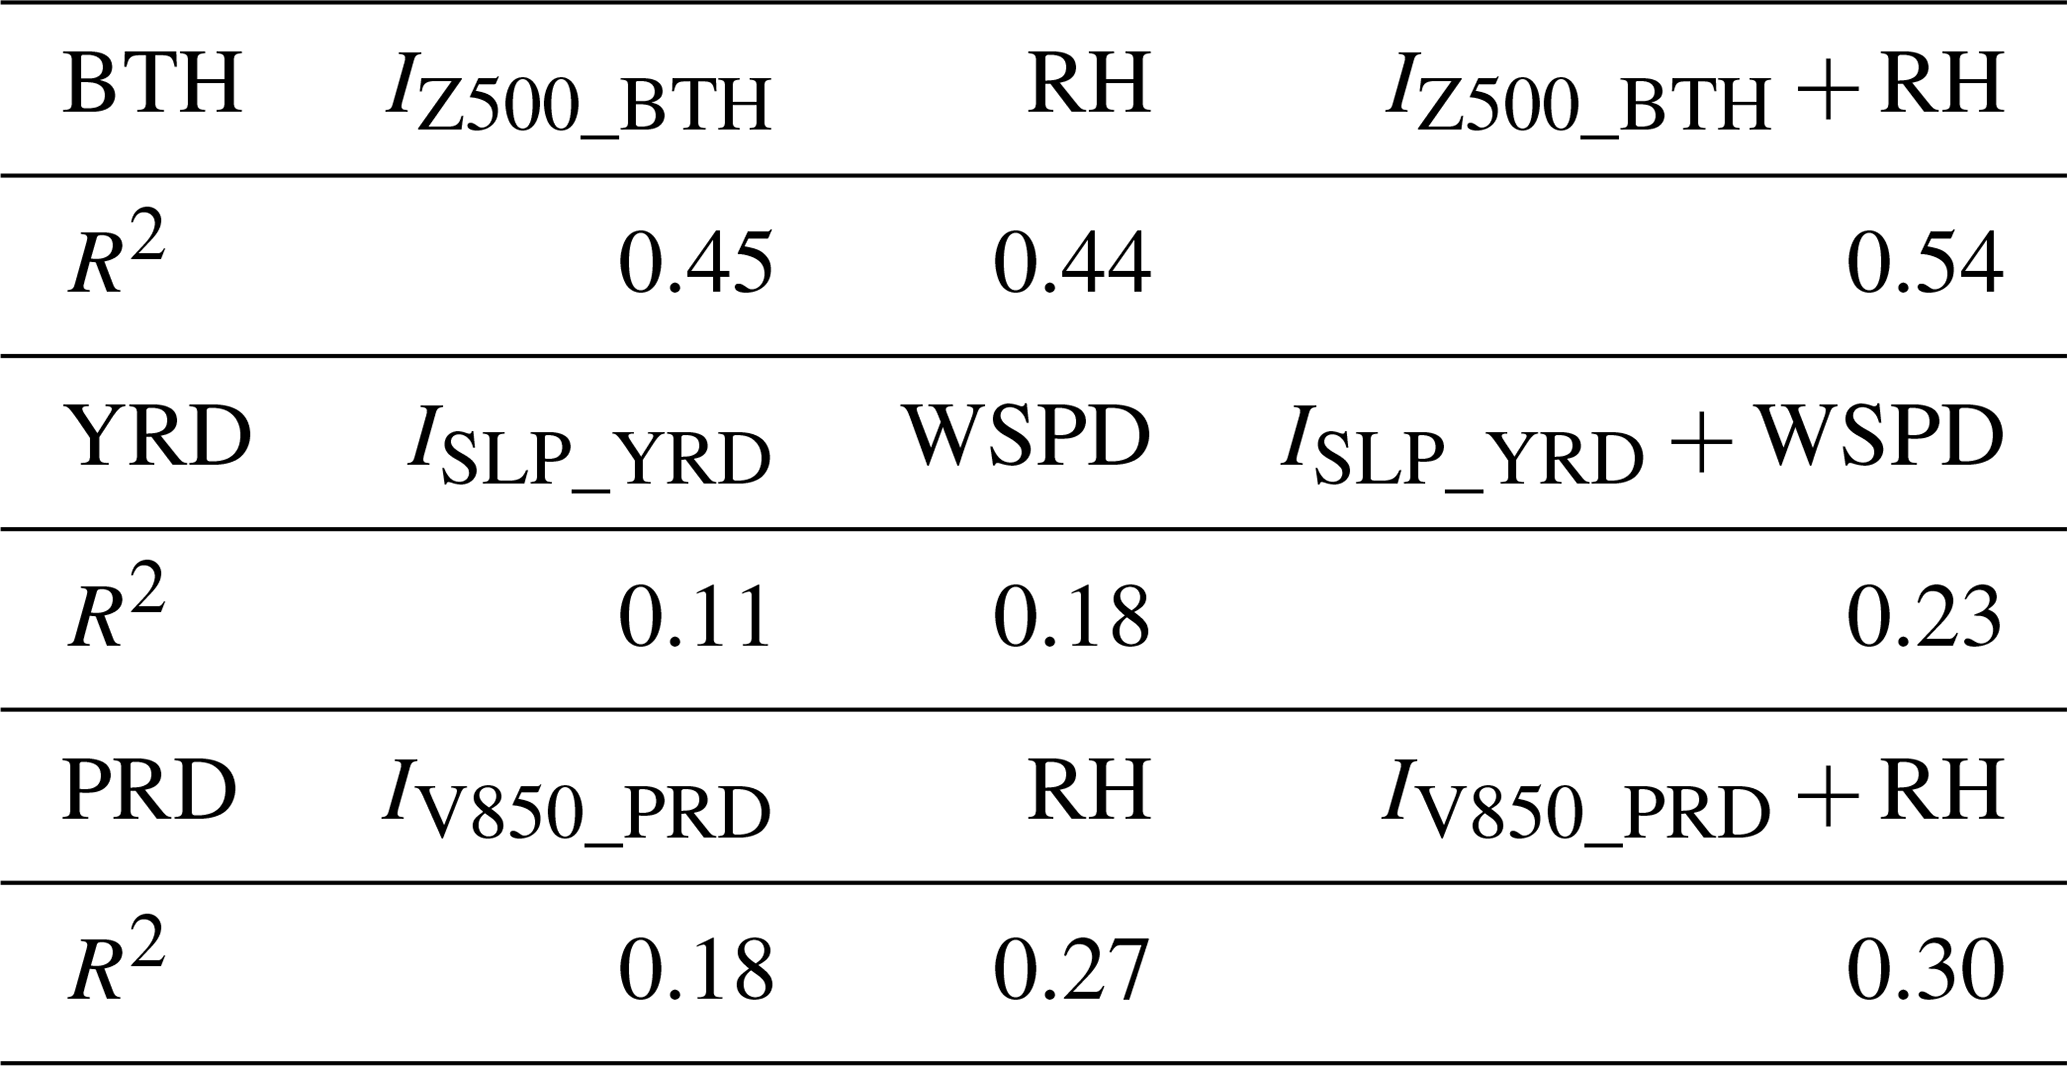
While there is some co-variation in the large-scale circulation with the regional meteorology, they can be combined to reproduce the day-to-day variability of PM2.5 with improved performance. We therefore build multiple regression models including a linear combination of the most important regional meteorological field and the large-scale circulation index in each region (Table 3). The inclusion of regional meteorology explains more of the variance in the PM2.5 concentrations for all three regions (, and ) than the large-scale circulation index alone (R2(IZ500_BTH)=0.45, R2(ISLP_YRD)=0.11 and R2(IV850_PRD)=0.18). However, if we consider the regional meteorological variable alone, we see that its relationship with daily PM2.5 concentrations explains more of the variance than the large-scale circulation variable for the YRD and PRD regions. Hence, compared with a linear model on the most relevant regional meteorological field, these multiple models do not bring major improvements for YRD and PRD, where the increase in explained variance is relatively small (0.18 vs. 0.23 for YRD and 0.27 vs. 0.30 for PRD). As expected, the signs of the regression coefficients for the most important regional meteorological field and the large-scale circulation index (Table S2) are consistent with those of their respective correlation coefficients with PM2.5.
Table 3Linear relationship (explained variance) of daily PM2.5 concentrations in BTH, YRD and PRD, with the circulation-based index of Table 2, the most important regional meteorological field in each region and the linear combination of both during DJF 2013–2017. All the linear relationships are significant at the 99 % confidence level.
This study investigates the modulation of daily PM2.5 concentrations by regional meteorological conditions and large-scale circulation in three major populated regions of China during winter. Using a new high-resolution Chinese air quality reanalysis dataset, major regions associated with BTH, YRD and PRD are identified where daily PM2.5 concentrations are spatially coherent. For these three regions, we find that the regional meteorological variables most correlated with daily PM2.5 concentrations are different: RH on the same day for BTH (r=0.66), WSPD 1 d before for YRD () and RH 2 d before for PRD (). We identify the dominant large-scale circulation patterns associated with heavily polluted days (PM2.5 above p90) considering the same time lags. In BTH, we find that a shallow East Asian trough has the strongest relationship with both PM2.5 concentrations () and RH (). This suggests a strong contribution of warm, humid air from the south and weak transport of northerly cold, dry air associated with the shallow East Asian trough to air pollution accumulation in BTH. In YRD, a weak Siberian High shows the largest correlation with PM2.5 concentrations () and WSPD (r=0.29). This reflects the relationship between weak southerly winds over southern China, associated with a weak Siberian High, and poor horizontal dispersion of polluted air in YRD. In PRD, weak southerly winds over southern China have the largest correlations with PM2.5 concentrations () and RH (r=0.64). This illustrates the influence of flow from more polluted continental regions and of precipitation deficits under weak humid southerly winds on PM2.5 pollution through reduced wet deposition in PRD.
Based on these dominant large-scale circulation features, we propose three new circulation-based indices that can be used both to explain the day-to-day variability of the PM2.5 concentrations and to predict the occurrence of heavily polluted days and clean days (PM2.5 below p10) in each region: a 500 hPa geopotential height-based index for BTH (IZ500_BTH), a sea level pressure-based index for YRD (ISLP_YRD) and a meridional wind-based index for PRD (IV850_PRD). These indices capture the relationship between the dominant large-scale circulation and daily PM2.5 concentrations better than existing EAWM indices (Yang et al., 2002; Sun and Li, 1997; Jhun and Lee, 2004) and the Siberian High index (Wu and Wang, 2002). They improve on the capability of current circulation-based indices (e.g. Wu and Wang, 2002; Huang et al., 2016) to distinguish PM2.5 pollution levels in BTH, and are the first daily circulation-based indices specifically derived for YRD and PRD. Furthermore, consideration of regional meteorology improves the performance of these large-scale circulation-based indices to predict the day-to-day evolution of the regional PM2.5 concentrations in these regions, raising the explained variance from 0.45 to 0.54 for BTH, from 0.11 to 0.23 for YRD and from 0.18 to 0.30 for PRD.
These results demonstrate the benefits of considering the large-scale circulation for air quality studies over China. Although the circulation indices explain less variance than the most relevant regional meteorological fields for YRD and PRD, we expect climate models to represent these features of the large-scale circulation better than regional meteorological fields that depend on subgrid scale processes. Indeed, current climate models have a limited capability to represent some regional signals (e.g. RH: Xu et al., 2021; surface wind speed: Zha et al., 2020). On the other hand, climate model projections of the inter-annual variability, decadal oscillations and long-term trends of circulation indices are appropriate to represent the future evolution of the PM2.5 concentrations under climate change (e.g. Cai et al., 2017; Zhao et al., 2021), considering different degrees of pollution control. Such an approach could be applied to guide air quality policies aimed at keeping future PM2.5 concentrations below current levels.
There are, however, two limitations inherent in this work. First, the relationships between atmospheric circulation and daily PM2.5 concentrations may not be linear, as assumed in this study. Although we have improved the explained daily variability of PM2.5 by linearly combining the most important regional meteorological field and the large-scale circulation index, non-linear models that account for the covariance of meteorological fields (e.g. Barmpadimos et al., 2011, 2012, Garrido-Perez et al., 2021) or dimensionality reduction techniques, such as principal component analysis (e.g. Tai et al., 2012; Shen et al., 2015; Leung et al., 2018), merit further consideration. In addition, these large-scale relationships are based on only five winters of data, because high spatiotemporal coverage of air pollution measurements are only available in China from 2013. Hence, whilst our results are encouraging (e.g. we find that more than 80 % of heavily polluted days in PRD occur in La Niña years), the robustness of these results needs to be verified using longer-term data. Despite these limitations, the results of this study are beneficial to understanding and forecasting the occurrence of air pollution episodes in the three regions from a large-scale perspective.
No new data were created in this study. The data used in this study are introduced with details in Sect. 2 and web links of these publicly available datasets are as follows: ERA-5 (https://cds.climate.copernicus.eu/cdsapp#!/dataset/reanalysis-era5-pressure-levels, Hersbach et al., 2018), GPCP (https://rda.ucar.edu/datasets/ds728.3/, Huffman et al., 2016) and CAQRA (http://cstr.cn/31253.11.sciencedb.00053, Tang et al., 2021).
The supplement related to this article is available online at: https://doi.org/10.5194/acp-22-6471-2022-supplement.
ZJ, RMD, CO, CL and OW designed the study. ZJ processed and analysed the data. XT provided the CAQRA reanalysis data. ZJ, RMD, CO, CL and OW prepared the paper with contributions from all co-authors.
The contact author has declared that neither they nor their co-authors have any competing interests.
Publisher's note: Copernicus Publications remains neutral with regard to jurisdictional claims in published maps and institutional affiliations.
Oliver Wild and Ruth M. Doherty thank the Natural Environment Research Council (NERC) for funding under grant nos. NE/N006925/1, NE/N006976/1 and NE/N006941/1. Carlos Ordóñez thanks the Spanish Ministerio de Economía y Competitividad (grant no. RYC-2014-15036). Chaofan Li thanks the National Key Research and Development Program of China (grant No. 2018YFA0606501).
This research has been supported by the Natural Environment Research Council (NERC; grant nos. NE/N006925/1, NE/N006976/1 and NE/N006941/1).
This paper was edited by Lea Hildebrandt Ruiz and reviewed by three anonymous referees.
Aksoyoglu, S., Keller, J., Barmpadimos, I., Oderbolz, D., Lanz, V. A., Prévôt, A. S. H., and Baltensperger, U.: Aerosol modelling in Europe with a focus on Switzerland during summer and winter episodes, Atmos. Chem. Phys., 11, 7355–7373, https://doi.org/10.5194/acp-11-7355-2011, 2011.
Allen, M. R. and Smith, L. A.: Investigating the origins and significance of low-frequency modes of climate variability, Geophys. Res. Lett., 21, 883-886, https://doi.org/10.1029/94GL00978, 1994.
Barmpadimos, I., Hueglin, C., Keller, J., Henne, S., and Prévôt, A. S. H.: Influence of meteorology on PM10 trends and variability in Switzerland from 1991 to 2008, Atmos. Chem. Phys., 11, 1813–1835, https://doi.org/10.5194/acp-11-1813-2011, 2011.
Barmpadimos, I., Keller, J., Oderbolz, D., Hueglin, C., and Prévôt, A. S. H.: One decade of parallel fine (PM2.5) and coarse (PM10− PM2.5) particulate matter measurements in Europe: trends and variability, Atmos. Chem. Phys., 12, 3189–3203, https://doi.org/10.5194/acp-12-3189-2012, 2012.
Copernicus Climate Change Service (C3S): ERA5: fifth generation of ECMWF atmospheric reanalyses of the global climate, Copernicus Climate Change Service Climate Data Store (CDS) [data set], 15(2), 2020, https://cds.climate.copernicus.eu/cdsapp#!/home (last access: 16 May 2022), 2017.
Cai, W., Li, K., Liao, H., Wang, H., and Wu, L.: Weather conditions conducive to Beijing severe haze more frequent under climate change, Nat. Clim. Change, 7, 257–262, https://doi.org/10.1038/nclimate3249, 2017.
Chan, C. K. and Yao, X.: Air pollution in mega cities in China, Atmos. Environ., 42, 1–42, https://doi.org/10.1016/j.atmosenv.2007.09.003, 2008.
Chang, C. P., Wang, Z., and Hendon, H.: The Asian winter monsoon, in: The Asian Monsoon, 89–127, Springer, Berlin, Heidelberg, ISBN 9783540377221, ISBN 3540377220, 2006.
Cheng, J., Su, J., Cui, T., Li, X., Dong, X., Sun, F., Yang, Y., Tong, D., Zheng, Y., Li, Y., Li, J., Zhang, Q., and He, K.: Dominant role of emission reduction in PM2.5 air quality improvement in Beijing during 2013–2017: a model-based decomposition analysis, Atmos. Chem. Phys., 19, 6125–6146, https://doi.org/10.5194/acp-19-6125-2019, 2019.
Dawson, J. P., Adams, P. J., and Pandis, S. N.: Sensitivity of PM2.5 to climate in the Eastern US: a modeling case study, Atmos. Chem. Phys., 7, 4295–4309, https://doi.org/10.5194/acp-7-4295-2007, 2007.
Dawson, J. P., Bloomer, B. J., Winner, D. A., and Weaver, C. P.: Understanding the meteorological drivers of US particulate matter concentrations in a changing climate, B. Am. Meteorol. Soc., 95, 521–532, https://doi.org/10.1175/BAMS-D-12-00181.1, 2014.
Garrido-Perez, J. M., Ordóñez, C., and Garcia-Herrera, R.: Strong signatures of high-latitude blocks and subtropical ridges in winter PM10 over Europe, Atmos. Environ., 167, 49–60, https://doi.org/10.1016/j.atmosenv.2017.08.004, 2017.
Garrido-Perez, J. M., García-Herrera, R., and Ordóñez, C.: Assessing the value of air stagnation indices to reproduce PM10 variability in Europe, Atmos. Res., 248, 105258, https://doi.org/10.1016/j.atmosres.2020.105258, 2021.
Ge, W., Yin, Y., Wright, J. S., Huang, W., Jia, B., Wang, Y., and Yang, Z.: Links Between the Large-Scale Circulation and Daily Air Quality Over Central Eastern China During Winter, J. Geophys. Res.-Atmos., 124, 7147–7163, https://doi.org/10.1029/2018JD030154, 2019.
Han, L., Zhou, W., and Li, W.: Fine particulate (PM2.5) dynamics during rapid urbanization in Beijing, 1973–2013, Sci. Rep., 6, 1–5, https://doi.org/10.1038/srep23604, 2016.
He, C., Liu, R., Wang, X., Liu, S. C., Zhou, T., and Liao, W.: How does El Niño-Southern Oscillation modulate the interannual variability of winter haze days over eastern China?, Sci. Total Environ., 651, 1892–1902, https://doi.org/10.1016/j.scitotenv.2018.10.100, 2019.
Hersbach, H., Bell, B., Berrisford, P., Biavati, G., Horányi, A., Muñoz Sabater, J., Nicolas, J., Peubey, C., Radu, R., Rozum, I., Schepers, D., Simmons, A., Soci, C., Dee, D., and Thépaut, J.-N.: ERA5 hourly data on pressure levels from 1979 to present, Copernicus Climate Change Service (C3S) Climate Data Store (CDS) [data set], https://cds.climate.copernicus.eu/cdsapp#!/dataset/reanalysis-era5-pressure-levels (last access: 17 May 2022), 2018.
Hersbach, H., Bell, B., Berrisford, P., Hirahara, S., Horányi, A., Muñoz-Sabater, J., Nicolas, J., Peubey, C., Radu, R., Schepers, D., Simmons, A., Soci, C., Abdalla, S., Abellan, X., Balsamo, G., Bechtold, P., Biavati, G., Bidlot, J., Bonavita, M., Chiara, G., Dahlgren, P., Dee, D., Diamantakis, M., Dragani, R., Flemming, J., Forbes, R., Fuentes, M., Geer, A., Haimberger, L., Healy, S., Hogan, R. J., Hólm, E., Janisková, M., Keeley, S., Laloyaux, P., Lopez, P., Lupu, C., Radnoti, G., Rosnay, P., Rozum, I., Vamborg, F., Villaume, S., and Thépaut, J. N.: The ERA5 global reanalysis, Q. J. Roy. Meteor. Soc., 146, 1999–2049, https://doi.org/10.1002/qj.3803, 2020.
Hou, X., Fei, D., Kang, H., Zhang, Y., and Gao, J.: Seasonal statistical analysis of the impact of meteorological factors on fine particle pollution in China in 2013–2017, Nat. Hazards, 93, 677–698, https://doi.org/10.1007/s11069-018-3315-y, 2018.
Hou, X., Zhu, B., Kumar, K. R., and Lu, W.: Inter-annual variability in fine particulate matter pollution over China during 2013–2018: Role of meteorology, Atmos. Environ., 214, 116842, https://doi.org/10.1016/j.atmosenv.2019.116842, 2019.
Hou, X., Zhu, B., Kumar, K. R., de Leeuw, G., Lu, W., Huang, Q., and Zhu, X.: Establishment of conceptual schemas of surface synoptic meteorological situations affecting fine particulate pollution across eastern China in the winter, J. Geophys. Res.-Atmos., 125, e2020JD033153, https://doi.org/10.1029/2020JD033153, 2020.
Hu, J., Emile-Geay, J., and Partin, J.: Correlation-based interpretations of paleoclimate data–where statistics meet past climates, Earth Planet. Sci. Lett., 459, 362–371, https://doi.org/10.1016/j.epsl.2016.11.048, 2017.
Huang, W., Wang, B., and Wright, J. S.: A potential vorticity-based index for the East Asian winter monsoon, J. Geophys. Res.-Atmos., 121, 9382–9399, https://doi.org/10.1002/2016JD025053, 2016.
Huffman, G. J., Adler, R. F., Morrissey, M. M., Bolvin, D. T., Curtis, S., Joyce, R., McGavock, B., and Susskind, J.: Global precipitation at one-degree daily resolution from multisatellite observations, J. Hydrometeorol., 2, 36–50, https://doi.org/10.1175/1525-7541(2001)002<0036:GPAODD>2.0.CO;2, 2001.
Huffman, G. J., Bolvin, D. T., and Adler, R. F.: GPCP Version 1.2 One-Degree Daily Precipitation Data Set, Research Data Archive at the National Center for Atmospheric Research, Computational and Information Systems Laboratory [data set], https://rda.ucar.edu/datasets/ds728.3/ (last access: 17 May 2022), 2016.
Jeong, J. I. and Park, R. J.: Winter monsoon variability and its impact on aerosol concentrations in East Asia, Environ. Pollut., 221, 285–292, https://doi.org/10.1016/j.envpol.2016.11.075, 2017.
Jhun, J. G. and Lee, E. J.: A new East Asian winter monsoon index and associated characteristics of the winter monsoon, J. Climate, 17, 711–726, https://doi.org/10.1175/1520-0442(2004)017<0711:ANEAWM>2.0.CO;2, 2004.
Jia, B., Wang, Y., Yao, Y., and Xie, Y.: A new indicator on the impact of large-scale circulation on wintertime particulate matter pollution over China, Atmos. Chem. Phys., 15, 11919–11929, https://doi.org/10.5194/acp-15-11919-2015, 2015.
Kong, L., Tang, X., Zhu, J., Wang, Z., Li, J., Wu, H., Wu, Q., Chen, H., Zhu, L., Wang, W., Liu, B., Wang, Q., Chen, D., Pan, Y., Song, T., Li, F., Zheng, H., Jia, G., Lu, M., Wu, L., and Carmichael, G. R.: A 6-year-long (2013–2018) high-resolution air quality reanalysis dataset in China based on the assimilation of surface observations from CNEMC, Earth Syst. Sci. Data, 13, 529–570, https://doi.org/10.5194/essd-13-529-2021, 2021.
Koch, D., Park, J., and Del Genio, A.: Clouds and sulfate are anticorrelated: A new diagnostic for global sulfur models, J. Geophys. Res.-Atmos., 108, 4781, https://doi.org/10.1029/2003JD003621, 2003.
Leung, D. M., Tai, A. P. K., Mickley, L. J., Moch, J. M., van Donkelaar, A., Shen, L., and Martin, R. V.: Synoptic meteorological modes of variability for fine particulate matter (PM2.5) air quality in major metropolitan regions of China, Atmos. Chem. Phys., 18, 6733–6748, https://doi.org/10.5194/acp-18-6733-2018, 2018.
Li, Y. and Yang, S.: A dynamical index for the East Asian winter monsoon, J. Climate, 23, 4255–4262, https://doi.org/10.1175/2010JCLI3375.1, 2010.
Li, M., Huang, X., Zhu, L., Li, J., Song, Y., Cai, X., and Xie, S.: Analysis of the transport pathways and potential sources of PM10 in Shanghai based on three methods, Sci. Total Environ., 414, 525–534, https://doi.org/10.1016/j.scitotenv.2011.10.054, 2012.
Li, K., Jacob, D. J., Liao, H., Zhu, J., Shah, V., Shen, L., Bates, K. H., Zhang, Q., and Zhai, S.: A two-pollutant strategy for improving ozone and particulate air quality in China, Nat. Geosci., 12, 906–910, https://doi.org/10.1038/s41561-019-0464-x, 2019.
Pei, L., Yan, Z., Sun, Z., Miao, S., and Yao, Y.: Increasing persistent haze in Beijing: potential impacts of weakening East Asian winter monsoons associated with northwestern Pacific sea surface temperature trends, Atmos. Chem. Phys., 18, 3173–3183, https://doi.org/10.5194/acp-18-3173-2018, 2018.
Shen, L., Mickley, L. J., and Tai, A. P. K.: Influence of synoptic patterns on surface ozone variability over the eastern United States from 1980 to 2012, Atmos. Chem. Phys., 15, 10925–10938, https://doi.org/10.5194/acp-15-10925-2015, 2015.
Sun, B. M. and Li, C. Y.: Relationship between the disturbances of East Asian trough and tropical convective activities in boreal winter, Chin. Sci. Bull, 42, 500–504, https://doi.org/10.1360/csb1997-42-5-500, 1997.
Sun, Y., Wang, Z., Fu, P., Jiang, Q., Yang, T., Li, J., and Ge, X.: The impact of relative humidity on aerosol composition and evolution processes during wintertime in Beijing, China, Atmos. Environ., 77, 927–934, https://doi.org/10.1016/j.atmosenv.2013.06.019, 2013.
Sun, J., Li, H., Zhang, W., Li, T., Zhao, W., Zuo, Z., Guo, S., Wu, D., and Fan, S.: Modulation of the ENSO on winter aerosol pollution in the eastern region of China, J. Geophys. Res.-Atmos., 123, 11952–11969, https://doi.org/10.1029/2018JD028534, 2018.
Tai, A. P., Mickley, L. J., and Jacob, D. J.: Correlations between fine particulate matter (PM2.5) and meteorological variables in the United States: Implications for the sensitivity of PM2.5 to climate change, Atmos. Environ., 44, 3976–3984, https://doi.org/10.1016/j.atmosenv.2010.06.060, 2010.
Tai, A. P. K., Mickley, L. J., Jacob, D. J., Leibensperger, E. M., Zhang, L., Fisher, J. A., and Pye, H. O. T.: Meteorological modes of variability for fine particulate matter (PM2.5) air quality in the United States: implications for PM2.5 sensitivity to climate change, Atmos. Chem. Phys., 12, 3131–3145, https://doi.org/10.5194/acp-12-3131-2012, 2012.
Tang, X., Kong, L., Zhu, J., Wang, Z., Li, J., Wu, H., Wu, Q., Chen, H., Zhu, L., Wang, W., Liu, B., Wang, Q., Chen, D., Pan, Y., Song, T., Li, F., Zheng, H., Jia, G., Lu, M., Wu, L., and Carmichael, G. R.: A High-resolution Air Quality Reanalysis Dataset over China (CAQRA)[DS/OL], Science Data Bank [data set], http://cstr.cn/31253.11.sciencedb.00053 (last access: 17 May 2022), 2021.
Wang, F. K.: Confidence interval for the mean of non-normal data, Qual. Reliab. Eng. Int., 17, 257–267, https://doi.org/10.1002/qre.400, 2001.
Wang, L. and Chen, W.: How well do existing indices measure the strength of the East Asian winter monsoon?, Adv. Atmos. Sci., 27, 855–870, https://doi.org/10.1007/s00376-009-9094-3, 2010.
Wang, L. and Lu, M. M.: The East Asian winter monsoon, in: The global monsoon system: research and forecast, 3rd edn, edited by: Chang, C. P., Kuo, H. C., Lau, N. C., Johnson, R.H., Wang, B., and Wheeler, M., World Scientific, Singapore, 51–61, https://doi.org/10.1142/9789813200913_0005, 2017.
Wang, W., Primbs, T., Tao, S., and Simonich, S. L. M.: Atmospheric particulate matter pollution during the 2008 Beijing Olympics, Environ. Sci. Technol., 43, 5314–5320, https://doi.org/10.1021/es9007504, 2009.
Wang, B., Wu, R., and Fu, X.: Pacific–East Asian teleconnection: how does ENSO affect East Asian climate?, J. Climate, 13, 1517–1536, https://doi.org/10.1175/1520-0442(2000)013<1517:PEATHD>2.0.CO;2, 2000.
Wang, L., Xu, J., Yang, J., Zhao, X., Wei, W., Cheng, D., Pan, X., and Su, J.: Understanding haze pollution over the southern Hebei area of China using the CMAQ model, Amtos. Environ., 56, 69–79, https://doi.org/10.1016/j.atmosenv.2012.04.013, 2012.
Wang, L., Zhang, N., Liu, Z., Sun, Y., Ji, D., and Wang, Y.: The influence of climate factors, meteorological conditions, and boundary-layer structure on severe haze pollution in the Beijing-Tianjin-Hebei region during January 2013, Adv. Meteorol., 2014, 685971, https://doi.org/10.1155/2014/685971, 2014.
Wang, X., Wang, K., and Su, L.: Contribution of atmospheric diffusion conditions to the recent improvement in air quality in China, Sci. Rep., 6, 1–11, https://doi.org/10.1038/srep36404, 2016.
Wang, X., Dickinson, R. E., Su, L., Zhou, C., and Wang, K.: PM2.5 pollution in China and how it has been exacerbated by terrain and meteorological conditions, B. Am. Meteorol. Soc., 99, 105–119, https://doi.org/10.1175/BAMS-D-16-0301.1, 2018.
Wang, L., Wang, H., Liu, J., Gao, Z., Yang, Y., Zhang, X., Li, Y., and Huang, M.: Impacts of the near-surface urban boundary layer structure on PM2.5 concentrations in Beijing during winter, Sci. Total Environ., 669, 493–504, https://doi.org/10.1016/j.scitotenv.2019.03.097, 2019a.
Wang, C., An, X., Zhang, P., Sun, Z., Cui, M., and Ma, L.: Comparing the impact of strong and weak East Asian winter monsoon on PM2.5 concentration in Beijing, Atmos. Res., 215, 165–177, https://doi.org/10.1016/j.atmosres.2018.08.022, 2019b.
Wu, B., and Wang, J.: Winter arctic oscillation. Siberian High and East Asian Monsoon, Geophys. Res. Lett., 29, 1897, https://doi.org/10.1029/2002GL015373, 2002.
Xu, P., Chen, Y., and Ye, X.: Haze, air pollution, and health in China, Lancet, 382, 2067, https://doi.org/10.1016/S0140-6736(13)62693-8, 2013.
Xu, Z., Han, Y., Tam, C. Y., Yang, Z. L., and Fu, C.: Bias-corrected CMIP6 global dataset for dynamical downscaling of the historical and future climate (1979–2100), Scientific Data, 8, 1–11, https://doi.org/10.1038/s41597-021-01079-3, 2021.
Yang, S., Lau, K. M., and Kim, K. M.: Variations of the East Asian jet stream and Asian–Pacific–American winter climate anomalies, J. Climate, 15, 306–325, https://doi.org/10.1175/1520-0442(2002)015<0306:VOTEAJ>2.0.CO;2, 2002.
Yang, Y., Liu, X., Qu, Y., Wang, J., An, J., Zhang, Y., and Zhang, F.: Formation mechanism of continuous extreme haze episodes in the megacity Beijing, China, in January 2013, Atmos. Res., 155, 192–203, https://doi.org/10.1016/j.atmosres.2014.11.023, 2015.
Zha, J., Wu, J., Zhao, D., and Fan, W.: Future projections of the near-surface wind speed over eastern China based on CMIP5 datasets, Clim. Dynam., 54, 2361–2385, https://doi.org/10.1029/2012JD017533, 2020.
Zhang, Q., Streets, D. G., He, K., and Klimont, Z.: Major components of China's anthropogenic primary particulate emissions, Environ. Res. Lett., 2, 045027, https://doi.org/10.1088/1748-9326/2/4/045027, 2007.
Zhang, R., Min, Q., and Su, J.: Impact of El Niño on atmospheric circulations over East Asia and rainfall in China: Role of the anomalous western North Pacific anticyclone, Science China Earth Sciences, 60, 1124–1132, https://doi.org/10.1007/s11430-016-9026-x, 2017.
Zhang, R. H., Li, Q., and Zhang, R.: Meteorological conditions for the persistent severe fog and haze event over eastern China in January 2013, Science China Earth Sciences, 57, 26–35, https://doi.org/10.1007/s11430-013-4774-3, 2014.
Zhang, G., Gao, Y., Cai, W., Leung, L. R., Wang, S., Zhao, B., Wang, M., Shan, H., Yao, X., and Gao, H.: Seesaw haze pollution in North China modulated by the sub-seasonal variability of atmospheric circulation, Atmos. Chem. Phys., 19, 565–576, https://doi.org/10.5194/acp-19-565-2019, 2019.
Zhao, X. J., Zhao, P. S., Xu, J., Meng, W., Pu, W. W., Dong, F., He, D., and Shi, Q. F.: Analysis of a winter regional haze event and its formation mechanism in the North China Plain, Atmos. Chem. Phys., 13, 5685–5696, https://doi.org/10.5194/acp-13-5685-2013, 2013.
Zhao, S., Feng, T., Tie, X., Li, G., and Cao, J.: Air pollution zone migrates south driven by East Asian winter monsoon and climate change, Geophys. Res. Lett., 48, e2021GL092672, https://doi.org/10.1029/2021GL092672, 2021.
Zheng, S., Pozzer, A., Cao, C. X., and Lelieveld, J.: Long-term (2001–2012) concentrations of fine particulate matter (PM2.5) and the impact on human health in Beijing, China, Atmos. Chem. Phys., 15, 5715–5725, https://doi.org/10.5194/acp-15-5715-2015, 2015.
Zhu, J., Liao, H., and Li, J.: Increases in aerosol concentrations over eastern China due to the decadal-scale weakening of the East Asian summer monsoon, Geophys. Res. Lett., 39, L09809, https://doi.org/10.1029/2012GL051428, 2012.
- Abstract
- Introduction
- Data and methodology
- Influence of regional meteorological variables on daily PM2.5 variability
- Modulation of daily PM2.5 by the large-scale circulation
- Performance of circulation-based indices for differing air pollution levels
- Joint effect of large-scale circulation and regional meteorology
- Discussion and conclusions
- Data availability
- Author contributions
- Competing interests
- Disclaimer
- Acknowledgements
- Financial support
- Review statement
- References
- Supplement