the Creative Commons Attribution 4.0 License.
the Creative Commons Attribution 4.0 License.
 | 18 May 2022
Inverse modeling of the 2021 spring super dust storms in East Asia
Jianbing Jin
Mijie Pang
Arjo Segers
Li Fang
Baojie Li
Haochuan Feng
Hai Xiang Lin
Hong Liao
Last spring, super dust storms reappeared in East Asia after being absent for one and a half decades. The event caused enormous losses in both Mongolia and China. Accurate simulation of such super sandstorms is valuable for the quantification of health damage, aviation risks, and profound impacts on the Earth system, but also to reveal the climatic driving force and the process of desertification. However, accurate simulation of dust life cycles is challenging, mainly due to imperfect knowledge of emissions. In this study, the emissions that lead to the 2021 spring dust storms are estimated through assimilation of MODIS AOD and ground-based PM10 concentration data simultaneously. With this, the dust concentrations during these super storms could be reproduced and validated with concentration observations. The multi-observation assimilation is also compared against emission inversion that assimilates AOD or PM10 concentration measurements alone, and the added values are analyzed. The emission inversion results reveal that wind-blown dust emissions originated from both China and Mongolia during spring 2021. Specifically, 19.9×10⁶ and 37.5×10⁶ t of particles were released in the Chinese and Mongolian Gobi, respectively, during these severe dust events. By source apportionment it was revealed that the Mongolian Gobi poses more severe threats to the densely populated regions of the Fenwei Plain (FWP) and the North China Plain (NCP) located in northern China than does the Chinese Gobi. It was estimated that 63 % of the dust deposited in FWP was due to transnational transport from Mongolia. For NCP, the long-distance transport dust from Mongolia contributes about 69 % to the dust deposition.
- Article
(10087 KB) - Full-text XML
-
Supplement
(7045 KB) - BibTeX
- EndNote


Dust storms occur as a result of wind erosion liberating dust particles from dry and barren surfaces (Shao et al., 1993). They are relatively common meteorological hazards in arid or semi-arid regions (World Meteorological Organization, 2019). Fine dust particles released from the ground can be lifted several kilometers high, and subsequently carried over long distances, sometimes even across continents (Zhang et al., 2018). The substantial amounts of dust particles as well as irritating spores, bacteria, and viruses carried by the dust storms pose great threats to human health and agriculture (World Meteorological Organization, 2017). Next to these adverse health effects and property losses, the visibility reduction would cause severe disruption or disorders to transportation and aviation systems (World Meteorological Organization, 2020). The dust cycle itself also plays a key role in the Earth system by influencing radiative balance (Wu et al., 2016) but also forest and ocean ecosystems (Shao et al., 2011).
Driven by strong cyclones, dust storms forming in the Gobi desert could affect East Asia following long-distance transport patterns, as can be seen in, for example, Fig. 1a. These events usually occur in springtime, when particles are more erodible under the circumstance of a dry season and sparse vegetation. The frequency and intensity of spring dust storms reached a peak from the 1950s to 1970s, and declined steadily thereafter (Yin et al., 2021). In the past decade, the dust storms were persistently rare, and only two strong events occurred in 2015 (Jin et al., 2018) and 2017 (Jin et al., 2019b). The declining trend in dust storm occurrence was co-driven by strict greenness controls in northern China over the past decades (Shao et al., 2013), climate anomalies (Yin et al., 2021), synoptic disturbances, and other factors not yet explored. However, the ongoing land degradation and desertification in Mongolia (Han et al., 2021) is reported to aggravate the regional dust storms. In spring 2021, however, East Asia experienced an outbreak of severe dust storms after an absence of one and a half decades. Specifically, three super events occurred during 14 to 16 March, 26 to 28 March, and 14 to 15 April, which will be described in Sect. 2.1 later. The re-occurring spring super dust storms resulted in enormous losses directly. Taking the dust event in 14–16 March for example, 10 people were reported dead and hundreds of people reported missing in Mongolia (Chen and Walsh, 2021); the PM10 pollutant level in Beijing was brought over 8000 µg m−3 and 12 provinces in northern China were affected, with thousands of flights grounded and public transportation systems halted (Jin, 2021). Fully understanding the reappearing dust storms is of great interest to health professionals, aviation authorities, and policy- makers, not only to help evaluate property losses, adverse health effects, and Earth system impacts, but also to reveal the synoptic climatic driving forces and finally to build the next generation of the dust early-warning system.
Numerical simulation models are commonly used to study dust lifecycles. Such models usually consist of an atmospheric transport model that is able to simulate aerosol concentrations, coupled to a dust-emission module. The underlying model is often a chemical transport model (CTM) which is already used to calculate concentrations of air pollutants, with dust just one of the aerosol species included. Substantial effort has been invested to develop dust models, especially for dust-emission parameterization which is the most uncertain element in simulating the dust concentrations. Since the early 1990s, several dust-emission schemes have been introduced, e.g., MB95 (Marticorena and Bergametti, 1995), Shao96/Shao04 (Shao et al., 1996; Shao, 2004), Ginoux01 (Ginoux et al., 2001), and Zender03 (Zender, 2003). Such emission parameterizations have been included in many global or regional atmospheric transport models, e.g., ECMWF's Integrated Forecast System (IFS) (Morcrette et al., 2008b, a, 2009), BSC-DREAM8b (Pérez et al., 2006; Mona et al., 2014), CUACE/Dust (Zhou et al., 2008; Gong and Zhang, 2008), GEOS-Chem (Fairlie et al., 2007), and LOTOS-EUROS (Timmermans et al., 2017; Manders et al., 2017), as will be used in this study. Due to insufficient knowledge of the actual dust emission and transport, and due to limitations to computing resources to resolve finest-scale variabilities, huge difference might occur when simulations are compared to observations (Niu et al., 2008; Huneeus et al., 2011).
Recent advances in sensor technologies and the continuously decreasing cost of electronic devices have made large-scale measurements of dust feasible. For dust storms over East Asia, important observation includes ground-based aerosol optical properties from the AErosol RObotic NETwork (AERONET) (Dubovik et al., 2000) and Sun-sky radiometer Observation NETwork (SONET) (Li et al., 2018), PM10 concentration from the China Ministry of Environmental Protection (MEP) air-quality monitoring network (Jin et al., 2018), satellite remote-sensing data from polar orbiting instruments (e.g., Moderate-Resolution Imaging Spectroradiometer (MODIS), Remer et al., 2005, and Cloud-Aerosol Lidar and Infrared Pathfinder Satellite Observations (CALIPSO), Winker et al., 2007), and from geostationary platforms (e.g., Himawari-8, Bessho et al., 2016, and FY-4 AOPs, Min et al., 2017). These various types of observations have been used alongside the simulation models to analyze the dust storms (Ginoux et al., 2012; Gkikas et al., 2021). Despite their significant roles in characterizing the atmospheric dust load, using only the measurements is not sufficient to obtain a complete four-dimensional insight into the dust plumes, because either the measurements do not cover all areas (surface network), only observe once or twice a day (polar orbiting satellites), or observe only vertically integrated quantities (AOD).
Instead of studying dust storms with either simulation models or observations only, it is useful to combine the measurements and the simulations through data assimilation (Kalnay, 2002). For the purpose of dust storm simulations, the measurements could be used to decrease the uncertainty in the emissions such that the optimized simulation is in better agreement with those measurements (Gong and Zhang, 2008; Lin et al., 2008). For instance, aerosol products from the MODIS instrument onboard the polar orbiting satellites Terra and Aqua have been widely applied in global or East Asian dust storm assimilation (Di Tomaso et al., 2017; Yumimoto and Takemura, 2015). The geostationary Himawari-8 data have recently also gained popularity and been used in dust storm detection and assimilation (Yumimoto et al., 2016). In our previous studies described in Jin et al. (2018, 2019a), the ground-based PM10 concentration data were assimilated to estimate the dust source emission for a sandstorm in 2015 over East Asia. Himawari-8 AODs were also assimilated to nudge the dust emission, and the necessity of removing those AODs in cloudy environment is emphasized in Jin et al. (2019b). An adjoint model was applied to construct a background covariance that was better able to describe the potential source regions for dust emission (Jin et al., 2020). Meanwhile, an imaging morphing-based assimilation method was designed which effectively corrected the position error caused in the long-distance dust plume transport (Jin et al., 2021).
While various kinds of dust or aerosol measurements were used in these assimilation experiments, most of them assimilated only one type of observation at a time. For the sandstorms in East Asia, however, none of the aforementioned measurements can provide sufficient information to track these short-term and fast-changing dust plumes completely. For a case in point, the China MEP air-quality monitoring network has over 1700 sites for PM10 concentrations by now, but these are mainly located in the downwind and densely populated regions, which are far away from the source region of dust in East Asia (the Gobi deserts that can be seen in Fig. 1a). The network therefore only measures the dust plume when it has already been transported to the downwind urban regions; hence, it is of limited help to characterize the plume near the source regions in rural areas. Besides, the ground-based PM10 data only represent the surface dust concentrations and lack information on the vertical structure. AERONET and SONET instruments provide some information on the vertical structure via column-integrated observations, but the network is much sparser than the PM10 network, and most of the sites are also far away from the source regions. The MODIS satellite products provide global coverage, but again only information on the total column and therefore no estimate of the plume height or thickness. These polar orbiting instruments also have a limited temporal coverage; for example, the MODIS Aqua and Terra platforms pass by only around 10:30 and 13:30 (local time). Designed with the wide-observing coverage and high temporal resolution, geostationary measuring instruments provide valuable information. However, large uncertainties were found in the Himawari-8 product due to uncertainty in assumptions on aerosol models and surface reflectance estimation in the retrieval algorithm (Zhang et al., 2019). This was also found in Jin et al. (2019b): a strict observation selection was necessary when assimilating the Himawari-8 AOD values.
Another challenge for dust assimilation is the proper definition of the observations. In general, the commonly used data assimilation schemes all rely on the basic assumption of an unbiased observation. However, all the aforementioned observations, e.g., AOD and PM10 concentration, not only measure dust aerosols, but rather actually the sum of the dust and other fine particles. These originate from, for example, anthropogenic activities, e.g., industry, vehicles, and households, and from natural sources such as wildfires and sea spray. These particles are referred to the non-dust fraction in the total aerosols in our study. In the presence of non-dust bias, it is impossible to attribute the difference between the a priori simulation and an observation to either this bias or to model deficiencies. The non-dust bias might lead to assimilations that diverge from reality (Lorente-Plazas and Hacker, 2017). However, aerosol measurements are usually directly assimilated, and little progress has been made in bias correction of fully aerosol measurements for their use in dust storm assimilation. Lin et al. (2008) selected only PM10 observations for assimilation when at least one occurrence of dust clouds was reported by the local stations. Both machine learning tools and chemical transport models were used for modeling the dynamic non-dust aerosol levels in the PM10 concentration measurements; the bias-corrected observations subsequently resulted in more promising assimilation analysis in Jin et al. (2019a). Some efforts have been made to exclude those “polluted” AODs induced by cloud scenes in the dust assimilation (Jin et al., 2019b); nevertheless, the issue of a non-dust AOD bias remains to large extent unresolved.
To analyze the outbreak of super dust storms in spring 2021, an emission inversion will be performed through assimilation of multiple observation types. Both the MODIS AOD and the ground-based PM10 concentration observations will be used, each providing a different view on the dust plumes. To use the AODs for representing the dust load, an data quality control is designed, which consists of an Ångström-based data screening and a non-dust AOD bias correction. The former is capable of selecting those coarse-mode dust AOD values and excludes the pixels dominated by fine-mode aerosol from non-dust sources, while the latter focuses on removing the non-dust baseline in the selected AOD. Similar for PM10, a non-dust bias correction as used in Jin et al. (2019a, 2021) is adopted in this work. Based on the posterior emission field obtained in the inversion, the spatial pattern of the emission analyzed for the three events is studied, and the active source regions are identified. In addition, source apportionment simulations are performed, in which the contribution of dust emissions from either Mongolia or China to the dust deposition is calculated for two mega-city clusters, the North China Plain (NCP) and the Fenwei Plain (FWP).
The paper is organized as follows. Section 2 introduces the three super dust events that occurred last spring, as well as the available dust observations from MODIS and ground-based PM10 networks measuring the dust loading from different perspectives. Before AOD is assimilated, quality control combining an Ångström-based screen and a non-dust bias correction are designed to ensure that the observations are representative for the dust load. A brief description of our dust simulation model (LOTOS-EUROS/dust) is presented as well. Section 3 reviews the reduced-tangent-linearization four-dimensional variational (4DVar) data assimilation-based emission inversion system. In Sect. 4, the posterior emission field and the estimated AOD and surface dust concentration simulation are evaluated and discussed. Posterior emission obtained through the multi-observation assimilation is compared against the result from emission inversion that only assimilates PM10 or AOD data, and the added values are illustrated. A source apportionment study is performed to obtain information about dust pollution sources and the extent to which they contribute to ambient air pollution in northern China. Focusing on NCP and FWP, their dominant dust sources are identified herein.
2.1 Dust events of spring 2021
The Fenwei Plain (FWP) and the North China Plain (NCP) experienced the most dust affection in China since they face the dust source regions as shown in Fig. 1a. Figure 1b shows the recorded PM10 concentration average during spring (March–May) in NCP and FWP over 2019–2021. In spite of ongoing air pollutant reduction measures, the PM10 levels in NCP and FWP both reached their highest average values of 123 and 119 µg m−3 in 2021. These mean values are 34 % and 27 % higher than the means of the previous 2 years. The reason for this is that East Asia suffered an outbreak of dust storms in the 2021 spring season, including three large-scale and severe ones. These dust events swept across northern China, as can be seen from the time series of the hourly PM10 concentrations reported by the monitoring stations in NCP and FWP in Fig. 1c–d. The timeline in Table 1 shows that these three dust events occurred around 15 March, 28 March, and 15 April, and each of them lasted 3 to 4 d. The highest PM10 concentrations reported by the ground-based air quality monitoring network reached values of 9993, 9985, and 4113 µg m−3; in this study, the three events are referred to as SD1, SD2, and SD3, respectively.
The three dust storms will be studied by combining model simulations and AOD and PM10 concentration observations using assimilation, in order to identify the emission sources that affect densely populated regions in northern China.
Table 1Descriptions of the three severe dust storm events that occurred in China in spring 2021. Time zone is China Standard Time (CST).
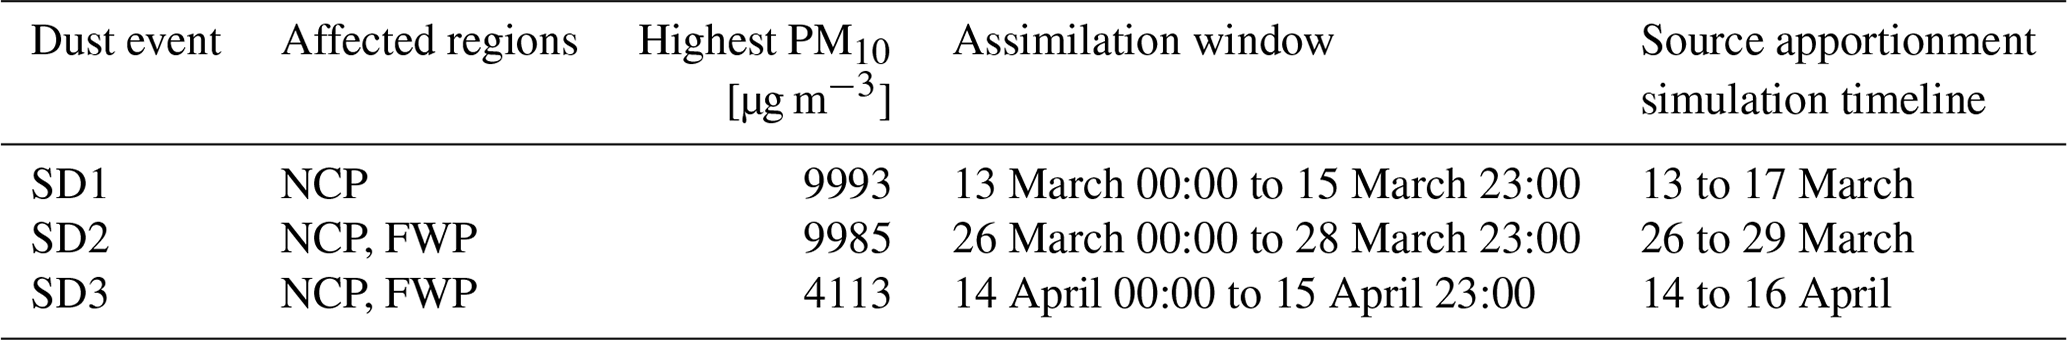
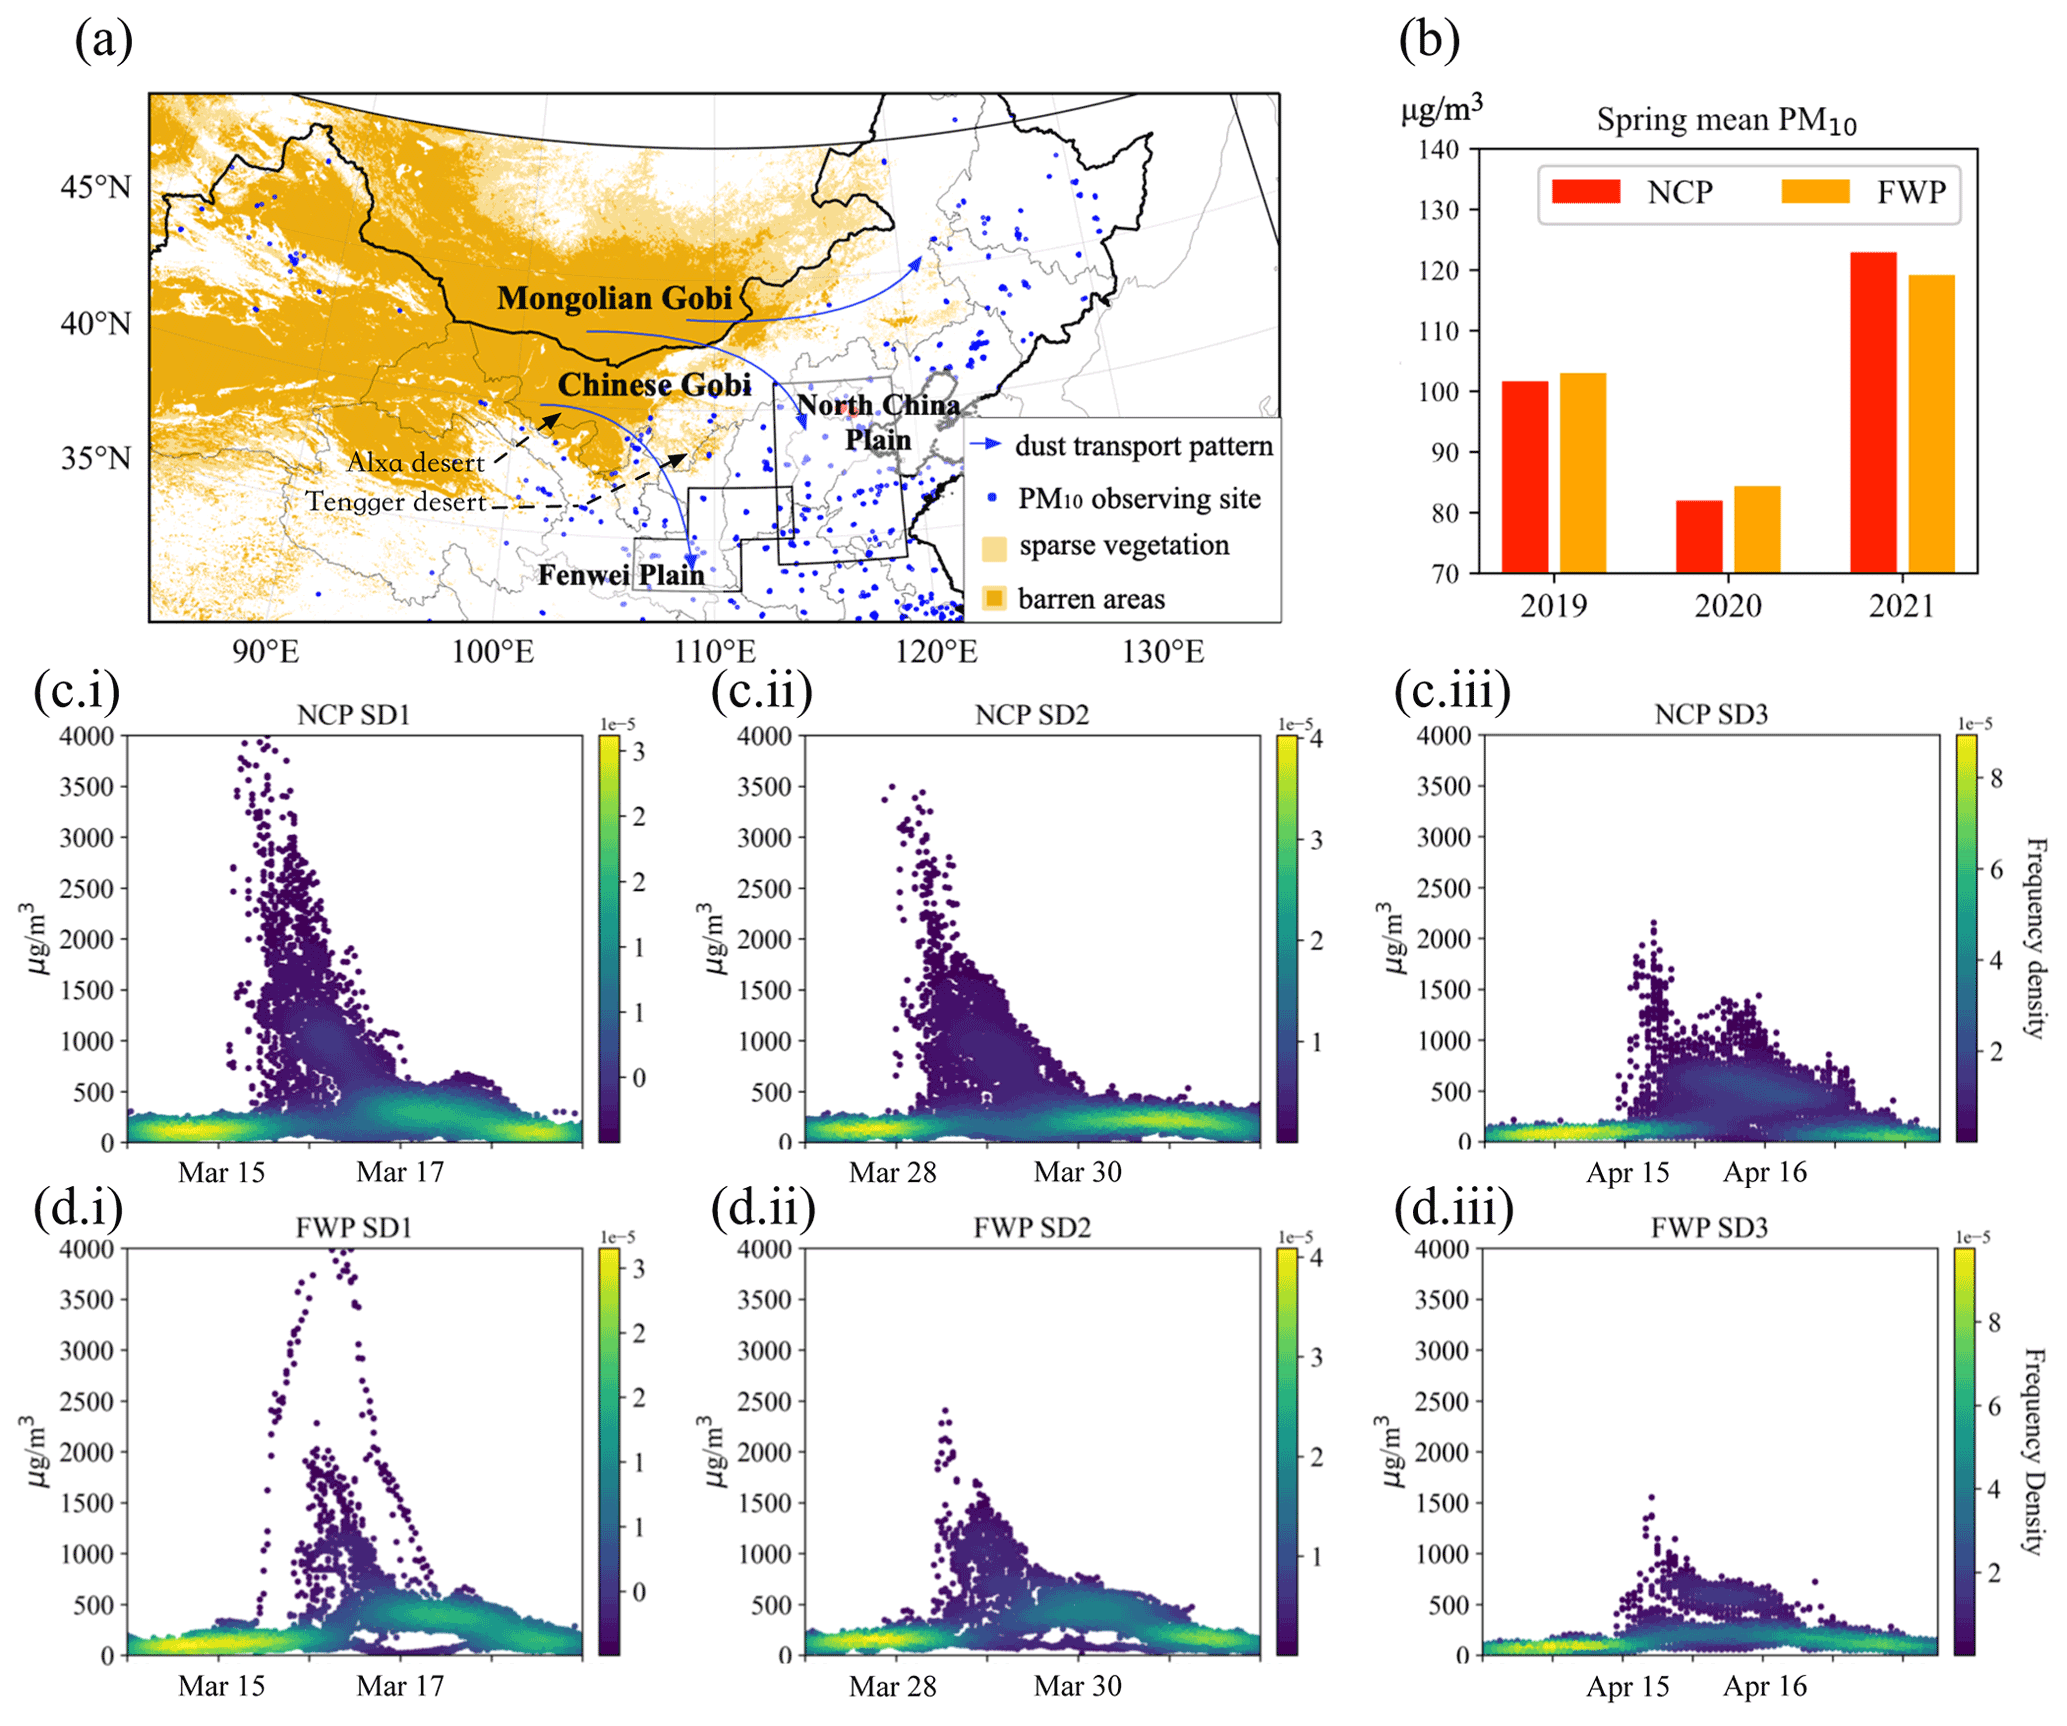
Figure 1(a) Distribution of the potential dust emission source (barren and sparse vegetation land cover) over East Asia and the China MEP observing network over northern China. (b) The spring (March–May) mean PM10 concentration observations over NCP and FWP from 2019 to 2021. Time series of the hourly PM10 concentration measurements reported by stations in NCP (c) and FWP regions (d) during SD1 (i), SD2 (ii), and SD3 (iii).
2.2 Ground-based PM10 observations
A huge number of ground-based stations measuring air-quality indicators have been established by the China Ministry of Environmental Protection (MEP) since 2013. At present, the monitoring network has grown up to 1800 monitoring sites covering China, of which a part is shown in Fig. 1a. The PM10 concentrations observed by the network hence provide valuable information on the dust storms. Snapshots of the PM10 measurements for SD1, SD2, and SD3 can be found in Figs. 2a.i, 3a.i, and 4a.i, respectively. In the observations it is clearly visible where the dust plume is located and how it moves through the regions.
It should be kept in mind that these PM10 measurements are actually a sum of dust and other airborne particles like black carbon, sulfate, etc. The PM10 data therefore cannot be used directly to represent the dust load. In a previous study (Jin et al., 2019a) it has been shown that removing the non-dust baseline from PM10 observations will lead to a more accurate assimilation result, especially if the dust aerosol is not dominant. In this study, the same observational bias correction is performed to make the PM10 measurements fully representative of the dust loads.
The PM10 bias correction takes two steps. First, non-dust aerosol levels are calculated using a model simulation with a configuration for air-quality simulation (as will be described in Sect. 2.4), but with the dust tracers disabled. Second, using these simulations, bias-corrected dust observations were calculated by subtracting the non-dust loads from the original PM10 concentration observations.
The non-dust aerosol surface concentrations from the simulations, and the dust-only bias-corrected observations of PM10 accompanying the original PM10 scenes shown in Figs. 2a.i, 3a.i, and 4a.i are available in Figs. S1, S3, and S5 in the Supplement. As an example, as shown in Fig. S1a–b, during the SD1 event, the non-dust aerosols were also carried southward and ahead of the dust plume due to the strong winds, and the bias-corrected PM10 data show the shape of the dust plume. The shape of the simulated a priori dust plume at 15 March 10:00 shown in Fig. 2a.ii matches with the observed shape, although the dust concentrations are sometimes very different; this will be discussed in more detail in Sect. 2.4. Similar features are seen in Figs. S3 and S5 for the other events as well.
2.3 MODIS AOD observations
2.3.1 MODIS Deep Blue AOD product
The Moderate-Resolution Imaging Spectroradiometer (MODIS) satellite instruments (Justice et al., 1998) on board of the polar orbiting satellites Terra and Aqua measure atmosphere reflectance at several wavelengths in the visible to near-infrared range. The aerosol properties that are retrieved from the MODIS observations have provided high-quality data since 2000 (Terra) and 2002 (Aqua). Designed with a wide swath (≈ 2330 km), MODIS provides near-global observations on an almost daily basis. In this study, the Deep Blue dataset in the newest MODIS Collection 6.1 Operational Level-2 Aerosol Product is used. The Deep Blue dataset is generated by the Enhanced Deep Blue algorithm (Hsu et al., 2013; Sayer et al., 2014), reporting retrievals over all cloud-free and snow-free land surfaces at a resolution of 10 km. The MODIS Deep Blue dataset is widely used in dust source identification (Ginoux et al., 2012), dust model calibration (Zhang et al., 2018) and emission inversion (Yumimoto and Takemura, 2015; Di Tomaso et al., 2017), and dust field reanalysis (Di Tomaso et al., 2021) through data assimilation.
Snapshots of the MODIS Deep Blue AOD for SD1, SD2, and SD3 can be found in Figs. 2b.i–c.i, 3b.i, and 4b.i. For each of the three events, MODIS AOD provides valuable information for a large part of the domain of interest. For instance, the SD2 plume position and intensity at 28 March 11:00 are clearly identified in Fig. 3b.i, while the SD3 plume at 15 April 11:00 is observed clearly in Fig. 4b.i. The two AOD scans in Fig. 2b.i–c.i together also provide the general spatial pattern of the dust plume.
Compared to the ground-based PM10 measurements, satellite instruments are designed with a larger observing coverage. However, they also have higher uncertainties in representing the aerosol/dust load (Jin et al., 2019b). In most of the dust model evaluation/calibration using the satellite data, AOD measurements are directly used for comparing to simulated dust AODs and analyzing the dust strengths. For those regions affected by the severe dust storm, it would be reliable to approximate the dust AODs using the AOD measurements, since the amounts of non-dust aerosols are negligible compared to the dust loading; for those areas where dust is not the dominant aerosol, it is then necessary to perform the dust/non-dust AOD discrimination.
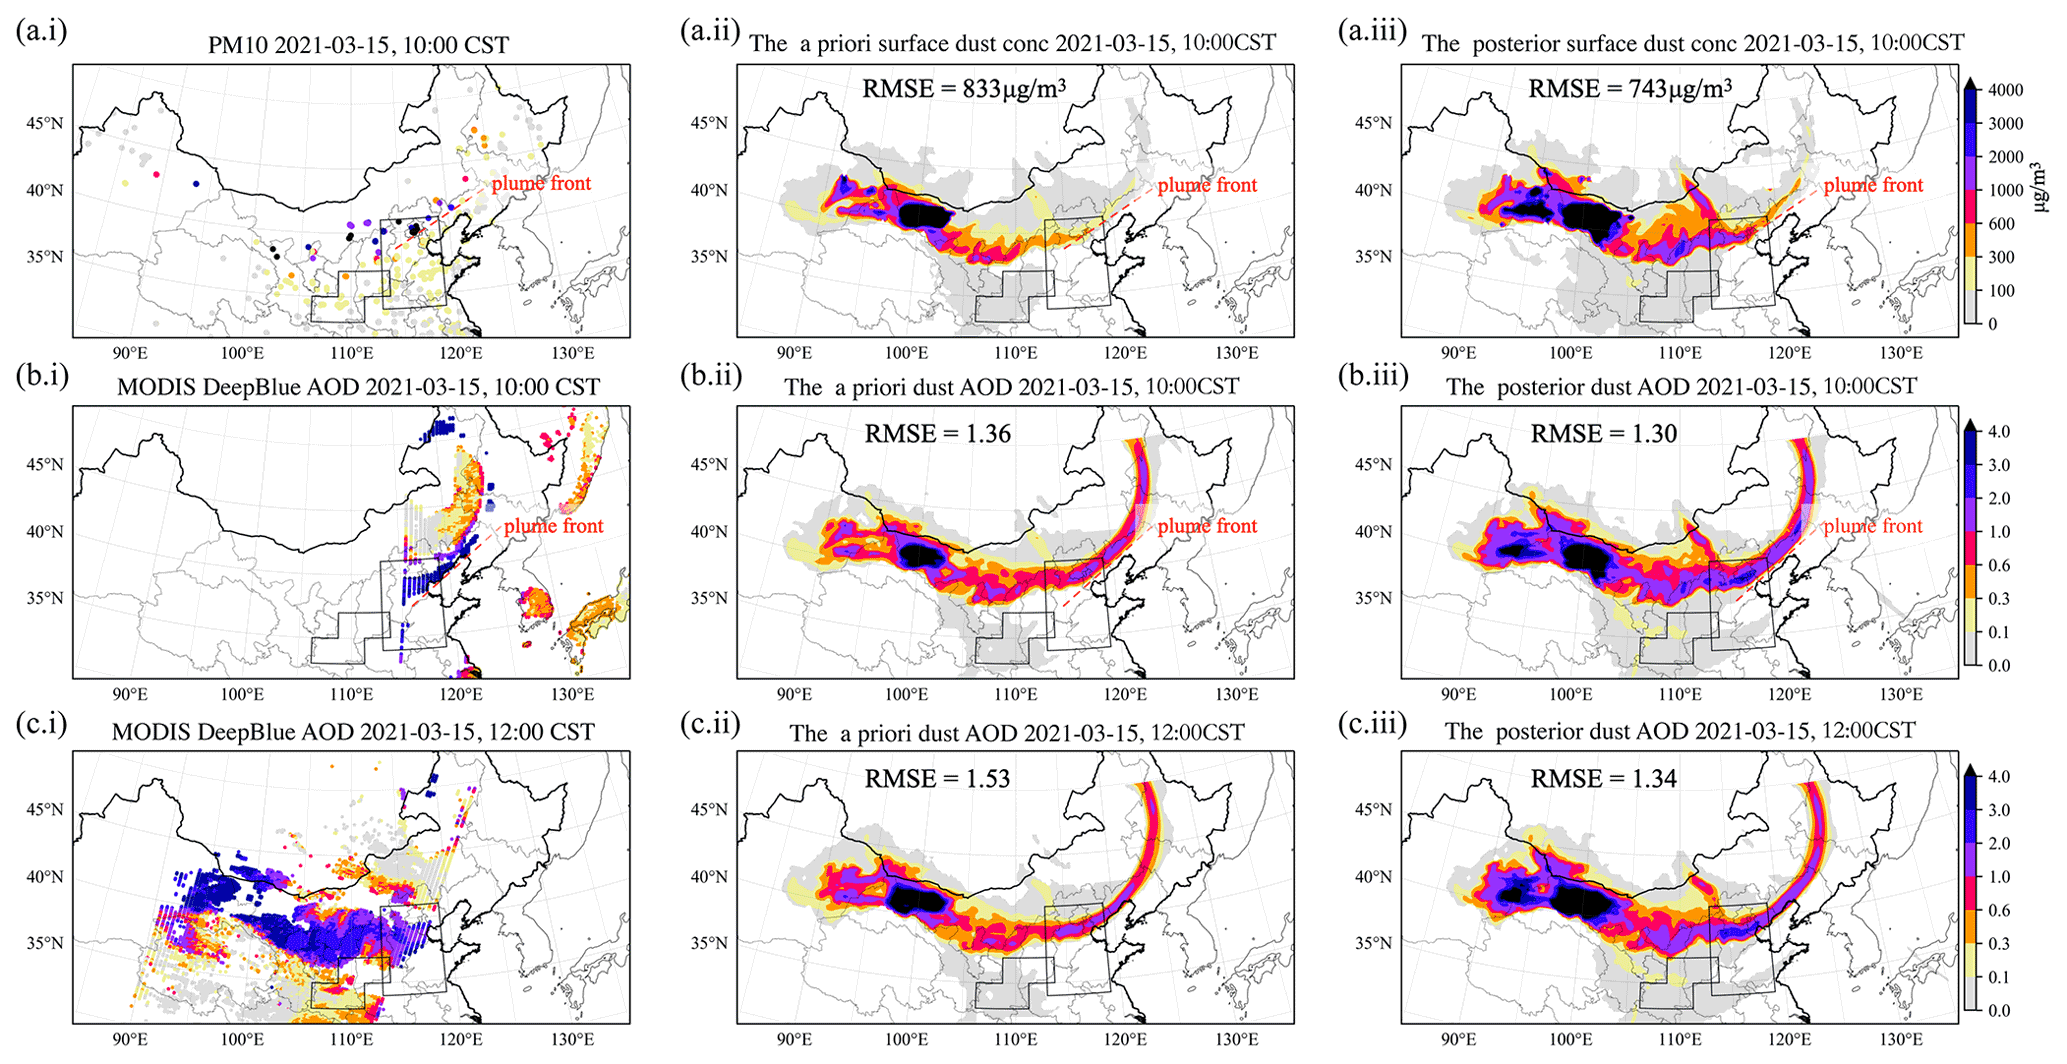
Figure 2Snapshots of observations and simulations during severe dust event 1 (SD1) at 15 March 2021. Row (a) shows PM10 concentrations observed by ground network at 10:00 CST (i), and a priori (ii) and posterior (iii) simulations by the LOTOS-EUROS/dust model. Similarly, row (b) shows for the same hour AOD at 550 nm from MODIS Deep Blue observations (i) and simulations (ii–iii) at 10:00; row (c) shows the same for the MODIS overpass at 12:00.
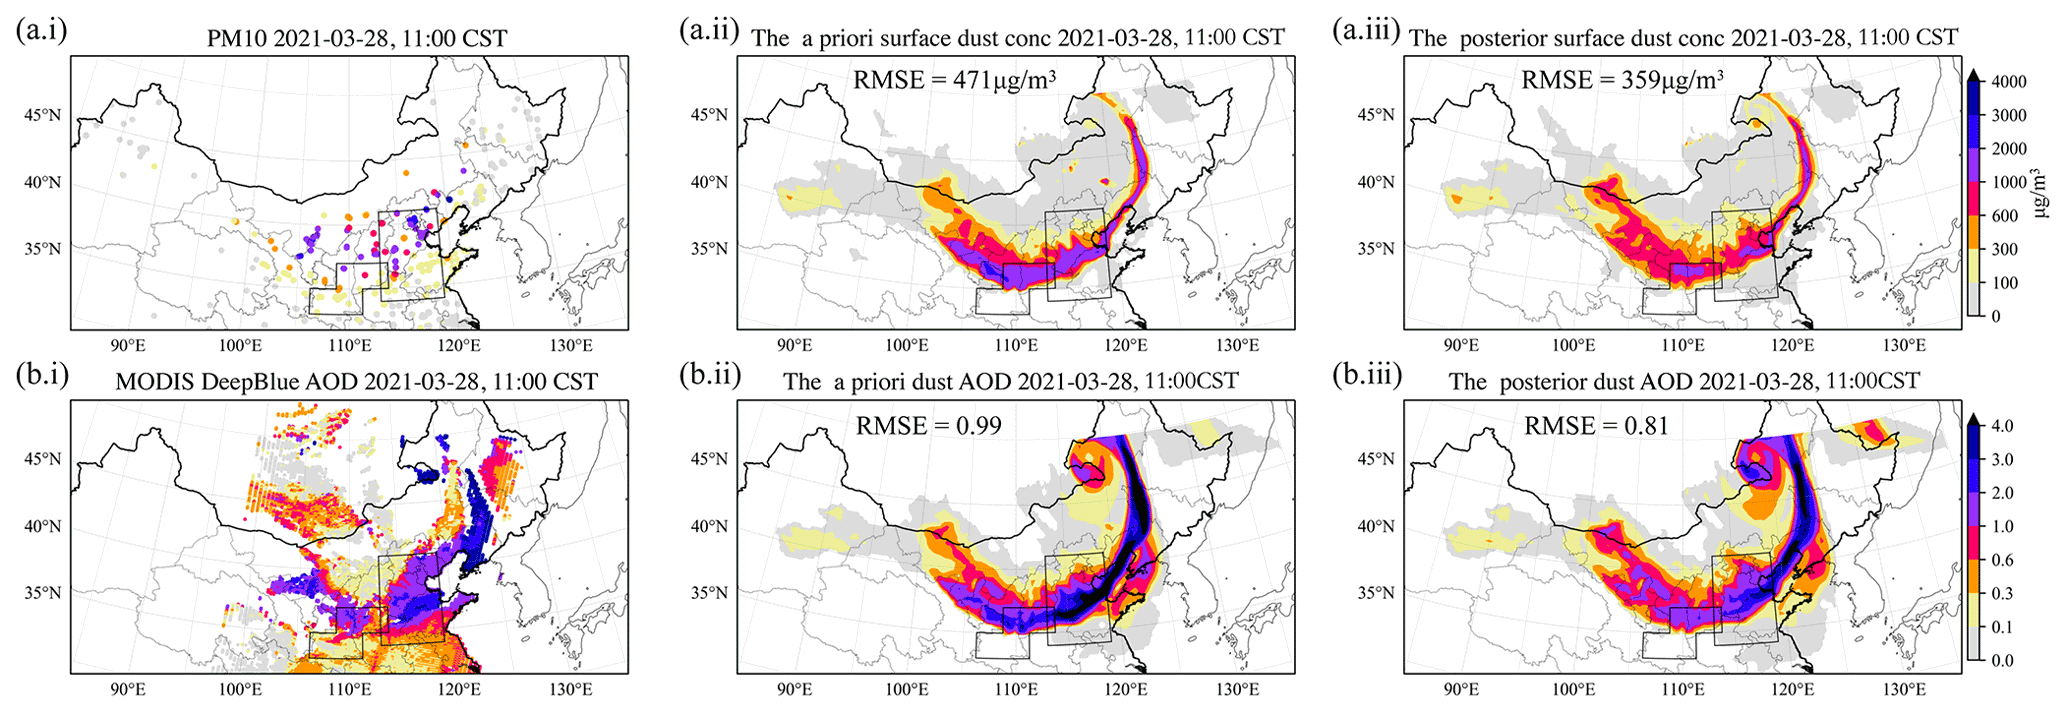
Figure 3Snapshots of observations and simulations during severe dust event 2 (SD2) at 28 March 2021. Row (a) shows PM10 concentrations observed by ground network at 11:00 CST (i), a priori (ii), and posterior (iii) simulations by the LOTOS-EUROS/dust model. Row (b) shows for the same hour AOD at 550 nm from MODIS Deep Blue observations (i) and simulations (ii–iii).
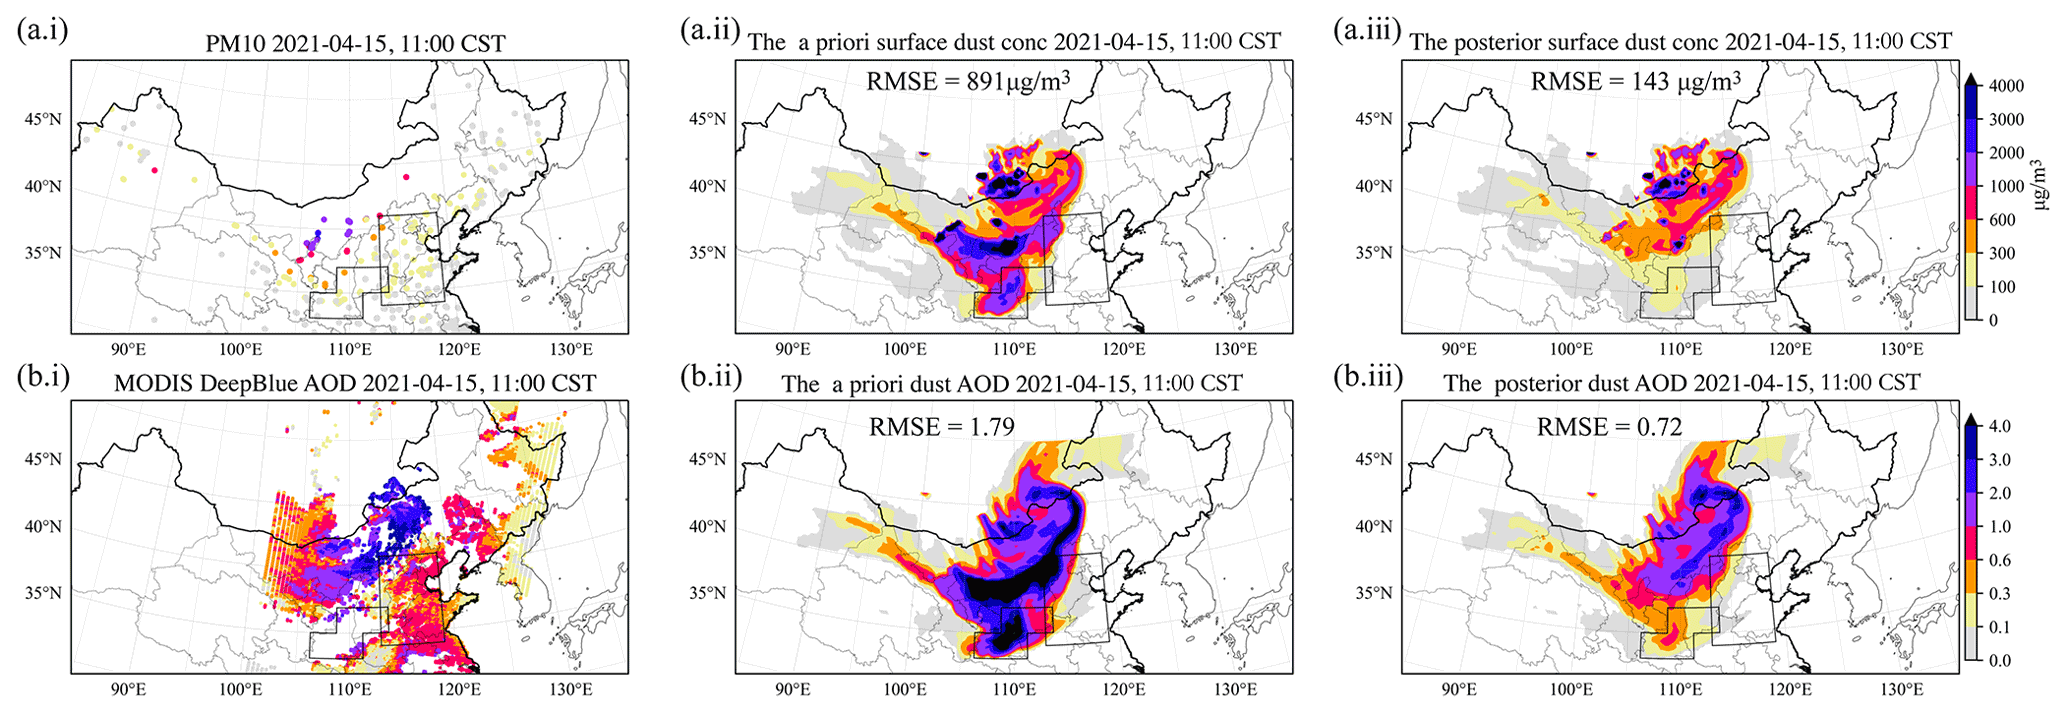
Figure 4Snapshots of observations and simulations during severe dust event 3 (SD3) at 15 April 2021. Row (a) shows PM10 concentrations observed by ground network at 11:00 CST (i), a priori (ii), and posterior (iii) simulations by the LOTOS-EUROS/dust model. Row (b) shows for the same hour AOD at 550 nm from MODIS Deep Blue observations (i) and simulations (ii–iii).
2.3.2 AOD quality control
While aerosols originating from biomass-burning, urban pollution, and biogenic sources consist mainly of fine-mode particles (with a radius less than 1 µm), the aerosols in a dust plume are mainly in the coarse modes (particle radius larger than 1 µm) (Dubovik et al., 2002; Jin et al., 2019a). The dominance of one mode over the other can be measured with the Ångström wavelength exponent α (Schuster et al., 2006; Saide et al., 2013; Liu et al., 2019), which describes how the optical thickness depends on the wavelength of the incident light. The Ångström exponent is in the range of −0.5 to 2.5, and inversely related to the average size of the measured aerosol: the smaller the particles, the larger the exponent. Eck et al. (1999) used α=0.5 as the threshold for an aerosol mixture dominated by dust, while Schepanski et al. (2007) used α=0.6 to detect the presence of dust particles. Ginoux et al. (2012) used α=0 to select areas dominated by dust in a single-mode distribution of coarse particles.
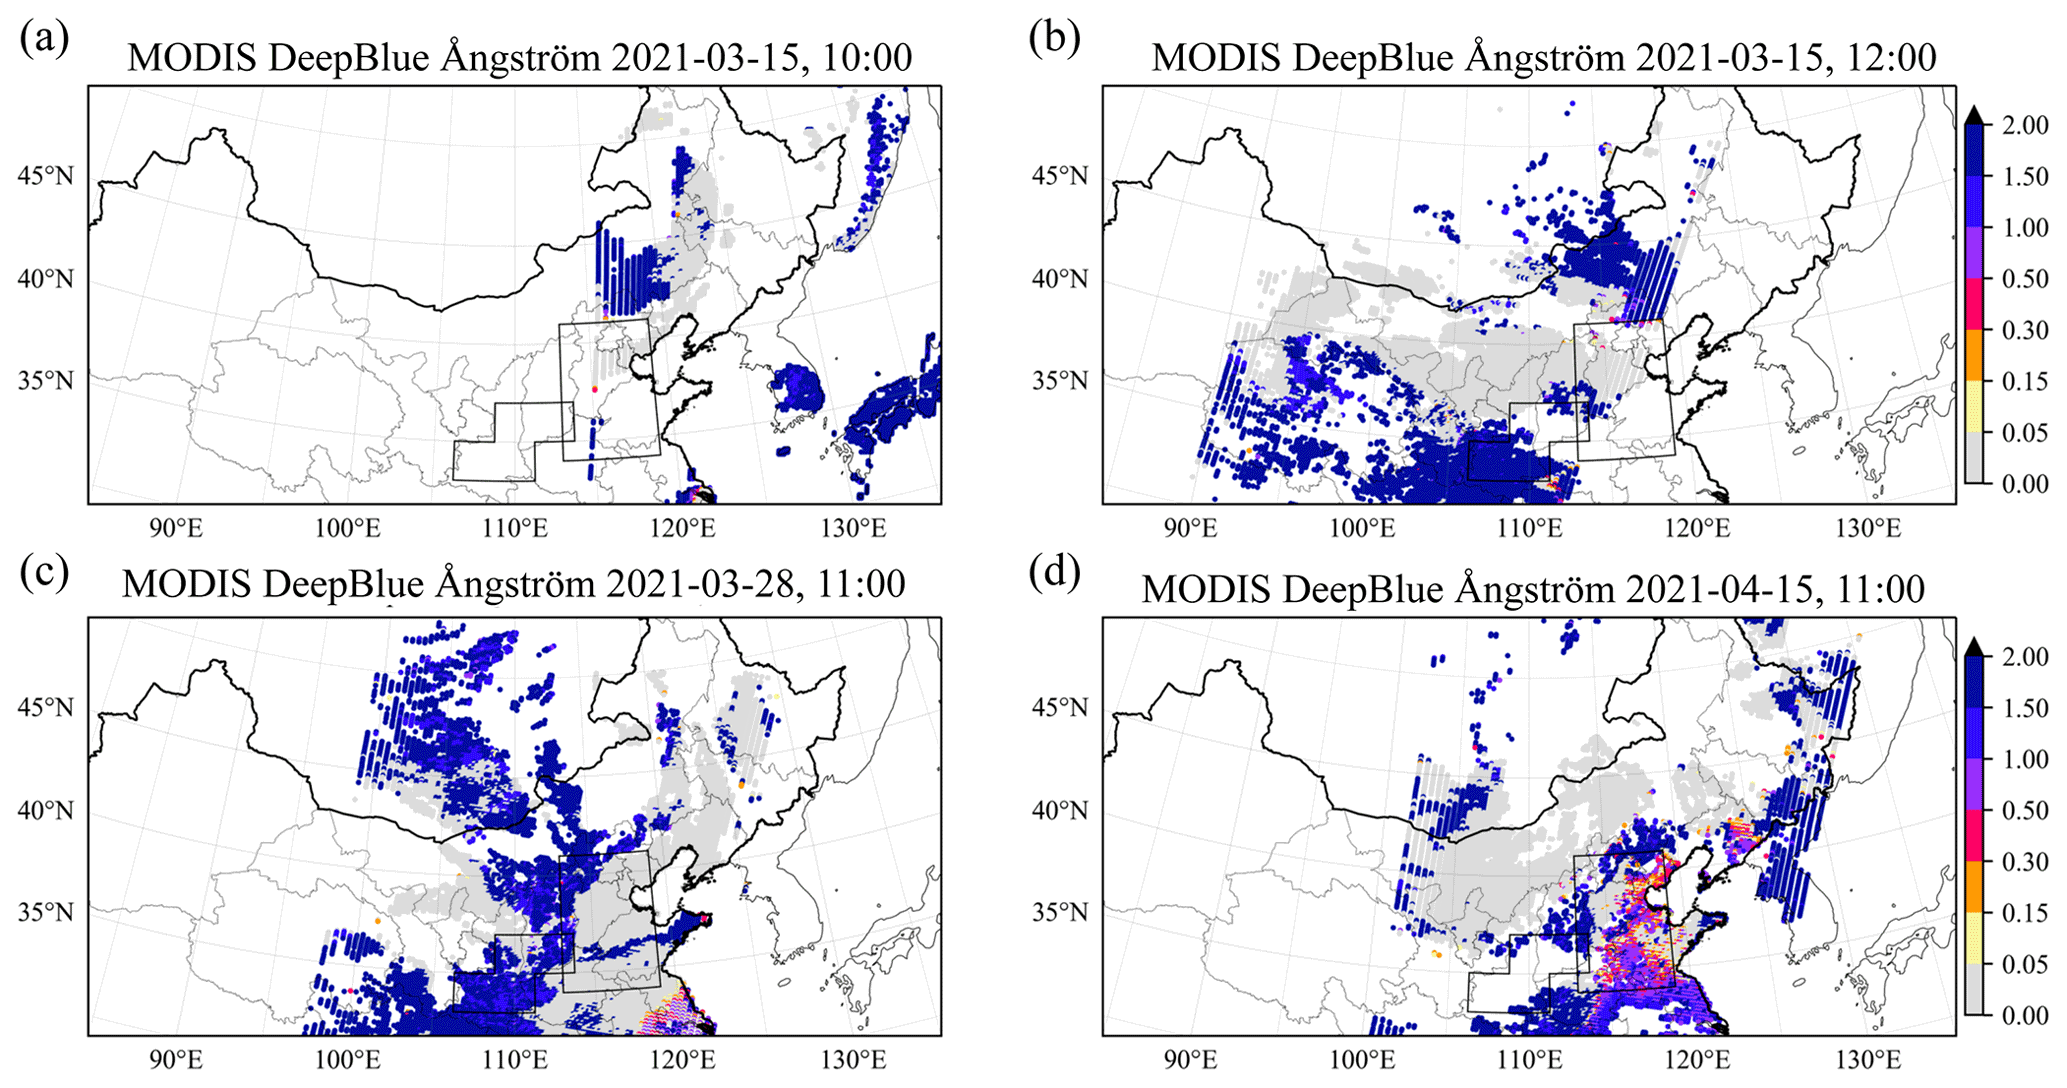
Figure 5 shows the four snapshots of retrieved Ångström exponents corresponding to the AOD values of Figs. 2b.i–c.i, 3b.i, and 4b.i. In general, the locations of low Ångström exponent values correspond to the high AOD values of the dust plumes. For example, for the snapshot in Fig. 5d, it indicates that a plume of coarse aerosols stays in the Inner Mongolia provinces of China, while fine aerosols are more dominant in the southern regions. This matches with the dust simulation that is shown in Fig. 4b.ii. This gives confidence in using the Ångström exponent values for the discrimination between dust and non-dust AOD.
To be able to use the AOD observations in an assimilation focusing on dust only, an Ångström-based data screening and a non-dust AOD bias correction has been developed and applied. The screening and bias-correction procedures are performed after each other. First the Ångström-based screening selects the pixels with α<0.5, assuming that these are the ones that are dominated by (coarse-mode) dust. For these pixels, a bias-corrected AOD is calculated by subtracting a non-dust AOD fraction from the selected AODs. Similar to the non-dust PM10 simulation, these non-dust AOD baselines are also calculated using a full-chemistry LOTOS-EUROS simulation with the dust tracers disabled. Finally, to make the AOD data resolution consistent with the model, the MODIS Deep Blue AODs are coarsened by taking the average over the 0.25 × 0.25 model grid cell. Snapshots of the non-dust AOD simulation and the bias-corrected AOD measurements for assimilation can be found in Figs. S2, S4, and S6.
2.4 Dust simulation model
The regional chemical transport model LOTOS-EUROS v2.1 (Manders et al., 2017) is used to simulate dust concentrations. LOTOS-EUROS has been used for a wide range of applications supporting scientific research and operational air-quality forecasts over Europe, China, and other regions. Daily operational forecasts over China used to be released via the MarcoPolo–Panda projects (Timmermans et al., 2017; Brasseur et al., 2019). Additionally, it is also implemented in the World Meteorological Organization (WMO) Sand and Dust Storm Warning Advisory and Assessment System to provide short-term forecasting of the dust load over the areas of North Africa, Middle East, and Europe; the online forecast product is delivered via http://sds-was.aemet.es/forecast-products/dust-forecasts (last access: July 2021).
To simulate dust concentrations over East Asia, the model is configured on a domain from 15 to 50∘ N and 70 to 140∘ E, with a resolution of 0.25∘ × 0.25∘. Vertically, the model consists of eight layers, with a top at 10 km. Our regional model has zero boundary conditions by assuming all dust aerosols are emitted regionally and the external dust flows can be ignored. Although BSC-DREAM8b simulation, which is released via https://ess.bsc.es/bsc-dust-daily-forecast (last access: January 2022), indicates that part of the dust plume released in the Middle East is likely to have been transported to western China during SD1, those particles did not go as far as FWP or NCP. Boundary conditions from a global dust model are in demand if we focus on western China in our future work. The dust simulation is driven by the European Centre for Medium-Ranged Weather Forecasts' (ECMWF) operational forecasts over 3–12 h, retrieved at a regular longitude–latitude grid with a resolution of about 7 km. An interface to the ECMWF output set is designed, which not only interpolates the default 3 h ECMWF short-term forecast meteorology to hourly values but also averages the forecast to fit the LOTOS-EUROS spatial resolutions (Manders et al., 2017). Physical processes included are wind-blown dust emission, diffusion, advection, dry and wet deposition, and sedimentation.
2.5 Dust emission and uncertainty
The goal of this work is to calculate the optimal emission field that best fits the a priori model simulation and the observation. It is then necessary to define and quantify the uncertainty in the dust simulations. In this study, we define the main model uncertainty to be in the parameterization of the dust emissions. Although other model processes such as transport and deposition are uncertain too, for the events studied here, these are assumed to be of less importance than the location and the intensity of dust emission.
The physical basis of the dust-emission model adopted in LOTOS-EUROS is the parameterization scheme by Zender (2003). The dust flux f is calculated as a function of horizontal saltation fh (Marticorena and Bergametti, 1995), the sandblasting efficiency a, a terrain preference 𝒮, and an erodible surface fraction 𝒞:
The dust saltation rate fh is proportional to the third power of the wind friction velocity u, as long as this exceeds a certain (surface-dependent) friction velocity threshold ut:
The friction velocity threshold controls whether dust is released from a surface at all, and how strong the emission is. In Jin et al. (2018), it was shown that the uncertainty in the friction velocity threshold parameterization is the main factor that prohibits accurate dust-emission forecasts. Although other controlling factors, e.g., the wind-field uncertainty, will also introduce uncertainty in the emission partially, these were found to be of less important in the emission error quantification (Jin et al., 2019b).
3.1 Assimilation method
The assimilation system that will be used to combine PM10 and AOD measurements with dust simulations is based on the reduced-tangent-linearization four-dimensional variational (4DVar) data assimilation developed in Jin et al. (2018). The goal of the 4DVar technique is to find the maximum likelihood estimation of a state vector, which is here the dust emission field f, given both the available AOD and PM10 measurements over a time window. The optimal emission f is calculated by minimizing the cost function:
In here, 𝒥b represents the background term as follows:
where fb represents the a priori or background dust emission vector which follows the calculation described in Sect. 2.4. As in Jin et al. (2018), the errors in dust emission field are assumed to be only caused by the uncertainty in the friction velocity threshold in Eq. (2), and it can be compensated by introducing a spatially varying multiplicative factor β:
where ut(i,t) denotes the model parameterized friction velocity threshold in a given grid cell i at instant t, while denotes the true value. The β values are defined to be random variables with a mean of 1.0 and a standard deviation σβ=0.1. This empirical standard deviation was found to provide sufficient variations to resolve the observation–simulation difference. A background covariance matrix Bβ is then formulated by combining the constant standard deviation and a correlation matrix C:
Here, C(i,j) denotes a distance-based spatial correlation between the βs in two grid cells i and j, which is defined as
where di,j represents the distance between two grid cells i and j. In Jin et al. (2018), the correlation length scale L was configured to be 800 km, which was found to be suitable to simulate the main characteristics of the dust event studied there. In this study, however, a smaller length scale L=300 km is used, which gives a higher spatial degree of freedom, while it can still be resolved by the assimilation due to the larger number of MODIS AOD and PM10 concentration measurements.
With the covariance matrix Bβ, an ensemble (N=200) of samples of β is generated randomly. These ensemble samples are then applied in our dust model, and each of them produces an emission forecast. The covariance of these emission fields are approximated as follows:
where represents the emission vector computed using the friction velocity threshold ensemble member i, while is the ensemble mean.
The observation term of the cost function, and quantify mismatch between dust simulation and PM10 and between dust simulation and AOD measurements, respectively.
where m and n are the number of time steps within the assimilation window; yPM and yAOD contain the pre-processed PM10 and MODIS AOD measurements; ℳ denotes the LOTOS-EUROS/dust transport model that is driven by the emission f, and ℋPM and ℋAOD are the observation operators that convert simulated dust concentrations into PM10 and AOD observation space. The PM10 and AOD observation mismatch terms are weighted by observation error covariance OPM and OAOD. The uncertainties in the observations are assumed to be independent, and hence both OPM and OAOD are diagonal matrices.
Both the instrument and representing errors are considered when the observation error covariance, OPM and OAOD, are designed. The uncertainty (square root of the individual diagonal element in OPM) of the pre-processed PM10 measurements for assimilation is assumed to be due to uncertainty in the PM10 data and the non-dust PM10 bias correction. We have used to characterize the uncertainty of PM10 data. It follows the choice of 10 % in our previous study (Jin et al., 2018), with uncertainty inflated for this application. This is mainly to prevent the posterior from getting too close to the low-value PM10 observations and hence being model divergent. In addition, the uncertainty of the non-dust PM10 simulation σBC that is introduced in Sect. 2.2 is set to 40 % following the aerosol simulation analysis over China using LOTOS-EUROS (Timmermans et al., 2017). The integrated uncertainty σintegrated for using the bias-corrected PM10 to represent the dust load is then calculated as
Snapshots of σPM and σintegrated distribution accompanying the PM10 measurements shown in Figs. 2a.i, 3a.i, and 4a.i in the three dust events are shown in Figs. S1c–d, S3c–d, and S5c–d, respectively.
The integrated uncertainty of AOD measurements for assimilation is also calculated as the sum of the instrument error and the error of the non-dust AOD bias correction. The former is taken directly from the MODIS Deep Blue product, while the uncertainty of non-dust AOD simulation is set to 40 % as well. Snapshots of the AOD instrument uncertainty and integrated uncertainty with respect to the AOD observations in the three dust events can be found in Figs. S2c–d, S4c–d, and S6c–d.
3.2 Assimilation window
Table 1 shows the timeline of the three severe dust events studied here. These dust events have a short duration, and therefore a single assimilation window of length 72, 72, and 48 h is used, respectively. Dust emissions occur at the start of the assimilation window when a plume is lifted high to be carried downwind. The PM10 network is only able to observe the plume when it has moved downwind, and is already far away from the source region. Therefore, assimilation windows covering both the time of dust emission and the moment of observation are necessary. When the dust plume is carried further southward or eastward, the error of the simulated dust concentration grows steadily due to the accumulation of dust transport and deposition uncertainty. Therefore, AOD or PM10 measurements out of the assimilation window help little in emission inversion and are therefore not used here.
4.1 Dust storm inverse modeling
Using the assimilation system introduced in Sect. 3, the emission inversions were performed by assimilating the bias-corrected PM10 and MODIS AODs processed in Sect. 2.2 and Sect. 2.3, which is referred to as multi-observation assimilation in this study. First, the posterior emission analysis is carried out in Sect. 4.1.1, then the dust simulation driven by the posterior emission result is illustrated in Sect. 4.1.2.
4.1.1 Dust emission analysis
To assess the spatial pattern of the dust emission, the accumulated emissions over the assimilation window are calculated for each of the dust events. Figure 6 shows the map of the a priori and posterior accumulated dust emissions in SD1, SD2, and SD3 over the potential source regions. The a priori model simulation indicates that dust emission took place over both the Alxa desert (part of the Chinese Gobi) and the central region of the Mongolian Gobi desert during SD1, and their maximum emission flux exceeded 200 g m−2. Through assimilating the MODIS AODs and ground-based PM10 concentration measurements, the emission field is estimated. It indicates that emission took place in more grid cells that are located in the Alxa desert and in eastern Mongolia. However, the dust plume released from the Alxa desert did not move far towards the south or the east, while Mongolian dust was the main source of dust affection in northern China as will be discussed in Sect. 4.3.

Figure 6Distribution of the a priori (i) and posterior (ii) accumulated dust emission for the SD1 (a), SD2 (b), and SD3 (c); the total priori and posterior emission either from China or from Mongolia during SD1, SD2, and SD3 (d).
For the SD2 event, the accumulated a priori emissions are rather high, especially around the border between China and Mongolia. The emission accumulations in several grid cells here are in the order of 300 g m−2, which results in an overestimation of surface dust concentration and AOD simulation as shown in Fig. 3a.ii–b.ii. In contrast, the posterior simulation estimates that the border region is almost free of dust emission during the event, and the dust plume is actually attributed to the dust emission from northern Mongolia. The Alxa desert also contributed partially to the dust plume that effected the FWP region.
For the SD3 event, the a priori emission simulation suggests that most of the dust originated from the source regions in China rather than from the bare lands in Mongolia. Especially in the Tengger (also part of the Chinese Gobi) and Alxa deserts, the accumulated emissions reach values over 200 g m−2. By assimilating the MODIS AOD and PM10 concentration data, the posterior dust emission field is updated and the assimilated estimate of the accumulation map is plotted in Fig. 6c.ii. What is interesting about the result in the posterior map is that a much smaller amount of dust is estimated to be emitted from the Tengger and Alxa deserts, while sparsely vegetated regions in the northeastern part of the Inner Mongolia province are estimated to be a significant source. Dust from these regions is estimated to be transported towards NCP and northeast China, as will be discussed later. Close inspection of the posterior emission map shows that the emission over the Mongolian and Chinese border region was also one of the main sources in the SD3 event.
Apart from the spatial patterns of dust emission, the total mass of the emissions from Mongolia and China was calculated and shown in Fig. 6d, which helps to evaluate the emission intensity of dust in these two countries. Although the spatial patterns have been strongly changed by assimilation of the MODIS and PM10 concentration measurements, the posterior emission sums per country and event are in most cases close to the a priori values. An exception is the value for China in SD3, for which the total emission is decreased from 15.4×10⁶ to 7.1×10⁶ t by the assimilation. The emission sums show that the Mongolian Gobi is a stronger source of dust (37.5×10⁶ t) than the Chinese Gobi (19.9×10⁶ t).
The dust emission inversion successfully optimized the dust simulation using different types of observations of the dust plumes by adjusting the emission fields. The posterior emission field not only helps us exploit the spatial pattern of active dust sources, but also to simulate long-distance dust transport more accurately. This could be used for evaluation of the threats that dust imposes on human health, the transport system, and the Earth system.
4.1.2 Simulated dust field
The impact of the assimilation was evaluated by comparing the simulated observations from the a priori and posterior simulations with the (bias corrected) observations. The purpose of this paper is to have an emission field that is as accurate as possible; therefore, we assimilated all available PM10 and MODIS AOD observations instead of leaving a subset of them for independent validation. To quantify the performance, the root mean square error (RMSE) that calculates the deviation of the simulation with respect to the bias-corrected measurements is calculated.
A snapshot of the a priori and posterior surface dust concentration and AOD during SD1 are shown in the middle and right panels in Fig. 2, respectively. Both of the a priori and posterior simulations show a similar pattern as the (bias-corrected) PM10 and AOD observations that are shown in Figs. S1 and S2, or the raw data shown in the left panel of Fig. 2. However, the dust concentrations are underestimated in the a priori simulation in the entire region, resulting in a PM10 RMSE of 833 µg m−3 and AOD RMSE of 1.36 and 1.53. Compared to the a priori simulation, the posterior emission field simulated a more severe dust plume, and the PM10 RMSE is reduced to 743 µg m−3 and the AOD RMSE declined to 1.30 and 1.34, simultaneously. One important reason for this high error residue is the position mismatch among the simulation and observations. For instance, the plume front (red dashed line) that is visible in the MODIS AOD retrievals in Fig. 2b.i is about 100 km ahead of the front line shown in PM10 measurements in Fig. 2a.i. It is possible that the dust plume in the higher layers moved faster and was further southeast than the dust cloud at the bottom layer. However, this feature is not correctly captured by our LOTOS-EUROS/dust model. Both the simulated plume of AOD and surface dust concentration are in the same position; the simulated plume fronts indicated in Fig. 2a.ii and b.ii moved faster than the front line indicated by PM10 measurements, but slower than the front line in the MODIS AOD. The mismatch in simulated vertical structure is mostly likely caused by uncertainty in the advection transport. The two-dimensional grid distortion technique (Jin et al., 2021), which is independent of emission inversion, could adjust the horizontal position of the dust cloud simulation to better fit the available measurements, but is not yet able to adjust the vertical structure as is required here. A three-dimensional grid distortion with data measuring the vertical profile of the dust cloud is planned to solve this issue in our future research.
Figure 3 shows snapshots of original AOD and PM10 measurements, as well as the a priori and posterior AOD and surface dust concentration simulation at 28 March 11:00 (CST) within SD2. What stands out in the a priori AOD simulation in Fig. 3a.ii is the overestimation, especially at the center of the plume in the NCP region. The standard model simulated AOD values even larger than 4, while the measurements were around 2 to 3. It should be noted that all the AOD measurements shown in Fig. 3a.i contain both the dust and non-dust fractions, and the baseline-removed AODs which can be found in Fig. S4 are therefore a bit lower. By assimilating these bias-corrected measurements, posterior AOD simulations in Fig. 3a.iii are now in better agreement with the AOD observations. The AOD RMSE is therefore reduced from 0.99 in the a priori simulation to 0.81 in the posterior simulation. The improvement is also seen in the surface PM10 simulation, where the RMSE score decreases from 471 µg m−3 in the a priori to 359 µg m−3 in the posterior simulation.
Scenes of original AOD and PM10 measurements and the a priori and posterior simulated AOD and surface dust concentration at 15 April 11:00 (CST) during SD3 are plotted in Fig. 4. It is apparent from this figure that dust concentrations are overestimated by the model within this event as well. For a case in point, the PM10 measurements in Fig. 4a.i show that FWP is almost free of dust at that moment, and this is confirmed by the baseline-removed PM10 measurements shown in Fig. S5. The multi-observation assimilation successfully resolves the PM10 and AOD measurements. The simulation driven by the posterior emission field is in much better agreement with the measurements, with the PM10 RMSE reduced from 891 to 144 µg m−3 and the AOD RMSE drastically decreased from 1.79 to 0.73.
4.2 AOD-only or PM10-only assimilation evaluation
Next to the multi-observation (AOD and PM10 together) emission inversion described in Sect. 4.1, assimilation tests with the same configurations but using only AOD or PM10 observations are carried out as well. They are referred to as AOD-only and PM10-only assimilation in this study. The difference and added value of the multi-observation assimilation vs. AOD-only/PM10-only assimilation are analyzed. In addition, once AOD or PM10 measurements are assimilated alone, the other one will be used as the independent data for validation.
Figure 7 shows snapshots of the dust AOD and surface concentration simulation driven by the AOD-only (panels a.ii and b.ii) and PM10-only (panels a.iii and b.iii) posterior emission field with the SD3. It clearly illustrates the typical results that are observed in the other two events. As mentioned above, the AOD RMSE is reduced from 1.79 (the a priori) to 0.72 in the multi-observation assimilation. Once the MODIS AODs are assimilated alone, better dust AOD simulation performance is obtained, with the AOD RMSE further reduced to 0.69. The effectiveness of emission estimation through assimilating AOD is validated using the independent PM10 measurements; the PM10 RMSE decreased from 891 µg m−3 (the a priori) to 210 µg m−3 simultaneously. However, the PM10 RMSE stays at a slightly higher level compared to 143 µg m−3 as obtained in the multi-observation assimilation. Similarly, the PM10-only assimilation provides a further lower PM10 RMSE 133 µg m−3, but the simulated AOD field (RMSE = 0.77) is not as accurate as the one from the multi-observation assimilation.
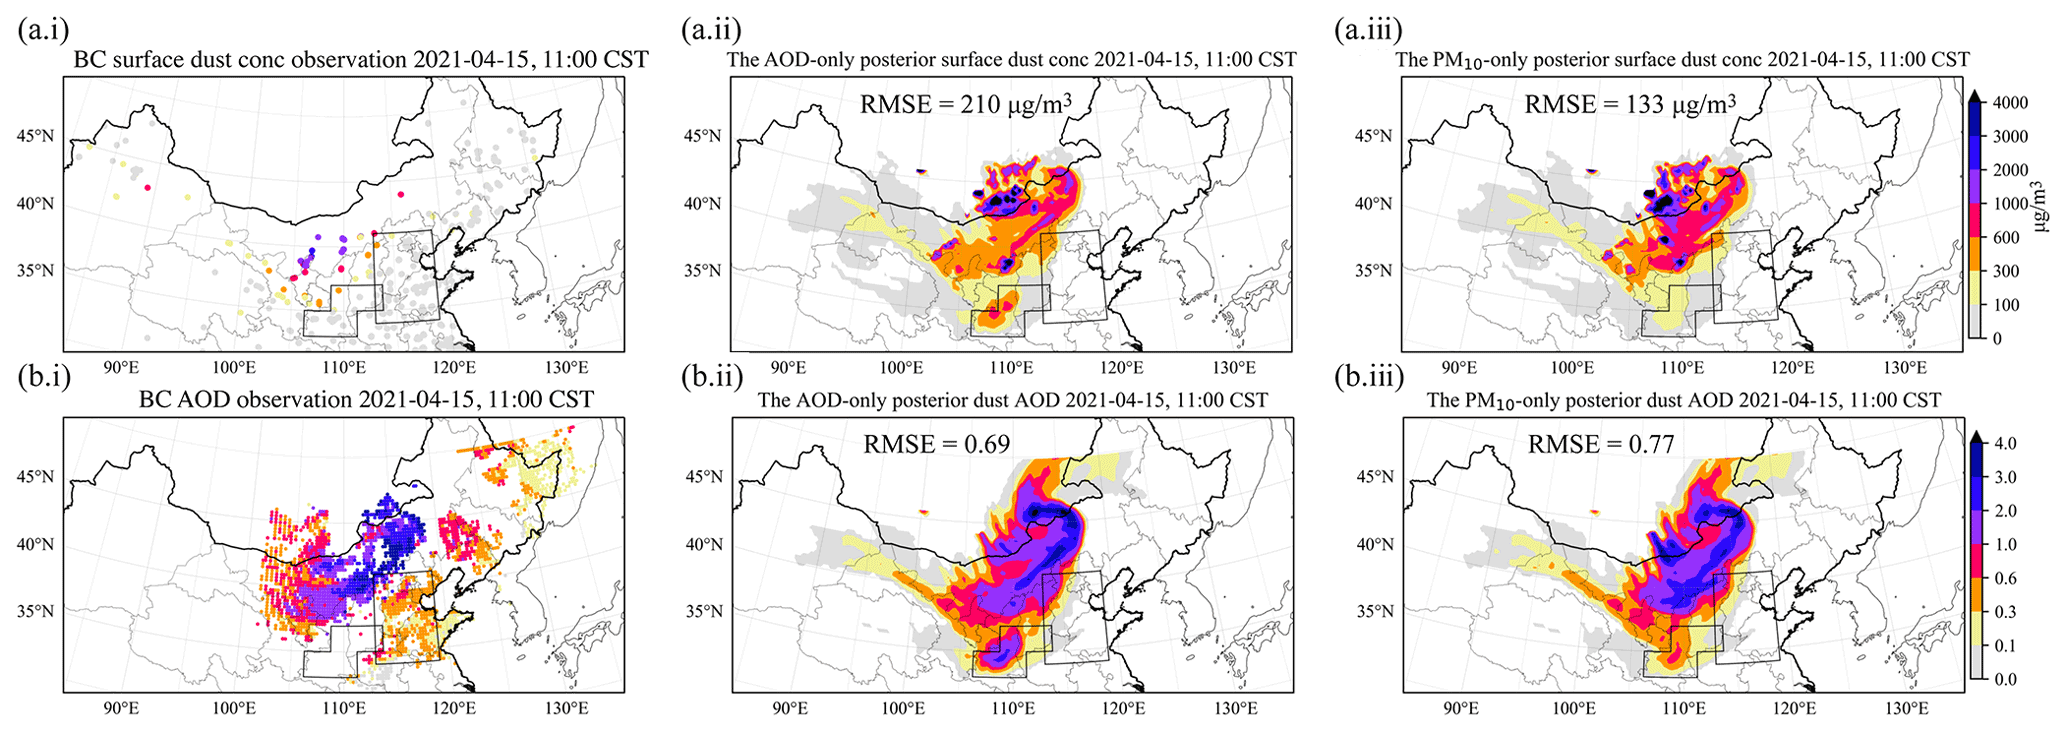
Figure 7The posterior dust surface dust concentration and AOD simulation either driven by the AOD-only or driven by the PM10-only assimilation emission result during SD3. (a.i, b.i) The bias-corrected (BC) PM10 and AOD observations; (a.ii, b.ii) the dust surface concentration and AOD simulation driven by the posterior emission from AOD-only assimilation; (a.iii, b.iii) the dust surface concentration and AOD result driven by the posterior emission from PM10-only assimilation at 11:00, 15 April.
Scenes of dust AOD and surface concentration simulation from the AOD-only and PM10-only assimilation in SD1 and SD2 can be found in Figs. S7 and S8. The corresponding AOD and PM10 RMSEs are calculated and shown in Table 2. Very similar trends are found in the assimilation tests within SD2. For SD3, the AOD-only or PM10-only assimilation also results in closer dust simulation to the assimilated measurements. However, poor performance (compared to the a priori) is obtained against the independent observations. For instance, driven by the emission through assimilating the AOD, the posterior simulated dust concentrations are very different from the PM10 measurements, and the RMSE is lifted up to 887 µg m−3 from 833 µg m−3 (a priori). This is mainly because the AOD and PM10 measurements indicate the different dust plume position in the simulation space as described in Sect. 4.1.2, and therefore the assimilation would lead the dust simulation into mismatch with the independent one.
Therefore, any AOD-only or PM10-only assimilation would only result in the posterior being closer to the assimilated data, but the posterior simulation in the independent observation space is not ensured to be improved. It is even possible that the posterior simulation is misled when the dust vertical profile is not well reproduced (such as in our simulation over SD1) or systematical observation bias is present. In this case, multi-observation assimilation as used in this study is a safe choice to avoid the model divergence.
Table 2Evaluation (RMSE) of the posterior dust simulation either by assimilating AOD, or by assimilating PM10, or by assimilating both of them.

4.3 Source apportionment
China's government has launched several large-scale ecological engineering projects to combat the environmental problems in northern China during recent decades. One of the largest is the Three-North Shelter Forest Program, which aims at increasing the vegetation cover up to 15 % by 2050 (Niu et al., 2019). Several studies (Shao et al., 2013; Tan and Li, 2015) reported that the vegetation recovery weakened dust storms substantially. In contrast, Mongolia has experienced ever-increasing land degradation and desertification (Meng et al., 2020), which aggravates the spring dust storms (Han et al., 2021). To evaluate the roles of Mongolian and Chinese Gobi deserts in the 2021 super sandstorms quantitatively, source apportionment tests based on the estimated emission field are carried out. These source apportionment tests focus on the two dust-affected mega-city clusters in northern China, namely the North China Plain (NCP) and the Fenwei Plain (FWP), and aim to calculate whether the dust originates from transnational transport from Mongolia or from domestic sources in China.
Two LOTOS-EUROS/dust simulations were conducted with the posterior emission field obtained in the multi-observation assimilation in Sect. 4.1.1, but with either only the emissions in Mongolia or only the emissions in China enabled. As can be seen in the time series of the hourly PM10 concentration measurements in NCP and FWP in Fig. 1c–d, after the peak of the dust had passed by the NCP and FWP regions, they still suffered from some less severe dust affection. Therefore, longer simulation windows are used in these source apportionment tests to simulate the full life cycle of these dust events as can be seen in Table 1. Different from cases caused by other pollutants, the spring dust events in East Asia are usually short-term events, with concentrations of dust that quickly increase to huge levels, but also drop down quickly after the storm has passed by. Metrics such as daily average dust concentration do not reflect the dust intensity directly. Therefore, a dust-deposition index is introduced that measures the sum of dry and wet deposition to quantify the impact of the dust in the studied regions.
Figure 8 shows the spatial pattern of the deposition for dust originating from China (left panels) and originating from Mongolia (right panels) in SD1, SD2, and SD3. The most interesting finding is that the sources in Mongolia play a much more important role in dust pollution in northern China than the sources in China itself. As shown in Fig. 8a.i, a huge quantity of particles were released in the Alxa desert during SD1, but these were mainly transported westward and only a small fraction of them moved to the densely populated areas. During SD2, the deposition of dust released from China is non-negligible, but the total deposition is still dominated by dust released from Mongolia. Within SD3, the dust particles emitted from the Chinese Gobi were spread all over northern China and hence played a more significant role.
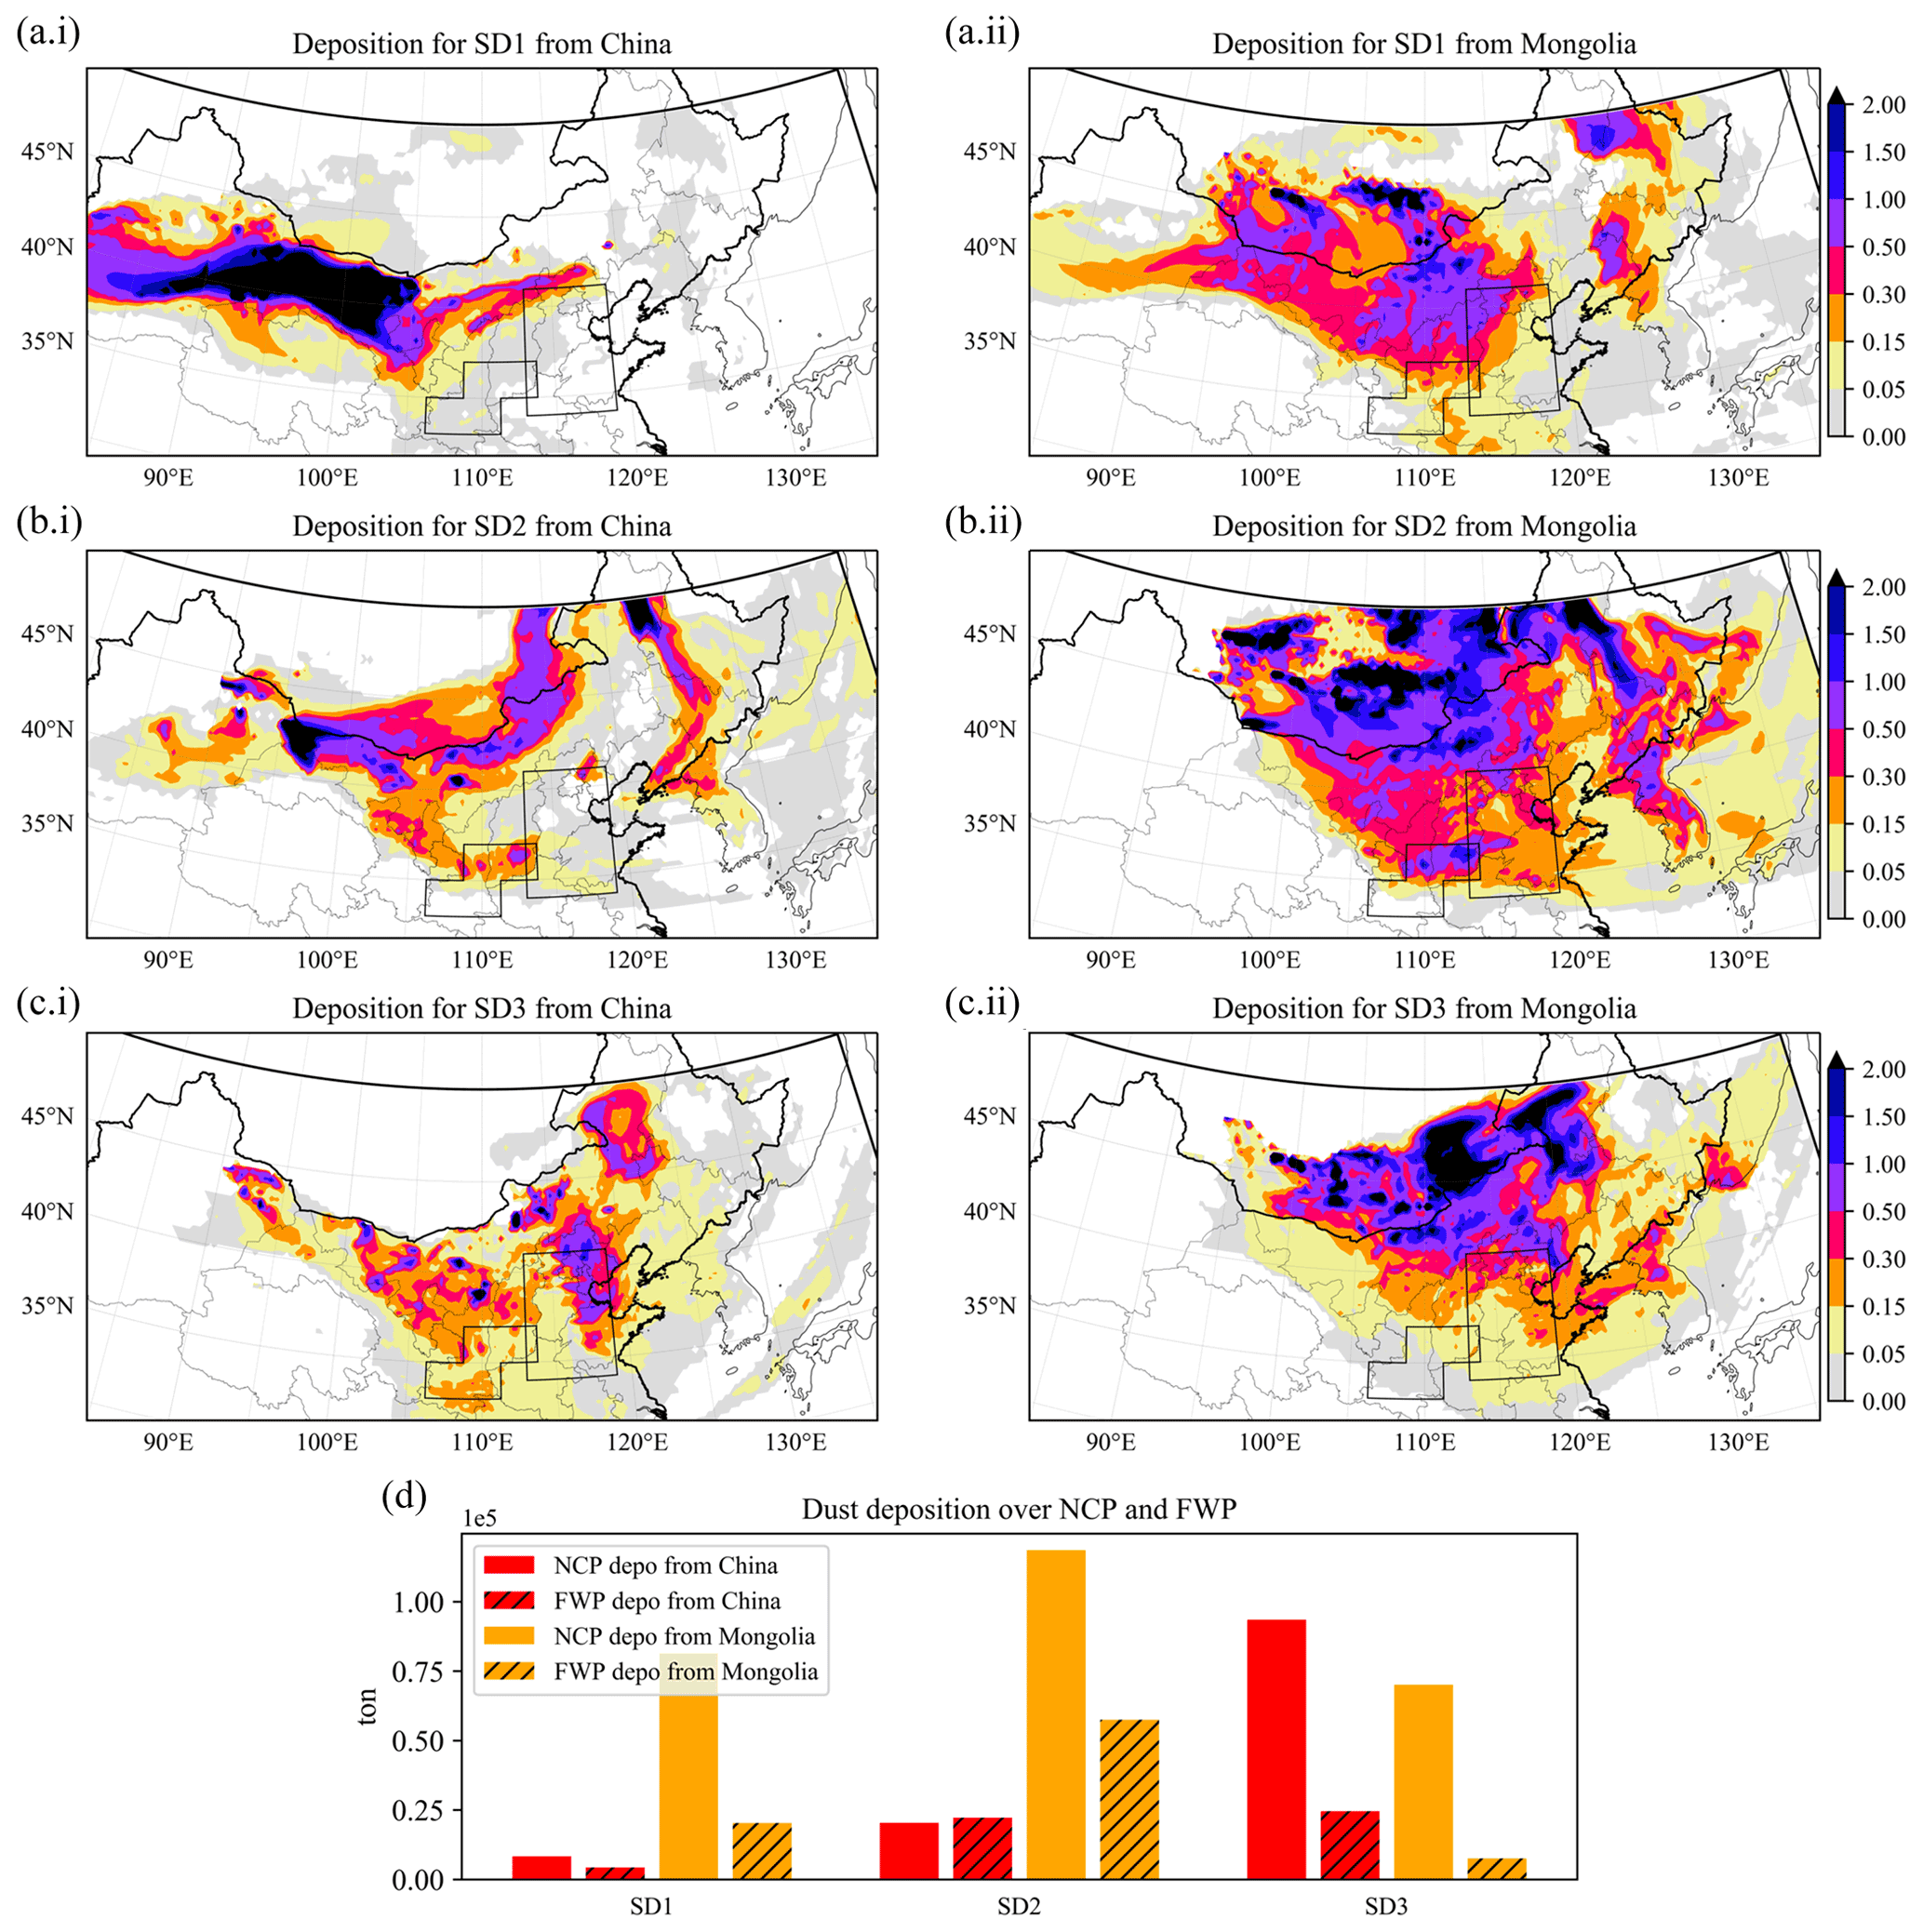
Figure 8Spatial patterns of deposition of dust originating from China (i) and from Mongolia (ii). Panel (d) shows the total mass of dust deposition on NCP and FWP either from China or from Mongolia during SD1 (a), SD2 (a), and SD3 (c).
The total deposition in the NCP and FWP regions was calculated and is shown in Fig. 8d. For the NCP region, 81×103, 118 ×103, and 70 ×103 t of Mongolian dust was deposited during SD1, SD2, and SD3 events, while the total deposition from Chinese desert was about 8.3 ×10³, 20 ×103, and 93 ×103 t, respectively. For the other important cluster FWP, 4.3 ×10³, 22 ×103, and 24 ×103 t were attributed to domestic sources, and 20 ×103, 57 ×103, and 7.5 ×10³ t of dust were attributed to transnational transport from Mongolia. In general, the Mongolian Gobi poses a more severe threat to the FWP and NCP regions than the Chinese Gobi. About 63 % of the dust deposition in FWP is attributed to transnational transport. Over NCP, this value further increases up to 69 %.
In spring 2021, three super dust storms occurred in East Asia after being absent for one and a half decades, which brought enormous health damages and property losses. To exploit the reappearing super sandstorms, inverse modeling was conducted through optimizing the dust simulation with observations of MODIS AODs and ground-based PM10 concentration from the Chinese MEP air-quality monitoring network. Data quality controls were designed and applied in order to use the AOD and PM10 measurements for representing the dust load. Based on the most likely emission field calculated by the inversion, source apportionment was further performed to derive the contribution of transnational transport from Mongolia and domestic dust emission to the dust pollutant level in northern China.
Emission inversion was successfully performed by assimilating the AOD and PM10 concentration measurements. The multi-observation assimilation showed that windblown dust emission occurred actively both in Chinese and Mongolian Gobi deserts during the events studied. Overall, about 37.5×10⁶ t of dust was released in Mongolia, and the total emission from the Chinese Gobi was also as high as 19.9×10⁶ t. The simulated AOD and surface dust concentration driven by the posterior emission fields have been validated to be in better agreement with the observations. To obtain a further accurate dust field analysis, however, vertical structure-adjusting techniques such as 3D grid distortion are then in demand for fully resolving the ground-based PM10 and column-integrated AOD together, and will be explored in our future work.
Emission inversions that only assimilated the AOD or PM10 concentration were also carried out. The comparison against the multi-observation assimilation showed that AOD-only or PM10-only assimilation would result in the posterior that is closer to the assimilated data, but the improvement of the simulation in the independent observation space is not ensured. Especially when vertical structure is not well reproduced (such as in the simulation over SD1), the posterior simulation would be divergent. Under this circumstance, multi-observation assimilation as used in this study is the more reliable choice.
A source apportionment study was then performed based on the multi-observation assimilation-estimated emission by estimating the origin of the dust that was deposited in regions of northern China. It indicated that the Mongolian Gobi posed more severe threats to the Fenwei Plain (FWP) and the North China Plain (NCP) than the Chinese Gobi within the three 2021 spring dust storms. For FWP, about 63 % of the dust deposition originated from transnational transport from Mongolia. In NCP, the Mongolian dust contribution was also as high as 69 %. To further explore the roles of specific deserts (such as the Alxa and Tengger deserts in Chinese Gobi) and long-distance transport patterns on the dust affection in northern China, more complex source apportionment tests are planned in our future research.
The source code and user guide of the LOTOS-EUROS CTM could be obtained from https://lotos-euros.tno.nl (TNO, 2022). The real-time PM10 data are from the network established by the China Ministry of Environmental Protection and available to the public via http://106.37.208.233:20035/ (China Ministry of Environmental Protection, 2022) (Internet Explorer 10 or 11), the PM10 data used in this paper is also archived on Zendo (https://doi.org/10.5281/zenodo.6459866, Jin, 2022). The MODIS Deep Blue C6 data suites are available at https://ladsweb.modaps.eosdis.nasa.gov/ (NASA, 2022). The datasets including measurements and model simulations can also be accessed by contacting the corresponding author.
The supplement related to this article is available online at: https://doi.org/10.5194/acp-22-6393-2022-supplement.
JJ conceived the study and designed the dust storm data assimilation. JJ, MP, and AS performed the control and assimilation tests and carried out the data analysis. AS, HL, WH, BL, and HXL provided useful comments on the paper. JJ prepared the manuscript with contributions from AS and all others co-authors.
The contact author has declared that neither they nor their co-authors have any competing interests.
Publisher’s note: Copernicus Publications remains neutral with regard to jurisdictional claims in published maps and institutional affiliations.
This article is part of the special issue “Dust aerosol measurements, modeling and multidisciplinary effects (AMT/ACP inter-journal SI)”. It is not associated with a conference.
We would like to thank the referee Thomas Sekiyama for the in-depth comments.
This research has been supported by the National Natural Science Foundation of China (grant no. 42105109, 42021004) and the Natural Science Foundation of Jiangsu Province (grant no. BK20210664).
This paper was edited by Toshihiko Takemura and reviewed by Thomas Sekiyama and one anonymous referee.
Bessho, K., Date, K., Hayashi, M., Ikeda, A., Imai, T., Inoue, H., Kumagai, Y., Miyakawa, T., Murata, H., Ohno, T., Okuyama, A., Oyama, R., Sasaki, Y., Shimazu, Y., Shimoji, K., Sumida, Y., Suzuki, M., Taniguchi, H., Tsuchiyama, H., Uesawa, D., Yokota, H., and Yoshida, R.: An Introduction to Himawari-8/9 – Japan's New-Generation Geostationary Meteorological Satellites, J. Meteorol. Soc. Jpn. Ser. II, 94, 151–183, https://doi.org/10.2151/jmsj.2016-009, 2016. a
Brasseur, G. P., Xie, Y., Petersen, A. K., Bouarar, I., Flemming, J., Gauss, M., Jiang, F., Kouznetsov, R., Kranenburg, R., Mijling, B., Peuch, V.-H., Pommier, M., Segers, A., Sofiev, M., Timmermans, R., van der A, R., Walters, S., Xu, J., and Zhou, G.: Ensemble forecasts of air quality in eastern China – Part 1: Model description and implementation of the MarcoPolo–Panda prediction system, version 1, Geosci. Model Dev., 12, 33–67, https://doi.org/10.5194/gmd-12-33-2019, 2019. a
Chen, L. and Walsh, M.: Vast sandstorms expose Mongolia's long-ignored ecological crisis, https://asia.nikkei.com/Spotlight/Caixin/Vast-sandstorms-expose-Mongolia-s-long-ignored-ecological-crisis (last access: 14 May 2022), 2021. a
China Ministry of Environmental Protection: Ground-based air quality monitoring measurements, China Ministry of Environmental Protection [data set], http://106.37.208.233:20035/, last access: 14 May 2022. a
Di Tomaso, E., Schutgens, N. A. J., Jorba, O., and Pérez García-Pando, C.: Assimilation of MODIS Dark Target and Deep Blue observations in the dust aerosol component of NMMB-MONARCH version 1.0, Geosci. Model Dev., 10, 1107–1129, https://doi.org/10.5194/gmd-10-1107-2017, 2017. a, b
Di Tomaso, E., Escribano, J., Basart, S., Ginoux, P., Macchia, F., Barnaba, F., Benincasa, F., Bretonnière, P.-A., Buñuel, A., Castrillo, M., Cuevas, E., Formenti, P., Gonçalves, M., Jorba, O., Klose, M., Mona, L., Montané, G., Mytilinaios, M., Obiso, V., Olid, M., Schutgens, N., Votsis, A., Werner, E., and Pérez García-Pando, C.: The MONARCH high-resolution reanalysis of desert dust aerosol over Northern Africa, the Middle East and Europe (2007–2016), Earth Syst. Sci. Data Discuss. [preprint], https://doi.org/10.5194/essd-2021-358, in review, 2021. a
Dubovik, O., Smirnov, A., Holben, B., King, M., Kaufman, Y., Eck, T., and Slutsker, I.: Accuracy assessments of aerosol optical properties retrieved from Aerosol Robotic Network (AERONET) Sun and sky radiance measurements, J. Geophys. Res.-Atmos., 105, 9791–9806, 2000. a
Dubovik, O., Holben, B., Eck, T. F., Smirnov, A., Kaufman, Y. J., King, M. D., Tanré, D., and Slutsker, I.: Variability of absorption and optical properties of key aerosol types observed in worldwide locations, J. Atmos. Sci., 59, 590–608, 2002. a
Eck, T. F., Holben, B., Reid, J., Dubovik, O., Smirnov, A., O'neill, N., Slutsker, I., and Kinne, S.: Wavelength dependence of the optical depth of biomass burning, urban, and desert dust aerosols, J. Geophys. Res.-Atmos., 104, 31333–31349, 1999. a
Fairlie, T. D., Jacob, D. J., and Park, R. J.: The impact of transpacific transport of mineral dust in the United States, Atmos. Environ., 41, 1251–1266, https://doi.org/10.1016/j.atmosenv.2006.09.048, 2007. a
Ginoux, P., Chin, M., Tegen, I., Prospero, J. M., Holben, B., Dubovik, O., and Lin, S.-J.: Sources and distributions of dust aerosols simulated with the GOCART model, J. Geophys. Res., 106, 20255–20273, https://doi.org/10.1029/2000jd000053, 2001. a
Ginoux, P., Prospero, J. M., Gill, T. E., Hsu, N. C., and Zhao, M.: Global-scale attribution of anthropogenic and natural dust sources and their emission rates based on MODIS Deep Blue aerosol products, Rev. Geophys., 50, RG3005, https://doi.org/10.1029/2012RG000388, 2012. a, b, c
Gkikas, A., Proestakis, E., Amiridis, V., Kazadzis, S., Di Tomaso, E., Tsekeri, A., Marinou, E., Hatzianastassiou, N., and Pérez García-Pando, C.: ModIs Dust AeroSol (MIDAS): a global fine-resolution dust optical depth data set, Atmos. Meas. Tech., 14, 309–334, https://doi.org/10.5194/amt-14-309-2021, 2021. a
Gong, S. L. and Zhang, X. Y.: CUACE/Dust – an integrated system of observation and modeling systems for operational dust forecasting in Asia, Atmos. Chem. Phys., 8, 2333–2340, https://doi.org/10.5194/acp-8-2333-2008, 2008. a, b
Han, J., Dai, H., and Gu, Z.: Sandstorms and desertification in Mongolia, an example of future climate events: A review, Environ. Chem. Lett., 19, 4063–4073, 2021. a, b
Hsu, N. C., Jeong, M.-J., Bettenhausen, C., Sayer, A. M., Hansell, R., Seftor, C. S., Huang, J., and Tsay, S.-C.: Enhanced Deep Blue aerosol retrieval algorithm: The second generation, J. Geophys. Res.-Atmos., 118, 9296–9315, https://doi.org/10.1002/jgrd.50712, 2013. a
Huneeus, N., Schulz, M., Balkanski, Y., Griesfeller, J., Prospero, J., Kinne, S., Bauer, S., Boucher, O., Chin, M., Dentener, F., Diehl, T., Easter, R., Fillmore, D., Ghan, S., Ginoux, P., Grini, A., Horowitz, L., Koch, D., Krol, M. C., Landing, W., Liu, X., Mahowald, N., Miller, R., Morcrette, J.-J., Myhre, G., Penner, J., Perlwitz, J., Stier, P., Takemura, T., and Zender, C. S.: Global dust model intercomparison in AeroCom phase I, Atmos. Chem. Phys., 11, 7781–7816, https://doi.org/10.5194/acp-11-7781-2011, 2011. a
Jin, G.: The most severe Sandstorm in a decade, https://www.chinanews.com/m/sh/2021/03-15/9433005.shtml (last access: 14 May 2022), 2021. a
Jin, J.: ground-based air quality measurements during the 2021 spring super dust storms, Zenodo [data set], https://doi.org/10.5281/zenodo.6459866, 2022. a
Jin, J., Lin, H. X., Heemink, A., and Segers, A.: Spatially varying parameter estimation for dust emissions using reduced-tangent-linearization 4DVar, Atmos. Environ., 187, 358–373, https://doi.org/10.1016/j.atmosenv.2018.05.060, 2018. a, b, c, d, e, f, g, h
Jin, J., Lin, H. X., Segers, A., Xie, Y., and Heemink, A.: Machine learning for observation bias correction with application to dust storm data assimilation, Atmos. Chem. Phys., 19, 10009–10026, https://doi.org/10.5194/acp-19-10009-2019, 2019a. a, b, c, d, e
Jin, J., Segers, A., Heemink, A., Yoshida, M., Han, W., and Lin, H.-X.: Dust Emission Inversion Using Himawari‐8 AODs Over East Asia: An Extreme Dust Event in May 2017, J. Adv. Model. Earth Sy., 11, 446–467, https://doi.org/10.1029/2018MS001491, 2019b. a, b, c, d, e, f
Jin, J., Segers, A., Liao, H., Heemink, A., Kranenburg, R., and Lin, H. X.: Source backtracking for dust storm emission inversion using an adjoint method: case study of Northeast China, Atmos. Chem. Phys., 20, 15207–15225, https://doi.org/10.5194/acp-20-15207-2020, 2020. a
Jin, J., Segers, A., Lin, H. X., Henzing, B., Wang, X., Heemink, A., and Liao, H.: Position correction in dust storm forecasting using LOTOS-EUROS v2.1: grid-distorted data assimilation v1.0, Geosci. Model Dev., 14, 5607–5622, https://doi.org/10.5194/gmd-14-5607-2021, 2021. a, b, c
Justice, C., Vermote, E., Townshend, J., Defries, R., Roy, D., Hall, D., Salomonson, V., Privette, J., Riggs, G., Strahler, A., Lucht, W., Myneni, R., Knyazikhin, Y., Running, S., Nemani, R., Wan, Z., Huete, A., van Leeuwen, W., Wolfe, R., Giglio, L., Muller, J., Lewis, P., and Barnsley, M.: The Moderate Resolution Imaging Spectroradiometer (MODIS): land remote sensing for global change research, IEEE T. Geosci. Remote Sens., 36, 1228–1249, https://doi.org/10.1109/36.701075, 1998. a
Kalnay, E.: Atmospheric Modeling, Data Assimilation and Predictability, edited by: Kalnay, E., Cambridge University Press, https://doi.org/10.1017/CBO9780511802270, 2002. a
Li, Z., Xu, H., Li, K., Li, D., Xie, Y., Li, L., Zhang, Y., Gu, X., Zhao, W., Tian, Q., Deng, R., Su, X., Huang, B., Qiao, Y., Cui, W., Hu, Y., Gong, C., Wang, Y., Wang, X., Wang, J., Du, W., Pan, Z., Li, Z., and Bu, D.: Comprehensive study of optical, physical, chemical, and radiative properties of total columnar atmospheric aerosols over China: An overview of Sun–Sky Radiometer Observation Network (SONET) measurements, B. Am. Meteorol. Soc., 99, 739–755, 2018. a
Lin, C., Wang, Z., and Zhu, J.: An Ensemble Kalman Filter for severe dust storm data assimilation over China, Atmos. Chem. Phys., 8, 2975–2983, https://doi.org/10.5194/acp-8-2975-2008, 2008. a, b
Liu, M., Zhou, G., Saari, R. K., Li, S., Liu, X., and Li, J.: Quantifying PM2.5 mass concentration and particle radius using satellite data and an optical-mass conversion algorithm, ISPRS J. Photogramm., 158, 90–98, https://doi.org/10.1016/j.isprsjprs.2019.10.010, 2019. a
Lorente-Plazas, R. and Hacker, J. P.: Observation and Model Bias Estimation in the Presence of Either or Both Sources of Error, Mon. Weather Rev., 145, 2683–2696, https://doi.org/10.1175/MWR-D-16-0273.1, 2017. a
Manders, A. M. M., Builtjes, P. J. H., Curier, L., Denier van der Gon, H. A. C., Hendriks, C., Jonkers, S., Kranenburg, R., Kuenen, J. J. P., Segers, A. J., Timmermans, R. M. A., Visschedijk, A. J. H., Wichink Kruit, R. J., van Pul, W. A. J., Sauter, F. J., van der Swaluw, E., Swart, D. P. J., Douros, J., Eskes, H., van Meijgaard, E., van Ulft, B., van Velthoven, P., Banzhaf, S., Mues, A. C., Stern, R., Fu, G., Lu, S., Heemink, A., van Velzen, N., and Schaap, M.: Curriculum vitae of the LOTOS–EUROS (v2.0) chemistry transport model, Geosci. Model Dev., 10, 4145–4173, https://doi.org/10.5194/gmd-10-4145-2017, 2017. a, b, c
Marticorena, B. and Bergametti, G.: Modeling the atmospheric dust cycle: 1. Design of a soil-derived dust emission scheme, J. Geophys. Res., 100, 16415–16430, https://doi.org/10.1029/95JD00690, 1995. a, b
Meng, X., Gao, X., Li, S., and Lei, J.: Spatial and Temporal Characteristics of Vegetation NDVI Changes and the Driving Forces in Mongolia during 1982–2015, Remote Sens., 12, 603, https://doi.org/10.3390/rs12040603, 2020. a
Min, M., Wu, C., Li, C., Liu, H., Xu, N., Wu, X., Chen, L., Wang, F., Sun, F., Qin, D., Wang, X., Li, B., Zheng, Z., Cao, G., and Dong., L.: Developing the science product algorithm testbed for Chinese next-generation geostationary meteorological satellites: Fengyun-4 series, J. Meteorol. Res., 31, 708–719, 2017. a
Mona, L., Papagiannopoulos, N., Basart, S., Baldasano, J., Binietoglou, I., Cornacchia, C., and Pappalardo, G.: EARLINET dust observations vs. BSC-DREAM8b modeled profiles: 12-year-long systematic comparison at Potenza, Italy, Atmos. Chem. Phys., 14, 8781–8793, https://doi.org/10.5194/acp-14-8781-2014, 2014. a
Morcrette, J.-J., Beljaars, A., Benedetti, A., Jones, L., and Boucher, O.: Sea-salt and dust aerosols in the ECMWF IFS model, Geophys. Res. Lett., 35, L24813, https://doi.org/10.1029/2008GL036041, 2008a. a
Morcrette, J.-J., Boucher, O., Jones, L., Salmond, D., Bechtold, P., Beljaars, A., Benedetti, A., Bonet, A., Kaiser, J., Razinger, M., Schulz, M., Serrar, S., Simmons, A., Sofiev, M., Suttie, M., Tompkins, A., Untch, A., and the GEMS-AER team: Aerosol analysis and forecast in the ECMWF Integrated Forecast System: Forward modelling, ECMWF Technical Memoranda, ECMWF, p. 35, https://doi.org/10.21957/jxqm3uq6j, 2008b. a
Morcrette, J.-J., Boucher, O., Jones, L., Salmond, D., Bechtold, P., Beljaars, A., Benedetti, A., Bonet, A., Kaiser, J. W., Razinger, M., Schulz, M., Serrar, S., Simmons, A. J., Sofiev, M., Suttie, M., Tompkins, A. M., and Untch, A.: Aerosol analysis and forecast in the European Centre for Medium-Range Weather Forecasts Integrated Forecast System: Forward modeling, J. Geophys. Res.-Atmos., 114, D06206, https://doi.org/10.1029/2008JD011235, 2009. a
NASA: MODIS Data Collection, NASA [data set], https://ladsweb.modaps.eosdis.nasa.gov/, last access: 14 May 2022. a
Niu, Q., Xiao, X., Zhang, Y., Qin, Y., Dang, X., Wang, J., Zou, Z., Doughty, R. B., Brandt, M., Tong, X., Horion, S., Fensholt, R., Chen, C., Myneni, R. B., Xu, W., Di, G., and Zhou, X.: Ecological engineering projects increased vegetation cover, production, and biomass in semiarid and subhumid Northern China, Land Degrad. Dev., 30, 1620–1631, https://doi.org/10.1002/ldr.3351, 2019. a
Niu, T., Gong, S. L., Zhu, G. F., Liu, H. L., Hu, X. Q., Zhou, C. H., and Wang, Y. Q.: Data assimilation of dust aerosol observations for the CUACE/dust forecasting system, Atmos. Chem. Phys., 8, 3473–3482, https://doi.org/10.5194/acp-8-3473-2008, 2008. a
Pérez, C., Nickovic, S., Baldasano, J. M., Sicard, M., Rocadenbosch, F., and Cachorro, V. E.: A long Saharan dust event over the western Mediterranean: Lidar, Sun photometer observations, and regional dust modeling, J. Geophys. Res.-Atmos., 111, D15214, https://doi.org/10.1029/2005JD006579, 2006. a
Remer, L. A., Kaufman, Y. J., Tanré, D., Mattoo, S., Chu, D. A., Martins, J. V., Li, R. R., Ichoku, C., Levy, R. C., Kleidman, R. G., Eck, T. F., Vermote, E., and Holben, B. N.: The MODIS Aerosol Algorithm, Products, and Validation, J. Atmos. Sci., 62, 947–973, 2005. a
Saide, P. E., Carmichael, G. R., Liu, Z., Schwartz, C. S., Lin, H. C., da Silva, A. M., and Hyer, E.: Aerosol optical depth assimilation for a size-resolved sectional model: impacts of observationally constrained, multi-wavelength and fine mode retrievals on regional scale analyses and forecasts, Atmos. Chem. Phys., 13, 10425–10444, https://doi.org/10.5194/acp-13-10425-2013, 2013. a
Sayer, A. M., Munchak, L. A., Hsu, N. C., Levy, R. C., Bettenhausen, C., and Jeong, M.-J.: MODIS Collection 6 aerosol products: Comparison between Aqua's e-Deep Blue, Dark Target, and “merged” data sets, and usage recommendations, J. Geophys. Res.-Atmos., 119, 13965–13989, https://doi.org/10.1002/2014JD022453, 2014. a
Schepanski, K., Tegen, I., Laurent, B., Heinold, B., and Macke, A.: A new Saharan dust source activation frequency map derived from MSG-SEVIRI IR-channels, Geophys. Res. Lett., 34, L18803, https://doi.org/10.1029/2007GL030168, 2007. a
Schuster, G. L., Dubovik, O., and Holben, B. N.: Angstrom exponent and bimodal aerosol size distributions, J. Geophys. Res.-Atmos., 111, D07207, https://doi.org/10.1029/2005JD006328, 2006. a
Shao, Y.: Simplification of a dust emission scheme and comparison with data, J. Geophys. Res., 109, D10202, https://doi.org/10.1029/2003jd004372, 2004. a
Shao, Y., Raupach, M. R., and Findlater, P. A.: Effect of saltation bombardment on the entrainment of dust by wind, J. Geophys. Res., 98, 12719–12726, https://doi.org/10.1029/93jd00396, 1993. a
Shao, Y., Wyrwoll, K.-H., Chappell, A., Huang, J., Lin, Z., McTainsh, G. H., Mikami, M., Tanaka, T. Y., Wang, X., and Yoon, S.: Dust cycle: An emerging core theme in Earth system science, Aeolian Res., 2, 181–204, https://doi.org/10.1016/j.aeolia.2011.02.001, 2011. a
Shao, Y., Klose, M., and Wyrwoll, K.-H.: Recent global dust trend and connections to climate forcing, J. Geophys. Res.-Atmos., 118, 11107–11118, https://doi.org/10.1002/jgrd.50836, 2013. a, b
Shao, Y. P., Raupach, M. R., and Leys, J. F.: A model for predicting aeolian sand drift and dust entrainment on scales from paddock to region, Australian J. Soil Res., 34, 309–342, https://doi.org/10.1071/sr9960309, 1996. a
Tan, M. and Li, X.: Does the Green Great Wall effectively decrease dust storm intensity in China? A study based on NOAA NDVI and weather station data, Land Use Policy, 43, 42–47, https://doi.org/10.1016/j.landusepol.2014.10.017, 2015. a
Timmermans, R., Kranenburg, R., Manders, A., Hendriks, C., Segers, A., Dammers, E., Zhang, Q., Wang, L., Liu, Z., Zeng, L., Denier van der Gon, H., and Schaap, M.: Source apportionment of PM2.5 across China using LOTOS-EUROS, Atmos. Environ., 164, 370–386, https://doi.org/10.1016/j.atmosenv.2017.06.003, 2017. a, b, c
TNO: LOTOS-EUROS source code, TNO [code], https://lotos-euros.tno.nl, last access: 14 May 2022. a
Winker, D. M., Hunt, W. H., and McGill, M. J.: Initial performance assessment of CALIOP, Geophys. Res. Lett., 34, L19803, https://doi.org/10.1029/2007gl030135, 2007. a
World Meteorological Organization: WMO AIRBORNE DUST BULLETIN: Sand and Dust Storm Warning Advisory and Assessment System, https://library.wmo.int/doc_num.php?explnum_id=3416 (last access: 14 May 2022), 2017. a
World Meteorological Organization: WMO AIRBORNE DUST BULLETIN: Sand and Dust Storm Warning Advisory and Assessment System, Tech. rep., https://public.wmo.int/en/resources/library/wmo-airborne-dust-bulletin-sand-and-dust-storm-warning-advisory-and-assessment (last access: 14 May 2022), 2019. a
World Meteorological Organization: Sand and Dust Storm Warning Advisory and Assessment System: Science Progress Report, Tech. rep., World Meteorological Organization, https://public.wmo.int/en/resources/library/sand-and-dust-storm-warning-advisory-and-assessment-system-science-progress-report (last access: 14 May 2022), 2020. a
Wu, C., Lin, Z., He, J., Zhang, M., Liu, X., Zhang, R., and Brown, H.: A process-oriented evaluation of dust emission parameterizations in CESM: Simulation of a typical severe dust storm in East Asia, J. Adv. Model. Earth Sy., 8, 1432–1452, https://doi.org/10.1002/2016MS000723, 2016. a
Yin, Z., Wan, Y., Zhang, Y., and Wang, H.: Why super sandstorm 2021 in North China, Natl. Sci. Rev., 9, nwab165, https://doi.org/10.1093/nsr/nwab165, 2021. a, b
Yumimoto, K. and Takemura, T.: Long-term inverse modeling of Asian dust: Interannual variations of its emission, transport, deposition, and radiative forcing, J. Geophys. Res.-Atmos., 120, 2014JD022390+, https://doi.org/10.1002/2014jd022390, 2015. a, b
Yumimoto, K., Nagao, T. M., Kikuchi, M., Sekiyama, T. T., Murakami, H., Tanaka, T. Y., Ogi, A., Irie, H., Khatri, P., Okumura, H., Arai, K., Morino, I., Uchino, O., and Maki, T.: Aerosol data assimilation using data from Himawari-8, a next-generation geostationary meteorological satellite, Geophys. Res. Lett., 43, 2016GL069298, https://doi.org/10.1002/2016gl069298, 2016. a
Zender, C. S.: Mineral Dust Entrainment and Deposition (DEAD) model: Description and 1990s dust climatology, J. Geophys. Res., 108, 4416, https://doi.org/10.1029/2002jd002775, 2003. a, b
Zhang, X.-X., Sharratt, B., Liu, L.-Y., Wang, Z.-F., Pan, X.-L., Lei, J.-Q., Wu, S.-X., Huang, S.-Y., Guo, Y.-H., Li, J., Tang, X., Yang, T., Tian, Y., Chen, X.-S., Hao, J.-Q., Zheng, H.-T., Yang, Y.-Y., and Lyu, Y.-L.: East Asian dust storm in May 2017: observations, modelling, and its influence on the Asia-Pacific region, Atmos. Chem. Phys., 18, 8353–8371, https://doi.org/10.5194/acp-18-8353-2018, 2018. a, b
Zhang, Z., Wu, W., Fan, M., Tao, M., Wei, J., Jin, J., Tan, Y., and Wang, Q.: Validation of Himawari-8 aerosol optical depth retrievals over China, Atmos. Environ., 199, 32–44, 2019. a
Zhou, C. H., Gong, S. L., Zhang, X. Y., Wang, Y. Q., Niu, T., Liu, H. L., Zhao, T. L., Yang, Y. Q., and Hou, Q.: Development and evaluation of an operational SDS forecasting system for East Asia: CUACE/Dust, Atmos. Chem. Phys., 8, 787–798, https://doi.org/10.5194/acp-8-787-2008, 2008. a
- Abstract
- Introduction
- Dust events, measurements, and model
- Data assimilation algorithms
- Results and discussions
- Summary and future work
- Code and data availability
- Author contributions
- Competing interests
- Disclaimer
- Special issue statement
- Acknowledgements
- Financial support
- Review statement
- References
- Supplement