the Creative Commons Attribution 4.0 License.
the Creative Commons Attribution 4.0 License.
 | 17 May 2022
An investigation into the chemistry of HONO in the marine boundary layer at Tudor Hill Marine Atmospheric Observatory in Bermuda
Youfeng Wang
Xianliang Zhou
Yasin F. Elshorbany
Chunxiang Ye
Matthew Hayden
Andrew J. Peters
Here we present measurement results of temporal distributions of nitrous acid (HONO) along with several chemical and meteorological parameters during the spring and the late summer of 2019 at Tudor Hill Marine Atmospheric Observatory in Bermuda. Large temporal variations in HONO concentration were controlled by several factors including local pollutant emissions, air mass interaction with the island, and long-range atmospheric transport of HONO precursors. In polluted plumes emitted from local traffic, power plant, and cruise ship emissions, HONO and nitrogen oxides (NOx) existed at substantial levels (up to 278 pptv and 48 ppbv, respectively), and NOx-related reactions played dominant roles in daytime formation of HONO. The lowest concentration of HONO was observed in marine air, with median concentrations at ∼ 3 pptv around solar noon and < 1 pptv during the nighttime. Considerably higher levels of HONO were observed during the day in the low-NOx island-influenced air ([NO2] < 1 ppbv), with a median HONO concentration of ∼ 17 pptv. HONO mixing ratios exhibited distinct diurnal cycles that peaked around solar noon and were lowest before sunrise, indicating the importance of photochemical processes for HONO formation. In clean marine air, NOx-related reactions contribute to ∼ 21 % of the daytime HONO source, and the photolysis of particulate nitrate (pNO3) can account for the missing source assuming a moderate enhancement factor of 29 relative to gaseous nitric acid photolysis. In low-NOx island-influenced air, the contribution from both NOx-related reactions and pNO3 photolysis accounts for only ∼ 48 % of the daytime HONO production, and the photochemical processes on surfaces of the island, such as the photolysis of nitric acid on the forest canopy, might contribute significantly to the daytime HONO production. The concentrations of HONO, NOx, and pNO3 were lower when the site was dominated by the aged marine air in the summer and were higher when the site was dominated by North American air in the spring, reflecting the effects of long-range transport on the reactive nitrogen chemistry in background marine environments.
- Article
(4129 KB) - Full-text XML
-
Supplement
(1234 KB) - BibTeX
- EndNote


Nitrous acid (HONO) is a reactive nitrogen species that plays an important role in the oxidation capacity of the troposphere, as its rapid photolysis (Reaction R1) can account for a significant fraction of the production of the hydroxyl radical (OH) (Elshorbany et al., 2010, 2012; Kleffmann et al., 2005; Perner and Platt, 1979):
The chemistry of HONO, especially during the daytime, is not well understood. Known HONO sources include direct emissions (Y. Q. Li et al., 2008; Oswald et al., 2013; Su et al., 2011; Trentmann et al., 2003), reactions between nitrogen oxide (NO) and OH (Zabarnick, 1993), heterogeneous production from nitrogen dioxide (NO2) (Kleffmann, 2007), and the photolysis of nitrate on surfaces (Ye et al., 2016a; Zhou et al., 2003) or in the aerosol phase (Ye et al., 2017a, b):
Recent field observations reported that HONO exists at considerable levels during the day, up to several parts per billion volume (ppbv) in the urban atmosphere (e.g., Acker et al., 2006a; Elshorbany et al., 2009) and up to several hundred parts per trillion by volume (pptv) in the rural and remote atmosphere (He et al., 2006; Ye et al., 2016b; Zhang et al., 2009). During the daytime, HONO is removed rapidly by its photolysis, with a short photolytic lifetime of ∼ 10 min at noon under clear-sky conditions (Elshorbany et al., 2009; Kleffmann et al., 2003; Zhang et al., 2009). To sustain the observed HONO concentration against the major photochemical loss of HONO, active daytime production is needed to explain its observed mixing ratios (Neftel et al., 1996; Zhou et al., 2001, 2002).
In the urban environment, direct HONO emission only accounts for a small fraction of its observed atmospheric concentration (Kleffmann, 2007). It is commonly believed that HONO is mainly formed by the gas-phase reactions between NO and OH (Elshorbany et al., 2010; Villena et al., 2011a) and heterogeneous reactions of NO2 (Finlayson-Pitts et al., 2003; Kleffmann, 2007). The heterogeneous reactions leading to HONO formation occur on a variety of surfaces, including aerosol, soot, vegetation, and urban surfaces (He et al., 2006; Kleffmann et al., 1999; Ramazan et al., 2004; Reisinger, 2000; Stutz et al., 2002). It was also suggested that HONO formation is likely enhanced by solar irradiation, since measurement studies observed unexpectedly high HONO concentrations during the daytime in various environments (Acker et al., 2006b; Kleffmann et al., 2005; Vogel et al., 2003; Liu et al., 2019). One possible explanation was that organic matter serves as photosensitizer and results in light-initiated enhancement of HONO formation during the heterogeneous reaction of NO2 (George et al., 2005; Stemmler et al., 2006, 2007). Other proposed mechanisms for HONO production include gas-phase reactions of excited NO2 with water (S. Li et al., 2008) and the reactions between NO2 and the hydroperoxyl–water complex (HO2•H2O) (Li et al., 2014); recent model calculations suggested that these newly proposed, NO2-related mechanisms are likely insignificant as HONO precursors (Carr et al., 2009; Wong et al., 2011; Ye et al., 2015).
In atmospheric environments with relatively low abundance of NOx (NOx = NO + NO2), studies proposed that rapid photolysis of HNO3 on various surfaces as well as particulate nitrate (pNO3) photolysis might serve as an important HONO source (Ye et al., 2016b; Zhou et al., 2003, 2011). Direct evidence from laboratory photochemistry experiments showed that there are major photolytic rate enhancements of HNO3 on various surfaces (Ye et al., 2016a; Zhou et al., 2003) and in aerosol samples collected from various air masses, including boundary layer air above the Atlantic Ocean and over the terrestrial environments over the United States (Ye et al., 2017b, 2018). The reported pNO3 photolytic rate constant (, normalized by solar irradiation at tropical noontime) was higher than the rate constant for gaseous nitric acid photolysis by ∼ 1–3 orders of magnitude (Ye et al., 2017b, 2018).
To date, few studies have investigated HONO distribution and its chemical cycling in the marine boundary layer (MBL), even though the oceans cover > 70 % of the earth surface (Crilley et al., 2021; Kasibhatla et al., 2018; Reed et al., 2017; Wojtal et al., 2011; Ye et al., 2016b; Zha et al., 2014). Several studies observed substantial HONO concentrations (∼ 3.5–11 pptv) during the day in clean, well-aged marine air (Crilley et al., 2021; Kasibhatla et al., 2018; Reed et al., 2017; Ye et al., 2016b). Evidence from both field observations and laboratory experiments suggested that pNO3 photolysis might contribute to a major fraction of the observed level of HONO in the marine atmosphere (Ye et al., 2016b). However, major uncertainties persist in current model evaluations for the impact of pNO3 photochemistry on reactive nitrogen cycling in the MBL, due to the paucity of field measurements as well as laboratory experiments that determined in marine aerosol samples. Additionally, the role of the ocean surface in regulating HONO cycling in the MBL remains unclear. The ocean surface is expected as a HONO sink due to its high solubility in alkaline aqueous solutions. However, several studies reported nighttime accumulation of HONO in the MBL, with higher NO2-to-HONO conversion rate in air masses that have passed over the ocean surface than those that have passed over the terrestrial surface (Wojtal et al., 2011; Zha et al., 2014). It is possible that there is an unknown HONO source at the air–sea interface; further evidence in the field and the laboratory is required to confirm this potential HONO source.
During the spring and late summer of 2019, we conducted extensive field measurements to determine the temporal distributions of HONO and the relevant parameters including NOx, pNO3, HNO3, aerosol loading, O3, and meteorological parameters, at Tudor Hill Marine Atmospheric Observatory (THMAO) in Bermuda. To examine the importance of pNO3 as a photolytic HONO source, we collected aerosol samples during the field campaigns and conducted photochemistry experiments to determine the pNO3 photolysis rate constants leading to HONO formation in the gas phase. In the present study, we present results from both field observations and laboratory experiments and discuss the chemistry of HONO as well as other reactive nitrogen species in the marine atmosphere in Bermuda.
2.1 Field observations
Two intensive field studies were conducted at the THMAO site in Bermuda during the spring (17 April–13 May) and late summer (16 August–10 September) of 2019. The site is located on the western coast of Bermuda (32.2647∘ N, 64.8788∘ W) (Fig. S1 in the Supplement). The sampling site is equipped with three trailers for in-house measurements and an aluminum sampling tower that is 23 and 53
Ambient HONO concentrations were continuously measured, employing a long-path absorption photometry (LPAP) system. HONO was collected in a 10-turn glass coil sampler with purified water (18.2 MΩ cm) that was obtained from a Barnstead Nanopure Diamond™ water purification system (Thermo Scientific). The collected nitrite was derivatized with a reagent solution with 5 mM sulfanilamide (SA), 0.5 mM N-(1-naphthyl)ethylenediamine (NED) and 40 mM hydrochloric acid (HCl). The formed azo dye was detected at 540 nm using a four-channel fiber-optic spectrometer (LEDspec, World Precision Instruments) with a 1 m liquid waveguide capillary cell (World Precision Instruments). To minimize potential artifacts for HONO measurements on the sampling inlet wall, the HONO measurement system was installed directly on the platform of the sampling tower. The sampling assembly consisted of a coil sampler, a three-way Teflon solenoid valve, and a Na2CO3 denuder. Background correction was conducted using the zero-HONO air that was generated by pulling ambient air through the Na2CO3 denuder. The LPAP system ran 60 min alternating cycles; during each cycle the solenoid valve feeds the coil sampler with zero-HONO air for 10 min and ambient air for 50 min. The absorbance signal was recorded every 5 s; data were averaged every 10 min for further analyses. The LPAP system has successfully proven its effectiveness and accuracy in HONO measurement during the previous NOMADSS field data, and the reader is referred to Ye et al. (2016b, 2018) for detailed discussion for method validation and interference elimination. Briefly, interference species NOx, peroxyacetyl nitrate (PAN), and particulate nitrite are expected to pass through the Na2CO3 denuder, and therefore their potential inference was eliminated by the background correction. Interference from peroxynitric acid (HO2NO2) is expected to be negligible due to the low steady-state concentration at warm temperature (i.e., > 20 ∘C). The air sampling rate was 3 L min−1. The detection limit of HONO was calculated as 3 times the standard deviation (3σ) for the baseline signal and was ∼ 0.6 pptv at 10 min time resolution.
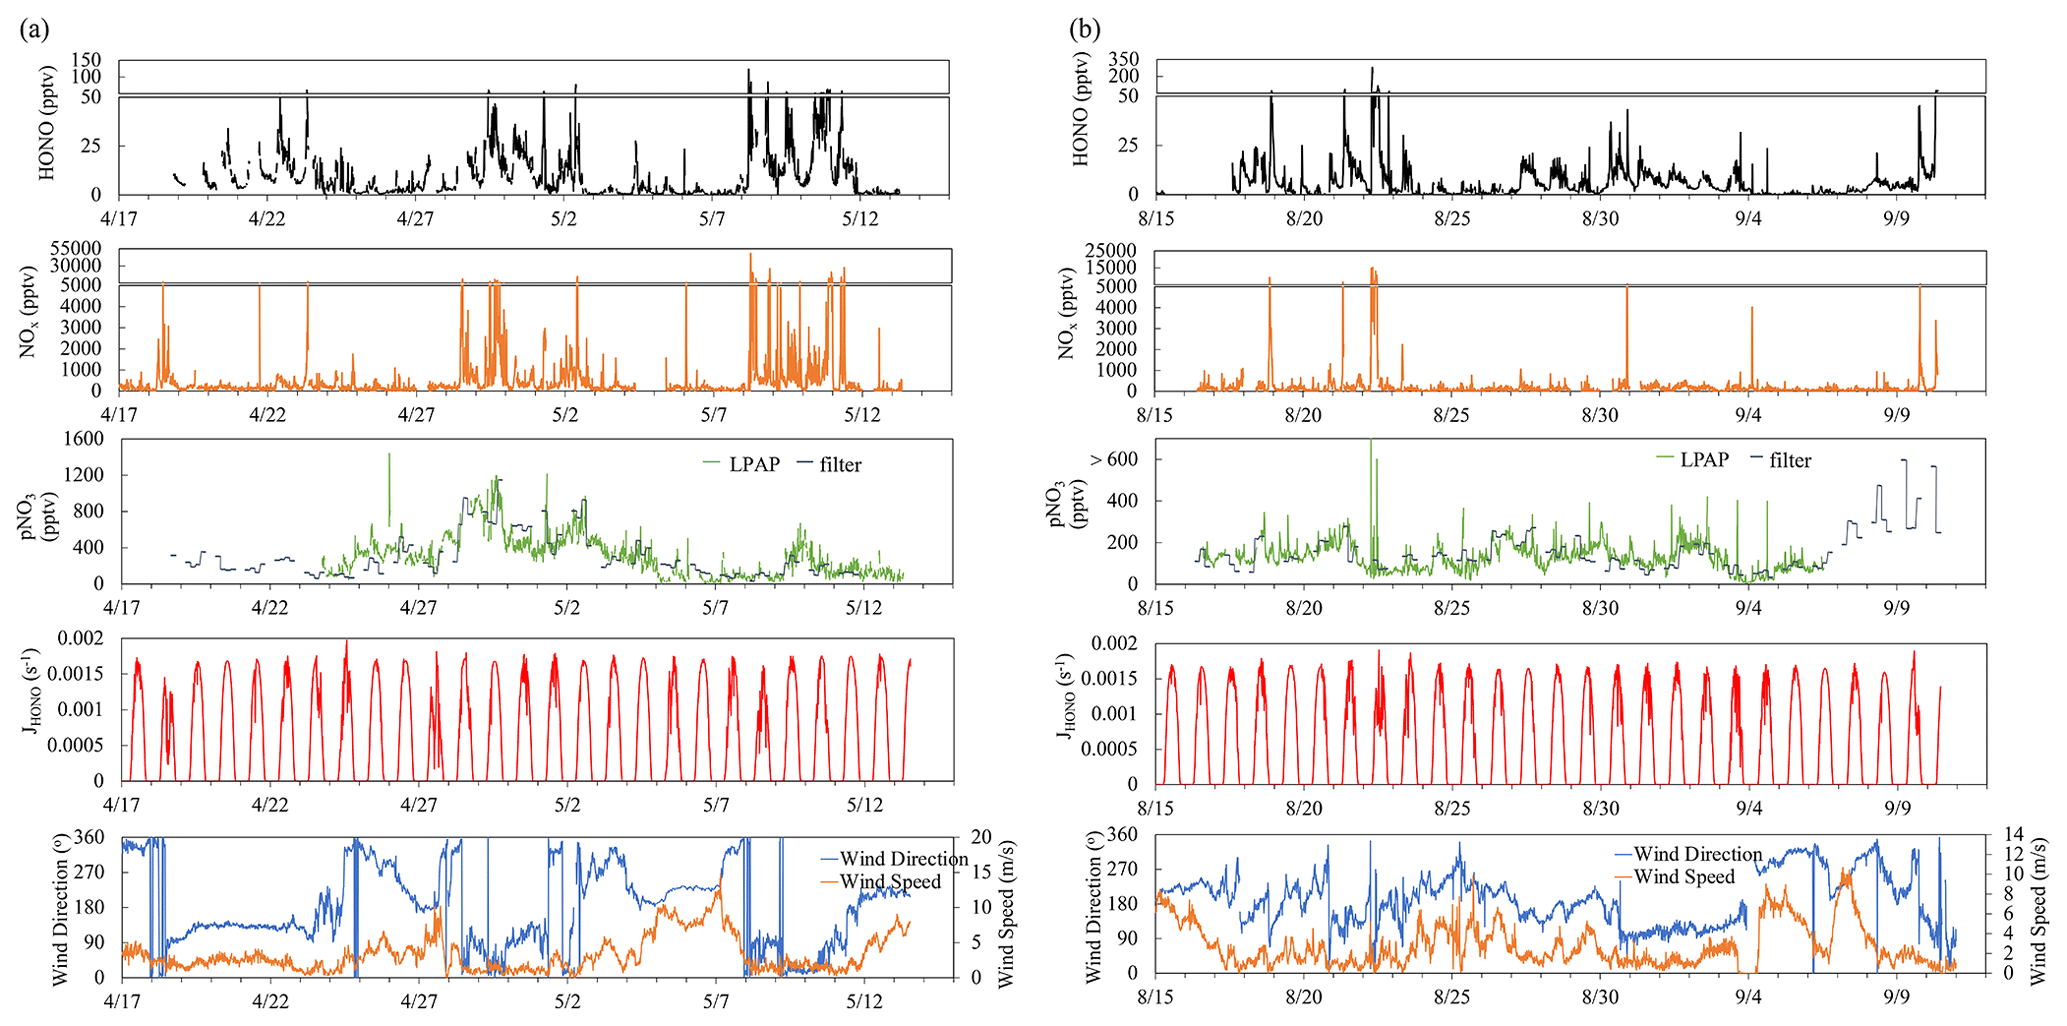
Figure 1Time series plots of HONO, NOx, , , HONO photolysis rate constant (JHONO), wind direction, and wind speed for the spring (a) and summer (b) field campaigns that were conducted at the THMAO in Bermuda.
Ambient HNO3 and pNO3 were measured by LPAP systems similar to the system for HONO; these were installed directly on the platform of the sampling tower. Gaseous HNO3 and HONO were collected in a 10-turn glass coil sampler with purified water, and the collected nitrate was converted into nitrite by passing it through a Cd column in NH4Cl buffer solution. The zero-HONO and zero-HNO3 air was generated by pulling ambient air through a Na2CO3 denuder. HONO concentration measured by the first LPAP system was used to calculate the absorption signal contributed by HONO, which was subtracted from the total absorption signal to obtain the final product for HNO3 concentration. The air sampling rate was 2 L min−1. The detection limit of HNO3 was ∼ 2 pptv (3σ) at 10 min time resolution. Aerosol nitrate was scrubbed from ambient air in a continuously wetted frit-disc sampler with purified water. The collected nitrate was converted into nitrite by passing it through a Cd column in NH4Cl buffer solution. A Na2CO3 denuder was installed right before the frit-disc sampler to remove all the gaseous acidic species, including HNO3 and HONO. Zero-pNO3 air was generated by pumping ambient air through a 0.45 µm Teflon filter (Sartorius Biolab Products, 47 mm diameter) to generate the baseline for pNO3 measurement. The air sampling rate was 2 L min−1. The detection limit of particulate nitrate measured by the LPAP system () was ∼ 17 pptv (3σ) at 10 min time resolution. We corrected concentrations by multiplying them by a factor of 2.06, after comparing the data with the aerosol nitrate concentrations determined in bulk aerosol samples (; see Sect. 2.2 for details). The correction factor was the slope of the linear correlation between the concentrations of and that were measured simultaneously. The discrepancy might in part result from loss of aerosol particles within the sampling compartment of the LPAP system (e.g., deposition on the walls of the Na2CO3 denuder) before the aerosol samples were scrubbed in the wetted frit-disc sampler. After the correction factor was applied, good agreements were achieved when comparing the temporal trends of particulate nitrate concentrations determined by the two different methods (Fig. 1).
NOx concentrations were measured by a low-level commercial chemiluminescence analyzer (Thermo Environmental Instruments Inc. 42C-TL) with a blue-light NO2-to-NO convertor (Droplet Measurement Technologies); the detection limit (3σ) was ∼ 88 and 30 pptv for NO2 and NO, respectively, at 10 min resolution. Measurement data from the NOx analyzer meet our needs in the general examination of temporal data variations that were largely influenced by pollution episodes (see Sect. 3.1 and 3.2). However, NOx levels in relatively clean marine air were near to or lower than the detection limits of the NOx analyzer. Therefore, data obtained by the NOx analyzer were not applicable in advanced data analyses (see Sect. 3.3 and 3.4), especially in clean marine air. During the summer field campaign, we installed a NO2 measurement system employing the LPAP technique (NO2-LPAP). The NO2-LPAP system was assembled following Villena et al. (2011b). In our customized NO2-LPAP system, ozone (O3) was firstly removed with 0.6 g L−1 potassium indigotrisulfonate (Villena et al., 2011b) in a 30-turn coil sampler, and the O3-free air later passed a 50-turn coil sampler that scrubbed NO2 with a 14 g L−1 SA (dissolved in 2.5 M acetic acid) solution and a 0.5 g L−1 NED solution. The air sampling rate was 0.5 L min−1. NO2-LPAP measurements (only available in the summer field campaign) successfully lowered the detection limit (3σ) to 14 pptv at 10 min resolution. Measurement systems for NOx, NO2-LPAP, and O3 were installed in the trailers; ∼ 30 m long Teflon tubing was used to sample ambient air from the platform of the sampling tower to the in-house measurement systems. O3 was monitored with a commercial ozone monitor (Thermo 49i) based on UV absorbance at 254 nm, and the detection limit (3σ) was 1.7 ppbv at 10 min resolution.
Aerosol loading was monitored by a commercial nephelometer (Thermo Scientific) which was installed just below the platform of the sampling tower; the nephelometer provided a detection resolution of 0.1 µg m−3 and a particle size range of 0.1–10 µm. The intensity of ultraviolet (UV) light was measured by an Eppley TUV radiometer (295–385 nm) that was installed on the platform of the sampling tower, and the measured UV data were later combined with the tropospheric ultraviolet and visible radiative transfer model (https://www2.acom.ucar.edu/modeling/tropospheric-ultraviolet-and-visible-tuv-radiation-model, last access: 4 May 2022) to calculate the photolysis rate constant for NO2, HONO, HNO3, and O3. Photolysis rate constant calculations were performed following Zhou et al. (2011), and the details for these calculations are presented in the Supplement Sect. S1.
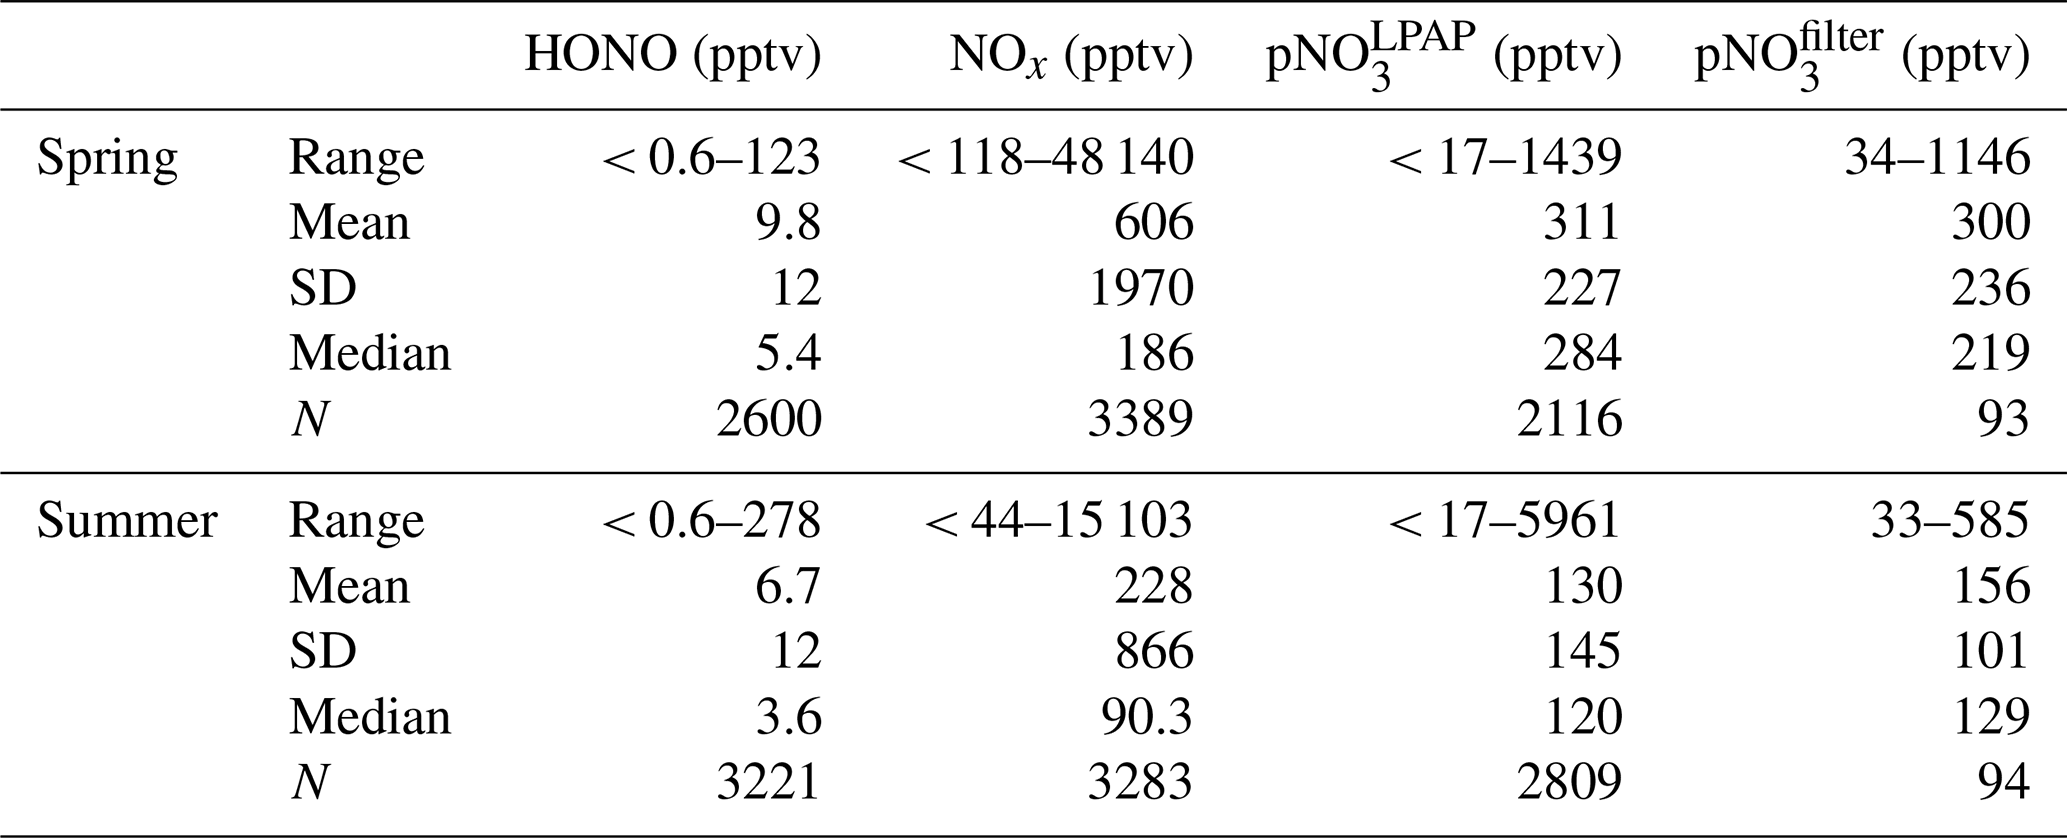
Table 1Data statistics for the concentrations of HONO, NOx, , and during the spring (17 April–13 May) and late summer (16 August–10 September) of 2019 at the THMAO in Bermuda. For HONO, NOx, concentrations, the statistical analyses were performed based on 10 min averaged data.
2.2 pNO3 Photolysis rate constant determination
Bulk aerosol samples were collected on Teflon filters (Sartorius Biolab Products, 0.45 µm pore size, 47 mm diameter) during the field campaigns. There were four sampling periods during each day, from 04:00–08:00, 08:00–12:00, 12:00–16:00, and 16:00–20:00 LT (local time). The aerosol sampling rate was 10 L min−1. The collected aerosol samples were stored in tightly capped petri dishes (Analyslide®, Pall Corporation) in a freezer until use for laboratory experiments. Upon usage, each filter was cut into to two equal halves. One-half of the aerosol filter was extracted by 5 mL purified water to determine the concentrations of and other ionic components (Na+, Mg2+, Ca2+, , Cl−, and ) using a Dionex ICS 3000 ion chromatography system coupled with an AS14 4 mm analytical column and an AG14 4 mm guard column.
The other half filter was used in a light exposure experiment to determine the production rate constant of HONO. During each photochemistry experiment, the aerosol filter was placed in a cylindrical flow reactor that was installed under a solar simulator. The cylindrical flow reactor, with 10 cm diameter and 1.5 cm depth, was made from a Teflon block with a quartz window on the top. A 300 W Cermax® Xenon lamp (Perkin Elmer) served as the light source in the solar simulator. Humidified zero air (50 % RH) was used as the carrier gas that flows through the Teflon block reactor, and the flow rate was 1 L min−1. The amount of HONO that was produced during short-period (5 min) light exposure was determined with a LPAP system that was installed after the flow reactor. Readers are referred to the Supplement Sect. S2 for detailed calculations of aerosol nitrate photolysis rate constant leading to HONO production , which was normalized to light conditions during tropical summer with a solar zenith angle of 0∘.
Figure 1 presents an overview for some chemical and meteorological parameters that were measured during the spring and late summer field campaigns of 2019, including HONO, NOx, , , JHONO, wind speed, and wind direction. Data statistics for HONO, NOx, , concentrations are summarized in Table 1. As shown in Fig. 1, we observed large temporal variations for the concentrations of reactive nitrogen species. These temporal variations resulted from joint influences by local pollutant emissions (see Sect. 3.1 for detailed discussion), long-range transport of air masses (see Sect. 3.2 for detailed discussion), and diurnal changes in solar radiation (see Sect. 3.3 for detailed discussion).
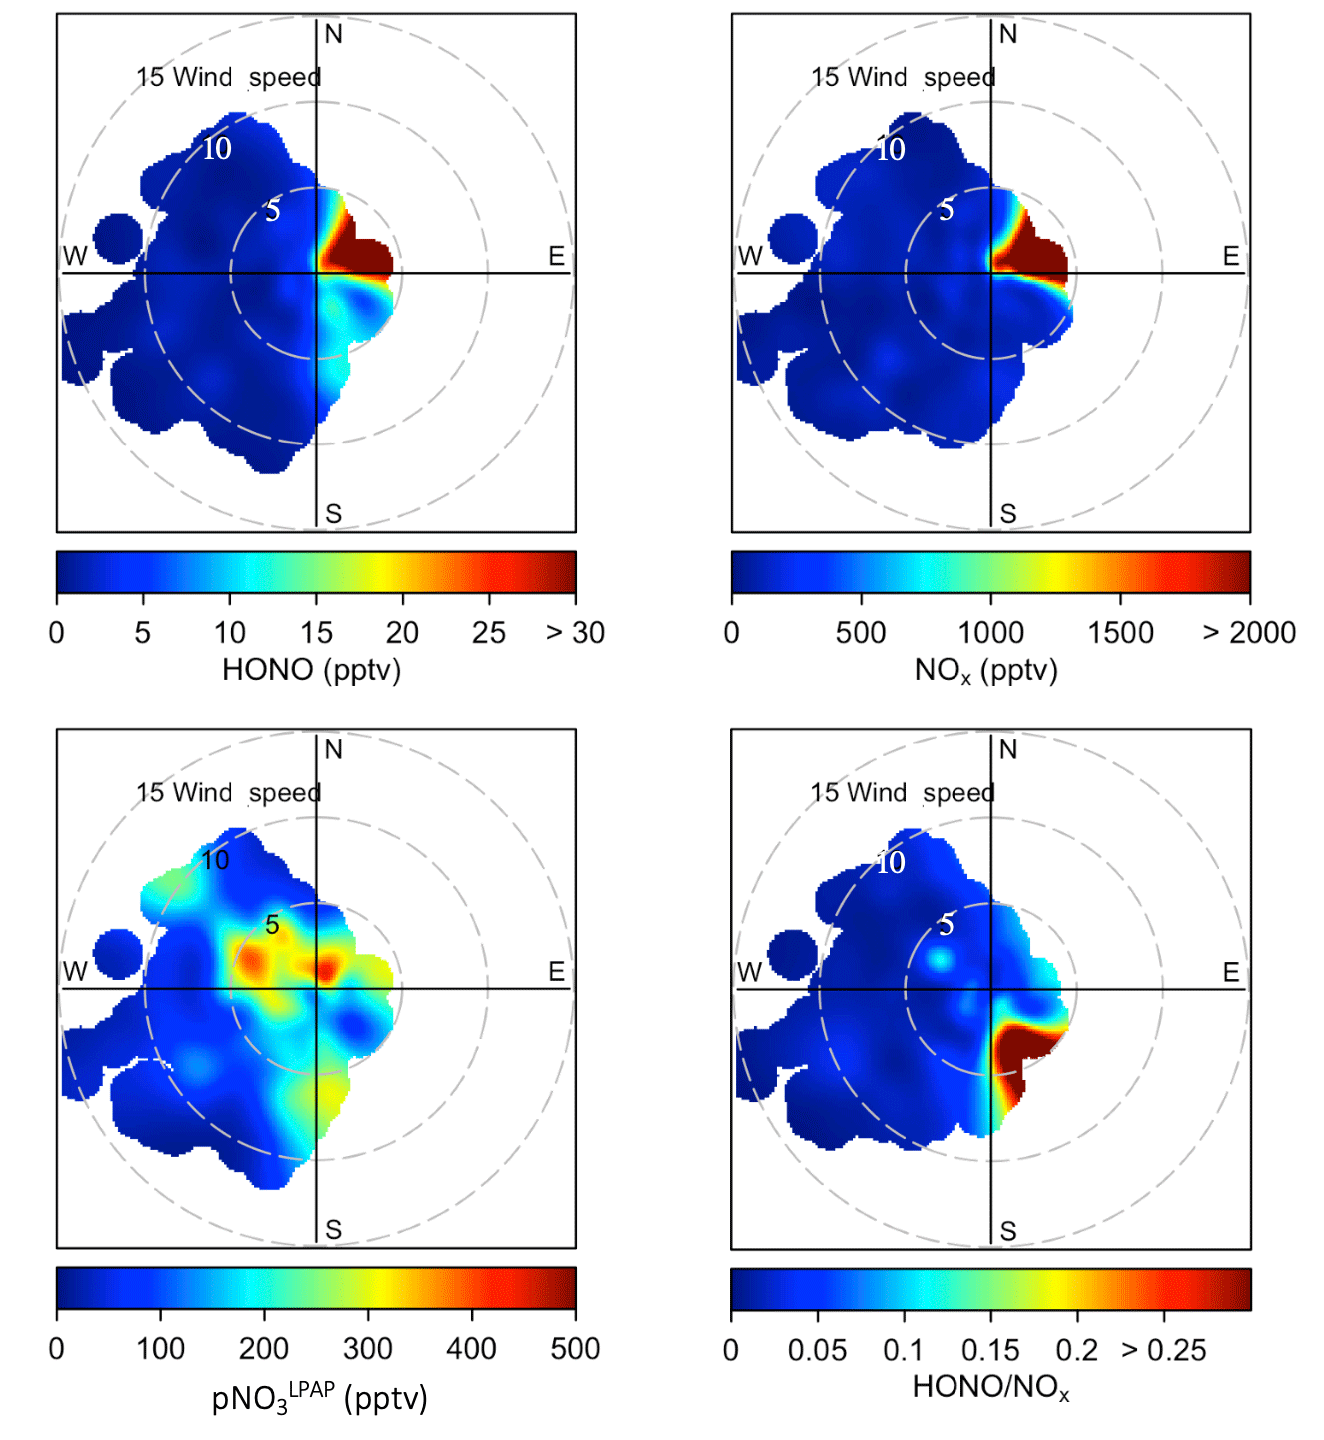
Figure 2Bivariate polar plots showing the joint wind speed and wind direction dependences of HONO, NOx, , and ratios during the two field campaigns in Bermuda. Data measured during the spring and the summer seasons were combined to generate these polar plots. The color scales represent HONO, NOx, and concentrations and ratios. The radial scale shows the wind speed in meters per second.
3.1 Impact from local emissions
At the THMAO, reactive nitrogen measurements were quite sensitive to directions of local winds. Figure S2 in the Supplement shows wind rose plots representing the distribution of wind direction and wind speed during the spring and summer field campaigns. Figure 2 represents bivariate polar plots (generated with openair – an R package for air quality data analysis; Carslaw and Ropkins, 2012) showing the joint wind speed and wind direction dependences of HONO, NOx, , and ratios. When prevailing winds blew from the northwest or southwest, clean marine air with relatively low concentrations of HONO and NOx was brought to the sampling site. It is also shown by Fig. 2 that urban and power plant plumes were transported to the THMAO site with northeasterly winds. These plumes, that originated from the city of Hamilton (i.e., capital city of Bermuda with busy road traffic and a nearby power plant) and the Royal Naval Dockyard (i.e., a harbor of cruise ships), contained HONO and NOx at substantial levels (Fig. 2). The highest concentrations of HONO and NOx reached 278 pptv and 48 ppbv, respectively. The pollution level within the plumes was comparable with that observed in polluted marine atmospheric environments at coastal sites in Hong Kong (Zha et al., 2014), on Tuoji Island in the eastern Bohai Sea, China (Wen et al., 2019), and on Saturna Island in British Columbia, Canada (Wojtal et al., 2011).

Figure 3Whisker plots comparing HONO, NOx, and concentrations and ratios in clean marine air, island-influenced air, and polluted plumes during the spring and the summer field campaigns in Bermuda. The thick lines represent median values, the boxes the 25th and 75th percentiles, and the whiskers the largest value within 1.5 times the interquartile range above the 75th percentile and the smallest value within 1.5 times the interquartile range below the 25th percentile.
Here we divided our measurement datasets into different categories based on three types of local influences: clean marine air (wind directions ranged from 210 to 330∘), island-influenced air (wind directions ranged from 0 to 180∘, [NO2] < 1 ppbv), and polluted plumes (wind directions ranged from 0 to 180∘; [NO2] ≥ 1 ppbv). It should be pointed out that the clean marine air was still affected by ship emissions, and thus spikes were removed from the dataset when averaging HONO and NO2 concentration in clean marine air to eliminate influences of emissions from passing ships. Average NO2 and HONO concentrations within the removed spikes were 1563 and 15 pptv, respectively. Whisker plots comparing HONO, NOx, and concentrations and ratios under different types of local influences are presented in Fig. 3. HONO and NOx concentrations in polluted plumes were higher than those in marine air by ∼ 1–3 orders of magnitude. The relative contribution from direct emissions to the high-level HONO may be substantial during the night or under low-light conditions but is expected to be relatively small within 4 h before and after solar noon. Estimated transport times from the city of Hamilton to the THMAO site were ≥ 1.4 h (with ∼ 10 km distance and ∼ 2 m s−1 wind speed) and were several times longer than the HONO photolytic lifetime (∼ 10–18 min under clear skies) from 09:30 to 17:30 during the day. Therefore, the observed HONO in the daytime plumes at the site was mostly produced during the air transport from emission sources to the THMAO site via gas-phase reaction (Reaction R2), heterogeneous reactions (Reaction R3) on aerosol and island surfaces, and maybe some other chemical sources.
The island-influenced air was the marine air mass that passed over less populated regions of the island and was thus not significantly impacted by anthropogenic emissions. The concentrations of HONO and NOx were higher in island-influenced air than in clean marine air (Fig. 3). It was also observed that the highest ratios (an indicator for the efficiency of HONO production) were found in island-influenced air. The underlying mechanism for this active HONO production is unknown. One possible explanation is that reactions occurring on various surfaces (e.g., the ground and vegetation surfaces) of the island contribute significantly to HONO production during the day (see Sect. 3.4 for detailed discussion).
Figure 3 also shows that local wind direction did not appear as a significant factor controlling pNO3 concentrations. It is concluded that pNO3 concentration was mainly controlled by the origins of the air masses and long-range transport (see Sect. 3.2) and was relatively independent from the impacts by local pollution emissions.
3.2 Impact from long-range transport
The THMAO, located on the western coast of the Bermuda island, is influenced by air masses that originated from different source regions (Moody and Galloway, 1988; Todd et al., 2003). Figure S3 in the Supplement shows a summary of the 7 d backward trajectories; the trajectories were calculated daily starting at local noontime using NOAA'S HYSPLIT model (https://www.ready.noaa.gov, last access: 4 May 2022). In the spring season, 23 out of 27 of the daily trajectories indicated northwesterly flows that originated from the North American continent. Exceptions were found from 3 to 7 May when the sampling site received aged marine air. In the summer season, the site was under the influence of the Bermuda high and received well-aged marine air above the Atlantic Ocean. On 7 September, the Bermuda high was disturbed as Hurricane Dorian traveled along the eastern coast of the United States. Calculated backward trajectories indicated fast-traveling air flows originated on the North American continent during 7–10 September.

Figure 4Diurnal profiles of HONO (pptv), NO2 (pptv), (pptv), and ratio in (a) clean marine air and (b) island-influenced air. The solid lines represent the median values, and the areas represent 25th to 75th percentiles.
In order to provide direct comparisons of data based on source regions of air masses, i.e., North American (NA) in the spring and North Atlantic Ocean (NAO) in the summer, we excluded measurement data collected during 3–7 May and 7–10 September, and generated whisker plots (Fig. S4 in the Supplement) comparing HONO, NOx, concentrations and ratios. The plots in Figs. 3 and S4 are almost identical, due to the fact that most of the air masses originated from North America in spring but circulated above the North Atlantic Ocean during the summer. It appears that the local emission and the island modification of the air masses controlled the levels of HONO and NOx and the ratio. However, the level of pNO3 was significantly higher in NA than in NAO as a result of long-distance transport of this species and was less dependent on how the air masses interact with the island. For HONO production efficiencies, no significant differences were found in the ratios between the two air mass categories (Fig. S4) under each type of local influences, as expected from HONO being a short-lived species controlled by in situ production and rapid loss (Elshorbany et al., 2009; Kleffmann et al., 2003; Zhang et al., 2009; Zhou et al., 2001, 2002). However, it should be noted that air flows that traveled a long distance could affect HONO chemistry under certain circumstances. In fact, significant changes in reactive nitrogen chemistry were observed on 7 and 8 September while aged North Atlantic air was replaced by a fast-traveling flow from the northeastern United States. Readers are referred to Sect. 3.5 for detailed discussions.
3.3 Diurnal variations
Diurnal cycles for HONO, NO2, concentrations and ratios in marine and island-influenced air are presented in Fig. 4 after binning measurement data into 1 h intervals. Urban plumes represented high-NOx air that were emitted from point sources (e.g., power plant emission) or mobile sources (e.g., road traffic emissions). Diurnal trends in polluted plumes are not shown in Fig. 4 because (1) temporal variability of reactive nitrogen species in polluted plumes was largely dependent on the source of the pollutant emission, and (2) data collected in polluted plumes are insufficient to represent diurnal cycles for a 24 h time period.
HONO concentrations exhibited distinct diurnal cycles in clean marine air (Fig. 4a), with maxima of ∼ 3 pptv around solar noon and minima near or below ∼ 1 pptv during the early morning hours before sunrise. The observed diurnal trends of HONO were in good agreement with those observed from the Cape Verde Atmospheric Observatory located in the tropical Atlantic boundary layer (Crilley et al., 2021; Kasibhatla et al., 2018; Reed et al., 2017; Ye et al., 2017a). At night, HONO concentrations reached steady-state concentrations of ∼ 1 and 0.7 pptv for the spring and summer season, respectively; these nocturnal HONO concentration steady states were consistent with previous reports in the clean marine boundary layer (Crilley et al., 2021; Kasibhatla et al., 2018; Reed et al., 2017; Ye et al., 2017a). In island-influenced air, HONO concentrations also exhibited diurnal cycles representing higher concentrations during the daytime than the nighttime. The observed diurnal cycles confirmed that HONO cycling is controlled by local photoproduction and rapid photolytic loss (Elshorbany et al., 2009; Kleffmann et al., 2003; Zhang et al., 2009; Zhou et al., 2001, 2002). During the summer season, the median value for noontime maxima of HONO concentrations was ∼ 13 pptv and was significantly lower than the median daytime maxima of ∼ 23 pptv for the spring season. This seasonal difference in HONO daytime maxima likely resulted from the low “background” levels of HONO daytime precursors including NOx and pNO3 in aged marine air that dominated our summer field campaign, as discussed in Sect. 3.2.
The concentrations of NO2 were generally higher during the day than during the night but with a bimodal distribution pattern that peaks in the morning and the evening hours (Fig. 4), which is different from a previously reported monomodal pattern of NO2 that peaked around solar noon (Reed et al., 2017; Ye et al., 2017a). This bimodal distribution pattern, which was more distinct in island-influenced air than in marine air and also more distinct in spring than in summer, was likely due to the increases in marine traffic and sporting boat activity in the waters off Bermuda western shore during the westerly air flow; the observed NO2 peaks coincided with the local morning and evening traffic rush hours during the island-influenced periods, with a possible 1–2 h transport time delay from more populated areas. It is interesting to point out that the patterns of HONO and NO2 were highly different during the day, suggesting that NO2 was unlikely a major HONO precursor in the background air masses when NOx concentration was below 1 ppbv.
pNO3 is known as another important HONO precursor (Ye et al., 2016b, 2017b, 2018). In both clean marine air and island-influenced air, we observed significant seasonality and no clear diurnal cycles regarding pNO3 concentrations, confirming the importance of long-range transport contribution to pNO3 concentrations, as discussed in Sect. 3.2.
The plateaus of HONO concentration and ratio consistently occurred in the daytime around solar noon (± 3 h) under all types of local influences, indicating the existence of active daytime photochemical HONO sources to compensate for the rapid photolytic loss of HONO (Oswald et al., 2015; Zhou et al., 2007). The daytime ratios were ∼ 0.04 and 0.10 in clean marine air and island-influenced air, respectively. The significantly higher ratios in island-influenced air are indicative of a significant contribution of HONO by heterogeneous processes occurring on island surfaces. Readers are referred to Sect. 3.4 for detailed discussion regarding factors that affected the daytime chemistry of HONO.
During the nighttime, we observed pseudo-steady-state concentrations of HONO in the marine atmosphere (Fig. 4). Nighttime steady states in HONO concentrations were previously reported in a clean (Crilley et al., 2021; Kasibhatla et al., 2018; Reed et al., 2017; Ye et al., 2017a) and polluted marine environment (Wojtal et al., 2011). Several recent research works showed nighttime HONO accumulations in polluted marine environments (Wen et al., 2019; Wojtal et al., 2011; Yang et al., 2021; Zha et al., 2014). With higher NO2-to-HONO conversion rates and higher ratios in the air masses passing over sea surface than land surface (Zha et al., 2014), the NO2 heterogeneous reaction on the sea surface microlayer has been proposed to be the nighttime HONO source in the nocturnal polluted MBL. However, we did not observe any nighttime HONO accumulation in the MBL at the THMAO site in either clean marine air or the island-influenced air. Furthermore, the ratios were lower in the clean marine air (< 0.02) than in the island-influenced air (< 0.06), contradicting the earlier reports. The lack of nighttime HONO accumulation and the significantly lower HONO concentrations and ratio during the night than the day suggest the existence of a nighttime HONO sink in the absence of its photolytic loss, i.e., the dry deposition of HONO onto the ocean surface. It is therefore concluded that the ocean surface is a net HONO sink in the clean MBL.
Island-influenced air was a marine air mass that interacted with the land surfaces during its transit over the island before reaching the sampling site. The interaction time between the air mass and the island surface was in the range from less than 1 h to several hours, depending on the wind flow direction. A higher pseudo-steady-state HONO concentration was quickly reached during the day (Fig. 4) due to its strong photochemical source and fast photolytic loss. During the night, enhanced HONO accumulation from NO2 heterogeneous reactions on island surfaces occurred only during the relatively short time when the air mass was over the island. As a result, the nighttime HONO concentration and ratio in the island-influenced air would remain low but would be higher than those in the clean marine air (Fig. 4).
3.4 Daytime HONO budget
In the current section, we examine the daytime HONO budget (Eq. 1) using the data obtained during the day around solar noon, from 10:00 to 15:00 LT.
where PHONO and LHONO are the overall HONO production and loss rates (in pptv s−1), respectively. During the daytime, known HONO daytime formation sources (Elshorbany et al., 2010; Finlayson-Pitts et al., 2003; Ye et al., 2016b; Zhou et al., 2003) include NOx-related reactions (Reactions R2 and R3) (), the photolysis of HNO3 on surfaces (Reaction R4) (), and the photolysis of pNO3 (Reaction R5) ():
where Pother represents other unaccounted processes.
HONO photolysis (Lphotolysis) is the dominant HONO sink during the day. Minor HONO sinks include its reaction with OH (LHONO+OH) and its dry deposition (Ldeposition):
In a daytime photo-steady state, :
JHONO is the photolysis rate constant of HONO (s−1). kHONO+OH is the constant for the reaction between HONO and OH () obtained from Atkinson et al. (2004). In this section, a constant [OH] of 6 × 10⁶ is assumed for all of our daytime budget analyses. υHONO is the deposition velocity, which is set to a high value of 1 cm s−1 (Harrison et al., 1996; Stutz et al., 2002) and H the vertical transport distance. The value of H (i.e., 116 m) was calculated following Zhang et al. (2009), with an assumed turbulent diffusion coefficient Kz of 105 cm2 s−1 and a HONO photolytic lifetime of 670 s (11 min). The medians for calculated daytime Lphotolysis are 3.8 × 10⁻³, 2.4 × 10⁻², and 7.3 × 10⁻² pptv s−1 for clean marine air, island-influenced air, and polluted plumes, respectively. Lphotolysis is the dominant HONO sink during the day, accounting for ∼ 92 % of the HONO loss rate, and is ∼ 1 order of magnitude higher than LHONO+OH and Ldeposition. The medians for calculated daytime LHONO+OH are 9.1 × 10⁻⁵, 5.8 × 10⁻⁴, and 1.8 × 10⁻³ pptv s−1 for clean marine air, island-influenced air, and polluted plumes, respectively. The medians for calculated daytime Ldeposition are 2.6 × 10⁻⁴, 1.4 × 10⁻³, and 4.3 × 10⁻³ pptv s−1 for clean marine air, island-influenced air, and polluted plumes, respectively.
3.4.1 Polluted plumes
NOx-related processes, including the gaseous reaction between NO and OH (Reaction R2) and the heterogeneous production from NO2 (Reaction R3), were the most well-studied HONO sources during the daytime (e.g., Elshorbany et al., 2010; Finlayson-Pitts et al., 2003; He et al., 2006; Kleffmann et al., 1998; Villena et al., 2011a). However, chemical kinetics data on the relevant reactions in the MBL were scarce and thus not sufficient for quantitative analyses of the HONO daytime budget. Nighttime HONO accumulation, commonly used to estimate the net NO2 to HONO rates in marine atmospheric environments (Wen et al., 2019; Yang et al., 2021; Zha et al., 2014), was not observed in the present study (see Sect. 3.3). Therefore, we chose to evaluate the role of NOx as a daytime HONO source by examining the NOx–HONO relationship in the high-NOx plume, where NOx is the dominant precursor via Reactions (R2) and (R3).
Figure 5a indicates that HONO concentration increased with [NOx], as expected from NO and NO2 being HONO precursors. It was also shown that the ratio decreased with [NOx] (Fig. 5b) due to the decreasing relative contribution from other HONO-formation mechanisms. With the increase in NOx concentration in the pollution plumes, the NOx-related processes became the dominant HONO precursor, leading to a stabilization in the ratio at [NOx] > 4 ppbv (Fig. 5b). In the daytime plumes ([NOx] > 4 ppbv, 10:00–15:00), HONO concentrations were found to be strongly correlated with [NOx] (slope = 0.0092, R2 = 0.70), as highlighted within the black circle in Fig. 5a. The slope of 0.0092 in the [HONO]–[NOx] plot agrees well with the stabilized ratio displayed in Fig. 5b. Constant ratio of 0.0092 was then used to estimate the efficiency of HONO production through NOx-related reactions:
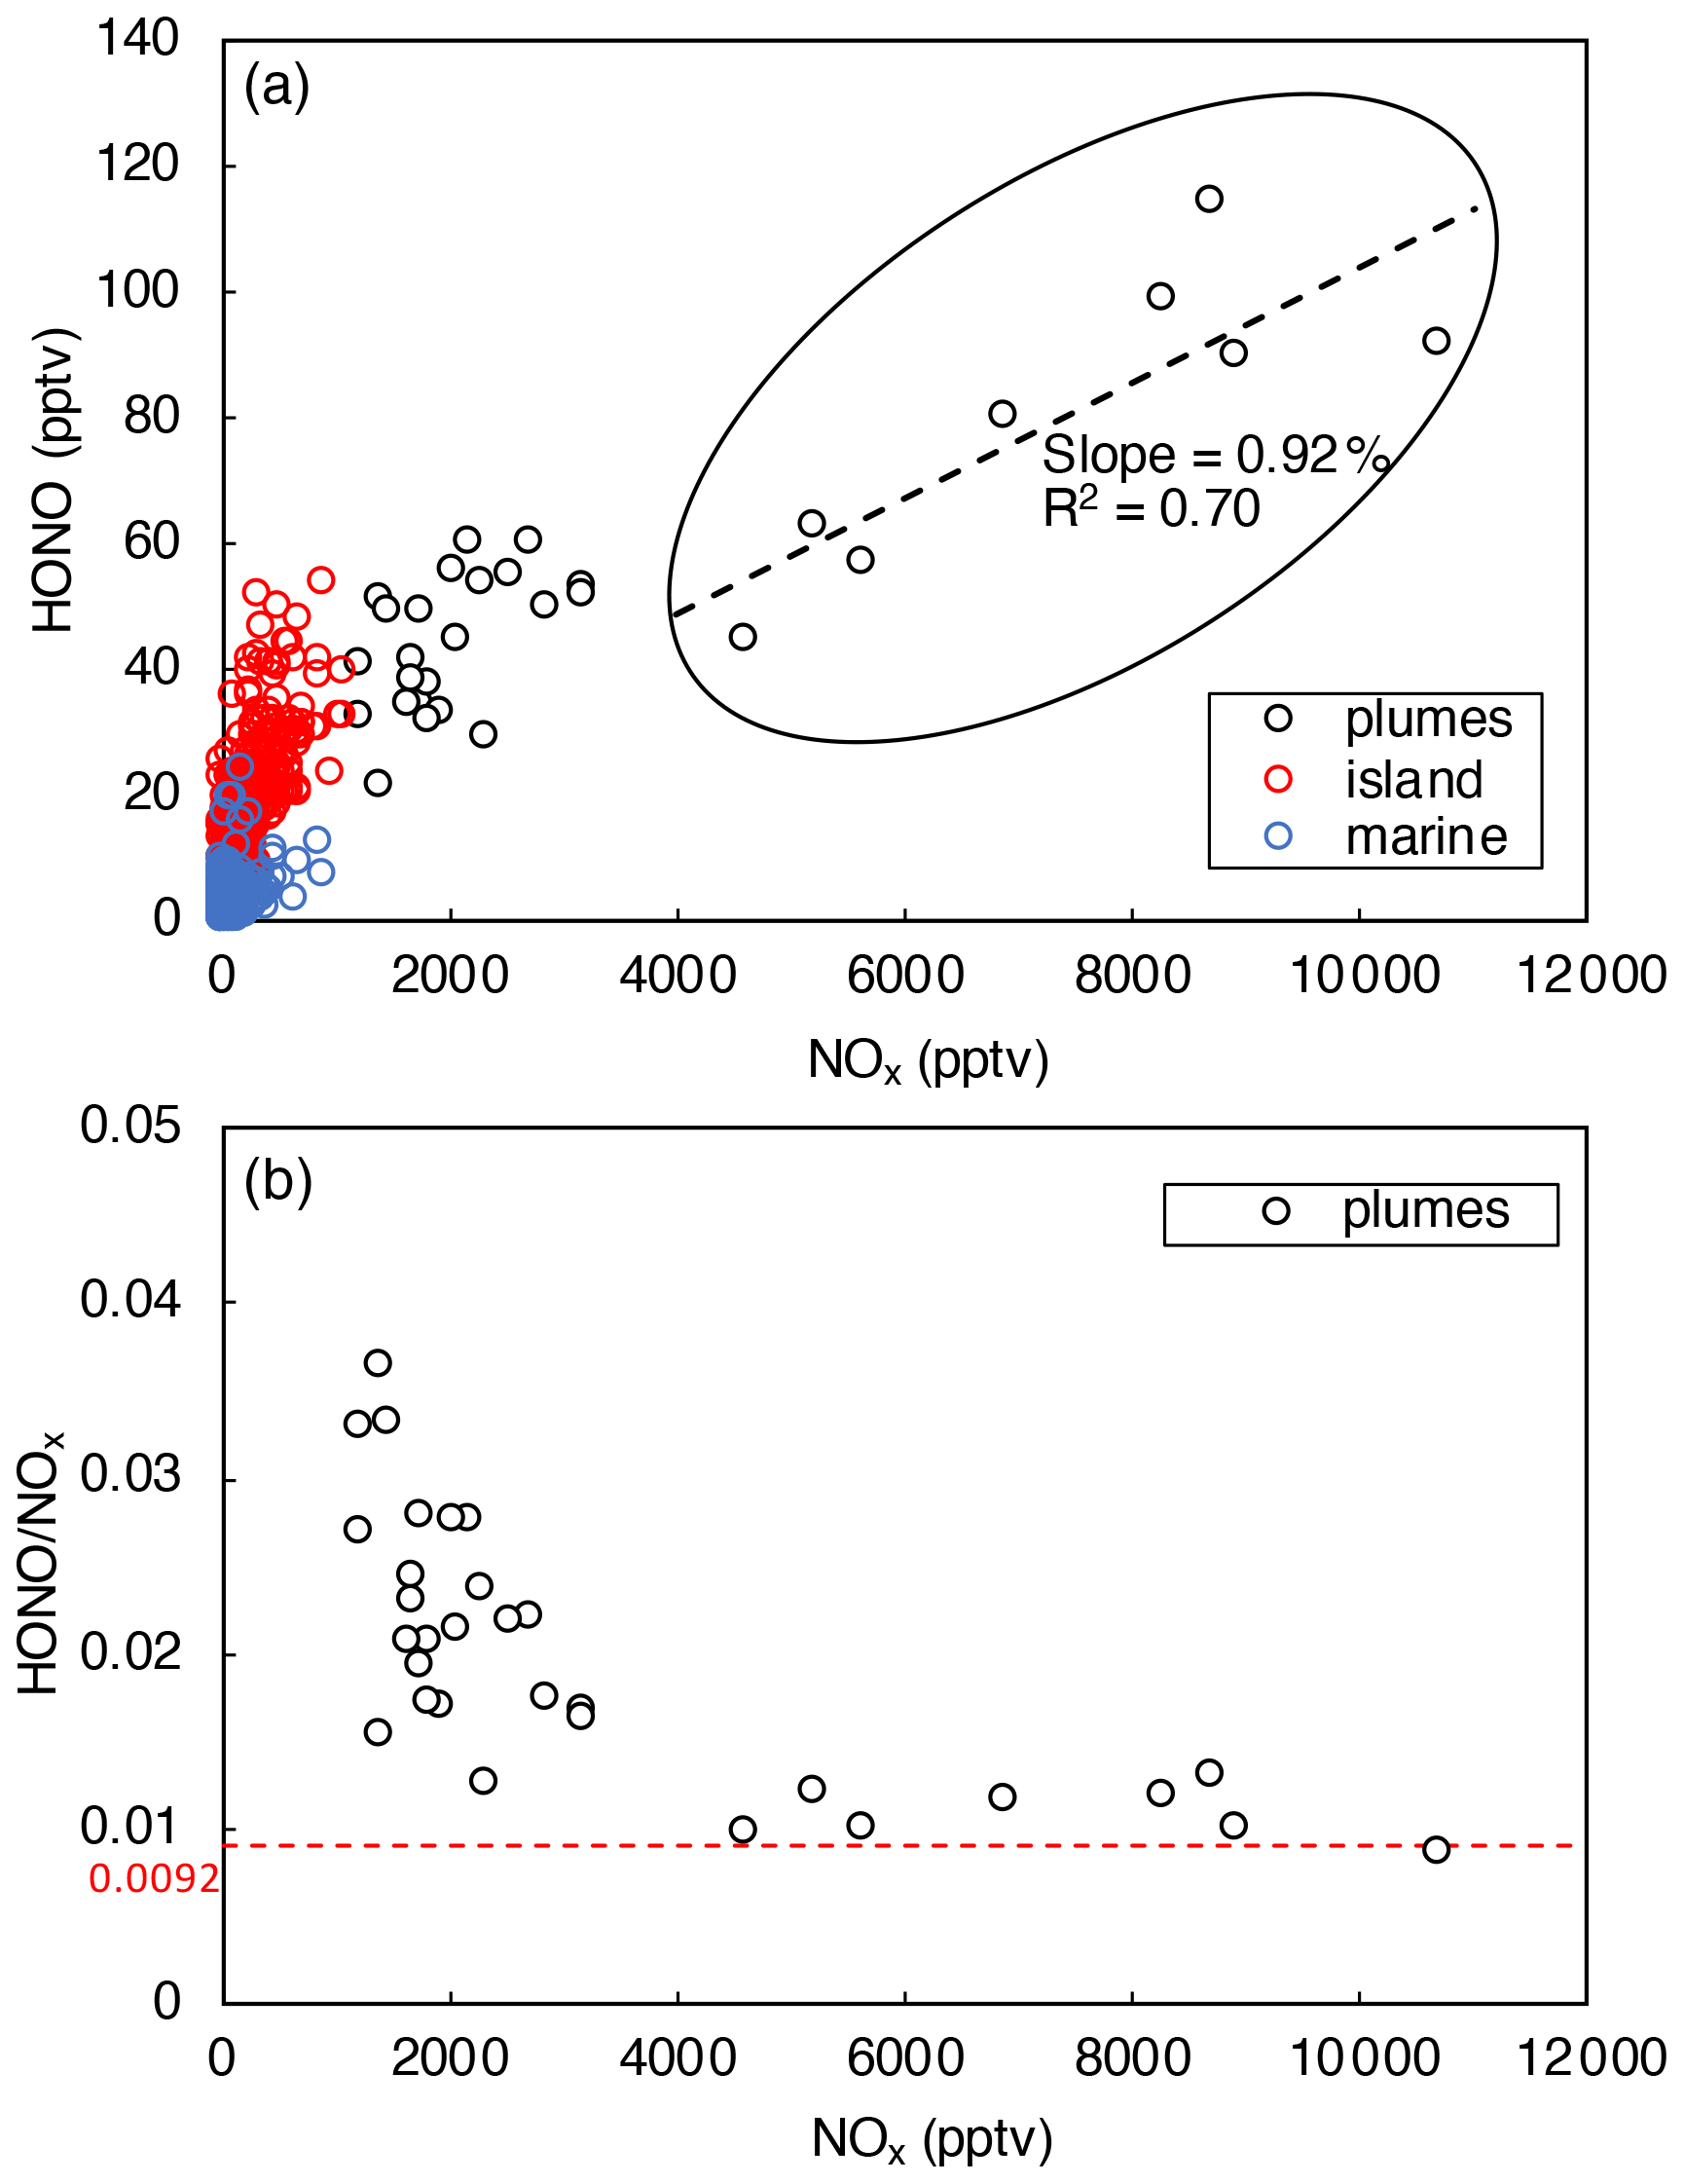
Figure 5HONO concentrations plotted against NOx concentration during daytime from 10:00 to 15:00. Data were divided into three categories (i.e., polluted plumes, island-influenced air, and clean marine air) based on local wind direction and NO2 concentrations. The dashed black line in (a) represents the best fits of linear regression between HONO and NOx in polluted plumes (0 < wind direction < 180∘, [NOx] > 4 ppbv). The dashed red line in (b) indicates where .
The values are calculated for polluted plumes with [NOx] > 4 ppbv. The median daytime value is 8.4 × 10⁻² pptv s−1, which is nearly sufficient to compensate for the daytime HONO loss of 9.4 × 10⁻² pptv s−1 within our measurement uncertainties.
In polluted plumes with [NOx] < 4 ppbv, the ratio increases with lowering NOx (Fig. 5b), and the calculated by Eq. (5) fails to fully account for the HONO production budget needed to compensate for the rapid HONO loss rates, LHONO. The HONO production rate that is uncounted by NOx-related reactions (Pmissing) was calculated using the following equation:
The median Pmissing value is of 3.7 × 10⁻² pptv s−1 in polluted plumes with [NOx] < 4 ppbv, which accounts for 56 % of the median HONO production rates needed to counter HONO loss rates. The daytime missing HONO source was commonly reported by previous field studies in forested, marine, and urban environments (e.g., Elshorbany et al., 2009; Oswald et al., 2015; Su et al., 2011; Ye et al., 2016b), reflecting the source strength of HONO production from processes other than NOx reactions, such as pNO3 and surface HNO3(ads) photolysis. In this work, budget analyses for and were attempted for clean marine air (see Sect. 3.4.2) and island-influenced air (see Sect. 3.4.3), not for polluted plumes, since pNO3 and HNO3(ads) photolysis is expected to be more important as HONO precursors in low-NOx environments than high-NOx environments.
3.4.2 Clean marine air
For clean marine air coming directly over the ocean, the ocean surface is likely a net HONO sink due to high solubility of HONO in alkaline seawater. The HONO production efficiencies through NOx-related processes were expected to be lower in the air mass in contact with the ocean surface than that over the island. Therefore, calculated using Eq. (5) is expected to overestimate HONO production rate through NOx-related processes in clean marine air and the following equations are used to estimate the HONO production rates through Reactions (R2) and (R3):
where kNO+OH is the reaction rate constant between NO and OH obtained from Atkinson et al. (2004). For Eq. (8), is calculated as
where is the mean molecular speed of NO2, is the surface to volume ratio, and is the uptake coefficient of NO2 on aerosol surfaces. A ratio of 5 × 10⁻⁵ m−1 is used, based on 20 µg m−3 of 1 µm sea-salt aerosol particles. An upper-limit value of 2 × 10⁻⁵ is also used, taking into account the photo-enhancement of HONO formation through heterogeneous reaction of NO2 (Li et al., 2010; Stemmler et al., 2006). The calculated medians for and are 8.9 × 10⁻⁴ and 5.9 × 10⁻⁶ pptv s−1 in clean marine air, respectively, which only account for minor fractions (21 % and 0.14 %, respectively) of the median HONO production rate needed to counter the HONO loss rate. , defined here as the sum of and , is estimated to be 9.0 × 10⁻⁴ pptv s−1 in clean marine air and is lower than the 1.2 × 10⁻³ pptv s−1 calculated using Eq. (5), confirming that HONO production efficiencies through NOx-related processes are lower in air mass over the ocean surface than that over the island.
In clean marine air, ground-surface related reactions are absent, and pNO3 might serve as an important HONO precursor that explains its missing daytime source. Various research works, including those conducted in the field (Ye et al., 2016b, 2018) and the laboratory (Ye et al., 2017b), reported significant enhancement in the photolysis rate constant of particulate nitrate () compared to that of gaseous nitric acid (). To date, the largest dataset for was reported by Ye et al. (2017b), which included experimental results for aerosols collected from various environments, including “ground” samples from rural, urban, and remote mountain areas, as well as “aloft” samples from the troposphere over the southeastern United States. For clean marine environments, Ye et al. (2016b) reported a 150–300-fold enhancement in pNO3 photolysis relative to HNO3 photolysis based on experimental data for a single aerosol sample collected on an aircraft during a research flight to the Atlantic Ocean off North and South Carolinas. However, it is possible that such a high enhancement factor (EF) cannot be extrapolated to a larger geographical scale (e.g., the global oceanic environments), since several reactive nitrogen chemistry models suggested that better approximation for reactive nitrogen cycling is achieved when pNO3 photolysis is assumed to be moderately enhanced (e.g., ∼ 10–25 times higher) relative to the photolysis of HNO3 (Kasibhatla et al., 2018; Reed et al., 2017; Romer et al., 2018; Ye et al., 2017b). In order to evaluate the rate of daytime HONO production from pNO3 photolysis () in clean marine air of Bermuda, we assume it to account for 100 % of the Pmissing and calculate an upper-limit enhancement factor for pNO3 photolysis leading to HONO production relative to HNO3 photolysis (EF∗):
where is the gaseous nitric acid photolysis rate constant, and is the particulate nitrate concentration determined from the aerosol samples collected on Teflon filters. Pmissing is calculated using Eq. (6), and is defined as the sum of and in clean marine air. The median value for Pmissing is 3.3 × 10⁻³ pptv s−1 in clean marine air. The median value and the 25th to 75th percentiles of the calculated EF∗ are 29, 20, and 43, respectively. It should be noted that HONO is assumed as the main product of pNO3 photolysis here. The calculated median EF∗ value agrees with several recent studies (Kasibhatla et al., 2018; Reed et al., 2017; Romer et al., 2018; Ye et al., 2017b) that pNO3 photolysis is moderately enhanced (EF range from 1 to 30) relative to the photolysis of HNO3 in the marine environments but is much lower than the EF between 150 and 300 reported by Ye et al. (2016b). The discrepancies may represent the differences in the environments encountered in these different studies, i.e., the lower MBL in this work and other previous ground-based studies (e.g., Kasibhatla et al., 2018; Reed et al., 2017) vs the upper marine boundary layer encountered in the aircraft study by Ye et al. (2016b). Significantly higher concentrations were observed in marine air at the THMAO site (medians of 284 and 120 pptv in spring and summer, respectively, Table 1) than in the upper marine boundary layer (∼ 50 pptv) (Ye et al., 2016b), with a much higher ratio, ∼ 6 in this work vs ∼ 1 reported by Ye et al. (2016b). Furthermore, supermicron particles were found to dominate the aerosol size distribution at the THMAO site, reflecting the younger age of marine aerosols generated by breaking waves (Keene et al., 2007). Laboratory studies have shown that pNO3 photolysis was enhanced by lower pNO3 concentration, smaller aerosol particle size, and higher acidity, resulting in photolysis rate constants that varied by 2 orders of magnitude (Bao et al., 2018; Ye et al., 2017b).
Laboratory-based photochemistry experiments were performed to determine pNO3 photolysis rate constants using aerosol samples collected on Teflon filters during the field campaigns. The determined rate constant (), normalized to the tropical noontime conditions at ground level with a of 7 × 10⁻⁷ s−1, varies from 1.0 × 10⁻⁶ to 1.8 × 10⁻⁵ s−1, with a mean value (± SD) of 3.2 (± 2.3) × 10−6 s−1 and a median value of 2.6 × 10⁻⁶ s−1. Our experimental results indicated that HONO is the main product of pNO3 photolysis; the determined average HONO : NO2 molar yield is . The measured enhancement factor (EFm) was calculated as
The EFm value varies from 1.5 to 26, with a mean value ( ± SD) of 4.6 ± 3.3 and a median of 3.7. The low EFm is similar to the recent reported EF values of ≤ 10 determined by Shi et al. (2021) for NaNO3 and NH4NO3 particles and the EF range of 1–30 reported by Romer et al. (2018) but much lower than the EF values for ambient aerosol particles collected in filters from various environments (Bao et al., 2018; Ye et al., 2016b, 2017b). While no categorial differences in EFm are observed for different types of air masses under the influence of island modification or long-range atmospheric transport, the measured EFm value decreases with pNO3 concentration, as previously reported (Ye et al., 2017b). Furthermore, the highest EFm values are found to be associated with air that represented high ratios, suggesting the enhancing effect of aerosol acidity, as observed by Bao et al. (2018). Additional details for the temporal variations and potential factors affecting pNO3 photolysis rate constants are to be discussed in a separate paper.

Figure 6Median values for the production and loss rates of HONO contributed by different processes in clean marine air from 10:00 to 15:00. The HONO production rate by NO2 heterogeneous reactions on aerosols contributed to < 0.2 % of the HONO production budget and therefore is not displayed in this figure. For the HONO production rate via pNO3 photolysis, in (a) was estimated with a constant EF∗ value of 29, and in (b) was estimated with the measured enhancement factor EFm.
Figure 6 illustrates the contributions of different production and loss pathways to the chemistry of HONO from 10:00 to 15:00 in clean marine air. In Fig. 6a, the upper limit of the HONO production rate by pNO3 photolysis () is 3.3 × 10⁻³ pptv s−1, assuming it accounts for 100 % of the Pmissing, and it can be calculated by Eq. (12) using an EF∗ of 29:
In Fig. 6b, the HONO production rate by pNO3 photolysis () is estimated using EFm:
The median of in clean marine air is 3.5 × 10⁻⁴ pptv s−1, which only accounts for 8 % for the total production budget of HONO during the daytime. Other unknown HONO formation processes are needed to make up about 70 % of the daytime HONO production budget in this scenario.
The large discrepancy between EFm and EF∗ might result from a bias in photolysis rate constants determined in the laboratory using stored marine aerosol samples collected on Teflon filters. The sampling and storage may alter the physical and chemical properties of the sea-salt aerosols, such as aggregation of particles and deprotonation of nitrate, resulting in the lower nitrate photoreactivity compared to pNO3 in the ambient aerosol particles in a real marine atmospheric environment. Therefore, calculated using EF∗ and calculated using EFm should be considered as the upper-limit and lower-limit estimates for HONO production rates by pNO3 photolysis, respectively.
3.4.3 Island-influenced air
For island-influenced air, we identified a large extra daytime HONO source (Pextra) that is not accounted for by the combined sources of , , and via Eqs. (7), (8), and (12), respectively. The calculated medians for , , and in island-influenced air are 2.6 × 10⁻³, 2.0 × 10⁻⁵, and 2.6 × 10⁻³ pptv s−1, respectively. The median value of Pextra is 2.0 × 10⁻² pptv s−1, about 79 % of the HONO daytime production budget of 2.5 × 10⁻² pptv s−1 in island-influenced air. While (i.e., the upper-limit estimate of HONO production rate via pNO3 photolysis) accounts for ∼ 79 % of HONO production in clean marine air, it accounts for ∼10 % in the island-influenced air masses. The remaining imbalances in the HONO budgets suggest that there were other mechanisms that were important in the formation of HONO during the day.
In air masses in contact with the island surface, ground-related processes might play major roles in the daytime production of HONO. Heterogeneous NO2 reaction on island surfaces (ground, buildings, and forest) via Reaction (R3) leads to HONO formation ():
where is the rate constant for NO2-to-HONO conversions via Reaction (R3):
where is the uptake coefficient of NO2 on ground surfaces. A value of 0.017 m−1 was calculated with an effective surface area of 2 m2 per geometric surface area and an air column height (H) of 116 m. The value of H was calculated following Zhang et al. (2009), assuming a turbulent diffusion coefficient Kz of 105 cm2 s−1 and a HONO photolytic lifetime of 670 s (11 min). is set as 2 × 10⁻⁵, which is an upper-limit value suggested by Stemmler et al. (2006) taking into account potential photo-enhancement. The calculated median of in island-influenced air is 7.0 × 10⁻³ pptv s−1 and accounts for 28 % of the daytime HONO production budget in island-influenced air masses. Figure 7 illustrates the contributions of different production and loss pathways in the daytime HONO budget from 10:00 to 15:00 in island-influenced air. contributes to < 0.1 % of the HONO production budget and therefore is not displayed in Fig. 7. The combined HONO production () accounts for only ∼ 1.2 × 10⁻² pptv s−1 or ∼ 48 % of HONO production rate needed to compensate for the HONO loss rate of ∼ 2.5 × 10⁻² pptv s−1 (Fig. 7).
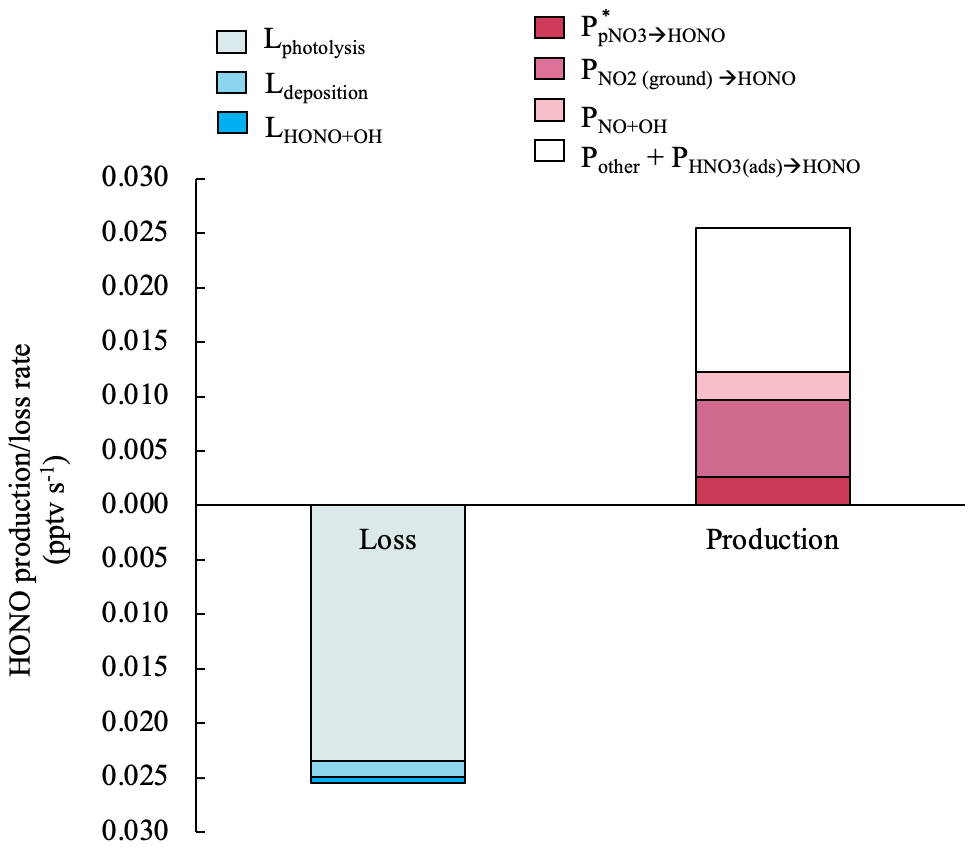
Figure 7Median values for the production and loss rates of HONO contributed by different processes in island-influenced air masses from 10:00 to 15:00. The HONO production rate by NO2 heterogeneous reactions on aerosols contributed to < 0.1 % of the HONO production budget and therefore is not displayed in this figure.
The HONO production rate unaccounted by NOx-related processes and pNO3 photolysis is calculated as
The calculated was used in our estimation for the noontime HONO concentration that cannot be explained by NOx-related reactions and pNO3 photolysis ([HONO]unaccounted):
It is possible that a significant fraction of [HONO]unaccounted could be explained by photolysis of nitric acid/nitrate adsorbed (HNO3(ads)) on surfaces (e.g., the forest canopy). As suggested by previous field observations conducted in the forested, rural area of northern Michigan (Zhou et al., 2011) and northeastern New York (Zhou et al., 2003, 2007), HNO3(ads) photolysis played a dominant role as a HONO daytime source in a low-NOx environment. In this field study, island-modified air masses may interact with the island surfaces, especially the forest surfaces that half surround the sampling site at Tudor Hill. In the high-NOx plumes, NOx should be the dominant HONO precursor via Reactions (R2) and (R3). However, these high-NOx plumes picked up pollutants at point sources, such as power plant and cruise ships, and from small high traffic areas, such as the city of Hamilton, and only accounted for a small fraction of air masses modified by the island. For the majority of the island-influenced air masses, NOx concentration was relatively low (≤ 1 ppbv), and the photolysis of nitric acid/nitrate adsorbed (HNO3(ads)) on island surfaces may be an important HONO source, resulting in higher ratios than those observed in high-NOx polluted plumes.
When [HONO]unaccounted is plotted against the averaged HNO3 concentration over the prior 24 h ([HNO3]ave, a proxy for HNO3(ads) loading on the island surfaces), a significant and positive correlation is found (R2 = 0.50; Fig. 8), suggesting that HNO3(ads) is likely an important precursor of HONO during the daytime. The nitric acid photolysis on the surface could potentially contribute to a significant portion of the remaining HONO daytime production budget (i.e., ∼ 1.3 × 10⁻² pptv s−1) that is not accounted for by the contributions from NOx-related reactions and pNO3 photolysis in island-influenced air masses.

Figure 8HONO concentration unaccounted for by NOx-related processes and pNO3 photolysis ([HONO]unaccounted, in pptv, averaged for each day from 10:00 to 15:00) plotted against HNO3 concentration averaged for 24 h prior to local noontime ([HNO3]ave, in pptv) in island-influenced air with [NO2] < 1 ppbv.

Figure 9Time series plots of HONO, NOx, , O3, HONO photolysis rate constant (JHONO), wind direction and wind speed from 10 to 12 May 2019. The light blue boxes highlight highly polluted periods when the Tudor Hill site received urban pollutants. The pink box highlights a short-term pollution plume that resulted from ship emissions.
3.5 Case studies
Two case studies are presented here to show how the temporal variations in HONO can be caused by the various factors discussed in the previous sections.
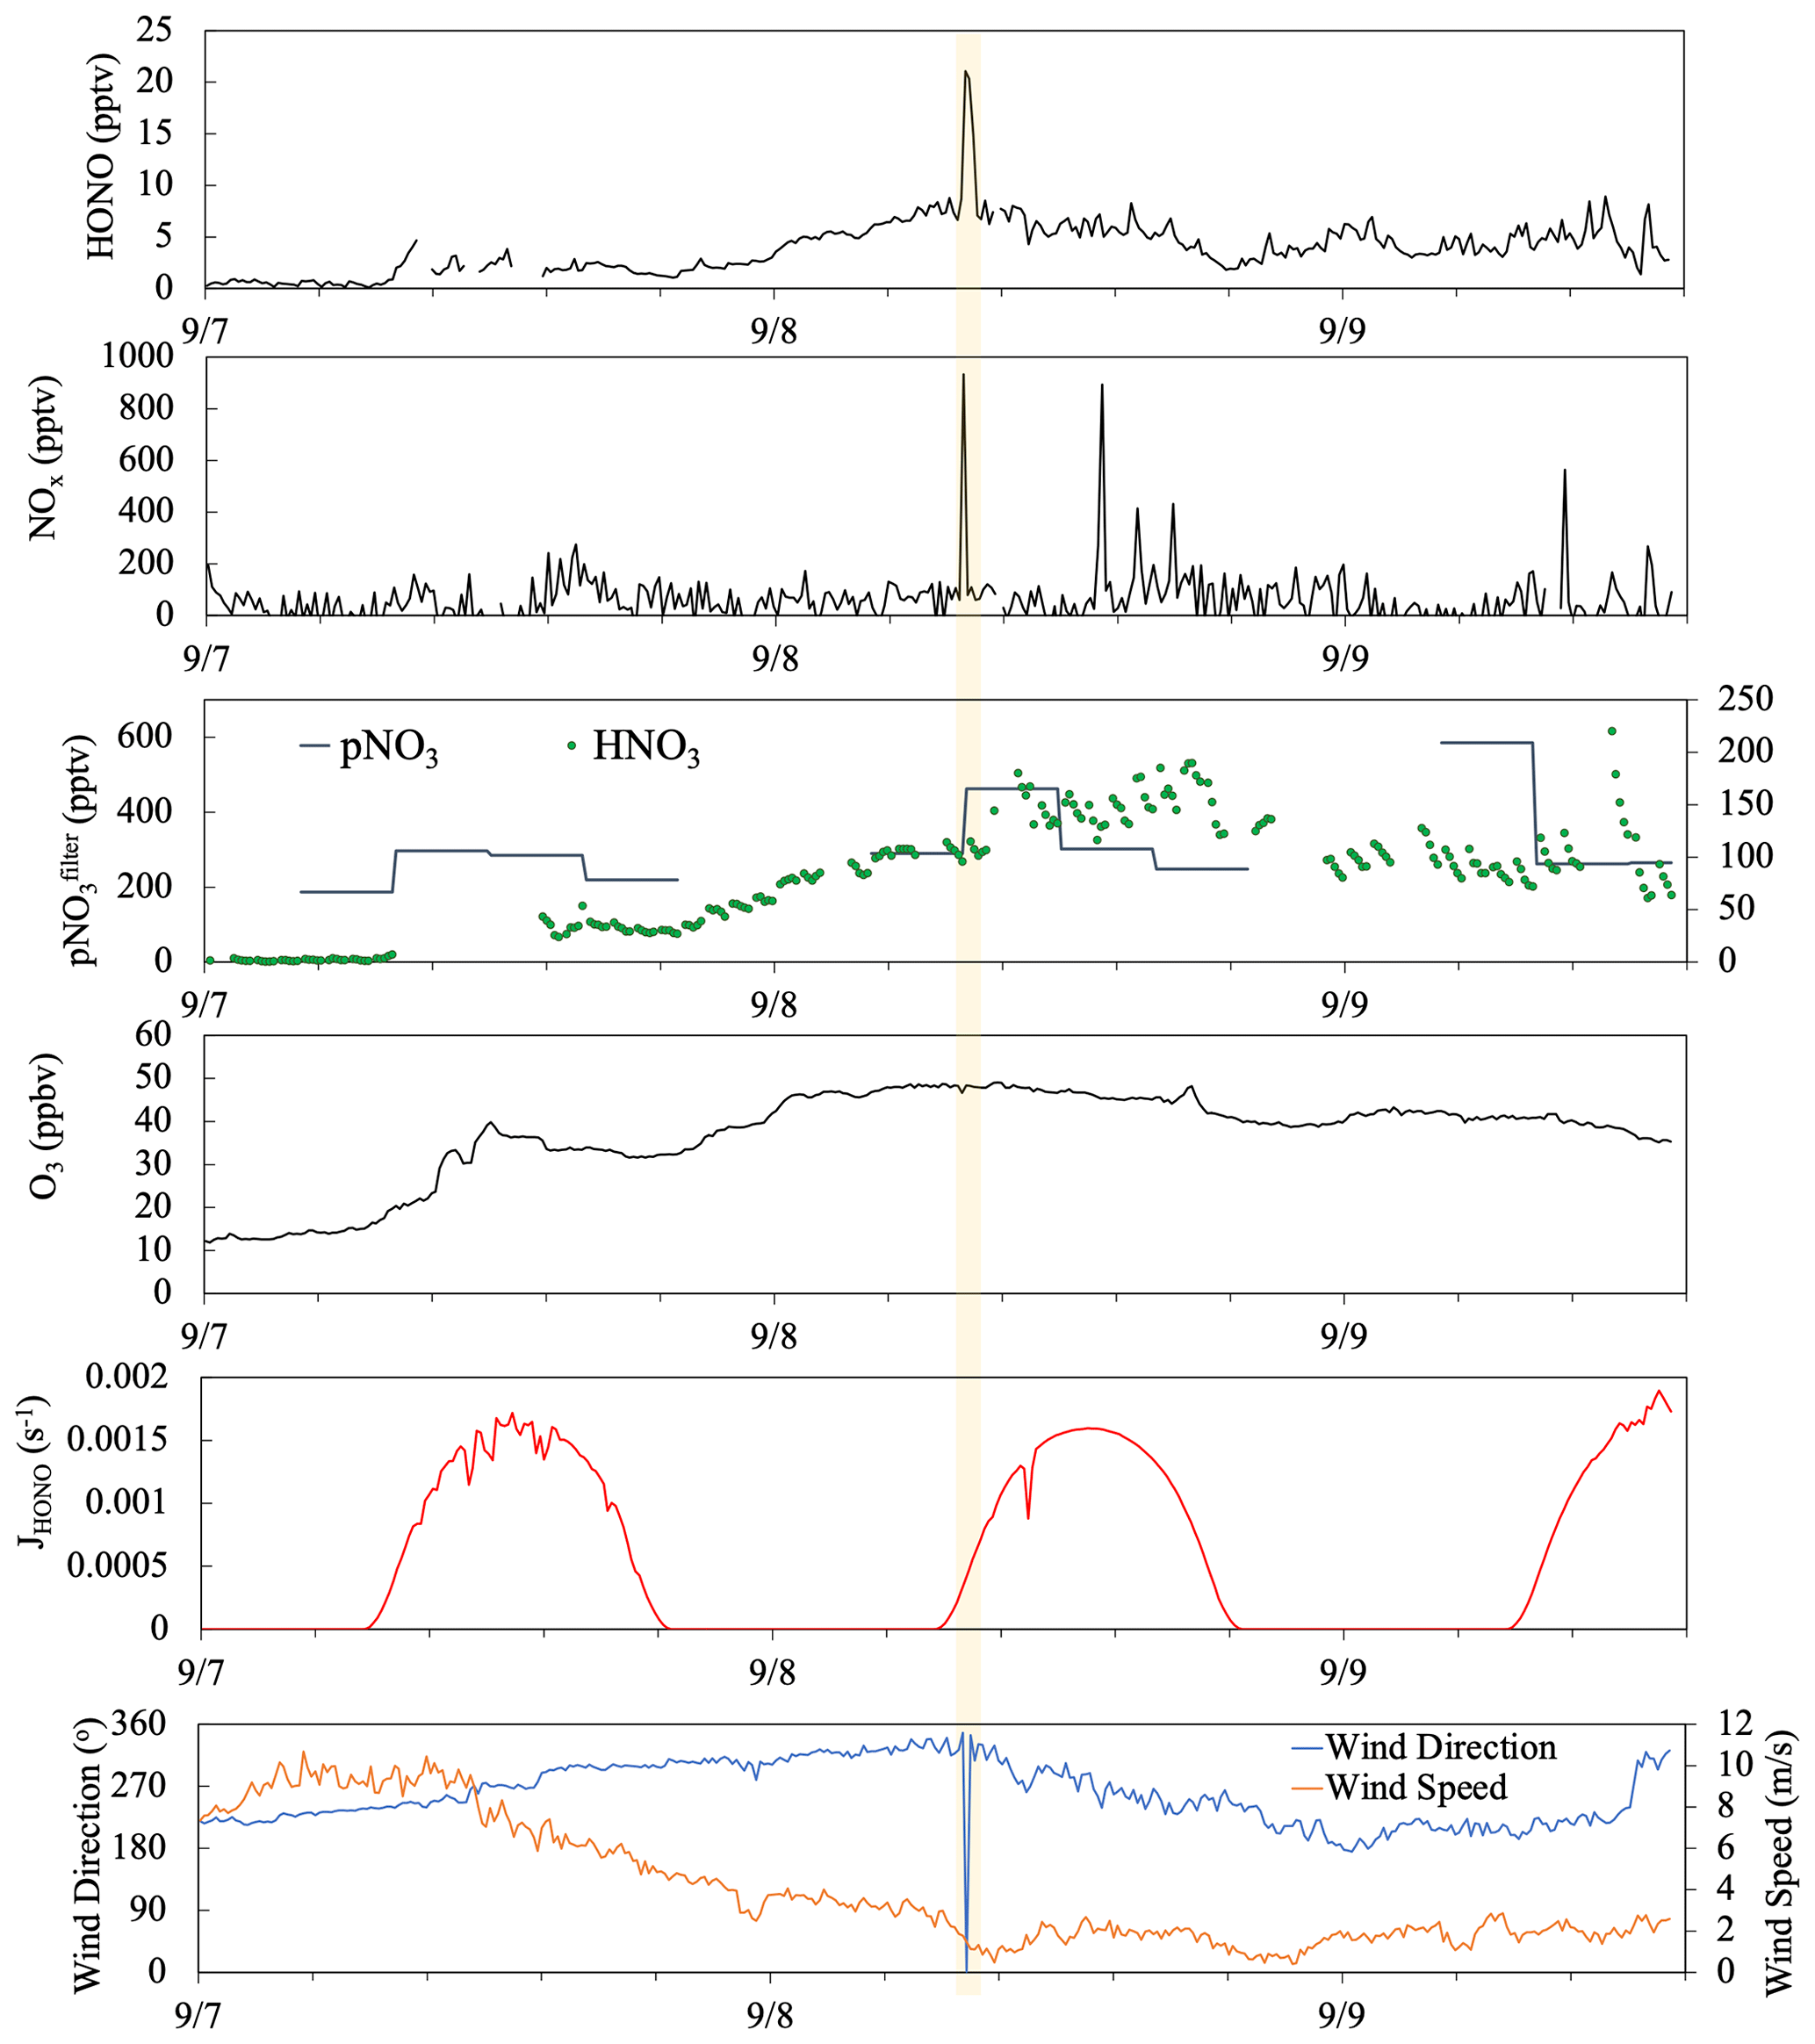
Figure 10Time series plots of HONO, NOx, , HNO3, O3, HONO photolysis rate constant (JHONO), wind direction, and wind speed from 7 to 9 September 2019. The yellow box highlights a short-term pollution plume that resulted from a sudden shift in local wind direction.
Figure 9 displays a case study illustrating the temporal variations of HONO in response to various types of local influences during the period of 10–12 May. From midnight on 10 May to 18:00 on 11 May, the site was dominated by local winds from the east and was thus under the island's influence. The observed NOx levels were sensitive to wind direction, higher in air masses from the northeastern quarter with a power plant, major roads, and population centers and lower in air masses from southeastern quarters. In polluted plumes (highlighted in blue), the average NOx concentration was 9 ppbv and the highest value reached 27 ppbv; the elevated NOx levels were associated with scavenging of O3. The HONO concentration in these high-NOx plumes also reached the highest of 63 pptv in the selected period. The average ratio was 0.6 % and 0.7 % in the high-NOx plumes before midnight and around sunrise of 11 May, respectively. These low ratios were close to the published emission ratio of 0.79 % (Liu et al., 2019), suggesting that direct anthropogenic emission was the dominant HONO source within the nighttime plume. It is interesting to point out that similar ratios were also observed in the smaller plume observed around 09:00 on 11 May, despite significant HONO photolytic loss during the air mass transport, indicating the photochemical enhancement in HONO formation from Reactions (R2)–(R5). During the after-midnight hours (00:30–05:00) of 11 May, the NOx level was low, with an average of 62 pptv, due to the lack of active emission sources. However, the HONO level (5–15 pptv) and ratio (∼ 0.10) were higher than their typical nighttime values in the clean marine air, probably due to the delayed release of HONO from the heterogeneous NO2 reaction that occurred on island surfaces during the high-NO2 period a few hours earlier. From 18:00 on 11 May to the end of the selected period, the local wind shifted to a southwesterly and westerly direction, and the site started receiving marine air without modification by the island, with low HONO and NOx levels most of the time. There was a short period (highlighted in pink) showing elevated NOx attributed to ship emission but no HONO spike, suggesting the NOx-related reactions were not a major HONO source in the marine air without interacting with the island, likely due to the limited surface area for heterogeneous NO2 reactions in air masses over the ocean. The noontime ratios (∼ 0.04 on 12 May) that were higher than those in polluted plumes (< 0.02) support the argument that the photolysis of pNO3 (Reaction R5) was the main contributor to the daytime formation of HONO in clean marine air. The highest ratios (∼ 0.13) were observed near the solar noon of the island-influenced period from 10–11 May, reflecting active photochemical formation of HONO contributed via multiple mechanisms, including homogeneous and heterogeneous NOx (Reactions R2 and R3) and the photolysis of pNO3 associated with aerosols (Reaction R5) and HNO3 on the island surfaces (Reaction R4).
Figure 10 depicted a case study showing the impact of long-range air mass transport on the temporal distribution of reactive nitrogen species. During the selected period from 7–9 September, the site was dominated by the westerly flows (180∘ < wind direction < 360∘), and thus the sampling site mostly received the clean marine air. There was only one short period near 08:00 on 8 September (highlighted in yellow) showing elevated HONO and NOx concentrations attributed to the local emissions and island surface effect when local wind direction shifted briefly to the southeasterly direction. There were also a few spikes in NOx emitted from ships in the upwind sea lanes on 8 and 9 September but no HONO spikes due to the low surface area available for heterogeneous NO2 reactions in this air mass traveling over the ocean. During the summer field campaign, the air mass that traveled to the THMAO site was dominated by well-aged marine air above the Atlantic Ocean. Starting from the early afternoon of 7 September, Hurricane Dorian disturbed the Bermuda high when it traveled along the eastern coast of North America; the modeled backward trajectories indicate that the air mass arriving at the site during the period originated from the northeastern United States. The fast-traveling air flow from North America contained elevated levels of particulate nitrate (219–585 pptv) and O3 (29–49 ppbv) compared to those in aged marine air (average concentrations for and O3 were 127 pptv and 16 ppbv, respectively). During the air mass transition, we observed a strong increasing trend in HONO and HNO3 concentrations from the evening of 7 September to the early morning of 8 September. The rapid increase in HNO3 concentrations (from ∼ 7 to 110 pptv) during a 24 h period from 08:00 on 7 September to 08:00 on 8 September largely affected the partitioning of nitrate between the gas phase and the aerosol phase ( increased from 4 % to 25 %). An elevated daytime maximum in HONO concentration was found on 8 September (∼ 6 pptv, 3 times higher than the ∼ 2 pptv daytime HONO maximum on 7 September). The photoproduction efficiency of HONO from aerosols also changed; the average value of determined for aerosol samples collected on 8 September was 1.0 × 10⁻⁵ s−1, much higher than the summer average value of (i.e., 3.4 × 10⁻⁶ s−1). The HONO production efficiency from pNO3 photolysis appears to be enhanced by the acidity of the aerosols.
Large temporal variations in HONO concentrations were observed at the THMAO site in Bermuda during the spring and the summer of 2019, depending on the types of marine air masses and how the air masses interact with the island. High concentrations of HONO, up to 278 pptv, were found in the locally emitted high-NOx plumes. A ratio of 0.0092 is derived from the HONO–NOx correlation in the daytime high-NOx plumes and is used to estimate the HONO source strength from NOx-related reactions during the day. HONO concentrations were at low pptv and tens of pptv levels in the low-NOx marine air masses without and with island modification, respectively. Distinctive diurnal HONO variations were observed in both low-NOx marine air with or without island modification, with daytime plateaus and nighttime valleys. Such diurnal variation patterns suggest that HONO was produced by photochemical processes during the day and that ocean surface was likely a net HONO sink. The photolysis of pNO3, if moderately enhanced relative to HNO3 photolysis by a factor of 29, can explain the missing daytime HONO source after counting the contribution from NOx-related reactions in the clean marine air mass. The missing daytime HONO source accounts for the majority (∼ 79 %) of the overall daytime HONO budget of ∼ 4.2 × 10⁻³ pptv s−1 in clean marine air. To sustain the observed daytime HONO concentration in the low-NOx island-modified air mass, a large HONO source, ∼ 1.3 × 10⁻² pptv s−1, is required, in addition to the known HONO production sources from NOx and pNO3 precursors, 9.7 × 10⁻³ and 2.6 × 10⁻³ pptv s−1, respectively. It is likely that the photolysis of HNO3(ads) on the forest canopy and other island surfaces contributes significantly to this large missing HONO source in the low-NOx island-modified air mass. The concentrations of HONO and its precursors, NOx and pNO3, were higher in spring than in summer in the clean marine air masses, attributed to the fact that the air masses arriving at the site in the summer had circulated over the North Atlantic Ocean and were more aged than the air masses that traveled from the North American continent in the spring. The background concentrations of HONO precursors decreased as the air masses aged and thereby lowered the production rates of HONO.
Data can be downloaded from https://github.com/HONO-Bermuda-MBL/ (last access: 11 May 2022) and https://doi.org/10.5281/zenodo.6539716 (Elshorbany and Zhu, 2022) and are available upon request via xianliang.zhou@health.ny.gov.
The supplement related to this article is available online at: https://doi.org/10.5194/acp-22-6327-2022-supplement.
XZ and YFE designed the study. YZ, YW, and XZ performed the development, calibration, and deployments of the reactive nitrogen measurement systems. XZ led the field campaigns. YZ, YW, XZ, YFE, CY, MH, and AJP contributed to the data collection during the field campaigns. YZ conducted the photochemistry experiments, performed the data processing, and prepared the manuscript with inputs from all coauthors.
The contact author has declared that neither they nor their coauthors have any competing interests.
Publisher's note: Copernicus Publications remains neutral with regard to jurisdictional claims in published maps and institutional affiliations.
This research is supported by the National Science Foundation's Atmospheric Chemistry Program and Chemical Oceanography Program through grants AGS-1826989 (Xianliang Zhou), AGS-1826956 (Yasin Elshorbany), and OCE-1829686 (Andrew Peters) and by the Chinese National Natural Science Foundation through grant 41875151 (Chunxiang Ye). We thank Haider Khwaja and lab members at Wadsworth Center for providing instrumentation and laboratory supports.
This research has been supported by the Division of Atmospheric and Geospace Sciences (grant nos. AGS-1826989 and AGS-1826956), the Division of Ocean Sciences (grant no. OCE-1829686), and the National Natural Science Foundation of China (grant no. 41875151).
This paper was edited by Ralf Ebinghaus and reviewed by two anonymous referees.
Acker, K., Febo, A., Trick, S., Perrino, C., Bruno, P., Wiesen, P., Möller, D., Wieprecht, W., Auel, R., Giusto, M., Geyer, A., Platt, U., and Allegrini, I.: Nitrous acid in the urban area of Rome, Atmos. Environ., 40, 3123–3133, https://doi.org/10.1016/j.atmosenv.2006.01.028, 2006a.
Acker, K., Möller, D., Wieprecht, W., Meixner, F. X., Bohn, B., Gilge, S., Plass-Dülmer, C., and Berresheim, H.: Strong daytime production of OH from HNO2 at a rural mountain site, Geophys. Res. Lett., 33, L02809, https://doi.org/10.1029/2005GL024643, 2006b.
Atkinson, R., Baulch, D. L., Cox, R. A., Crowley, J. N., Hampson, R. F., Hynes, R. G., Jenkin, M. E., Rossi, M. J., and Troe, J.: Evaluated kinetic and photochemical data for atmospheric chemistry: Volume I – gas phase reactions of Ox, HOx, NOx and SOx species, Atmos. Chem. Phys., 4, 1461–1738, https://doi.org/10.5194/acp-4-1461-2004, 2004.
Bao, F., Li, M., Zhang, Y., Chen, C., and Zhao, J.: Photochemical aging of Beijing urban PM2.5: HONO production, Environ. Sci. Technol., 52, 6309–6316, https://doi.org/10.1021/acs.est.8b00538, 2018.
Carr, S., Heard, D. E., and Blitz, M. A.: Comment on “Atmospheric Hydroxyl Radical Production from Electronically Excited NO2 and H2O,” Science, 324, 336b, https://doi.org/10.1126/science.1166669, 2009.
Carslaw, D. C. and Ropkins, K.: openair – An R package for air quality data analysis, Environ. Model. Softw., 27–28, 52–61, https://doi.org/10.1016/j.envsoft.2011.09.008, 2012.
Crilley, L. R., Kramer, L. J., Pope, F. D., Reed, C., Lee, J. D., Carpenter, L. J., Hollis, L. D. J., Ball, S. M., and Bloss, W. J.: Is the ocean surface a source of nitrous acid (HONO) in the marine boundary layer?, Atmos. Chem. Phys., 21, 18213–18225, https://doi.org/10.5194/acp-21-18213-2021, 2021.
Elshorbany, Y. and Zhu, Y.: HONO-Bermuda-MBL/Public-data: Bermuda_MBL_V1.0.1 (Bermuda_MBL_V1.0.1), Zenodo [data set], https://doi.org/10.5281/zenodo.6539716, 2022.
Elshorbany, Y. F., Kurtenbach, R., Wiesen, P., Lissi, E., Rubio, M., Villena, G., Gramsch, E., Rickard, A. R., Pilling, M. J., and Kleffmann, J.: Oxidation capacity of the city air of Santiago, Chile, Atmos. Chem. Phys., 9, 2257–2273, https://doi.org/10.5194/acp-9-2257-2009, 2009.
Elshorbany, Y. F., Kleffmann, J., Kurtenbach, R., Lissi, E., Rubio, M., Villena, G., Gramsch, E., Rickard, A. R., Pilling, M. J., and Wiesen, P.: Seasonal dependence of the oxidation capacity of the city of Santiago de Chile, Atmos. Environ., 44, 5383–5394, https://doi.org/10.1016/j.atmosenv.2009.08.036, 2010.
Elshorbany, Y. F., Steil, B., Brühl, C., and Lelieveld, J.: Impact of HONO on global atmospheric chemistry calculated with an empirical parameterization in the EMAC model, Atmos. Chem. Phys., 12, 9977–10000, https://doi.org/10.5194/acp-12-9977-2012, 2012.
Finlayson-Pitts, B. J., Wingen, L. M., Sumner, A. L., Syomin, D., and Ramazan, K. A.: The heterogeneous hydrolysis of NO2 in laboratory systems and in outdoor and indoor atmospheres: An integrated mechanism, Phys. Chem. Chem. Phys., 5, 223–242, https://doi.org/10.1039/B208564J, 2003.
George, C., Strekowski, R. S., Kleffmann, J., Stemmler, K., and Ammann, M.: Photoenhanced uptake of gaseous NO2 on solid organic compounds: a photochemical source of HONO?, Faraday Discuss., 130, 195–210, https://doi.org/10.1039/B417888M, 2005.
Harrison, R. M., Peak, J. D., and Collins, G. M.: Tropospheric cycle of nitrous acid, J. Geophys. Res.-Atmos., 101, 14429–14439, https://doi.org/10.1029/96JD00341, 1996.
He, Y., Zhou, X., Hou, J., Gao, H., and Bertman, S. B.: Importance of dew in controlling the air-surface exchange of HONO in rural forested environments, Geophys. Res. Lett., 33, L02813, https://doi.org/10.1029/2005GL024348, 2006.
Kasibhatla, P., Sherwen, T., Evans, M. J., Carpenter, L. J., Reed, C., Alexander, B., Chen, Q., Sulprizio, M. P., Lee, J. D., Read, K. A., Bloss, W., Crilley, L. R., Keene, W. C., Pszenny, A. A. P., and Hodzic, A.: Global impact of nitrate photolysis in sea-salt aerosol on NOx, OH, and O3 in the marine boundary layer, Atmos. Chem. Phys., 18, 11185–11203, https://doi.org/10.5194/acp-18-11185-2018, 2018.
Keene, W. C., Maring, H., Maben, J. R., Kieber, D. J., Pszenny, A. A. P., Dahl, E. E., Izaguirre, M. A., Davis, A. J., Long, M. S., Zhou, X., Smoydzin, L., and Sander, R.: Chemical and physical characteristics of nascent aerosols produced by bursting bubbles at a model air–sea interface, J. Geophys. Res.-Atmos., 112, D21202, https://doi.org/10.1029/2007JD008464, 2007.
Kleffmann, J.: Daytime Sources of Nitrous Acid (HONO) in the Atmospheric Boundary Layer, ChemPhysChem, 8, 1137–1144, https://doi.org/10.1002/cphc.200700016, 2007.
Kleffmann, J., Becker, K. H., and Wiesen, P.: Heterogeneous NO2 conversion processes on acid surfaces: possible atmospheric implications, Atmos. Environ., 32, 2721–2729, https://doi.org/10.1016/S1352-2310(98)00065-X, 1998.
Kleffmann, J., Becker, K. H., Lackhoff, M., and Wiesen, P.: Heterogeneous conversion of NO2 on carbonaceous surfaces, Phys. Chem. Chem. Phys., 1, 5443–5450, https://doi.org/10.1039/A905545B, 1999.
Kleffmann, J., Kurtenbach, R., Lörzer, J., Wiesen, P., Kalthoff, N., Vogel, B., and Vogel, H.: Measured and simulated vertical profiles of nitrous acid—Part I: Field measurements, Atmos. Environ., 37, 2949–2955, https://doi.org/10.1016/S1352-2310(03)00242-5, 2003.
Kleffmann, J., Gavriloaiei, T., Hofzumahaus, A., Holland, F., Koppmann, R., Rupp, L., Schlosser, E., Siese, M., and Wahner, A.: Daytime formation of nitrous acid: A major source of OH radicals in a forest, Geophys. Res. Lett., 32, L05818, https://doi.org/10.1029/2005GL022524, 2005.
Li, G., Lei, W., Zavala, M., Volkamer, R., Dusanter, S., Stevens, P., and Molina, L. T.: Impacts of HONO sources on the photochemistry in Mexico City during the MCMA-2006/MILAGO Campaign, Atmos. Chem. Phys., 10, 6551–6567, https://doi.org/10.5194/acp-10-6551-2010, 2010.
Li, S., Matthews, J., and Sinha, A.: Atmospheric Hydroxyl Radical Production from Electronically Excited NO2 and H2O, Science, 319, 1657–1660, https://doi.org/10.1126/science.1151443, 2008.
Li, X., Rohrer, F., Hofzumahaus, A., Brauers, T., Häseler, R., Bohn, B., Broch, S., Fuchs, H., Gomm, S., Holland, F., Jäger, J., Kaiser, J., Keutsch, F. N., Lohse, I., Lu, K., Tillmann, R., Wegener, R., Wolfe, G. M., Mentel, T. F., Kiendler-Scharr, A., and Wahner, A.: Missing Gas-Phase Source of HONO Inferred from Zeppelin Measurements in the Troposphere, Science, 344, 292–296, https://doi.org/10.1126/science.1248999, 2014.
Li, Y. Q., Schwab, J. J., and Demerjian, K. L.: Fast time response measurements of gaseous nitrous acid using a tunable diode laser absorption spectrometer: HONO emission source from vehicle exhausts, Geophys. Res. Lett., 35, L04803, https://doi.org/10.1029/2007GL031218, 2008.
Liu, Y., Nie, W., Xu, Z., Wang, T., Wang, R., Li, Y., Wang, L., Chi, X., and Ding, A.: Semi-quantitative understanding of source contribution to nitrous acid (HONO) based on 1 year of continuous observation at the SORPES station in eastern China, Atmos. Chem. Phys., 19, 13289–13308, https://doi.org/10.5194/acp-19-13289-2019, 2019.
Moody, J. L. and Galloway, J. N.: Quantifying the relationship between atmospheric transport and the chemical composition of precipitation on Bermuda, Tellus B, 40B, 463–479, https://doi.org/10.1111/j.1600-0889.1988.tb00117.x, 1988.
Neftel, A., Blatter, A., Hesterberg, R., and Staffelbach, T.: Measurements of concentration gradients of HNO2 and HNO3 over a semi-natural ecosystem, Atmos. Environ., 30, 3017–3025, https://doi.org/10.1016/1352-2310(96)00011-8, 1996.
Oswald, R., Behrendt, T., Ermel, M., Wu, D., Su, H., Cheng, Y., Breuninger, C., Moravek, A., Mougin, E., Delon, C., Loubet, B., Pommerening-Röser, A., Sörgel, M., Pöschl, U., Hoffmann, T., Andreae, M. O., Meixner, F. X., and Trebs, I.: HONO Emissions from Soil Bacteria as a Major Source of Atmospheric Reactive Nitrogen, Science, 341, 1233–1235, https://doi.org/10.1126/science.1242266, 2013.
Oswald, R., Ermel, M., Hens, K., Novelli, A., Ouwersloot, H. G., Paasonen, P., Petäjä, T., Sipilä, M., Keronen, P., Bäck, J., Königstedt, R., Hosaynali Beygi, Z., Fischer, H., Bohn, B., Kubistin, D., Harder, H., Martinez, M., Williams, J., Hoffmann, T., Trebs, I., and Sörgel, M.: A comparison of HONO budgets for two measurement heights at a field station within the boreal forest in Finland, Atmos. Chem. Phys., 15, 799–813, https://doi.org/10.5194/acp-15-799-2015, 2015.
Perner, D. and Platt, U.: Detection of nitrous acid in the atmosphere by differential optical absorption, Geophys. Res. Lett., 6, 917–920, https://doi.org/10.1029/GL006i012p00917, 1979.
Ramazan, K. A., Syomin, D., and Finlayson-Pitts, B. J.: The photochemical production of HONO during the heterogeneous hydrolysis of NO2, Phys. Chem. Chem. Phys., 6, 3836–3843, https://doi.org/10.1039/B402195A, 2004.
Reed, C., Evans, M. J., Crilley, L. R., Bloss, W. J., Sherwen, T., Read, K. A., Lee, J. D., and Carpenter, L. J.: Evidence for renoxification in the tropical marine boundary layer, Atmos. Chem. Phys., 17, 4081–4092, https://doi.org/10.5194/acp-17-4081-2017, 2017.
Reisinger, A. R.: Observations of HNO2 in the polluted winter atmosphere: possible heterogeneous production on aerosols, Atmos. Environ., 34, 3865–3874, https://doi.org/10.1016/S1352-2310(00)00179-5, 2000.
Romer, P. S., Wooldridge, P. J., Crounse, J. D., Kim, M. J., Wennberg, P. O., Dibb, J. E., Scheuer, E., Blake, D. R., Meinardi, S., Brosius, A. L., Thames, A. B., Miller, D. O., Brune, W. H., Hall, S. R., Ryerson, T. B., and Cohen, R. C.: Constraints on aerosol nitrate photolysis as a potential source of HONO and NOx, Environ. Sci. Technol., 52, 13738–13746, https://doi.org/10.1021/acs.est.8b03861, 2018.
Shi, Q., Tao, Y., Krechmer, J. E., Heald, C. L., Murphy, J. G., Kroll, J. H., and Ye, Q.: Laboratory investigation of renoxification from the photolysis of inorganic particulate nitrate, Environ. Sci. Technol., 55, 854–861, https://doi.org/10.1021/acs.est.0c06049, 2021.
Stemmler, K., Ammann, M., Donders, C., Kleffmann, J., and George, C.: Photosensitized reduction of nitrogen dioxide on humic acid as a source of nitrous acid, Nature, 440, 195–198, https://doi.org/10.1038/nature04603, 2006.
Stemmler, K., Ndour, M., Elshorbany, Y., Kleffmann, J., D'Anna, B., George, C., Bohn, B., and Ammann, M.: Light induced conversion of nitrogen dioxide into nitrous acid on submicron humic acid aerosol, Atmos. Chem. Phys., 7, 4237–4248, https://doi.org/10.5194/acp-7-4237-2007, 2007.
Stutz, J., Alicke, B., and Neftel, A.: Nitrous acid formation in the urban atmosphere: Gradient measurements of NO2 and HONO over grass in Milan, Italy, J. Geophys. Res.-Atmos., 107, 8192, https://doi.org/10.1029/2001JD000390, 2002.
Su, H., Cheng, Y., Oswald, R., Behrendt, T., Trebs, I., Meixner, F. X., Andreae, M. O., Cheng, P., Zhang, Y., and Pöschl, U.: Soil nitrite as a source of atmospheric HONO and OH radicals, Science, 333, 1616–1618, https://doi.org/10.1126/science.1207687, 2011.
Todd, D. L., Keene, W. C., Moody, J. L., Maring, H., and Galloway, J. N.: Effects of wet deposition on optical properties of the atmosphere over Bermuda and Barbados, J. Geophys. Res.-Atmos., 108, 4099, https://doi.org/10.1029/2001JD001084, 2003.
Trentmann, J., Andreae, M. O., and Graf, H.-F.: Chemical processes in a young biomass-burning plume, J. Geophys. Res.-Atmos., 108, 4705, https://doi.org/10.1029/2003JD003732, 2003.
Villena, G., Kleffmann, J., Kurtenbach, R., Wiesen, P., Lissi, E., Rubio, M. A., Croxatto, G., and Rappenglück, B.: Vertical gradients of HONO, NOx and O3 in Santiago de Chile, Atmos. Environ., 45, 3867–3873, https://doi.org/10.1016/j.atmosenv.2011.01.073, 2011a.
Villena, G., Bejan, I., Kurtenbach, R., Wiesen, P., and Kleffmann, J.: Development of a new Long Path Absorption Photometer (LOPAP) instrument for the sensitive detection of NO2 in the atmosphere, Atmos. Meas. Tech., 4, 1663–1676, https://doi.org/10.5194/amt-4-1663-2011, 2011b.
Vogel, B., Vogel, H., Kleffmann, J., and Kurtenbach, R.: Measured and simulated vertical profiles of nitrous acid—Part II. Model simulations and indications for a photolytic source, Atmos. Environ., 37, 2957–2966, https://doi.org/10.1016/S1352-2310(03)00243-7, 2003.
Wen, L., Chen, T., Zheng, P., Wu, L., Wang, X., Mellouki, A., Xue, L., and Wang, W.: Nitrous acid in marine boundary layer over eastern Bohai Sea, China: Characteristics, sources, and implications, Sci. Total Environ., 670, 282–291, https://doi.org/10.1016/j.scitotenv.2019.03.225, 2019.
Wojtal, P., Halla, J. D., and McLaren, R.: Pseudo steady states of HONO measured in the nocturnal marine boundary layer: a conceptual model for HONO formation on aqueous surfaces, Atmos. Chem. Phys., 11, 3243–3261, https://doi.org/10.5194/acp-11-3243-2011, 2011.
Wong, K. W., Oh, H.-J., Lefer, B. L., Rappenglück, B., and Stutz, J.: Vertical profiles of nitrous acid in the nocturnal urban atmosphere of Houston, TX, Atmos. Chem. Phys., 11, 3595–3609, https://doi.org/10.5194/acp-11-3595-2011, 2011.
Yang, J., Shen, H., Guo, M.-Z., Zhao, M., Jiang, Y., Chen, T., Liu, Y., Li, H., Zhu, Y., Meng, H., Wang, W., and Xue, L.: Strong marine-derived nitrous acid (HONO) production observed in the coastal atmosphere of northern China, Atmos. Environ., 244, 117948, https://doi.org/10.1016/j.atmosenv.2020.117948, 2021.
Ye, C., Zhou, X., Pu, D., Stutz, J., Festa, J., Spolaor, M., Cantrell, C., Mauldin, R. L., Weinheimer, A., and Haggerty, J.: Comment on “Missing gas-phase source of HONO inferred from Zeppelin measurements in the troposphere,” Science, 348, 1326-d, https://doi.org/10.1126/science.aaa1992, 2015.
Ye, C., Gao, H., Zhang, N., and Zhou, X.: Photolysis of nitric acid and nitrate on natural and artificial surfaces, Environ. Sci. Technol., 50, 3530–3536, https://doi.org/10.1021/acs.est.5b05032, 2016a.
Ye, C., Zhou, X., Pu, D., Stutz, J., Festa, J., Spolaor, M., Tsai, C., Cantrell, C., Mauldin, R. L., Campos, T., Weinheimer, A., Hornbrook, R. S., Apel, E. C., Guenther, A., Kaser, L., Yuan, B., Karl, T., Haggerty, J., Hall, S., Ullmann, K., Smith, J. N., Ortega, J., and Knote, C.: Rapid cycling of reactive nitrogen in the marine boundary layer, Nature, 532, 489–491, https://doi.org/10.1038/nature17195, 2016b.
Ye, C., Heard, D. E., and Whalley, L. K.: Evaluation of novel routes for NOx formation in remote regions, Environ. Sci. Technol., 51, 7442–7449, https://doi.org/10.1021/acs.est.6b06441, 2017a.
Ye, C., Zhang, N., Gao, H., and Zhou, X.: Photolysis of particulate nitrate as a source of HONO and NOx, Environ. Sci. Technol., 51, 6849–6856, https://doi.org/10.1021/acs.est.7b00387, 2017b.
Ye, C., Zhou, X., Pu, D., Stutz, J., Festa, J., Spolaor, M., Tsai, C., Cantrell, C., Mauldin III, R. L., Weinheimer, A., Hornbrook, R. S., Apel, E. C., Guenther, A., Kaser, L., Yuan, B., Karl, T., Haggerty, J., Hall, S., Ullmann, K., Smith, J., and Ortega, J.: Tropospheric HONO distribution and chemistry in the southeastern US, Atmos. Chem. Phys., 18, 9107–9120, https://doi.org/10.5194/acp-18-9107-2018, 2018.
Zabarnick, S.: Kinetics of the reaction OH + NO + M → HONO + M as a function of temperature and pressure in the presence of argon, SF6, and N2 bath gas, Chem. Phys., 171, 265–273, https://doi.org/10.1016/0301-0104(93)85149-3, 1993.
Zha, Q., Xue, L., Wang, T., Xu, Z., Yeung, C., Louie, P. K. K., and Luk, C. W. Y.: Large conversion rates of NO2 to HNO2 observed in air masses from the South China Sea: Evidence of strong production at sea surface?, Geophys. Res. Lett., 41, 7710–7715, https://doi.org/10.1002/2014GL061429, 2014.
Zhang, N., Zhou, X., Shepson, P. B., Gao, H., Alaghmand, M., and Stirm, B.: Aircraft measurement of HONO vertical profiles over a forested region, Geophys. Res. Lett., 36, L15820, https://doi.org/10.1029/2009GL038999, 2009.
Zhou, X., Beine, H. J., Honrath, R. E., Fuentes, J. D., Simpson, W., Shepson, P. B., and Bottenheim, J. W.: Snowpack photochemical production of HONO: A major source of OH in the Arctic boundary layer in springtime, Geophys. Res. Lett., 28, 4087–4090, https://doi.org/10.1029/2001GL013531, 2001.
Zhou, X., Civerolo, K., Dai, H., Huang, G., Schwab, J., and Demerjian, K.: Summertime nitrous acid chemistry in the atmospheric boundary layer at a rural site in New York State, J. Geophys. Res.-Atmos., 107, 4590, https://doi.org/10.1029/2001JD001539, 2002.
Zhou, X., Gao, H., He, Y., Huang, G., Bertman, S. B., Civerolo, K., and Schwab, J.: Nitric acid photolysis on surfaces in low-NOx environments: Significant atmospheric implications, Geophys. Res. Lett., 30, 2217, https://doi.org/10.1029/2003GL018620, 2003.
Zhou, X., Huang, G., Civerolo, K., Roychowdhury, U., and Demerjian, K. L.: Summertime observations of HONO, HCHO, and O3 at the summit of Whiteface Mountain, New York, J. Geophys. Res.-Atmos., 112, D08311, https://doi.org/10.1029/2006JD007256, 2007.
Zhou, X., Zhang, N., TerAvest, M., Tang, D., Hou, J., Bertman, S., Alaghmand, M., Shepson, P. B., Carroll, M. A., Griffith, S., Dusanter, S., and Stevens, P. S.: Nitric acid photolysis on forest canopy surface as a source for tropospheric nitrous acid, Nat. Geosci., 4, 440–443, https://doi.org/10.1038/ngeo1164, 2011.