the Creative Commons Attribution 4.0 License.
the Creative Commons Attribution 4.0 License.
 | 16 May 2022
A process-oriented evaluation of CAMS reanalysis ozone during tropopause folds over Europe for the period 2003–2018
Johannes Flemming
Antje Inness
Philippe Nédélec
Prodromos Zanis
Tropopause folds are the key process underlying stratosphere-to-troposphere transport (STT) of ozone, and thus they affect tropospheric ozone levels and variability. In the present study we perform a process-oriented evaluation of Copernicus Atmosphere Monitoring Service (CAMS) reanalysis (CAMSRA) O3 during folding events over Europe and for the time period from 2003 to 2018. A 3-D labeling algorithm is applied to detect tropopause folds in CAMSRA, while ozonesonde data from WOUDC (World Ozone and Ultraviolet Radiation Data Centre) and aircraft measurements from IAGOS (In-service Aircraft for a Global Observing System) are used for CAMSRA O3 evaluation. The profiles of observed and CAMSRA O3 concentrations indicate that CAMSRA reproduces the observed O3 increases in the troposphere during the examined folding events. Nevertheless, at most of the examined sites, CAMSRA overestimates the observed O3 concentrations, mostly at the upper portion of the observed increases, with a median fractional gross error (FGE) among the examined sites >0.2 above 400 hPa. The use of a control run without data assimilation reveals that the aforementioned overestimation of CAMSRA O3 arises from the data assimilation implementation. Overall, although data assimilation assists CAMSRA O3 to follow the observed O3 enhancements in the troposphere during the STT events, it introduces biases in the upper troposphere resulting in no clear quantitative improvement compared to the control run without data assimilation. Less biased assimilated O3 products, with finer vertical resolution in the troposphere, in addition to higher IFS (Integrated Forecasting System) vertical resolution, are expected to provide a better representation of O3 variability during tropopause folds.
- Article
(9392 KB) - Full-text XML
-
Supplement
(1494 KB) - BibTeX
- EndNote


Ozone has multiple roles in the Earth's troposphere, making it one of the most important trace gases. It is a major source of the OH radical that controls the oxidizing capacity of the troposphere, and it is also a short-lived climate forcer being an important greenhouse gas, especially in the upper troposphere and lower stratosphere. Near the surface, ozone is a pollutant detrimental to human health, crops, and ecosystems (Monks et al., 2015; Young et al., 2018). The Intergovernmental Panel on Climate Change (IPCC) Sixth Assessment Report (AR6) assessed that tropospheric ozone has increased since the mid-20th century by 30 %–70 % across the Northern Hemisphere based on sparse historical surface and low-altitude data (Gulev et al., 2021; Szopa et al., 2021). The tropospheric ozone budget is controlled by chemical production and loss, stratosphere–troposphere exchange (STE), and deposition at the Earth's surface, whose magnitude can vary widely across chemistry climate models (Young et al., 2018; Griffiths et al., 2021; Szopa et al., 2021). The net stratospheric influx results from STE processes, comprised of stratosphere-to-troposphere transport (STT) and troposphere-to-stratosphere transport (TST) (Stohl et al., 2003). The latter constitutes an important pathway through which very short-lived substances (VSLS) emitted at the surface can be transported to the lower stratosphere influencing ozone (Levine et al., 2007; Aschmann et al., 2009; Liang et al., 2014). The main mechanism for STT is tropopause folding (Stohl et al., 2003), which results in the downward transport of stratospheric ozone-rich air into the troposphere, a process known as stratospheric intrusion (Danielsen and Mohnen, 1977). Therefore, tropopause folding events affect tropospheric composition and in particular tropospheric ozone levels (Beekmann et al., 1997; Ott et al., 2016; Cooper et al., 2005; Tarasick et al., 2019; Zhao et al., 2021a), especially in regions that are known to be hot spots of fold activity (Zanis et al., 2014; Akritidis et al., 2016; Ojha et al., 2017). Occasionally, during deep and intense folding events, stratospheric air is transported down to the lower troposphere or even to the planetary boundary layer leading to changes in tropospheric and surface ozone concentrations (Langford et al., 2009; Lin et al., 2015; Knowland et al., 2017). Model projections suggested that under a changing climate tropopause folds will be associated with both future increases and interannual variability in ozone STT (Akritidis et al., 2019).
The spatial and temporal characteristics of tropopause folds occurrence around the globe have been the subject of study in recent years, suggesting the jet stream location, intensity, and seasonality as their main drivers (Elbern et al., 1998; Sprenger et al., 2003; Škerlak et al., 2014; Akritidis et al., 2021). The springtime western United States region is a hot spot of deep folding events with well-known implications for tropospheric ozone and air quality (Langford et al., 2009; Lin et al., 2012, 2015; Knowland et al., 2017). Recently, Luo et al. (2019) explored the seasonal features of tropopause folds over the Tibetan Plateau where folds occur frequently (Tyrlis et al., 2014), while other studies investigated the effect of tropopause folds on lower-tropospheric ozone levels and air quality in China (Lu et al., 2019; Zhao et al., 2021b, a). Regarding the broader European region, the summertime Eastern Mediterranean is a well-known hot spot of fold activity (Tyrlis et al., 2014; Akritidis et al., 2016), resulting from the interaction of the subtropical jet stream and the South Asian monsoon (Tyrlis et al., 2014), while further north folds occur in the vicinity of cyclones (Reutter et al., 2015; Antonescu et al., 2013; Knowland et al., 2015). During the past 2 decades several studies have explored the impact of stratospheric intrusions on tropospheric ozone levels and variability over Europe (Stohl et al., 2000; Cristofanelli et al., 2006; Trickl et al., 2020), as well as the quality of their forecast (Zanis et al., 2003; Trickl et al., 2010; Akritidis et al., 2018).
Nowadays, a comprehensive framework to study the contribution of stratospheric intrusions to tropospheric ozone are atmospheric composition reanalysis products that provide global meteorological and ozone data in relatively high spatial and temporal resolution. Yet, before estimating the impact of STT events on tropospheric ozone, a process-oriented evaluation of the reanalysis product during such events is deemed essential. The latest reanalysis of atmospheric composition produced by the European Centre for Medium-Range Weather Forecasts (ECMWF) is the Copernicus Atmosphere Monitoring Service (CAMS) reanalysis (CAMSRA) (Inness et al., 2019a). Within the framework of the CAMS service element CAMS_84, Akritidis et al. (2018) evaluated the performance of the ECMWF Integrated Forecasting System (IFS) in forecasting the observed O3 increases in the troposphere during a deep STT event over Europe. However, apart from such individual case studies, there is no long-term evaluation of IFS during STT events. Recently, Akritidis et al. (2021) using a fold detection algorithm constructed a global record of tropopause folds in CAMSRA for the period from 2003 to 2018.
In the present study we perform a process-oriented evaluation of CAMSRA O3 during STT events, selected from the CAMSRA tropopause folds database by Akritidis et al. (2021), for the European region and over the time period 2003–2018. Compared with other regions worldwide, the European region exhibits relatively high observational data availability for the examined period. In addition, the role of IFS chemical data assimilation in O3 STT is explored. Section 2 describes WOUDC (World Ozone and Ultraviolet Radiation Data Centre) and IAGOS (In-service Aircraft for a Global Observing System) O3 data used for the evaluation, ECMWF IFS system and CAMSRA data, the 3-D labeling algorithm applied for tropopause fold detection, and the methodological approach for the selection of STT events. Section 3 presents the main evaluation results, and finally Sect. 4 summarizes the key findings of the study.
2.1 Observational data
To evaluate CAMSRA O3 during folding events, ozonesonde measurements were obtained from the WOUDC network (WMO/GAW Ozone Monitoring Community, 2022) (last access: 7 February 2022) for nine European sites, namely Lerwick, United Kingdom (UK) (LER); Uccle, Belgium (UCC); Hohenpeissenberg, Germany (HOH); Payerne, Switzerland (PAY); Legionowo, Poland (LEG); Madrid, Spain (MAD); De Bilt, the Netherlands (DBI); Lindenberg, Germany (LIN); and Prague, Czech Republic (PRA). At all sites the measurements are carried out with electrochemical concentration cell (ECC) ozonesondes (Komhyr, 1969), except at Hohenpeissenberg where the Brewer Mast ozonesonde (Brewer and Milford, 1960) is used. Both ozonesonde types are based on the same measurement principle of ozone electrochemical detection in potassium iodine. The major differences between ECC and Brewer Mast ozonesondes are that the latter uses only one reaction chamber and a silver anode instead of a platinum anode, requiring an external electrical potential in contrast to the ECC (Beekmann et al., 1994). The precision of ECC ozonesondes in the troposphere (below 200 hPa) is between −7 % and +17 %, as reported by Komhyr et al. (1995), while for the Brewer Mast ozonesondes the same order of precision was found by Steinbrecht et al. (1998). The ozonesonde observations are compared against CAMSRA O3 concentrations of the nearest grid point and time step.
Aircraft ozone measurements from the IAGOS (In-service Aircraft for a Global Observing System) program were also used (http://iagos-data.fr/, last access: 21 April 2020). Within the framework of IAGOS, instruments are carried on commercial airlines, measuring ozone, carbon monoxide, and water vapor along with meteorological parameters and cloud particles. Details of the IAGOS project can be found in Petzold et al. (2015), with the technical details of the instrumentation, operations, and validation presented in Nédélec et al. (2015). Five IAGOS airports were selected for the evaluation, based on their data temporal coverage, namely Paris, France (PAR); Düsseldorf, Germany (DUS); Frankfurt, Germany (FRA); Munich, Germany (MUN); and Vienna, Austria (VIE). The IAGOS O3 data have an accuracy of ±2 ppb, a precision of ±2 %, and a detection limit of 2 ppb (Blot et al., 2021). Landing and takeoff O3 profiles are compared against CAMSRA O3 profiles. It should be noted that the IAGOS profiles are not strictly vertical. To this end, and in order to perform a more realistic evaluation of CAMSRA O3 according to the flight position (longitude, latitude, pressure), the respective CAMSRA grid points are extracted at the nearest time to that of the takeoff or landing. The selection of both ozonesonde sites and IAGOS airports was based in the availability of at least 500 profile observations throughout the 2003–2018 period. This objective criterion ensures a sufficient number of both observational sites and folding events to be selected for the analysis. It is noteworthy to mention that both ozonesondes and IAGOS profiles are not assimilated and hence they constitute completely independent validation data. The location of the examined WOUDC ozonesonde sites and IAGOS airports are depicted in Fig. 1.

Figure 1Location of WOUDC ozonesonde sites (white balloons) and IAGOS airports (blue airplanes) over Europe used in the present study.
2.2 CAMS reanalysis
CAMSRA is the latest reanalysis dataset produced by ECMWF, including three-dimensional fields of meteorological, chemical, and aerosol species for the period from 2003 onwards. It comes as a follow-up of the previous successful reanalysis products, the Monitoring Atmospheric Composition and Climate (MACC) reanalysis (MACCRA) (Inness et al., 2013) and the CAMS interim reanalysis (CAMSIRA) (Flemming et al., 2017). CAMSRA is based on the ECMWF's IFS CY42R1 cycle and the 4D-VAR data assimilation system (Inness et al., 2019a). In more detail, it is based on the minimization of a penalty function that takes the deviations of the model's background fields from the observations to provide the optimal forecast during 12 h assimilation windows (from 09:00 to 21:00 and 21:00 to 09:00 UTC) by modifying the initial conditions accordingly. To this end, satellite retrievals of total column CO, tropospheric column NO2, aerosol optical depth, and total column, partial column and profile ozone retrievals are assimilated in the IFS system. More details on the satellite retrievals (product, satellite, period) assimilated in CAMSRA can be found in Table 1 of the CAMSRA evaluation study by Wagner et al. (2021). In addition, meteorological observations, including satellite, PILOT, in situ, radiosonde, dropsonde, and aircraft measurements are also incorporated in IFS. The chemical mechanism used in the IFS is an extended version of the Carbon Bond 2005 (CB05) tropospheric chemical mechanism (Flemming et al., 2015) and stratospheric ozone chemistry is parameterized by a “Cariolle scheme” (Cariolle and Déqué, 1986; Cariolle and Teyssèdre, 2007). The emissions consist of the MACCity (MACC and CityZEN EU projects) anthropogenic emissions (Granier et al., 2011), the GFAS (Global Fire Assimilation System) fire emissions (Kaiser et al., 2012), and the MEGAN2.1 (Model of Emissions of Gases and Aerosols from Nature) biogenic emissions (Guenther et al., 2006). The CAMSRA data have a spatial resolution of approximately 80 km (0.7∘ × 0.7∘ grid) with 60 hybrid sigma–pressure (model) levels (13 levels between approximately 400 and 100 hPa) in the vertical (top level at 0.1 hPa) and a temporal resolution of 3 h. The quality of the CAMSRA O3 field is documented in Wagner et al. (2021) and comprehensive validation reports that can be found on the CAMS website https://atmosphere.copernicus.eu/eqa-reports-global-services (last access: 10 May 2022) (e.g., Errera et al., 2021).
To investigate the role of chemical data assimilation in tropospheric ozone representation during folding events, a control simulation of IFS without the use of chemical data assimilation (CAMSRA no DA) is also used. As it would have been computationally too expensive to produce a control analysis experiment that was identical to CAMSRA but did not actively assimilate observations of reactive gases, a forecast run was carried out that applied the same settings (model code, resolution, emissions) as used in CAMSRA. The control run was carried out as a sequence of 24 h. The meteorological initial conditions were taken from CAMSRA, but the initial conditions for the atmospheric composition species, including ozone, from the previous forecast. It thus allows us to detect the impact of the assimilation of ozone data, for example, by comparing its ozone fields with CAMSRA. This approach was also followed by Akritidis et al. (2018) in their evaluation of CAMS forecasting systems during a deep STT event over Europe, indicating an overall improvement of IFS performance due to the chemical data assimilation implementation.
Apart from O3, a stratospheric ozone tracer (O3s) is also used from CAMSRA providing a diagnostic of O3 STT. In principle, O3s in IFS is defined identically with O3 in the stratosphere; however, in CAMSRA O3s is equal to the modeled (Cariolle scheme) O3 tracer and not the assimilation-resulted O3. In the troposphere O3s is subject to transport and chemical destruction just like O3. The tropopause in CAMSRA is calculated based on the temperature lapse rate, switching the chemistry scheme from CB05 (troposphere) to Cariolle (stratosphere) accordingly. It should be noted that O3s is used here only as a qualitative diagnostic of ozone STT to support evidence of stratospheric ozone downward transport during the folding events.
2.3 Fold detection in CAMS reanalysis
Tropopause folds are identified in CAMSRA using the latest version of the 3-D labeling and fold detection algorithm by Škerlak et al. (2015), initially developed by Sprenger et al. (2003). Here, we adopted the 3-D labeling algorithm to detect folds in CAMSRA, using as inputs the fields of potential vorticity (PV), potential temperature, specific humidity, and surface pressure. The 3-D fields of pressure are constructed and the pressure level of the dynamical tropopause (Holton et al., 1995; Stohl et al., 2003) is determined using the lower of the isosurfaces of PV at 2 PVU and potential temperature at 380 K. Subsequently, the vertical profile for each grid point is examined, and a fold is assigned when multiple crossings of the tropopause are identified. Still, there are specific cases where air with PV >2 PVU is either not connected to the stratosphere (stratospheric cut-offs) or is not of stratospheric origin (diabatic PV anomalies or surface-bound PV anomalies), which should not be considered as stratospheric. To this end, the 3-D labeling algorithm, using physical and geometrical criteria, labels the air masses as follows: tropospheric (label =1), stratospheric (label =2), stratospheric cut-off or diabatically produced PV anomaly (label =3), tropospheric cut-off (label =4), surface-bound PV anomaly (label =5). The diabatically produced PV anomalies merged with the stratosphere are distinguished using a specific humidity threshold of 0.1 g kg−1. Further details on the criteria used for the 3-D labeling can be found in Škerlak et al. (2015). Therefore, a fold is identified when a or 3 transition is detected on a vertical profile (from top to bottom), with the algorithm outputting a binary variable (0: no fold; 1: fold) for every grid point and time step. In addition, the upper (pu), middle (pm), and lower (pl) pressure levels of the tropopause crossings are identified along with the difference , which depicts the vertical extent of the fold. The spatial distribution of CAMSRA monthly mean tropopause folds (with Δp≥50 hPa) frequency over Europe for the period 2003–2018 is presented in Fig. S1 of the Supplement.
2.4 Selection of STT events
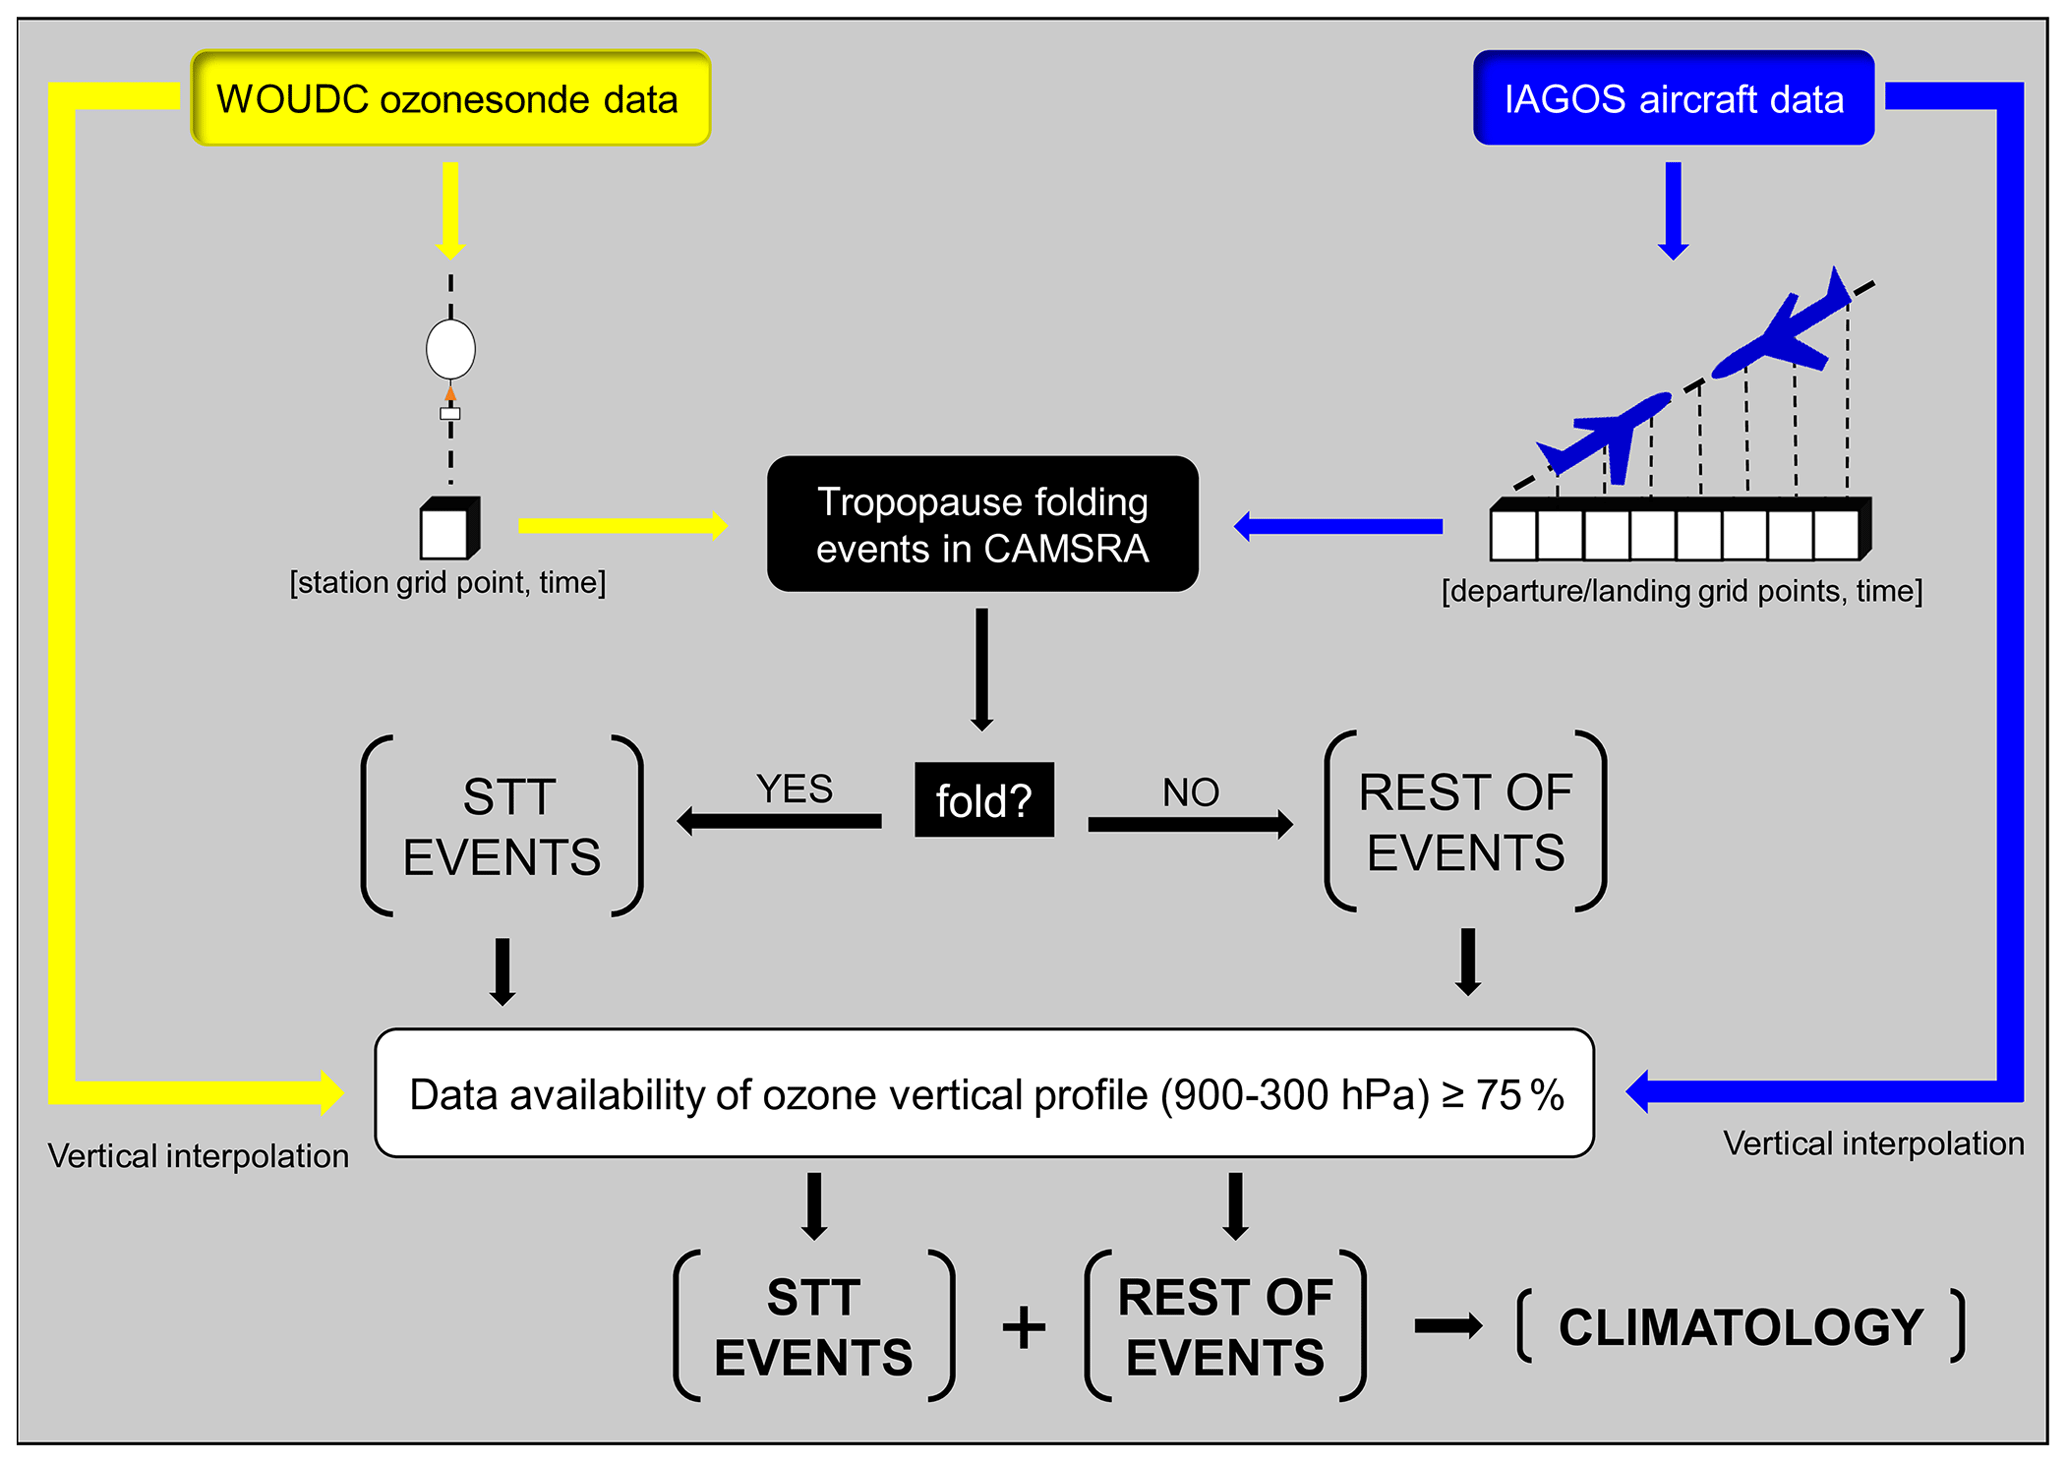
To perform the process-oriented evaluation of CAMSRA O3, the STT events are selected for each WOUDC ozonesonde site by applying the following methodology.
- a.
For every ozonesonde profile, the time and location of release are extracted.
- b.
For the CAMSRA grid cell, including the ozonesonde site location, and for the CAMSRA 3 h time steps before and after the time of ozonesonde release, the presence of a tropopause fold with Δp≥50 hPa is explored (e.g., if the ozonesonde release was 14:00 UTC, we search for folds at the 12:00 and 15:00 UTC time steps of the respective grid cell).
- c.
If a fold is found, the respective ozonesonde profile is classified in “STT events”, while it otherwise is classified in “rest of events”.
- d.
The ozonesonde data are vertically interpolated (linear) with a step of 25 hPa, and only the profiles exhibiting a data completeness ≥75 % from 900 to 300 hPa are kept in the STT events and rest of events records. Merging the STT events record with the rest of events record provides the climatology of ozonesonde profile.
The same approach is followed (steps a, c, and d) for the IAGOS data with one difference in step b. Since the aircraft measurement profiles during takeoff and landing are not strictly vertical, a tracking of the aircraft position is performed and the respective CAMSRA grid cells that include the aircraft route are extracted. Subsequently, the presence of a tropopause fold with Δp≥50 hPa is explored if it is found in at least one of the extracted grid cells. A schematic representation of the applied methodology for the STT events selection is illustrated in Fig. 2. For direct comparison with observations, CAMSRA O3 concentrations are also vertically interpolated (linear) with a step of 25 hPa.
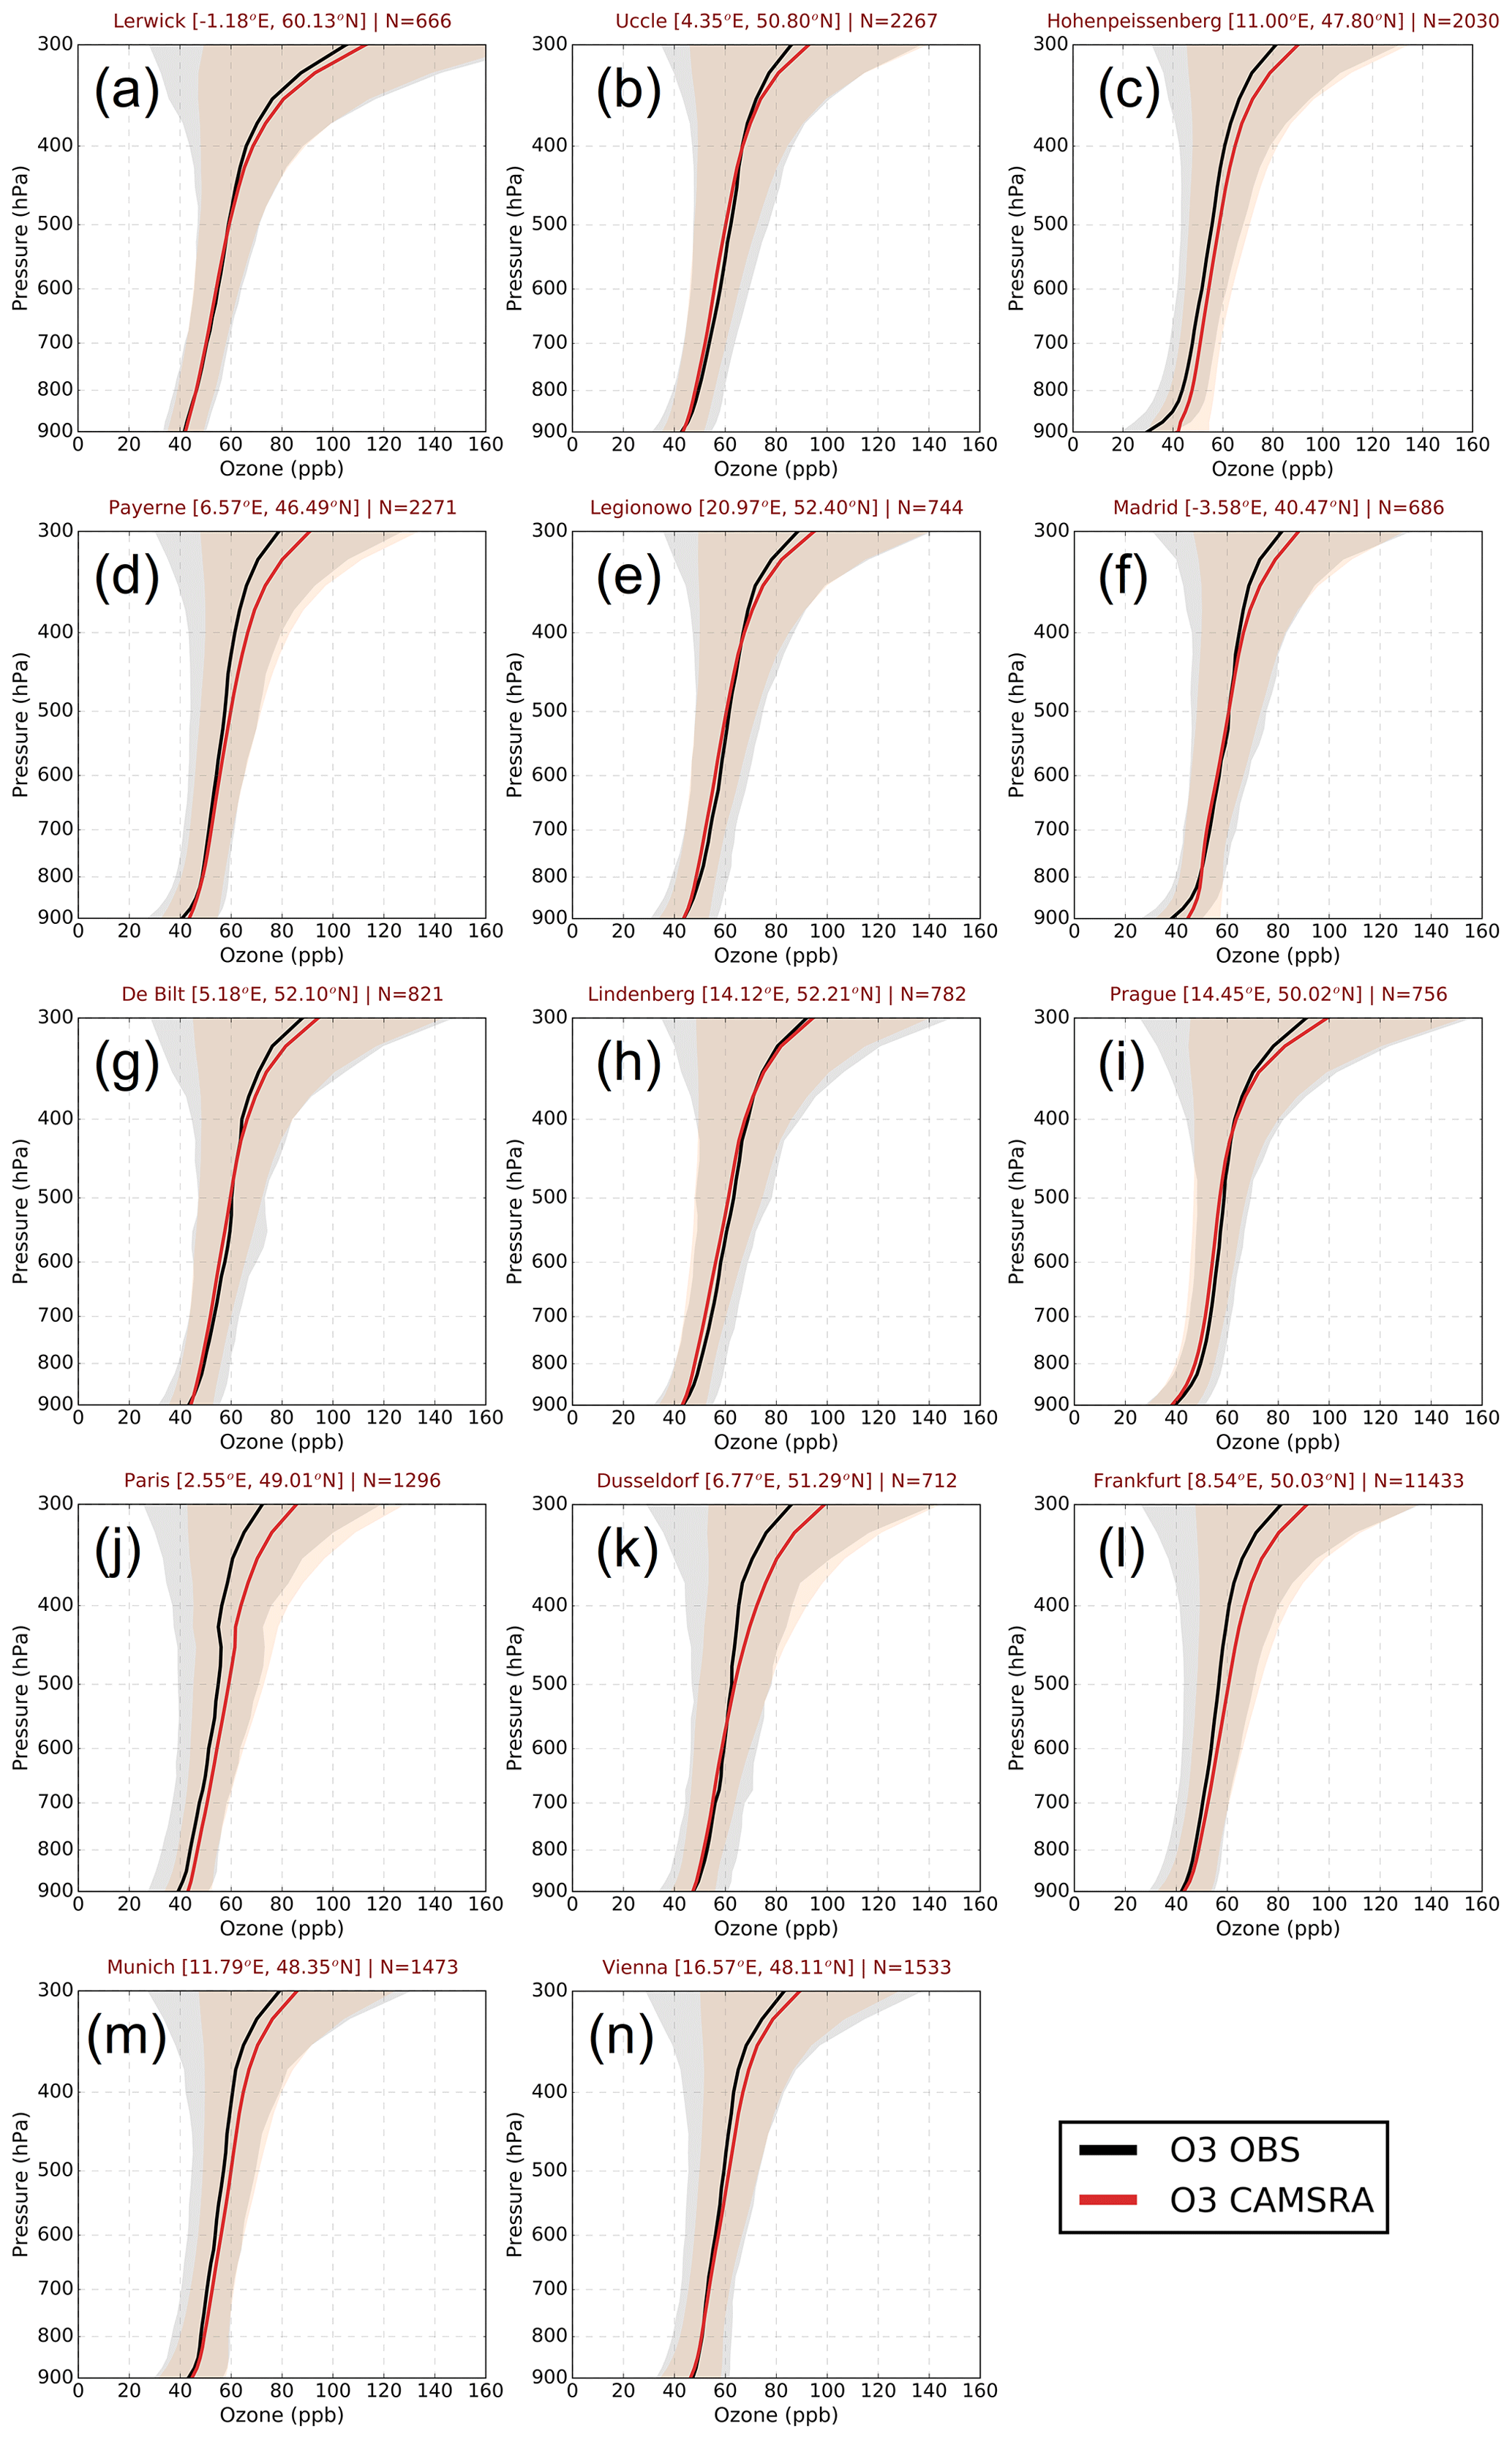
Figure 3Vertical profiles of observed (black) and CAMSRA (red) ozone concentrations (ppb) at the WOUDC ozonesonde stations of (a) Lerwick (UK), (b) Uccle (Belgium), (c) Hohenpeissenberg (Germany), (d) Payerne (Switzerland), (e) Legionowo (Poland), (f) Madrid (Spain), (g) De Bilt (the Netherlands), (h) Lindenberg (Germany), and (i) Prague (Czech Republic) and at the IAGOS airports of (j) Paris (France), (k) Düsseldorf (Germany), (l) Frankfurt (Germany), (m) Munich (Germany), and (n) Vienna (Austria) for the period 2003–2018. The grey and sandy brown areas depict the ± 1 standard deviation of ozone vertical profiles in observations and CAMSRA, respectively.
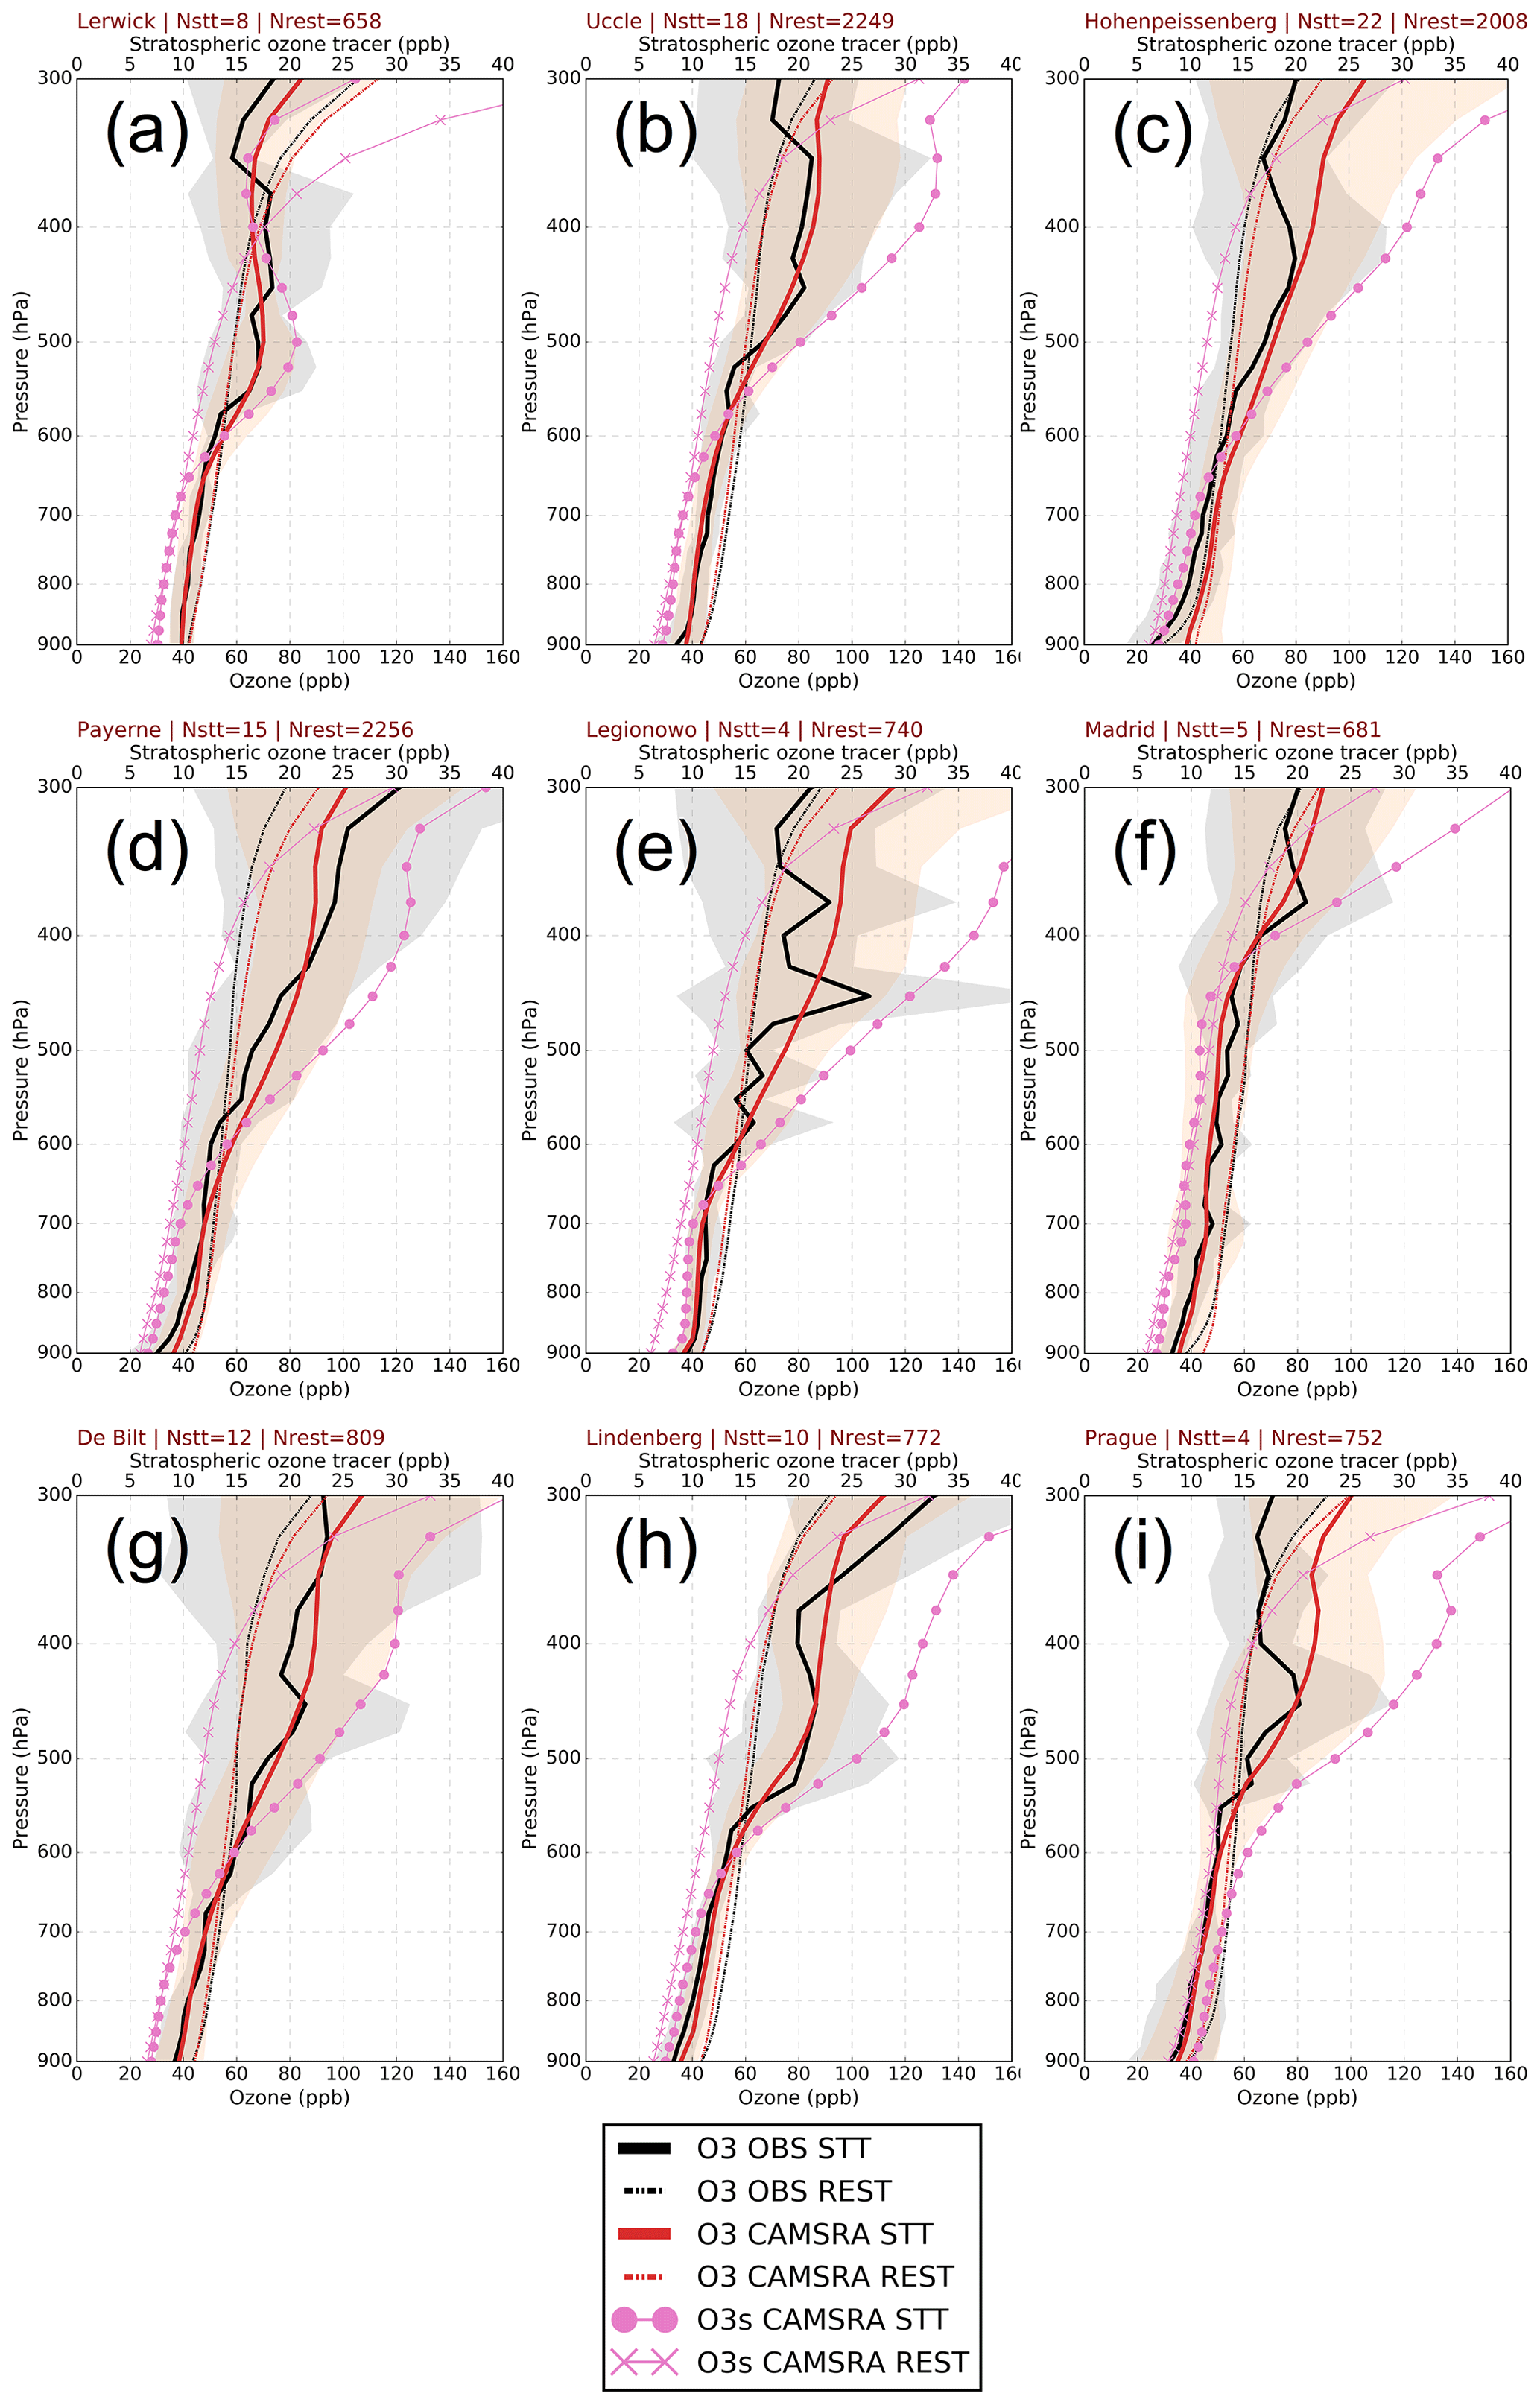
Figure 4Vertical profiles of observed (black) and CAMSRA (red) ozone concentrations (ppb) during STT events (thick solid line) and during the rest of the events (thin dashed line) at the WOUDC ozonesonde stations of (a) Lerwick (UK), (b) Uccle (Belgium), (c) Hohenpeissenberg (Germany), (d) Payerne (Switzerland), (e) Legionowo (Poland), (f) Madrid (Spain), (g) De Bilt (the Netherlands), (h) Lindenberg (Germany), and (i) Prague (Czech Republic). Also shown are the vertical profiles of stratospheric ozone tracer concentrations (ppb) during STT (pink circles) and the rest of the events (pink crosses). The grey and sandy brown areas depict the ± 1 standard deviation of ozone vertical profiles during STT events in observations and CAMSRA, respectively. Keep in mind that O3 and O3s concentrations are presented on different horizontal axes.
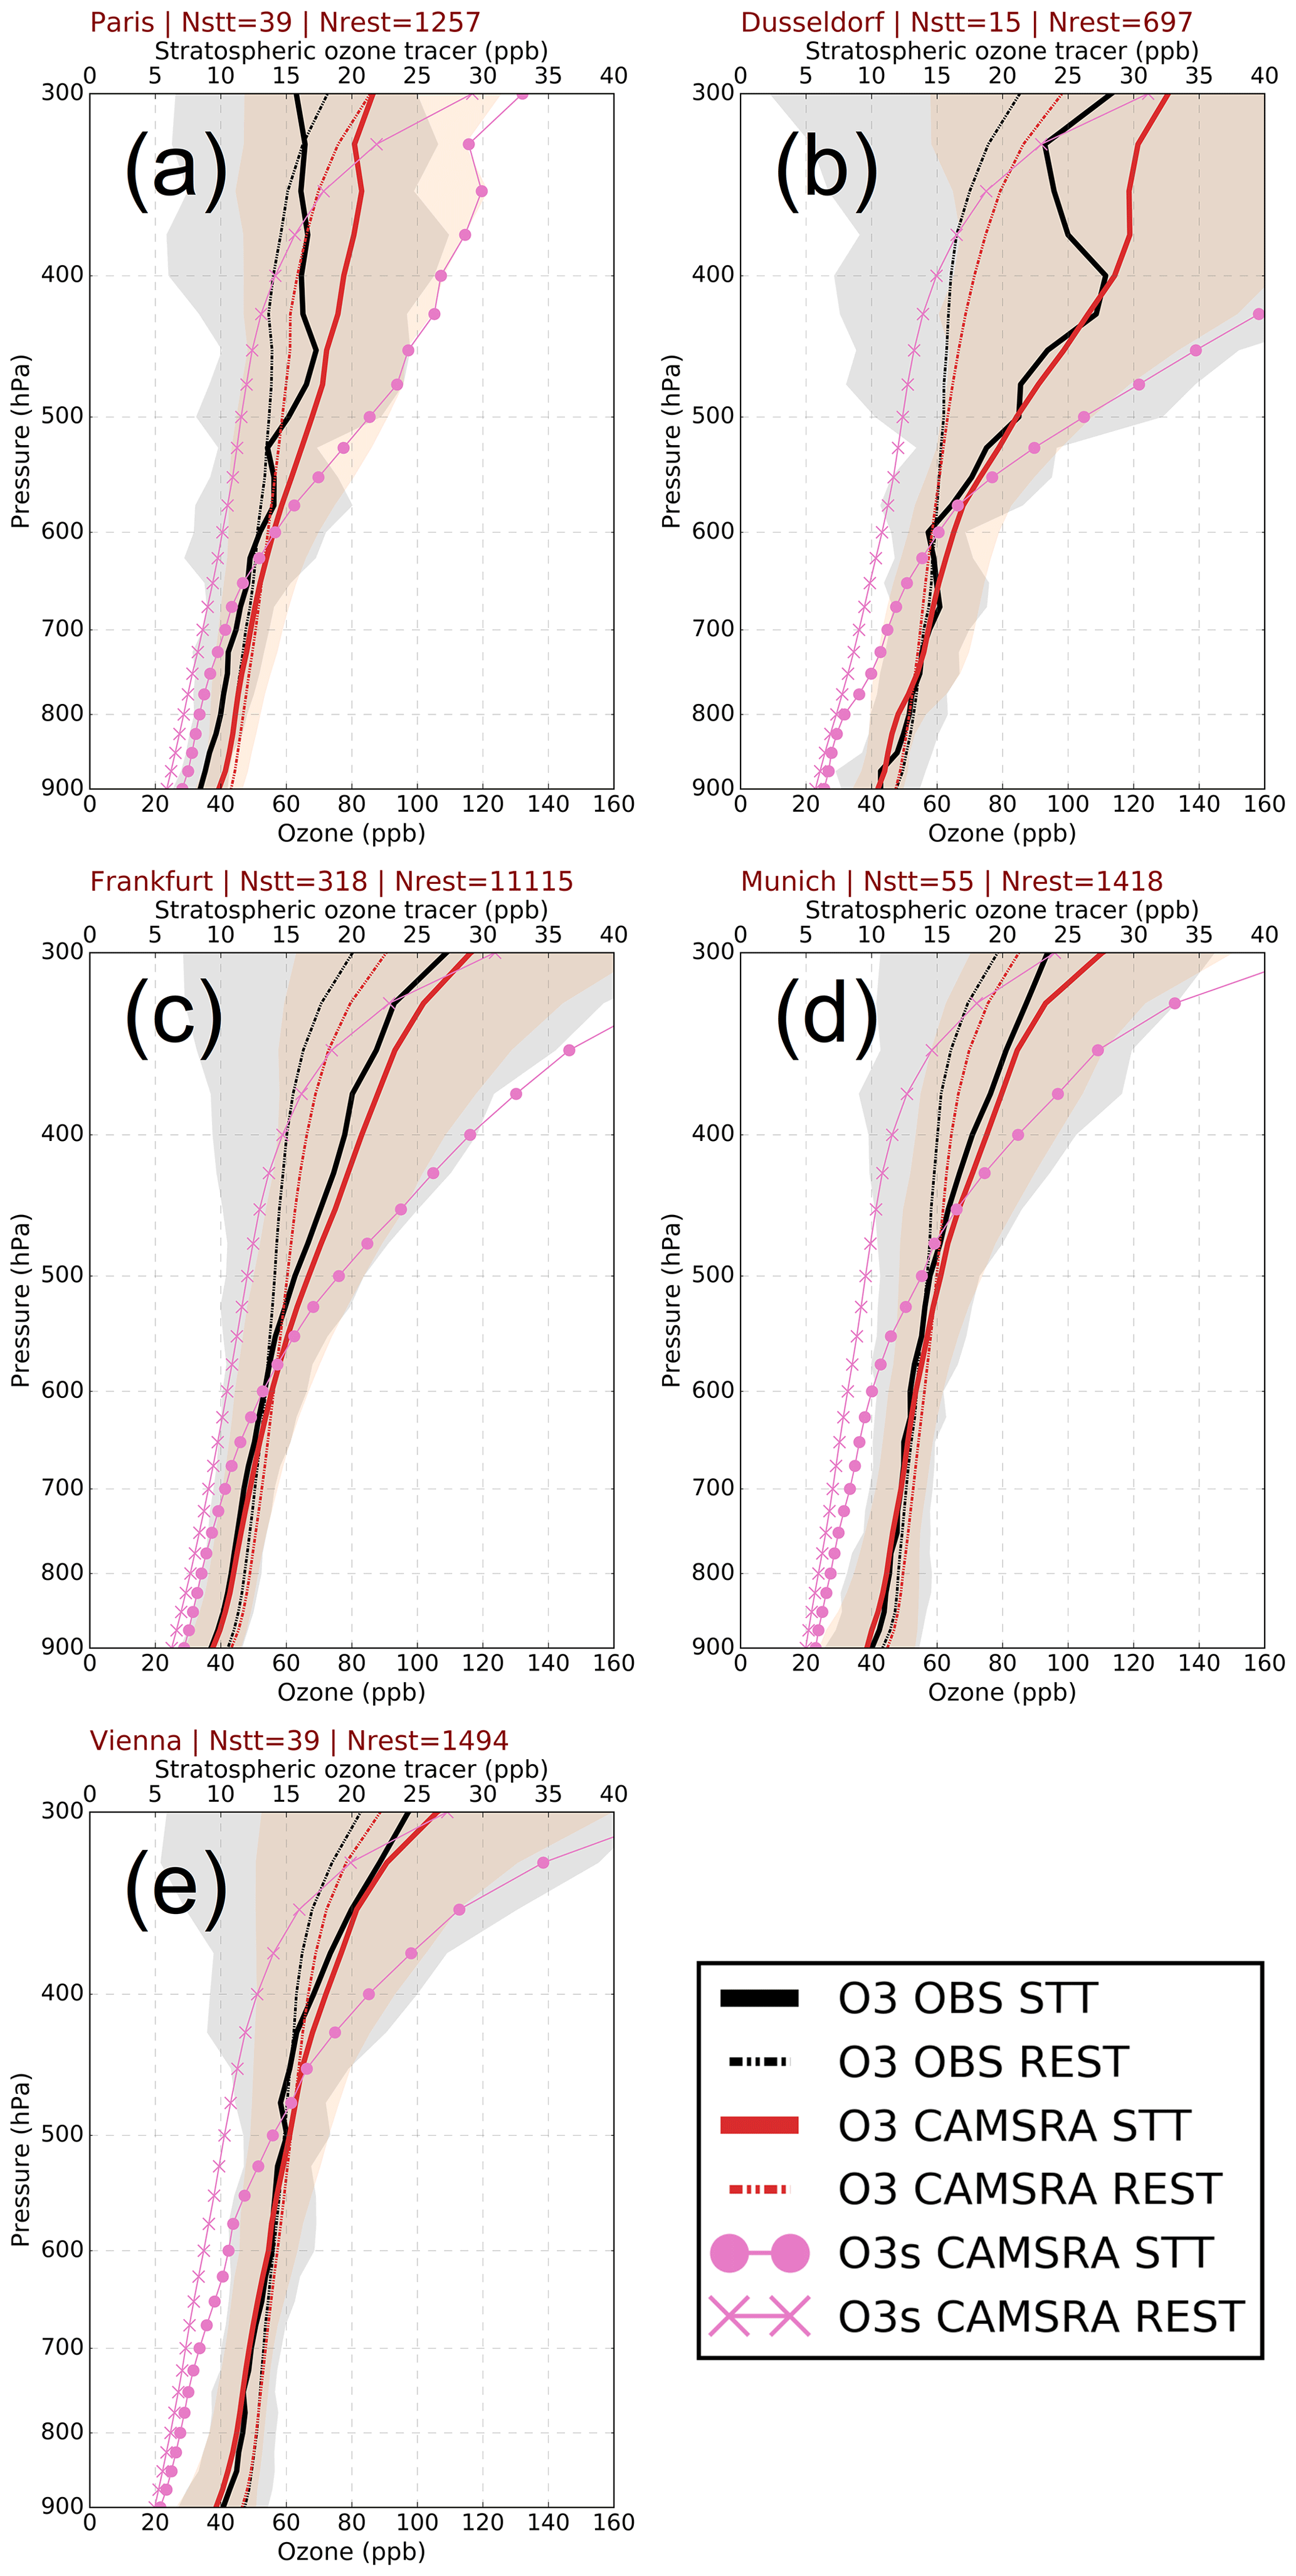
Figure 5Vertical profiles of observed (black) and CAMSRA (red) ozone concentrations (ppb) during STT events (thick solid line) and during the rest of the events (thin dashed line) at the IAGOS airports of (a) Paris (France), (b) Düsseldorf (Germany), (c) Frankfurt (Germany), (d) Munich (Germany), and (e) Vienna (Austria). Also shown are the vertical profiles of stratospheric ozone tracer concentrations (ppb) during STT (pink circles) and the rest of the events (pink crosses). The grey and sandy brown areas depict the ± 1 standard deviation of ozone vertical profiles during STT events in observations and CAMSRA, respectively. Keep in mind that O3 and O3s concentrations are presented on different horizontal axes.
3.1 Comparison of observed and CAMSRA climatological O3 profiles
Before proceeding with the process-oriented evaluation of CAMSRA O3 during the STT events, we present a comparison of CAMSRA O3 profiles against observations (ozonesonde and aircraft measurements) during all the events (STT events + rest of events), to ensure that CAMSRA reproduces the climatological features of the observed O3 profiles at the examined European sites. Figure 3 presents the climatological O3 profiles of both observations and CAMSRA for all examined WOUDC and IAGOS sites. As depicted, CAMSRA captures the features of observed vertical O3 profiles, with a common characteristic at all sites being an overestimation of CAMSRA mostly in the upper troposphere, which is also seen in the evaluation studies by Inness et al. (2019a); Huijnen et al. (2020); Wagner et al. (2021). More specifically, CAMSRA exhibits higher O3 concentrations throughout the troposphere at Hohenpeissenberg and Paris and to a lesser extent at Frankfurt and Munich, with the greatest overestimation seen in the upper troposphere at all sites. Similar O3 overestimations in the free troposphere over Hohenpeissenberg are also reported for previous ECMWF atmospheric composition reanalysis products such as the MACC reanalysis (see Figs. 7 and 8 in the evaluation study by Katragkou et al., 2015). At Payerne and Düsseldorf, CAMSRA O3 is only overestimated above 500 hPa. At the rest of the sites CAMSRA O3 is quantitatively in very good agreement with observations. The differences seen in the comparison between the observed and CAMSRA O3 concentrations among the examined sites are presumably related to regional differences and uncertainties in O3 precursor emissions affecting modeled local net photochemical O3 production rates, as well as the spatiotemporal representativeness of WOUDC vertical profiles and IAGOS aircraft takeoff and landing routes by the selected CAMSRA grid points and time steps.

Figure 6Vertical profiles of CAMSRA ozone (a) FGE and (b) MNMB for the examined WOUDC ozonesonde stations and IAGOS airports over the period 2003–2018. The observational sites are ordered with increasing latitude.
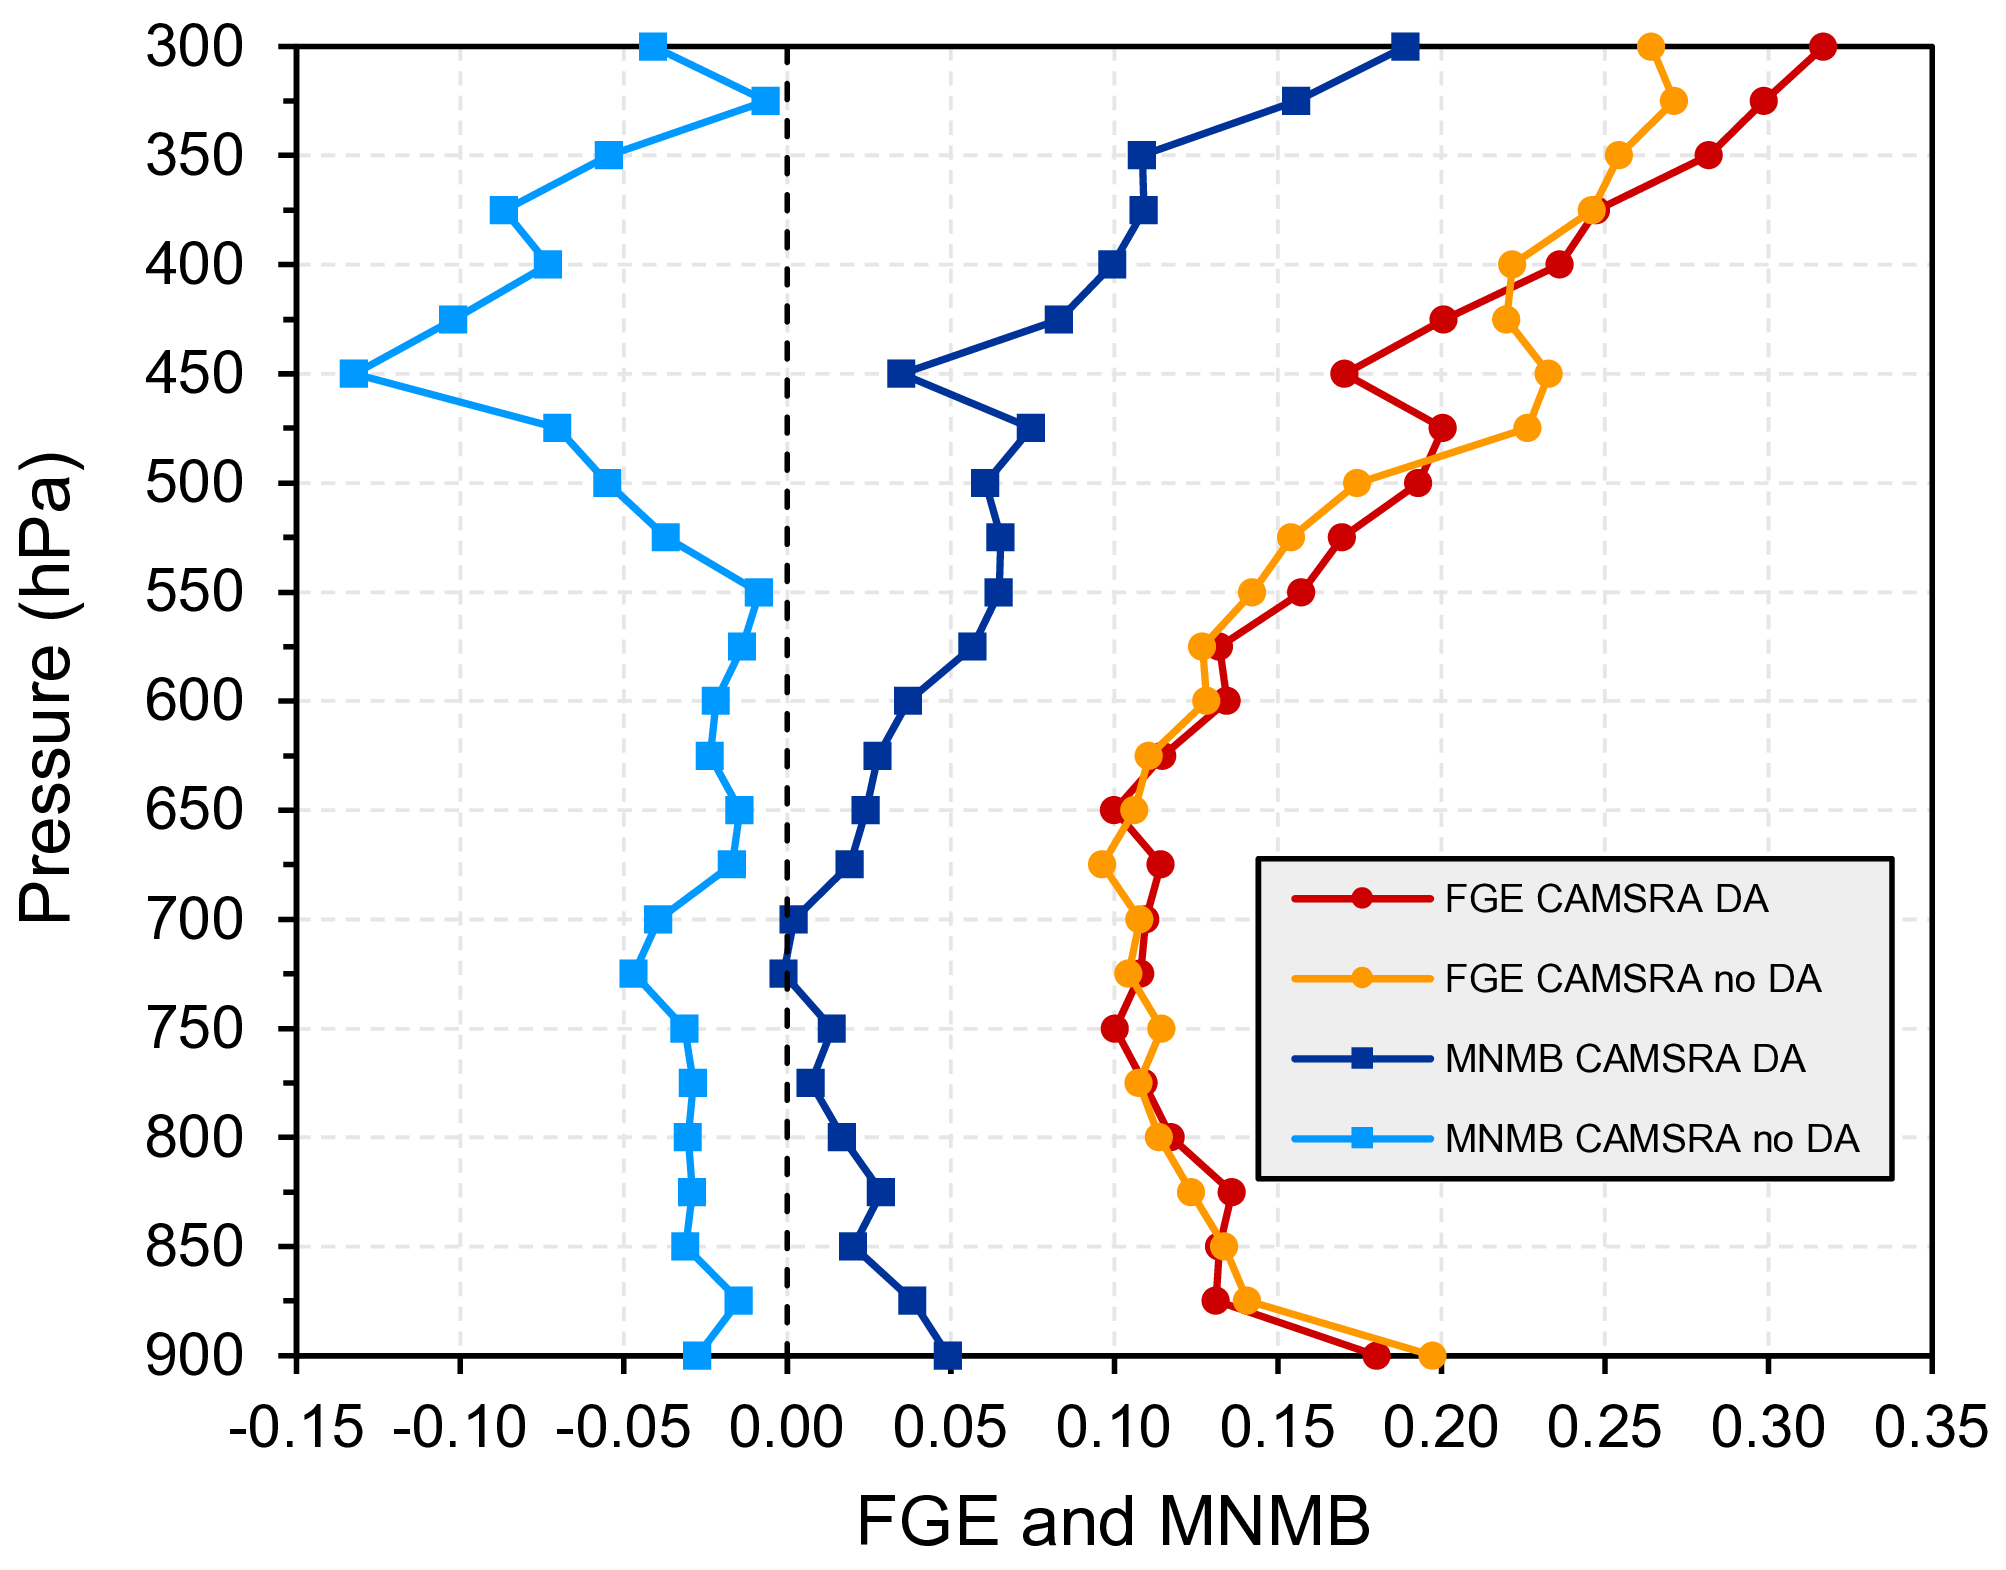
Figure 7Vertical profiles of median (among examined sites) FGE and MNMB for CAMSRA O3 with and without chemical data assimilation (DA and no DA, respectively).
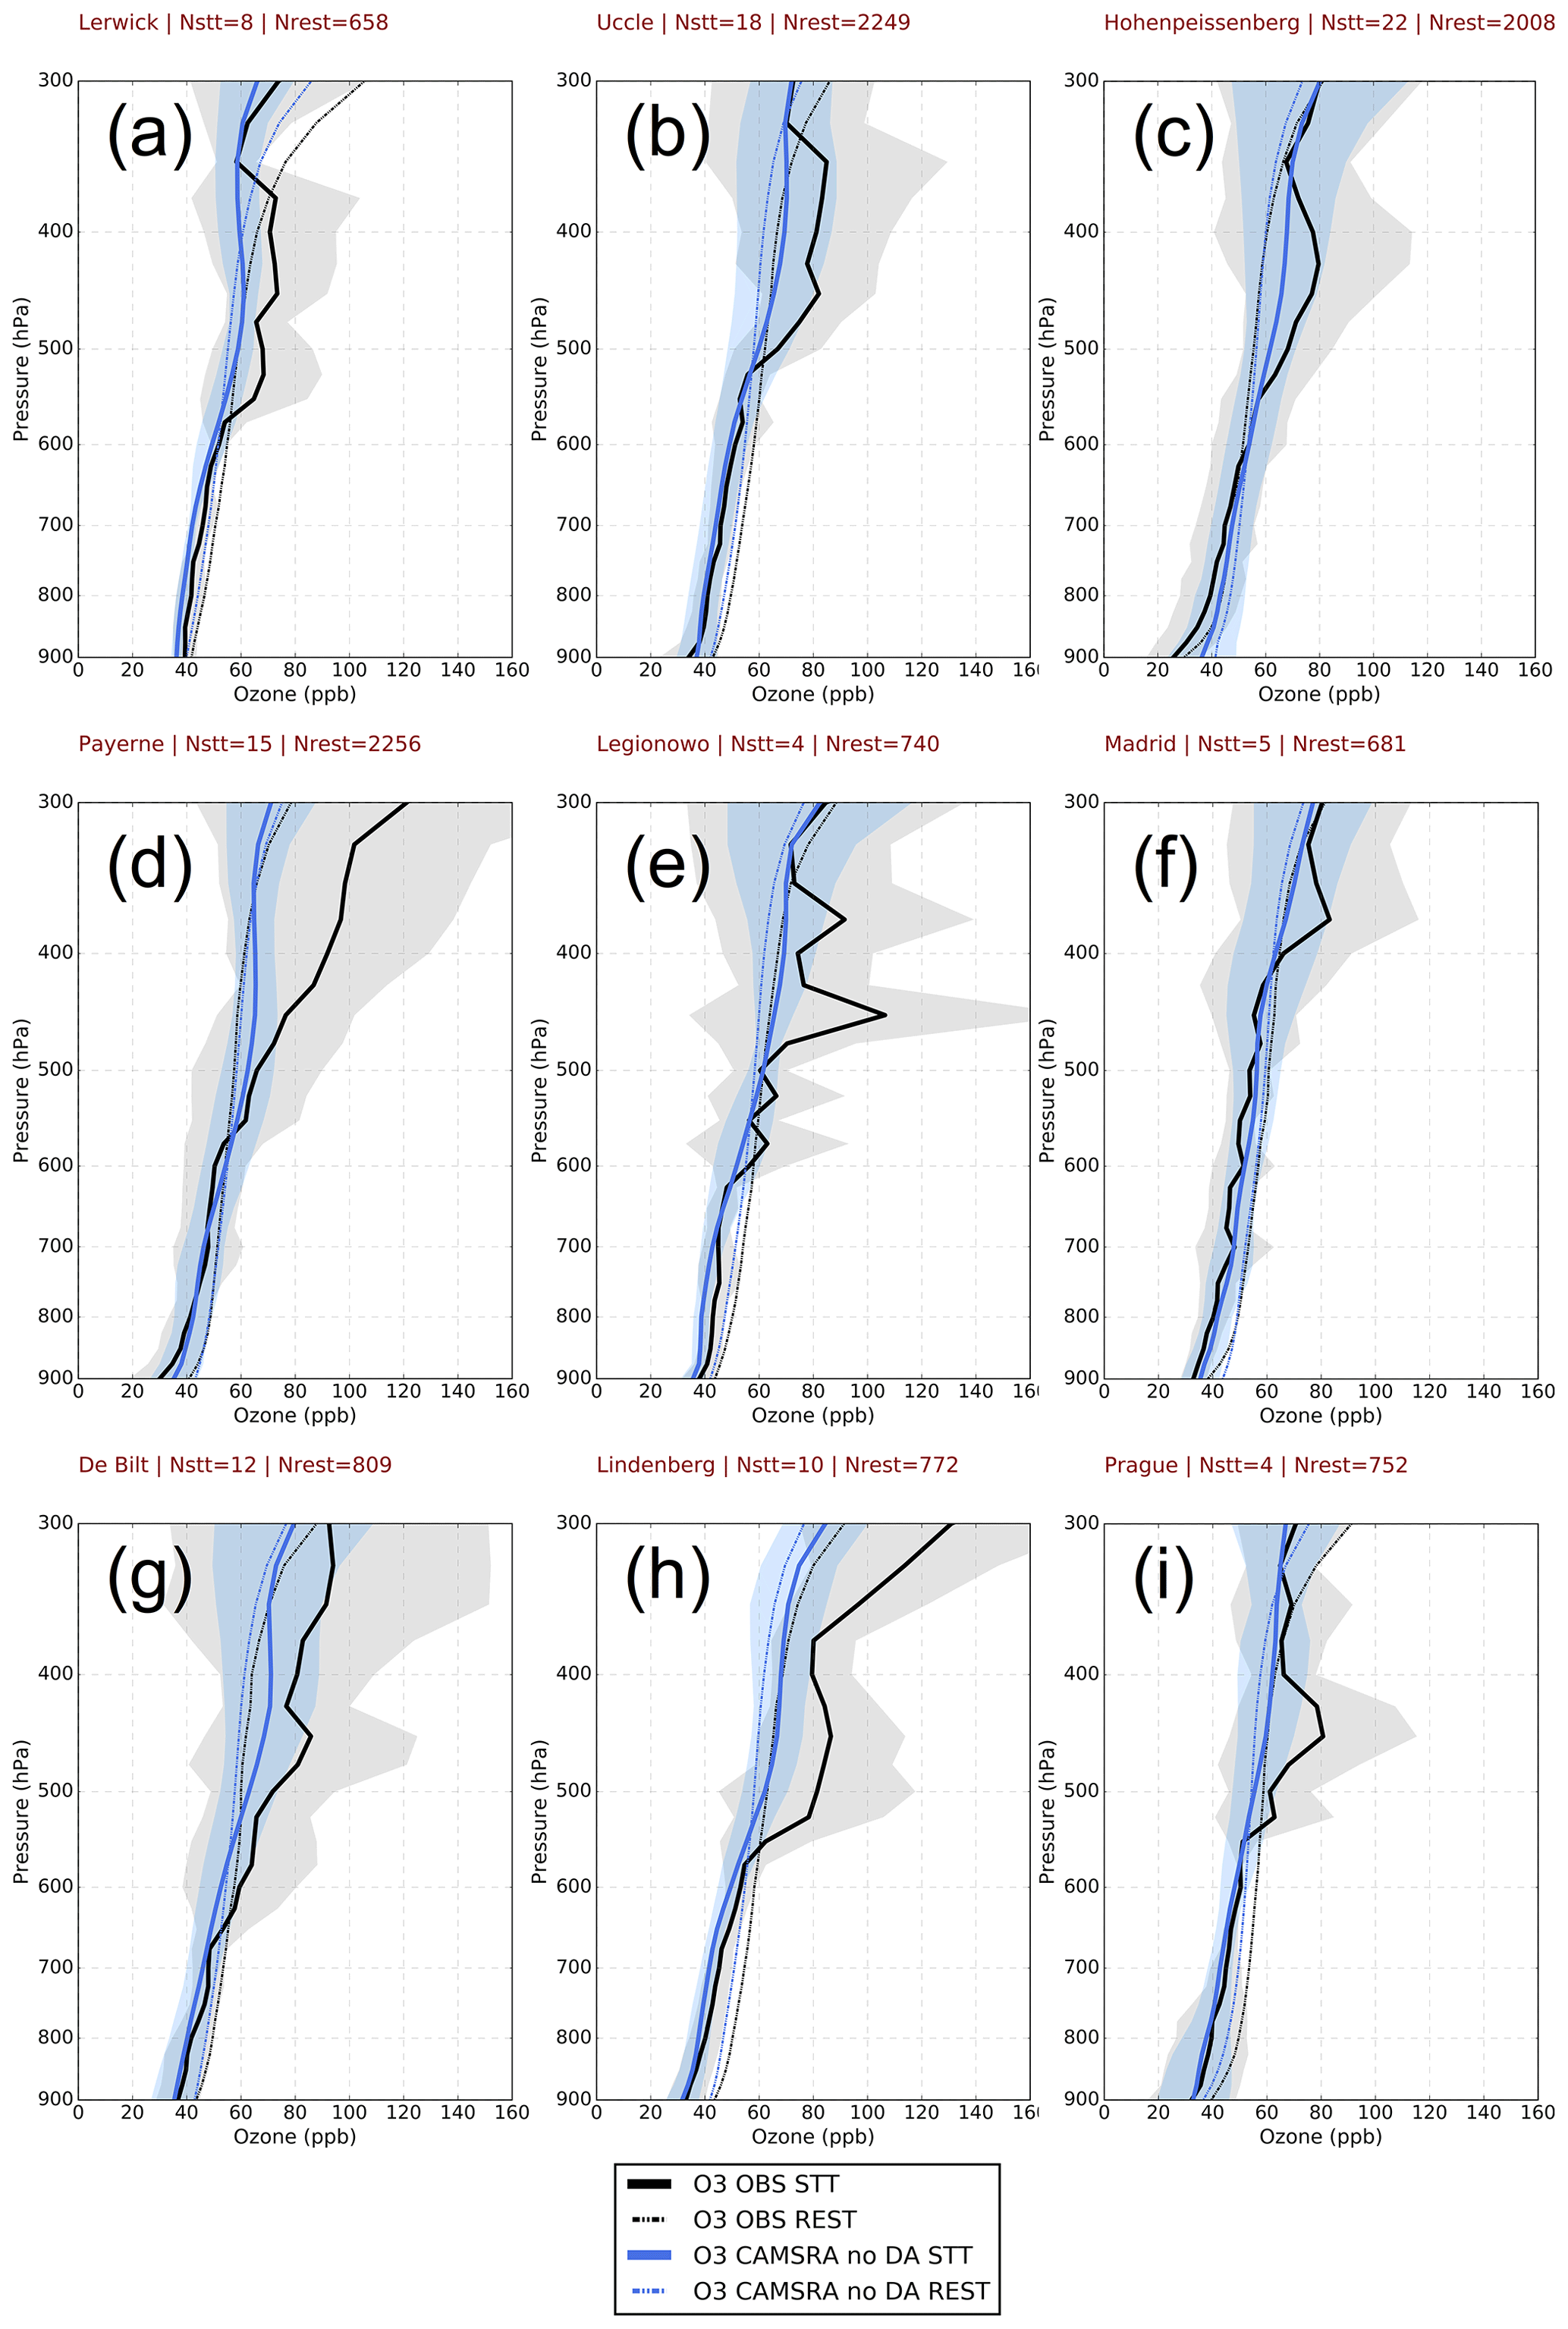
Figure 8Vertical profiles of observed (black) and CAMSRA no DA (blue) ozone concentrations (ppb) during STT events (thick solid line) and during the rest of the events (thin dashed line) at the WOUDC ozonesonde stations of (a) Lerwick (UK), (b) Uccle (Belgium), (c) Hohenpeissenberg (Germany), (d) Payerne (Switzerland), (e) Legionowo (Poland), (f) Madrid (Spain), (g) De Bilt (the Netherlands), (h) Lindenberg (Germany), and (i) Prague (Czech Republic). The grey and light blue areas depict the ± 1 standard deviation of ozone vertical profiles during STT events in observations and CAMSRA no DA, respectively.
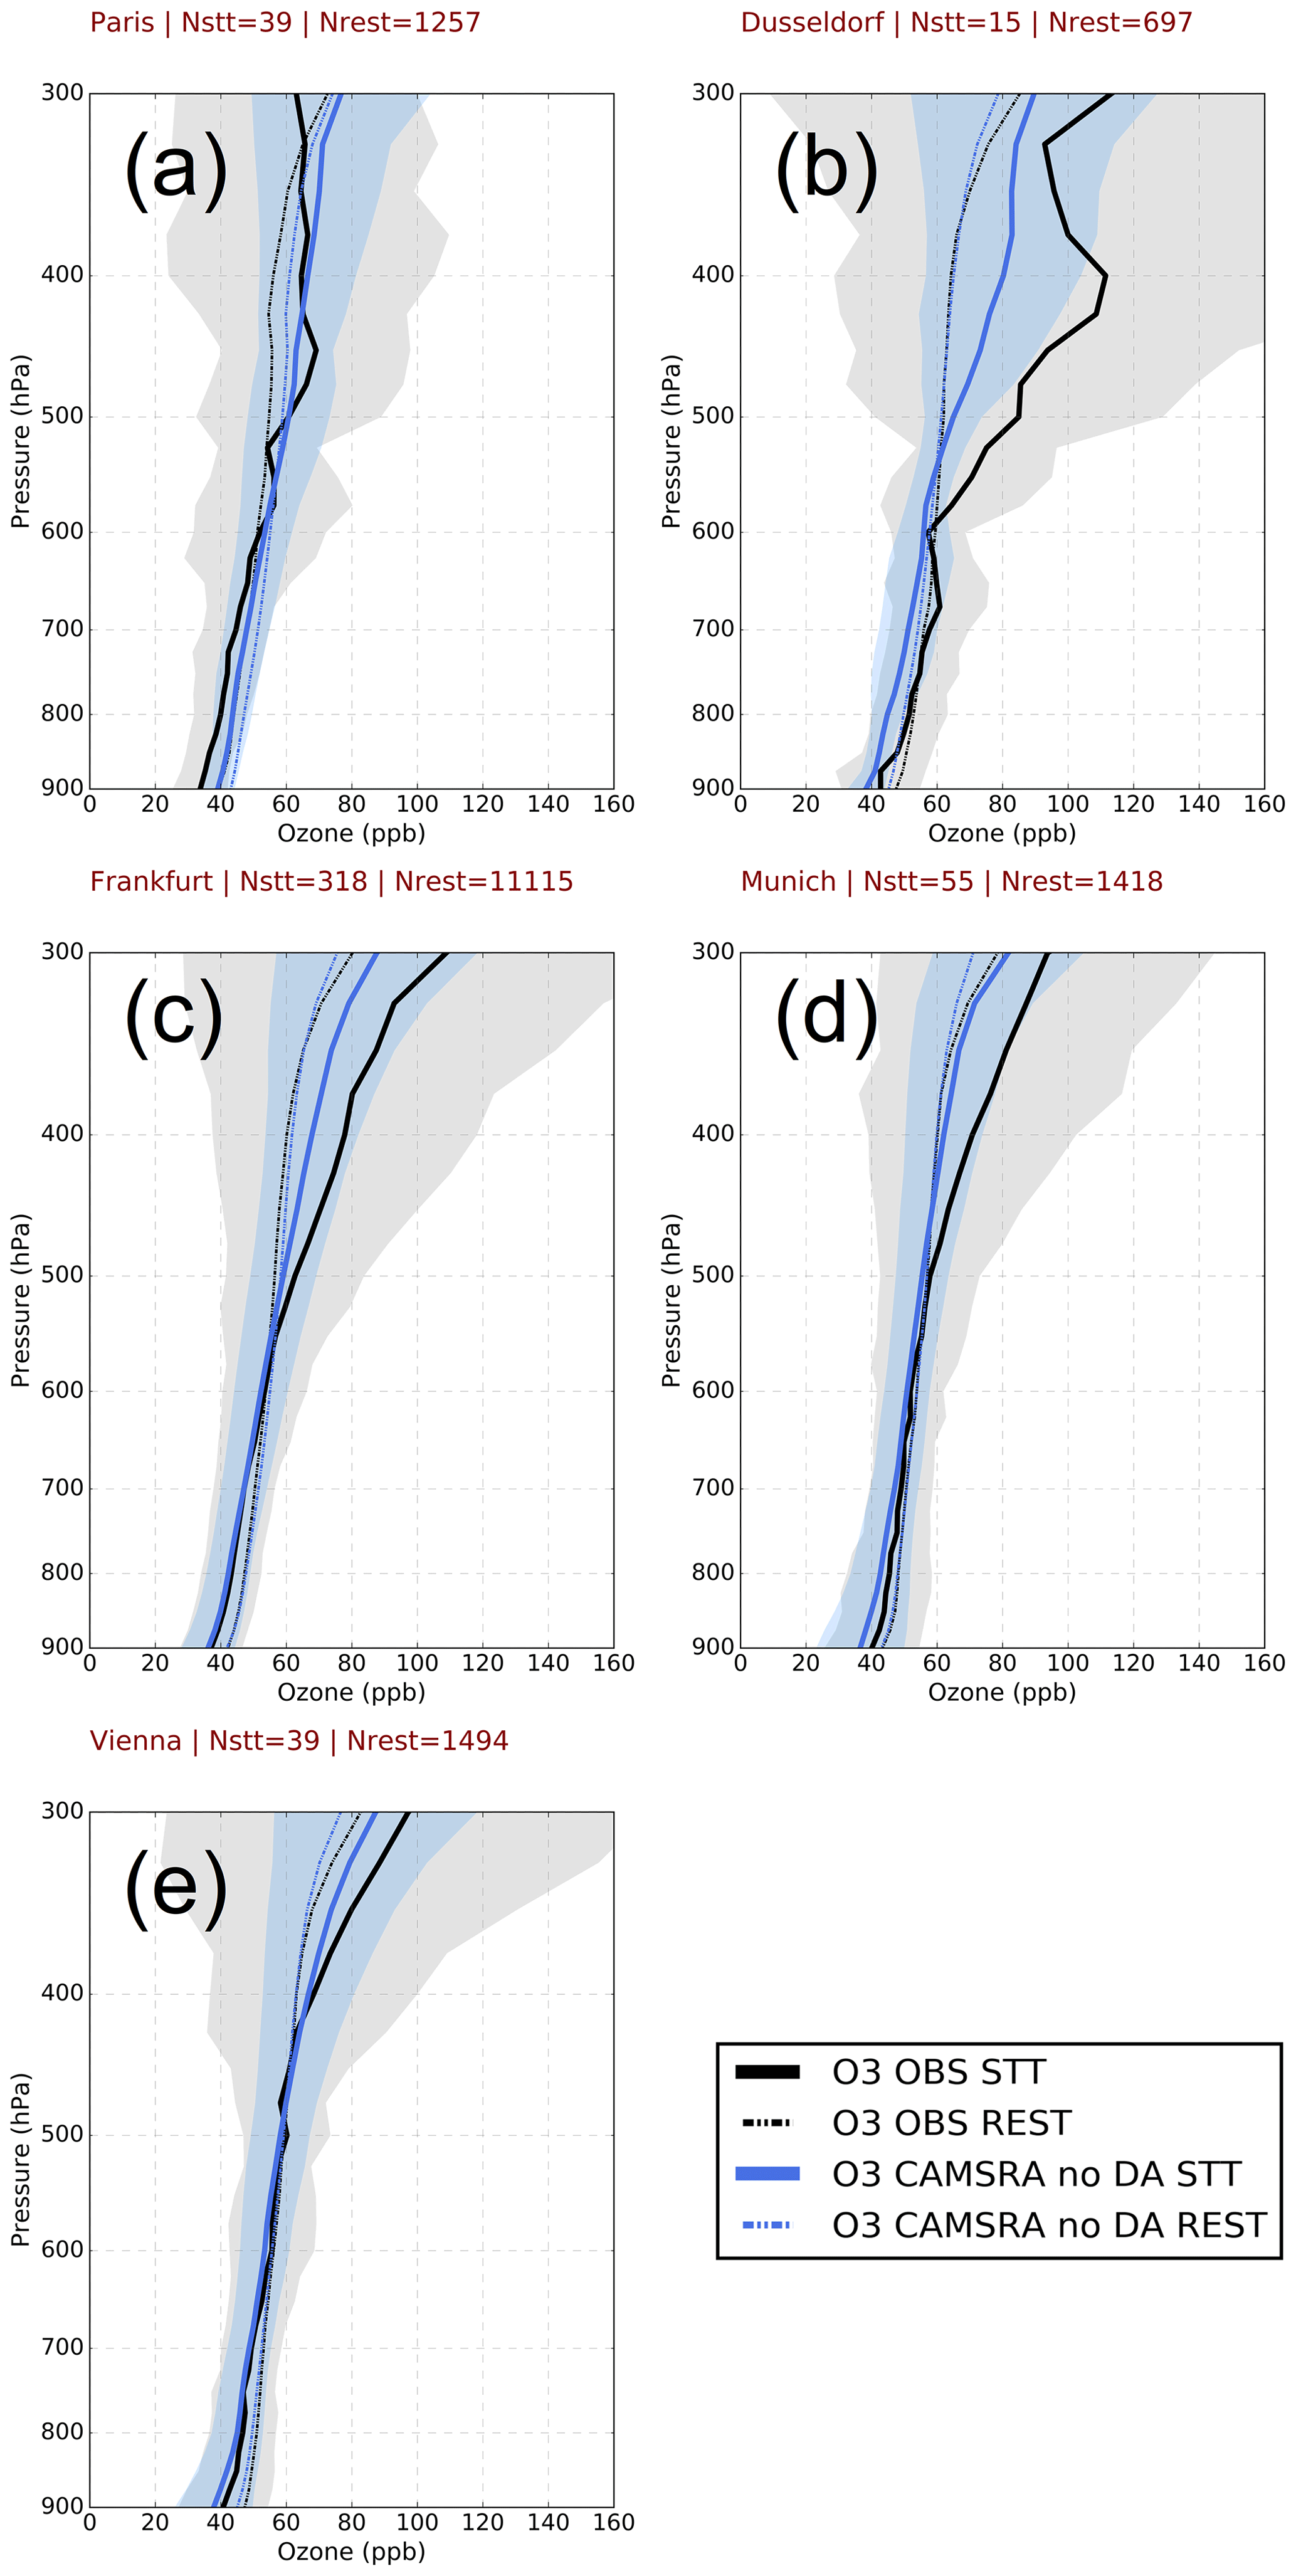
Figure 9Vertical profiles of observed (black) and CAMSRA no DA (blue) ozone concentrations (ppb) during STT events (thick solid line) and during the rest of the events (thin dashed line) at the IAGOS airports of (a) Paris (France), (b) Düsseldorf (Germany), (c) Frankfurt (Germany), (d) Munich (Germany), and (e) Vienna (Austria). The grey and light blue areas depict the ± 1 standard deviation of ozone vertical profiles during STT events in observations and CAMSRA no DA, respectively.
3.2 Evaluation of CAMSRA O3 during STT events
In Figs. 4 and 5 we present CAMSRA and observed O3 profiles averaged during the selected STT events and the rest of events records at the WOUDC ozonesonde sites and IAGOS airports, respectively. Also shown are the respective CAMSRA O3s profiles. As expected, both CAMSRA and observations exhibit higher O3 concentrations in the middle and upper troposphere for the STT events compared to the rest of events records at all examined sites. Similarly, CAMSRA O3s concentrations for STT events are higher than those for the rest of events records, resembling the respective CAMSRA O3 enhancements in the troposphere. This highlights the stratospheric contribution in O3 increases during the selected tropopause folding episodes. Overall, CAMSRA O3 is in a satisfactory agreement with the observed O3 enhancements in the troposphere during the STT events but still exhibits specific limitations. The following feature is seen at some observational sites (Uccle, Hohenpeissenberg, Legionowo, Prague, Paris, and Düsseldorf): although CAMSRA follows the observed O3 increases in the troposphere, it misses the observed decrease back to normal tropospheric O3 values, resulting in overestimation of O3 in the upper troposphere. As mentioned above, the O3 overestimation in the upper troposphere is an already known issue in both CAMS near-real-time analysis and reanalysis products. This might be due to a bias in some of the assimilated data, the likely insufficient vertical resolution of O3 data assimilated (total column and stratospheric profiles) in IFS to capture STT events, and the O3 background error formulation in data assimilation. In particular, CAMSRA O3 vertical profiles during both STT and rest of events exhibit a better agreement in the upper troposphere with observations during the years 2003 and 2004, indicating that the inclusion of the Aura data in the assimilation system from August 2004 and onward is likely to result in O3 overestimation in the upper troposphere (Fig. S2 and S3 in the Supplement). In addition, the individual dynamics and the different vertical location and geometrical characteristics of the selected STT events, especially for observational sites with a less extended number of events, may form somehow unique structures of CAMSRA and observed O3 deviations. In particular, for sites exhibiting a very small number of STT events over the years (e.g., Legionowo), the O3 vertical variability is not smoothed out, and CAMSRA is not found to be able to reproduce the high-resolution features of O3 increase, probably due to its coarser vertical resolution compared to ozonesonde measurements.
For a quantitative comparison between CAMSRA and observations, in Fig. 6 we present the vertical profiles of fractional gross error (FGE) and modified normalized mean bias (MNMB) of CAMSRA O3 for the WOUDC ozonesonde sites and IAGOS airports. The FGE is a normalized version of the mean error, while the MNMB is a normalized version of the mean bias. Both metrics are normalized by the mean of the observed and model (here CAMSRA) values, being dimensionless and relative, and they are thus suitable to use at different heights in the troposphere. FGE and MNMB are insensitive to outliers in the distribution and range between 0 to 2 and −2 to 2, respectively, behaving symmetrically with respect to underestimation and overestimation:
where Mi is the model (CAMSRA here) value for the ith STT event, Oi is the corresponding observed value, and N is the number of STT events. As can be seen in Fig. 6a, the FGE is mostly increasing with height, with values >0.3 found above 400 hPa at several sites. Indicatively, the median FGE value among the examined sites for each pressure level is >0.2 above 400 hPa (Fig. 7). As expected, the respective profiles of MNMB in Fig. 6b indicate that the biases are mostly positive, confirming the aforementioned discussion. The median MNMB value among the examined sites for each pressure level ranges from approximately 0 to +0.1 below 400 hPa (Fig. 7), which is in agreement with the MNMB values of CAMSRA O3 in the free troposphere reported by Inness et al. (2019a) and Wagner et al. (2021). Above 400 hPa, the respective median MNMB value ranges from +0.1 to +0.19 (Fig. 7).
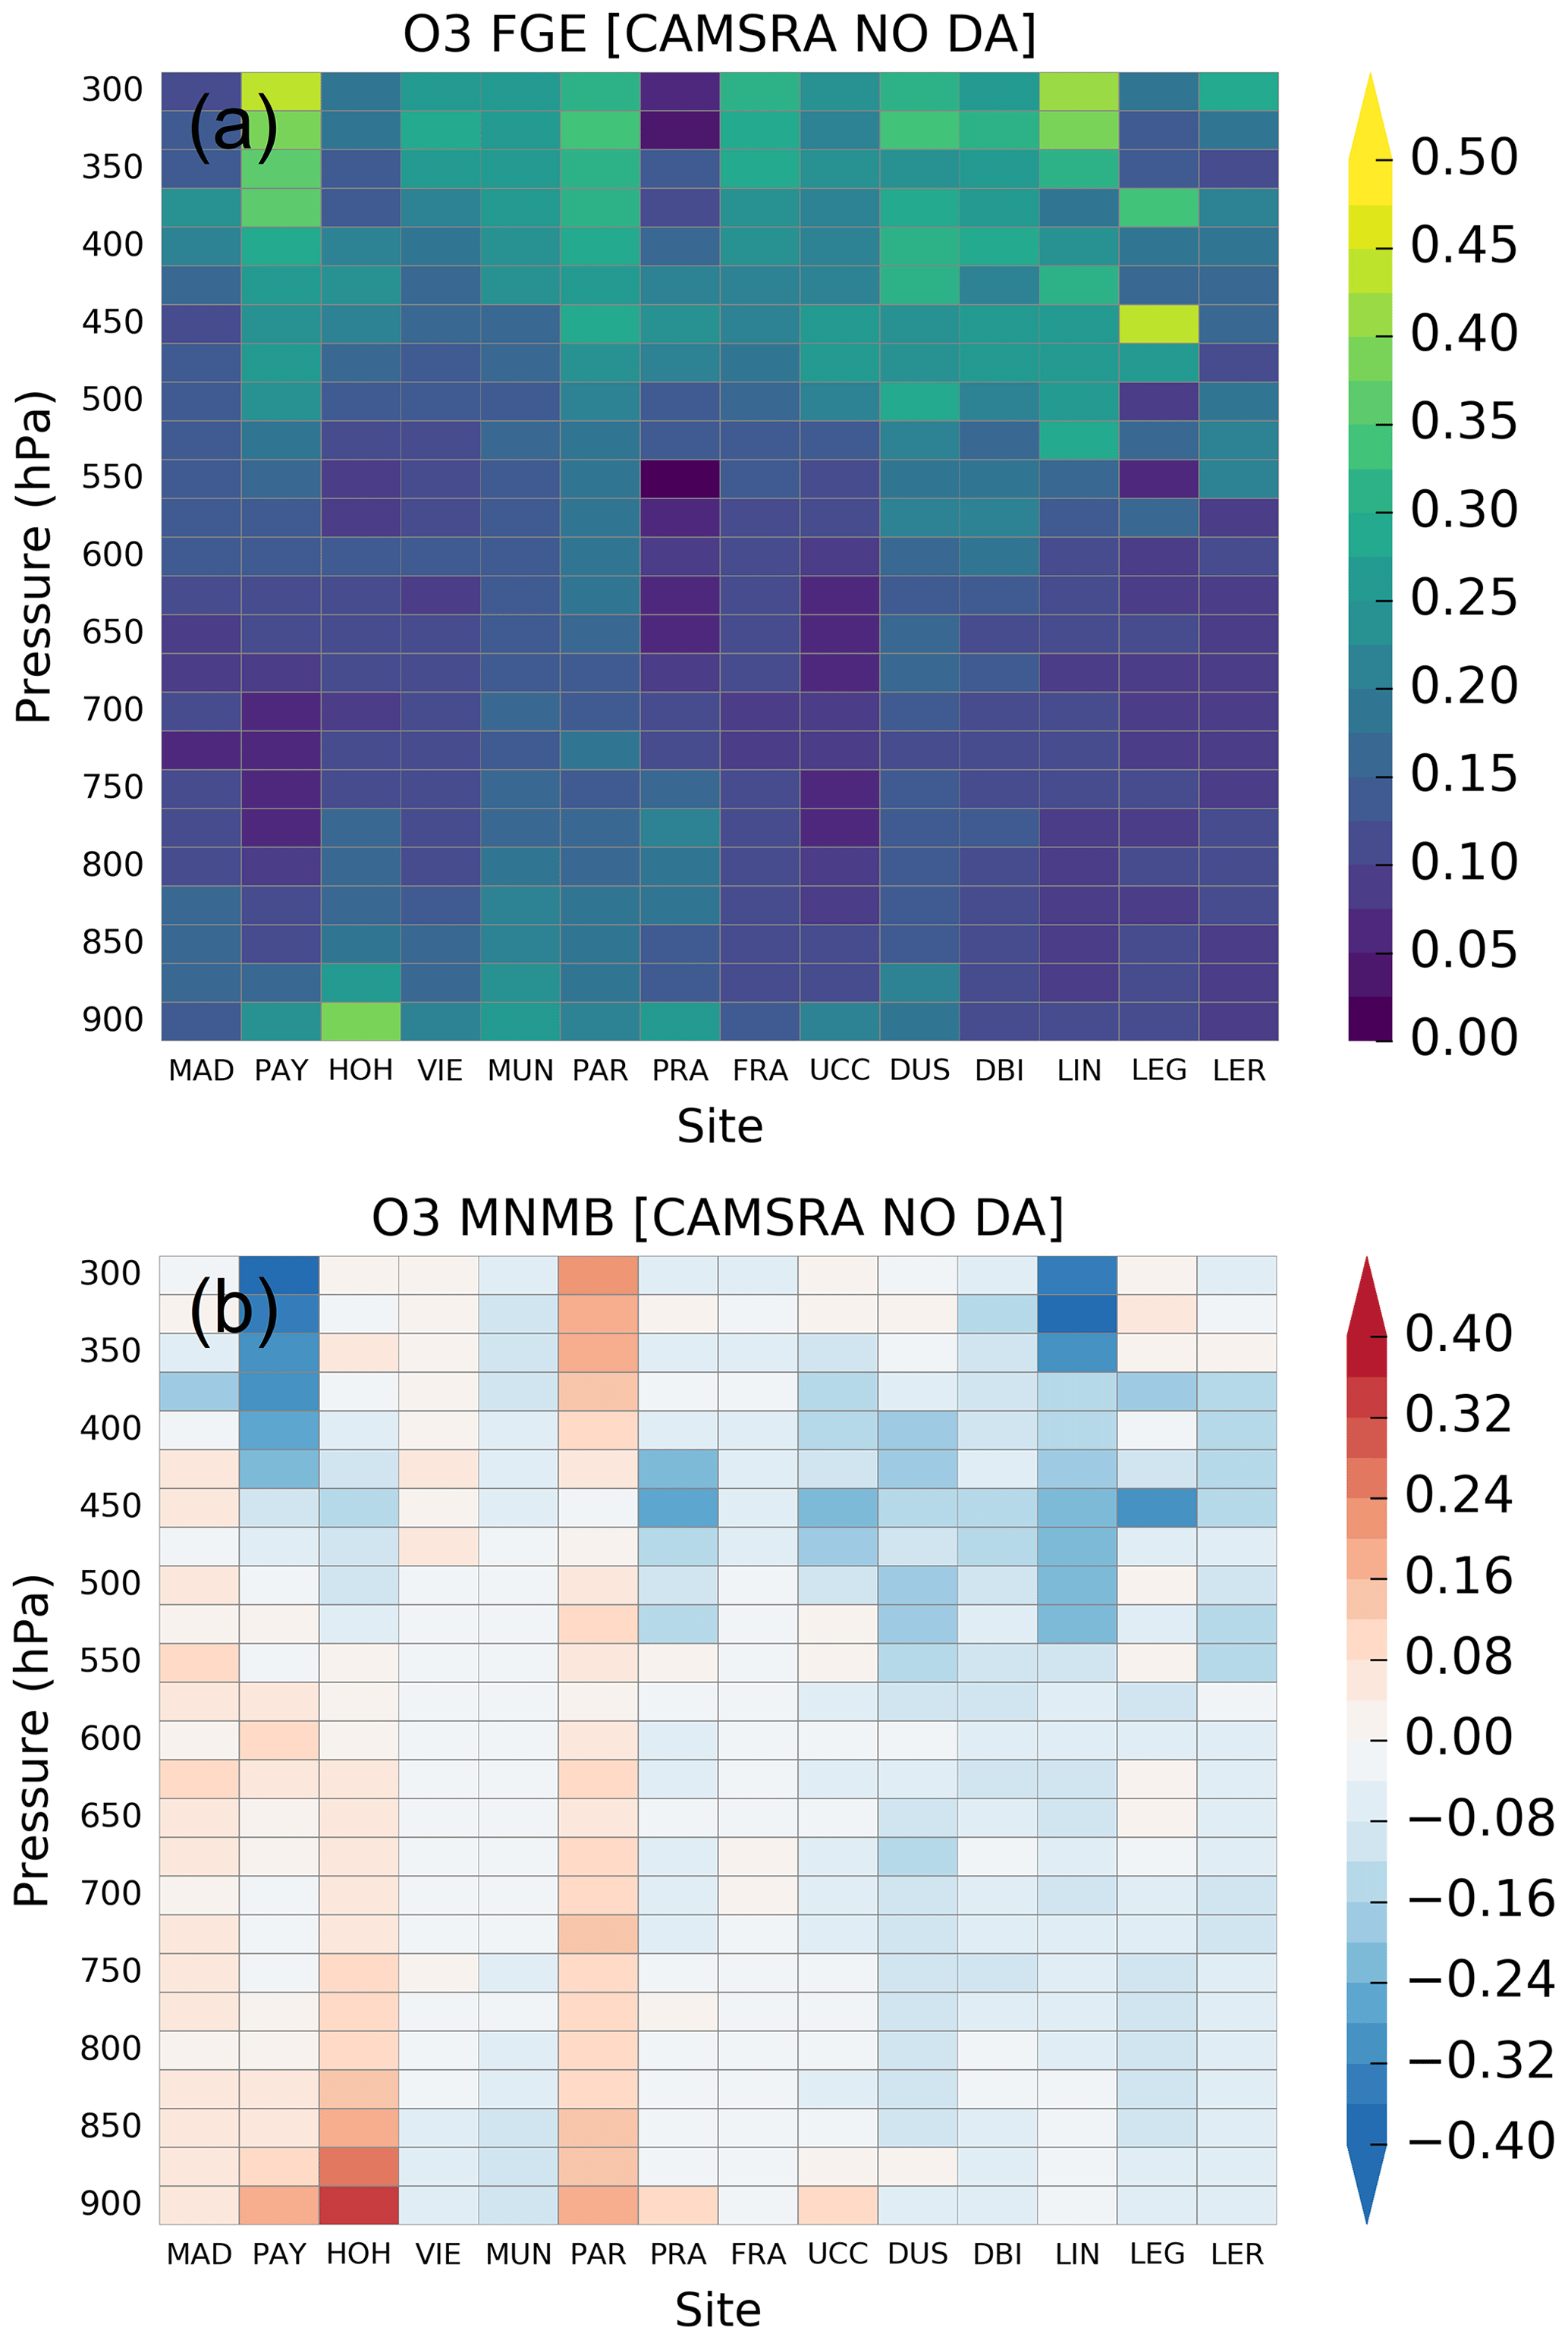
Figure 10Vertical profiles of CAMSRA no DA ozone (a) FGE and (b) MNMB for the examined WOUDC ozonesonde stations and IAGOS airports over the period 2003–2018. The observational sites are ordered by increasing latitude.
3.3 The role of chemical data assimilation
Here we investigate the role of chemical data assimilation in CAMSRA O3 representation during the selected STT events. To this end, we present CAMSRA no DA and observed O3 profiles averaged during the selected STT events and the rest of events, at the WOUDC ozonesonde sites and IAGOS airports in Figs. 8 and 9, respectively. As depicted in both figures, although CAMSRA no DA exhibits relatively high O3 concentrations during the STT events, compared to the rest of events it clearly underestimates the observed O3 increases in the troposphere at all sites above about 500 hPa. This, in combination with Figs. 4 and 5, indicates that chemical data assimilation boosts O3 concentrations in the direction of capturing the observed O3 enhancement structures in the middle and upper troposphere. Similar results for the role of IFS chemical data assimilation in O3 representation were reported by Akritidis et al. (2018) in their evaluation of CAMS-global forecast system during a deep STT event over Europe.
The FGE values of CAMSRA no DA O3 shown in Fig. 10a indicate similar values to that of CAMSRA, with an error increase close to O3 enhancements in the upper troposphere. The respective MNMB values illustrated in Fig. 10b reveal overall an underestimation of O3 during the STT events. The median FGE and MNMB values depicted in Fig. 7 suggest an overall improvement of MNMB and FGE in CAMSRA due to chemical data assimilation between 500 and 400 hPa and a deterioration above 350 hPa reflecting the aforementioned CAMSRA O3 overestimation in the upper troposphere.
A process-oriented evaluation of CAMS reanalysis O3 during tropopause folding events over the period 2003–2018 is performed using WOUDC ozonesonde data and IAGOS aircraft measurements. The selected STT events were obtained from the CAMSRA tropopause folds database by Akritidis et al. (2021), which was constructed with the implementation of the 3-D labeling and fold detection algorithm by Škerlak et al. (2015). Moreover, the role of chemical data assimilation in O3 representation during the examined STT events was investigated using a CAMS control simulation without chemical data assimilation. The most notable findings of the study are summarized as follows.
-
CAMSRA reproduces the observed O3 increases in the troposphere during the examined folding events, which as indicated by the respective O3s profiles are of stratospheric origin.
-
For some sites CAMSRA misses the observed return of O3 concentrations back to normal tropospheric levels, resulting in an overestimation of O3 in the upper troposphere, with FGE values at 350 hPa ranging from 0.13 to 0.38 (median of 0.28) at the observational sites.
-
The use of chemical data assimilation in IFS is found to be beneficial for the representation of CAMSRA O3 enhancements in the troposphere during the STT events. However, it leads to an overestimation of O3 concentrations at the upper portion of O3 increases.
-
Overall, and in terms of O3 bias and absolute bias, only a small improvement is found between 500 and 400 hPa due to chemical data assimilation implementation.
The present analysis indicates that CAMSRA satisfactorily reproduces the observed O3 increases in the troposphere during the tropopause folding events. Although IFS chemical data assimilation helps CAMSRA O3 to follow the observed O3 increases, it mostly leads to O3 overestimation in the upper troposphere. Future improvements to the quality and vertical resolution of the assimilated O3 products, increases in the vertical resolution of the IFS, and a reassessment of the O3 background error statistics are expected to advance the performance of future IFS-based reanalyses in capturing O3 variability during STT events.
The CAMS Reanalysis data (Inness et al., 2019b) were obtained from ECMWF's web repository at https://apps.ecmwf.int/data-catalogues/cams-reanalysis/?class=mc&expver=eac4 (last access: 2 March 2020) through the corresponding WebAPI and are also available at the CAMS Atmosphere Data Store (ADS) https://ads.atmosphere.copernicus.eu/cdsapp#!/dataset/cams-global-reanalysis-eac4?tab=overview (last access: 10 May 2022). The CAMS control simulation without data assimilation was obtained from the ECMWF's Copernicus Helpdesk. This study contains modified Copernicus Atmosphere Monitoring Service Information (2020); neither the European Commission nor ECMWF is responsible for any use that may be made of the information it contains. The ozonesonde data were downloaded from the World Ozone and Ultraviolet Radiation Data Center (WOUDC) at https://woudc.org/ (last access: 7 February 2022). The IAGOS aircraft measurements were obtained from the IAGOS database at http://iagos-data.fr/ (last access: 21 April 2020).
The supplement related to this article is available online at: https://doi.org/10.5194/acp-22-6275-2022-supplement.
DA designed the study, performed the analysis, and wrote the manuscript. AP adopted the 3-D labeling algorithm and performed the fold identification calculations. JF and AI have contributed to the development of IFS and the production of CAMS reanalysis of atmospheric composition product. All authors contributed to reviewing and editing of the manuscript and interpretation of the results.
At least one of the (co-)authors is a member of the editorial board of Atmospheric Chemistry and Physics. The peer-review process was guided by an independent editor, and the authors also have no other competing interests to declare.
Publisher's note: Copernicus Publications remains neutral with regard to jurisdictional claims in published maps and institutional affiliations.
This research is co-financed by Greece and the European Union (European Social Fund–ESF) through the Operational Programme “Human Resources Development, Education and Lifelong Learning” in the context of the project “Reinforcement of Postdoctoral Researchers – 2nd Cycle” (MIS-5033021), implemented by the State Scholarships Foundation (IKY). MOZAIC/CARIBIC/IAGOS data were created with support from the European Commission, national agencies in Germany (BMBF), France (MESR), and the UK (NERC), and the IAGOS member institutions (https://www.iagos.org/iagos-partner/, last access: 10 May 2022). The participating airlines (Lufthansa, Air France, Austrian, China Airlines, Iberia, Cathay Pacific, Air Namibia, Sabena) supported IAGOS by carrying the measurement equipment free of charge since 1994. The data are available at http://www.iagos.fr (last access: 10 May 2022) thanks to additional support from AERISM. We also acknowledge the WOUDC for making the ozonesonde data available. Michael Sprenger (ETH Zurich) is acknowledged for the original development of the 3-D labeling algorithm, which is used in the present study to identify tropopause folds. The authors gratefully acknowledge the computing facilities of the German Climate Computing Center (Deutsches Klimarechenzentrum, DKRZ). The Copernicus Atmosphere Monitoring Service is operated by the European Centre for Medium‐Range Weather Forecasts on behalf of the European Commission as part of the Copernicus program (http://copernicus.eu, last access: 10 May 2022), and CAMS data are freely available from http://atmosphere.copernicus.eu/data (last access: 10 May 2022).
This research has been supported by the State Scholarships Foundation (grant no. MIS-5033021).
The article processing charges for this open-access publication were covered by the Max Planck Society.
This paper was edited by Andreas Petzold and reviewed by two anonymous referees.
Akritidis, D., Pozzer, A., Zanis, P., Tyrlis, E., Škerlak, B., Sprenger, M., and Lelieveld, J.: On the role of tropopause folds in summertime tropospheric ozone over the eastern Mediterranean and the Middle East, Atmos. Chem. Phys., 16, 14025–14039, https://doi.org/10.5194/acp-16-14025-2016, 2016. a, b
Akritidis, D., Katragkou, E., Zanis, P., Pytharoulis, I., Melas, D., Flemming, J., Inness, A., Clark, H., Plu, M., and Eskes, H.: A deep stratosphere-to-troposphere ozone transport event over Europe simulated in CAMS global and regional forecast systems: analysis and evaluation, Atmos. Chem. Phys., 18, 15515–15534, https://doi.org/10.5194/acp-18-15515-2018, 2018. a, b, c, d
Akritidis, D., Pozzer, A., and Zanis, P.: On the impact of future climate change on tropopause folds and tropospheric ozone, Atmos. Chem. Phys., 19, 14387–14401, https://doi.org/10.5194/acp-19-14387-2019, 2019. a
Akritidis, D., Pozzer, A., Flemming, J., Inness, A., and Zanis, P.: A Global Climatology of Tropopause Folds in CAMS and MERRA-2 Reanalyses, J. Geophys. Res.-Atmos., 126, e2020JD034115, https://doi.org/10.1029/2020JD034115, 2021. a, b, c, d
Antonescu, B., Vaughan, G., and Schultz, D. M.: A Five-Year Radar-Based Climatology of Tropopause Folds and Deep Convection over Wales, United Kingdom, Mon. Weather Rev., 141, 1693–1707, https://doi.org/10.1175/MWR-D-12-00246.1, 2013. a
Aschmann, J., Sinnhuber, B.-M., Atlas, E. L., and Schauffler, S. M.: Modeling the transport of very short-lived substances into the tropical upper troposphere and lower stratosphere, Atmos. Chem. Phys., 9, 9237–9247, https://doi.org/10.5194/acp-9-9237-2009, 2009. a
Beekmann, M., Ancellet, G., Megie, G., Smit, H., and Kley, D.: Intercomparison campaign of vertical ozone profiles including electrochemical sondes of ECC and Brewer-Mast type and a ground based UV-differential absorption lidar, J. Atmos. Chem., 19, 259–288, https://doi.org/10.1007/BF00694614, 1994. a
Beekmann, M., Ancellet, G., Blonsky, S., Muer, D., Ebel, A., Elbern, H., Hendricks, J., Kowol, J., Mancier, C., Sladkovic, R., Smit, H., Speth, P., Trickl, T., and Haver, P.: Regional and Global Tropopause Fold Occurrence and Related Ozone Flux Across the Tropopause, J. Atmos. Chem., 28, 29–44, https://doi.org/10.1023/A:1005897314623, 1997. a
Blot, R., Nedelec, P., Boulanger, D., Wolff, P., Sauvage, B., Cousin, J.-M., Athier, G., Zahn, A., Obersteiner, F., Scharffe, D., Petetin, H., Bennouna, Y., Clark, H., and Thouret, V.: Internal consistency of the IAGOS ozone and carbon monoxide measurements for the last 25 years, Atmos. Meas. Tech., 14, 3935–3951, https://doi.org/10.5194/amt-14-3935-2021, 2021. a
Brewer, A. W. and Milford, J. R.: The Oxford-Kew Ozone Sonde, P. Roy. Soc. Lond. A, 256, 470–495, 1960. a
Cariolle, D. and Déqué, M.: Southern hemisphere medium-scale waves and total ozone disturbances in a spectral general circulation model, J. Geophys. Res.-Atmos., 91, 10825–10846, https://doi.org/10.1029/JD091iD10p10825, 1986. a
Cariolle, D. and Teyssèdre, H.: A revised linear ozone photochemistry parameterization for use in transport and general circulation models: multi-annual simulations, Atmos. Chem. Phys., 7, 2183–2196, https://doi.org/10.5194/acp-7-2183-2007, 2007. a
Cooper, O. R., Stohl, A., Hübler, G., Hsie, E. Y., Parrish, D. D., Tuck, A. F., Kiladis, G. N., Oltmans, S. J., Johnson, B. J., Shapiro, M., Moody, J. L., and Lefohn, A. S.: Direct transport of midlatitude stratospheric ozone into the lower troposphere and marine boundary layer of the tropical Pacific Ocean, J. Geophys. Res.-Atmos., 110, D23310, https://doi.org/10.1029/2005JD005783, 2005. a
Cristofanelli, P., Bonasoni, P., Tositti, L., Bonafè, U., Calzolari, F., Evangelisti, F., Sandrini, S., and Stohl, A.: A 6-year analysis of stratospheric intrusions and their influence on ozone at Mt. Cimone (2165 m above sea level), J. Geophys. Res.-Atmos., 111, D03306, https://doi.org/10.1029/2005JD006553, 2006. a
Danielsen, E. F. and Mohnen, V. A.: Project Dustorm report: Ozone transport, in situ measurements, and meteorological analyses of tropopause folding, J. Geophys. Res., 82, 5867–5877, 1977. a
Elbern, H., Hendricks, J., and Ebel, A.: A Climatology of Tropopause Folds by Global Analyses, Theor. Appl. Climatol., 59, 181–200, https://doi.org/10.1007/s007040050023, 1998. a
Errera, Q., Bennouna, Y., Schulz, M., Eskes, H., Basart, S., Benedictow, S., Blechschmidt, A.-M., Chabrillat, S., Clark, H., Cuevas, E., Flentje, H., Hansen, K., Im, U., Kapsomenakis, J., L. B., Petersen, K., Richter, A., Sudarchikova, N., Thouret, V., Wagner, A., Wang, Y., Warneke, T., and Zerefos, C.: Validation report of the CAMS global Reanalysis of aerosols and reactive gases, years 2003–2020, Copernicus Atmosphere Monitoring Service (CAMS) report, CAMS84_2018SC3_D5.1.1-2020.pdf, June 2021, https://doi.org/10.24380/8gf9-k005, 2021. a
Flemming, J., Huijnen, V., Arteta, J., Bechtold, P., Beljaars, A., Blechschmidt, A.-M., Diamantakis, M., Engelen, R. J., Gaudel, A., Inness, A., Jones, L., Josse, B., Katragkou, E., Marecal, V., Peuch, V.-H., Richter, A., Schultz, M. G., Stein, O., and Tsikerdekis, A.: Tropospheric chemistry in the Integrated Forecasting System of ECMWF, Geosci. Model Dev., 8, 975–1003, https://doi.org/10.5194/gmd-8-975-2015, 2015. a
Flemming, J., Benedetti, A., Inness, A., Engelen, R. J., Jones, L., Huijnen, V., Remy, S., Parrington, M., Suttie, M., Bozzo, A., Peuch, V.-H., Akritidis, D., and Katragkou, E.: The CAMS interim Reanalysis of Carbon Monoxide, Ozone and Aerosol for 2003–2015, Atmos. Chem. Phys., 17, 1945–1983, https://doi.org/10.5194/acp-17-1945-2017, 2017. a
Granier, C., Bessagnet, B., Bond, T., D'Angiola, A., van der Denier Gon, H., Frost, G. J., Heil, A., Kaiser, J. W., Kinne, S., Klimont, Z., Kloster, S., Lamarque, J.-F., Liousse, C., Masui, T., Meleux, F., Mieville, A., Ohara, T., Raut, J.-C., Riahi, K., Schultz, M. G., Smith, S. J., Thompson, A., van Aardenne, J., van der Werf, G. R., and van Vuuren, D. P.: Evolution of anthropogenic and biomass burning emissions of air pollutants at global and regional scales during the 1980–2010 period, Clim. Change, 109, 163–190, https://doi.org/10.1007/s10584-011-0154-1, 2011. a
Griffiths, P. T., Murray, L. T., Zeng, G., Shin, Y. M., Abraham, N. L., Archibald, A. T., Deushi, M., Emmons, L. K., Galbally, I. E., Hassler, B., Horowitz, L. W., Keeble, J., Liu, J., Moeini, O., Naik, V., O'Connor, F. M., Oshima, N., Tarasick, D., Tilmes, S., Turnock, S. T., Wild, O., Young, P. J., and Zanis, P.: Tropospheric ozone in CMIP6 simulations, Atmos. Chem. Phys., 21, 4187–4218, https://doi.org/10.5194/acp-21-4187-2021, 2021. a
Guenther, A., Karl, T., Harley, P., Wiedinmyer, C., Palmer, P. I., and Geron, C.: Estimates of global terrestrial isoprene emissions using MEGAN (Model of Emissions of Gases and Aerosols from Nature), Atmos. Chem. Phys., 6, 3181–3210, https://doi.org/10.5194/acp-6-3181-2006, 2006. a
Gulev, S. K., Thorne, P. W., Ahn, J., Dentener, F. J., Domingues, C. M., Gerland, S., Gong, D., Kaufman, D. S., Nnamchi, H. C., Quaas, J., Rivera, J. A., Sathyendranath, S., Smith, S. L., Trewin, B., von Schuckmann, K., and Vose, R. S.: Changing State of the Climate System. In Climate Change 2021: The Physical Science Basis. Contribution of Working Group I to the Sixth Assessment Report of the Intergovernmental Panel on Climate Change, edited by: Masson-Delmotte, V., Zhai, P., Pirani, A., Connors, S. L., Péan, C., Berger, S., Caud, N., Chen, Y., Goldfarb, L., M. Gomis, I., Huang, M., Leitzell, K., Lonnoy, E., Matthews, J. B. R., Maycock, T. K., Waterfield, T., Yelekçi, O., Yu, R., and Zhou, B., Cambridge University Press, Cambridge, United Kingdom and New York, NY, USA, 287–422, https://doi.org/10.1017/9781009157896.004, 2021. a
Holton, J. R., Haynes, P. H., McIntyre, M. E., Douglass, A. R., Rood, R. B., and Pfister, L.: Stratosphere-troposphere exchange, Rev. Geophys., 33, 403–439, https://doi.org/10.1029/95RG02097, 1995. a
Huijnen, V., Miyazaki, K., Flemming, J., Inness, A., Sekiya, T., and Schultz, M. G.: An intercomparison of tropospheric ozone reanalysis products from CAMS, CAMS interim, TCR-1, and TCR-2, Geosci. Model Dev., 13, 1513–1544, https://doi.org/10.5194/gmd-13-1513-2020, 2020. a
Inness, A., Baier, F., Benedetti, A., Bouarar, I., Chabrillat, S., Clark, H., Clerbaux, C., Coheur, P., Engelen, R. J., Errera, Q., Flemming, J., George, M., Granier, C., Hadji-Lazaro, J., Huijnen, V., Hurtmans, D., Jones, L., Kaiser, J. W., Kapsomenakis, J., Lefever, K., Leitão, J., Razinger, M., Richter, A., Schultz, M. G., Simmons, A. J., Suttie, M., Stein, O., Thépaut, J.-N., Thouret, V., Vrekoussis, M., Zerefos, C., and the MACC team: The MACC reanalysis: an 8 yr data set of atmospheric composition, Atmos. Chem. Phys., 13, 4073–4109, https://doi.org/10.5194/acp-13-4073-2013, 2013. a
Inness, A., Ades, M., Agustí-Panareda, A., Barré, J., Benedictow, A., Blechschmidt, A.-M., Dominguez, J. J., Engelen, R., Eskes, H., Flemming, J., Huijnen, V., Jones, L., Kipling, Z., Massart, S., Parrington, M., Peuch, V.-H., Razinger, M., Remy, S., Schulz, M., and Suttie, M.: The CAMS reanalysis of atmospheric composition, Atmos. Chem. Phys., 19, 3515–3556, https://doi.org/10.5194/acp-19-3515-2019, 2019a. a, b, c, d
Inness, A., Ades, M., Agustí-Panareda, A., Barré, J., Benedictow, A., Blechschmidt, A., Dominguez, J., Engelen, R., Eskes, H., Flemming, J., Huijnen, V., Jones, L., Kipling, Z., Massart, S., Parrington, M., Peuch, V.-H., Razinger, M., Remy, S., Schulz, M., and Suttie, M.: CAMS global reanalysis (EAC4), Copernicus Atmosphere Monitoring Service (CAMS) Atmosphere Data Store (ADS), https://ads.atmosphere.copernicus.eu/cdsapp#!/dataset/cams-global-reanalysis-eac4?tab=overview (last access: 10 May 2022), 2019b. a
Kaiser, J. W., Heil, A., Andreae, M. O., Benedetti, A., Chubarova, N., Jones, L., Morcrette, J.-J., Razinger, M., Schultz, M. G., Suttie, M., and van der Werf, G. R.: Biomass burning emissions estimated with a global fire assimilation system based on observed fire radiative power, Biogeosciences, 9, 527–554, https://doi.org/10.5194/bg-9-527-2012, 2012. a
Katragkou, E., Zanis, P., Tsikerdekis, A., Kapsomenakis, J., Melas, D., Eskes, H., Flemming, J., Huijnen, V., Inness, A., Schultz, M. G., Stein, O., and Zerefos, C. S.: Evaluation of near-surface ozone over Europe from the MACC reanalysis, Geosci. Model Dev., 8, 2299–2314, https://doi.org/10.5194/gmd-8-2299-2015, 2015. a
Knowland, K. E., Doherty, R. M., and Hodges, K. I.: The effects of springtime mid-latitude storms on trace gas composition determined from the MACC reanalysis, Atmos. Chem. Phys., 15, 3605–3628, https://doi.org/10.5194/acp-15-3605-2015, 2015. a
Knowland, E., Ott, L., Duncan, B., and Wargan, K.: Stratospheric intrusion-influenced ozone air quality exceedances investigated in the NASA MERRA-2 reanalysis, Geophys. Res. Lett., 44, 10–691, https://doi.org/10.1002/2017GL074532, 2017. a, b
Komhyr, W.: Electrochemical concentration cells for gas analysis, Ann. Geophys., 25, 203–210, 1969. a
Komhyr, W. D., Barnes, R. A., Brothers, G. B., Lathrop, J. A., and Opperman, D. P.: Electrochemical concentration cell ozonesonde performance evaluation during STOIC 1989, J. Geophys. Res.-Atmos., 100, 9231–9244, https://doi.org/10.1029/94JD02175, 1995. a
Langford, A. O., Aikin, K. C., Eubank, C. S., and Williams, E. J.: Stratospheric contribution to high surface ozone in Colorado during springtime, Geophys. Res. Lett., 36, L12801, https://doi.org/10.1029/2009GL038367, 2009. a, b
Levine, J. G., Braesicke, P., Harris, N. R. P., Savage, N. H., and Pyle, J. A.: Pathways and timescales for troposphere-to-stratosphere transport via the tropical tropopause layer and their relevance for very short lived substances, J. Geophys. Res.-Atmos., 112, D04308, https://doi.org/10.1029/2005JD006940, 2007. a
Liang, Q., Atlas, E., Blake, D., Dorf, M., Pfeilsticker, K., and Schauffler, S.: Convective transport of very short lived bromocarbons to the stratosphere, Atmos. Chem. Phys., 14, 5781–5792, https://doi.org/10.5194/acp-14-5781-2014, 2014. a
Lin, M., Fiore, A. M., Cooper, O. R., Horowitz, L. W., Langford, A. O., Levy, H., Johnson, B. J., Naik, V., Oltmans, S. J., and Senff, C. J.: Springtime high surface ozone events over the western United States: Quantifying the role of stratospheric intrusions, J. Geophys. Res.-Atmos., 117, 7105, https://doi.org/10.1038/ncomms8105, 2012. a
Lin, M., Fiore, A. M., Horowitz, L. W., Langford, A. O., Oltmans, S. J., Tarasick, D., and Rieder, H. E.: Climate variability modulates western US ozone air quality in spring via deep stratospheric intrusions, Nat. Commun., 6, D00V22, https://doi.org/10.1029/2012JD018151, 2015. a, b
Lu, X., Zhang, L., Chen, Y., Zhou, M., Zheng, B., Li, K., Liu, Y., Lin, J., Fu, T.-M., and Zhang, Q.: Exploring 2016–2017 surface ozone pollution over China: source contributions and meteorological influences, Atmos. Chem. Phys., 19, 8339–8361, https://doi.org/10.5194/acp-19-8339-2019, 2019. a
Luo, J., Liang, W., Xu, P., Xue, H., Zhang, M., Shang, L., and Tian, H.: Seasonal features and a case study of tropopause folds over the Tibetan Plateau, Adv. Meteorol., 2019, 4375123, https://doi.org/10.1155/2019/4375123, 2019. a
Monks, P. S., Archibald, A. T., Colette, A., Cooper, O., Coyle, M., Derwent, R., Fowler, D., Granier, C., Law, K. S., Mills, G. E., Stevenson, D. S., Tarasova, O., Thouret, V., von Schneidemesser, E., Sommariva, R., Wild, O., and Williams, M. L.: Tropospheric ozone and its precursors from the urban to the global scale from air quality to short-lived climate forcer, Atmos. Chem. Phys., 15, 8889–8973, https://doi.org/10.5194/acp-15-8889-2015, 2015. a
Nédélec, P., Blot, R., Boulanger, D., Athier, G., Cousin, J.-M., Gautron, B., Petzold, A., Volz-Thomas, A., and Thouret, V.: Instrumentation on commercial aircraft for monitoring the atmospheric composition on a global scale: the IAGOS system, technical overview of ozone and carbon monoxide measurements, Tellus B, 67, 27791, https://doi.org/10.3402/tellusb.v67.27791, 2015. a
Ojha, N., Pozzer, A., Akritidis, D., and Lelieveld, J.: Secondary ozone peaks in the troposphere over the Himalayas, Atmos. Chem. Phys., 17, 6743–6757, https://doi.org/10.5194/acp-17-6743-2017, 2017. a
Ott, L. E., Duncan, B. N., Thompson, A. M., Diskin, G., Fasnacht, Z., Langford, A. O., Lin, M., Molod, A. M., Nielsen, J. E., Pusede, S. E., Wargan, K., Weinheimer, A. J., and Yoshida, Y.: Frequency and impact of summertime stratospheric intrusions over Maryland during DISCOVER-AQ (2011): New evidence from NASA's GEOS-5 simulations, J. Geophys. Res.-Atmos., 121, 3687–3706, https://doi.org/10.1002/2015JD024052, 2016. a
Petzold, A., Thouret, V., Gerbig, C., Zahn, A., Brenninkmeijer, C. A. M., Gallagher, M., Hermann, M., Pontaud, M., Ziereis, H., Boulanger, D., Marshall, J., Nédélec, P., Smit, H. G. J., Friess, U., Flaud, J.-M., Wahner, A., Cammas, J.-P., Volz-Thomas, A., and IAGOS TEAM: Global-scale atmosphere monitoring by in-service aircraft–current achievements and future prospects of the European Research Infrastructure IAGOS, Tellus B, 67, 28452, https://doi.org/10.3402/tellusb.v67.28452, 2015. a
Reutter, P., Škerlak, B., Sprenger, M., and Wernli, H.: Stratosphere–troposphere exchange (STE) in the vicinity of North Atlantic cyclones, Atmos. Chem. Phys., 15, 10939–10953, https://doi.org/10.5194/acp-15-10939-2015, 2015. a
Škerlak, B., Sprenger, M., and Wernli, H.: A global climatology of stratosphere–troposphere exchange using the ERA-Interim data set from 1979 to 2011, Atmos. Chem. Phys., 14, 913–937, https://doi.org/10.5194/acp-14-913-2014, 2014. a
Škerlak, B., Sprenger, M., Pfahl, S., Tyrlis, E., and Wernli, H.: Tropopause Folds in ERA-Interim: Global Climatology and Relation to Extreme Weather Events, J. Geophys. Res.-Atmos., 120, 4860–4877, 2015. a, b, c
Sprenger, M., Croci Maspoli, M., and Wernli, H.: Tropopause folds and cross-tropopause exchange: A global investigation based upon ECMWF analyses for the time period March 2000 to February 2001, J. Geophys. Res., 108, 8518, https://doi.org/10.1029/2002JD002587, 2003. a, b
Steinbrecht, W., Schwarz, R., and Claude, H.: New Pump Correction for the Brewer–Mast Ozone Sonde: Determination from Experiment and Instrument Intercomparisons, J. Atmos. Ocean. Tech., 15, 144–156, https://doi.org/10.1175/1520-0426(1998)015<0144:NPCFTB>2.0.CO;2, 1998. a
Stohl, A., Spichtinger-Rakowsky, N., Bonasoni, P., Feldmann, H., Memmesheimer, M., Scheel, H., Trickl, T., Hübener, S., Ringer, W., and Mandl, M.: The influence of stratospheric intrusions on alpine ozone concentrations, Atmos. Environ., 34, 1323–1354, https://doi.org/10.1016/S1352-2310(99)00320-9, 2000. a
Stohl, A., Bonasoni, P., Cristofanelli, P., Collins, W., Feichter, J., Frank, A., Forster, C., Gerasopoulos, E., Gaggeler, H., James, P., Kentarchos, T., Kromp-Kolb, H., Krüger, B., Land, C., Meloen, J., Papayannis, A., Priller, A., Seibert, P., Sprenger, M., Roelofs, G. J., Scheel, H. E., Schnabel, C., Siegmund, P., Tobler, L., Trickl, T., Wernli, H., Wirth, V., Zanis, P., and Zerefos, C.: Stratosphere-troposphere exchange: A review, and what we have learned from STACCATO, J. Geophys. Res.-Atmos., 108, 8516, https://doi.org/10.1029/2002JD002490, 2003. a, b, c
Szopa, S., Naik, V., Adhikary, B., Artaxo, P., Berntsen, T., Collins, W. D., Fuzzi, S., Gallardo, L., Kiendler-Scharr, A., Klimont, Z., Liao, H., Unger, N., and Zanis, P.: Short-Lived Climate Forcers. In Climate Change 2021: The Physical Science Basis. Contribution of Working Group I to the Sixth Assessment Report of the Intergovernmental Panel on Climate Change, edited by: Masson-Delmotte, V., Zhai, P., Pirani, A., Connors, S. L., Péan, C., Berger, S., Caud, N., Chen, Y., Goldfarb, L., Gomis, M. I., Huang, M., Leitzell, K., Lonnoy, E., Matthews, J. B. R., Maycock, T. K., Waterfield, T., Yelekçi, O., Yu, R., and Zhou, B., Cambridge University Press, Cambridge, United Kingdom and New York, NY, USA, 817–922, https://doi.org/10.1017/9781009157896.008, 2021. a, b
Tarasick, D., Carey-Smith, T., Hocking, W., Moeini, O., He, H., Liu, J., Osman, M., Thompson, A., Johnson, B., Oltmans, S., and Merrill, J.: Quantifying stratosphere-troposphere transport of ozone using balloon-borne ozonesondes, radar windprofilers and trajectory models, Atmos. Environ., 198, 496–509, https://doi.org/10.1016/j.atmosenv.2018.10.040, 2019. a
Trickl, T., Feldmann, H., Kanter, H.-J., Scheel, H.-E., Sprenger, M., Stohl, A., and Wernli, H.: Forecasted deep stratospheric intrusions over Central Europe: case studies and climatologies, Atmos. Chem. Phys., 10, 499–524, https://doi.org/10.5194/acp-10-499-2010, 2010. a
Trickl, T., Vogelmann, H., Ries, L., and Sprenger, M.: Very high stratospheric influence observed in the free troposphere over the northern Alps – just a local phenomenon?, Atmos. Chem. Phys., 20, 243–266, https://doi.org/10.5194/acp-20-243-2020, 2020. a
Tyrlis, E., Škerlak, B., Sprenger, M., Wernli, H., Zittis, G., and Lelieveld, J.: On the linkage between the Asian summer monsoon and tropopause fold activity over the eastern Mediterranean and the Middle East, J. Geophys. Res.-Atmos., 119, 3202–3221, 2014. a, b, c
Wagner, A., Bennouna, Y., Blechschmidt, A.-M., Brasseur, G., Chabrillat, S., Christophe, Y., Errera, Q., Eskes, H., Flemming, J., Hansen, K. M., Inness, A., Kapsomenakis, J., Langerock, B., Richter, A., Sudarchikova, N., Thouret, V., and Zerefos, C.: Comprehensive evaluation of the Copernicus Atmosphere Monitoring Service (CAMS) reanalysis against independent observations: Reactive gases, Elementa: Science of the Anthropocene, 9, 00171, https://doi.org/10.1525/elementa.2020.00171, 2021. a, b, c, d
WMO/GAW Ozone Monitoring Community: World Meteorological Organization-Global Atmosphere Watch Program (WMO-GAW)/World Ozone and Ultraviolet Radiation Data Centre (WOUDC) [data set], https://doi.org/10.14287/10000001, 2020. a
Young, P. J., Naik, V., Fiore, A. M., Gaudel, A., Guo, J., Lin, M. Y., Neu, J. L., Parrish, D. D., Rieder, H. E., Schnell, J. L., Tilmes, S., Wild, O., Zhang, L., Ziemke, J., Brandt, J., Delcloo, A., Doherty, R. M., Geels, C., Hegglin, M. I., Hu, L., Im, U., Kumar, R., Luhar, A., Murray, L., Plummer, D., Rodriguez, J., Saiz-Lopez, A., Schultz, M. G., Woodhouse, M. T., and Zeng, G.: Tropospheric Ozone Assessment Report: Assessment of global-scale model performance for global and regional ozone distributions, variability, and trends, Elementa: Science of the Anthropocene, 6, 10, https://doi.org/10.1525/elementa.265, 2018. a, b
Zanis, P., Trickl, T., Stohl, A., Wernli, H., Cooper, O., Zerefos, C., Gaeggeler, H., Schnabel, C., Tobler, L., Kubik, P. W., Priller, A., Scheel, H. E., Kanter, H. J., Cristofanelli, P., Forster, C., James, P., Gerasopoulos, E., Delcloo, A., Papayannis, A., and Claude, H.: Forecast, observation and modelling of a deep stratospheric intrusion event over Europe, Atmos. Chem. Phys., 3, 763–777, https://doi.org/10.5194/acp-3-763-2003, 2003. a
Zanis, P., Hadjinicolaou, P., Pozzer, A., Tyrlis, E., Dafka, S., Mihalopoulos, N., and Lelieveld, J.: Summertime free-tropospheric ozone pool over the eastern Mediterranean/Middle East, Atmos. Chem. Phys., 14, 115–132, https://doi.org/10.5194/acp-14-115-2014, 2014. a
Zhao, K., Huang, J., Wu, Y., Yuan, Z., Wang, Y., Li, Y., Ma, X., Liu, X., Ma, W., Wang, Y., and Zhang, X.: Impact of Stratospheric Intrusions on Ozone Enhancement in the Lower Troposphere and Implication to Air Quality in Hong Kong and Other South China Regions, J. Geophys. Res.-Atmos., 126, e2020JD033955, https://doi.org/10.1029/2020JD033955, 2021a. a, b
Zhao, K., Hu, C., Yuan, Z., Xu, D., Zhang, S., Luo, H., Wang, J., and Jiang, R.: A modeling study of the impact of stratospheric intrusion on ozone enhancement in the lower troposphere over the Hong Kong regions, China, Atmos. Res., 247, 105158, https://doi.org/10.1016/j.atmosres.2020.105158, 2021b. a