the Creative Commons Attribution 4.0 License.
the Creative Commons Attribution 4.0 License.
 | 13 May 2022
Measurement report: Vertical profiling of particle size distributions over Lhasa, Tibet – tethered balloon-based in situ measurements and source apportionment
Liang Ran
Yunfei Wu
Jiwei Li
Zhixuan Bai
Ye Lu
Deqing Zhuoga
Jianchun Bian
In situ measurements of vertically resolved particle size distributions based on a tethered balloon system were carried out for the first time in the highland city of Lhasa over the Tibetan Plateau in summer 2020, using portable optical counters for the size range of 0.124–32 µm. The vertical structure of 112 aerosol profiles was found to be largely shaped by the evolution of the planetary boundary layer (PBL), with a nearly uniform distribution of aerosols within the daytime mixing layer and a sharp decline with the height in the shallow nocturnal boundary layer. During the campaign, mass concentrations of particulate matter smaller than 2.5 µm in aerodynamic diameter (PM2.5) within the PBL ranged from 0.5 to 12.0 µg m−3, with an average and standard deviation of 3.4 ± 2.3 µg m−3, almost 4 times the amount in the free troposphere (FT), which was rarely affected by surface anthropogenic emissions. Though there was a lower level of particle mass in the residual layer (RL) than in the PBL, a similarity in particle mass size distributions (PMSDs) suggested that particles in the RL might be of the same origin as the particles in the PBL. This was also consistent with the source apportionment analysis based on the PMSDs. In total, three distinct modes were observed in the PMSDs for the PBL and the RL. One mode was exclusively coarse particles up to roughly 15 µm, peaking around 5 µm. More than 50 % of total particle mass was often contributed by coarse-mode particles in this area, which was thought to be associated with local dust resuspension. The mode peaking over 0.5–0.7 µm was representative of biomass burning on religious holidays and was found to be most pronounced on holiday mornings. The contribution from the religious burning factor rose from about 25 % on non-holidays to nearly 50 % on holiday mornings. The mode dominated by particles smaller than 0.3 µm was thought to be associated with combustion-related emissions and/or secondary aerosol formation. In the FT coarse mode, particles only accounted for less than 10 % of the total mass, and particles larger than 5 µm were negligible. The predominant submicron particles in the FT might be related to secondary aerosol formation and the aging of existing particles. To give a full picture of aerosol physical and chemical properties and better understand the origin and impacts of aerosols in this area, intensive field campaigns involving measurements of vertically resolved aerosol chemical compositions in different seasons would be highly encouraged in the future.
- Article
(2707 KB) - Full-text XML
-
Supplement
(965 KB) - BibTeX
- EndNote


Lhasa, the provincial capital of Tibet, lies almost in the heart of the sparsely populated Tibetan Plateau, which is the highest plateau in the world with an average altitude of approximately 4320 m (Zhang et al., 2021). As a result of its unique topography, the Tibetan Plateau plays a vital role in the East Asian Summer Monsoon and therefore in the regional and global climate (He et al., 2019; Chiang et al., 2020). As the most urbanized and populated highland city in Tibet, Lhasa is quite suitable for exploring the impact of anthropogenic activities on atmospheric components over this remote region.
In the past decade, the population in Lhasa has increased from about 0.55 million in 2010 to nearly 0.87 million in 2020, according to the newly published data from the Seventh National Population Census (http://www.xizang.gov.cn/zwgk/zfsj/ndtjgb/202105/t20210520_202889.html, last access: 18 June 2021). Rapid urbanization and economic growth, also the ever-thriving tourism, have given rise to a marked increase in residential, industrial, and traffic emissions. As a religious and cultural center, widespread religious burning was also an important source of various air pollutants (Y. Y. Cui et al., 2018; Wei et al., 2019a). In the low-oxygen-containing atmosphere (molecules per volume) at an altitude of about 3650 m, incomplete combustion could further enhance emissions of air pollutants such as black carbon and organic aerosols. The probable photochemically active atmosphere due to strong solar radiation at such a high altitude and low latitude might facilitate the formation of secondary aerosols and gaseous pollutants like ozone (Lin et al., 2008), though the extent to which secondary production is enhanced remains uncertain, considering pressure-dependent reaction rate constants (Atkinson, 2000). In addition, effective dilution of air pollutants is often prevented in Lhasa, since it is located in the Lhasa River valley and surrounded by high mountains. Consequently, serious air pollution, comparable to the levels in more urbanized and developed cities at lower altitudes, has been observed (Ran et al., 2014; Duo et al., 2018; Li et al., 2019). However, it was demonstrated that air quality in Lhasa improved slightly in 2017, compared with previous years, due to the Action Plan on the Prevention and Control of Air Pollution that has been implemented all over China since 2013 (Yin et al., 2019).
Previous studies on aerosols in Lhasa were quite limited. One particular focus was the chemical composition of single particle (D. Z. Zhang et al., 2001; Duo et al., 2015), bulk aerosol (Cong et al., 2011; Gong et al., 2011; Liu et al., 2013; Chen et al., 2018), and size-segregated aerosols (X. Y. Zhang et al., 2001; Wan et al., 2016; L. L. Cui et al., 2018; Wei et al., 2019a, b) near the ground. Results from these studies revealed that vehicular exhaust, religious activities that involve incense burning and biomass burning, and the suspension of mineral dust were major sources. It was also pointed out from the results of the backward trajectory analysis that local emissions dominated during the monsoon season (Wei et al., 2019b). Aerosol optical properties such as multiwavelength aerosol absorption near the ground (Zhu et al., 2017) and aerosol optical depth (Bai et al., 2000; Zhu et al., 2019) have also been investigated. However, the particle size distribution, as a critical microphysical property, has rarely been studied. Using a portable optical particle counter, Y. Y. Cui et al. (2018) measured the particle size distributions (14 size bins) within the range of 0.14–3 µm for 3 weeks in summer 2016 in urban Lhasa and emphasized the significance of religious burning to fine particles. In situ measured vertical profiles of particle size distributions with a rather coarse size resolution were obtained from three balloon measurements in 1999 over Lhasa but were only used to explore an enhancement in fine particle concentrations near the tropopause (Tobo et al., 2007). The vertical structure of the particle size distributions and its temporal variation within the planetary boundary layer has not yet been examined. To obtain better knowledge on the current status of aerosol microphysical properties in Lhasa and to advance our understanding on the influence of anthropogenic activities, in situ measurements of vertically resolved particle size distributions with a high vertical resolution are very necessary.
In this study, the vertical structure and temporal variability in aerosol profiles were explored, based on in situ measurements of particle size distributions within 1 km above the ground at a suburban site in Lhasa, using optical counters attached to a tethered balloon. Source apportionment based on measured particle size distributions was further performed to identify possible sources for aerosols in different layers.
2.1 The field site
The city of Lhasa lies in an east–west-oriented valley along the Lhasa River, surrounded by mountains up to an elevation of about 5500 m (Fig. 1a), as shown by Shuttle Radar Topography Mission (SRTM) data v4 from Jarvis et al. (2008). The field site is on the Najin Campus of Tibet University (29.64∘ N, 91.18∘ E) in a suburban area of Lhasa, approximately 5 km to the east of the urban center (Fig. 1b). As the commercial and religious center, the urban area features crowded streets and heavy traffic, partly due to the thriving tourism and partly due to frequent religious activities. Religious burnings are constantly practiced and are especially vigorous on religious ceremonies in the Potala Palace and the neighboring famous temples, such as Jokhang Temple and Ramoche Temple, which are all located in this area and attended by many worshippers and tourists throughout the year. Comparatively, the suburb is thinly populated with much less traffic. Thus, emissions from residential, vehicular, and religious sources are expected to be much weaker in the surrounding area of the site than in the downtown.
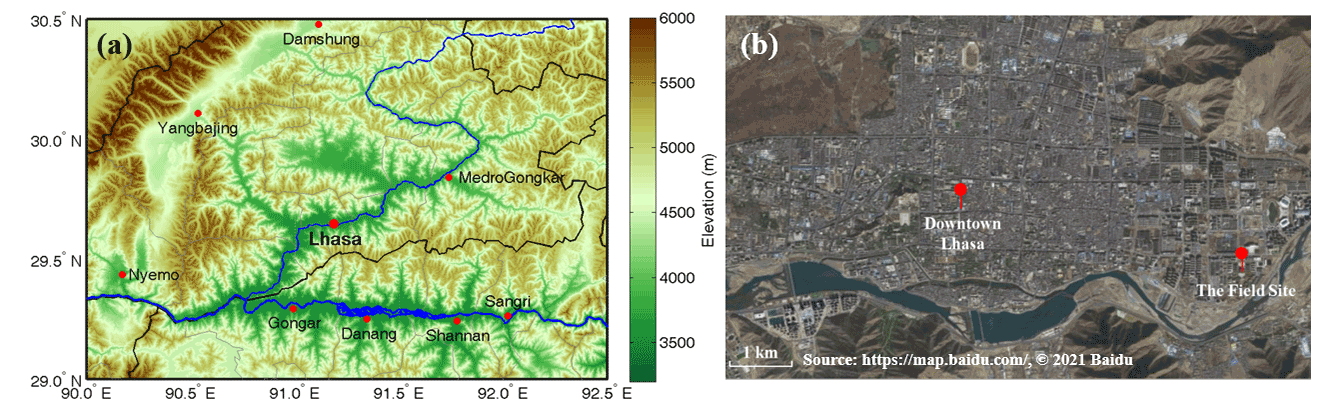
Figure 1The topographic map of the Lhasa River valley (a) and the city map of Lhasa (b).
2.2 Instruments and data
Measurements were conducted in an open space, about 90 m away from the nearest building, in order to ensure the safety of launching the tethered balloon system. The 60 m3 helium-filled tethered balloon, with a payload capacity of roughly 10 kg at an elevation of 3650 m, was operated by an electric winch that controlled the ascent and descent rate of the fish-shaped balloon. It was scheduled to launch the balloon to at least 800 m above the ground every 3 h from 07:00 to 22:00 (all times are given in Beijing time, GMT+8, unless otherwise indicated) during 8–28 August 2020. The actual number of launches and the actual maximum height reached by each flight were subject to unavailable flight permits and unfavorable weather conditions (precipitation and/or strong winds). In total, 56 launches were successfully performed for the entire campaign (Fig. S1a). Most flights of the tethered balloon reached above 600 m, with 3 launches reaching 450–500 m, 15 reaching 500–600 m, 17 reaching 600–700 m, 15 reaching 700–800 m, and 6 reaching 800–850 m. In particular, strong winds were often encountered in the late afternoon, resulting in a lack of observations during this time period (Fig. S1b).
A lightweight optical counter, the Portable Optical Particle Spectrometer (POPS, Handix Scientific), was attached to the tethered balloon for in situ measurements of vertical profiles of atmospheric aerosols. Details about the principle on which the instrument operates were given in Gao et al. (2016). The POPS was calibrated by establishing a relationship between the scattering signal and the particle size before the campaign. Both polystyrene latex sphere (PSL) with known sizes and ammonium sulfate particles with sizes selected by a differential mobility analyzer were employed. Though the experimental responses of the two calibration materials generally agreed well with the simulated theoretical responses, both theoretical response curves were found to be highly oscillatory above the particle size of 600 nm (Gao et al., 2016). Considering that the refractive index of ammonium sulfate is closer to ambient dry aerosols than PSL (Shingler et al., 2016), a combined calibration curve from the experimental response of ammonium sulfate particles for diameters smaller than 600 nm, and the smoothed theoretical response of ammonium sulfate particles for diameters larger than 600 nm, was used to obtain 42 logarithmically equal bins over the size range of 0.124–2.55 µm. Ambient aerosols were sufficiently dried before entering the POPS by a homemade silica-gel-filled diffusion dryer. Previous tests of the diffusion dryer showed that roughly 75 % and 50 % of the water vapor could be removed after the drying in summer and winter, respectively. As a matter of fact, the relative humidity will be further lowered inside the instrument, due to the temperature difference between the ambient condition and instrument chambers. The combined effects resulted in the relative humidity inside the POPS to be well below 20 % and 30 % in summer and winter, respectively. The flow rate of the instrument was regularly checked during the campaign and used for data correction. Particle number size distributions (PNSDs, ) were obtained with a temporal resolution of 1 s and integrated over the whole size range to provide total number concentrations (Na). Particle mass size distributions (PMSDs, ) were calculated from PNSDs assuming spherical particles with a density of 1.7 g cm−3 (Sloane et al., 1991; Tao et al., 2014). Though the assumption of a fixed density for particles with different diameters and the difference between the actual density of ambient particles and the assumed one might introduce some uncertainties in the calculation of PMSDs, the qualitative results regarding PMSDs would not be much affected. Mass concentrations of particulate matter smaller than 1 and 2.5 µm in aerodynamic diameter (PM1 and PM2.5) were obtained under the assumption that the optically equivalent diameter could be considered equal to the geometric diameter and the aerodynamic diameter could be converted from the geometric diameter with a density of 1.7 g cm−3. The penetration curve of the SCC-2.229 cyclone at 16.7 lpm (https://bgi.mesalabs.com/wp-content/uploads/sites/35/2015/02/scc_btr-2.229.pdf, last access: 15 March 2022) was adopted for calculating PM1 mass concentrations, and the penetration curve of VSCC-2.946 cyclone at 16.7 lpm (https://bgi.mesalabs.com/wp-content/uploads/sites/35/2015/02/vsccref6-2.946.pdf, last access: 15 March 2022) was adopted for calculating PM2.5 mass concentrations. The effective diameter (De) was the ratio of the third-order moment to the second-order moment of particle size distributions. Similarly, the effective diameters for submicron particles () and for supermicron particles (De,1–2.5 µm) were calculated for particles with a diameter smaller than 1 µm and in the range of 1–2.5 µm, respectively.
A portable aerosol spectrometer (Model 11-C, GRIMM Aerosol Technik Ainring GmbH & Co. KG), equipped with the homemade silica-gel-filled diffusion dryer, was also attached to the tethered balloon for 24 launches to concurrently measure the PNSDs for dry particles within the size range of 0.25–32 µm. The measuring time interval was set to be 6 s, for which 31 size channels were classified. Sizing of aerosols by the instrument was verified before the campaign for several selected diameters using polystyrene latex spheres. The PNSD measured by GRIMM 11-C was combined with the PNSD simultaneously measured by the POPS, using weighting factors in the overlapped size range, namely from the lower size limit of GRIMM 11-C (Dp,L) to the upper size limit of the POPS (Dp,U). The weighting factors for GRIMM 11-C were derived as , while for the POPS, they were defined as . An example of combining the PNSD from POPS and GRIMM 11-C and the PMSD from POPS and GRIMM 11-C using the weighting factors for each instrument is illustrated in Fig. S2.
Vertical profiles of meteorological parameters, including pressure (MS5540B, Intersema Sensoric SA), temperature (T), and relative humidity (RH; SHT7x, Sensirion), as well as winds (homemade sensor based on a slotted optical switch OPB610 from TT Electronics and an electronic compass module ZCC211N from Shanghai Zhichuan Electronic Tech Co., 40 Ltd.), were measured for each flight, with a temporal resolution of 1 s. Potential temperature (θ) and specific humidity (q), two conservative quantities, were calculated following the equations in Ran et al. (2016). Besides, surface meteorological parameters in August were available from an automatic weather station roughly 4.5 km to the northwest of the site in urban Lhasa and were averaged into hourly data, except that winds were recorded as 2 min averages at the beginning of each hour.
Profiles of aerosol and meteorological parameters were all processed into 10 m averaged data for the subsequent analysis. A mixed layer (ML) for daytime profiles or a nocturnal boundary layer (NBL) for nighttime profiles, mentioned together as the planetary boundary layer (PBL) in what follows, could be identified for 72 profiles in the dataset of 112 profiles in total. For the remaining 40 profiles, the flight path was entirely within the daytime ML. The height of the PBL, denoted as Hm hereafter, was estimated from profiles of aerosols and meteorological parameters based on the gradient method (Seibert et al., 2000; Kim et al., 2007; Ferrero et al., 2010; Ran et al., 2016). For profiles with the top of the ML above the flight limit, Hm was taken as the maximum height reached by the tethered balloon for further statistical analysis. The normalized height (HNor) was then calculated as H/Hm−1, where H is height above the ground (Ferrero et al., 2014). For several profiles, the free troposphere (FT) that was identified as the layer above the PBL without the presence of elevated aerosol layers or the residue from aerosols in the daytime after the collapse of the ML, and the residual layer (RL) could also be identified. In addition, the time mentioned anywhere in this study is Beijing time, which is around 2 h earlier than local solar time.
2.3 Positive matrix factorization (PMF)
A bilinear factor-based receptor model, with positive matrix factorization (PMF), was used for the source apportionment of particle mass in this study based upon observed PMSDs (Paatero and Tapper, 1994; Paatero, 1997). By minimizing an objective function Q, a key parameter to review the distribution of the components and to estimate the stability of the solution (Brown et al., 2015), the measured matrix was decomposed into factor profiles (F) and factor contributions (G) with non-negativity constraints. The input matrix, comprising PMSDs (22 size bins within 0.124–15 µm) averaged for the ML, the RL, and the FT, and the lower 10 m averaged PMSDs in the NBL, was used in 20 random PMF runs (using EPA PMF5.0 software) for 2 to 5 factors. In total, there were 48 PMSDs for the ML, 23 PMSDs for the RL, and 10 PMSDs for the FT. The components in the PMF runs were separated to keep one signal rather significant from those dominated by noise on account of a criterion of the signal-to-noise ratio (Amato et al., 2009). The components with the less than 2 were removed from further analysis, while components with the above 2 were set as “strong” aerosol types (Paatero and Hopke, 2003). The stability of the converged Q values was found for all runs. By estimating diagnostic errors, the three-factor result was found to be the optimal solution, with all factors mapped in 100 % of the bootstrap run, no swap of displacement, and no swapping case of bootstrap–displacement. The results of the scaled residuals for the three-factor outcome were within an acceptable range from −3 to 3 (Juntto and Paatero, 1994). The measured and PMF-simulated total particle mass concentrations were significantly correlated (R2=0.89).
3.1 An overview of meteorological conditions
Under the impact of the East Asian Summer Monsoon, Lhasa normally experiences a rainy season from May to September (Ding, 2007; Ran et al., 2014). However, in August 2020 when the campaign took place, two periods with distinctly different conditions of water vapor were found, as can be clearly seen from q near the ground measured in urban Lhasa (Fig. 2a). The sharp reduction in q during the daytime of 17 August was an indicator of changing from a humid Period I (average 11.1 g kg−1) to a relatively dry Period II (average 8.1 g kg−1). Period I was also characterized as rainy, with the precipitation amounting to 78.5 mm, and quite cloudy for most of the time, while there was plentiful sunshine and almost no precipitation during Period II (Fig. 2a). Rainfall mostly occurred in the evening and at night (20:00–08:00), accounting for 84 % of the total amount in that month. The two periods did not differ much in T, which ranged from 8.8 to 26.8∘ in Period I and from 8.6–25.0∘ in Period II, with an average of about 17.0∘ for both periods. In contrast, RH averaged nearly 62 % in Period I but only 45 % in Period II (Fig. 2b), corresponding well to the difference in q. The temperature shared a similar pattern on each day, except that the maximum value in the daytime apparently lowered on days with an overcast sky. Unlike the diurnal variation in T being a peak in the late afternoon (around 18:00) and a valley in the early morning (around 09:00) without much difference between the two periods, the average RH reached a maximum in the early morning of about 79 % ± 11 % for Period I and 64 % ± 6 % for Period II, as well as a minimum in the late afternoon of about 43 % ± 11 % for Period I and 28 % ± 11 % for Period II. Surface winds were largely under 4 m s−1 and dominated by easterly and westerly winds (Fig. 2c).
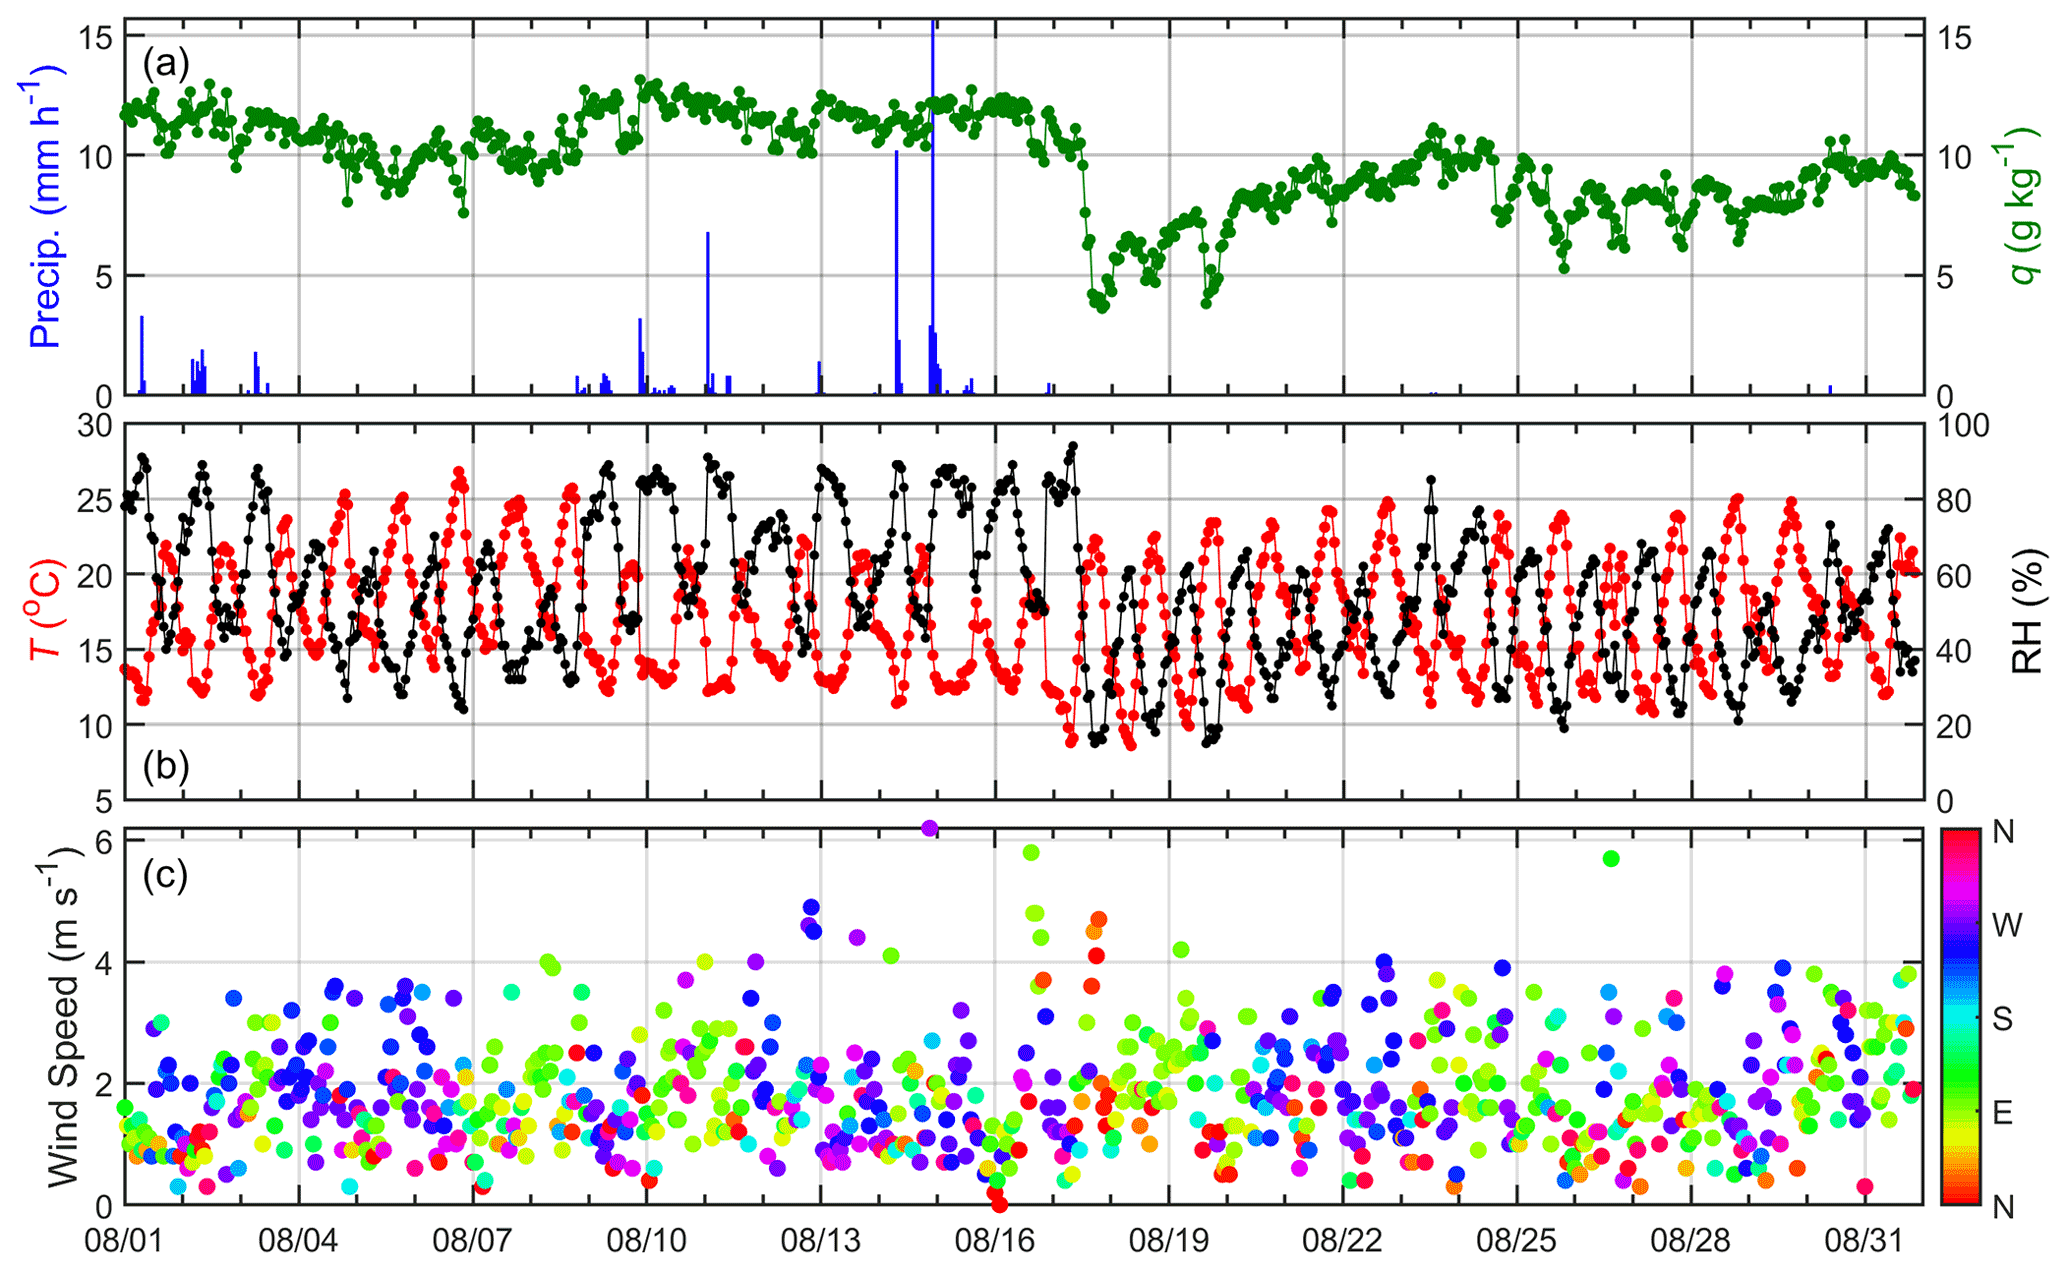
Figure 2The time series of (a) precipitation in blue and specific humidity (q) in green, (b) temperature (T) in red, and relative humidity (RH) in black, as well as (c) wind speed and wind direction (in colors), based on hourly data in August from an automatic weather station in urban Lhasa.
Vertical profiles of meteorological parameters observed at the site were categorized into five time periods of the day, as given in Table S1, and were presented along HNor, if either a ML or a NBL could be identified, for a straightforward comparison between the two periods (Fig. S3). The amount of moisture was obviously higher in Period I than in Period II for all time periods, which is consistent with what had been revealed from continuous surface measurements. The conservative quantities, θ and q, were generally uniform in the ML for daytime profiles, whereas T decreased and RH increased with increasing height, respectively. For profiles collected during 07:00–08:00 and 20:00–23:00, air temperature inversions in the NBL were recognized for several cases. On average, there was a slight increase in θ and decrease in q along with increasing height. Accordingly, wind speed apparently increased with increasing height. A further examination of the probability distributions of wind speed and wind direction indicated that winds were mainly below 4 m s−1 both within and above the PBL throughout the campaign; in addition, easterly and westerly winds dominated as near the ground (Fig. S4). Stronger easterly winds exceeding 4 m s−1 occurred above the PBL, even up to nearly 7 m s−1 in Period II. It should be kept in mind that data points available for calculating the averages over a time period at some heights above the PBL, corresponding to HNor larger than 0, might make up only a part of the total number and might thus introduce misleading details. Caution should therefore be taken about statistically drawing conclusions from the characteristics of height-normalized profiles across the PBL and at different heights above the top of the PBL. Last but not least, the analysis regarding meteorological parameters, especially winds, was somewhat limited to measurements under a relatively mild condition when the tethered balloon was able to be launched.
3.2 The vertical structure and temporal variability in aerosol profiles
3.2.1 Vertical distributions and diurnal variations in aerosol properties
The evolution of the PBL was an important influencing factor in shaping the vertical structure of atmospheric aerosols, as has been pointed out by some previous studies (Ferrero et al., 2010; Ran et al., 2016; Zhang et al., 2017). During the campaign, heights of the shallow NBL were largely below 200 m around sunrise/sunset and at night (Fig. S5). In Period I, Hm could be determined for most profiles before midday (around 14:00), possibly resulting from the development of the ML being suppressed under usually cloudy conditions. In the afternoon, the ML often developed higher than the maximum height reached by the tethered balloon. Unfortunately, intensive observations covering a day from the early morning until the night were unavailable, either because of unobtainable aviation permission or bad weather. Nevertheless, relatively frequent measurements on 12 August (marked by black cross in Fig. S5) revealed in a more realistic way compared to what the overall picture could tell, the gradual increase in Hm in the overcast morning, from below 100 m before sunrise to about 700 m towards noon. The depth of the ML on that day was expected to be far above the flight limit of 500 m in the afternoon, since it turned to be quite sunny and cloudless overhead after midday. As for Period II, the ML should have developed very quickly after sunrise on those sunny days; thus, Hm were often already high above the flight limit when aviation permissions were granted in the late morning and the afternoon.
Normalized by Hm, the average vertical profiles of aerosol properties in the five time periods of the day are illustrated in Fig. 3, exhibiting a similarity between Periods I and II. Profiles of Na and particle mass concentrations around sunrise (07:00–08:00) and after sunset (20:00–23:00) resembled an exponential decay in the stable NBL, which favored the accumulation of air pollutants near the ground. In the daytime, profiles were characterized by a nearly uniform distribution of aerosols within the ML, except for profiles collected during 08:00–12:00 in Period II with the characteristics of nighttime profiles. This misleading feature was attributed largely to profiles on religious holidays that were frequently encountered in Period II, with the impact of strong emissions from religious burning in the morning, which will be discussed in detail in Sect. 3.3. With the evolution of the ML, stronger dilution effects led to a decline in surface Na and particle mass concentrations in the daytime, compared to those in the early morning and at night. However, surface Na and particle mass concentrations were found to be the highest during 08:00–12:00 in both periods. The reasons for this phenomenon might be the enhanced emissions from more anthropogenic activities after sunrise but a still weak dispersion inside a ML, where vertical convection had not been fully developed. Above the PBL, the number of data points used for averaging varied with HNor, depending on Hm and the maximum height of each flight. To avoid being misled by insufficient data, averaged data were only adopted at heights where the data availability exceeded 75 %. An evident reduction in Na and particle mass concentrations above the PBL was observed by comparison with those within the PBL. For both periods, ratios of PM1 to PM2.5 mass concentrations (PM1 PM2.5) were relatively uniform within the PBL, even for NBL-type profiles, despite the distinctly different aerosol amount along the normalized height in the NBL. The daytime PM1 PM2.5 ratios were relatively larger than ratios in the early morning and at night. Accordingly, De was found to be relatively smaller during the day.
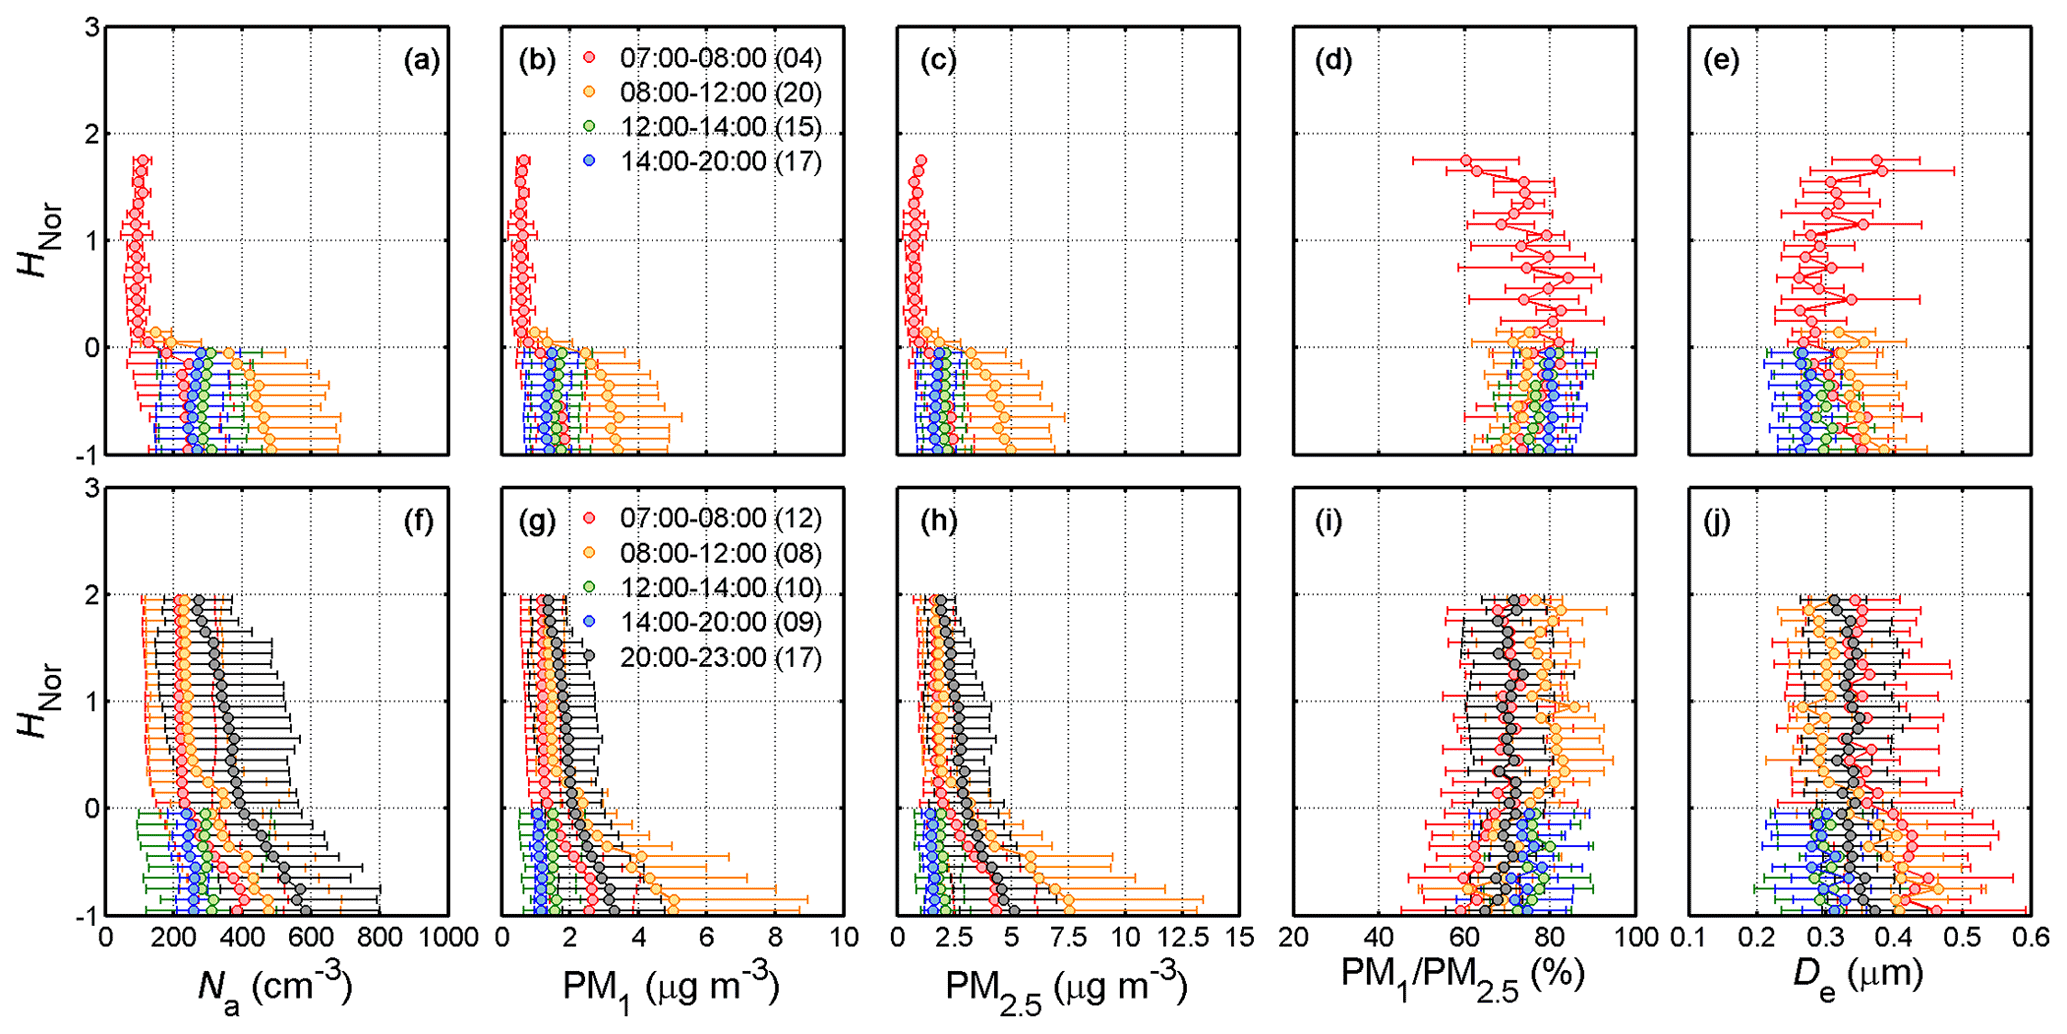
Figure 3Average vertical profiles of (a) the particle number concentration (Na), (b) PM1 mass concentration, (c) PM2.5 mass concentration, (d) the ratio of PM1 to PM2.5 mass concentration, and (e) the effective diameter (De) over the whole size range of the POPS, along the normalized height (HNor) during Period I. Profiles for different time periods are shown in different colors, with dots representing average values and error bars representing standard deviations at each of the HNor. The number of data points used for averaging at each HNor was more than about 75 % of the number of profiles during each time period, as given in parentheses. Average vertical profiles measured during Period II are displayed in the same way in panels (f)–(j).
Table 1 listed particle parameters in the PBL, the RL, and the FT. For the PBL category, averages within the ML and 10 m averages near the ground for the NBL were adopted. Inside the well-mixed layer, the surface level and the ML-averaged level were close to each other. Averaged Na within the PBL was about 338 ± 162 cm−3 in Period I and 409 ± 201 cm−3 in Period II. The mean PM2.5 mass concentration within the PBL was 2.9 ± 1.8 µg m−3 in Period I, with a fraction of PM1 in PM2.5 to be about 76 ± 6 %. In Period II, PM2.5 mass concentrations within the PBL averaged 3.9 ± 2.6 µg m−3, with PM1 accounting for approximately 68 ± 10 %. The lower level of aerosols in Period I might be ascribed to frequent rainfalls and associated efficient removal processes. Submicron particles took up a smaller proportion in PM2.5 during Period II, together with a larger average De of 0.37 and a larger average De,1–2.5 µm of 1.67, indicating more large particles in Period II than in Period I. Though average in the two periods was comparable with each other, a wider range was found in Period II, showing the large variability in particle size distributions among profiles collected at different time.
Table 1Particle parameters within the PBL, in the RL, and in the FT for Periods I and II, given as average value ± standard deviation and the range in parentheses. The number of profiles for each category is also given in parentheses in the second row.

It was found that PM2.5 mass concentrations within the PBL ranged from 0.5 to 12.0 µg m−3, with an average of 3.4 µg m−3 and a standard deviation of 2.3 µg m−3 during this campaign. PM2.5mass concentrations in this study were far below what had been observed near the ground in August 2016 in urban Lhasa, where the high levels often exceeded 20 µg m−3 and were sometimes up to more than 40 µg m−3, with the overall average of 11 ± 2.2 µg m−3 over the size range of 0.14–3 µm (Y. Y. Cui et al., 2018). The significant difference of particle mass concentrations between the previous and the current study might reflect different emission strengths surrounding the two sites. Being located in the downtown area and adjacent to several temples, the observational site in the previous study was greatly affected by various strong local emissions, such as traffic, residential, and religious-activity-related emissions, while the suburban site in this study was under the influence of much weaker nearby emissions and was more likely to represent an average condition over this area. Furthermore, the continuous monitoring of PM2.5 mass concentrations from 2013 to 2017 at six sites across the city of Lhasa revealed a slight decrease in 2017 (Yin et al., 2019). This was demonstrated to be partly attributed to measures that have been taken to prevent and control air pollution in Lhasa since 2013. Actually, the location of the site in this study was on the same campus of Tibet University as one site (LHASA-XZ) in Yin et al. (2019). Considering that monthly mean PM2.5 mass concentration of all six sites for August was reported as about 15 µg m−3, and the LHASA-XZ site was not the cleanest one among the others, it might suggest an apparent reduction in PM2.5 mass concentrations with the continuing implementation of air quality policies.
Profiles in Period II were mainly collected in the early morning and at night, when elevated aerosol layers were often encountered, though it was hard to tell whether those were only residual layers that could easily form above the NBL after sunset and remain until the PBL had evolved to a sufficient height on the next day or if there could also be contributions from transported plume. Here, we generally denoted such elevated layers as residual layers (RLs). In total, the RL was identified for 29 profiles in Period II, whereas no profiles were identified in Period I. A layer above the PBL and beneath the FT was observed for four profiles collected in the morning in Period I, with Na being a little higher than that in the FT but still very low (∼ 100 cm−3). These profiles were identified as being neither the RL nor the FT, since it was insufficient to decide whether the layer was the RL or still a part of the FT, and it would also be misleading if they were used to represent the average condition of the RL during Period I. In Period II, the average particle number and mass concentrations in the RL were around 75 % and 55 % of that within the PBL, respectively. In the FT, the average particle number and mass concentrations in the two periods were generally comparable with each other and were generally less than 25 % of the amount within the PBL. In general, fractions of PM1 in PM2.5 within the PBL were close to those in the RL and the FT for each period.
Undoubtedly, air quality over the Tibetan Plateau has been increasingly influenced by anthropogenic activities and emissions during the processes of urbanization and economic growth in the past several decades, especially in the relatively densely populated cities like Lhasa. However, the level of Na over Lhasa was still much lower than what has been observed in more populated and developed regions. Aircraft measurements of particles with the diameter ranging from 0.1 to 3.0 µm using a passive cavity aerosol spectrometer probe (PCASP) over the Loess Plateau, which is adjacent to the Tibetan Plateau, revealed that Na in the PBL often exceeded 1000 cm−3, and Na above the PBL reached well above 200 cm−3 for most flights during the summer campaign 2020 (Cai et al., 2022). Influenced more by anthropogenic emissions, Na over the Loess Plateau were more than 3 times of those obtained within and above the PBL over Lhasa. Though a slightly larger average De of around 0.4 µm was observed over the Loess Plateau, no apparent dependence of De on altitude was found in both locations. Aircraft measurements that also employed PCASP in non-winter seasons during 2005 and 2006 over Beijing in the polluted North China Plain showed that the surface level of Na ranged from 1000 (10th percentile) to 10 000 cm−3 (90th percentile) and averaged as high as 6600 cm−3, which was more than 10 times that over Lhasa (Liu et al., 2009). Aerosol profiles measured by a tethered balloon-born optical particle counter (OPC) over Milan in Italy, which is also located in a river valley (the Po Valley) but in a region much more industrialized and populated than the Lhasa River Valley, exhibited an average Na of 35 ± 2 cm−3 in the diameter range of 0.3–20 µm above the PBL in summer (Ferrero et al., 2010). Given the same size range, a lower level of particle number concentrations was found in the FT over Lhasa, with the average Na to be 12 ± 8 cm−3.
3.2.2 Vertically resolved particle mass size distributions
Particle mass size distributions (PMSDs) measured by the POPS were categorized into two periods and averaged for three layers (Fig. 4). In general, size-resolved particle mass concentrations were the highest at all diameters within the PBL, while being much lower in the FT. Nevertheless, a similarity was found among all PMSDs. Plainly, a distinct mode below 0.3 µm existed for all layers during both periods, though its strength relative to the rest of the PMSDs considerably differed among different layers and periods. For this mode, more particles were observed towards the lower end of the size range in Period II, possibly implying stronger secondary formation of fine particles favored by the fine weather during that period. It was noteworthy that the small peak around 0.23 µm might result from uncertainties in the measurement or calibration. Thus, caution should be taken when drawing specific conclusions. Particles larger than 1 µm apparently increased with the diameter for all PMSDs, suggesting another mode in coarse particles. The normalized averages of PMSDs that were merged from the POPS and GRIMM 11-C measurements over the size range of 0.124–32 µm, which were only available for 48 profiles in Period II, did exhibit a mode with a peak at around 2.5 µm in the FT and around 5 µm in the other two layers (Fig. S6). Particles as large as roughly 15 µm were observed within the PBL and in the RL. In contrast, particles with the diameter larger than 5 µm accounted only for a negligible part of the PMSDs in the FT. It was also noted, from both the average PMSDs (Fig. 4) and the normalized average PMSDs (Fig. S6), that there was a third mode ranging over 0.5–0.7 µm within the PBL and in the RL, though relatively less pronounced for the latter one, whereas no such an apparent mode was observed in the FT. These features revealed that, under most circumstances, particles in the RL were of the same origin as particles in the PBL, whereas particles in the FT should be rarely affected by local anthropogenic emissions near the ground.

Figure 4Average particle mass size distributions () for different layers during the two periods as indicated by different markers.
The vertical distribution of PMSDs within the size range of 0.124–32 µm for each profile in Period II was explored in more detail. It was noteworthy that the mode over 0.5–0.7 µm was found to be more distinct on the mornings of religious holidays compared to other times. In order to conveniently make comparisons among different cases, the dataset was grouped into subsets of data collected on non-holidays and holidays. In total, there were 22 aerosol profiles collected on non-holidays and 26 on the four religious holidays (19, 20, 26, and 28 August). The subset of data from the holidays was further divided into five cases, four of which comprised measurements on the morning of each religious holiday, respectively. One case, consisting of data collected on holidays except in the morning, was denoted as holidays* to distinguish from the category named holidays that covered all profiles measured on religious holidays. The average profile of on non-holidays and holidays* were found to be close to each other, with an average of roughly 0.21 ± 0.006 and 0.20 ± 0.005 µm through the vertical direction, respectively (Fig. 5a). However, the average vertical distribution of on the morning of each religious holiday, as separately displayed in different colors, was significantly different from the categories of non-holidays and holidays*. In the PBL, a remarkably larger was observed in the morning on all religious holidays than that on both non-holidays and holidays*. The largest was nearly 0.35 µm on 19 August, the Shakyamuni Buddha Day and also the beginning of the Sho Dun Festival, which is one of the most ceremonious traditional festival in Tibet. This could plausibly explain the aforementioned larger range of averaged within the PBL in period II than in Period I, since emissions from religious activities on religious holidays enlarged the effective diameter, and only one religious holiday (8 August) was encountered in Period I. Above the PBL for the four holiday morning cases generally fell in the range of on non-holidays and holidays, except that on the morning of 19 August was apparently larger than others. As for coarse particles in the size range of 1∼ 10 µm, no obvious difference was observed between non-holidays and holidays (Fig. 5b).
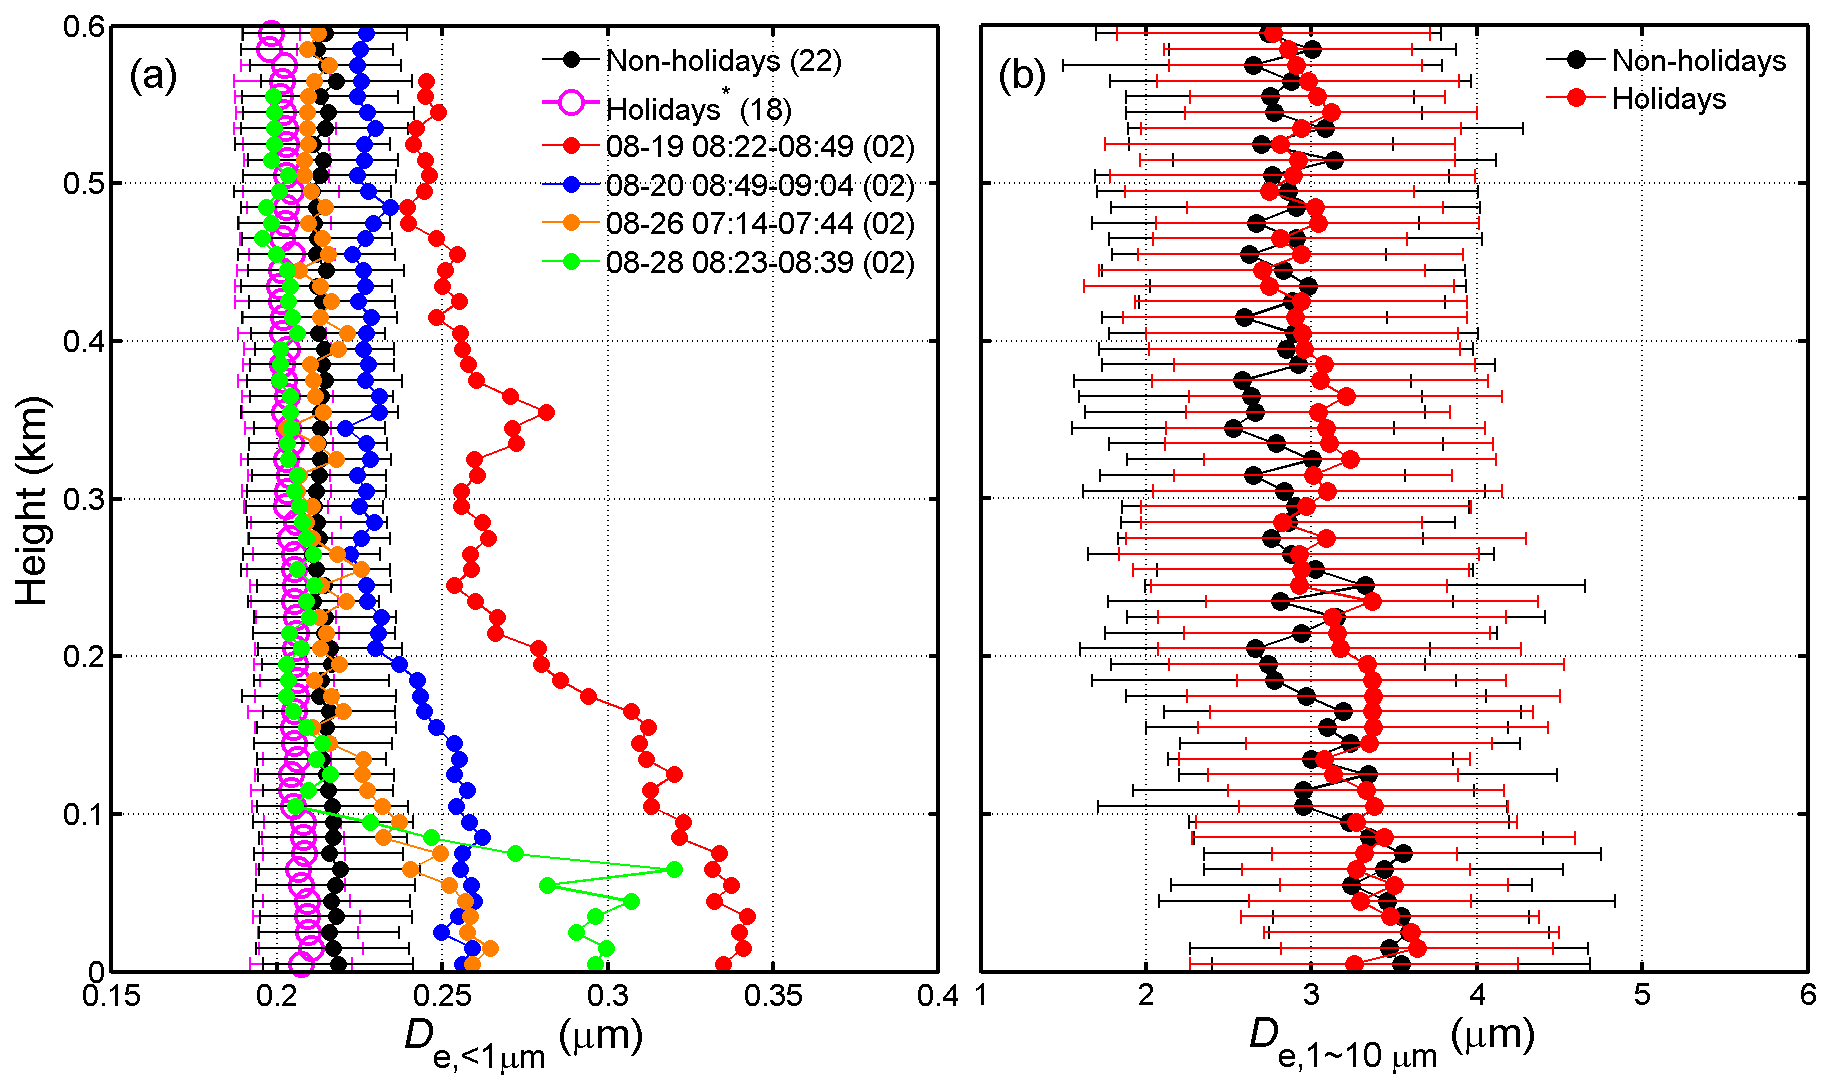
Figure 5(a) Average vertical profiles of for different cases. Solid black dots are for non-holidays, magenta circles are for religious holidays excluding samples in the mornings, and various colored solid dots are for religious holiday mornings. (b) Average vertical profiles of De,1–10 µm for non-holidays (black dots) and holidays (red dots). The number of profiles collected during the period of each case is given in parentheses.
A further examination was made of average PMSDs within 50 m above the ground for each category, considering that in the NBL or in an early morning ML measurements near the ground would help to better elucidate the impact religious activities brought to PMSDs. A marked mode, peaking around 0.6 µm and amounting to about 18 µg m−3, was observed in the PMSDs on 19 and 28 August (Fig. 6). Though much lower around 5 µg m−3 on 20 and 26 August, the peak of this mode was still almost double of that on non-holidays and holidays*. The existence of the accumulation mode over 0.5–0.7 µm on religious holidays was consistent with the findings from surface aerosol measurements in August 2016, and was demonstrated to be characteristic of emissions from incense burning and biomass burning for religious ceremonies (Y. Y. Cui et al., 2018, and references therein). As a widespread religious custom, incense burning was commonly performed in the daily life of local people, not only in temples but also at home. The burning of butter lamps and several types of wood branches and herbs in temples was also traditional religious activities. The PMSDs clearly showed that these emissions were largely enhanced on holidays, especially in the mornings, and a much strengthened accumulation mode formed.

Figure 6Average PMSDs within 50 m above the ground for different cases, with the same markers and text as in Fig. 5.
3.3 Potential sources of particles in different layers
In total, three source factors were identified from the PMF analysis of the PMSDs combined from the POPS and GRIMM 11-C measurements in Period II (Fig. 7a). The first factor (factor 1) revealed a potential source that predominantly contributed to particles smaller than 0.3 µm, probably being associated with local emissions from fossil fuel combustions and/or secondary aerosol formation. The second factor (factor 2) showed a broad peak over about 0.3–0.7 µm, also with a considerable contribution from particles with a diameter extending from 0.7 to around 2.5 µm. Considering the apparent enhancement of particle mass in the size range of 0.5–0.7 µm on religious holiday mornings, factor 2 was taken to be mainly representative of aerosols released from religious activities such as burning incense, cypress branches, herbs, and butter lamps (Y. Y. Cui et al., 2018, and references therein). The third factor (factor 3) was almost exclusively composed of particles in the coarse mode (>1 µm). This factor might be attributed to suspended dust particles from unpaved roads, construction sites, and the surrounding mountains. Indoor particles previously collected at a temple in Lhasa exhibited a bimodal particle mass distribution, with one peak around 0.4–0.7 µm and one peak in the coarse mode around 5 µm (L. L. Cui et al., 2018). It was speculated that factor 3 might also involve a certain contribution from religious burning and/or residential biomass burning. However, concentrations contributed by factor 3 did not increase as expected with the rising concentrations contributed by factor 2 on holiday mornings, when assuming that coarse-mode particles observed at the site were partly generated from religious activities (Fig. S7). Also residential burning of biomass including cow dung and plants, as an important source of energy in the past, is negligible nowadays and has been mostly replaced by a mixture of fossil fuel and renewable energy sources such as solar, wind, geothermal, and hydroelectric power.
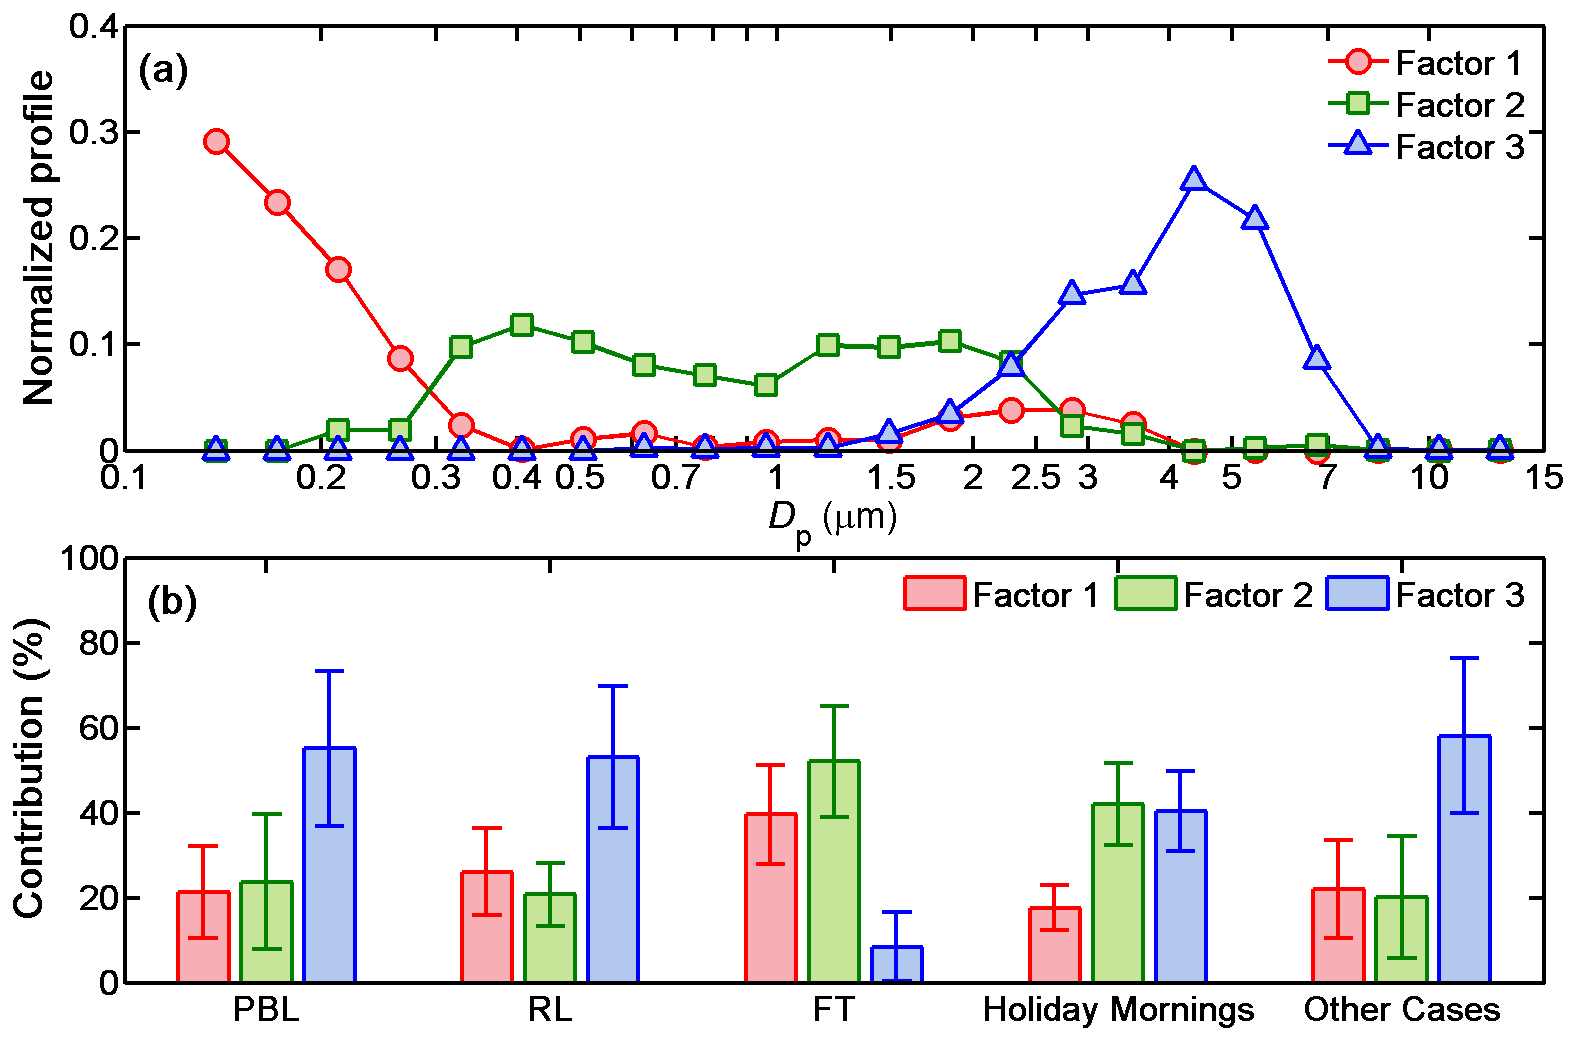
Figure 7(a) Normalized factor profiles and (b) averaged contributions of each factor to the total particle mass concentrations in the PBL, the RL, and the FT in Period II and also for averages in the PBL on holiday mornings and other cases, namely non-holidays and holidays*, with the error bar indicating the standard deviation.
On average, particles in the PBL and the RL shared a similar makeup of potential sources (Fig. 7b), suggesting that particles in the two layers were probably of the same origin. The contribution by suspended dust particles took up a portion of more than 50 %, while the contribution by religious burning was comparable with the contribution by combustion-related or secondary formation sources with a fraction of roughly 20 %–25 %. In particular, the results for the PBL were separated into one part on holiday mornings and the other under other conditions, namely non-holidays and holidays* as defined above, since particles in the PBL were mostly influenced by emissions near the ground. It was found that on non-holidays and holidays* the contributions of potential sources were close to that during the whole Period II, while religious burning contributed about 45 % on holiday mornings and exceeded the other two factors. However, the relative relationship of the two factors other than religious burning was similar under both conditions, with the contribution by combustion/secondary formation nearly 40 % of the contribution by dust suspension, suggesting that these two sources stayed relatively stable during the campaign. An examination of the contributions from the three factors at different time periods on non-holidays revealed the predominant contribution by dust suspension, and no obvious diurnal variation in the makeup of potential sources was found. Unlike in the PBL and the RL, where the significant importance of coarse-mode particles was found, the contribution by large particles that were possibly associated with dust suspension was below 10 % in the FT. Factors 1 and 2 contributed approximately 40 % and 50 % in the FT. Although factor 2 was identified as being a religious burning factor for the PBL and the RL, this might not be the case in the FT, as the contribution from factor 2 did not differ so much on holiday mornings and at other times. Given that the FT was generally much less influenced by emissions near the ground, factor 1 and 2 may be related more to secondary aerosol formation and the aging of existing particles. Measurements of aerosol chemical compositions along the vertical direction in the future might help disentangle this issue.
In this study, vertical profiles of particle size distributions within 1 km were measured by a POPS and a GRIMM 11-C attached to a tethered balloon in summer 2020 at a suburban site in Lhasa. The variability in the vertical structure and temporal features of parameters, such as aerosol number and mass concentrations, the effective diameter, and particle mass size distributions were examined. Possible sources for aerosols in different layers were investigated by the PMF analysis.
The vertical distribution of aerosol properties was found to be largely governed by the diurnal variation in the boundary layer. Generally speaking, aerosols uniformly distributed in the daytime PBL and sharply declined in the NBL. Usually, the average particle number and mass concentrations in the FT were less than 25 % of the amount in the PBL. For the humid Period I under the influence the East Asian Summer Monsoon, a lower level of aerosols and also fewer large particles in the PBL were found than that in the relatively dry Period II, possibly due to frequent rainfall and associated efficient removal by wind. More emissions from religious activities in Period II might also contribute to the differences between the two periods. In contrast, both the total amount and the size distribution of particle mass in the FT for the two periods were comparable. Residual layers with elevated aerosol were often encountered in Period II, with particle mass concentrations averaging around 55 % of that in the PBL. The PMSDs in the RL shared a similar pattern to that in the PBL, suggesting they were probably of the same origin. The source apportionment analysis revealed that the factor associated with suspended dust in the coarse mode contributed more than 50 % in the PBL and the RL. However, a distinct peak over 0.5–0.7 µm was observed on religious holiday mornings, the same time periods when the contribution by the identified religious burning factor with a broad peak over about 0.3–0.7 µm was found to exceed the contribution by dust suspension. In the FT, submicron particles dominated, and the contribution by coarse-mode particles was below 10 %. More investigations based on ground-level, long-term monitoring and vertical measurements of aerosol chemical and physical properties will help better identify the origin and evolution processes of aerosols in this area.
The data in this study can be publicly accessed via https://doi.org/10.5281/zenodo.6374312 (Ran et al., 2022).
The supplement related to this article is available online at: https://doi.org/10.5194/acp-22-6217-2022-supplement.
JB and LR proposed the study. LR, ZD, and ZB designed and conducted the field campaign. YL participated in the field campaign. LR and ZD processed the data. JL and YW performed the positive matrix factorization modeling. DZ provided the surface meteorological data. LR visualized the data and wrote the paper. ZD and YW participated in several discussions and provided valuable suggestions. All authors reviewed the paper carefully.
The contact author has declared that neither they nor their co-authors have any competing interests.
Publisher’s note: Copernicus Publications remains neutral with regard to jurisdictional claims in published maps and institutional affiliations.
We are grateful to Yong Wang, Hanze Yu, and Qi Li, for their assistance in launching the tethered balloon. We also thank Tibet University, for providing the location for the campaign and all the support.
This research has been funded by the Second Tibetan Plateau Scientific Expedition and Research Program (grant no. 2019QZKK0604) and the National Natural Science Foundation of China (grant nos. 91837311 and 42061134012).
This paper was edited by Rolf Müller and reviewed by two anonymous referees.
Amato, F., Pandolfi, M., Escrig. A., Querol, X., Alastuey, A., Pey, J., Perez, N., and Hopke, P. K.: Quantifying road dust resuspension in urban environment by Multilinear Engine: A comparison with PMF2, Atmos. Environ., 43, 2770–2780, https://doi.org/10.1016/j.atmosenv.2009.02.039, 2009.
Atkinson, R.: Atmospheric chemistry of VOCs and NOx, Atmos. Environ., 34, 2063–2101, https://doi.org/10.1016/S1352-2310(99)00460-4, 2000.
Bai, Y. B., Shi, G. Y., Tamura, K., Shibata, T., Iwasaka, Y., Shin'ichi, K., and Tamio, T.: Aerosol optical properties derived from simultaneous sunphotometer and aureolemeter measurements in Lhasa, J. Environ. Sci., 12, 439–443, 2000.
Brown, S. G., Eberly, S., Paatero, P., and Norris, G. A.: Methods for estimating uncertainty in PMF solutions: Examples with ambient air and water quality data and guidance on reporting PMF results, Sci. Total Environ., 518–519, 626–635, https://doi.org/10.1016/j.scitotenv.2015.01.022, 2015.
Cai, Z. X., Li, Z. Q., L, P. R., Li, J. X., Sun, H. P., Yang, Y. M., Gao, X., Ren, G., Ren, R. M., and Wei, J.: Vertical distributions of aerosol microphysical and optical properties based on aircraft measurements made over the Loess Plateau in China, Atmos. Environ., 270, 118888, https://doi.org/10.1016/j.atmosenv.2021.118888, 2022.
Chen, P. F., Kang, S. C., Li, C. L., Li, Q. L., Yan, F. P., Guo, J. M., Ji, Z. M., Zhang, Q. G., Hu, Z. F., Tripathee, L., and Sillanpää, M.: Source apportionment and risk assessment of atmospheric polycyclic aromatic hydrocarbons in Lhasa, Tibet, China, Aerosol Air Qual. Res., 18, 1294–1304, https://doi.org/10.4209/aaqr.2017.12.0603, 2018.
Chiang, J. C. H., Kong, W., Wu, C. H., and Battisti, D. S.: Origins of East Asian Summer Monsoon seasonality, J. Climate, 33, 7945–7965, https://doi.org/10.1175/JCLI-D-19-0888.1, 2020.
Cong, Z. Y., Kang, S. C., Luo, C. L., Li, Q., Huang, J., Gao, S. P., and Li, X. D.: Trace elements and lead isotopic composition of PM10 in Lhasa, Tibet, Atmos. Environ., 45, 6210–6215, https://doi.org/10.1016/j.atmosenv.2011.07.060, 2011.
Cui, L. L., Duo, B., Zhang, F., Li, C. L., Fu, H. B., and Chen, J. M.: Physiochemical characteristics of aerosol particles collected from the Jokhang Temple indoors and the implication to human exposure, Environ. Pollut., 236, 992–1003, https://doi.org/10.1016/j.envpol.2017.10.107, 2018.
Cui, Y. Y., Liu, S., Bai, Z. X., Bian, J. C., Li, D., Fan, K. Y., McKeen, S. A., Watts, L. A., Ciciora, S. J., and Gao, R. S.: Religious burning as a potential major source of atmospheric fine aerosols in summertime Lhasa on the Tibetan Plateau, Atmos. Environ., 181, 186–191, https://doi.org/10.1016/j.atmosenv.2018.03.025, 2018.
Ding, Y. H.: The variability of the Asian Summer Monsoon, J. Meteor. Soc. Japan, 85B, 21–54, https://doi.org/10.2151/jmsj.85B.21, 2007.
Duo, B., Zhang, Y. C., Kong, L. D., Fu, H. B., Hu, Y. J., Chen, J. M., Li, L., and Qiong, A.: Individual particle analysis of aerosols collected at Lhasa City in the Tibetan Plateau, J. Environ. Sci., 29, 165–177, https://doi.org/10.1016/j.jes.2014.07.032, 2015.
Duo, B., Cui, L. L., Wang, Z. Z., Li, R., Zhang, L. W., Fu, H. B., Chen, J. M., Zhang, H. F., and Qiong, A.: Observations of atmospheric pollutants at Lhasa during 2014–2015: Pollution status and the influence of meteorological factors, J. Environ. Sci., 63, 28–42, https://doi.org/10.1016/j.jes.2017.03.010, 2018.
Ferrero, L., Perrone, M. G., Petraccone, S., Sangiorgi, G., Ferrini, B. S., Lo Porto, C., Lazzati, Z., Cocchi, D., Bruno, F., Greco, F., Riccio, A., and Bolzacchini, E.: Vertically-resolved particle size distribution within and above the mixing layer over the Milan metropolitan area, Atmos. Chem. Phys., 10, 3915–3932, https://doi.org/10.5194/acp-10-3915-2010, 2010.
Ferrero, L., Castelli, M., Ferrini, B. S., Moscatelli, M., Perrone, M. G., Sangiorgi, G., D'Angelo, L., Rovelli, G., Moroni, B., Scardazza, F., Močnik, G., Bolzacchini, E., Petitta, M., and Cappelletti, D.: Impact of black carbon aerosol over Italian basin valleys: high-resolution measurements along vertical profiles, radiative forcing and heating rate, Atmos. Chem. Phys., 14, 9641–9664, https://doi.org/10.5194/acp-14-9641-2014, 2014.
Gao, R. S., Telg, H., McLaughlin, R. J., Ciciora, S. J., Watts, L. A., Richardson, M. S., Schwarz, J. P., Perring, A. E., Thornberry, T. D., Rollins, A. W., Markovic, M. Z., Bates, T. S., Johnson, J. E., and Fahey, D. W.: A light-weight, high-sensitivity particle spectrometer for PM2.5 aerosol measurements, Aerosol Sci. Technol., 50, 88–99, https://doi.org/10.1080/02786826.2015.1131809, 2016.
Gong, P., Wang, X. P., and Yao. T. D.: Ambient distribution of particulate- and gas-phase n-alkanes and polycyclic aromatic hydrocarbons in the Tibetan Plateau, Environ. Earth Sci., 64, 1703–1711, https://doi.org/10.1007/s12665-011-0974-3, 2011.
He, C., Wang, Z. Q., Zhou, T. J., and Li, T.: Enhanced latent heating over the Tibetan Plateau as a key to the enhanced East Asian Summer Monsoon circulation under a warming climate, J. Climate, 32, 3373–3388, https://doi.org/10.1175/JCLI-D-18-0427.1, 2019.
Jarvis, A., Reuter, H. I., Nelson, A., and Guevara, E.: Hole-filled seamless SRTM data V4, International Centre for Tropical Agriculture (CIAT) [data set], http://srtm.csi.cgiar.org (last access: 6 November 2010), 2008.
Juntto, S. and Paatero, P.: Analysis of daily precipitation data by positive matrix factorization, Environmetrics, 5, 127–144, https://doi.org/10.1002/env.3170050204, 1994.
Kim, S. W., Yoon, S. C., Won, J. G., and Choi, S. C.: Ground-based remote sensing measurements of aerosol and ozone in an urban area: a case study of mixing height evolution and its effect on ground-level ozone concentrations, Atmos. Environ., 41, 7069–7081, https://doi.org/10.1016/j.atmosenv.2007.04.063, 2007.
Li, C. L., Han, X. W., Kang, S. C., Yan, F. P., Chen, P. F., Hu, Z. F., Yang, J. H., Ciren, D. J., Gao, S. P., Sillanpää, M., Han, Y. M., Cui, Y. Y., Liu, S., and Smith, K. R.: Heavy near-surface PM2.5 pollution in Lhasa, China during a relatively static winter period, Chemosphere, 214, 314–318, https://doi.org/10.1016/j.chemosphere.2018.09.135, 2019.
Lin, W., Zhu, T., Song, Y., Zou, H., Tang, M., Tang, X., and Hu, J.: Photolysis of surface O3 and production potential of OH radicals in the atmosphere over the Tibetan Plateau, J. Geophys. Res., 113, D02309, https://doi.org/10.1029/2007JD008831, 2008.
Liu, J. W., Li, J., Lin, T., Liu, D., Xu, Y., Chaemfa, C., Qi, S. H., Liu, F. B., and Zhang, G.: Diurnal and nocturnal variations of PAHs in the Lhasa atmosphere, Tibetan Plateau: Implication for local sources and the impact of atmospheric degradation processing, Atmos. Res., 124, 34–43, https://doi.org/10.1016/j.atmosres.2012.12.016, 2013.
Liu, P. F., Zhao, C. S., Zhang, Q., Deng, Z. Z., Huang, M. Y., Ma, X. C., and Tie, X. X.: Aircraft study of aerosol vertical distributions over Beijing and their optical properties, Tellus, 61B, 756–767, https://doi.org/10.1111/j.1600-0889.2009.00440.x, 2009.
Paatero, P.: Least squares formulation of robust non-negative factor analysis, Chemom. Intell. Lab. Syst., 37, 23–35, https://doi.org/10.1016/S0169-7439(96)00044-5, 1997.
Paatero, P. and Hopke, P. K.: Discarding or downweighting high-noise variables in factor analytic models, Anal. Chim. Acta, 490, 277–289, https://doi.org/10.1016/S0003-2670(02)01643-4, 2003.
Paatero, P. and Tapper, U.: Positive matrix factorization: A non-negative factor model with optimal utilization of error estimates of data values, Environmetrics, 5, 111–126, https://doi.org/10.1002/env.3170050203, 1994.
Ran, L., Lin, W. L., Deji, Y. Z., La, B., Tsering, P. M., Xu, X. B., and Wang, W.: Surface gas pollutants in Lhasa, a highland city of Tibet – current levels and pollution implications, Atmos. Chem. Phys., 14, 10721–10730, https://doi.org/10.5194/acp-14-10721-2014, 2014.
Ran, L., Deng, Z., Xu, X., Yan, P., Lin, W., Wang, Y., Tian, P., Wang, P., Pan, W., and Lu, D.: Vertical profiles of black carbon measured by a micro-aethalometer in summer in the North China Plain, Atmos. Chem. Phys., 16, 10441–10454, https://doi.org/10.5194/acp-16-10441-2016, 2016.
Ran, L., Deng, Z. Z., Wu, Y. F., Li, J. W., Bai, Z. X., Lu, Y., Zhuoga, D. Q., and Bian, J. C.: Data for “Measurement report: Vertical profiling of particle size distributions over Lhasa, Tibet: Tethered balloon-based in-situ measurements and source apportionment”, Zenodo [data set], https://doi.org/10.5281/zenodo.6374312, 2022.
Seibert, P., Beyrich, F., Gryning, S. E., Joffre, S., Rasmussen, A., and Tercier, P.: Review and intercomparison of operational methods for the determination of the mixing height, Atmos. Environ., 34, 1001–1027, https://doi.org/10.1016/S1352-2310(99)00349-0, 2000.
Shingler, T., Crosbie, E., Ortega, A., Shiraiwa, M., Zuend, A., Beyersdorf, A., Ziemba, L., Anderson, B., Thornhill, L., Perring, A. E., Schwarz, J. P., Campazano-Jost, P., Day, D. A., Jimenez, J. L., Hair, J. W., Mikoviny, T., Wisthaler, A., and Sorooshian, A.: Airborne characterization of subsaturated aerosol hygroscopicity and dry refractive index from the surface to 6.5 km during the SEAC4RS campaign, J. Geophys. Res.-Atmos., 121, 4188–4210, https://doi.org/10.1002/2015JD024498, 2016.
Sloane, C. S., Watson, J., Chow, J., Pritchett, L., and Richards, L. W.: Size-segregated fine particle measurements by chemical species and their impact on visibility impairment in Denver, Atmos. Environ., 25, 1013–1024, https://doi.org/10.1016/0960-1686(91)90143-U, 1991.
Tao, J., Zhang, L. M., Cao, J. J., Hsu, S.-C., Xia, X. A., Zhang, Z. S., Lin, Z. J., Cheng, T. T., and Zhang, R. J.: Characterization and source apportionment of aerosol light extinction in Chengdu, southwest China, Atmos. Environ., 95, 552–562, https://doi.org/10.1016/j.atmosenv.2014.07.017, 2014.
Tobo, Y., Iwasaka, Y., Shi, G. Y., Kim, Y. S., Ohashi, T., Tamura, K., and Zhang, D. Z.: Balloon-borne observations of high aerosol concentrations near the summertime tropopause over the Tibetan Plateau, Atmos. Res., 84, 233–241, https://doi.org/10.1016/j.atmosres.2006.08.003, 2007.
Wan, X., Kang, S. C., Xin, J. Y., Liu, B., Wen, T. X., Wang, P. L., Wang, Y. S., and Cong, Z. Y.: Chemical composition of size-segregated aerosols in Lhasa city, Tibetan Plateau, Atmos. Res., 174–175, 142–150, https://doi.org/10.1016/j.atmosres.2016.02.005, 2016.
Wei, N. N., Ma, C. L., Liu, J. W., Wang, G. H., Liu, W., Zhuoga, D. Q., Xiao, D. T., and Yao, J.: Size-segregated characteristics of carbonaceous aerosols during the monsoon and non-monsoon seasons in Lhasa in the Tibetan Plateau, Atmosphere, 10, 157, https://doi.org/10.3390/atmos10030157, 2019a.
Wei, N. N., Xu, Z. Y., Liu, J. W., Wang, G. H., Liu, W., Zhuoga, D. Q., Xiao, D. T., and Yao, J.: Characteristics of size distributions and sources of water-soluble ions in Lhasa during monsoon and non-monsoon seasons, J. Environ. Sci., 82, 155–168, https://doi.org/10.1016/j.jes.2019.02.017, 2019b.
Yin, X. F., de Foy, B., Wu, K. P., Feng, C., Kang, S. C., and Zhang, Q. G.: Gaseous and particulate pollutants in Lhasa, Tibet during 2013–2017: Spatial variability, temporal variations and implications, Environ. Pollut., 253, 68–77, https://doi.org/10.1016/j.envpol.2019.06.113, 2019.
Zhang, D. Z., Iwasaka, Y., and Shi, G. Y.: Soot particles and their impacts on the mass cycle in the Tibetan atmosphere, Atmos. Environ., 35, 5883–5894, https://doi.org/10.1016/S1352-2310(01)00391-0, 2001.
Zhang, K., Wang, D. F., Bian, Q. G., Duan, Y. S., Zhao, M. F., Fei, D. N., Xiu, G. L., and Fu, Q. Y.: Tethered balloon-based particle number concentration, and size distribution vertical profiles within the lower troposphere of Shanghai, Atmos. Environ., 154, 141–150, https://doi.org/10.1016/j.atmosenv.2017.01.025, 2017.
Zhang, X. Y., Arimoto, R., Cao, J. J., An, Z. S., and Wang, D.: Atmospheric dust aerosol over the Tibetan Plateau, J. Geophys. Res., 106, 18471–18476, https://doi.org/10.1029/2000JD900672, 2001.
Zhang, Y. L., Li, B. Y., Liu, L. S., and Zheng, D.: Redetermine the region and boundaries of Tibetan Plateau, Geograph. Res., 40, 1543–1553, https://doi.org/10.11821/dlyj020210138, 2021 (in Chinese).
Zhu, C. S., Cao, J. J., Hu, T. F., Shen, Z. X., Tie, X. X., Huang H., Wang, Q. Y., Huang, R. J., Zhao, Z. Z., Močnik, G., and Hansen, A. D. A.: Spectral dependence of aerosol light absorption at an urban and a remote site over the Tibetan Plateau, Sci. Total Environ., 590–591, 14–21, https://doi.org/10.1016/j.scitotenv.2017.03.057, 2017.
Zhu, J., Xia, X., Che, H., Wang, J., Cong, Z., Zhao, T., Kang, S., Zhang, X., Yu, X., and Zhang, Y.: Spatiotemporal variation of aerosol and potential long-range transport impact over the Tibetan Plateau, China, Atmos. Chem. Phys., 19, 14637–14656, https://doi.org/10.5194/acp-19-14637-2019, 2019.