the Creative Commons Attribution 4.0 License.
the Creative Commons Attribution 4.0 License.
 | 10 May 2022
Assessing the consequences of including aerosol absorption in potential stratospheric aerosol injection climate intervention strategies
Andy Jones
Ben T. Johnson
William McFarlane Smith
Theoretical stratospheric aerosol intervention (SAI) strategies model the deliberate injection of aerosols or their precursors into the stratosphere, thereby reflecting incident sunlight back to space and counterbalancing a fraction of the warming due to increased concentrations of greenhouse gases. This cooling mechanism is known to be relatively robust through analogues from explosive volcanic eruptions which have been documented to cool the climate of the Earth. However, a practical difficulty of SAI strategies is how to deliver the injection high enough to ensure dispersal of the aerosol within the stratosphere on a global scale. Recently, it has been suggested that including a small amount of absorbing material in a dedicated 10 d intensive deployment might enable aerosols or precursor gases to be injected at significantly lower, more technologically feasible altitudes. The material then absorbs sunlight, causing a localised heating and “lofting” of the particles and enabling them to penetrate into the stratosphere. Such self-lofting has recently been observed following the intensive wildfires in 2019–2020 in south-eastern Australia, where the resulting absorbing aerosol penetrated into the stratosphere and was monitored by satellite instrumentation for many months subsequent to emission. This study uses the fully coupled UKESM1 climate model simulations performed for the Geoengineering Model Intercomparison Project (GeoMIP) and new simulations where the aerosol optical properties have been adjusted to include a moderate degree of absorption. The results indicate that partially absorbing aerosols (i) reduce the cooling efficiency per unit mass of aerosol injected, (ii) increase deficits in global precipitation, (iii) delay the recovery of the stratospheric ozone hole, (iv) disrupt the Quasi-Biennial Oscillation when global-mean temperatures are reduced by as little as 0.1 K, and (v) enhance the positive phase of the wintertime North Atlantic Oscillation which is associated with floods in northern Europe and droughts in southern Europe. While these results are dependent upon the exact details of the injection strategies and our simulations use 10 times the ratio of black carbon to sulfate that is considered in the recent intensive deployment studies, they demonstrate some of the potential pitfalls of injecting an absorbing aerosol into the stratosphere to combat the global warming problem.
- Article
(1810 KB) - Full-text XML
- BibTeX
- EndNote


Global warming has accelerated swiftly over the last decade, with the last 7 years being warmer than any preceding years in the climatological record (https://climate.nasa.gov/vital-signs/global-temperature/, last access: 9 May 2022). Global-mean near-surface temperatures are currently 1.2 ∘C above pre-industrial levels (IPCC, 2021), with future shared socioeconomic pathway (SSP) projections universally showing continued warming for at least the next 2 decades. Consequently, the global-mean temperature target of the Paris 21st Conference of Parties (COP21) of 1.5 ∘C will very likely be exceeded in the next 2 decades, and even the 2 ∘C above the pre-industrial target will be extremely difficult to achieve under conventional mitigation scenarios (e.g. Rogelj et al., 2016; Millar et al., 2017; Tollefson, 2018; IPCC, 2018, 2021). These concerns have led to less conventional mitigation strategies being considered, including proposals to remove greenhouse gases from the atmosphere (frequently called carbon dioxide removal, CDR) and proposals to either block sunlight from reaching the planet or increase the reflectivity of the planet to reflect more sunlight out to space (frequently called solar radiation management, SRM). Stratospheric aerosol intervention (SAI), which proposes injecting aerosols, or their precursors, into the stratosphere where the resulting aerosols can reflect sunlight back to space, thereby cooling the planet (Shepherd, 2009; Lawrence et al., 2018; NAS, 2021), is the most prominent of the SRM methodologies. The injection material that has most frequently been studied is sulfur dioxide as this builds on the scientific understanding from observing and modelling the climatic impacts of large volcanic eruptions which periodically inject millions of tonnes of sulfur dioxide into the stratosphere.
The Geoengineering Model Intercomparison Project (GeoMIP; Kravitz et al., 2011) provides a comprehensive multi-model assessment of the effects of SRM (e.g. Kravitz et al., 2013; Tilmes et al., 2013; Jones et al., 2013). The latest phase of GeoMIP (GeoMIP6; Kravitz et al., 2016) provides policy-relevant simulations where the global-mean temperature trend for high-end warming scenarios is reduced to that of more moderate scenarios (e.g. Jones et al., 2021; Visioni et al., 2021). These reductions in global-mean temperature are achieved by injecting sulfur dioxide gas into the stratosphere, and the results have been shown to differ significantly from simulations that simply reduce the solar constant (e.g. Jones et al., 2021; Visioni et al., 2021).
Several systems for delivery of millions of tonnes of sulfur dioxide into the stratosphere have been conceptualised, including delivery by high-altitude aircraft, tethered balloons, rockets, artillery and rigid towers (Robock et al., 2009; McClellan et al., 2012; Davidson et al., 2012), but each of these is hampered by severe technological constraints which become more testing as the altitude of delivery increases. Several model simulations have shown that the cooling impact of stratospheric aerosols is maximised for aerosol delivered at high altitudes in the tropics (e.g. Jones et al., 2017; Tilmes et al., 2017), and more complex injection strategies as a function of latitude, altitude and season have been developed to customise the climate response and minimise any residual climatic impacts (e.g. Kravitz et al., 2016; Visioni et al., 2020; Lee et al., 2021). However, these studies assume that the technological solution for delivery exists, while, to date, it does not in any suitably scalable form, although development of a fleet of aircraft capable of delivering payloads at 20 km altitude using current technologies appears feasible (e.g. Smith, 2020).
The use of absorbing aerosols such as black carbon (BC) in stratospheric aerosol injection has also been investigated with models (e.g. Kravitz et al., 2012; Jones et al., 2016), but utilising BC alone as a single agent in SAI has been effectively discounted. Modelling results suggested that the temperature increases in the stratosphere when using BC injections to offset a few degrees of global warming was in the range of 60–80 K, depending upon the details of the injection scenario. However, recently it has been suggested that including a small amount of black carbon in a tailored intensive injection strategy could produce “self-lofting” that could at least ameliorate the need for high-altitude injection of material directly into the stratosphere. The theory is that the heating caused by aerosol absorption would rapidly transfer into the surrounding air, which would become more buoyant and rise relative to its surroundings. Gao et al. (2021) examine injections at an altitude of 13.5 km including both 2 Tg of sulfur dioxide and 0.01 Tg of BC as a lofting agent and conclude that, if deployed correctly, the sulfur dioxide and resulting sulfateBC aerosol mixture would rise into the stratosphere, resulting in a stratospheric burden as great as if sulfur dioxide were injected directly into the stratosphere at 20 km altitude.
In this study, we focus on the potential impacts on key climate variables of introducing partially absorbing aerosol into the stratosphere. Our experiments are based on the GeoMIP G6sulfur experiments (Kravitz et al., 2015) and are performed with the UKESM1 climate model (Sellar et al., 2019). Under G6sulfur, the global-mean near-surface temperature from the high-end climate change SSP5–8.5 scenario (O'Neill et al., 2014) is reduced to that of a more moderate SSP2–4.5 scenario by injecting sulfur dioxide into the stratosphere. We investigate the impacts of including a moderate amount of aerosol absorption by adjusting the single scattering albedo of the stratospheric aerosol at 550 nm from 1 to 0.95, which is equivalent to assuming a stratospheric BC : sulfate mass ratio of around 2 %. As such, this is a significantly higher fraction than that assumed in the plume rise modelling of Gao et al. (2021), who perform simulations with injections of BC and 2 Tg of SO2 over a 10 d period in the CESM2 model and then downscale the minimum BC injection rate to produce the same lifting impact within a plume model, finding a minimum injection of 0.01 TgBC. Thus, Gao et al. (2021) effectively assume a BC : sulfate ratio of just 0.3 %, while we assume ratios almost 10 times higher. We note not only technological challenges in the plume deployment procedure documented in Gao et al. (2021), which might increase the BC : sulfate ratio, but also that Gao et al. (2021) suggest that more SO2 could theoretically be lifted which might decrease the BC : sulfate ratio. Thus our simulations are not meant to directly follow or challenge the injection scenario of Gao et al. (2021) but rather to establish with current state-of-the-art model simulations what the impacts of including a moderate amount of absorption would be upon resulting climate impacts.
Section 2 provides a description of the UKESM1 model set-up and an overview of the G6sulfur simulations and new simulations including absorption (denoted G6abs hereafter). Section 3 compares results from the G6sulfur, G6abs and SSP2–4.5 simulations as appropriate, focussing on the spatial distribution of the aerosols, impacts on the induced near-surface regional and global-mean temperatures and the cooling efficiency, and impacts on precipitation and ozone. Section 4 focusses on the impact on the positive phase of the North Atlantic Oscillation (NAO; Jones et al., 2021, 2022). Section 5 focusses on the impacts on the Quasi-Biennial Oscillation (QBO; see also Jones et al., 2022). Section 6 provides a discussion and conclusions.
UKESM1 (Sellar et al., 2019) is a fully coupled Earth system model which has contributed to CMIP6 (Eyring et al., 2016) and GeoMIP6 (Kravitz et al., 2015). UKESM1 includes an atmosphere model based on the Met Office Unified Model (UM; Walters et al., 2019; Mulcahy et al., 2018) with a resolution of 1.25∘ latitude by 1.875∘ longitude, with 85 levels up to approximately 85 km, which is coupled to an ocean model with 1∘ resolution and 75 levels (Storkey et al., 2018). It also includes components to model both tropospheric and stratospheric chemistry (Archibald et al., 2020), aerosols (Mann et al., 2010), sea ice (Ridley et al., 2018), the land surface and vegetation (Best et al., 2011), and ocean biogeochemistry (Yool et al., 2013).
The GeoMIP G6sulfur simulations that reduce global-mean temperatures from the SSP5–8.5 scenario (O'Neill et al., 2016) to the SSP2–4.5 scenario are described in detail elsewhere (Kravitz et al., 2015; Jones et al., 2021). Three ensemble members are run for G6sulfur, based on three ScenarioMIP SSP5–8.5 simulations which are themselves continuations of corresponding CMIP6 historical simulations initialised from different points in the model's pre-industrial control simulation. In G6sulfur, the stratospheric SO2 injection is continuous between 10∘ N and 10∘ S along the Greenwich meridian at 18–20 km altitude and is adjusted every 10 years to provide a decadal global-mean temperature that matches that of SSP2–4.5 within ±0.2 K. In G6abs the SO2 injection rate (in Tg SO2 yr−1) is identical to that of G6sulfur in terms of mass, but the optical properties of the stratospheric sulfate aerosol are adjusted to simulate an internal mixture with BC making up 2 % of the aerosol volume (assuming volume weighting of refractive indices at all wavelengths). This reduces the single scattering albedo at 550 nm from around 1 to 0.95 at 550 nm and leads to a 40-fold increase in absorptivity when integrated across the solar spectrum but has minimal impact on extinction and aerosol optical depth (∼ 4 % increase). Again, a three-member ensemble is performed.
We predominantly focus our analysis on two aspects. The first of these is the evolution of global-mean parameters such as temperature and precipitation as a function of time over the period 2020–2100. The second is the difference in the spatial distribution of key physical and meteorological variables between the G6abs and G6sulfur simulations (G6abs–G6sulfur) or against present-day (PD, taken as the period 2016–2025 from the SSP2–4.5 ensemble) conditions (i.e. G6abs-PD or G6sulfur-PD). For simplicity, we generally make comparisons against the end of the simulations over the 20-year period 2081–2100.
3.1 Impact on the vertical distribution of the plume and the resulting stratospheric aerosol optical depth (SAOD)
Before assessing the impacts of the plume on climate variables such as the cooling efficiency and the impact on global-mean precipitation, we examine the influence that the additional absorption has on the spatial characteristics of the aerosol plume. Figure 1a shows the annual-mean latitude–altitude cross section of accumulation-mode sulfate aerosol concentrations under G6sulfur and G6abs, and the difference between the two is shown in Fig. 1b.
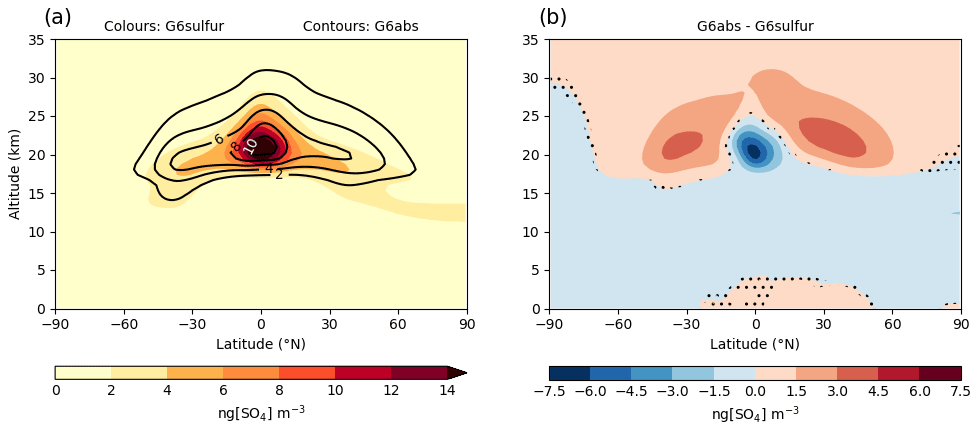
Figure 1(a) The accumulation-mode sulfate aerosol concentrations under G6sulfur (colours) and G6abs (lines) and (b) the difference in the aerosol concentrations. Simulations are for ensemble means from 2081 to 2100. Stippling represents areas that are not significant at the 5 % level using a two-tailed t-test.
In G6abs, the aerosol concentrations are less constrained to the tropics (Fig. 1b), reaching higher altitudes and spreading at higher altitudes to the mid latitudes. This increased aerosol altitude leads to an increased SAOD of 0.38 for G6abs compared to 0.29 for G6sulfur (i.e. an enhancement of a factor of around 1.3). This increased AOD is a result of additional buoyancy provided by solar lofting in G6abs which counteracts the gravitational settling of the aerosol and maintains it at higher altitudes, so reducing the flux of aerosol across the tropopause and enhancing its lifetime in the stratosphere.
3.2 Impacts on the cooling efficiency of the SAI particles
Figure 2 shows the resulting global-mean temperatures from the SSP5–8.5 ensemble, the SSP2–4.5 ensemble, and G6sulfur and G6abs.

Figure 2(a) The change in the global-mean near-surface air temperatures from pre-industrial (PI) conditions for (a) the SSP5–8.5 (ssp585), SSP2–4.55 (ssp245), G6sulfur and G6abs ensembles. Each ensemble is comprised of three members. The spatial distribution of the annual-mean surface temperature change for 2081–2100 compared to present day (PD) for (b) G6sulfur and (c) G6abs. All areas in (b) and (c) are significant at the 5 % level using a two-tailed t-test.
Figure 2a shows that, while G6sulfur is successful in reducing the SSP5–8.5 scenario temperatures to those of SSP2–4.5, G6abs results in an under-cooling. It is well established that absorbing aerosols lead to an additional heating of the stratosphere (e.g. Kravitz et al., 2012; Jones et al., 2017). This leads to an increase in downward terrestrial radiation across the tropopause which leads to an additional heating of the troposphere, thus reducing the aerosol cooling efficiency in the G6abs simulations.
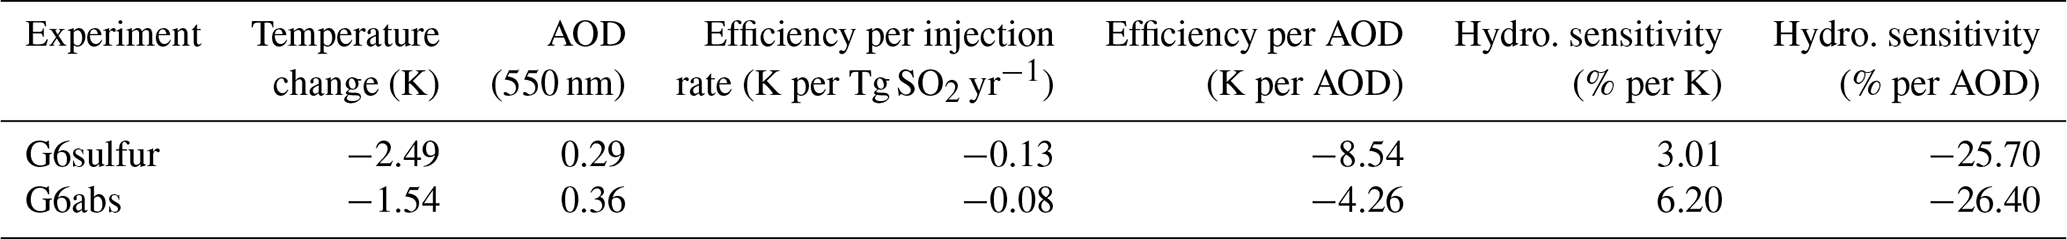
The ratio of the cooling of G6abs to G6sulfur for the period 2081–2100 is 0.62, indicating a significantly less effective cooling efficiency for the absorbing aerosols. Over the period 2081–2100, the injection averages 19.0 Tg SO2 yr−1, yielding a cooling of approximately 2.5 K in G6sulfur and a cooling efficiency of 0.13 K per Tg SO2 yr−1, in agreement with the range of 0.04 to 0.14 K per Tg SO2 yr−1 from other studies performing the G6sulfur simulations (Visioni et al., 2021). For G6abs, the cooling efficiency drops to 0.08 K per Tg SO2 yr−1.
The cooling efficiency per unit aerosol optical depth (AOD) is reduced even further, leading to a cooling efficiency of 8.5 K per AOD for G6sulfur but 4.1 K per AOD for G6abs, indicating that, under G6abs, although the SAOD is increased, this impact is more than offset by the impact of reduced cooling owing to the heating of the stratosphere. These results are summarised in Table 1.
Table 1Summarising the global-mean cooling efficiency and hydrological sensitivity for G6sulfur and G6abs compared to SSP5–8.5 over the period 2081–2100. The metrics shown are derived for injection rates of approximately 19 Tg SO2 yr−1.
As expected, the spatial distribution of the annual-mean temperature change reveals a greater temperature change at extreme polar latitudes as the G6sulfur simulations are designed to offset only a fraction of the global-mean temperature change under the SSP5–8.5 simulations, so polar amplification (e.g. Holland and Bitz, 2003) remains evident (Fig. 2b and c).
3.3 Impact on the global-mean precipitation response
As stated in Bala et al. (2008), for the same surface temperature change, forcings acting in the solar spectrum result in relatively larger changes in net radiative fluxes at the surface than those from CO2 that act in the terrestrial spectrum. These larger changes are compensated by larger changes in the sum of latent and sensible heat fluxes. While this feature was first noted in early experiments that perturbed the solar constant (e.g. Bala et al., 2008; Schmidt et al., 2012; Kravitz et al., 2013; Jones et al., 2013), SAI via sulfate aerosol has been shown to have an even larger hydrological sensitivity (Neimeier et al., 2013; Visioni et al., 2021), with Visioni et al. (2021) diagnosing a multi-model hydrological sensitivity of 3.79 ± 0.76 % by 2081–2100 under the G6sulfur scenario. Absolute values of the precipitation change with respect to pre-industrial conditions are presented in Fig. 3. As in other studies, the global-mean precipitation is reduced for G6sulfur when compared to SSP2–4.5, but this reduction is even more pronounced for G6abs. The higher hydrological sensitivity for G6abs is influenced both by the increased absolute reduction in precipitation and the reduced cooling impact (Fig. 2, Table 1). Values of hydrological sensitivity of 3.01 % per K and 6.20 % per K are diagnosed for G6sulfur and G6abs over 2081–2100. Table 1 shows that G6abs has an optical depth that is approximately a factor of 1.3 greater than G6sulfur, and thus the hydrological sensitivity as percent per AOD is similar between the G6sulfur and G6abs cases. The results show interesting parallels with results for perturbations to tropospheric BC and sulfate aerosols, though through different mechanisms. In the troposphere, warming in the mid and upper troposphere is known to reduce global precipitation by countering the balance between longwave cooling and latent heat release through precipitation (Smith et al., 2018). This mechanism is particularly strong for tropospheric BC (e.g. Johnson et al., 2019) and leads to a much greater hydrological sensitivity compared to tropospheric sulfate perturbations or reductions in the solar constant (Samset et al., 2018).
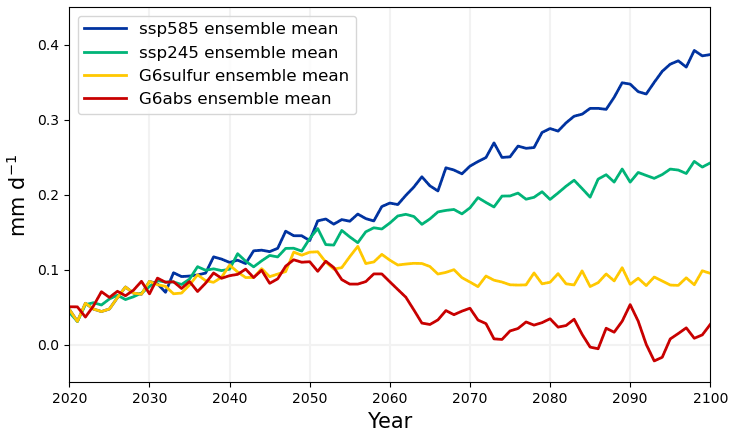
Figure 3The mean change in the global-mean precipitation from PI conditions for the SSP5–8.5 (ssp585), SSP2–4.55 (ssp245), G6sulfur and G6abs ensembles. Each ensemble is comprised of three members.
Figure 4 shows the spatial distribution of precipitation changes over land areas for 2081–2100 compared to PD; while the global-mean precipitation changes only a little from PD conditions, the spatial distribution of precipitation changes is quite variable. Both G6sulfur and G6abs show a similar distribution with drying over central North America, central Eurasia, Amazonia, and southern and central Africa. While the pattern of precipitation changes is similar, the changes in precipitation are stronger for G6abs compared to G6sulfur even though the temperature change is reduced.
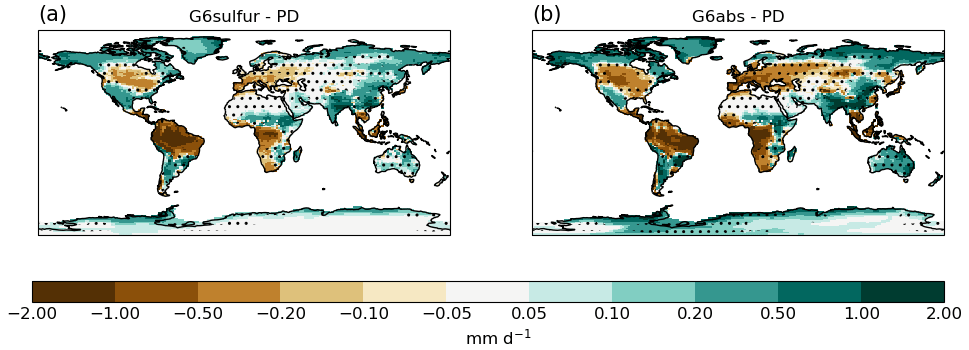
Figure 4The spatial distribution of the change in the precipitation distribution in the period 2081–2100 compared to PD for (a) G6sulfur and (b) G6abs. Note that the values quoted for the means are for land areas only; global means without the land mask are +0.048 mm d−1 for G6sulfur and −0.023 mm d−1 for G6abs. Stippling represents areas that are not significant at the 5 % level using a two-tailed t-test.
3.4 Impacts on stratospheric temperatures
Stratospheric temperatures are strongly impacted by the aerosol injections in both G6sulfur and G6abs. Compared to SSP5–8.5, by 2081–2100 G6sulfur shows a maximum annual-mean stratospheric temperature perturbation of 5–10 K centred at the Equator at an altitude of around 22 km (Fig. 5a). This perturbation to equatorial stratospheric temperatures is much increased to 25–30 K for G6abs (Fig. 5b). The difference in the stratospheric temperature between G6abs and G6sulfur (Fig. 5c) reveals that the maximum temperature perturbation caused by the inclusion of aerosol absorption is shifted to higher altitudes, which reflects the changes to the vertical distribution of the aerosol concentrations (Fig. 1a).
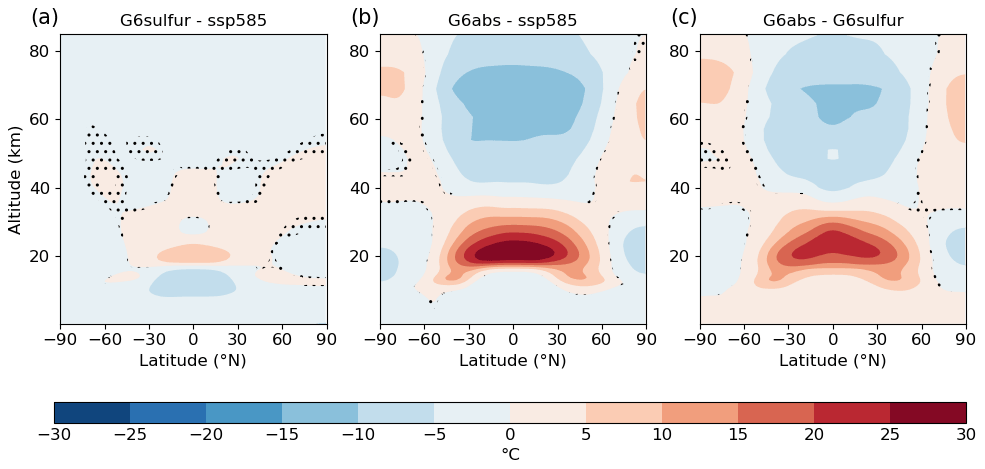
Figure 5The perturbation to atmospheric temperatures (2081–2100) under (a) G6sulfur compared to SSP5–8.5, (b) G6abs compared to SSP5–8.5, and (c) G6abs–G6sulfur. Stippling represents areas that are not significant at the 5 % level using a two-tailed t-test.
3.5 Impacts on stratospheric ozone and water vapour
Stratospheric ozone may be impacted by stratospheric aerosols through heterogeneous processes (e.g. Solomon, 1999), and both ozone and water vapour may be influenced by changes in stratospheric dynamics that are induced by changes to the heating rates. Tilmes et al. (2022) provide the most comprehensive multi-model assessment of the impacts of SAI from the G6sulfur simulations on stratospheric ozone, finding significant ozone depletion during spring-time over polar regions but general increases in total column ozone over mid latitudes and the tropics. Our experimental design is unable to assess impacts of any changes to heterogeneous processes between G6sulfur and G6abs because our simulations simply perturb the optical characteristics of the aerosols. However, the simulations do allow assessment of impacts on ozone through changes to the stratospheric dynamics.
We compare ozone concentrations for the time period 2081–2100 for both G6sulfur and G6abs against the present day (Fig. 6). Results are similar to those derived when the global-mean temperature perturbation is identical (i.e. 2081–2100 for G6sulfur and 2065–2084 for G6abs against the present day, not shown). Compared to PD, G6sulfur shows an increase in high-latitude stratospheric ozone as ozone-depleting substances decrease in the future and the ozone hole starts to recover, and a small decrease in tropical stratospheric ozone. The G6abs simulations show that the inclusion of absorption effectively cancels out the recovery of the ozone hole at high latitudes and causes additional stratospheric ozone depletion at tropical and mid latitudes. We stress again that our results are applicable only to the impacts of increased solar absorption of the composite aerosols. BC is not explicitly modelled here, so the impacts of heterogeneous chemistry from inclusion of BC aerosols remain an open question.
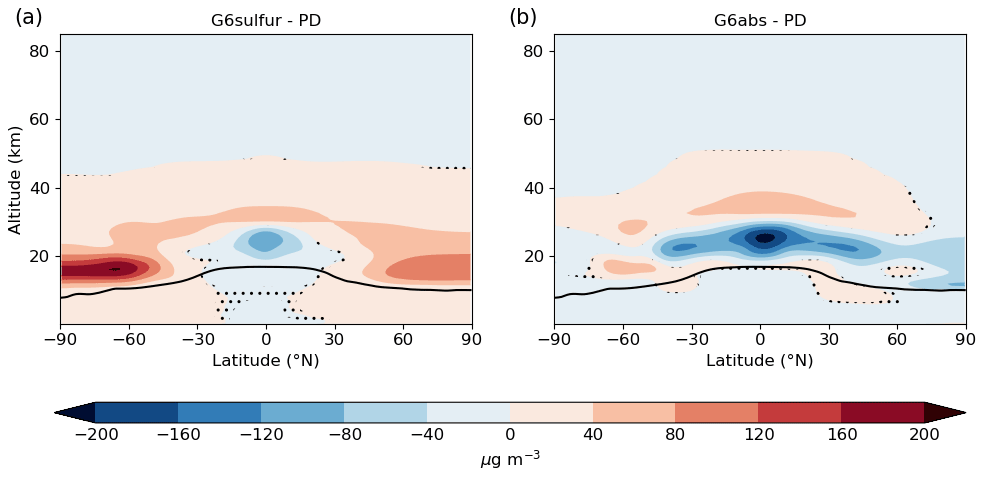
Figure 6The perturbation to stratospheric ozone for 2081–2100 compared to PD for (a) G6sulfur and (b) G6abs. The modelled tropopause is marked by the black line. Stippling represents areas that are not significant at the 5 % level using a two-tailed t-test.
The predominant source of stratospheric water vapour is from troposphere–stratosphere transport across the tropopause at tropical latitudes (Holton et al., 1995). This transport is limited by the tropopause acting as a “cold trap” (Sherwood and Dessler, 2001) that dries air to the local saturation vapour pressure as it crosses into the stratosphere, leading to condensation of water vapour and dehydration of stratospheric air. A secondary source of water vapour is the oxidation of methane (e.g. Le Texier et al., 1988). One of the consequences of the significant stratospheric heating from G6abs is a very significant increase in stratospheric water vapour by an order of magnitude owing to the significant increase in the tropical tropopause temperature, which becomes a less effective cold trap. Figure 7 presents the stratospheric humidity (ppmv). Under PD conditions, water vapour concentrations are typically in the range 5–10 ppmv. By 2081–2100, under SSP5–8.5, stratospheric water vapour typically increases by around 5 ppmv, presumably owing to increases in the oxidation of atmospheric methane. Little change from PD is seen in SSP2–4.5 by 2081–2100. Under G6sulfur, water vapour concentrations are higher than both SSP2–4.5 and SSP5–8.5 despite the fact that the global-mean surface temperature is (by design) the same as that of SSP2–4.5. In G6abs, the amount of water vapour in the stratosphere is increased by almost an order of magnitude owing to the reduced efficiency of the tropopause cold trap caused by the strong stratospheric heating at tropical latitudes (Fig. 5). Note that even stronger increases in stratospheric water vapour concentrations have been noted in simulations of nuclear winter scenarios through the same mechanistic route (Coupe et al., 2019). As noted by Mills et al. (2014), the photolysis of water vapour in the stratosphere exacerbates stratospheric ozone destruction, thus contributing to the ozone loss shown in Fig. 6. Our simulations are not able to assess the relative contribution of this process to the ozone loss.
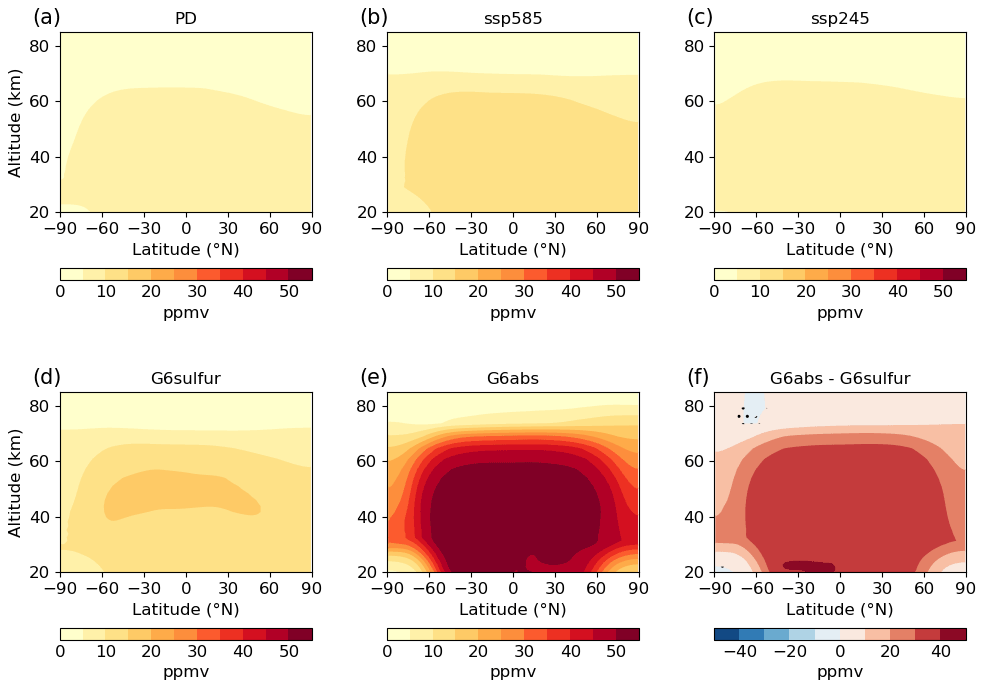
Figure 7Stratospheric water vapour concentrations for (a) PD, (b) SSP5–8.5 (2081–2100), (c) SSP2–4.5 (2081–2100), (d) G6sulfur (2081–2100) and (e) G6abs (2081–2100). (f) Changes in water vapour concentrations for G6abs–G6sulfur (2081–2100), where stippling represents areas that are not significant at the 5 % level using a two-tailed t-test.
In essence, the NAO is a measure of the perturbation to the pressure difference between the Icelandic low-pressure and Azores high-pressure systems (e.g. Hurrell, 1995). A positive phase of the NAO during Northern Hemisphere wintertime (DJF) corresponds to a larger-than-normal pressure difference which is associated with increased rainfall in northern Europe and drying of southern Europe. Observational analyses have shown that the majority of devastating floods in northern Europe are associated with a positive NAO (Zanardo et al., 2019), while southern Europe and particularly the Iberian Peninsula are prone to disruptive droughts and water shortages (Trigo et al., 2004). Recent works have revealed potentially damaging impacts of SAI with sulfate aerosols as they can force a positive wintertime NAO phase through the following mechanism. Non-negligible absorption of sulfate aerosol at wavelengths greater than approximately 1.3 µm (Dykema et al., 2016) combines with differential insolation across the boundary of the wintertime polar night to strengthen the polar vortex via thermal wind balance. These features impact the tropospheric winds, causing a strengthening of westerly flow leading to drying across Iberia, the Mediterranean countries and the Balkans (Jones et al., 2021, 2022; Banerjee et al., 2021). By increasing the absorption of stratospheric aerosols, one might expect this impact to be significantly amplified (Simpson et al., 2019). We follow the approach of Stephenson et al. (2006) and Baker et al. (2018) in defining the boreal wintertime NAO as the mean DJF difference in area-mean sea-level pressure between two regions: one bounded by 90∘ W–60∘ E, 20–55∘ N (for simplicity referred to as Azores), the other by 90∘ W–60∘ E, 55–90∘ N (for simplicity referred to as Iceland).
Mechanistically, the reasons behind changes to the NAO are identical to those shown in Jones et al. (2021) for G6sulfur, but the magnitude of the effect is significantly greater in G6abs. In G6sulfur a strong stratospheric zonal-mean DJF wind anomaly centred over Alaska develops at around 10 hPa at 60–70∘ N with an increase of more than 15 ms−1, thereby enhancing the strength of the polar vortex. In G6abs, the increase is more than 50 ms−1 (not shown for brevity). This enhanced westerly flow propagates through to lower levels in the troposphere, as shown by the DJF zonal-mean wind perturbation at 850 hPa (Fig. 8a and b).

Figure 8Panels (a)–(b) show the spatial distribution (2081–2100 compared to PD) of the perturbation to the 850 hPa wind speed for DJF for (a) G6sulfur and (b) G6abs. White areas represent elevated areas where the surface pressure is less than 850 hPa. Panels (c)–(d) show the spatial distribution of the perturbation (2081–2100 vs. PD) to mean sea-level pressure (MSLP, hPa) for (c) G6sulfur and (d) G6abs. Stippling represents areas that are not significant at the 5 % level using a two-tailed t-test.
There is clear evidence of propagation of the enhanced westerly flow to the surface north of around 50∘ N, with decreased westerly flow to the south of that latitude for both the G6sulfur and G6abs simulations. The patterns of the response are similar for G6sulfur (Fig. 8a) and G6abs (Fig. 8b), but the magnitude is increased by around a factor of 2 in G6abs compared to G6sulfur. In G6abs, there is evidence that the westerly flow perturbation penetrates deeper into Eurasia, stretching across Siberia, and “joins up” with the perturbation to the westerly flow that is evident over the North Pacific. Thus, in G6abs, the westerly perturbation over the North Pacific to the east of Kamchatka is enhanced by considerably more than a factor of 2 when compared to G6sulfur.
The perturbations to the mean sea-level pressure (MSLP) show similar large-scale features between G6sulfur and G6abs (Fig. 8c and d), but again, the response to G6abs is stronger than for G6sulfur, leading to a more well-defined polar vortex. The resulting impact on the temporal evolution of the NAO index is shown in Fig. 9 for SSP2–4.5, G6sulfur and G6abs. As documented by Jones et al. (2021, 2022), there is little impact on the NAO index under SSP2–4.5 but a strong impact on the NAO index under G6sulfur, with the pressure difference between Iceland and the Azores increasing by around 2.5 hPa by 2100 (Fig. 9). In G6abs, the increase in the pressure difference is even more dramatic, exceeding 6 hPa by 2100. Note that all six climate models that have performed G6sulfur simulations to date indicate a clear increase in the NAO for sulfate geoengineering (Jones et al., 2022); given our understanding of drivers of the NAO mechanisms (e.g. Shindell et al., 2004; Jones et al., 2021), it is reasonable to assume that all models would also show a similar increase should the aerosols applied in SAI be more absorbing, although dedicated multi-model assessments would be needed to prove this assumption.
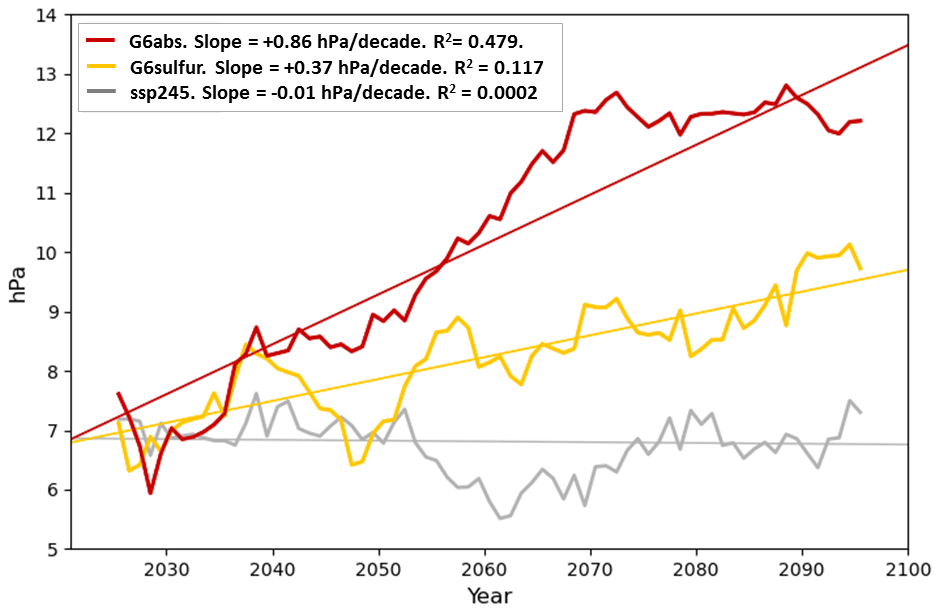
Figure 9Evolution of the NAO, defined as the DJF mean sea-level pressure difference (hPa) between regions bounded by 90∘ W–60∘ E, 20–55∘ N and 90∘ W–60∘ E, 55–90∘ N for each model in experiments SSP2–45 (ssp245 – grey), G6sulfur (yellow) and G6abs (red). All results are ensemble means and have been smoothed using a 10-year running mean; a least-squares straight-line fit to each is also plotted.
We now consider the impacts of the strengthening of the NAO on patterns of temperature and precipitation. We have already presented the change in the annual-mean temperature compared to PD in Fig. 2, which showed significantly more warming in G6abs compared to G6sulfur, particularly over northern latitudes of Siberia and continental North America. Our focus now shifts to the DJF period. To make a meaningful comparison of the changes in patterns in regional temperatures, we assess the temperatures in the periods when the global-mean perturbation in temperature in G6abs is equivalent to that in G6sulfur. The periods that are analysed are 2065–2084 for G6abs and 2081–2100 for G6sulfur (Fig. 2a). The results are shown in Fig. 10.
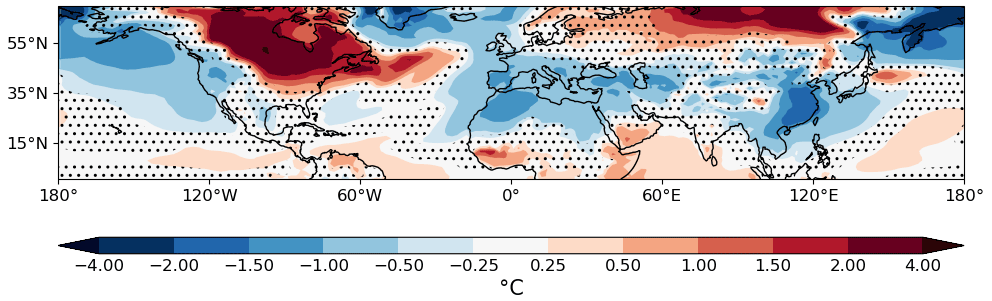
Figure 10The difference (G6abs − G6sulfur) in the DJF near-surface temperature between G6abs (2065–2084) and G6sulfur (2081–2100). Stippling represents areas that are not significant at the 5 % level using a two-tailed t-test.
Although the 20-year annual-mean temperatures are the same, G6abs leads to warmer DJF temperatures than G6sulfur over northern Europe and cooler temperatures over southern Europe, signals that are consistent with an increase in the NAO index, which increases the penetration of mobile weather systems over northern Europe but enhances blocking over southern Europe. It is noticeable that there is enhanced warming over Siberia, but more particularly over much of northern and eastern continental North America. A multi-model assessment of model behaviour under G6sulfur suggests that all six models experience a DJF warming over Siberia (Jones et al., 2022, their Fig. 3), and it is therefore unsurprising that further enhancing the positive NAO index further enhances this warming. However, these multi-model results show little consistency over continental North America (Banerjee et al., 2021), so any impact over continental North America inferred by this present study must be treated with caution.
The most well-established impacts of an increased positive phase of the NAO during DJF are the increased precipitation and flooding over northern Europe and decreased precipitation and drought over southern Europe (e.g. Trigo et al., 2004; Zanardo et al., 2019). Again, these impacts have been clearly demonstrated in multi-model assessments of the G6sulfur simulations (Jones et al., 2022). We show the differences between both G6sulfur and G6abs for the period 2081–2100 compared to the present day in Fig. 11.

Figure 11The difference in the DJF land precipitation rates in 2081–2100 compared to the present day for (a) G6sulfur and (b) G6abs. Stippling represents areas that are not significant at the 5 % level using a two-tailed t-test.
It is clear that G6abs is associated with a greater positive-NAO-phase enhancement of the disruption of precipitation than G6sulfur even though the global-mean cooling impact is less for G6abs over this period. The impacts of such a disruption over many countries around the Mediterranean have been highlighted in other studies for sulfate aerosol (e.g. Jones et al., 2021, 2022; Banerjee et al., 2021), with Jones et al. (2022) showing a multi-model mean precipitation reduction for G6sulfur of around 22 % for the Iberian Peninsula when comparing 2081–2100 against 2011–2030. Here, UKESM1 suggests a reduction over Iberia of 10.1 % for G6sulfur for a similar time frame of analysis but 30.2 % for G6abs, suggesting that precipitation reductions over Iberia are around 3 times greater under G6abs than G6sulfur. Such reductions in precipitation would be very detrimental in terms of water resources (López-Moreno and Vicente-Serrano, 2008). The areal extent and severity of the reductions in DJF precipitation become more pronounced in countries surrounding the Black Sea, and the areal extent of the precipitation reduction under G6abs spreads from Eurasia through to eastern Asia. Reductions in precipitation are widespread across China and the Indo-China Peninsula. In much of coastal eastern China, including areas around Beijing and Shanghai, the deficits in DJF precipitation translate to reductions of greater than 20 % but exceed 40 % at the southern tip of the Indo-China Peninsula across Cambodia, Vietnam and Thailand. In contrast, precipitation in northern Europe is enhanced in G6abs, with Finland seeing percentage increases in excess of 60 %, while the Baltic states experience precipitation increases in excess of 40 %. Enhanced precipitation of greater than 60 % is also experienced around the Great Lakes areas of North America, although we note the lack of model consensus in G6sulfur noted in Jones et al. (2022).
Jones et al. (2022) present multi-model ensemble simulations examining the impact of SAI upon the QBO in the G6sulfur simulations. Of the six models analysed, UKESM1 has arguably one of the more realistic representations of QBO frequency and magnitude throughout the depth of the stratosphere (Richter et al., 2020; Jones et al., 2022). As in previous studies (Aquila et al., 2014; Jones et al., 2016, 2022), a shutdown of the QBO is characterised by winds in the lower stratosphere becoming locked into a persistent westerly phase. This behaviour is clearly evident in G6sulfur, with the QBO shutdown commencing around 2058. In G6abs this shutdown occurs at a much earlier date, around 2033 (Fig. 12), when there is negligible global-mean cooling impact from G6abs (Fig. 2a): the cooling impact of SAI in G6abs at around 2033 is just 0.1 K. The cause of such an early shutdown in the QBO appears to be the intense heating of the tropical stratosphere which causes an increased positive vertical velocity that opposes downward propagation of zonal wind variation in the tropics. Sulfate aerosol only absorbs an appreciable amount of solar radiation at wavelengths longer than 1.3 µm (Dykema et al., 2016), while BC absorbs solar radiation across the entire solar spectrum, resulting in much stronger heating rates and perturbations to stratospheric temperatures by around a factor of 5 (Fig. 5). Thus, the intrinsic absorption of the aerosol particles, rather than any changes to the AOD, appears to be the leading cause of the breakdown of the QBO which locks into a westerly phase for around 30 years until around 2060–2065. Subsequently, a further change in the characteristics of lower-stratospheric tropical dynamics is noted, with a transition to annually alternating easterly–westerly winds at around 10 hPa with persistent easterlies below. Simulations with the CESM2–WACCM6 climate model of volcanic “super-eruptions” (Brenna et al., 2021), where a pulse of 1000 MtSO2 was injected into the tropical stratosphere, cause a peak tropical lower-stratospheric warming of around 30 K (see also our Fig. 5). Brenna et al. (2021) report a similar breakdown of the QBO to that reported here, with persistent easterlies that switch to persistent westerlies that evolve into a more recognisable QBO structure as the stratospheric temperatures reduce. That the CESM2–WACCM6 model performs in a similar way to UKESM1 for these extreme stratospheric temperature changes lends confidence to our results.
We emphasise again here that the simulations for both G6sulfur and G6abs inject aerosol only at tropical latitudes (10∘ N–10∘ S). Simulations using SO2 injection positioned in the sub-tropics (e.g. 15∘ N, 30∘ N, 15∘ S, and 30∘ S) in other models appear to prevent significant locking of the QBO into the westerly phase (e.g. Richter et al., 2017, 2018; Kravitz et al., 2019).
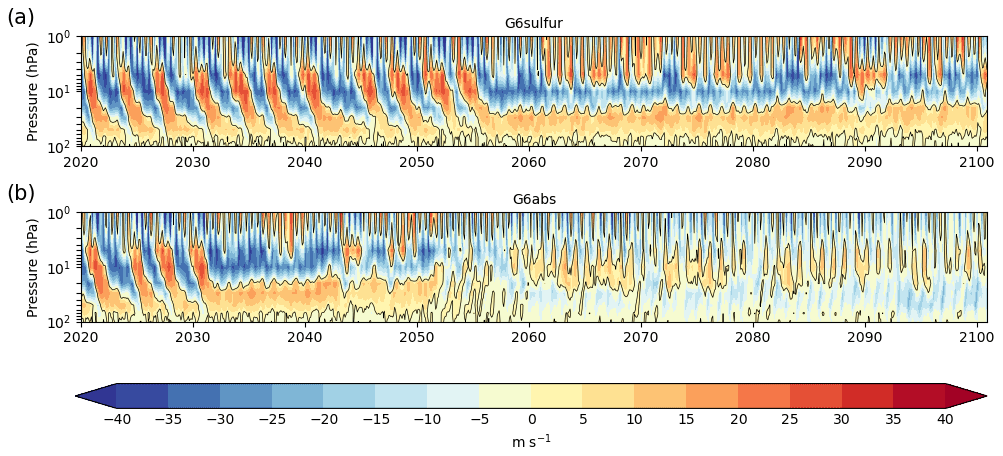
Figure 12The QBO diagnosed from one of the three ensemble members (all ensemble members show similar behaviour) for (a) G6sulfur and (b) G6abs. Plots consist of time–pressure cross sections of 5∘ N–5∘ S mean zonal stratospheric winds (m s−1) from a single ensemble member. Positive values indicate westerly winds and negative values indicate easterlies; the black contour is at 0 m s−1.
There is growing evidence to support the hypothesis that “self-lofting” can aid the transport of absorbing aerosols into the stratosphere. Many observational studies have shown intrusions of biomass burning smoke from intense pyrocumulus events that have ascended and persisted in the stratosphere for weeks or months (e.g. Fromm et al., 2000, 2005; Peterson et al., 2018; Christian et al., 2019; Osborne et al., 2022). For instance, plumes of absorbing biomass burning smoke from the Pacific Northwest fires of 2017 (Peterson et al., 2018; Yu et al., 2019) were detected at altitudes of 23 km in the stratosphere. An even stronger injection of smoke into the stratosphere has been documented from the intense fires of December 2019–January 2020 in south-eastern Australia, after which smoke aerosol was observed at altitudes in excess of 30 km (Khaykin et al., 2020). The progressive ascent of the smoke was clearly evident in satellite retrievals of stratospheric aerosol (Kloss et al., 2021). Thus, there is little doubt that the absorption-lofting mechanism is physically plausible and could raise the altitude of partially absorbing aerosols released in theoretical SAI scenarios.
We stress again that in the suggestion by Gao et al. (2021), a smaller amount of BC aerosol was proposed to lift sulfate into the stratosphere, which assumed a ratio of BC to sulfate around 10 times less than that modelled here. It would be critical to assess whether the assumed BC amounts used in such proposals could achieve the efficacy of lofting that is stated. In addition, there are certainly other caveats that need to be considered in our modelling study. Under the G6sulfur protocol, the injection strategy is not optimised in terms of the injection latitudes (e.g. Kravitz et al., 2016; Tilmes et al., 2017) or seasons (Lee et al., 2021); both could help to ameliorate the impacts on the QBO and the NAO.
The simulations presented here investigate the influence of moderately absorbing aerosol on the stratosphere by adjusting the absorption properties of aerosols in UKESM1 simulations of the GeoMIP G6sulfur scenario. A moderate level of absorption (with an aerosol single scattering albedo of 0.95 at 0.55 µm) is chosen to provide a suitable signal : noise ratio in resulting physical and dynamical changes. Our results suggest that inclusion of absorption
- i.
reduces the cooling efficiency per unit mass of aerosol injected,
- ii.
increases deficits in global precipitation,
- iii.
delays the recovery of the stratospheric ozone hole,
- iv.
disrupts the Quasi-Biennial Oscillation when applying moderately absorbing aerosols to combat a warming of just 0.1 K, and
- v.
enhances the positive phase of the wintertime North Atlantic Oscillation, associated with floods in northern Europe and droughts in southern Europe.
We believe that the scientific understanding of the impacts of absorbing aerosols is sufficient to provide an informed scientific discourse on some of the potential pitfalls of absorbing aerosols in the stratosphere. Where the main uncertainties arise is not in the climatic response of global-mean temperatures, precipitation patterns, or the impacts on dynamical features such as the QBO and NAO and their subsequent impacts on regional climate but in uncertainties around the effectiveness of the physical deployment of such strategies (Gao et al., 2021). A quantitative uncertainty analysis of physical and logistical factors that could reduce (or enhance) the efficiency of such deployment strategies would seem like an essential first step in assessing whether such technologies could theoretically be used to combat global climate change. Besides scientific and technological factors, there are a host of other moral, philosophical, and political questions that would need to be addressed (e.g. Lawrence et al., 2018); while of critical importance, such factors are beyond the scope of this work.
UKESM1 model data for the SSP2-45, SSP5-85, and GeoMIP G6sulfur scenarios used in this work are available from the Earth System Grid Federation (WCRP, 2021; https://esgf-node.llnl.gov/projects/cmip6, last access: 2 February 2022). Data from G6abs is available on request from the authors.
JMH and AJ devised the experiment and led the analysis. BTJ developed the spectral properties of the absorbing aerosol. AJ ran the G6abs experiments. WMS performed an initial analysis of the simulations during his MMaths project supervised by JMH. JMH and AJ wrote the paper with contributions from all the co-authors.
The contact author has declared that neither they nor their co-authors have any competing interests.
Publisher's note: Copernicus Publications remains neutral with regard to jurisdictional claims in published maps and institutional affiliations.
This article is part of the special issue “Resolving uncertainties in solar geoengineering through multi-model and large-ensemble simulations (ACP/ESD inter-journal SI)”. It is not associated with a conference.
Jim M. Haywood, Andy Jones and Ben T. Johnson were supported by the Met Office Hadley Centre Climate Programme funded by BEIS. Andy Jones and Jim M. Haywood were funded by SilverLining through its Safe Climate Research Initiative. William McFarlane Smith was partly funded by a Natural Environment Research Council Exeter-NCAR (EXTEND) collaborative development grant (NE/W003880/1).
This paper was edited by Susannah Burrows and reviewed by two anonymous referees.
Aquila, V., Garfinkel, C. I., Newman, P. A., Oman, L. D., and Waugh, D. W.: Modifications of the quasi-biennial oscillation by a geoengineering perturbation of the stratospheric aerosol layer, Geophys. Res. Lett., 41, 1738–1744, https://doi.org/10.1002/2013GL058818, 2014.
Archibald, A. T., O'Connor, F. M., Abraham, N. L., Archer-Nicholls, S., Chipperfield, M. P., Dalvi, M., Folberth, G. A., Dennison, F., Dhomse, S. S., Griffiths, P. T., Hardacre, C., Hewitt, A. J., Hill, R. S., Johnson, C. E., Keeble, J., Köhler, M. O., Morgenstern, O., Mulcahy, J. P., Ordóñez, C., Pope, R. J., Rumbold, S. T., Russo, M. R., Savage, N. H., Sellar, A., Stringer, M., Turnock, S. T., Wild, O., and Zeng, G.: Description and evaluation of the UKCA stratosphere–troposphere chemistry scheme (StratTrop vn 1.0) implemented in UKESM1, Geosci. Model Dev., 13, 1223–1266, https://doi.org/10.5194/gmd-13-1223-2020, 2020.
Baker, L. H., Shaffrey, L. C., Sutton, R. T., Weisheimer, A., and Scaife, A. A.: An intercomparison of skill and overconfidence/underconfidence of the wintertime North Atlantic Oscillation in multimodel seasonal forecasts, Geophys. Res. Lett., 45, 7808–7817, https://doi.org/10.1029/2018GL078838, 2018.
Bala, G., Duffy, P. B., and Taylor, K. E.: Impact of geoengineering schemes on the global hydrological cycle, P. Natl. Acad. Sci. USA, 105, 7664–7669, 2008.
Banerjee, A., Butler, A. H., Polvani, L. M., Robock, A., Simpson, I. R., and Sun, L.: Robust winter warming over Eurasia under stratospheric sulfate geoengineering – the role of stratospheric dynamics, Atmos. Chem. Phys., 21, 6985–6997, https://doi.org/10.5194/acp-21-6985-2021, 2021.
Best, M. J., Pryor, M., Clark, D. B., Rooney, G. G., Essery, R. L. H., Ménard, C. B., Edwards, J. M., Hendry, M. A., Porson, A., Gedney, N., Mercado, L. M., Sitch, S., Blyth, E., Boucher, O., Cox, P. M., Grimmond, C. S. B., and Harding, R. J.: The Joint UK Land Environment Simulator (JULES), model description – Part 1: Energy and water fluxes, Geosci. Model Dev., 4, 677–699, https://doi.org/10.5194/gmd-4-677-2011, 2011.
Brenna, H., Kutterolf, S., Mills, M. J., Niemeier, U., Timmreck, C., and Krüger, K.: Decadal disruption of the QBO by tropical volcanic supereruptions, Geophys. Res. Lett., 48, 1–13, https://doi.org/10.1029/2020GL089687, 2021.
Christian, K., Wang, J., Ge, C., Peterson, D., Hyer, E., Yorks, J., and McGill, M.: Radiative forcing and stratospheric warming of pyrocumulonimbus smoke aerosols: First modeling results with multisensor (EPIC, CALIPSO, and CATS) views from space, Geophys. Res. Lett., 46, 10061–10071, 2019.
Coupe, J., Bardeen, C. G., Robock, A., and Toon, O. B.: Nuclear winter responses to nuclear war between the United States and Russia in the whole atmosphere community climate model version 4 and the Goddard Institute for Space Studies ModelE, J. Geophys. Res.-Atmos., 124, 8522–8543, 2019.
Davidson, P., Burgoyne, C., Hunt, H., and Causier, M.: Lifting options for stratospheric aerosol geoengineering: advantages of tethered balloon systems, Philos. T. Roy. Soc. A, 370, 4263–4300, 2012.
Dykema, J. D., Keith, D. W., and Keutch, F. N.: Improved aerosol radiative properties as a foundation for solar geoengineering risk assessment, Geophys. Res. Lett., 43, 7758–7766, https://doi.org/10.1002/2016GL069258, 2016.
Eyring, V., Bony, S., Meehl, G. A., Senior, C. A., Stevens, B., Stouffer, R. J., and Taylor, K. E.: Overview of the Coupled Model Intercomparison Project Phase 6 (CMIP6) experimental design and organization, Geosci. Model Dev., 9, 1937–1958, https://doi.org/10.5194/gmd-9-1937-2016, 2016.
Fromm, M., Alfred, J., Hoppel, K., Hornstein, J., Bevilacqua, R., Shettle, E., and Stocks, B.: Observations of boreal forest fire smoke in the stratosphere by POAM III, SAGE II, and lidar in 1998, Geophys. Res. Lett., 27, 1407–1410. https://doi.org/10.1029/1999GL011200, 2000.
Fromm, M., Bevilacqua, R., Servranckx, R., Rosen, J., Thayer, J. P., Herman, J., and Larko, D.: Pyro-cumulonimbus injection of smoke to the stratosphere: Observations and impact of a super blowup in northwestern Canada on 34 August 1998, J. Geophys. Res., 110, D08205, https://doi.org/10.1029/2004JD005350, 2005.
Gao, R. S., Rosenlof, K. H., Kärcher, B., Tilmes, S., Toon, O. B., Maloney, C., and Yu, P.: Toward practical stratospheric aerosol albedo modification: Solar-powered lofting, Sci. Adv., 7, eabe3416, https://doi.org/10.1126/sciadv.abe3416, 2021.
Holland, M. M. and Bitz, C. M.: Polar amplification of climate change in coupled models, Clim. Dynam., 21, 221–232, 2003.
Holton, J. R., Haynes, P. H., McIntyre, M. E., Douglass, A. R., Rood, R. B., and Pfister, L.: Stratosphere-troposphere exchange, Rev. Geophys., 33, 403–439, 1995.
Hurrell, J. W.: Decadal trends in the North Atlantic Oscillation: regional temperatures and precipitation, Science, 269, 676–679, https://doi.org/10.1126/science.269.5224.676, 1995.
IPCC: Global warming of 1.5 ∘C. An IPCC Special Report on the impacts of global warming of 1.5 ∘C above pre-industrial levels and related global greenhouse gas emission pathways, in the context of strengthening the global response to the threat of climate change, sustainable development, and efforts to eradicate poverty, edited by: Masson-Delmotte, V., Zhai, P., Pörtner, H. O., Roberts, D., Skea, J., Shukla, P. R., Pirani, A., Moufouma-Okia, W., Péan, C., Pidcock, R., Connors, S., Matthews, J. B. R., Chen, Y., Zhou, X., Gomis, M. I., Lonnoy, E., Maycock, T., Tignor, M., and Waterfield, T., 2018.
IPCC: Climate Change 2021: The Physical Science Basis. Contribution of Working Group I to the Sixth Assessment Report of the Intergovernmental Panel on Climate Change, edited by: Masson-Delmotte, V., Zhai, P., Pirani, A., Connors, S. L., Péan, C., Berger, S., Caud, N., Chen, Y., Goldfarb, L., Gomis, M. I., Huang, M., Leitzell, K., Lonnoy, E., Matthews, J. B. R., Maycock, T. K., Waterfield, T., Yelekçi, O., Yu, R., and Zhou, B., Cambridge University Press, 2021.
Johnson, B. T., Haywood, J. M., and Hawcroft, M. K.: Are changes in atmospheric circulation important for black carbon aerosol impacts on clouds, precipitation, and radiation?, J. Geophys. Res.-Atmos, 124, 7930–7950, https://doi.org/10.1029/2019JD030568, 2019.
Jones, A., Haywood, J. M., Alterskjær, K., Boucher, O., Cole, J. N., Curry, C. L., Irvine, P. J., Ji, D., Kravitz, B., Kristjánsson, J. E., and Moore, J. C.: The impact of abrupt suspension of solar radiation management (termination effect) in experiment G2 of the Geoengineering Model Intercomparison Project (GeoMIP), J. Geophys. Res.-Atmos., 118, 9743–9752, 2013.
Jones, A. C., Haywood, J. M., Dunstone, N., Emanuel, K., Hawcroft, M. K., Hodges, K. I., and Jones, A.: Impacts of hemispheric solar geoengineering on tropical cyclone frequency, Nat. Commun., 8, 1–10, 2017.
Jones, A., Haywood, J. M., Jones, A. C., Tilmes, S., Kravitz, B., and Robock, A.: North Atlantic Oscillation response in GeoMIP experiments G6solar and G6sulfur: why detailed modelling is needed for understanding regional implications of solar radiation management, Atmos. Chem. Phys., 21, 1287–1304, https://doi.org/10.5194/acp-21-1287-2021, 2021.
Jones, A., Haywood, J. M., Scaife, A. A., Boucher, O., Henry, M., Kravitz, B., Lurton, T., Nabat, P., Niemeier, U., Séférian, R., Tilmes, S., and Visioni, D.: The impact of stratospheric aerosol intervention on the North Atlantic and Quasi-Biennial Oscillations in the Geoengineering Model Intercomparison Project (GeoMIP) G6sulfur experiment, Atmos. Chem. Phys., 22, 2999–3016, https://doi.org/10.5194/acp-22-2999-2022, 2022.
Jones, A. C., Haywood, J. M., and Jones, A.: Climatic impacts of stratospheric geoengineering with sulfate, black carbon and titania injection, Atmos. Chem. Phys., 16, 2843–2862, https://doi.org/10.5194/acp-16-2843-2016, 2016.
Khaykin, S., Legras, B., Bucci, S., Sellitto, P., Isaksen, L., Tence, F., Bekki, S., Bourassa, A., Rieger, L., Zawada, D., and Jumelet, J.: The 2019/20 Australian wildfires generated a persistent smoke-charged vortex rising up to 35 km altitude, Commun. Earth Environ., 1, 1–12, 2020.
Kloss, C., Berthet, G., Sellitto, P., Ploeger, F., Taha, G., Tidiga, M., Eremenko, M., Bossolasco, A., Jégou, F., Renard, J.-B., and Legras, B.: Stratospheric aerosol layer perturbation caused by the 2019 Raikoke and Ulawun eruptions and their radiative forcing, Atmos. Chem. Phys., 21, 535–560, https://doi.org/10.5194/acp-21-535-2021, 2021.
Kravitz, B., Robock, A., Boucher, O., Schmidt, H., Taylor, K. E., Stenchikov, G., and Schulz, M.: The geoengineering model intercomparison project (GeoMIP), Atmos. Sci. Lett., 12, 162–167, 2011.
Kravitz, B., Robock, A., Shindell, D. T., and Miller, M. A.: Sensitivity of stratospheric geoengineering with black carbon to aerosol size and altitude of injection, J. Geophys. Res., 117, D09203, https://doi.org/10.1029/2011JD017341, 2012.
Kravitz, B., Caldeira, K., Boucher, O., Robock, A., Rasch, P. J., Alterskjær, K., Karam, D. B., Cole, J. N., Curry, C. L., Haywood, J. M., and Irvine, P. J.: Climate model response from the geoengineering model intercomparison project (GeoMIP), J. Geophys. Res.-Atmos., 118, 8320–8332, 2013.
Kravitz, B., Robock, A., Tilmes, S., Boucher, O., English, J. M., Irvine, P. J., Jones, A., Lawrence, M. G., MacCracken, M., Muri, H., Moore, J. C., Niemeier, U., Phipps, S. J., Sillmann, J., Storelvmo, T., Wang, H., and Watanabe, S.: The Geoengineering Model Intercomparison Project Phase 6 (GeoMIP6): simulation design and preliminary results, Geosci. Model Dev., 8, 3379–3392, https://doi.org/10.5194/gmd-8-3379-2015, 2015.
Kravitz, B., MacMartin, D. G., Wang, H., and Rasch, P. J.: Geoengineering as a design problem, Earth Syst. Dynam., 7, 469–497, https://doi.org/10.5194/esd-7-469-2016, 2016.
Kravitz, B., MacMartin, D. G., Tilmes, S., Richter, J. H., Mills, M. J., Cheng, W., Dagon, K., Glanville, A. S., Lamarque, J. F., Simpson, I. R., and Tribbia, J.: Comparing surface and stratospheric impacts of geoengineering with different SO2 injection strategies, J. Geophys. Res.-Atmos., 124, 7900–7918, 2019.
Lawrence, M. G., Schäfer, S., Muri, H., Scott, V., Oschlies, A., Vaughan, N. E., Boucher, O., Schmidt, H., Haywood, J., and Scheffran, J.: Evaluating climate geoengineering proposals in the context of the Paris Agreement temperature goals, Nat. Commun., 9, 1–19, 2018.
Lee, W. R., MacMartin, D. G., Visioni, D., and Kravitz, B.: High-Latitude Stratospheric Aerosol Geoengineering Can Be More Effective if Injection Is Limited to Spring, Geophys. Res. Lett., 48, e2021GL092696, https://doi.org/10.1029/2021GL092696, 2021.
Le Texier, H., Solomon, S., and Garcia, R. R.: The role of molecular hydrogen and methane oxidation in the water vapour budget of the stratosphere, Q. J. Roy. Meteor. Soc., 114, 281–295, 1988.
López-Moreno, J. I. and Vicente-Serrano, S. M.: Positive and negative phases of the wintertime North Atlantic Oscillation and drought occurrence over Europe: a multitemporal-scale approach, J. Climate, 21, 1220–1243, https://doi.org/10.1175/2007JCLI1739.1, 2008.
Mann, G. W., Carslaw, K. S., Spracklen, D. V., Ridley, D. A., Manktelow, P. T., Chipperfield, M. P., Pickering, S. J., and Johnson, C. E.: Description and evaluation of GLOMAP-mode: a modal global aerosol microphysics model for the UKCA composition-climate model, Geosci. Model Dev., 3, 519–551, https://doi.org/10.5194/gmd-3-519-2010, 2010.
McClellan, J., Keith, D. W., and Apt, J.: Cost analysis of stratospheric albedo modification delivery systems, Environ. Res. Lett., 7, 034019, https://doi.org/10.1088/1748-9326/7/3/034019, 2012.
Millar, R. J., Fuglestvedt, J. S., Friedlingstein, P., Rogelj, J., Grubb, M. J., Matthews, H. D., Skeie, R. B., Forster, P. M., Frame, D. J., and Allen, M. R.: Emission budgets and pathways consistent with limiting warming to 1.5∘C, Nat. Geosci., 10, 741–747, 2017.
Mills, M. J., Toon, O. B., Lee-Taylor, J., and Robock, A.: Multidecadal global cooling and unprecedented ozone loss following a regional nuclear conflict, Earth's Future, 2, 161–176, https://doi.org/10.1002/2013EF000205, 2014.
Mulcahy, J. P., Jones, C., Sellar, A., Johnson, B., Boutle, I. A., Jones, A., Andrews, T., Rumbold, S. T., Mollard, J., Bellouin, N., Johnson, C. E., Williams, K. D., Grosvenor, D. P., and Mc-Coy, D. T.: Improved Aerosol Processes and Effective Radiative Forcing in HadGEM3 and UKESM1, J. Adv. Model. Earth Sy., 10, 2786–2805, https://doi.org/10.1029/2018MS001464, 2018.
NAS (National Academies of Sciences), Engineering, and Medicine: Reflecting Sunlight: Recommendations for Solar Geoengineering Research and Research Governance, Washington, DC, The National Academies Press https://doi.org/10.17226/25762, 2021.
Niemeier, U., Schmidt, H., Alterskjær, K., and Kristjánsson, J. E.: Solar irradiance reduction via climate engineering: Impact of different techniques on the energy balance and the hydrological cycle, J. Geophys. Res.-Atmos., 118, 11–905, 2013.
O'Neill, B. C., Kriegler, E., Riahi, K., Ebi, K. L., Hallegatte, S., Carter, T. R., Mathur, R., and van Vuuren, D.P.: A new scenario framework for climate change research: the concept of shared socioeconomic pathways, Climatic Change, 122, 387–400, 2014.
Osborne, M. J., de Leeuw, J., Witham, C., Schmidt, A., Beckett, F., Kristiansen, N., Buxmann, J., Saint, C., Welton, E. J., Fochesatto, J., Gomes, A. R., Bundke, U., Petzold, A., Marenco, F., and Haywood, J.: The 2019 Raikoke volcanic eruption – Part 2: Particle-phase dispersion and concurrent wildfire smoke emissions, Atmos. Chem. Phys., 22, 2975–2997, https://doi.org/10.5194/acp-22-2975-2022, 2022.
Peterson, D. A., Campbell, J. R., Hyer, E. J., Fromm, M. D., Kablick, G. P., Cossuth, J. H., and DeLand, M. T.: Wildfire-driven thunderstorms cause a volcano-like stratospheric injection of smoke, NPJ Clim. Atmos. Sci., 1, 1–8, 2018.
Richter, J. H., Tilmes, S., Mills, M. J., Tribbia, J. J., Kravitz, B., MacMartin, D. G., Vitt, F., and Lamarque, J.-F.: Stratospheric Dynamical Response and Ozone Feedbacks in the Presence of SO2 Injections, J. Geophys. Res.-Atmos., 122, 12557–12573, https://doi.org/10.1002/2017JD026912, 2017.
Richter, J. H., Tilmes, S., Glanville, A., Kravitz, B., MacMartin, D. G., Mills, M. J., Simpson, I. R., Vitt, F., Tribbia, J. J., and Lamarque, J. F.: Stratospheric response in the first geoengineering simulation meeting multiple surface climate objectives, J. Geophys. Res.-Atmos., 123, 5762–5782, 2018.
Richter, J. H., Anstey, J. A., Butchart, N., Kawatani, Y., Meehl, G. A., Osprey, S., and Simpson, I. R.: Progress in simulating the quasi-biennial oscillation in CMIP models, J. Geophys. Res.-Atmos., 125, e2019JD032362, https://doi.org/10.1029/2019JD032362, 2020.
Ridley, J. K., Blockley, E. W., Keen, A. B., Rae, J. G. L., West, A. E., and Schroeder, D.: The sea ice model component of HadGEM3-GC3.1, Geosci. Model Dev., 11, 713–723, https://doi.org/10.5194/gmd-11-713-2018, 2018.
Robock, A., Marquardt, A., Kravitz, B., and Stenchikov, G.: Benefits, risks, and costs of stratospheric geoengineering, Geophys. Res. Lett., 36, L19703, https://doi.org/10.1029/2009GL039209, 2009.
Rogelj, J., Den Elzen, M., Höhne, N., Fransen, T., Fekete, H., Winkler, H., Schaeffer, R., Sha, F., Riahi, K., and Meinshausen, M.: Paris Agreement climate proposals need a boost to keep warming well below 2 ∘C, Nature, 534, 631–639, 2016.
Samset, B. H., Stjern, C. W., Andrews, E., Kahn, R., Myhre, G., Schulz, M., and Schuster, G.: Aerosol absorption: Progress towards global and regional constraints, Current Climate Change Reports, 4, 65–83, https://doi.org/10.1007/s40641-018-0091-4, 2018.
Schmidt, H., Alterskjær, K., Bou Karam, D., Boucher, O., Jones, A., Kristjánsson, J. E., Niemeier, U., Schulz, M., Aaheim, A., Benduhn, F., Lawrence, M., and Timmreck, C.: Solar irradiance reduction to counteract radiative forcing from a quadrupling of CO2: climate responses simulated by four earth system models, Earth Syst. Dynam., 3, 63–78, https://doi.org/10.5194/esd-3-63-2012, 2012.
Sellar, A., Jones, C. G., Mulcahy, J. P., Tang, Y., Yool, A., Wiltshire, A., O'Connor, F. M., Stringer, M., Hill, R., Palmieri, J., Woodward, S., de Mora, L., Kuhlbrodt, T., Rumbold, S., Kelley, D. I., Ellis, R., Johnson, C. E., Walton, J., Abraham, N. L., Andrews, M. B., Andrews, T., Archibald, A. T., Berthou, S., Burke, E., Blockley, E., Carslaw, K., Dalvi, M., Edwards, J., Folberth, G. A., Gedney, N., Griffiths, P. T., Harper, A. B., Hendry, M. A., Hewitt, A. J., Johnson, B., Jones, A., Jones, C. D., Keeble, J., Liddicoat, S., Morgenstern, O., Parker, R. J., Predoi, V., Robertson, E., Siahaan, A., Smith, R. S., Swaminathan, R., Woodhouse, M., Zeng, G., and Zerroukat, M.: UKESM1: Description and evaluation of the UK Earth System Model, J. Adv. Model. Earth Sy., 11, 4513–4558, https://doi.org/10.1029/2019MS001739, 2019.
Shepherd, J. G.: Geoengineering the climate: science, governance and uncertainty, Royal Society, RS Policy document 10/09, ISBN: 978-0-85403-773-5, 2009.
Sherwood, S. C. and Dessler, A. E.: A model for transport across the tropical tropopause, J. Atmos. Sci., 58, 765–779, 2001.
Shindell, D. T., Schmidt, G. A., Mann, M. E., and Faluvegi, G.: Dynamic winter climate response to large tropical volcanic eruptions since 1600, J. Geophys. Res.-Atmos., 109, D05104, https://doi.org/10.1029/2003JD004151, 2004.
Simpson, I. R., Tilmes, S., Richter, J. H., Kravitz, B., MacMartin, D. G., Mills, M. J., Fasullo, J. T., and Pendergrass, A. G.: The regional hydroclimate response to stratospheric sulfate geoengineering and the role of stratospheric heating, J. Geophys. Res.-Atmos., 124, 12587–12616, 2019.
Smith, W.: The cost of stratospheric aerosol injection through 2100, Environ. Res. Lett., 15, 114004, https://doi.org/10.1088/1748-9326/aba7e7, 2020.
Smith, C. J., Kramer, R. J., Myhre, G., Forster, P. M., Soden, B. J., Andrews, T., Boucher, O., Faluvegi, G., Fläschner, D., Hodnebrog, Ø., and Kasoar, M.: Understanding rapid adjustments to diverse forcing agents, Geophys. Res. Lett., 45, 12–23, 2018.
Solomon, S.: Stratospheric ozone depletion: A review of concepts and history, Rev. Geophys., 37, 275–316, 1999.
Stephenson, D. B., Pavan, V., Collins, M., Junge, M. M., and Quadrelli, R.: North Atlantic Oscillation response to transient greenhouse gas forcing and the impact on European winter climate: a CMIP2 multi-model assessment, Clim. Dynam., 27, 401–420, 2006.
Storkey, D., Blaker, A. T., Mathiot, P., Megann, A., Aksenov, Y., Blockley, E. W., Calvert, D., Graham, T., Hewitt, H. T., Hyder, P., Kuhlbrodt, T., Rae, J. G. L., and Sinha, B.: UK Global Ocean GO6 and GO7: a traceable hierarchy of model resolutions, Geosci. Model Dev., 11, 3187–3213, https://doi.org/10.5194/gmd-11-3187-2018, 2018.
Tilmes, S., Fasullo, J., Lamarque, J. F., Marsh, D. R., Mills, M., Alterskjær, K., Muri, H., Kristjánsson, J. E., Boucher, O., Schulz, M., and Cole, J. N.: The hydrological impact of geoengineering in the Geoengineering Model Intercomparison Project (GeoMIP), J. Geophys. Res.-Atmos., 118, 11–36, 2013.
Tilmes, S., Richter, J. H., Mills, M. J., Kravitz, B., MacMartin, D. G., Vitt, F., Tribbia, J. J., and Lamarque, J. F.: Sensitivity of aerosol distribution and climate response to stratospheric SO2 injection locations, J. Geophys. Res.-Atmos., 122, 12–591, 2017.
Tilmes, S., Visioni, D., Jones, A., Haywood, J., Séférian, R., Nabat, P., Boucher, O., Bednarz, E. M., and Niemeier, U.: Stratospheric ozone response to sulfate aerosol and solar dimming climate interventions based on the G6 Geoengineering Model Intercomparison Project (GeoMIP) simulations, Atmos. Chem. Phys., 22, 4557–4579, https://doi.org/10.5194/acp-22-4557-2022, 2022.
Tollefson, J.: IPCC says limiting global warming to 1.5∘C will require drastic action, Nature, 562, 172–173, 2018.
Trigo, R. M., Pozo-Vázquez, D., Osborn, T. J., Castro-Díez, Y., Gámiz-Fortis, S., and Esteban-Parra, M. J.: North Atlantic Oscillation influence on precipitation, river flow and water resources in the Iberian Peninsula, Int. J. Climatol., 24, 925–944, https://doi.org/10.1002/joc.1048, 2004.
Visioni, D., MacMartin, D. G., Kravitz, B., Richter, J. H., Tilmes, S., and Mills, M. J.: Seasonally modulated stratospheric aerosol geoengineering alters the climate outcomes, Geophys. Res. Lett., 47, e2020GL088337, https://doi.org/10.1029/2020GL088337, 2020.
Visioni, D., MacMartin, D. G., Kravitz, B., Boucher, O., Jones, A., Lurton, T., Martine, M., Mills, M. J., Nabat, P., Niemeier, U., Séférian, R., and Tilmes, S.: Identifying the sources of uncertainty in climate model simulations of solar radiation modification with the G6sulfur and G6solar Geoengineering Model Intercomparison Project (GeoMIP) simulations, Atmos. Chem. Phys., 21, 10039–10063, https://doi.org/10.5194/acp-21-10039-2021, 2021.
Walters, D., Baran, A. J., Boutle, I., Brooks, M., Earnshaw, P., Edwards, J., Furtado, K., Hill, P., Lock, A., Manners, J., Morcrette, C., Mulcahy, J., Sanchez, C., Smith, C., Stratton, R., Tennant, W., Tomassini, L., Van Weverberg, K., Vosper, S., Willett, M., Browse, J., Bushell, A., Carslaw, K., Dalvi, M., Essery, R., Gedney, N., Hardiman, S., Johnson, B., Johnson, C., Jones, A., Jones, C., Mann, G., Milton, S., Rumbold, H., Sellar, A., Ujiie, M., Whitall, M., Williams, K., and Zerroukat, M.: The Met Office Unified Model Global Atmosphere 7.0/7.1 and JULES Global Land 7.0 configurations, Geosci. Model Dev., 12, 1909–1963, https://doi.org/10.5194/gmd-12-1909-2019, 2019.
World Climate Research Programme (WCRP): WCRP Coupled Model Intercomparison Project (Phase 6), https://esgf-node.llnl.gov/projects/cmip6 (last access: 2 February 2022), 2021.
Yool, A., Popova, E. E., and Anderson, T. R.: MEDUSA-2.0: an intermediate complexity biogeochemical model of the marine carbon cycle for climate change and ocean acidification studies, Geosci. Model Dev., 6, 1767–1811, https://doi.org/10.5194/gmd-6-1767-2013, 2013
Yu, P., Toon, O. B., Bardeen, C. G., Zhu, Y., Rosenlof, K. H., Portmann, R. W., Thornberry, T. D., Gao, R. S., Davis, S. M., Wolf, E. T., and de Gouw, J.: Black carbon lofts wildfire smoke high into the stratosphere to form a persistent plume, Science, 365, 587–590, 2019.
Zanardo, S., Nicotina, L., Hilberts, A. G. J., and Jewson, S. P.: Modulation of economic losses from European floods by the North Atlantic Oscillation, Geophys. Res. Lett., 46, 2563–2572, https://doi.org/10.1029/2019GL081956, 2019.
- Abstract
- Introduction
- The UKESM1 model and model simulations
- Results: impacts on key variables
- Results: impacts on the North Atlantic Oscillation
- Results: impacts on the Quasi-Biennial Oscillation
- Discussion and conclusions
- Code and data availability
- Author contributions
- Competing interests
- Disclaimer
- Special issue statement
- Financial support
- Review statement
- References