the Creative Commons Attribution 4.0 License.
the Creative Commons Attribution 4.0 License.
 | 05 May 2022
Enhanced photodegradation of dimethoxybenzene isomers in/on ice compared to in aqueous solution
Ted Hullar
Theo Tran
Zekun Chen
Fernanda Bononi
Oliver Palmer
Davide Donadio
Photochemical reactions of contaminants in snow and ice can be important sinks for organic and inorganic compounds deposited onto snow from the atmosphere and sources for photoproducts released from snowpacks into the atmosphere. Snow contaminants can be found in the bulk ice matrix, in internal liquid-like regions (LLRs), or in quasi-liquid layers (QLLs) at the air–ice interface, where they can readily exchange with the firn air. Some studies have reported that direct photochemical reactions occur faster in LLRs and QLLs than in aqueous solution, while others have found similar rates. Here, we measure the photodegradation rate constants for loss of the three dimethoxybenzene isomers under varying experimental conditions, including in aqueous solution, in LLRs, and at the air–ice interface of nature-identical snow. Relative to aqueous solution, we find modest photodegradation enhancements (3- and 6-fold) in LLRs for two of the isomers and larger enhancements (15- to 30-fold) at the air–ice interface for all three isomers. We use computational modeling to assess the impact of light absorbance changes on photodegradation rate enhancements at the interface. We find small (2–5 nm) bathochromic (red) absorbance shifts at the interface relative to in solution, which increases light absorption, but this factor only accounts for less than 50 % of the measured rate constant enhancements. The major factor responsible for photodegradation rate enhancements at the air–ice interface appears to be more efficient photodecay: estimated dimethoxybenzene quantum yields are 6- to 24-fold larger at the interface compared to in aqueous solution and account for the majority (51 %–96 %) of the observed enhancements. Using a hypothetical model compound with an assumed Gaussian-shaped absorbance peak, we find that a shift in the peak to higher or lower wavelengths can have a minor to substantial impact on photodecay rate constants, depending on the original location of the peak and the magnitude of the shift. Changes in other peak properties at the air–ice interface, such as peak width and height (i.e., molar absorption coefficient), can also impact rates of light absorption and direct photodecay. Our results suggest our current understanding of photodegradation processes underestimates the rate at which some compounds are broken down, as well as the release of photoproducts into the atmosphere.
- Article
(2189 KB) - Full-text XML
-
Supplement
(8265 KB) - BibTeX
- EndNote


Snow and ice contain a wide variety of chemical compounds (Grannas et al., 2006), which can be transformed via photochemical reactions (Bartels-Rausch et al., 2014; Domine and Shepson, 2002; Grannas et al., 2007). While snow and ice are comprised primarily of crystalline water ice, under environmental conditions there are also small areas of disordered water molecules that contain most of the solutes present in a snowpack (Barret et al., 2011; Bartels-Rausch et al., 2014, 2017; Grannas et al., 2007; Jacobi et al., 2004). Although the terminology used in the literature can vary, at the air–ice interface these regions are commonly called quasi-liquid layers (QLLs), while those located at ice grain boundaries and other locations within the ice matrix are referred to as liquid-like regions (LLRs). Photochemistry can be important in snowpacks (Grannas et al., 2007), as light can penetrate tens of centimeters below the snow surface (France et al., 2011; Galbavy et al., 2007; Phillips and Simpson, 2005), and chemical species can exchange with the firn air in the snowpack. Photochemical reactions are classified as either direct – where a compound absorbs sunlight and is transformed – or indirect – where a reactive species (e.g., hydroxyl radical) formed from a direct photoreaction reacts with the compound of interest.
Despite their importance, only a small number of direct photochemical reactions have been studied in/on ice, with variable and occasionally conflicting findings. Measurements of direct photodegradation rates for a number of inorganic solutes (e.g., nitrate, nitrite, and hydrogen peroxide) found the same temperature dependence in aqueous solution and LLRs, suggesting both compartments provide similar environments for chemical reactions (Chu and Anastasio, 2003, 2005, 2007). The picture is more complicated for PAHs (polycyclic aromatic hydrocarbons). Two studies found little difference in PAH photochemistry in/on ice compared to solution: phenanthrene, pyrene, and fluoranthene had similar photodegradation rates in aqueous solution and in LLRs (Ram and Anastasio, 2009), while anthracene and pyrene had similar rates in aqueous solution, in LLRs, and at the air–ice interface (QLLs) (Hullar et al., 2018). However, two other studies reported that the photodecay of anthracene and naphthalene was faster in LLRs and at the air–ice interface compared to in solution (Kahan and Donaldson, 2007; Kahan et al., 2010b). Harmine has also been reported to photodegrade faster at the air–ice interface (Kahan et al., 2010a). Most recently, we found that guaiacol photodegradation was somewhat faster in LLRs and considerably faster at the air–ice interface than in aqueous solution (Hullar et al., 2020).
To evaluate the possible causes of photodegradation enhancements in/on ice compared to solution, consider the variables that control the direct photodecay rate (M s−1) for a chemical C in a given reservoir (Chu and Anastasio, 2003):
where 2303 is a factor for units (1000 cm3 L−1) and for converting measurements from base 10 to base e, NA is Avogadro's number (6.022×10²³ molec. mol−1), Iλ is the actinic flux at each wavelength (photons cm−2 s−1 nm−1), Δλ is the wavelength interval between photon flux data points (nm), εC,λ is the molar absorption coefficient for C (M−1 cm−1), ΦC,λ is the quantum yield for loss of C (molecule per photon), and [C] is the concentration (M). Based on Eq. (1), three factors could increase reaction rates in/on ice relative to solution: higher local photon fluxes, a bathochromic (red) shift in molar absorption coefficient (εC,λ) towards longer wavelengths, which have greater photon fluxes, or larger quantum yields.
Many previous studies did not measure photon fluxes at the point of the reaction, so it is difficult to accurately determine the significance of local flux differences in accounting for photodecay enhancements in, or on, ice. However, measurements in different solute locations, e.g., in solution, in LLRs, and at the air–ice interface, found that photon fluxes varied by less than a factor of 1.5 (McFall and Anastasio, 2016). In addition, in our recent work with guaiacol we normalized photodecay rate constants for loss by photon flux but still saw large differences in rate constants between solution, in ice, and at the air–ice interface (Hullar et al., 2020). Thus local photon flux differences do not appear to a major factor in observed reaction rate enhancements in/on ice.
Because natural solar photon fluxes increase by several orders of magnitude between 295 and 400 nm (Madronich and Flocke, 1999), even a small shift in compound absorbance towards longer wavelengths (i.e., a red, or bathochromic, shift) could substantially increase the amount of sunlight absorbed by a compound, increasing its reaction rate. Several studies have measured absorbance shifts for compounds in LLRs and at the air–ice interface relative to solution (Corrochano et al., 2017; Heger et al., 2005; Heger and Klán, 2007; Kahan and Donaldson, 2010; Kania et al., 2014; Krausko et al., 2015; Malongwe et al., 2016; Matykiewiczová et al., 2007). The absorbance of some compounds was the same as in aqueous solution, with others showing shifts of up to 15 nm either to the red or blue (i.e., a hypsochromic shift); for several compounds concentrated in LLRs, shifts of up to 100 nm were reported (Heger and Klán, 2007). However, these large shifts were attributed to aggregated test compounds and resulting intermolecular interactions, rather than individual molecules. Unfortunately, measuring a compound's absorbance at the air–ice interface can be challenging, particularly when using low concentrations representative of environmental conditions. Accurate absorbance measurements typically require relatively high concentrations, which can lead to aggregation on the ice surface, potentially influencing the absorption characteristics. To avoid this problem, we recently used molecular modeling to estimate the absorbance shift for guaiacol at the air–ice interface (Bononi et al., 2020; Hullar et al., 2020). While we did find a slight bathochromic shift (5 nm), this shift explained less than 10 % of the enhanced reaction rates experimentally measured at the interface.
Finally, an increased quantum yield at the air–ice interface could explain a faster reaction rate, due to a greater fraction of absorbed photons resulting in photochemical reaction of the chemical. Some studies suggest LLRs and solution represent similar reaction environments (Chu and Anastasio, 2003, 2005, 2007; Ram and Anastasio, 2009), while others have found higher quantum yields at the air–ice interface (Hullar et al., 2020, 2018; Zhu et al., 2010). Our recent work with guaiacol (Hullar et al., 2020) found that changes in the quantum yield were the dominant contributor to reaction rate differences between aqueous solution, LLRs, and QLLs, with values up to 40-fold higher at the air–ice interface compared to solution.
Taken together, previous studies show the importance of determining various factors to understand the reasons for enhanced chemical reaction rates in snow and ice. In particular, our recent results (Hullar et al., 2020) indicate that the direct photodecay of guaiacol is different in aqueous solution, LLRs, and QLLs and demonstrate how molecular modeling can be used to assess the relative contributions of changes in light absorbance and quantum yield. Here, we extend those results to three additional organic compounds chosen as model aromatics in the environment: 1,2-,1,3-, and 1,4-dimethoxybenzene (abbreviated 1,2-DMOB, 1,3-DMOB, and 1,4-DMOB, respectively; chemical structures given in Fig. 1). DMOBs can be emitted into the atmosphere by biomass burning (Smith et al., 2020). Several studies have examined the direct photodegradation of DMOBs and methoxybenzene (anisole), but few have used wavelengths relevant to tropospheric sunlight. At wavelengths greater than 290 nm, 1,2- and 1,3-DMOB have been reported to photodegrade slowly, with 1,4-DMOB loss being somewhat faster (Amalric et al., 1993). 1,2-DMOB in acetonitrile forms a triplet excited state when illuminated with 418 or 514 nm radiation (Schurmann and Lehnig, 2000). Aqueous 1,4-DMOB excited at 266 nm forms a triplet excited state, which decays to a solvated electron and a relatively long-lived organic radical cation (Grabner et al., 1996, 1980). Another study (Tajima et al., 1999) with 266 nm excitation under acidic conditions (pH = 1.46) found electron transfer from the excited triplet state to a hydronium ion. Although 1,2-DMOB was reported to be photostable in aqueous solution when illuminated with 254 nm light (Wan and Wu, 1990), in aqueous sulfuric acid (pH < 2) all three isomers are photoprotonated in the singlet excited state. Illuminated 1,2-DMOB additionally can undergo an acid-catalyzed ipso substitution of the alkoxy group by water, but this was not observed with the other two isomers (Mosi et al., 1995; Pollard et al., 1993; Wan and Wu, 1990; Zhang et al., 1994).
Here, we measure the direct photochemical reaction rate constants for loss of the three DMOB isomers in aqueous solution, LLRs, and QLLs, normalizing each to the measured photon flux for a given sample type. To assess the contribution of absorbance shifts, we model DMOB absorbance in aqueous solution and on an ice surface. As with guaiacol, the DMOBs are all doubly substituted aromatic rings; however, the hydroxyl group of guaiacol is replaced by a methoxy group, eliminating the possible unwanted reaction with triplet excited states (3C∗). Further, the three isomers provide the opportunity to examine how structural differences can influence light absorption, quantum yields, and ultimately photochemical reactivity. To more broadly examine the importance of changes in light absorption on photodecay, we also quantify how changes in the absorbance peak location, maximum absorbance, and absorption peak shape affect photochemical reaction rate constants and lifetimes.
2.1 Materials
1,2-, 1,3-, and 1,4-DMOB (99 %, >98 %, and 99 % purity, respectively) were from Aldrich. Acetonitrile (HPLC grade) was from Acros. 2-Nitrobenzaldehyde (2NB, 98 %) was from Sigma-Aldrich. High-purity water (“MQ”) was from house-produced reverse osmosis water run through a Barnstead International DO813 activated carbon cartridge and a Millipore Milli-Q Advantage A10 system (≥18.2 MΩ cm).
2.2 Sample preparation
We placed samples in 10 mL glass beakers (Pyrex) and covered them with nylon film (McMaster-Carr, approximately 25 µm thick, secured in place with an O-ring) to reduce evaporation and contamination while allowing for sample illumination. We prepared samples using one of five different methods: (1) we made an aqueous solution sample by first dissolving the test compound in MQ water to give a final concentration of 1.0 µM and then placing 10 mL of solution in a beaker and covering it. (2) We prepared a freezer-frozen solution sample by first making an aqueous solution sample and then placing it in a laboratory freezer (−20 ∘C) for at least 3 h. (3) For a liquid nitrogen frozen solution sample, we began with an aqueous solution sample and then placed it in a pan filled to a depth of 2 cm with liquid nitrogen; sample freezing took approximately 90 s. (4) To make a vapor-deposited to the surface of ice sample, we placed 10 mL of MQ water in a beaker, covered it with film, and froze it in a laboratory freezer. We removed and uncovered the frozen water sample and directed a nitrogen stream containing gas-phase dimethoxybenzene at the ice surface for 15 or 30 s. We then recovered the sample and placed it back in a laboratory freezer. (5) To prepare the vapor-deposited to nature-identical snow sample type, we first passed nitrogen from a tank in the cold room through 500 mL of laboratory-made snow (to condition the nitrogen stream with water vapor), then through a glass container holding 0.4 g of DMOB, and then through a 500 or 1000 mL HDPE bottle holding the snow to be illuminated. 1,2-DMOB is a liquid at room temperature but a solid at −20 ∘C, while 1,3-DMOB is a liquid at both temperatures and 1,4-DMOB a solid; vapor pressures at 25 ∘C are 0.057, 0.030, and 0.021 kPa, respectively (USEPA, 2021). We then gently mixed the treated snow and transferred it to beakers, tamped it down 10 mm below the top edge of the beaker, and covered it with nylon film. Additional details for these sample preparation methods can be found in Sect. S2 in the Supplement and our previous works (Hullar et al., 2020, 2018).
2.3 Sample illumination, actinometry, and chemical analysis
Sample illumination followed the method described previously (Hullar et al., 2020). We set sample beakers upright in a drilled aluminum block set within a temperature-controlled chamber; dark samples were completely covered with aluminum foil and placed in the aluminum block next to the illuminated samples. The samples were held at 5 ∘C (for aqueous) or −10 ∘C (for ice and snow). The light source was a 1000 W Xenon arc lamp filtered with an AM1.5 air mass filter (Sciencetech) and a 295 nm longwave pass filter (Andover Corporation) to approximate polar sunlight and a 400 nm shortwave pass filter (Andover Corporation) to reduce sample heating.
After illumination, we melted the frozen samples and measured DMOB concentration using a Shimadzu HPLC (Hullar et al., 2018) with an eluent of 60 : 40 acetonitrile : MQ water, a flow rate of 0.70 mL min−1, and detection wavelengths of 274, 273, and 287 nm for 1,2-, 1,3-, and 1,4-DMOB, respectively.
To account for differing photon fluxes across samples types and experiment days, we used 2-nitrobenzaldehyde (2NB) as a chemical actinometer (Galbavy et al., 2010; Hullar et al., 2020, 2018). Except for snow samples, we prepared 10 µM 2NB actinometry samples on each experiment day using the same sample preparation and experiment treatment as the test compound illuminations, although the illumination times were shorter. For snow samples, daily j2NB was determined by measuring j2NB in aqueous solution and correcting by a previously determined ratio (), as described in earlier work (Hullar et al., 2020).
We used the Tropospheric Ultraviolet and Visible (TUV) model (Madronich and Flocke, 1999) to model spectral actinic fluxes for Summit, Greenland, at noon on the summer solstice (subsequently referred to as “Summit conditions”). We used default settings (option 1) except for wavelength interval = 0.1 nm, latitude = 72.6∘, ground surface elevation = 3200 m, simulation elevation = 3200 m, total column ozone = 308 DU, surface albedo = 0.93, and four radiative transfer streams. Using methods described previously (Hullar et al., 2020), we calculated laboratory photon fluxes at 1 nm intervals from measured wavelength-dependent relative light intensities and our j2NB values and then interpolated those fluxes to 0.1 nm resolution.
2.4 Determining rate constants and quantum yields for DMOB loss
We determined DMOB photodegradation rate constants for loss using the same approach as for guaiacol and PAHs (Hullar et al., 2020, 2018). We illuminated samples with simulated polar sunlight, periodically removing a beaker (and corresponding dark beaker) for analysis. To determine the photodegradation rate constant for loss, we first calculated the natural logarithm of the ratio of the DMOB concentration at time t to the initial DMOB concentration and then adjusted these ratios by a correction factor (Table S1 in the Supplement) to account for differences in photon flux at each sample position (Hullar et al., 2020, 2018). The linear regression slope of illuminated samples gives the pseudo-first-order rate constant for loss during illumination, jDMOB; for dark controls, we get the rate constant for dark loss, . To calculate the net loss attributable to photodegradation, we subtracted from jDMOB to give the dark-corrected experimental photodegradation rate constant jDMOB,exp. We then normalized this value for the experimental photon flux by dividing jDMOB,exp by the daily measured j2NB value to give the photon-flux-normalized photodegradation rate constant for loss, . Full equations are given in our previous work (Hullar et al., 2020, 2018).
We calculated quantum yields for each DMOB using methods described previously (Hullar et al., 2020). In short, the quantum yield was estimated for each DMOB by dividing the dark-corrected experimental photodegradation rate constant (jDMOB,exp) by the measured aqueous molar absorption coefficient (εDMOB,λ) and the calculated photon flux in our experimental system. We determined aqueous solution molar absorption coefficients for each DMOB (εDMOB,λ, Table S2) by measuring absorbance spectra in five solutions (10–1000 µM) at 25 ∘C using a UV-2501PC spectrophotometer (Shimadzu) in 1.0 cm cuvettes against a MQ reference cell. The calculated quantum yields are an average value over the ranges of 250–317, 250–315, and 250–341 nm for 1,2-, 1,3-, and 1,4-DMOB, respectively. We chose the low end of this range because it represents a rough natural minimum of light absorbance for the three compounds and does not have any photon flux for either Summit conditions or in our experimental system; the upper cutoff varies for each compound and is the wavelength above which the molar absorption coefficient is less than M−1 cm−1. Based on light absorption spectra for the three compounds (discussed in the results section), the wavelengths driving photodegradation in our experiments are 270–300, 270–310, and 280–310 nm for 1,2-, 1,3-, and 1,4-DMOB, respectively. We estimated molar absorption coefficients at the air–ice interface by applying the results of the computational modeling to the measured aqueous molar absorption coefficients, as described in the results section below.
2.5 Computational methods
To investigate possible shifts in light absorbance at the air–ice interface for the three dimethoxybenzene isomers, we used a multimodel approach that combines classical and first-principles molecular dynamics (FPMD) simulations, excited state calculations using time-dependent density functional theory (TDDFT), and machine learning (ML) (Bononi et al., 2020; Tibshirani, 2011).
As in our recent work on phenol and guaiacol, models of DMOB in aqueous solutions and at the ice surface were equilibrated in classical MD simulations using the LAMMPS code (Plimpton, 1995), the OPLS force field, and the TIP4P/ice water model (Abascal et al., 2005). To model the air–ice interface we utilized an ice slab model, which captures a well-equilibrated surface structure and reproduces recent measurements for QLLs (Kling et al., 2018; Sanchez et al., 2017). We then performed FPMD simulations of the DMOB isomers in solution at 27 ∘C and at the air–ice interface at −10 ∘C. Density functional theory (DFT)-based FPMD simulations were run using the Perdew–Burke–Ernzerhof exchange and correlation functional with D3 van der Waals corrections, a double-Z valence polarizable basis set for valence states and norm-conserving pseudopotentials for the core states and the nuclei, as implemented in the CP2K code (Grimme et al., 2010; Hartwigsen et al., 1998; Perdew et al., 1996; VandeVondele et al., 2005). For each 50 ps FPMD simulation trajectory, we extracted approximately 200 statistically independent frames, replaced the explicit water molecules with the self-consistent continuum solvation scheme (Timrov et al., 2015), and finally computed absorption spectra for each frame using TDDFT as implemented in the Quantum ESPRESSO package (Casida et al., 2009; Giannozzi et al., 2017; Rocca et al., 2008) with the Environ patch to account for the solvent embedding (Andreussi and Fisicaro, 2019). To account for the configurational sampling at finite temperature in the specific solvation environment, we computed the final spectra by ensemble averaging the 200 single frame calculations for each isomer (Ge et al., 2015; Timrov et al., 2016).
As a refinement to our former approach, we developed a universal ML model to predict the absorption spectra for all three DMOB isomers. To accomplish the transferability, we adopted a more sophisticated atomic descriptor – the bispectrum component (BC) (Bartok et al., 2013; Thompson et al., 2015). The BC describes each molecule's atomic environment by projecting the weighted atomic densities to four-dimensional hyperspherical harmonics, and it has been previously applied to ML interatomic potential development and material property predictions (Cusentino et al., 2020; Legrain et al., 2017). By using the BC with the least absolute shrinkage and selection operator (LASSO) regression model (Tibshirani, 2011), we attain a more precise estimate of the low-energy, long-wavelength tails of the spectra, which are important for calculating rates of photon absorption since the photon flux is increasing in this region. To assess the relative contributions of the phenyl ring and methoxy groups to the light absorbance of each DMOB isomer, we decomposed the predicted peak wavelength from over ∼5000 frames of each FPMD trajectory, with λ0≈586 nm fitted as the intercept of the ML model. Further details about the simulation procedures and parameters to compute the BC and analysis of excitation energy predictions from the LASSO model are available in Sect. S1.
3.1 DMOB photodegradation for each sample preparation method
We prepared samples using one of several methods designed to place the DMOB isomer into aqueous solution, LLRs, or at the air–ice interface (Sect. 2.2 and 2.3). Then, we illuminated the samples, periodically removing them for analysis. Figures S1 through S12 in the Supplement show the results for every illumination experiment, with each data point representing one sample beaker. Generally, dark controls show slight loss of DMOB, probably attributable to volatilization; illuminated samples often show considerably greater loss due to photodegradation, but the extent of loss depends on DMOB isomer and sample preparation method. Figure 1 summarizes the experimental results for each of the three DMOBs in aqueous solution and the various frozen sample preparations. As described above, we divided each dark-corrected, measured rate constant for DMOB loss by the corresponding measured j2NB value to compensate for the different photon fluxes in each experiment and then calculated the average photon-flux-normalized rate constant () for each sample treatment; error bars in Fig. 1 are the 95 % confidence interval of mean values.
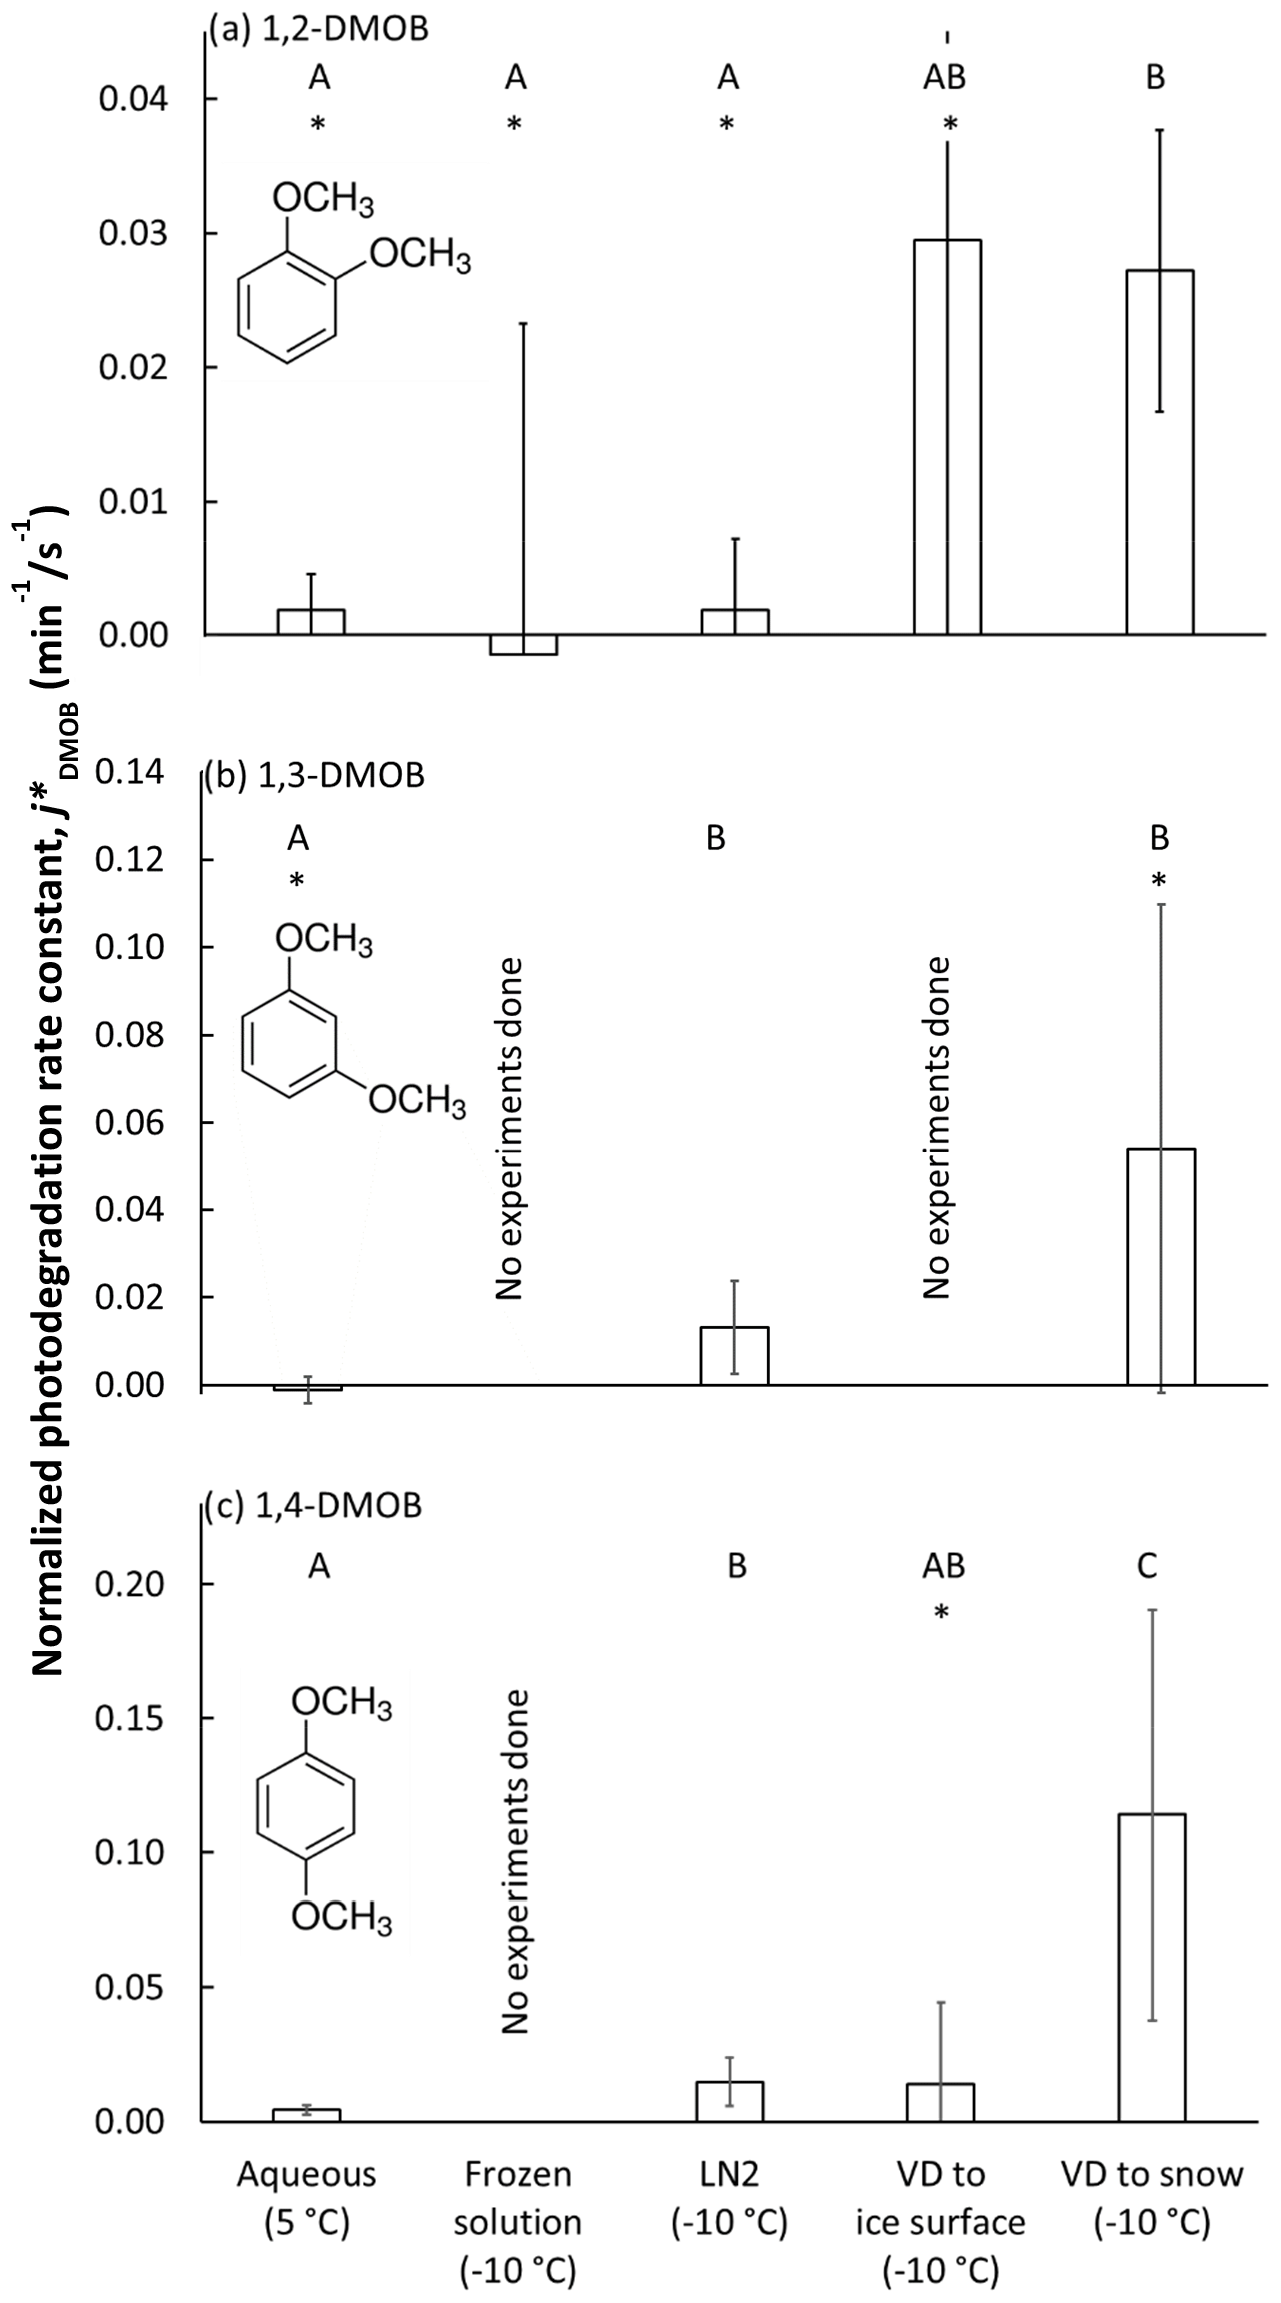
Figure 1Photon-flux-normalized photodegradation rate constants for loss for each dimethoxybenzene isomer () under five experimental conditions: (i) aqueous solution, (ii) solution frozen in a laboratory freezer (“frozen solution”), (iii) solution frozen in liquid nitrogen (“LN2”), (iv) vapor-deposited DMOB to a water ice surface (“VD to ice surface”), and (v) vapor-deposited DMOB to nature-identical snow (“VD to snow”). We illuminated samples at 5 ∘C (aqueous samples) or −10 ∘C (all others). Bars indicate the mean value for each sample preparation method (n = 3–8), with error bars as 95 % upper and lower confidence limits of the mean (UCL and LCL). For each isomer, sample types with statistically indistinguishable average rate constants as determined by a Tukey–Kramer test (P<0.05) are labeled with the same capital letter (“A”, “B”, or “C”); sample types with different letters have statistically different means. For example, “AB” indicates that the average rate constant for VD to ice surface is statistically indistinguishable from results labeled A or B. An asterisk (“∗”) indicates the average rate constant is indistinguishable from zero.
As shown in Fig. 1a, the 1,2-DMOB photodegradation rate in aqueous solution is slow, and the normalized rate constant for loss is statistically indistinguishable from zero. For frozen solution experiments, the average rate constant was negative, and the data were quite noisy. Samples frozen with liquid nitrogen (“LN2”) should, like freezer-frozen samples, place solutes primarily in internal LLRs. However, the variability in 1,2-DMOB LN2 experiments is considerably less than for freezer-frozen experiments, and the rate constant is roughly equivalent to that determined for aqueous solution. Previous work (Hullar and Anastasio, 2016) suggests more homogeneous solute distribution in LN2 samples compared to frozen solution samples, which may explain the reduced experimental variability in LN2 samples. The reduced variability might also be due to the fact that freezing in LN2 is fast (less than 90 s), which reduces the time available for the DMOB to react as solutes concentrate during freezing; in contrast, the freezer requires much more time (typically several hours) to make ice, which can lead to more, and more variable, DMOB loss. For both frozen solution and LN2 treatments, the rate constants are indistinguishable from zero. The two treatment methods which put 1,2-DMOB at the air–ice interface, VD to ice and VD to snow, both show normalized rate constants for loss approximately 15 times faster than in aqueous solution or in LLRs. However, while experimental results for the VD-to-ice treatment are highly variable (with an average rate constant indistinguishable from zero), VD-to-snow experiments are more reproducible and give a normalized rate constant statistically greater than zero, showing the advantage of using nature-identical snow to study photodegradation at the air–ice interface. As discussed previously (Hullar et al., 2020), the specific surface area (SSA) for our VD-to-snow samples (approximately 600 cm2 cm−3) is much higher than in VD-to-ice samples (0.3 cm2 cm−3). This should reduce DMOB aggregation and allow chemicals to deposit more evenly, potentially explaining the better experimental results from the VD-to-snow samples. For our range of measured aqueous concentrations in melted VD-to-ice samples, we estimate the DMOB surface coverage at 1.7–110 monolayers. For the VD-to-snow samples, DMOB surface coverage is 0.00036 to 0.047 monolayers, suggesting compounds are widely dispersed and less likely to aggregate. However, we cannot rule out the possibility that some of our vapor-deposited test compound is present as aggregated areas of concentrated or pure compound at the snow or ice surface.
1,3-DMOB results are summarized in Fig. 1b. Because the frozen solution and VD-to-ice experiments were very noisy for 1,2-DMOB, we did not run experiments with these sample treatments for 1,3-DMOB. For aqueous solution, the 1,3-DMOB average rate constant for loss is slightly negative and indistinguishable from zero. In LLRs (LN2 sample treatment), 1,3-DMOB photodegrades at a moderate rate, statistically greater than zero. Finally, at the air–ice interface (VD-to-snow samples), the photodegradation rate constant is approximately 4 times faster than in LLRs although statistically indistinguishable from zero because of very high variability.
For 1,4-DMOB in aqueous solution (Fig. 1c), the average photodegradation rate is slow but statistically greater than zero. As with 1,3-DMOB, we did not run experiments in frozen solution for 1,4-DMOB; however, LN2 experiments, which should also place solutes primarily in LLRs, showed photodecay rates both statistically greater than zero and approximately 3-fold faster than in aqueous solution. Measured VD-to-ice rates were variable, and although the average normalized rate constant for loss was similar to LN2, it was not statistically different than zero. As with 1,2-DMOB, the average 1,4-DMOB photodegradation rate constant at the air–ice interface (VD-to-snow experiments) is considerably faster than in either aqueous or LLR compartments, with a 26-fold enhancement relative to aqueous solution, and is statistically greater than zero.
To determine if the various sample treatment rate constants are statistically different from each other, we used the Tukey–Kramer test for multiple comparisons (P<0.05) to generate statistical groupings, identified by the letters A, B, and C in Fig. 1a–c. For 1,2-DMOB, mean rate constants for loss () for aqueous, frozen solution, and LN2 samples were indistinguishable from each other. However, VD to snow gave a rate constant significantly greater than these three sample types. Because of its high experimental variability, VD to ice could not be distinguished from any of the other sample treatments. For 1,3-DMOB, aqueous samples were statistically different than both LN2 and VD-to-snow samples. However, LN2 and VD-to-snow samples could not be distinguished from each other. For 1,4-DMOB, VD-to-snow samples were statistically higher than every other sample type. VD-to-ice samples were indistinguishable from both aqueous and LN2 samples, although LN2 samples were statistically different, and higher, than the aqueous samples.
Table 1 presents the rate constant enhancements for each frozen sample type relative to aqueous solution; Table S3 provides details for the various measured and computed experimental parameters. For 1,2-DMOB, photodegradation proceeds at approximately the same rate in LLRs and aqueous solution but roughly 15-fold (±9.5, 1σ) faster at the air–ice interface. Because the average aqueous rate constant for 1,3-DMOB was negative, we calculated an upper bound estimate (average + 95 % UCL of the mean) for the rate constant and determined enhancements relative to that value. Compared to the aqueous rate constant for loss, we estimate the 1,3-DMOB rate constant in LLRs to be at least 6.9-fold faster and at least 29-fold faster at the air–ice interface. Finally, for 1,4-DMOB, enhancement in LLRs is 3.4-fold (±2.4) and 26-fold (±27) at the air–ice interface. As noted in previous work (Hullar et al., 2020), vapor depositing a test compound to nature-identical snow rather than to an ice pellet surface is more representative of environmental conditions and gives more reliable experimental results, probably due to the much greater SSA of the snow. Although the experimental data show considerable variability, our results suggest DMOB photodegradation rate constants for loss are somewhat faster in LLRs than in corresponding aqueous solution and considerably faster at the air–ice interface; this finding is similar to previously reported results with guaiacol (Hullar et al., 2020) and several other organic compounds (Kahan and Donaldson, 2007; Kahan et al., 2010a, b). Taken together with earlier work, our results here suggest that at least for some compounds, aqueous solution, LLRs, and the air–ice interface can be different environments for photochemical reactivity.
Table 1Summary statistics for each experimental preparation methoda.
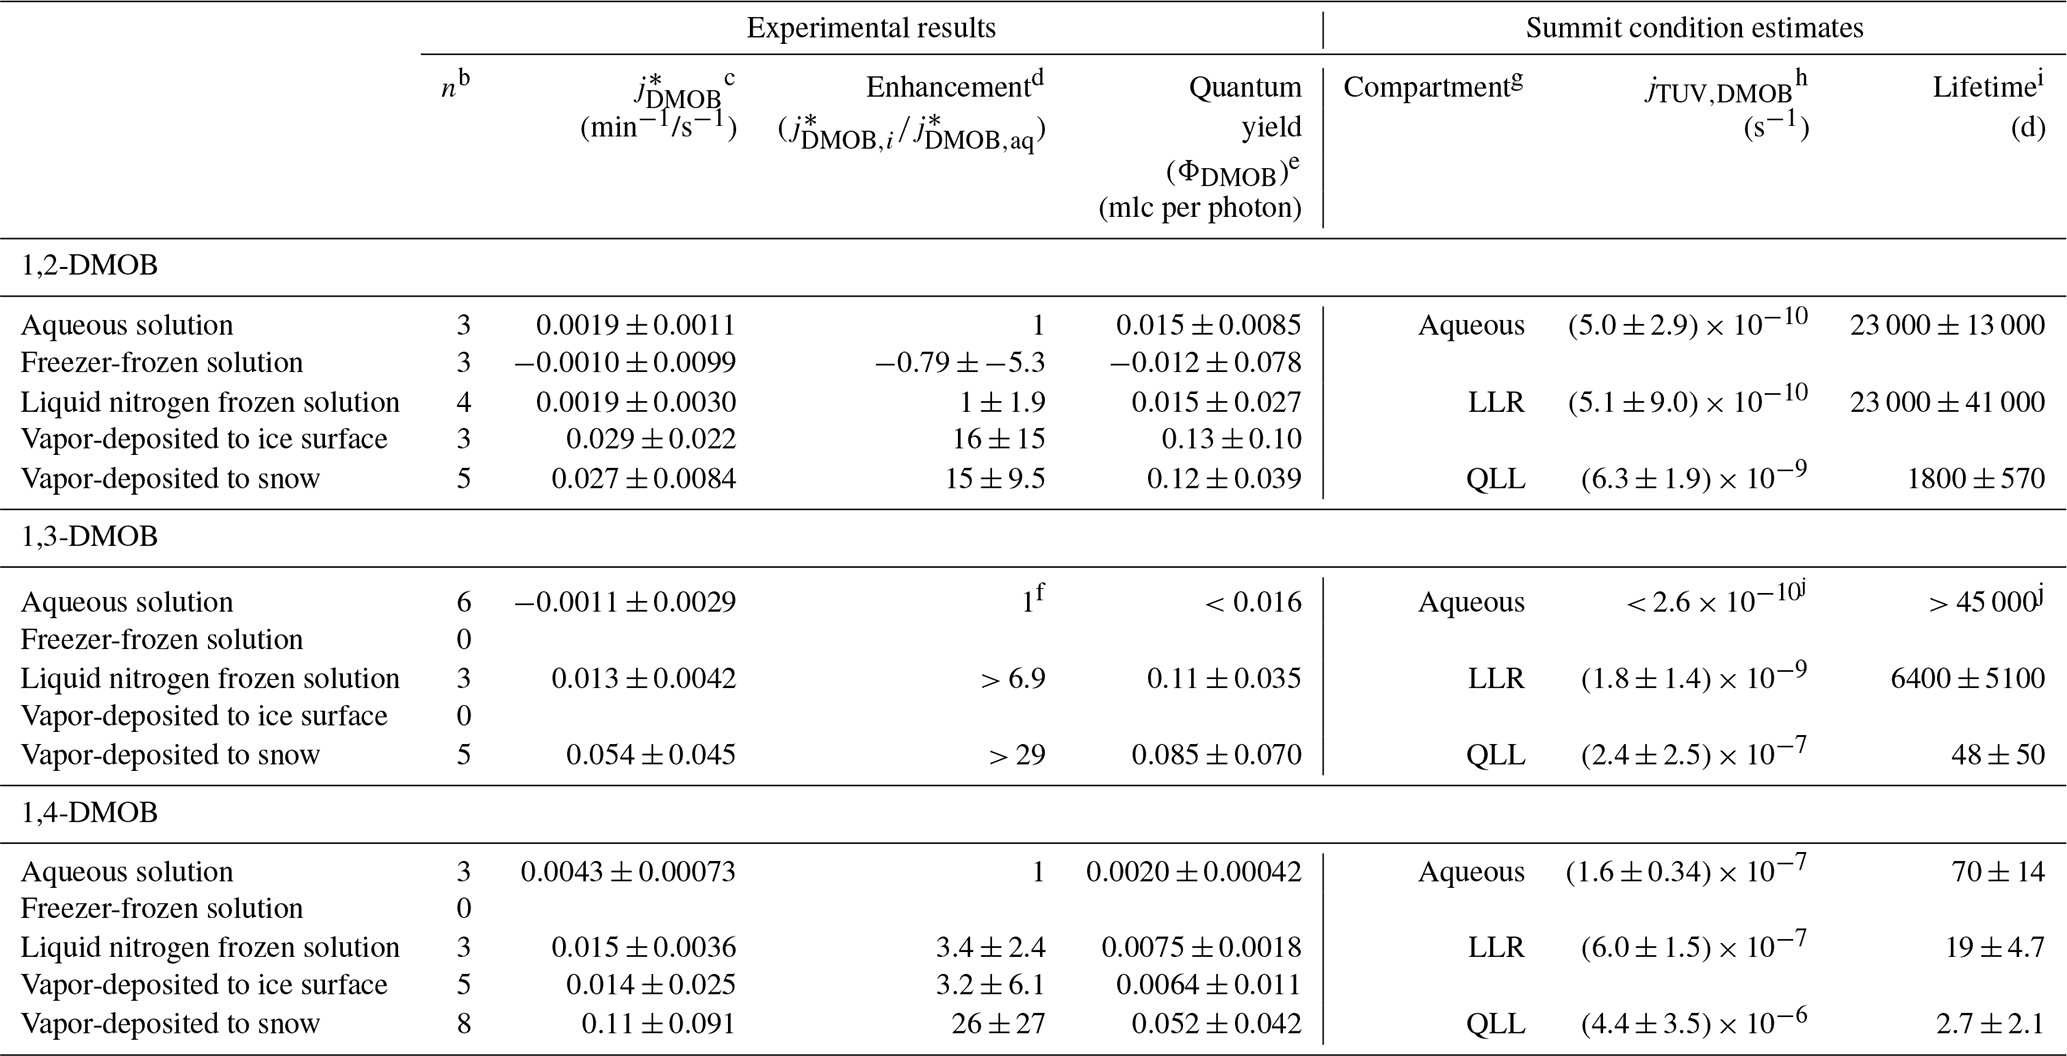
a Samples were held at 5 ∘C (aqueous samples) or −10 ∘C (all other preparations). b Number of experiments. c Listed values (photon-flux-normalized photodegradation rate constants for loss) are means ± 1 standard deviation. d Enhancement factors are the ratio of the mean value for each preparation method to the mean aqueous value for that light condition, ± the propagated standard deviation. e Quantum yields are calculated individually for each experiment using the measured jDMOB,exp and j2NB. Uncertainties for quantum yields are ± 1 standard deviation. f To calculate enhancement factors, we first estimated the upper bound value for aqueous solution as the mean + the 95 % UCL, 0.00190 min−1/s−1. Then, we calculated enhancement factors relative to this value. g For purposes of calculating and photochemical lifetimes, quantum yields in aqueous, LLR, and QLL compartments were assumed to be represented by aqueous solution, liquid nitrogen frozen solution, and vapor-deposited to snow sample types respectively. h Listed values (calculated photodegradation rate constants for Summit, Greenland) are means ± 1 propagated standard deviation. i Photochemical lifetimes are values ± 1 propagated standard deviation. j and photochemical lifetime calculated from upper bound estimate of 1,3-DMOB quantum yield.
3.2 DMOB light absorbance, quantum yields, and environmental lifetimes in solution and at the air–ice interface
Figure 2 presents the wavelength-dependent molar absorption coefficients for 1,2-, 1,3-, and 1,4-DMOB, as well as guaiacol (which was studied in our previous work; Hullar et al., 2020). 1,2- and 1,3-DMOB in solution have nearly identical absorbance curves, with maximum absorbance at 274 and 273 nm, respectively. While guaiacol absorbs less strongly, its curve shape and peak location are similar to 1,2- and 1,3-DMOB. In contrast, 1,4-DMOB absorbs at longer wavelengths, with a peak absorbance at 287 nm. For comparison, the two black lines in Fig. 2 show the photon flux of our experimental system (dashed line) and the modeled actinic flux for Summit conditions (solid line); a more detailed graph is shown in Fig. S13. While the actinic flux at Summit starts at approximately 297 nm and increases quickly with increasing wavelength, the experimental flux begins earlier (roughly 280 nm) and increases more gradually. 1,2- and 1,3-DMOB in solution absorb small amounts of light under our illumination conditions and virtually none in the Arctic environment. In contrast, the 1,4-DMOB absorbance curve has substantial overlap with both photon flux curves and therefore absorbs light under both experimental and natural conditions.

Figure 2Light absorption spectra for the dimethoxybenzene (DMOB) isomers and guaiacol, along with photon fluxes in our experiments and for Arctic summer conditions. Solid colored lines are the measured molar absorption coefficients for each DMOB isomer, while dashed colored lines are predicted absorbance spectra at the air–ice interface, estimated using the results of our molecular modeling. The solution guaiacol spectrum (dotted grey line) is provided for comparison to previous work (Hullar et al., 2020). Black lines (right axis) represent the modeled actinic flux for Summit conditions (solid line) and the photon flux measured in our laboratory illumination system (dashed line).
While we can measure light absorption by the DMOB isomers in solution, we also want to understand their absorption at the air–ice interface. To estimate this, we use molecular modeling combined with machine learning for each compound in aqueous solution and at the air–ice interface; these modeled curves are shown in Fig. 3. As shown in Fig. S14, modeled absorbance bands for aqueous DMOBs peak at longer wavelengths (7 to 21 nm) compared to measurements, equal to or greater than the 7 nm difference we observed for guaiacol (Bononi et al., 2020; Hullar et al., 2020). These differences are caused by systematic underestimation in our simulations, which is a known limitation of TDDFT calculations; the peak wavelength offset relative to measured spectra tends to increase with larger molecules (Leang et al., 2012; Miura et al., 2007), consistent with the greater difference here for the DMOB isomers compared to our previous work with guaiacol. These differences can be corrected by applying the same shifts to both solution and ice spectra (Ge et al., 2015).
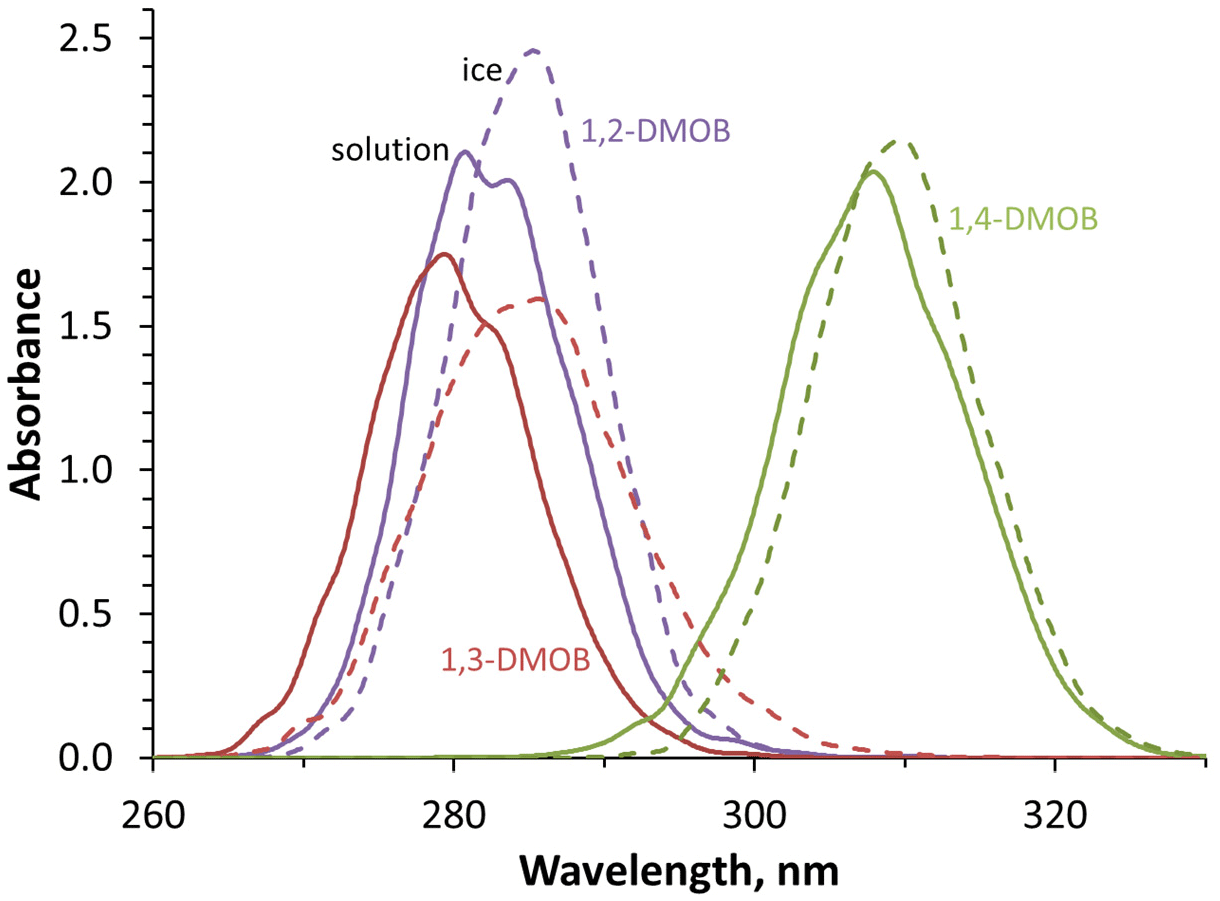
Figure 3Modeled absorbance spectra in aqueous solution (solid lines) and at the air–ice interface (dashed lines) for each DMOB isomer. Absolute absorbance values are arbitrary but accurately reflect the relative absorbance differences between isomers and conditions. Temperatures were 27 ∘C for aqueous solution and −10 ∘C at the air–ice interface.
While the modeling does not accurately reproduce the absolute wavelengths of absorbance, it provides useful insights into the differences between absorbance in aqueous solution and at the air–ice interface. We note that a similar modeling approach comparing phenol absorbance in gas and aqueous phases successfully predicted the experimentally observed ∼ 9 nm solvatochromic peak shift, as well as accurately reproducing the aqueous absorbance curve shape (Bononi et al., 2020). To predict the absorbance spectrum for each DMOB at the air–ice interface, we first examine how the model predicts the absorbance changes from aqueous to air–ice interface, then apply this change to the measured aqueous spectrum. We quantify how absorbance for a given DMOB changes from aqueous to ice using three characteristics – peak location, maximum peak height, and the full width of the peak at half maximum height (FWHM). In terms of the first characteristic, all three compounds showed a bathochromic (red) shift at the air–ice interface relative to aqueous solution; shifts were 2.4, 5.2, and 1.6 nm for 1,2-, 1,3-, and 1,4-DMOB, respectively. These results are consistent with a 5 nm red shift modeled for guaiacol (Hullar et al., 2020) and previous observations of anisole showing a 4 nm red shift at the air–ice interface (Malongwe et al., 2016) but less than the 10–15 nm red shifts observed for three aniline derivatives (Corrochano et al., 2017). For peak height, modeled absorbance peaks of 1,2- and 1,4-DMOB were higher at the air–ice interface compared to in solution, by 17 % and 6 % respectively, while the 1,3-DMOB peak height on ice was 91 % of the modeled aqueous value. In terms of peak width, 1,2- and 1,4-DMOB had narrower peaks on ice, 94 % and 92 % of the aqueous FWHM, respectively, while 1,3-DMOB had a 27 % wider peak on ice. Using this information, we applied the modeled peak shifts, peak height changes, and FWHM differences to the measured aqueous absorbance spectrum for each compound. This results in predicted absorbance spectra at the air–ice interface for each DMOB isomer, which are shown in Fig. 2 (dashed colored lines) and in Fig. S14.
We also used the molecular model results to assess the relative contributions of the phenyl ring and methoxy groups to the light absorbance of each DMOB. As indicated in Fig. S15, small geometrical changes in the phenyl ring are primarily responsible for the shifts in the absorption spectra for all three DMOB isomers, while the methoxy groups make a minor contribution. Changes in the geometry of the phenyl ring are responsible for 95 %–98 % of the light absorbance shifts in aqueous solution and 96 %–98 % at the air–ice interface. These findings are consistent with our previous work on guaiacol (Bononi et al., 2020; Hullar et al., 2020). Overall, these results suggest that differences in the atomic environments around the aromatic ring modify its geometry and determine their vertical excitation and are the primary factor controlling light absorption changes between aqueous solution and the air–ice interface.
As seen in Fig. 2, the predicted spectrum for each isomer at the air–ice interface (dashed colored line) is noticeably different than the measured aqueous spectrum (solid colored line), with bathochromic peak shifts and changes in absorbance spectrum shape. To assess the impact of these changes on light absorbance, for each isomer we multiplied the aqueous and air–ice interface wavelength-specific molar absorption coefficients by the experimental or Summit photon fluxes to determine the rate constant for light absorbance at each wavelength (Fig. S16). For each DMOB isomer, the rate constant for light absorbance is a wavelength-specific value giving the rate at which photons are absorbed per molecule of test compound for a given light condition. We then summed the wavelength-specific values to obtain the overall rate constant for light absorbance in aqueous solution and at the air–ice interface for each isomer, for laboratory and Summit light conditions (Table S4). Because all three isomers show bathochromic absorbance shifts at the air–ice interface relative to aqueous solution, the overall rate constants for light absorption are generally higher at the air–ice interface. 1,3-DMOB, which has the largest absorbance spectrum bathochromic shift (5.2 nm), shows the largest change in overall light absorption, with a 5.3-fold increase relative to aqueous solution for experimental light conditions; for Summit actinic flux, the rate constant of light absorption increases by a factor of 170 from solution to air–ice interface. Conversely, the light absorption peak for 1,4-DMOB shifts only slightly from solution to ice and has a greater overlap with the photon flux curves in solution, so the rate of light absorption increases only slightly (10 % or less) from solution to the air–ice interface. These results show that the amount of light absorbed can be dramatically affected by absorbance changes and that this effect depends strongly on the position of the absorbance spectrum relative to photon fluxes and on the magnitude of the absorbance shift on ice. Comparing the overall light absorbed under laboratory versus Summit light conditions, 1,2-DMOB in either aqueous solution or at the air–ice interface absorbs around 200 times as much light in our lab system compared to Summit, while for 1,4-DMOB the light absorption is approximately equal in both systems. 1,3-DMOB presents a more complex picture: in aqueous solution, the rate constant of light absorption is about 400-fold greater under laboratory illumination compared to Summit light conditions, but at the air–ice interface, light absorption is only 12-fold greater in the lab relative to Summit conditions due to the absorbance shift on ice. For 1,2- and 1,3-DMOB, wavelengths from 275 to 295 and 295 to 315 nm are most photochemically important for lab and Summit light conditions, respectively; for 1,4-DMOB, these ranges are 280–315 and 300–320 nm.
Our observed increases in photochemical degradation rates at the air–ice interface can be caused by increases in light absorbance or quantum yield or a combination of both. As shown previously (Hullar et al., 2020), by solving Eq. (1) for quantum yield, we can use the calculated enhancements in the rate constant of light absorbance from our modeling results to estimate how quantum yields change from solution to the air–ice interface. Using the measured aqueous and predicted ice spectra for each compound, we calculated the quantum yields for each isomer under various conditions (Table 1). Our experimental results suggest LLRs may represent an environment different from either aqueous solution or QLLs. However, we did not model light absorbance changes in LLRs, and the available literature is inconclusive on the likelihood of absorbance shifts in LLRs, so for the quantum yield calculations we assumed our test compounds have the same molar absorption coefficients in LLRs as in aqueous solution.
For 1,2-DMOB, our quantum yield in aqueous solution calculated from our experimental results is 0.015 (±0.0085, 1σ). Because the experimental data are noisy, the calculated quantum yield for frozen solution is statistically indistinguishable from zero. LN2 samples had a similar quantum yield to aqueous solution, although again the quantum yield is indistinguishable from zero. In both VD-to-ice and VD-to-snow samples, where we would expect to find 1,2-DMOB at the air–ice interface, the quantum yields were approximately 8 times higher than in aqueous solution or LLRs and were the highest calculated for any isomer and sample type, e.g., 0.12±0.039 in the VD-to-snow samples. For 1,3-DMOB, the negative experimental reaction rate constant for loss in solution (Fig. 1b) precludes calculating a quantum yield; however, using the calculated confidence interval (Table 1) we can provide an upper bound estimate of 0.016. In both LN2 (LLR) and VD-to-snow (air–ice interface) sample types, the 1,3-DMOB-calculated quantum yields are similar and at least 5 times higher than in aqueous solution. For 1,4-DMOB, the estimated aqueous solution quantum yield of 0.0020 (±0.00042) is approximately 8-fold less than that of 1,2-DMOB; the quantum yield in LLRs is approximately 4 times higher than in aqueous solution. At the air–ice interface, the 1,4-DMOB quantum yield (0.052±0.042 mlc per photon) had the largest increase in quantum yield relative to aqueous solution of any of the isomers, approximately 26-fold. These results are in the same range as previous results showing 40- and 3-fold increases in air–ice interface calculated quantum yields for guaiacol and nitrate, respectively (Hullar et al., 2020; McFall et al., 2018).
Next, we evaluated the relative contributions of increased light absorbance and larger quantum yields to the photodegradation rate enhancements at the air–ice interface relative to solution. For 1,2- and 1,4-dimethoxybenzene, the faster photodegradation on ice is primarily due to an increase in quantum yield. In contrast, for 1,3-DMOB, the enhanced photodegradation at the air–ice interface is roughly equally due to increases in quantum yield and light absorbance. As in our earlier work with guaiacol (Hullar et al., 2020), light absorbance changes are never the dominant factor controlling rate constant enhancements. Increased light absorption accounts for 16 %, 49 % or less, and 4 % of the reactivity enhancement on snow relative to aqueous solution for 1,2-,1,3-, and 1,4-DMOB, respectively. Thus, higher quantum yields account for the bulk of the enhancement seen at the air–ice interface, accounting for 84 %, at least 51 %, and 96 % of the observed enhancements, respectively. These results are roughly consistent with our previous observations for guaiacol, where the quantum yield increased at the air–ice interface by a factor of 41, accounting for 95 % of the overall 77-fold increase in reactivity compared to aqueous solution (Hullar et al., 2020).
3.3 Estimated photodegradation rate constants for loss under environmental conditions and sensitivity to absorbance shifts
To assess the environmental significance of our findings, we calculated dimethoxybenzene photodegradation rate constants for loss and photochemical lifetimes in each compartment for Summit, Greenland, conditions (Table 1). For these calculations, we used modeled actinic fluxes at Summit (Sect. 2.3) and our estimated quantum yields (Sect. 3.2); because our computational modeling did not include LLRs, we used measured aqueous spectra to represent absorbance in both aqueous and LLR compartments and our predicted ice spectra (Fig. 2) for the air–ice interface. 1,2-DMOB has slow photodegradation rate constants and very long photochemical lifetimes (∼ 60 years) in solution and in LLRs. At the air–ice interface, it photodegrades 13 times faster, but the resulting lifetime is still long – approximately 1800 d of midday, summer solstice sunlight. Thus even with the rate constant enhancement at the interface, direct photochemical degradation is still apparently negligible. Similar to 1,2-DMOB, 1,3-DMOB has long lifetimes and slow degradation rate constants in the aqueous and LLR compartments (45 000 and 6400 d respectively; Table 1). However, because of its significant bathochromic absorbance shift (5.2 nm), the lifetime of 1,3-DMOB at the air–ice interface decreases to 48 d. This result suggests 1,3-DMOB persistence in the environment could change significantly if present at the air–ice interface instead of in LLRs or if its absorbance spectrum in LLRs shifts bathochromically as it does at the air–ice interface. For 1,4-DMOB, its absorption is already at longer wavelengths compared to the other two isomers, so it absorbs more light under environmental conditions and therefore can undergo faster photodegradation: lifetimes are 70, 19, and 2.7 d in aqueous solution, LLRs, and QLLs, respectively, under Summit conditions. These results show that the location of an impurity in a snowpack can strongly influence photochemical degradation rates. For compounds that absorb sunlight substantially in solution, direct photochemical reactions at the air–ice interface may be an important transformation process in snowpacks. However, quantifying this effect requires understanding of the portion of a compound at the air–ice interface, which is poorly known.
As discussed above, enhanced reactivity at the air–ice interface is primarily due to increases in the quantum yield, ranging from at least 5-fold (1,3-DMOB) to 41-fold (guaiacol) (Hullar et al., 2020). However, although we can predict absorbance shifts at the air–ice interface using molecular modeling techniques, we cannot currently predict quantum yield changes using either computational or experimental methods. While changes in quantum yields affect photodegradation rate constants linearly – a doubling of quantum yield will double the rate constant for loss – absorbance shifts cause nonlinear effects. To evaluate the impact of absorbance shifts on compound photodegradation, Fig. 4a shows the calculated ratios of absorbance-shifted rate constants to the unshifted rate constant. We estimated environmental (jTUV,DMOB) and lab photodegradation rate constants for each isomer using our calculated aqueous solution quantum yield, Summit or experimental photon fluxes, and our measured aqueous absorbance including bathochromic and hypsochromic shifts to simulate absorbance changes in/on ice. For our experimental photon flux, a 5 nm bathochromic shift (approximately equal to the largest shift modeled for the three DMOB isomers) changes the photodegradation rate constants for loss by factors of 3.1 and 2.1 for 1,2-DMOB and 1,4-DMOB respectively. A 10 nm shift, similar to that measured for several aniline derivatives (Corrochano et al., 2017), increases the photodegradation rate constants by factors of 7.8 and 4.2. Because 1,4-DMOB absorbs more strongly at longer wavelengths than 1,2-DMOB and therefore has greater initial overlap with the experimental photon flux (Fig. 2), shifts have a smaller impact than for 1,2-DMOB. For a 5 nm hypsochromic (blue) shift, 1,2-DMOB and 1,4-DMOB rate constants are reduced by factors of 0.24 and 0.46, respectively; for a 10 nm shift, the factors are 0.040 and 0.19. As with red shifts, 1,2-DMOB shows greater sensitivity to a blue shift than 1,4-DMOB does. With Summit actinic fluxes, we see a similar pattern but a greater sensitivity to shift (Fig. 4a) due to the faster increase in actinic flux with increasing wavelength for Summit compared to our experimental photon fluxes (Fig. 2). For 1,2-DMOB, a 10 nm red or blue shift changes the rate constants by factors of 90 or 0.0078, respectively, under Summit (TUV) photon fluxes. For 1,4-DMOB, the same shifts yield changes of 16- or 0.029-fold. 1,3-DMOB has a very similar absorbance spectrum to 1,2-DMOB and thus shows similar impacts of a shift in its absorbance spectrum (Fig. S17). Figure S18 compares guaiacol photodegradation rate constant changes estimated using TUV actinic flux and under three different experimental light source conditions from this and previous work (Hullar et al., 2020), showing how our experimental illumination system has been improved over time but still does not fully reproduce the solar spectrum of Summit conditions.
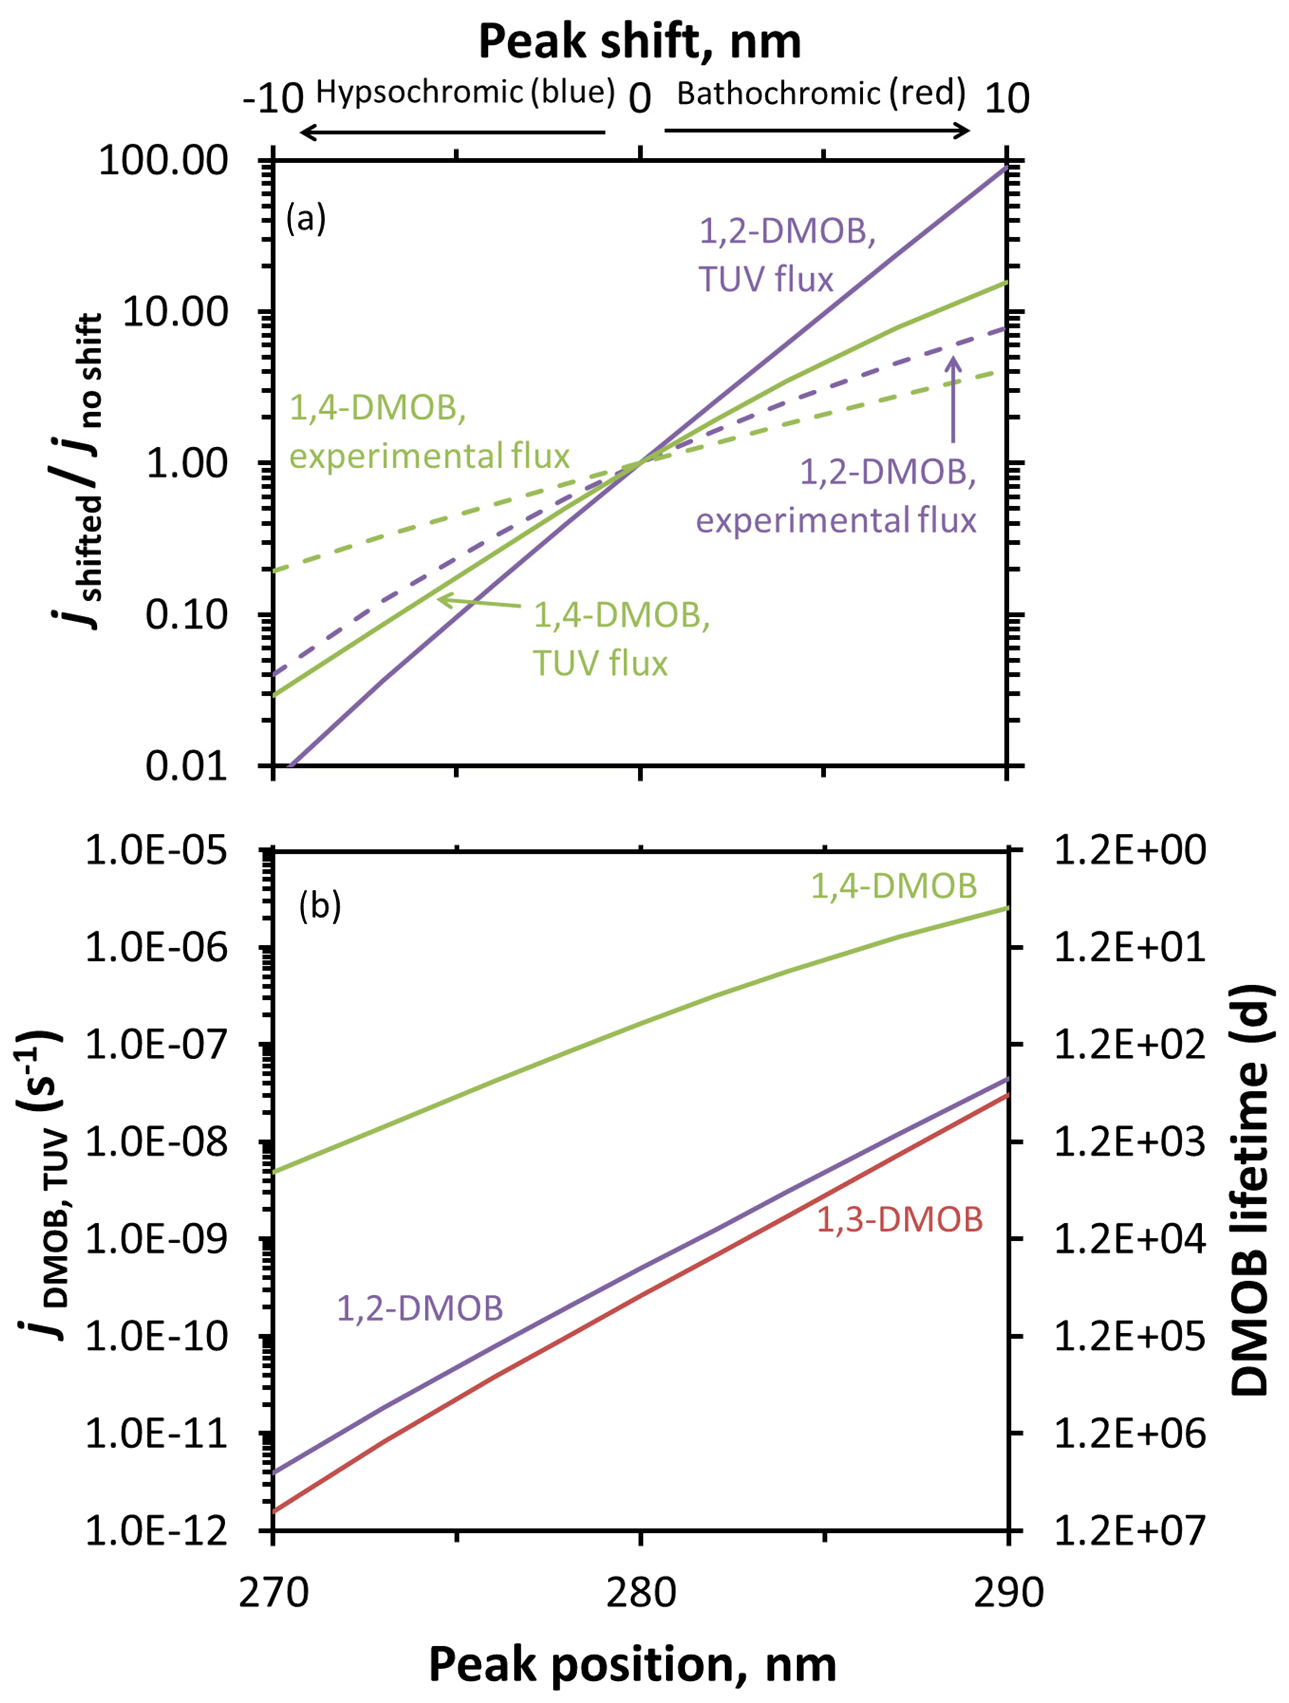
Figure 4Predicted changes to photodegradation rate constants for loss and lifetimes resulting from absorbance shifts for DMOB isomers. Rate constants for loss were determined using calculated aqueous quantum yields, aqueous absorbance spectra shifted either hypsochromically (towards shorter wavelengths) or bathochromically (towards longer wavelengths), and either experimental photon fluxes (dashed lines) or the modeled actinic flux for Summit conditions (solid lines). (a) Changes in absorbance-shifted photodegradation rate constants ( for experimental conditions, for TUV-modeled photon fluxes) relative to unshifted values for 1,2- and 1,4-DMOB in aqueous solution. (b) Estimated changes in direct photodegradation rate constant (jDMOB,TUV) and corresponding lifetime for each DMOB isomer under Summit conditions for various shifts in the light absorbance peak.
While the impact of a red shift in absorbance can be dramatic, this does not necessarily translate to a short lifetime. For example, a 10 nm red shift for 1,2-DMOB increases the rate constant for photodegradation by a factor of 90 (Fig. 4a), but this only reduces the lifetime from 23 000 to 260 d (Fig. 4b). 1,3-DMOB, which has essentially the same absorbance spectrum, behaves similarly (Figs. 4, 5, and S17). The behavior of 1,4-DMOB is different, however, since it overlaps the most with the solar spectrum (Fig. 2): while its rate constant for loss is less sensitive to a shift in absorbance (e.g., increasing by a factor of 16 for a 10 nm red shift), this changes the lifetime from 71 to 4.5 d (Fig. 4b), which is short enough to be significant for its environmental fate.
3.4 Sensitivity analysis of absorbance parameters on photodegradation rate constants for a hypothetical model compound
To generalize our experimental findings to other chemicals, we calculated photodegradation rate constants and lifetimes for a hypothetical model compound with an assumed Gaussian absorbance spectrum under Summit conditions and with a quantum yield of 1. We first made a single absorbance curve for a hypothetical model compound and then evaluated the impact of three variables: peak position, peak width, and peak height. We represented the model compound absorbance spectrum as a Gaussian curve with its peak at 280 nm, peak height (molar absorption coefficient) of 3000 M−1 cm−1, and a standard deviation (controlling peak width) of 7 nm. We derived these parameters by first fitting a Gaussian curve to each of the measured absorbance spectra for 1,2- and 1,4-DMOB (Fig. S19); because the right-hand (red side) of each absorbance spectrum determines the amount of light absorbed, we selected curves to fit this portion of the measured absorbance spectra. Finally, we averaged the parameters determined from the two Gaussian curves in Fig. S19 to give the absorption spectrum of the hypothetical compound.
We then evaluated the impacts of shifting the peak position widely, by ±20 nm, as illustrated in Fig. S20. As shown in Fig. 5a for Summit sunlight, the impact of a shift depends on the where it occurs, with the rate constant for photodegradation more sensitive at shorter wavelengths. For example, hypsochromically moving a peak from 280 to 260 nm decreases the rate constant by a factor of 320 000, while bathochromically moving the peak from 280 to 300 nm leads to a 920-fold increase in rate constant for loss. This difference is because the red shift moves the absorbance spectrum towards wavelengths where some light is already being absorbed. However, as discussed earlier, large increases in a rate constant do not necessarily translate to significant photochemistry: lifetimes for our hypothetical compound are 2 200 000, 6.7, and 0.0072 d when the peak is centered at 260, 280, and 300 nm, respectively (Fig. 5b). This sensitivity of shift impact to starting peak wavelength is shown even more clearly if we consider a wider wavelength range, as shown in Fig. S21. Once the compound absorbance begins to significantly overlap with the actinic flux curve, larger red shifts do not dramatically increase the amount of light absorbed, slowing the rate of jmax increase. If we assume our hypothetical compound experiences a 5 nm shift, the largest shift estimated by our calculations of the three DMOB isomers, the rate constant would decrease by a factor of 0.0075 for a blue shift and increase by 9.2-fold for a red shift.
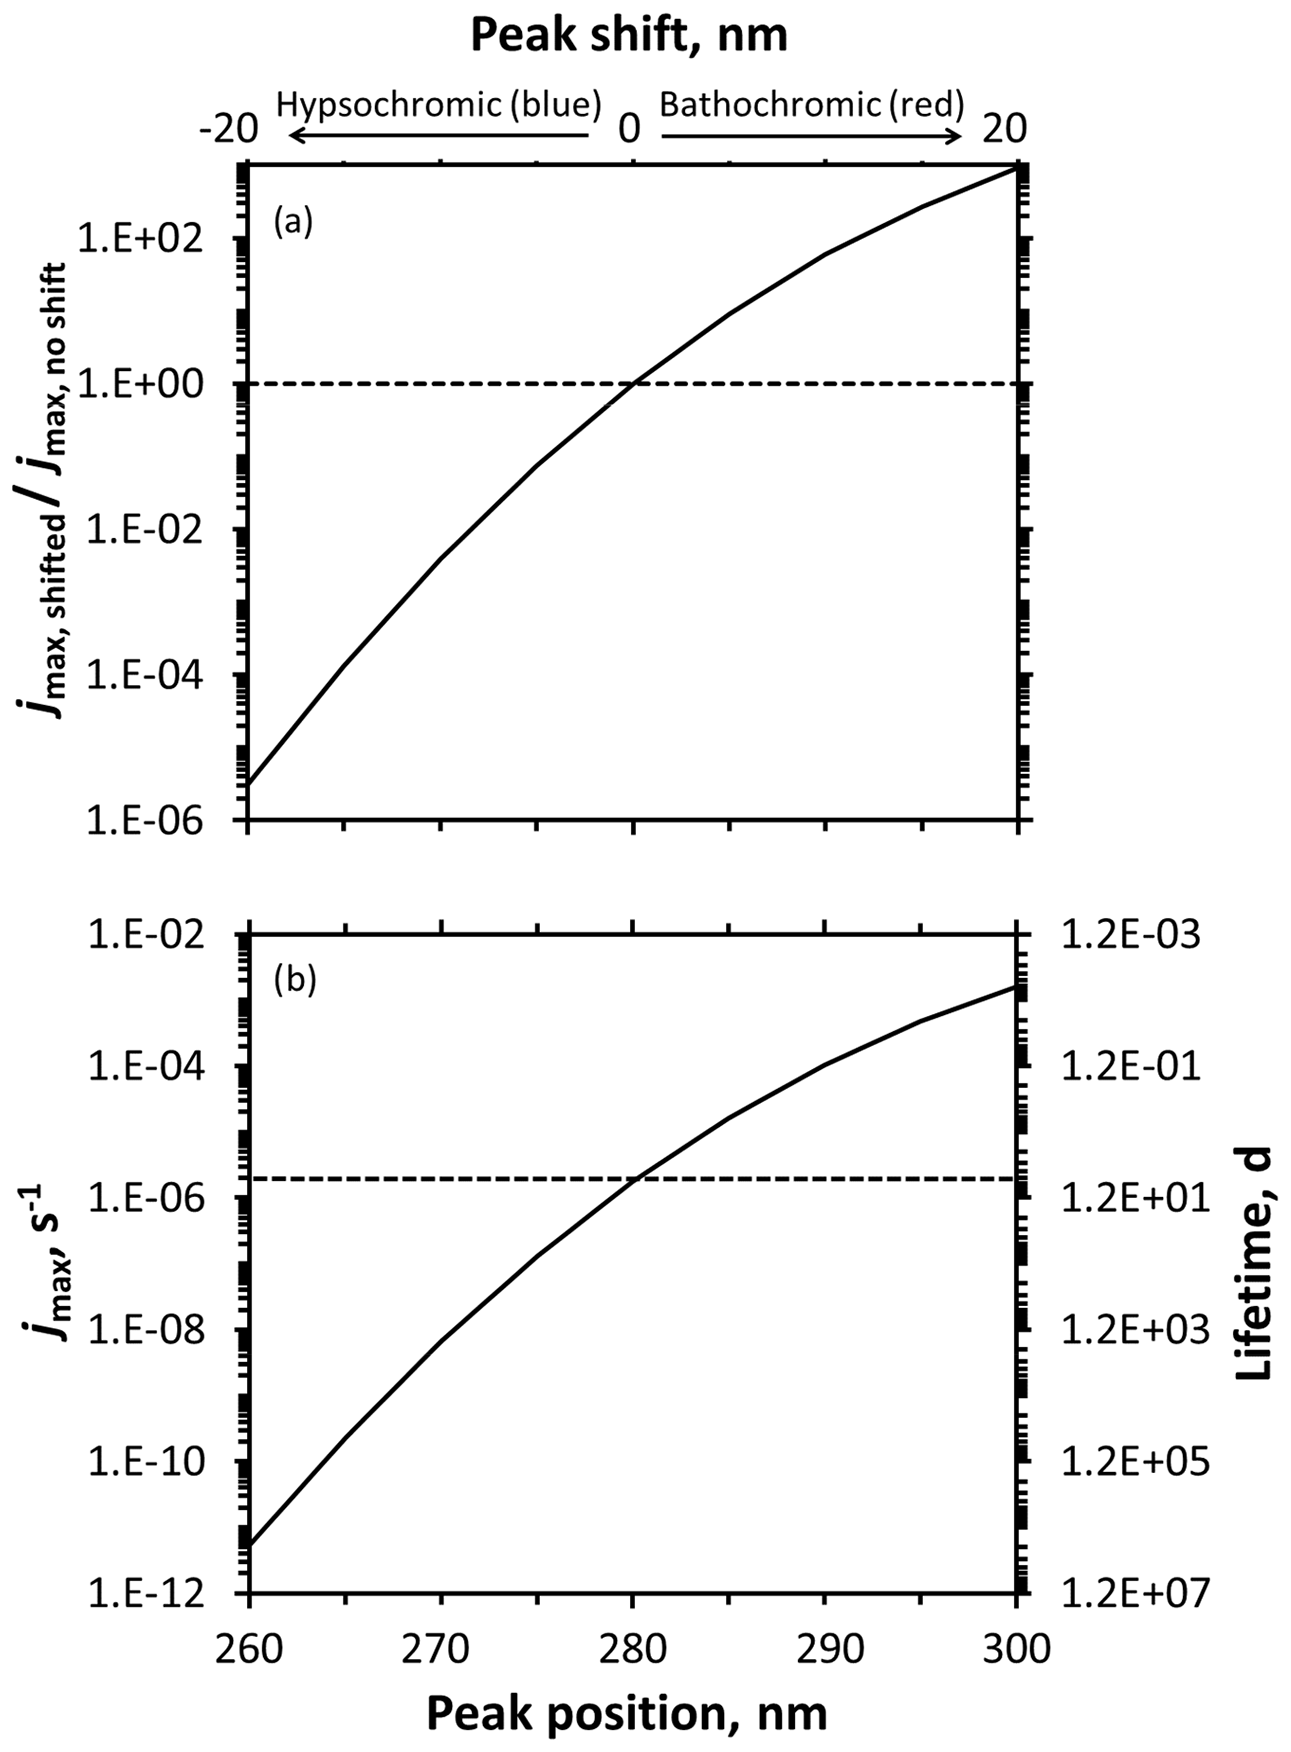
Figure 5Predicted changes to photodegradation rate constants for loss (jmax) and lifetimes resulting from absorbance shifts for a hypothetical model compound. Rate constants (jmax) and lifetimes calculated using an assumed quantum yield of 1, modeled actinic flux for Summit conditions, and an assumed Gaussian absorbance spectrum (peak molar absorptivity 3000 M−1 cm−1, standard deviation of 7 nm) with varying peak positions. (a) Ratio of shifted to unshifted jmax for varying hypsochromic (blue) or bathochromic (red) absorbance shifts. (b) Calculated rate constants (jmax) and lifetimes at various peak positions. The horizontal lines intersect the curves at the baseline peak position of 280 nm.
Next, we examined the impact of peak width, as illustrated in Fig. S22. From our modeling, the largest peak width change was approximately 2 nm (for 1,3-DMOB). As seen in Fig. S23, narrowing the hypothetical peak from 7 to 5 nm reduces jmax and increases the lifetime by 88-fold, roughly 7 times larger than the lifetime decrease caused by a 5 nm hypsochromic shift of the original 7 nm wide peak. While broadening the peak to 9 nm does increase jmax and decrease the lifetime, the magnitude of the change is not as significant, approximately 13-fold. Similarly to the pattern seen for peak location shifts, changes in peak width cause greater impacts when the compound's absorbance peak is located at shorter wavelengths.
Finally, we evaluated the impact of changing the peak height (hyper- and hypochromic shifts). Figure S24 shows the spectra tested and Fig. S25 the results; for comparison, our largest modeled peak height change was 17 %, for 1,2-DMOB. Because the area of a Gaussian curve is proportional to its peak height, doubling the height doubles the area, and therefore the light absorbed would double as well. However, compared to the impact of peak location and width, even a peak height doubling exerts a relatively small influence on peak area and therefore light absorbed. To evaluate the relative impact of absorbance shifts, broadenings, and peak height (molar absorption coefficient) changes on photodegradation, we assumed the largest modeled absorbance changes between aqueous solution and at the air–ice interface for the three DMOB isomers are typical for chemicals in the environment. Based on this assumption and applying these changes to our hypothetical peak, peak location and width changes at the air–ice interface probably control overall differences in light absorption, while changes in peak height likely make a minor contribution.
Our results, together with previous studies (Hullar et al., 2020; Kahan and Donaldson, 2007; Kahan et al., 2010a, b), suggest that for some organic compounds, QLLs and LLRs represent different photochemical reaction environments that are distinct from aqueous solution. While molecular modeling and laboratory measurements have both found evidence of absorbance shifts (Corrochano et al., 2017; Heger et al., 2005; Hullar et al., 2020; Malongwe et al., 2016), our results indicate that increases in quantum yield are the major reason for enhanced photochemical reactivity at the air–ice interface. For compounds absorbing appreciable amounts of sunlight in aqueous solution, QLL and LLR reactivity increases may cause environmentally significant changes in direct photoreaction rates and lifetimes, but for chemicals that absorb very little or no sunlight, these changes do not appear to make direct photochemistry a significant sink.
Our ability to make statistically significant conclusions depended on the choice of the experimental treatment; samples frozen in liquid nitrogen or vapor-deposited to nature-identical snow provided useful insights into LLR and QLL compartments, respectively. In contrast, samples frozen in a laboratory freezer or vapor-deposited to a water ice surface gave results that were noisier and less valuable. In addition, computational methods allowed us to determine absorbance spectra at the air–ice interface, where experimental observations would have been difficult.
While we find that quantum yields at the air–ice interface can be much higher than in aqueous solution, the reason for this remains unclear. Our modeling suggests small geometric changes in the configuration of the phenyl ring shifts molecular absorbance, and it is possible the change in the carbon atom positions could also increase the quantum yield. Despite our use of small amounts of DMOBs deposited to the air–ice interface, which should reduce aggregation and areas of high local concentration, the observed photodegradation rate constant enhancements might be caused by higher local concentrations at the air–ice interface, increasing secondary chemistry. An additional possibility for the higher quantum yields is a weakening of the cage effect at the air ice interface. In solution (including in LLRs), the chromophore is surrounded by a cage of water molecules, which can inhibit dissociation of the excited state into products. At the air–ice interface, however, this cage will be incomplete since the molecule is exposed to air on one side. This reduced cage should increase the efficiency of the excited state decaying into products, leading to a higher quantum yield. A reduced cage effect was proposed by Meusinger et al. (2014) to possibly explain enhanced photodecay of nitrate ion in natural snow studied in the lab, although later work in Antarctica (Barbero et al., 2021) found no enhancement in nitrate quantum yield in the field.
We used publicly available software to conduct the research and write the paper, including two commercial products, Microsoft Word and Microsoft Excel. For the modeling work, we used open-source tools: Quantum Espresso (QE) (https://www.quantum-espresso.org/, Giannozzi et al., 2017), the Environ patch to QE (http://www.quantum-environ.org/, Andreussi and Fisicaro, 2019), CP2K (https://www.cp2k.org/, VandeVondele et al., 2005), and LAMMPS (https://www.lammps.org/, Plimpton, 1995).
Data for the experimental portion of this work are included in the Supplement. For our computational efforts, data are available at https://doi.org/10.24435/materialscloud:q7-yg (Hullar et al., 2022). For additional questions or requests concerning data from this work, please contact the corresponding author.
The supplement related to this article is available online at: https://doi.org/10.5194/acp-22-5943-2022-supplement.
Overall, TH, TT, OP, and CA were responsible for the experimental portion of the research, while ZC, FB, and DD did the modeling work. Research oversight was provided by DD and CA. TT, OP, and FB performed most of the experimental and modeling efforts, with assistance and guidance from TH. ZC developed the machine learning model. TH wrote most of the manuscript, with additional text from ZC. TT, ZC, FB, DD, and CA commented on the paper drafts, with significant input from DD and CA.
The contact author has declared that neither they nor their co-authors have any competing interests.
Publisher’s note: Copernicus Publications remains neutral with regard to jurisdictional claims in published maps and institutional affiliations.
Calculations were performed using the Extreme Science and Engineering Discovery Environment (XSEDE), which is supported by the National Science Foundation (grant no. ACI-154856).
This research has been supported by the National Science Foundation (grant nos. CHE 1806210, AGS-PRF 1524857, and ACI-154856).
This paper was edited by Sergey A. Nizkorodov and reviewed by Dominik Heger and one anonymous referee.
Abascal, J. L. F., Sanz, E., Fernandez, R. G., and Vega, C.: A potential model for the study of ices and amorphous water: TIP4P/Ice, J. Chem. Phys., 122, 234511, https://doi.org/10.1063/1.1931662, 2005.
Amalric, L., Guillard, C., Serpone, N., and Pichat, P.: Water treatment: Degradation of dimethoxybenzenes by the titanium dioxide-UV combination, J. Environ. Sci. Heal. A, 28, 1393–1408, https://doi.org/10.1080/10934529309375949, 1993.
Andreussi, O. and Fisicaro, G.: Continuum Embeddings in Condensed-Matter Simulations, Int. J. Quantum. Chem., 119, e25725, https://doi.org/10.1002/qua.25725, 2019 (code available at: http://www.quantum-environ.org/, last access: 4 May 2022).
Barbero, A., Savarino, J., Grilli, R., Blouzon, C., Picard, G., Frey, M. M., Huang, Y., and Caillon, N.: New Estimation of the NOx Snow-Source on the Antarctic Plateau, J. Geophys. Res.-Atmos., 126, e2021JD035062, https://doi.org/10.1029/2021jd035062, 2021.
Barret, M., Domine, F., Houdier, S., Gallet, J. C., Weibring, P., Walega, J., Fried, A., and Richter, D.: Formaldehyde in the Alaskan Arctic snowpack: Partitioning and physical processes involved in air-snow exchanges, J. Geophys. Res.-Atmos., 116, D00R03, https://doi.org/10.1029/2011jd016038, 2011.
Bartels-Rausch, T., Jacobi, H.-W., Kahan, T. F., Thomas, J. L., Thomson, E. S., Abbatt, J. P. D., Ammann, M., Blackford, J. R., Bluhm, H., Boxe, C., Domine, F., Frey, M. M., Gladich, I., Guzmán, M. I., Heger, D., Huthwelker, Th., Klán, P., Kuhs, W. F., Kuo, M. H., Maus, S., Moussa, S. G., McNeill, V. F., Newberg, J. T., Pettersson, J. B. C., Roeselová, M., and Sodeau, J. R.: A review of air–ice chemical and physical interactions (AICI): liquids, quasi-liquids, and solids in snow, Atmos. Chem. Phys., 14, 1587–1633, https://doi.org/10.5194/acp-14-1587-2014, 2014.
Bartels-Rausch, T., Orlando, F., Kong, X. R., Artiglia, L., and Ammann, M.: Experimental Evidence for the Formation of Solvation Shells by Soluble Species at a Nonuniform Air-Ice Interface, Acs Earth Space Chem., 1, 572–579, https://doi.org/10.1021/acsearthspacechem.7b00077, 2017.
Bartok, A. P., Kondor, R., and Csanyi, G.: On representing chemical environments, Phys. Rev. B, 87, 184115, https://doi.org/10.1103/PhysRevB.87.184115, 2013.
Bononi, F. C., Chen, Z. K., Rocca, D., Andreussi, O., Hullar, T., Anastasio, C., and Donadio, D.: Bathochromic Shift in the UV-Visible Absorption Spectra of Phenols at Ice Surfaces: Insights from First-Principles Calculations, J. Phys. Chem. A, 124, 9288–9298, https://doi.org/10.1021/acs.jpca.0c07038, 2020.
Casida, M. E., Chermette, H., and Jacquemin, D.: Time-dependent density-functional theory for molecules and molecular solids Preface, J. Mol. Struc.-Theochem., 914, 1–2, https://doi.org/10.1016/j.theochem.2009.08.013, 2009.
Chu, L. and Anastasio, C.: Quantum yields of hydroxyl radical and nitrogen dioxide from the photolysis of nitrate on ice, J. Phys. Chem. A, 107, 9594–9602, https://doi.org/10.1021/jp0349132, 2003.
Chu, L. and Anastasio, C.: Formation of hydroxyl radical from the photolysis of frozen hydrogen peroxide, J. Phys. Chem. A, 109, 6264–6271, https://doi.org/10.1021/jp051415f, 2005.
Chu, L. and Anastasio, C.: Temperature and wavelength dependence of nitrite photolysis in frozen and aqueous solutions, Environ. Sci. Technol., 41, 3626–3632, https://doi.org/10.1021/es062731q, 2007.
Corrochano, P., Nachtigallová, D., and Klán, P.: Photooxidation of Aniline Derivatives Can Be Activated by Freezing Their Aqueous Solutions, Environ. Sci. Technol., 51, 13763–13770, https://doi.org/10.1021/acs.est.7b04510, 2017.
Cusentino, M. A., Wood, M. A., and Thompson, A. P.: Explicit Multielement Extension of the Spectral Neighbor Analysis Potential for Chemically Complex Systems, J. Phys. Chem. A, 124, 5456–5464, https://doi.org/10.1021/acs.jpca.0c02450, 2020.
Domine, F. and Shepson, P. B.: Air-snow interactions and atmospheric chemistry, Science, 297, 1506–1510, 2002.
France, J. L., King, M. D., Frey, M. M., Erbland, J., Picard, G., Preunkert, S., MacArthur, A., and Savarino, J.: Snow optical properties at Dome C (Concordia), Antarctica; implications for snow emissions and snow chemistry of reactive nitrogen, Atmos. Chem. Phys., 11, 9787–9801, https://doi.org/10.5194/acp-11-9787-2011, 2011.
Galbavy, E. S., Anastasio, C., Lefer, B. L., and Hall, S. R.: Light penetration in the snowpack at Summit, Greenland: Part 1 Nitrite and hydrogen peroxide photolysis, Atmos. Environ., 41, 5077–5090, https://doi.org/10.1016/j.atmosenv.2006.04.072, 2007.
Galbavy, E. S., Ram, K., and Anastasio, C.: 2-Nitrobenzaldehyde as a chemical actinometer for solution and ice photochemistry, J. Photoch. Photobio. A, 209, 186–192, https://doi.org/10.1016/j.jphotochem.2009.11.013, 2010.
Ge, X. C., Timrov, I., Binnie, S., Biancardi, A., Calzolari, A., and Baroni, S.: Accurate and Inexpensive Prediction of the Color Optical Properties of Anthocyanins in Solution, J. Phys. Chem. A, 119, 3816–3822, https://doi.org/10.1021/acs.jpca.5b01272, 2015.
Giannozzi, P., Andreussi, O., Brumme, T., Bunau, O., Nardelli, M. B., Calandra, M., Car, R., Cavazzoni, C., Ceresoli, D., Cococcioni, M., Colonna, N., Carnimeo, I., Dal Corso, A., de Gironcoli, S., Delugas, P., DiStasio, R. A., Ferretti, A., Floris, A., Fratesi, G., Fugallo, G., Gebauer, R., Gerstmann, U., Giustino, F., Gorni, T., Jia, J., Kawamura, M., Ko, H. Y., Kokalj, A., Kucukbenli, E., Lazzeri, M., Marsili, M., Marzari, N., Mauri, F., Nguyen, N. L., Nguyen, H. V., Otero-de-la-Roza, A., Paulatto, L., Ponce, S., Rocca, D., Sabatini, R., Santra, B., Schlipf, M., Seitsonen, A. P., Smogunov, A., Timrov, I., Thonhauser, T., Umari, P., Vast, N., Wu, X., and Baroni, S.: Advanced capabilities for materials modelling with QUANTUM ESPRESSO, J. Phys.-Condens. Mat., 29, 465901, https://doi.org/10.1088/1361-648X/aa8f79, 2017 (code available at: https://www.quantum-espresso.org/, last access: 4 May 2022).
Grabner, G., Rauscher, W., Zechner, J., and Getoff, N.: Photogeneration of Radical Cations from Aqueous Methoxylated Benzenes, J. Chem. Soc., 5, 222–223, https://doi.org/10.1039/c39800000222, 1980.
Grabner, G., Monti, S., Marconi, G., Mayer, B., Klein, C., and Kohler, G.: Spectroscopic and photochemical study of inclusion complexes of dimethoxybenzenes with cyclodextrins, J. Phys. Chem., 100, 20068–20075, https://doi.org/10.1021/jp962231r, 1996.
Grannas, A. M., Hockaday, W. C., Hatcher, P. G., Thompson, L. G., and Mosley-Thompson, E.: New revelations on the nature of organic matter in ice cores, J. Geophys. Res.-Atmos., 111, D04304, https://doi.org/10.1029/2005jd006251, 2006.
Grannas, A. M., Jones, A. E., Dibb, J., Ammann, M., Anastasio, C., Beine, H. J., Bergin, M., Bottenheim, J., Boxe, C. S., Carver, G., Chen, G., Crawford, J. H., Dominé, F., Frey, M. M., Guzmán, M. I., Heard, D. E., Helmig, D., Hoffmann, M. R., Honrath, R. E., Huey, L. G., Hutterli, M., Jacobi, H. W., Klán, P., Lefer, B., McConnell, J., Plane, J., Sander, R., Savarino, J., Shepson, P. B., Simpson, W. R., Sodeau, J. R., von Glasow, R., Weller, R., Wolff, E. W., and Zhu, T.: An overview of snow photochemistry: evidence, mechanisms and impacts, Atmos. Chem. Phys., 7, 4329–4373, https://doi.org/10.5194/acp-7-4329-2007, 2007.
Grimme, S., Antony, J., Ehrlich, S., and Krieg, H.: A consistent and accurate ab initio parametrization of density functional dispersion correction (DFT-D) for the 94 elements H-Pu, J. Chem. Phys., 132, 154104, https://doi.org/10.1063/1.3382344, 2010.
Hartwigsen, C., Goedecker, S., and Hutter, J.: Relativistic separable dual-space Gaussian pseudopotentials from H to Rn, Phys. Rev. B, 58, 3641–3662, https://doi.org/10.1103/PhysRevB.58.3641, 1998.
Heger, D. and Klán, P.: Interactions of organic molecules at grain boundaries in ice: A solvatochromic analysis, J. Photoch. Photobio. A, 187, 275–284, https://doi.org/10.1016/j.jphotochem.2006.10.012, 2007.
Heger, D., Jirkovsky, J., and Klán, P.: Aggregation of methylene blue in frozen aqueous solutions studied by absorption spectroscopy, J. Phys. Chem. A, 109, 6702–6709, https://doi.org/10.1021/jp050439j, 2005.
Hullar, T. and Anastasio, C.: Direct visualization of solute locations in laboratory ice samples, The Cryosphere, 10, 2057–2068, https://doi.org/10.5194/tc-10-2057-2016, 2016.
Hullar, T., Magadia, D., and Anastasio, C.: Photodegradation Rate Constants for Anthracene and Pyrene Are Similar in/on Ice and in Aqueous Solution, Environ. Sci. Technol., 52, 12225–12234, https://doi.org/10.1021/acs.est.8b02350, 2018.
Hullar, T., Bononi, F. C., Chen, Z. K., Magadia, D., Palmer, O., Tran, T., Rocca, D., Andreussi, O., Donadio, D., and Anastasio, C.: Photodecay of guaiacol is faster in ice, and even more rapid on ice, than in aqueous solution, Environ. Sci.-Proc. Imp., 22, 1666–1677, https://doi.org/10.1039/d0em00242a, 2020.
Hullar, T., Tran, T., Chen, Z., Bononi, F. C., Palmer, O., Donadio, D., and Anastasio, C.: Enhanced photodegradation of dimethoxybenzene isomers in/on ice compared to in aqueous solution, Materials Cloud Archive 2022.54 (2022) [data set], https://doi.org/10.24435/materialscloud:q7-yg, 2022 (data available at: https://archive.materialscloud.org/record/2022.54, last access: 4 May 2022).
Jacobi, H. W., Bales, R. C., Honrath, R. E., Peterson, M. C., Dibb, J. E., Swanson, A. L., and Albert, M. R.: Reactive trace gases measured in the interstitial air of surface snow at Summit, Greenland, Atmos. Environ., 38, 1687–1697, https://doi.org/10.1016/j.atmosenv.2004.01.004, 2004.
Kahan, T. F. and Donaldson, D. J.: Photolysis of polycyclic aromatic hydrocarbons on water and ice surfaces, J. Phys. Chem. A, 111, 1277–1285, https://doi.org/10.1021/jp066660t, 2007.
Kahan, T. F. and Donaldson, D. J.: Benzene photolysis on ice: Implications for the fate of organic contaminants in the winter, Environ. Sci. Technol., 44, 3819–3824, https://doi.org/10.1021/es100448h, 2010.
Kahan, T. F., Kwamena, N.-O. A., and Donaldson, D. J.: Different photolysis kinetics at the surface of frozen freshwater vs. frozen salt solutions, Atmos. Chem. Phys., 10, 10917–10922, https://doi.org/10.5194/acp-10-10917-2010, 2010a.
Kahan, T. F., Zhao, R., Jumaa, K. B., and Donaldson, D. J.: Anthracene photolysis in aqueous solution and ice: Photon flux dependence and comparison of kinetics in bulk ice and at the air-ice interface, Environ. Sci. Technol., 44, 1302–1306, https://doi.org/10.1021/es9031612, 2010b.
Kania, R., Malongwe, J. K., Nachtigallová, D., Krausko, J., Gladich, I., Roeselová, M., Heger, D., and Klán, P.: Spectroscopic properties of benzene at the air-ice interface: A combined experimental-computational approach, J. Phys. Chem. A, 118, 7535–7547, https://doi.org/10.1021/jp501094n, 2014.
Kling, T., Kling, F., and Donadio, D.: Structure and Dynamics of the Quasi-Liquid Layer at the Surface of Ice from Molecular Simulations, J. Phys. Chem. C, 122, 24780–24787, https://doi.org/10.1021/acs.jpcc.8b07724, 2018.
Krausko, J., Malongwe, J. K., Bièanová, G., Klán, P., Nachtigallová, D., and Heger, D.: Spectroscopic properties of naphthalene on the surface of ice grains revisited: A combined experimental computational approach, J. Phys. Chem. A, 119, 8565–8578, https://doi.org/10.1021/acs.jpca.5b00941, 2015.
Leang, S. S., Zahariev, F., and Gordon, M. S.: Benchmarking the performance of time-dependent density functional methods, J. Chem. Phys., 136, 104101, https://doi.org/10.1063/1.3689445, 2012.
Legrain, F., Carrete, J., van Roekeghem, A., Curtarolo, S., and Mingo, N.: How Chemical Composition Alone Can Predict Vibrational Free Energies and Entropies of Solids, Chem. Mater., 29, 6220–6227, https://doi.org/10.1021/acs.chemmater.7b00789, 2017.
Madronich, S. and Flocke, S. J.: The role of solar radiation in atmospheric chemistry, Handbook of Environmental Chemistry, edited by: Boule, P., Heidelberg, Springer, 1–26, https://doi.org/10.1007/978-3-540-69044-3_1, 1999.
Malongwe, J. K., Nachtigallová, D., Corrochano, P., and Klán, P.: Spectroscopic properties of anisole at the air-ice interface: A combined experimental-computational approach, Langmuir, 32, 5755–5764, https://doi.org/10.1021/acs.langmuir.6b01187, 2016.
Matykiewiczová, N., Kurkova, R., Klanova, J., and Klán, P.: Photochemically induced nitration and hydroxylation of organic aromatic compounds in the presence of nitrate or nitrite in ice, J. Photoch. Photobio. A, 187, 24–32, 2007.
McFall, A. S. and Anastasio, C.: Photon flux dependence on solute environment in water ices, Environ. Chem., 13, 682–687, https://doi.org/10.1071/EN15199, 2016.
McFall, A. S., Edwards, K. C., and Anastasio, C.: Nitrate Photochemistry at the Air-Ice Interface and in Other Ice Reservoirs, Environ. Sci. Technol., 52, 5710–5717, https://doi.org/10.1021/acs.est.8b00095, 2018.
Meusinger, C., Berhanu, T. A., Erbland, J., Savarino, J., and Johnson, M. S.: Laboratory study of nitrate photolysis in Antarctic snow. I. Observed quantum yield, domain of photolysis, and secondary chemistry, J. Chem. Phys., 140, 244305, https://doi.org/10.1063/1.4882898, 2014.
Miura, M., Aoki, Y., and Champagne, B.: Assessment of Time-Dependent Density-Functional Schemes for Computing the Oscillator Strengths of Benzene, Phenol, Aniline, and Fluorobenzene, J. Chem. Phys., 127, 084103–084117, https://doi.org/10.1063/1.2761886, 2007.
Mosi, R., Zhang, G. Z., and Wan, P.: Enhanced Basicity of the 2-Position of 1,3-Dialkoxybenzenes in S1: Acid-Catalyzed Photochemical Proton Deuteron Exchange, J. Org. Chem., 60, 411–417, https://doi.org/10.1021/jo00107a021, 1995.
Perdew, J. P., Burke, K., and Ernzerhof, M.: Generalized gradient approximation made simple, Phys. Rev. Lett., 77, 3865–3868, https://doi.org/10.1103/PhysRevLett.77.3865, 1996.
Phillips, G. J. and Simpson, W. R.: Verification of snowpack radiation transfer models using actinometry, J. Geophys. Res.-Atmos., 110, D08306, https://doi.org/10.1029/2004jd005552, 2005.
Plimpton, S.: Fast Parallel Algorithms for Short-Range Molecular Dynamics, J. Comput. Phys., 117, 1–19, https://doi.org/10.1006/jcph.1995.1039, 1995 (code available at: https://www.lammps.org/, last access: 4 May 2022).
Pollard, R., Wu, S., Zhang, G. Z., and Wan, P.: Photochemistry of Dimethoxybenzenes in Aqueous Sulfuric Acid, J. Org. Chem., 58, 2605–2613, https://doi.org/10.1021/jo00061a042, 1993.
Ram, K. and Anastasio, C.: Photochemistry of phenanthrene, pyrene, and fluoranthene in ice and snow, Atmos. Environ., 43, 2252–2259, https://doi.org/10.1016/j.atmosenv.2009.01.044, 2009.
Rocca, D., Gebauer, R., Saad, Y., and Baroni, S.: Turbo charging time-dependent density-functional theory with Lanczos chains, J. Chem. Phys., 128, 154105, https://doi.org/10.1063/1.2899649, 2008.
Sanchez, M. A., Kling, T., Ishiyama, T., van Zadel, M. J., Bisson, P. J., Mezger, M., Jochum, M. N., Cyran, J. D., Smit, W. J., Bakker, H. J., Shultz, M. J., Morita, A., Donadio, D., Nagata, Y., Bonn, M., and Backus, E. H. G.: Experimental and theoretical evidence for bilayer-by-bilayer surface melting of crystalline ice, P. Natl. Acad. Sci. USA, 114, 227–232, https://doi.org/10.1073/pnas.1612893114, 2017.
Schurmann, K. and Lehnig, M.: Mechanistic studies of the photochemical nitration of phenols, 1,2-dimethoxybenzene and anisoles with tetranitromethane by 15N CIDNP, Appl. Magn. Reson., 18, 375–384, https://doi.org/10.1007/bf03162151, 2000.
Smith, D. M., Cui, T., Fiddler, M. N., Pokhrel, R. P., Surratt, J. D., and Bililign, S.: Laboratory studies of fresh and aged biomass burning aerosol emitted from east African biomass fuels – Part 2: Chemical properties and characterization, Atmos. Chem. Phys., 20, 10169–10191, https://doi.org/10.5194/acp-20-10169-2020, 2020.
Tajima, S., Tobita, S., and Shizuka, H.: Electron transfer reaction from triplet 1,4-dimethoxybenzene to hydronium ion in aqueous solution, J. Phys. Chem. A, 103, 6097–6105, https://doi.org/10.1021/jp990743a, 1999.
Thompson, A. P., Swiler, L. P., Trott, C. R., Foiles, S. M., and Tucker, G. J.: Spectral neighbor analysis method for automated generation of quantum-accurate interatomic potentials, J. Comput. Phys., 285, 316–330, https://doi.org/10.1016/j.jcp.2014.12.018, 2015.
Tibshirani, R.: Regression shrinkage and selection via the lasso: a retrospective, J. R. Stat. Soc. B, 73, 273–282, https://doi.org/10.1111/j.1467-9868.2011.00771.x, 2011.
Timrov, I., Andreussi, O., Biancardi, A., Marzari, N., and Baroni, S.: Self-consistent continuum solvation for optical absorption of complex molecular systems in solution, J. Chem. Phys., 142, 034111, https://doi.org/10.1063/1.4905604, 2015.
Timrov, I., Micciarelli, M., Rosa, M., Calzolari, A., and Baroni, S.: Multimodel Approach to the Optical Properties of Molecular Dyes in Solution, J. Chem. Theory Comput., 12, 4423–4429, https://doi.org/10.1021/acs.jctc.6b00417, 2016.
USEPA: CompTox Chemicals Dashboard, https://comptox.epa.gov/dashboard/, last access: 9 December 2021.
VandeVondele, J., Krack, M., Mohamed, F., Parrinello, M., Chassaing, T., and Hutter, J.: QUICKSTEP: Fast and accurate density functional calculations using a mixed Gaussian and plane waves approach, Comput. Phys. Commun., 167, 103–128, https://doi.org/10.1016/j.cpc.2004.12.014, 2005 (code available at: https://www.cp2k.org/, last access: 4 May 2022).
Wan, P. and Wu, P.: Acid-Catalyzed ipso Photosubstitution of Alkoxy-substituted Benzenes in Aqueous Acid Solution, J. Chem. Soc., 11, 822–823, https://doi.org/10.1039/c39900000822, 1990.
Zhang, G. Z., Shi, Y. J., Mosi, R., Ho, T., and Wan, P.: Enhanced basicity of 1,3-Dialkoxy-substituted Benzenes – Cyclophane Derivatives, Can. J. Chem., 72, 2388–2395, https://doi.org/10.1139/v94-305, 1994.
Zhu, C. Z., Xiang, B., Chu, L. T., and Zhu, L.: 308 nm Photolysis of Nitric Acid in the Gas Phase, on Aluminum Surfaces, and on Ice Films, J. Phys. Chem. A, 114, 2561–2568, https://doi.org/10.1021/jp909867a, 2010.