the Creative Commons Attribution 4.0 License.
the Creative Commons Attribution 4.0 License.
 | 05 May 2022
Overview: On the transport and transformation of pollutants in the outflow of major population centres – observational data from the EMeRGe European intensive operational period in summer 2017
M. Dolores Andrés Hernández
Andreas Hilboll
Helmut Ziereis
Eric Förster
Ovid O. Krüger
Katharina Kaiser
Johannes Schneider
Francesca Barnaba
Mihalis Vrekoussis
Jörg Schmidt
Heidi Huntrieser
Anne-Marlene Blechschmidt
Midhun George
Vladyslav Nenakhov
Theresa Harlass
Bruna A. Holanda
Jennifer Wolf
Lisa Eirenschmalz
Marc Krebsbach
Mira L. Pöhlker
Anna B. Kalisz Hedegaard
Linlu Mei
Klaus Pfeilsticker
Yangzhuoran Liu
Ralf Koppmann
Hans Schlager
Birger Bohn
Ulrich Schumann
Andreas Richter
Benjamin Schreiner
Daniel Sauer
Robert Baumann
Mariano Mertens
Patrick Jöckel
Markus Kilian
Greta Stratmann
Christopher Pöhlker
Monica Campanelli
Marco Pandolfi
Michael Sicard
José L. Gómez-Amo
Manuel Pujadas
Katja Bigge
Flora Kluge
Anja Schwarz
Nikos Daskalakis
David Walter
Andreas Zahn
Ulrich Pöschl
Harald Bönisch
Stephan Borrmann
Ulrich Platt
John P. Burrows
Megacities and other major population centres (MPCs) worldwide are major sources of air pollution, both locally as well as downwind. The overall assessment and prediction of the impact of MPC pollution on tropospheric chemistry are challenging. The present work provides an overview of the highlights of a major new contribution to the understanding of this issue based on the data and analysis of the EMeRGe (Effect of Megacities on the transport and transformation of pollutants on the Regional to Global scales) international project. EMeRGe focuses on atmospheric chemistry, dynamics, and transport of local and regional pollution originating in MPCs. Airborne measurements, taking advantage of the long range capabilities of the High Altitude and LOng Range Research Aircraft (HALO, https://www.halo-spp.de, last access: 22 March 2022), are a central part of the project. The synergistic use and consistent interpretation of observational data sets of different spatial and temporal resolution (e.g. from ground-based networks, airborne campaigns, and satellite measurements) supported by modelling within EMeRGe provide unique insight to test the current understanding of MPC pollution outflows.
In order to obtain an adequate set of measurements at different spatial scales, two field experiments were positioned in time and space to contrast situations when the photochemical transformation of plumes emerging from MPCs is large. These experiments were conducted in summer 2017 over Europe and in the inter-monsoon period over Asia in spring 2018. The intensive observational periods (IOPs) involved HALO airborne measurements of ozone and its precursors, volatile organic compounds, aerosol particles, and related species as well as coordinated ground-based ancillary observations at different sites. Perfluorocarbon (PFC) tracer releases and model forecasts supported the flight planning, the identification of pollution plumes, and the analysis of chemical transformations during transport.
This paper describes the experimental deployment and scientific questions of the IOP in Europe. The MPC targets – London (United Kingdom; UK), the Benelux/Ruhr area (Belgium, the Netherlands, Luxembourg and Germany), Paris (France), Rome and the Po Valley (Italy), and Madrid and Barcelona (Spain) – were investigated during seven HALO research flights with an aircraft base in Germany for a total of 53 flight hours. An in-flight comparison of HALO with the collaborating UK-airborne platform Facility for Airborne Atmospheric Measurements (FAAM) took place to assure accuracy and comparability of the instrumentation on board.
Overall, EMeRGe unites measurements of near- and far-field emissions and hence deals with complex air masses of local and distant sources. Regional transport of several European MPC outflows was successfully identified and measured. Chemical processing of the MPC emissions was inferred from airborne observations of primary and secondary pollutants and the ratios between species having different chemical lifetimes. Photochemical processing of aerosol and secondary formation or organic acids was evident during the transport of MPC plumes. Urban plumes mix efficiently with natural sources as mineral dust and with biomass burning emissions from vegetation and forest fires. This confirms the importance of wildland fire emissions in Europe and indicates an important but discontinuous contribution to the European emission budget that might be of relevance in the design of efficient mitigation strategies. The present work provides an overview of the most salient results in the European context, with these being addressed in more detail within additional dedicated EMeRGe studies. The deployment and results obtained in Asia will be the subject of separate publications.
- Article
(13480 KB) - Full-text XML
-
Supplement
(3349 KB) - BibTeX
- EndNote


In recent decades, the number and size of major population centres (MPCs) have increased dramatically. The term “MPC” describes a single metropolitan area or converging urban conurbations with a population exceeding 10 million inhabitants. In 1950, New York and Tokyo were the only two megacities in the world (Gardi, 2017), whereas for 2018 the United Nations reported 33 megacities and 48 urban agglomerations of 5 to 10 million inhabitants (UN, 2019). One cause of the recent growth of the number of MPCs is the rapid industrialisation of some parts of the world, in particular East Asia.
The economic consequences of urbanisation, the spatial growth of MPCs, and, in particular, the environmental and economical sustainability of megacities have been a focus of recent discussion (ESPAS, 2019; Melchiorri et al., 2018; Hoole et al., 2019; Odendahl et al., 2019). The MPC has occasionally been presented as a favourable urban model because the concentration of resources and services and the development of more effective mitigation strategies make it potentially less harmful for the environment than other more dispersed population distributions (Grimm, 2008; Dodman, 2009). Nevertheless, the agglomeration of emissions from fossil fuel combustion for transport, industrial, and domestic purposes makes MPCs a growing and globally significant emission source of trace gases and aerosol particles for the troposphere. The current knowledge on local and regional impacts of MPC pollution outflows is still limited. Decoupling the pollutant input upwind from the MPC emissions remains essential to establish accurate source–receptor relationships and effective control and mitigation policies.
The EMeRGe (Effect of Megacities on the transport and transformation of pollutants on the Regional to Global scales) project has as an overarching objective the improvement of the current understanding of photochemical and heterogeneous processing of MPC plumes along expected transport pathways. EMeRGe began in 2016 in the framework of the Priority Program of the German Research Foundation (DFG: Deutsche Forschungsgemeinschaft, https://www.halo-spp.de/, last access: 22 March 2022) to exploit the High Altitude and LOng Range Research Aircraft (HALO) for atmospheric science.
EMeRGe has a focus on airborne measurements and fostered cooperation with an international research partnership (hereinafter referred to as EMeRGe international) to facilitate the delivery and comprehensive analysis of a unique set of data from aircraft-, ground-, and satellite-based sensors. The institutions currently involved in EMeRGe and EMeRGe international are listed in the Supplement (see Tables in Sects. S1 and S2).
Europe and Asia are regions of the world with a differing heritage of pollution control strategies and notable differences in the number, size, and proximity of MPCs as well as in the nature of emissions. For this reason, two field experiments were designed in EMeRGe to investigate the transport and transformation processes of pollution plumes originating from European and Asian MPCs. The first intensive observational period (IOP) was carried out in Europe from 10 to 28 July 2017 with special focus on the study of active plume processing close to emission sources. The second IOP aimed at the investigation of long-range transport (LRT) of MPC outflows from the Asian continent to the Pacific during the spring inter-monsoon period and took place with HALO base in Taiwan from 10 March to 9 April 2018.
The present article describes the experimental design and specific objectives of the IOP of EMeRGe in Europe. It highlights key research questions and some of the scientific results, which are further explored in dedicated publications.
High levels of urbanisation are associated with severe air pollution events which lead to adverse effects on human health (WHO, 2013; Lelieveld et al., 2015, 2020). The effects of pollution originating from MPCs and the development of adequate control strategies are receiving growing attention as the public concern about air quality and the interaction of pollution and climate on a warming planet increases (e.g. Jacob and Winner, 2009). In that respect, the MPC emissions of environmental interest are aerosol particles, which contain sulfate (SO and nitrate (NO, particulate organic matter (POM), black carbon (BC), and ammonium (NH, carbon monoxide (CO), and long-lived greenhouse gases (GHGs) such as carbon dioxide (CO2) and methane (CH4). The net radiative effect of the aerosol particles largely depends on the size and chemical composition which determine their scattering and absorption capabilities (e.g. Haywood and Boucher, 2000; Ramanathan et al., 2001; Pöschl, 2005). As cloud condensation nuclei (CCN) they have an additional effect on the optical properties and lifetime of clouds (e.g. Andreae and Rosenfeld, 2008; Campos Braga et al., 2017; Rosenfeld et al., 2008). Short-lived constituents of smog, such as nitrogen oxides (NOx, i.e. NO and NO2), volatile organic compounds (VOCs), and sulfur dioxide (SO2), react to produce ozone (O3) and secondary aerosol particles and also have a climatic effect (UNEP, 2011; Mar, 2021).
Primary MPC emissions are transported and transformed into secondary pollutants such as O3 or secondary aerosols (organic and inorganic) and lead to smog episodes downwind of the source. Modelling studies using artificial aerosol tracers and estimations of deposition potentials indicate that about 50 % of MPC emitted particles with diameter ≤2.5µm (PM2.5) deposit more than 1000 km from their source (Kunkel et al., 2012). Chemical and physical processing of MPC emitted pollutants can in turn be affected by mixing with natural, biogenic, and other anthropogenic emissions from regional sources or long-range transported from other areas (Lawrence et al., 2007; Monks et al., 2009; Lawrence and Lelieveld, 2010, and references therein).
The specific impact of the plumes from MPCs therefore depends not only on the type of emission sources (e.g. industry, transportation, domestic heating, and generation of electricity) but also on the variability of trace constituent emissions, the local meteorology, and topography. Modelling studies indicate significant latitudinal differences in regional to hemispheric dispersion characteristics (Lawrence et al., 2007, and references therein; Cassiani et al., 2013). Transport and transformation of MPC outflows are affected by the general weather patterns such as frontal passages and the frequency and duration of stagnation episodes, which are important for pollutant ventilation. In the last decades, improved monitoring and modelling capabilities and a growing number of measurement campaigns have provided essential information about the impact of MPC pollution on the atmospheric composition (see review by Zhu et al., 2012). However, capturing the combined influence of emissions, chemistry, and dynamics for specific locations is still a big challenge. In particular, inconsistencies in local and regional MPC inventories (e.g. Denier van der Gon et al., 2011; Mayer et al., 2000; Butler and Lawrence, 2009), and limitations in the prediction capabilities of pollution transport patterns and cumulative pollution events in downwind regions of MPCs (Zhang et al., 2008; Kunkel et al., 2012) require ongoing attention. Furthermore, controlling policies and changes in land cover and climate continue to evolve and are expected to substantially modify the relation between anthropogenic emissions and both natural aerosol and trace gases, as predicted by, e.g. Butler et al. (2012), and recently reported for East Asia (Fu et al., 2016; Silver et al., 2018, and references therein; Leung et al., 2018).
In Europe, the level of urbanisation is presently ∼ 74 % and is expected to further increase by 10 % up to the middle of this century (UN, 2019). Large urban conurbations are more abundant in Europe than megacities, of which there are a few. According to the European Environment Agency (EEA, 2019), the emission of air pollutants and precursors has decreased across Europe from the year 2000 to the present, partly as a result of the EU air quality legislation. Emissions of CO, BC, NOx, and non-methane VOCs have been reduced by around 30 % and those of sulfur oxide (SOx, primarily SO2) up to 77 %. Nevertheless, the daily and annual O3 and PM limit concentrations for protection of human health are often exceeded in several areas of the continent (EEA, 2019). Significant differences in pollution and photochemical episodes between northern and central Europe and the Mediterranean region are regularly observed, in particular due to the differences in solar actinic radiation (Kanakidou et al., 2011).
European air quality is frequently influenced by LRT of North American pollution as captured by airborne measurements and investigated in several model studies (e.g. Stohl et al., 2003; Huntrieser and Schlager, 2004; Huntrieser et al., 2005). Some evidence of LRT of Asian pollution to the Mediterranean has also been documented (Lawrence and Lelieveld, 2010; Lelieveld et al., 2002). The chemical signatures of LRT of pollutants vary depending on pollutant lifetime and mixing. Some recent modelling studies infer that the impact of non-European pollution on the European surface O3 annual average is larger than previously expected (Jonson et al., 2018).
In recent years, large European projects such as MEGAPOLI (http://megapoli.dmi.dk, last access: 21 June 2021) and CityZen (Mega city-Zoom for the Environment; https://cordis.europa.eu/project/id/212095/reporting, last access: 29 March 2022), provided comprehensive theoretical and experimental data about MPCs in Europe. The MEGAPOLI field campaign was conducted in Paris in summer 2009 and winter 2010 (Beekmann et al., 2015) and investigated source apportionment and photochemical processing of emitted gaseous and particulate substances using several ground-based stations and measurement vehicles (Crippa et al., 2013; Freutel et al., 2013; von der Weiden-Reinmüller et al., 2014). Beekmann et al. (2015) estimated the impact of the urban emissions from the Paris megacity to be relatively low in comparison to other external industrial sources of pollution. Aircraft measurements were restricted to the near-field outflow (up to 200 km) in the boundary layer (BL) below 700 m a.s.l. (Brands et al., 2011; Freney et al., 2014). In comparison, EMeRGe focuses on the impact of different MPCs in central and southern Europe and investigates atmospheric pollution plumes over much larger geographical extent.
CityZen (2008–2011) studied air pollution in and around selected megacities and emission hotspots by using in situ and satellite observations (Hilboll et al., 2013; Vrekoussis et al., 2013) as well as a series of different scale models (Colette et al., 2011; Im et al., 2012). The project focused on selected MPCs such as the Eastern Mediterranean, the Po Valley, the Benelux region, and the Pearl River Delta for intensive case studies but, in contrast to EMeRGe, did not conduct measurements of the photochemical evolution in the outflow of the studied regions.
The above studies focused on trace gases linked to air quality and provided relatively sparse information on GHGs. Long-lived greenhouse gases such as CH4 and CO2 emitted from individual European urban areas have been investigated in airborne and ground-based studies, e.g. for London (O'Shea et al., 2014; Helfter et al., 2016; Pitt et al., 2019), Paris (Bréon et al., 2015; Lian et al., 2019), Cracow (Kuc et al., 2003; Zimnoch et al., 2019), Berlin (Klausner et al., 2020), and Rome (Gioli et al., 2014). Collectively, they report on inconsistencies between the current emission inventories and measurements. This indicates the need for further experimental investigation of the GHG budget in Europe.
Overall, the proximity of most European MPCs results in the mixing of different pollution plumes during their transport. This hampers the identification of the air mass origin. The impact of biomass burning (BB) and mineral dust events on the total European burden of atmospheric aerosol and trace gases is, moreover, variable. Particularly in southern Europe, BB and mineral dust plumes occur frequently and can significantly affect the chemical processing of MPC pollution plumes. BB events from agriculture or wildland fires have a strong seasonal pattern and related impacts in Europe (Barnaba et al., 2011). Wildfires emit, similar to MPC, large amounts of pollutants, e.g. PM, NOx, CO, VOCs, and PAH (Andreae, 2019). The number and severity of wildfires are expected to increase in Europe under warmer and drier conditions as a co-effect of climate change (Forzieri et al., 2017; Guerreiro et al., 2018; Turco et al., 2018). Desert dust episodes of different intensity originating in northern Africa frequently affect air mass composition and atmospheric stratification over the Mediterranean particularly in spring and summer (e.g. Barnaba and Gobbi, 2004; Kalivitis et al., 2007; Gkikas et al., 2013; Pey et al., 2013; Pikridas et al., 2018).
3.1 Specific scientific questions
EMeRGe in Europe focuses on three primary scientific goals addressing a series of related specific questions:
- I.
Regarding identification of emission signatures in MPC plumes over Europe:
-
Are there individual MPC emission signatures identifiable in pollution plumes measured over Europe?
-
Is it possible to unambiguously identify MPC plumes after transport times of hours or days by tagging the air masses in the source regions with passive tracers released at the surface and using airborne sensors downwind?
-
Can the effect of plumes from different emission sources (e.g. anthropogenic, BB, and/or a mixture of them) on the oxidation potential of the atmosphere be inferred from changes in the NONOy and NOVOC ratios in airborne measurements?
-
Can airborne measurements detect signatures of urban and other emission sources of CH4 in Europe adequately?
-
How abundant are organic acids in European MPC plumes relative to inorganic acids and what are their main sources?
-
Are satellite measurements of aerosol and trace gases capable of supporting the identification of MPC plumes and dominant transport paths?
- II.
Regarding investigation and assessment of chemical processing in MPC pollution outflows:
-
Is the photochemical activity of MPC plumes readily related to changes in concentrations of radicals and their precursors measured by the HALO sensors?
-
Is the photochemical ageing of MPC plumes well described by the chemical clocks inferred from the airborne measurements of trace gases and aerosol particles?
-
Can the O3 production efficiency and NOx- and VOC-sensitive regimes in MPC plumes be determined? How do these change with respect to the plume age and mixing with background air?
-
Can the importance of the role of formaldehyde (HCHO) as an intermediate product in the oxidation of VOCs, and glyoxal (C2H2O2) and methylglyoxal (C3H4O2) in secondary aerosol formation be inferred from their airborne measurement in MPC pollution plumes?
-
Which processes control the heterogeneous formation of HONO in polluted air masses of MPC origin in the BL and lower troposphere over Europe?
- III.
Regarding assessment of the relative importance of MPCs as sources of pollution over Europe:
-
How important are BB and dust emissions to MPC plume photochemistry over Europe in the summer 2017?
-
How do the regional CH4 urban emission distributions in Europe compare with previous observations in the same areas?
-
Is it possible to assess the relative role of primary and secondary pollutants in the proximity and in the outflow of MPCs?
-
Are state-of-the-art chemical models capable of adequately simulating transport and transformation of European MPC outflows?
3.2 Selection of MPC targets and measurement strategy
The dominant source of NOx and CO in the planetary boundary layer (PBL) in Europe is anthropogenic activity, primarily fossil fuel combustion and BB. Cloud free monthly average tropospheric composites of NO2 columns retrieved from the Global Ozone Monitoring Experiment-2B (GOME-2B) and Ozone Monitoring Instrument (OMI) instruments aboard the MetOp-B and Aura satellites were used to identify the major MPCs in Europe during July in the EMeRGe study. Due to its short lifetime, NO2 is a good indicator of the origin of emission sources. The tropospheric NO2 columns retrieved in July 2016 during the campaign preparation showed enhanced NO2 concentrations over the megacities London, Moscow, and Paris, over large urban agglomerations such as the Benelux/Ruhr metropolitan area in central Europe and the Po Valley in northern Italy, and over the conurbations in southern Europe such as Rome, Naples, Madrid, and Barcelona. The satellite observations during the EMeRGe IOP in 2017 confirmed the NO2 hotspots identified (Fig. 1).
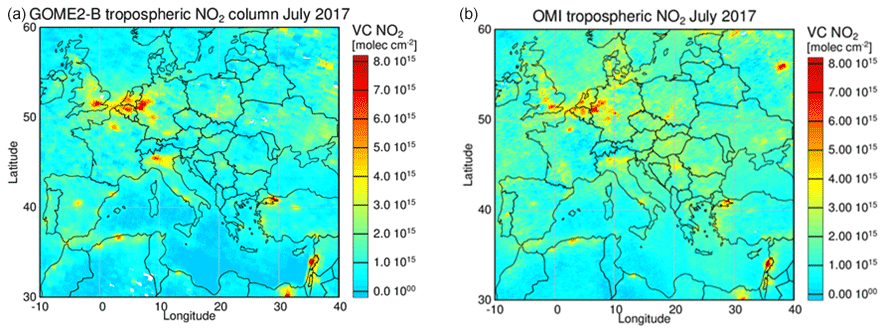
Figure 1Satellite tropospheric NO2 columns retrieved from GOME-2B (panel a, overpass at 09:30 LT) and OMI (panel b, overpass at 13:45 LT) instruments for the IOP period in July 2017.
CO was used in dispersion calculations to identify anthropogenic pollution from combustion. CO is a suitable tracer for transport pathways due to its relatively long atmospheric lifetime which is primarily determined by the reaction with the OH radical and varies between a few weeks and a few months. To address the EMeRGe scientific objectives, the day-to-day flight planning focused on the identification of the location of plumes from the targeted MPC outflows during potential flights. For this, the following forecast tools were exploited:
- i.
ECMWF (European Centre for Medium-Range Weather Forecasts, https://www.ecmwf.int/, last access: 21 March 2021) and NCEP (National Centers for Environmental Prediction, https://www.ncep.noaa.gov/, last access: 21 March 2021) weather forecasts,
- ii.
NOAA (National Oceanic and Atmospheric Association) HYSPLIT (Hybrid Single-Particle Lagrangian Integrated Trajectory, https://www.arl.noaa.gov/hysplit/, last access: 21 March 2021) model for forward dispersion calculations using CO as a tracer of pollution. These forecasts, carried out by DLR (Deutsches Zentrum für Luft- und Raumfahrt), assume MPCs to be continuous emission sources and provide snapshots as well as horizontal and vertical cross sections of the selected outflows at certain times.
- iii.
Tailor-made CO and stratospheric ozone tracer simulations provided by CAMS (Copernicus Atmosphere Monitoring Service, http://atmosphere.copernicus.eu, last access: 21 March 2021) through its field campaign support (see also Flemming et al., 2019).
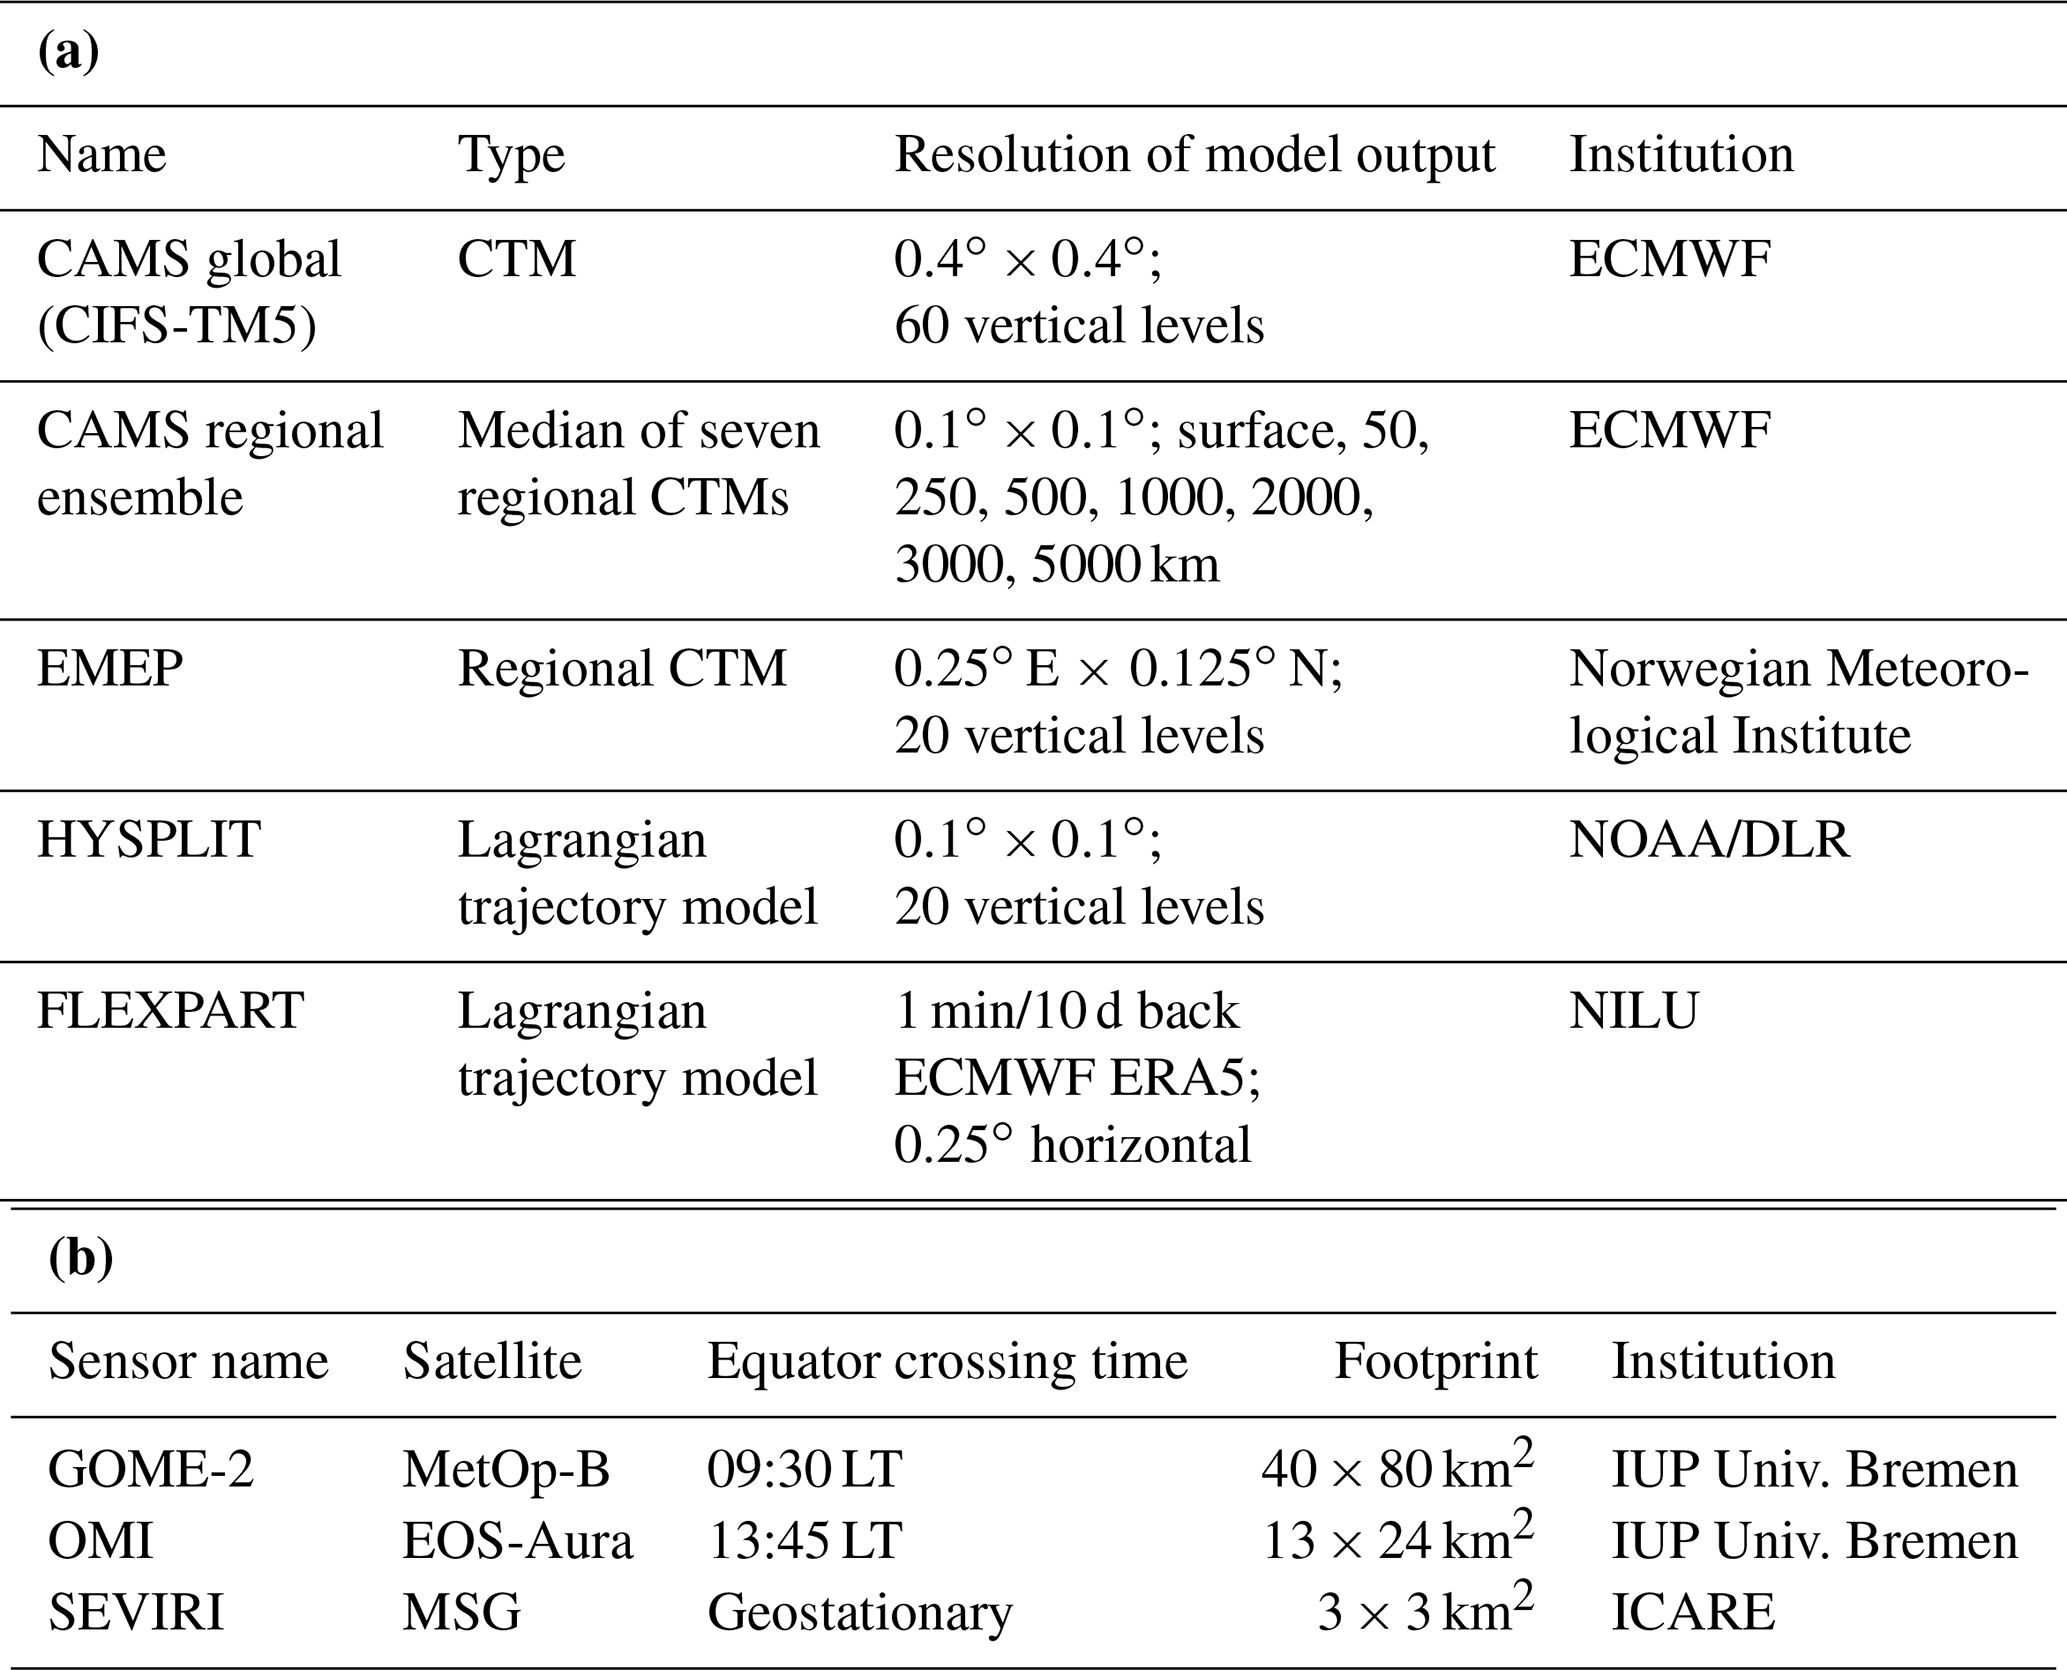
A list of model simulations and satellite observations used for flight planning is given in Table 1a and b. These are described in more detail in the Supplement (see S3). The dedicated mission support tool (MSS, Mission Support System; Rautenhaus et al., 2012) provided additional assistance in the flight planning.
Table 1(a) Model simulations used for flight planning during EMeRGe in Europe. (b) Satellite observations used during EMeRGe in Europe. LT: local time.
The flight track and patterns available to HALO were constrained by (a) flight restrictions from the air traffic authorities and special military-used airspaces (SUAs) and (b) the unstable meteorological conditions dominating in central Europe during the measurement period (see Sect. 3.4). Flight tracks to investigate the plumes from the MPC targets, London (Great Britain), the Benelux/Ruhr area (Benelux countries and Germany, hereinafter referred to as BNL/Ruhr), Paris (France), Rome and the Po Valley (Italy), and Madrid and Barcelona (Spain) were selected. It was possible to fly these flight tracks under favourable conditions typically more than once during the EMeRGe IOP, improving somewhat the representativeness of the measurements.
The HYSPLIT dispersion forecast indicated that the MPC pollution plumes targeted by EMeRGe resided predominantly below 3000 m. Consequently, the flights over Europe made use of the HALO long-endurance capabilities to fly in the PBL and incorporated vertical shuttles. Shuttles are defined here as a descent or climb pattern between holding altitudes. Typically, three flight levels (FLs) upwind or downwind of the target MPCs were part of the shuttle. Some of the MPC outflows were tagged by a coordinated release of a perfluorocarbon (PFC) tracer at the ground (see Sect. 4 in the Supplement). Details about flight tracks and flight regions are provided in Sect. 3.6.
3.3 EMeRGe instrumentation
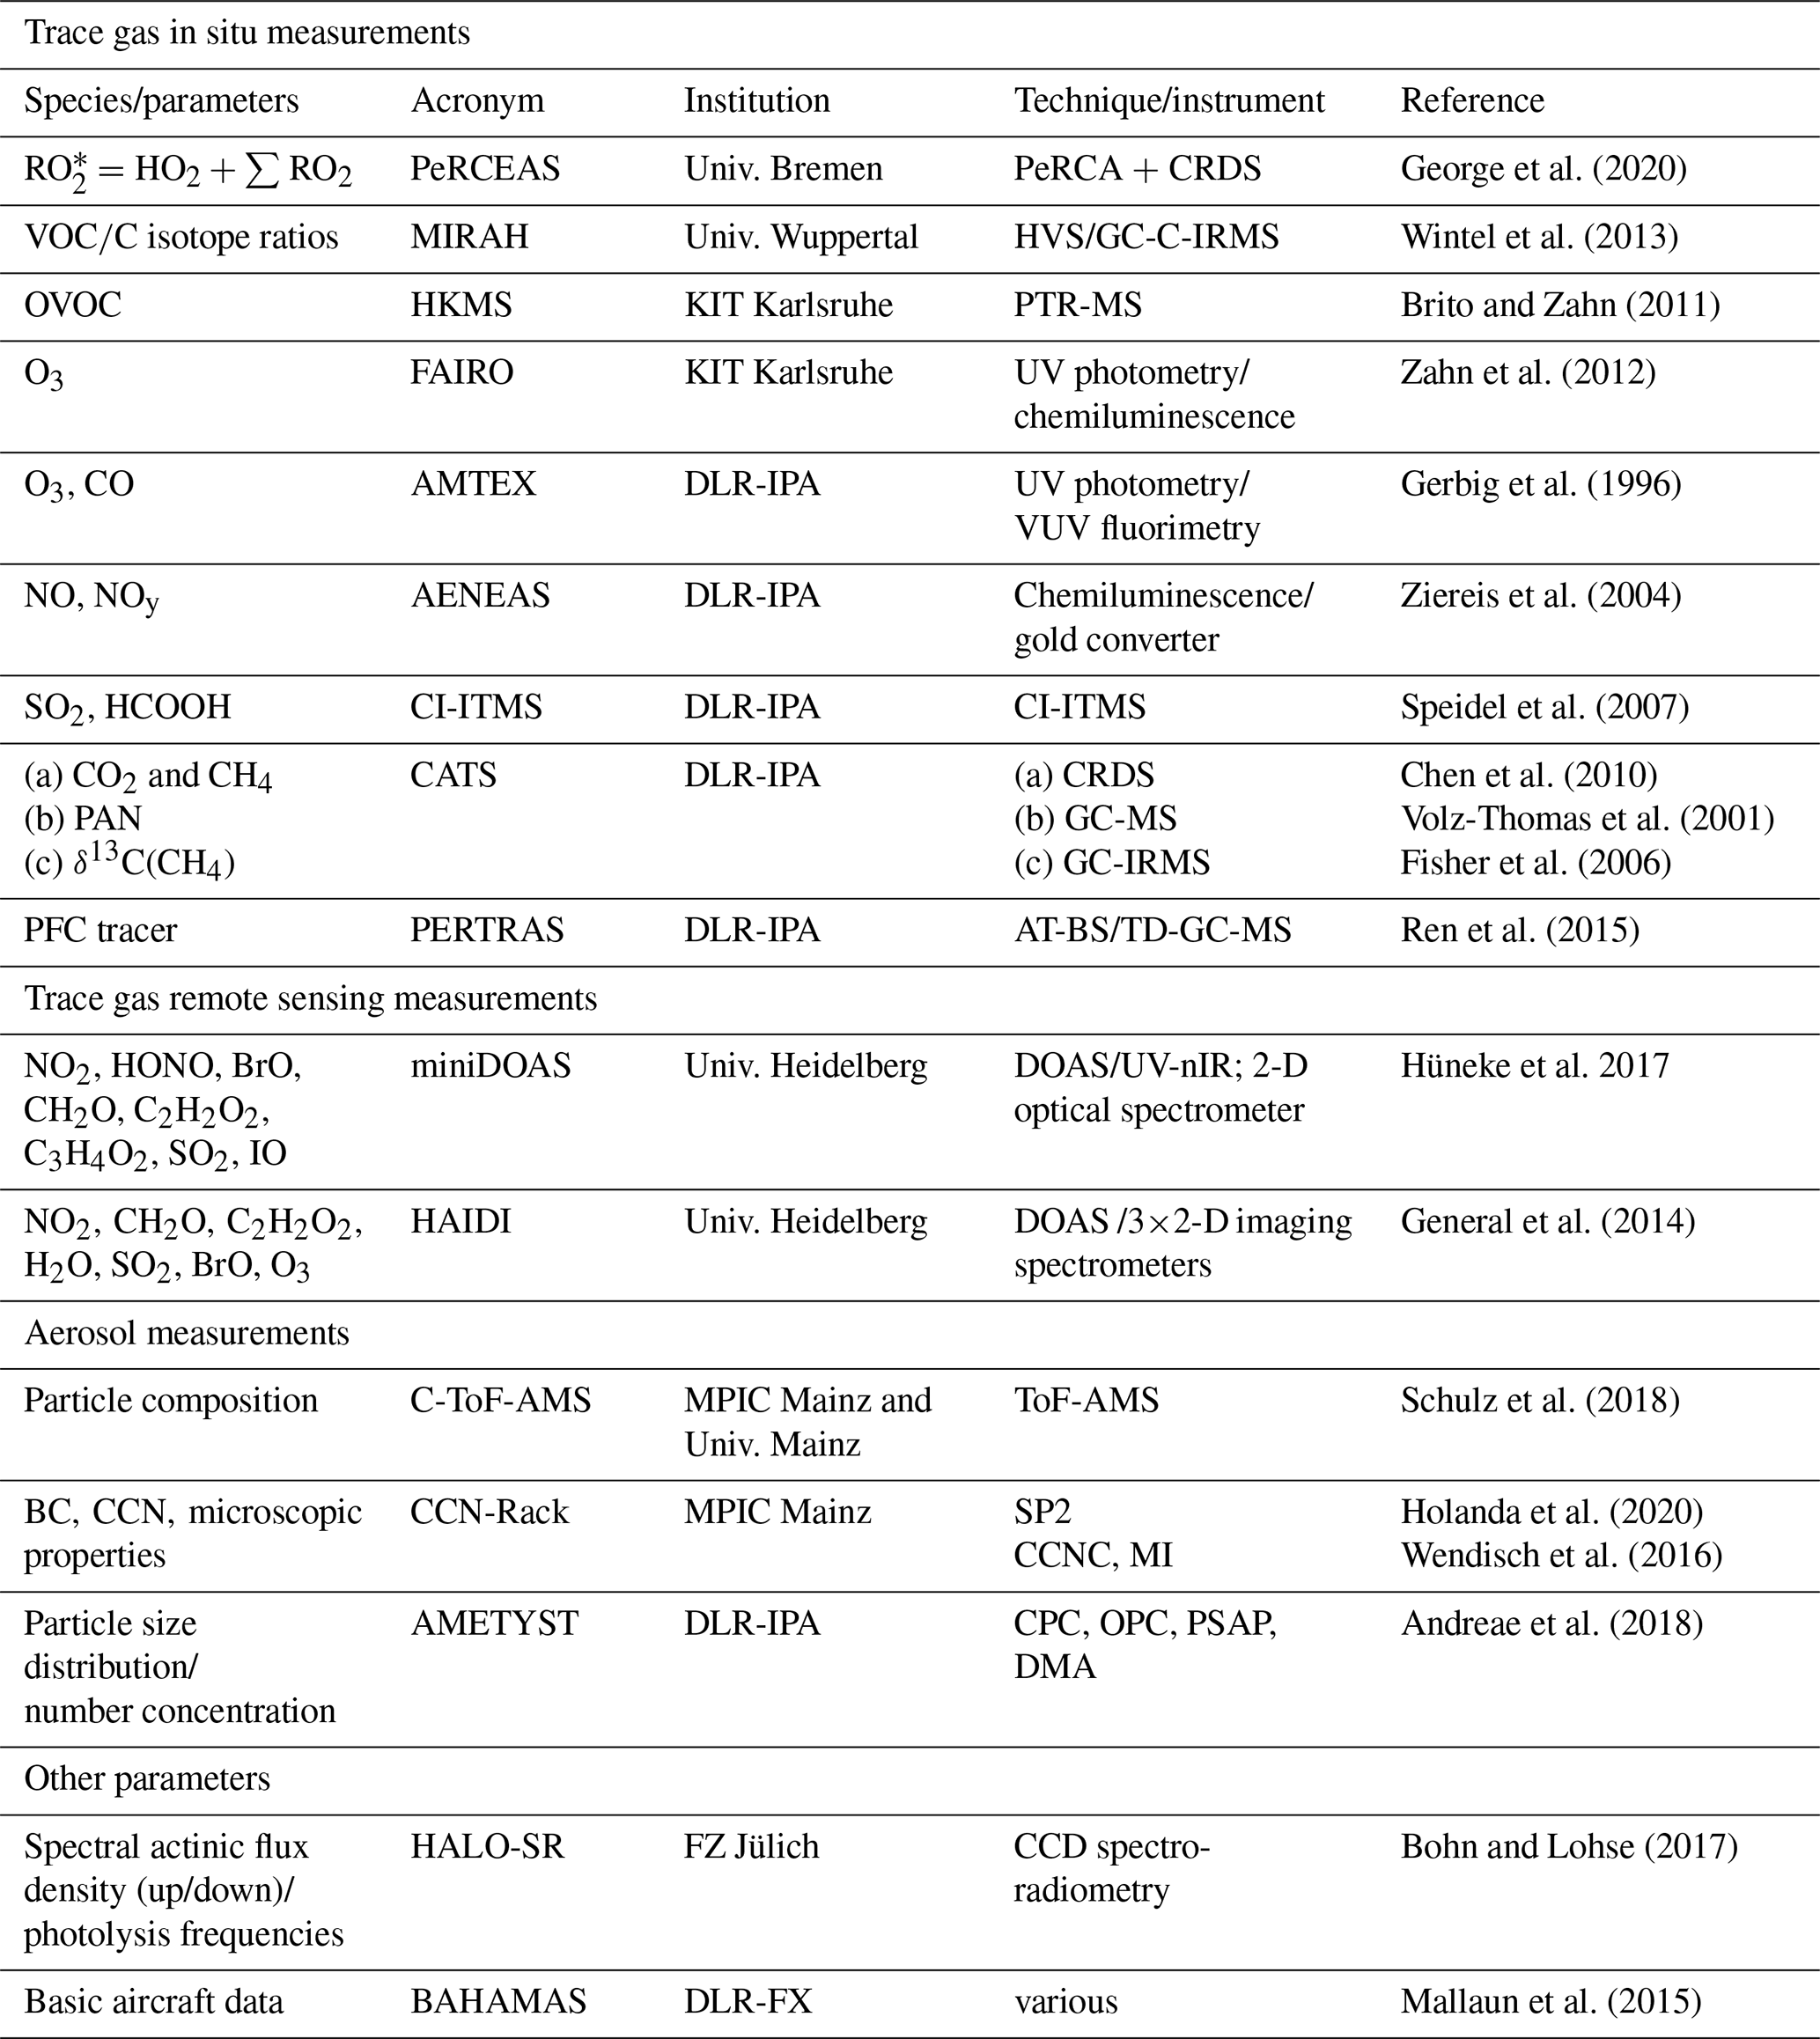
The airborne measurements made aboard HALO, a Gulfstream G550 business jet modified and specifically equipped for scientific research (see https://www.halo.dlr.de, last access: 22 March 22), are a key element of the EMeRGe data. The HALO payload for EMeRGe comprises a set of state-of-the-art instrumentation for the measurement of trace gases and aerosol particles. Table 2 summarises target species and parameters measured by the instruments installed aboard HALO, which are complemented by the HALO ancillary measurements (BAHAMAS; see Sect. 5 in the Supplement) during the EMeRGe campaign in Europe. The pollutant measurements made aboard HALO were enhanced with tracer experiments using PFC compounds. Details are provided in the Supplement (see Sect. 4 in the Supplement).
Table 2HALO instrumental payload for EMeRGe: PeRCA: peroxy radical chemical amplification; CRDS: cavity ring-down spectroscopy; HVS: High-Volume Sampler; GC-C-IRMS: gas chromatography combustion isotope ratio mass spectrometry; PTR-MS: Proton-Transfer-Reaction Mass Spectrometer; CI-ITMS: chemical ionisation ion trap mass spectrometry; GC-MS: gas chromatography–mass spectrometry analysis; PAN: peroxyacetyl nitrate; δ13C(CH4): isotopic signature of methane; PFC: perfluorinated carbon compounds; DOAS: differential optical absorption spectrometry; AT-BS: adsorption tube and bag air sampler; TD-GC-MS: thermal desorption gas chromatography and mass spectrometry; ToF-AMS: time-of-flight aerosol mass spectrometry; SP2: Single-Particle Soot Photometer; CCNC: Cloud Condensation Nuclei Counter; MI: Multi-Impactor for aerosol offline analysis; CPC: Condensation Particle Counter; DMA: Differential Mobility Analyzer; OPC: Optical Particle Counter; PSAP: Particle Soot Absorption Photometer. See details and HALO ancillary measurements in the Supplement. The instrument details are given in the quoted literature.
During the preparation and execution phases of the EMeRGe IOP in Europe, the EMeRGe international cooperation provided additional coordinated aircraft-, satellite-, and ground-based observations and modelling studies, as described in the Supplement (see Sect. 6). To assure the accuracy and comparability of the instrumentation on board, one research flight on 13 July 2017 was dedicated to common and simultaneous measurements of HALO and the Facility for Airborne Atmospheric Measurements (FAAM, https://www.faam.ac.uk/, last access: 21 June 2021) from the UK Natural Environment Research Council in a so-called blind intercomparison exercise (see Sect. 7 in the Supplement).
3.4 Meteorological conditions
In this subsection, a brief overview of the general meteorological situation over Europe is given. A summary of the meteorological conditions during individual flights is provided later in Sect. 3.6.
The EMeRGe IOP in Europe took place from 10 to 28 July 2017. The month of July was selected for the EMeRGe investigation because the summer period in Europe usually offers frequent events of high temperature and high insolation, which result in active photochemical processing of the air masses.
The monthly average weather conditions of July 2017 were evaluated by comparing 500 hPa geopotential height, temperature, wind, and precipitable water with a 30-year (1981–2010) reference climatology using NCEP reanalysis data (Kalnay et al., 1996). As shown in Fig. 2, stagnation events, high temperatures, and insolation dominated southern Europe similar to the average of the 30-year climatology. On the ground, the summer of 2017 was characterised by a number of heatwaves, which contributed to the propagation of frequent fire events especially on the Iberian Peninsula (EEA, 2019). Several EMeRGe flights were affected by such fires in the southern Mediterranean area, as summarised later in Sect. 3.6. Furthermore, in Sect. 4.4, more details are given on how the emissions from these fires frequently interacted with anthropogenic and other natural emissions. In contrast, during the EMeRGe period, northern Europe was influenced by a pronounced negative upper-level pressure and temperature anomaly. The polar front was positioned further southwards than usually and accompanied with anomalously high upper-level wind speeds over central Europe. These conditions favoured the passage of upper-level troughs associated with midlatitude cyclones and enhanced precipitation over central Europe. A cut-off low located over Great Britain during approximately the last 10 d of the campaign led to a pronounced deviation of the average weather conditions in July. Thunderstorms frequently developed near the Alps over southern Germany and northern Italy. Due to the various meteorological conditions in central and southern Europe, the photochemical processing of the investigated polluted air masses proceeded highly differently, as described in more detail in Sect. 4.5.
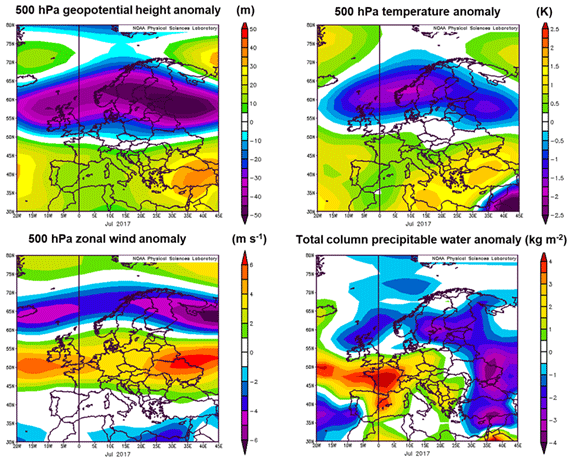
Figure 2Mean anomalies of the 500 hPa geopotential height (top left), temperature (top right), zonal wind (bottom left), and total column precipitable water (bottom right) for July 2017 with respect to a 1981–2010 July climatology based on NCEP reanalysis data (Kalnay et al., 1996). Total column precipitable water is the amount of water potentially available in the atmosphere for precipitation from the surface to the upper edge of the troposphere. NCEP reanalysis data and images are provided by the NOAA/ESRL Physical Sciences Laboratory, Boulder, Colorado (http://psl.noaa.gov/, last access: 21 September 2021).
3.5 Aerosol optical depth
The aerosol load in the target regions during the EMeRGe IOP in July 2017 was investigated. Monthly averages of aerosol optical depths (AODs) measured in July 2017 at 17 Aerosol Robotic Network (AERONET) sites (AERONET, 2020) covering the EMeRGe target regions were compared to the relevant climatology (i.e. the 19-year “July AOD mean” between 2001 and 2019). These AERONET level 2.0 AOD climatological data (Giles et al., 2019) are visualised in Fig. 3, referring to 500 nm wavelength. The results show that in July 2017 the aerosol load was generally lower than the relevant climatological value in each target region. For the BNL/Ruhr area (Brussels, Cabauw, Lille, Jülich), Rome (Rome “La Sapienza”, Rome “Tor Vergata”), Paris (Palaiseau, Paris), and the Po Valley (Ispra, Modena, Sirmione), the relative deviations of the AODs from the mean values are similar and of the order of −30 %. In Rome and the Po Valley, the July 2017 AOD is outside the range of the climatological mean and standard deviations. For eastern Spain (Barcelona, Burjassot, Montsec, Palma) and southern Great Britain (Bayfordbury, Chilbolton), the aerosol load is closer to the relevant climatology, with relative deviations of 7 % and 15 %, respectively.

Figure 3Monthly mean AOD values at 500 nm for July (years 2001–2019) in each of the EMeRGe target regions (black squares and standard deviations). These were obtained as mean of the multiple site monthly means (selected sites in colour, see legends). Note that for those AERONET instruments not having the 500 nm filter, the AOD values are interpolated using the Ångström coefficient between the two closest wavelengths. The values of the climatological – and July 2017 – AOD are also reported in the plot insets.
3.6 Flight regions and HALO flight tracks
The EMeRGe IOP in Europe comprised seven HALO flights for a total of 53 flight hours. All HALO flights started from the DLR base Oberpfaffenhofen (OP), located southwest of Munich in Germany. The flights are named E-EU-FN, where E stands for EMeRGe, EU for Europe, and FN are the two digits of the flight number. The flight tracks are shown in Fig. 4, and Table 3 summarises the corresponding flight times and targets.
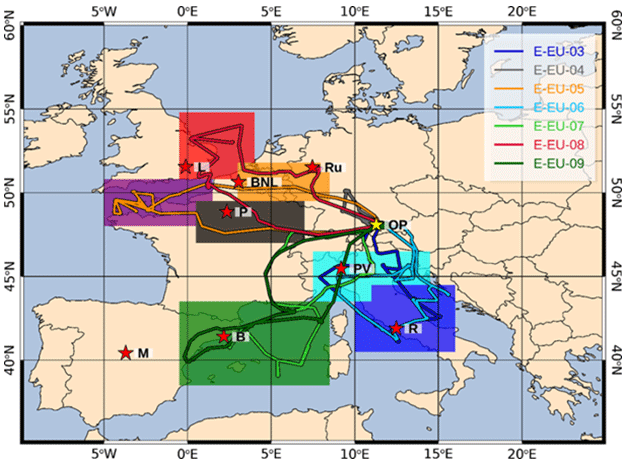
Figure 4HALO flight tracks during the EMeRGe campaign in Europe on 11, 13, 17, 20, 24, 26, and 28 July 2017 (E-EU-03 to E-EU-09, respectively, colour coded). The specific flight times are presented in Table 3. MPC target areas are colour coded by shading: the English Channel (purple), the North Sea (red) Benelux/Ruhr (orange), Paris (black), the Po Valley (cyan), central Italy (blue), and the Eastern Mediterranean (green). Distinctive locations/regions are marked with red stars, M: Madrid, B: Barcelona, P: Paris, L: London; BNL: Benelux; Ru: Ruhr area; PV: Po Valley, R: Rome. The coordinates of the MPC areas can be found in the Supplement (Sect. S8). The position of the HALO base at DLR in Oberpfaffenhofen (OP) is also indicated by a yellow star for reference.
Table 3Characteristics of the HALO flights carried out in Europe during EMeRGe. FR: flight region. Note that E-EU-01 and E-EU-02 were technical flights and are not considered in the present work.
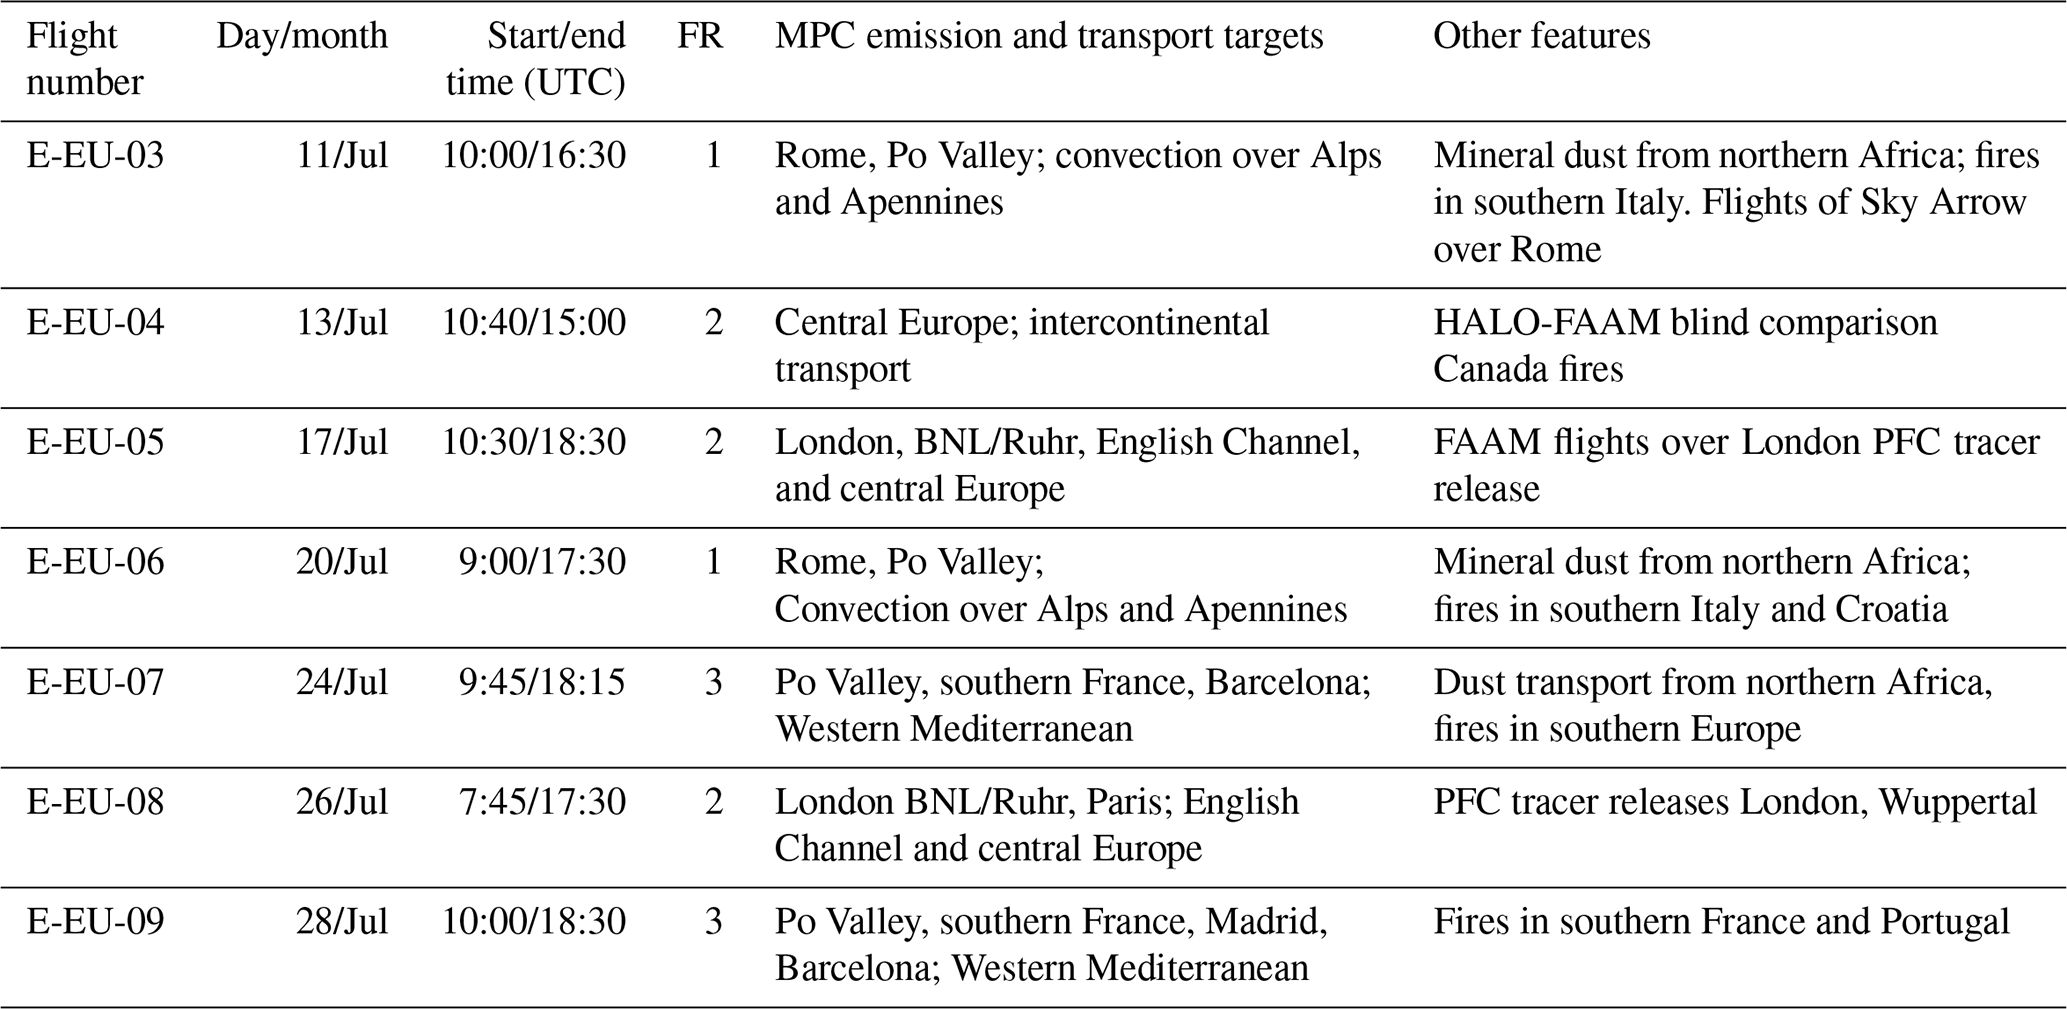
Overall, 60 % of the HALO measurements during EMeRGe in Europe were performed below 3000 m to probe fresh and transported outflows of selected MPCs (see Fig. 5 for the distribution of HALO flight altitudes during the EMeRGe IOP).
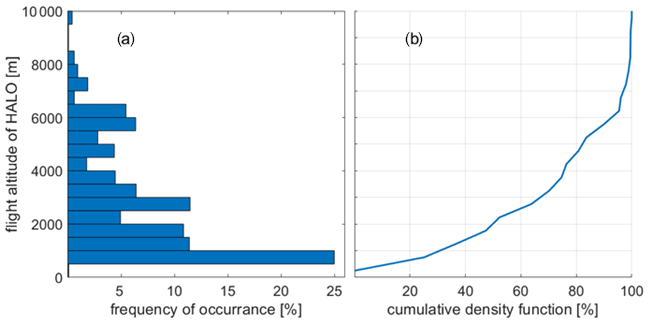
Figure 5Frequency of occurrence of flight altitudes during EMeRGe in Europe in bins of 500 m, (a) cumulated frequencies of flight altitudes from the ground to 10 000 m, and (b) cumulative density function.
Taking the flight constraints and the prevailing meteorological conditions into account, three flight regions were selected for the identification and measurement of outflows of target MPCs during the EMeRGe IOP:
- a.
flight region 1: southern Europe – Italy;
- b.
flight region 2: London and central Europe; and
- c.
flight region 3: southwestern Europe.
3.6.1 Flight region 1: southern Europe – Italy
Flight region 1 was selected for the HALO flights E-EU-03 (Sect. 9 in the Supplement, Table S9.1, and Fig. S9.1) and E-EU-06 (Fig. 6) on 11 and 20 July 2017, respectively. The synoptic situation in Europe during these days was characterised by a high-pressure system over the Mediterranean region and a cut-off low over the British Isles associated with the rapid passage of low-pressure systems over the UK and Scandinavia. As a result, a southwest flow with a trough approaching from the west and a short wave passage dominated. These conditions were suitable for the investigation of the MPC targets in Italy (Po Valley and Rome) and of the transport of pollution over the Alps and Apennines. Along the flight route, cloud formation in the Po Valley and thunderstorms in southern Germany in the afternoon after 15:00 UTC were observed on both days.
Figure 6Details of the E-EU-06 flight on the 20 July 2017. Three shuttles took place downwind of the Po Valley (PV), upwind of Rome (R) and along the Adriatic coast and are marked with red lines on the map in panel (a), as red-shaded areas on the altitude diagram in panel (b), and as a 3-D depiction in panels (c), (d), and e). The flight tracks during the shuttles d and e are shown in grey. The flight track in panel (a) is coloured as in Fig. 4, and the EMeRGe MPC targets are in red. Main changes in course and altitude are marked as a–l on the graphs for reference. OP indicates the position of the HALO base.
During these flights, BB emissions from forest and intentional fires in southern Italy, particularly in the Naples area, and along the coast of Croatia were detected. In addition, the transport of mineral dust from northern Africa to the central Mediterranean and the Italian west coast was observed.
The E-EU-03 and E-EU-06 flights were carried out over approximately the same geographical area. Initially, HALO flew over the Alps, then along the Po Valley to the Mediterranean coast of Italy. During E-EU-06, the vertical and horizontal distribution of pollutants was investigated in more detail by shuttles before entering the Po Valley and flying at lower altitudes. The tracks followed the Tyrrhenian Sea heading to the south and crossing the Italian Peninsula from west to east towards the Adriatic coast after a shuttle upwind of Rome. Along the Adriatic coast, shuttles were made while flying to the north. Finally, the flights crossed over the Alps back to OP. The E-EU-06 flight track details are summarised in Fig. 6.
During E-EU-03 the HALO airborne measurements were complemented by two circuits around Rome by the Sky Arrow aircraft and its payload (Sect. S6.1 in the Supplement), starting at 08:00 and 12:00 UTC, respectively. Each circuit comprised three vertical spirals from 200 to 1800 m altitude approximately. The interpretation of these airborne observations in combination with ground-based and in situ data is discussed in Barnaba et al. (2022).
Whole air samples for VOCs and their carbon isotope ratios were collected at the ground in evacuated canisters to determine a representative VOC fingerprint for Rome and Milan. To account for emission variations on the ground during the day, air samples were taken around 09:00 to 10:00 and 14:00 LT.
3.6.2 Flight region 2: London and central Europe
Flight region 2 was selected to study the London and BNL/Ruhr outflows with a scientific focus on their transport and interaction over central Europe. As mentioned in Sect. 3.4, July 2017 had an unsettled weather in the UK and central Europe with heavy, persistent rain at times and only brief hot spells. This made the selection of optimal flight tracks for this investigation challenging. The precise flight region 2 was tailored for the meteorological conditions prevailing during the E-EU-05, and E-EU-08 flights, which took place on 17 and 26 July 2017, respectively, to optimally cover different aspects of the target outflows.
Flight E-EU-05 (Sect. S9 in the Supplement, Table S9.2 and Fig. S9.3) took advantage of a short high-pressure ridge that formed behind a trough over Scandinavia on 17 July 2017. The outflow of the London MPC was predicted to travel to the English Channel and the northern coast of France. This area is regularly used by the UK and French air forces whose activities in the SUAs constrained the original flight options and the flight track were optimised during the flight route. Over the area of interest, HALO flew at different altitudes within the PBL. On the way back to OP, the outflow of Paris was probed south of Orly. On that day, the FAAM platform carried out two complementary circuits around London at 08:00 and 13:30 UTC.
On 26 July 2017, the synoptic situation changed slightly as a cut-off low moved eastwards over Germany while a trough approached from the west. In the period after the cut-off low and before the passage of the warm front over London, the route of E-EU-08 was chosen such that the outflow of London close to the east coast of England and its mixing with the BNL/Ruhr outflow over the European continent were probed (see Fig. 7). Cloudy conditions predominated throughout the day. This flight is studied in more detail in Sect. 4.3.
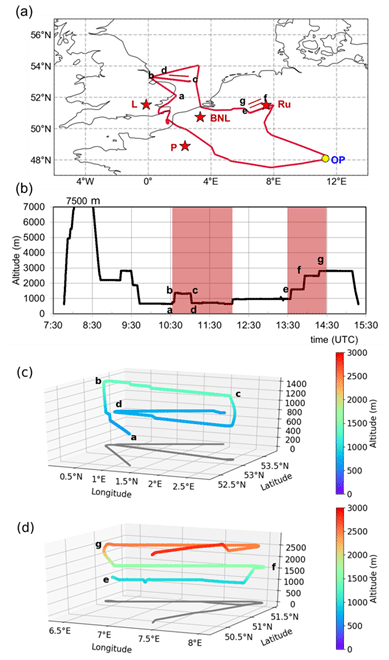
Figure 7Details of the E-EU-08 flight on the 26 July 2017. The position of the shuttles downwind from London and the BNL/Ruhr area are indicated in red on the map in panel (a), marked by the red-shaded areas in panel (b), and as a 3-D depiction in panels (c) and (d). The flight tracks during the shuttles are shown in panels (c) and (d) in grey. In panel (a), the EMeRGe MPC targets are shown in red, and the flight track is coloured as in Fig. 4. Main changes in course and altitude are marked as a–g on the graphs for reference. OP indicates the position of the HALO base.
The identification of the London outflow was confirmed by the on-board measurement of a PFC tracer released in the centre of London for both flights. During E-EU-08, a second tracer release was carried out in Wuppertal in the afternoon to identify the BNL/Ruhr outflow. In addition, information on the isotopic fingerprints in VOCs representative for London and Ruhr MPC air were obtained by collecting whole air samples at the tracer release sites before, during and after the release, and in the afternoon (see Sect. 4.5).
The E-EU-04 flight track on 13 July 2017 is a particular case that also covered central Europe (see Sect. S9, Table S9.3 and Fig. S9.5). The first part of the flight was dedicated to the blind instrumental intercomparison between the HALO and FAAM platforms described in Sect. S7 in the Supplement (see Schumann, 2020). A weak high-pressure ridge over Germany dominated. The main objective for the rest of the flight was to probe intercontinental pollution transport between 5000 and 7000 m altitude with signatures of fires originating in Canada.
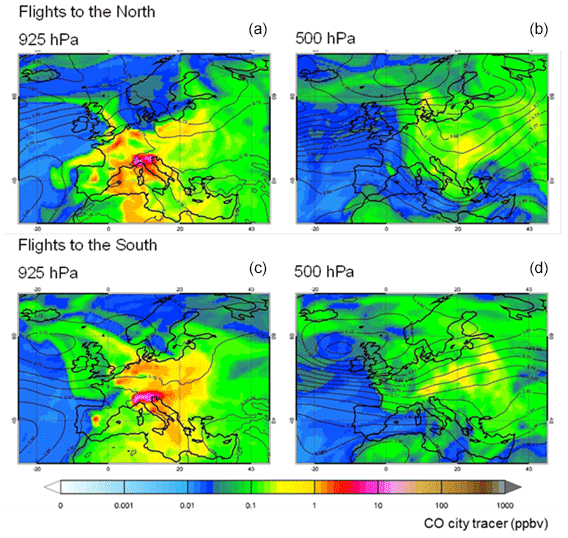
Figure 8Coloured shadings of composite averages of CAMS global city tracer forecasts of CO (ppbv) at 925 hPa (a, c) and 500 hPa (b, d) and 12:00 UTC for days of flights to the north (E-EU-05, E-EU-08, a–b) and south (E-EU-03, E-EU-06, E-EU-07, E-EU-09, c–d) of Europe. Black contours show corresponding averages of geopotential height (km) from the ECMWF Integrated Forecasting System (IFS).
3.6.3 Flight region 3: southwestern Europe
The objective of flight region 3 was to investigate the transport of southern European MPC outflows into the Western Mediterranean. This flight region was selected for the E-EU-07 and E-EU-09 flights on the 24 and 28 July 2017, respectively. The meteorological situation on 24 July 2017 over Europe was characterised by the eastwards displacement of a cut-off low leaving the British Isles. This was associated with a southwest flow during the passage of a trough over Spain and France. Dust transport from northern Africa, thunderstorms in the Po Valley, and fires on the southern Mediterranean coast of France and Corsica prevailed. The E-EU-07 flight track crossed the Po Valley and focused on the measurement of the predicted outflow of pollution from southern France and Barcelona into the Mediterranean. Three shuttle flight patterns downwind from Marseille, Barcelona, and close to the western coast of Sardinia were carried out (see Sect. 9; Table S9.4, Fig. S9.6).
On 28 July 2017, a short wave trough with a weak cold front passed over France. This situation led to a prevailing westerly flow and suitable conditions for the E-EU-09 flight over southern Europe. Two shuttle flight patterns were carried out downwind of Marseille and Barcelona. Features of interest during this flight were the transport of the Madrid and Barcelona outflows in stratified layers into the Mediterranean and the transport of forest fire emissions originating in southern France and Portugal. This is described in more detail in Sect. 4.3.
Further details on all the flight tracks and shuttles are given in the Supplement (Sect. S9).
3.7 Model-predicted pollution transport patterns
CAMS global model data (see Sect. 3.1 in the Supplement for the model description) are used here to identify and characterise prominent pollution transport patterns during the EMeRGe IOP over Europe. Figures 8 to 10 show composite average maps of CAMS global forecasts at 12:00 UTC for the EMeRGe flights to the north (flight region 2: E-EU-05 and E-EU-08) and to the south of Europe (Flight regions 1 and 3: E-EU-03, E-EU-06, E-EU-07, and E-EU-09; see Fig. 4 and Table 3 for description). A division into southwards and northwards flights is meaningful, as pollution transport patterns during individual flights in the two subgroups mainly resemble each other. Comparison of the CO city tracer simulations at 925 and 500 hPa (see Fig. 8) indicates that the largest part of the anthropogenic MPC emissions remained close to the surface within the PBL. The emissions from the MPCs in the north (e.g. London, Paris) were frequently transported eastwards due to the dominant west–southwesterly winds (Fig. 8, top left). Emissions from MPCs south of the polar front, such as Madrid, rather remained in the proximity of the emission sources due to variable weak winds (Fig. 8, bottom left). Emissions from the highly polluted Po Valley were often transported to the northeast and lifted over the high mountains of the Alps (Fig. 8, bottom right).
During flights towards the south, higher temperatures, and dry conditions in southern Europe favoured O3 production and smog events (Fig. 10, bottom left). These meteorological conditions supported the propagation of multiple and mostly intentionally started fires in the Mediterranean area. Average fire radiative power observed by MODIS (MODerate resolution Imaging Spectroradiometer, http://modis-fire.umd.edu/, last access: 3 November 2019) and assimilated within CAMS global forecasts over Europe in July 2017 is included in the Supplement (Fig. S10). Fire hotspots are visible around the Mediterranean and in Portugal. Further evaluation of the CAMS simulations shows that CO emitted by fires around the Mediterranean mainly remained below approximately 700 hPa. In contrast, CO resulting from the LRT of North American fire emissions was observed around 500–700 hPa over Europe. The average fields show that CO from North American fires was expected to be more pronounced during flights to the north (see Fig. 9) than to the south (see Fig. 10) with a maximum in the average fields over Great Britain.
The stratospheric O3 tracer indicates that stratospheric intrusions concurred with LRT of North American fire emissions initially lofted by warm conveyor belts or deep convection. Dry air masses rich in O3 were transported downwards to comparably low altitudes. In the average fields of stratospheric O3 for flights towards the north (see Fig. 9, bottom right), a stratospheric intrusion over Europe stretches broadly from southern Greece and southern Italy to the northeast. The latter is associated with the cut-off low which developed on 20 July 2017 over UK and dominated the weather conditions over Europe for approximately 1 week.
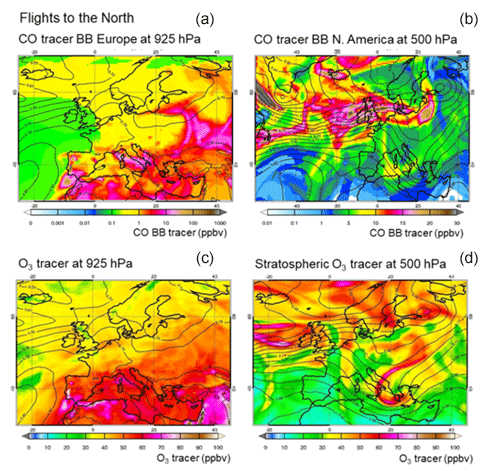
Figure 9Coloured shadings of composite averages of CAMS global forecasts at 12:00 UTC for flights to the north (E-EU-05, E-EU-08): BB CO tracer (ppbv) from Europe at 925 hPa (a) and from North America at 500 hPa (b); O3 (ppbv) at 925 hPa (c) and stratospheric ozone tracer (ppbv) at 500 hPa (d). Black contours show averages of geopotential height (km) from ECMWF IFS. Note the different scales. The BB tracer from North America (b) is shown on a larger map than the other CAMS forecasts in this image.
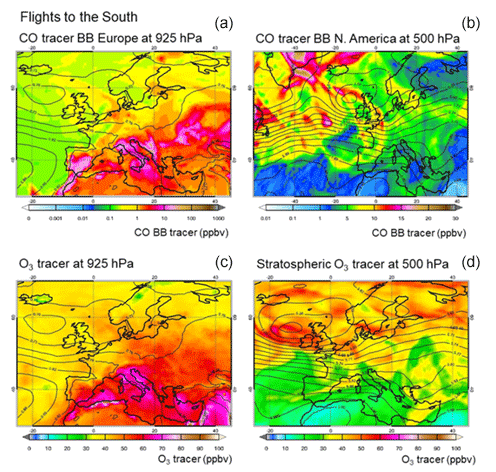
Figure 10Coloured shadings of composite averages of CAMS global forecasts as in Fig. 9 but for flights to the south (E-EU-03, E-EU-06, E-EU-07, and E-EU-09). Note that the BB tracer from North America (a) is shown on a larger map than the other CAMS forecasts in this image.
The EMeRGe campaign in Europe focused on the identification and measurement of plumes of pollution from selected MPCs, i.e. their emissions, transport, and transformation. EMeRGe achieved its measurement objectives by exploiting the unique capabilities of the HALO research platform to probe these plumes over a relatively large geographical coverage and by the use of forecasting models and tools. The analysis and publication of EMeRGe results is expected to provide new insights into the transport and transformation of pollution plumes over Europe during the IOP in July 2017. In that respect, general findings are summarised in the following sections, concerning observations, identification and mixing of the plumes and outflows, and photochemical processing of the air masses encountered.
4.1 Observations
EMeRGe provides a unique set of in situ and remote sensing airborne measurements of trace gases and aerosol particles along flight routes and regions in the lower troposphere over Europe. The use of collocated ground-based and satellite measurements facilitates the interpretation of the HALO measurements during the EMeRGe IOP in Europe. In that respect, EMeRGe enhances previous pollution studies in Europe by adding an extensive experimental data set in the PBL. The composition of the sampled air masses is highly variable throughout the flights, which cover large geographical areas of heterogeneous topography, under different solar insolation conditions and proximity to pollution sources. To illustrate this variability, average, median, and quartiles values of selected species measured during the EMeRGe flights are included in the Supplement (Sect. S11, Table S11.1).
Pollution hotspots were identified by using the spatial distribution of trace gases and aerosol particles observed over the flight tracks. A detailed analysis of the complexity of the air masses measured and the variations encountered in individual flights is beyond the scope of the present work and will be presented in dedicated publications. Figure 11 shows as an example the CO, NO, O3, CH3COCH3, CH4, and the organic aerosol mass concentrations measured during the EMeRGe flights in Europe. CO as well as total reactive nitrogen (NOy) and its most reactive forms (NO and NO2) are key species in the identification of anthropogenic pollution. As can be seen in the figure, the highest NO concentrations were found in the vicinity and downwind of major pollution sources like London, the BNL/Ruhr region, and the Po Valley. The Alps and Apennines on the Italian Peninsula lead to the transport of the Po Valley outflow southwards along the Italian Adriatic coast which is the geographic opening of the Po Valley (Finardi et al., 2014). High NO concentrations are indicative of recent or “fresh” anthropogenic emissions. The NOy lifetime of a few days enables a more reliable identification of aged polluted air masses further out from the source regions. Maximum NOy values as large as 12 ppbv (not shown) were measured over Europe. Elevated CO and NOy accompanied by low NO, as measured in the proximity of Barcelona, indicate the processing of the pollution plumes sampled. Emission hotspots can be hardly identified in the spatial distribution of O3 as expected from its non-linear secondary formation. Maximum O3 mixing ratios were generally observed at a distance downwind of MPCs. Organic aerosol has strong anthropogenic sources such as combustion (traffic, fossil fuel combustion, industrial activity, BB) and showed similar behaviour to CO and NO, in that larger mass concentrations were closer in time and space to MPCs such as London, Po Valley, and BNL. The lifetime of aerosol particles in the PBL is on the order of a few days, which explains the high variability observed. Additionally, aerosol particle concentrations presented a strong gradient above the PBL (see Fig. 12).
Signatures of urban sources of long-lived greenhouse gases like CH4 and CO2 were identified in the airborne measurements close to the MPC regions in Europe. The identification of plumes of GHG and the quantification of the MPC contributions to the regional GHG budget are challenging. This is caused by the long lifetime of these gases which yields a well-mixed and large atmospheric background. As can be seen in Fig. 11, the highest and most distinctive CH4 mixing ratios in the PBL were encountered in the Po Valley (up to 2.4 ppm), downwind of London, and across the BNL/Ruhr region (up to 2 ppm). Slightly lower mixing ratios were detected downwind of Barcelona (up to 1.94 ppm). The CH4 mixing ratios were higher than the global mean ground level mixing ratio of around 1.85 ppm for July 2017. At large downwind distances from the MPC regions, the CH4 emissions are diluted and/or mixed with pollution from surrounding sources. Although the contribution of BB emissions to total global anthropogenic CH4 is on the order of a few percent (Saunois et al., 2020), mixing ratios of CH4 comparable to those in urban plumes were occasionally measured in BB events that strongly influenced the local GHG distribution, as during E-EU-07 (not shown). For the assignment of the GHG enhancements to their source region, supporting model simulations and complementary measurements of shorter-lived species with smaller background concentrations and thus better signal-to-background ratios are therefore needed (Klausner, 2020).

Figure 11Mixing ratios of CO NO, O3, CH3COCH3, CH4, and organic aerosol mass concentrations measured along all EMeRGe flights in Europe. To increase colour contrast, 50 ppbv has been set as lower limit for CO, and 0.3 and 80 ppbv as upper limit for NO and O3, respectively. These limits are representative for more than 95 % of all measurements. CH4 mixing ratios are maximum values in 0.05×0.05∘ bins as in Klausner (2020). Organic aerosol mass concentrations are plotted for the original time resolution of 30 s and 8 µg m−3 were set as the upper limit. Note that mixing ratios measured at different altitudes in the shuttle areas are not distinguishable in the figure.
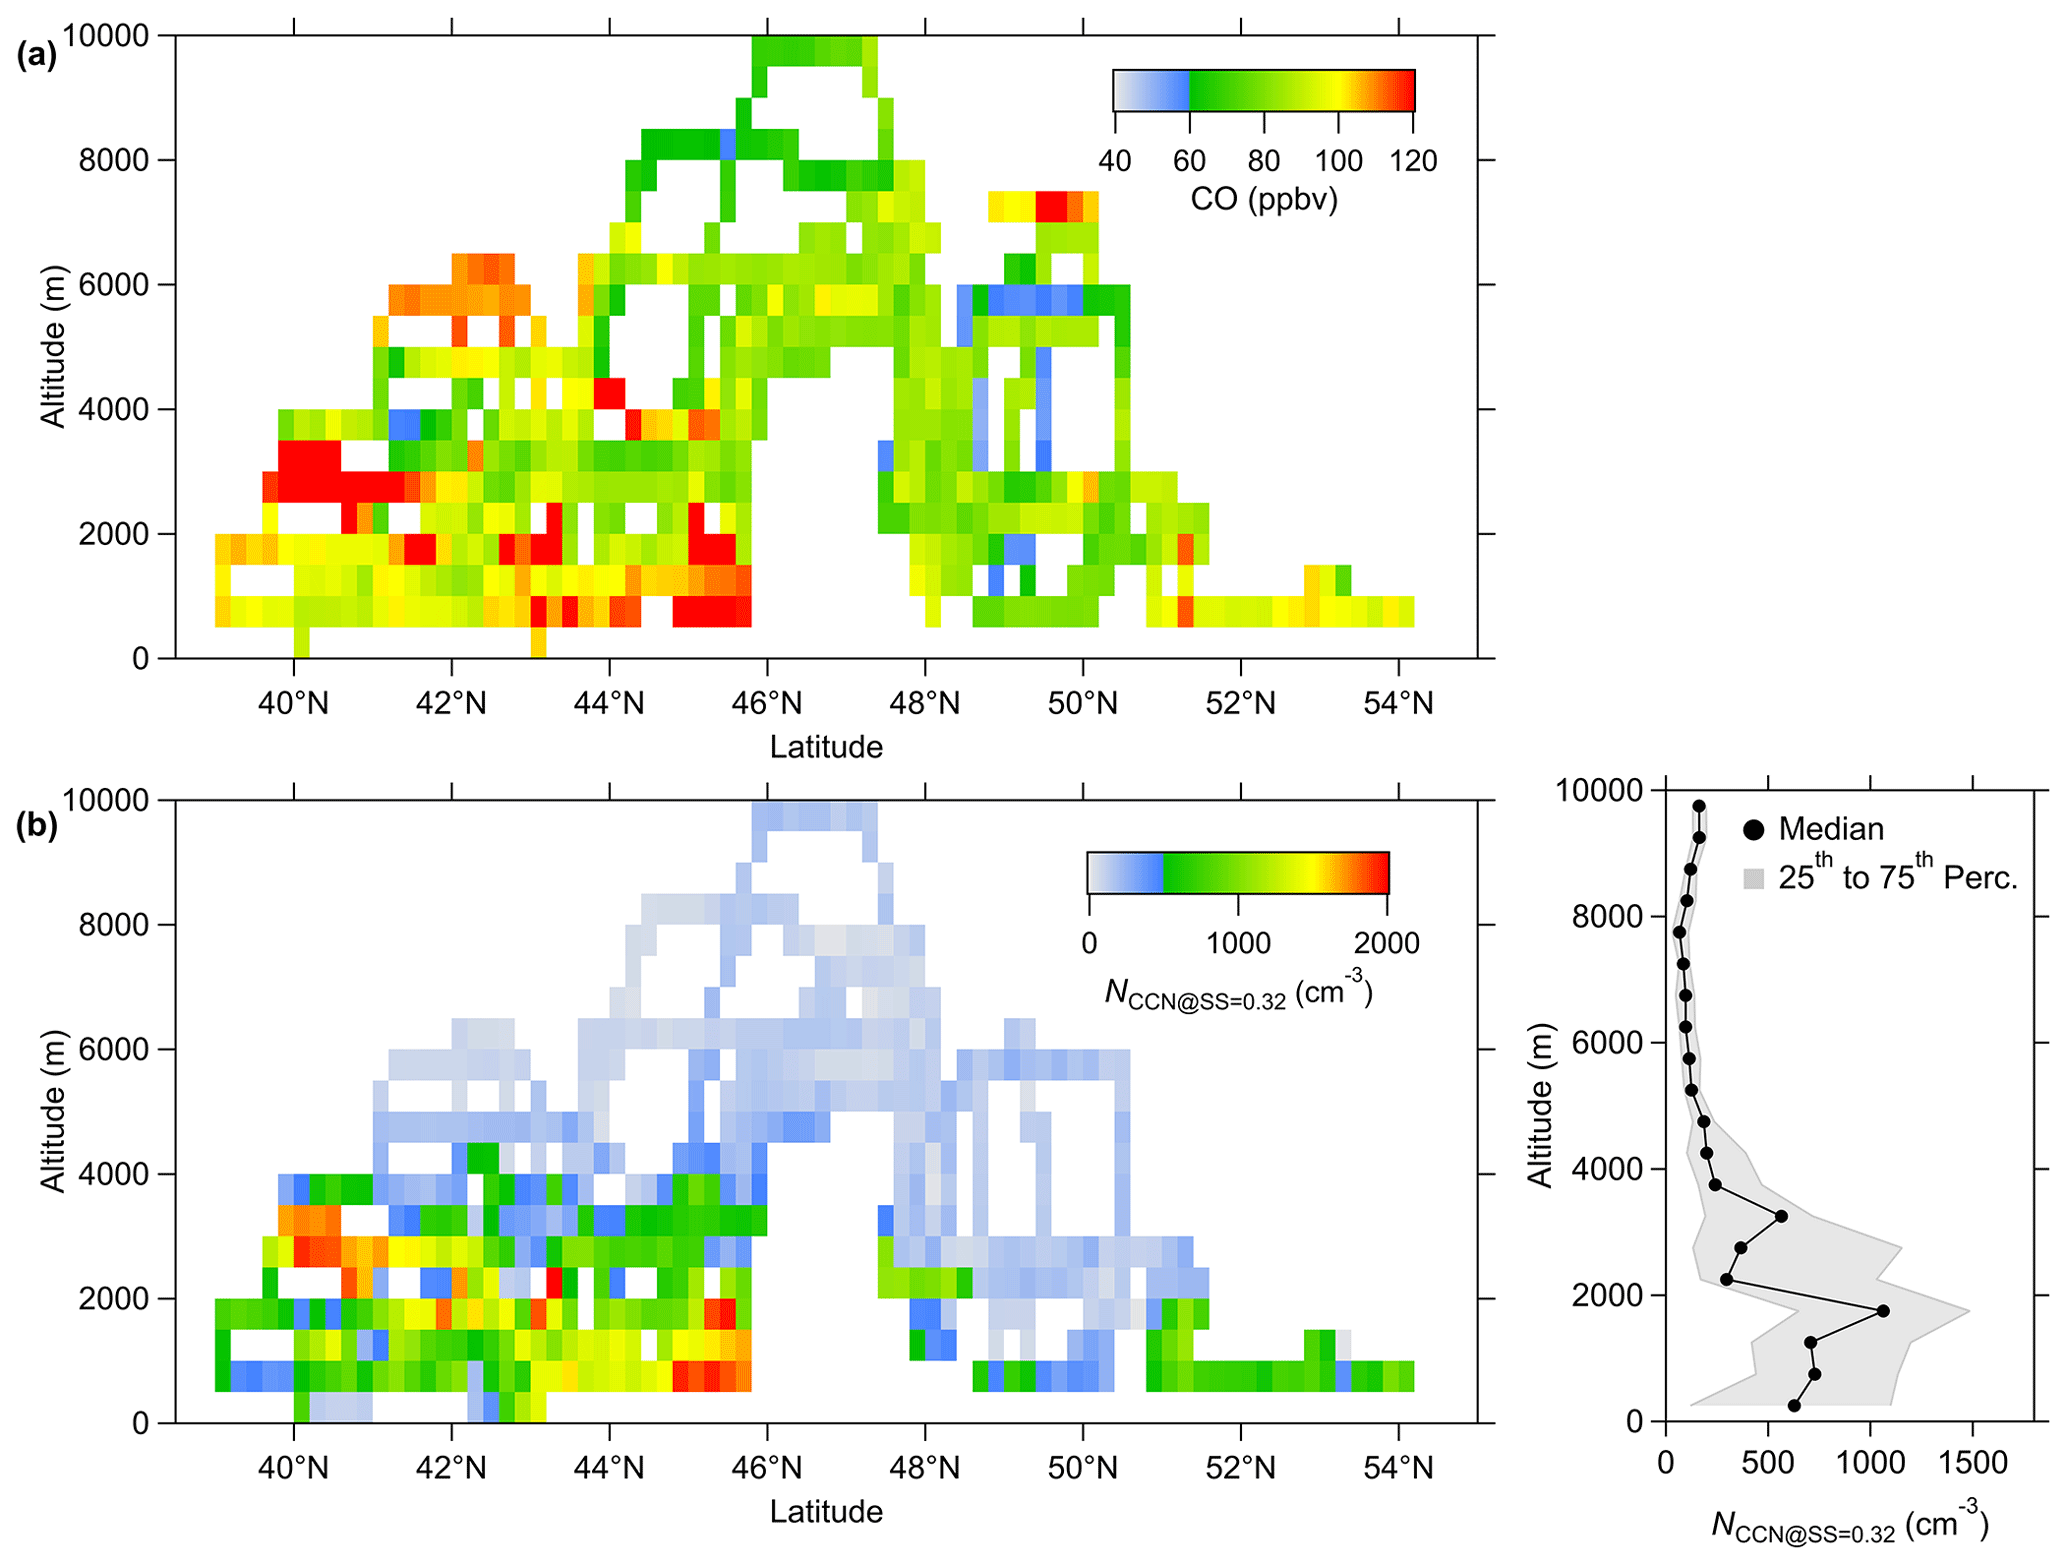
Figure 12Vertical and latitudinal distribution observed during the EMeRGe IOP of (a) CO mixing ratios and (b) CCN number concentration at a supersaturation (S) of 0.32 % (except for E-EU-04, due to instrumental failure). The CCN curtain plot on the bottom left is made with latitude- (0.2∘) and altitude-binned (500 m) CCN number concentrations. On the right, the median vertical NCCN(S=0.32 %) profile is represented by a solid black line and the interquartile range by a grey-shaded area. CCN data are standard temperature and pressure (STP) corrected.
Interestingly, the HONO detected in the moderately polluted upper boundary layer (several 100 ppt) and in the lower free troposphere (several 10 ppt) often exceeded mixing ratios expected from known gas-phase reactions as indicated by comparisons with model simulations. Potential mechanisms for the heterogeneous HONO formation are explored using theoretical studies in combination with the gas-phase, aerosol composition, and radiation observations. These measurements indicate that additional HONO is likely formed by a suite of different heterogeneous processes in the residual layer and lower free troposphere, in agreement with many near-surface observations in the polluted environment. This additional HONO may contribute significantly to the oxidation capacity of these polluted air masses.
Elevated concentrations of pollutants were typically observed below the top of the BL and occasionally after being transported over long distances. Curtain maps showing the latitudinal and vertical distributions of selected species supported the classification of the air masses, especially in the lower 2000 m of the troposphere. Differences observed north and south of the Alps are, e.g. evident in Fig. 12, showing a reasonable agreement in the geospatial distribution of the CCN and CO which has previously been documented as a nearly linear relationship within the PBL by Pöhlker et al. (2016, 2018). CO is a good tracer for relatively fresh combustion (e.g. Andreae, 2019). The CO emitted by open BB exceeds concentrations from anthropogenic sources. Thus, the good agreement between CCN and CO in the lower troposphere for the peak concentrations (colour coded in red in Fig. 12) implies BB to be the source of CCN. Observations of elevated CO not related to increases in CCN indicate aerosol removal by cloud processing (e.g. Fig. 12 above 4000 m between 41 and 44∘ N).
The vertical and latitudinal distribution of the CCN number concentration (NCCN) showed a strong vertical gradient. Generally, NCCN was highest in and above the PBL, up to ∼ 2000 m a.s.l. The NCCN depends strongly on the particular air mass, its photochemical history and the source of pollution as shown in Fig. 12b. In northern Europe, from 50 to 55∘ N, NCCN up to 1200 cm−3 were measured in the London outflow over the North Sea and over the BNL/Ruhr region. Below 46∘ N, NCCN often exceeded 1500 cm−3 above the MPC in the Po Valley, Rome, Marseille and Barcelona, the highest concentrations being observed in the Po Valley. An interesting observation was the distinct layer of BB smoke measured above the PBL between 2000 and 3500 m altitude, close to Marseille and Barcelona (40 to 42∘ N). The high NCCN due to BB are episodic in nature, whereas the CCN emissions from anthropogenic activity are produced daily with probably a weekend modulation. The vertical profile in Fig. 12b is a composite of all data but clearly shows that altitudes below 2000 m have the highest NCCN. The increased values between 2000 and 4000 m are associated with air masses, which either come from Po Valley air being lifted up the Alps (e.g. Diemoz et al., 2019a, b) or from BB events upwind flowing into the Mediterranean.
4.2 Identification, classification, and characteristics of pollution plumes
Anthropogenic and biogenic signatures were identified in the pollution plumes by using enhancements in the concentration of selected species, such as CO, NOy, and VOCs measured aboard HALO. Measured large pollution plume events were initially categorised into (a) anthropogenic pollution (AP), (b) biomass burning (BB), (c) mixed, and (d) biogenic plumes, by using enhancements of CH3CN, C6H6 and C5H8 over 184, 49, and 85 ppt thresholds, respectively. These thresholds take into consideration three times the instrumental noise over the limit of detection (LOD) or the individual atmospheric background values. Anthropogenic polluted air masses were, e.g. identified by the enhancements of C6H6 and absence of CH3CN in contrast with the unpolluted background air measured in the absence of both chemical tracers. Similarly, CH3CN enhanced plumes in the absence of C6H6 were identified as pure or aged BB events (see Sect. S12 in the Supplement for details). Figure 13 illustrates the result of applying this procedure to flight E-EU-08 on 26 July 2017, which investigated the London and BNL/Ruhr MPC outflows (see Sect. 4.3).
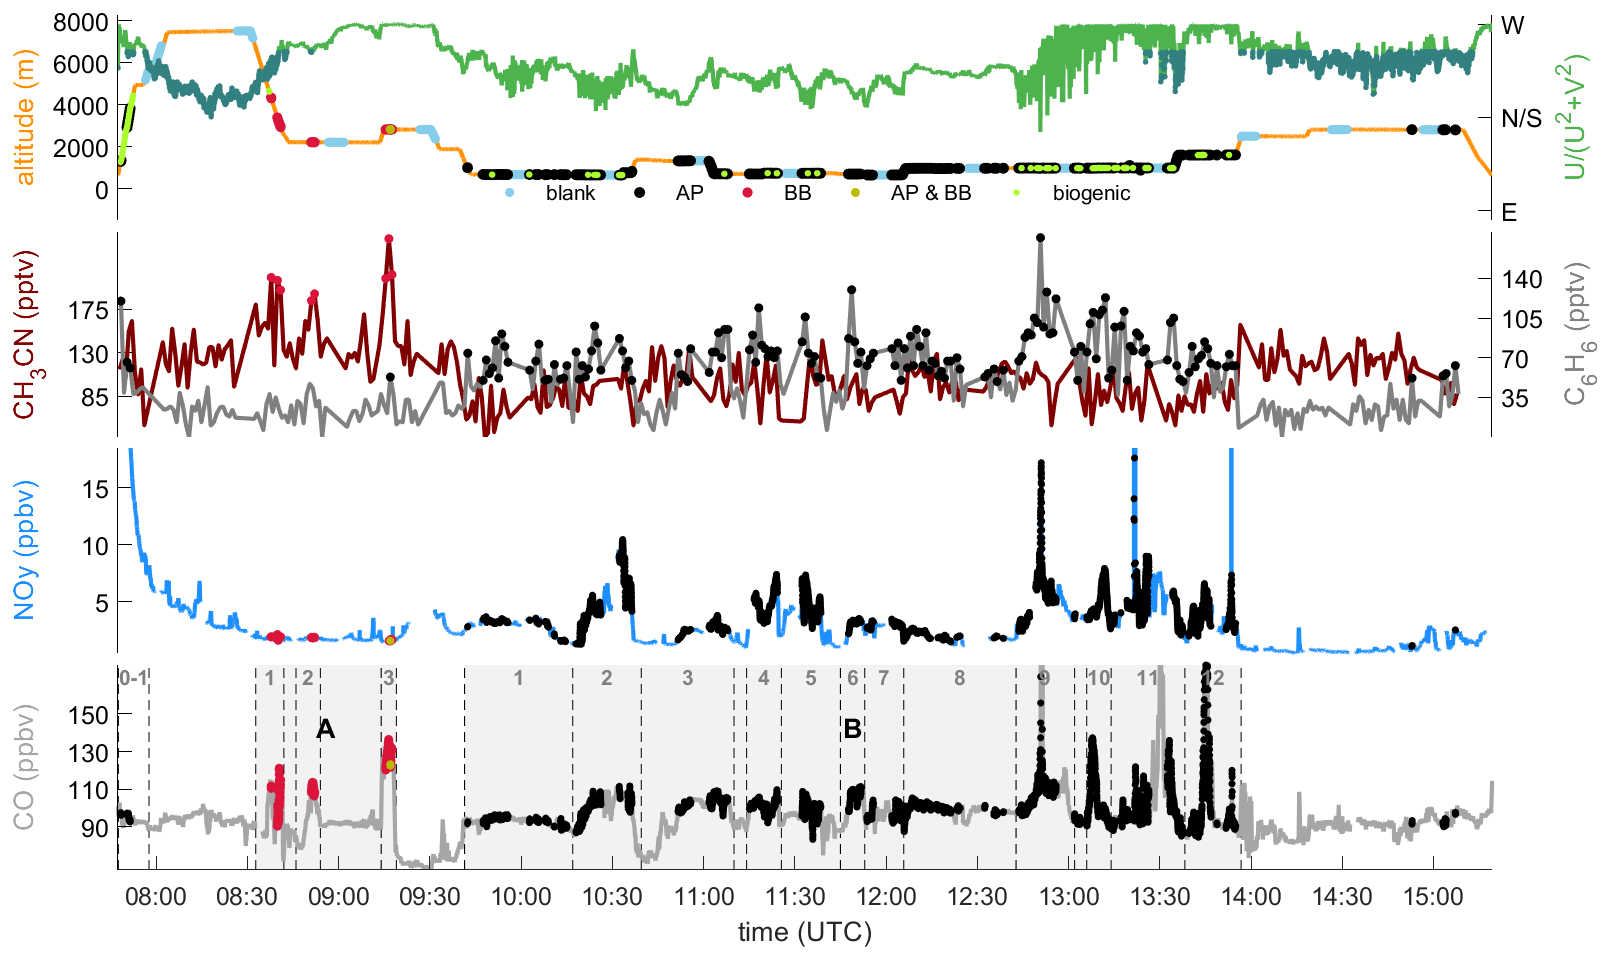
Figure 13Time series for E-EU-08 on the 26 July 2017 used for the categorisation of plumes based on VOC measurements: altitude, wind direction, CH3CN, C6H6, and NOy as refinement. The wind direction (green line and axis) is given as ), −1 is east wind (E), +1 is west wind (W), values around zero have north or south components (N/S). South components are marked with dark green colour. Altitude (brown line, top panel) is colour coded in green during C5H8 enhancements, in red during CH3CN enhancements, in black during C6H6 enhancements, and in dark red during both CH3CN and C6H6 enhancements. Additionally, blue colour-coded blank measurements of CH3CN, C6H6, and C5H8 are given. In the bottom panel, final numbering of structures and plumes according to concentration enhancements are shown for CO. Colour-coding indicates CH3CN enhancements (red), C6H6 enhancements (black), and both CH3CN and C6H6 enhancements (brown).
The anthropogenic polluted air measured during the EMeRGe IOP presented distinctive features in contrast to background air in Europe.
First of all, the maximum concentrations of trace gases and aerosol species of anthropogenic origin were typically measured below 2000 m. As an example, Fig. 14 shows median vertical distributions of observed major primary and secondary VOCs. Longer-lived VOCs were, as expected, well mixed in the troposphere and those with anthropogenic sources showed higher variability and highest mixing ratios below 2000 m. Benzene (C6H6) and toluene (C7H8) are primarily of anthropogenic origin. HCHO and acetaldehyde (C2H4O) have anthropogenic BB and significant biogenic sources. They are also generated downwind by the oxidation of transported VOCs. These species have a short lifetime as they are oxidised quickly in the lower layers of the troposphere. As a result, the concentrations observed above 2000 m were close to the LOD. The same is true for isoprene (C5H8) and xylene (C8H10) which have lifetimes on the order of some hours.
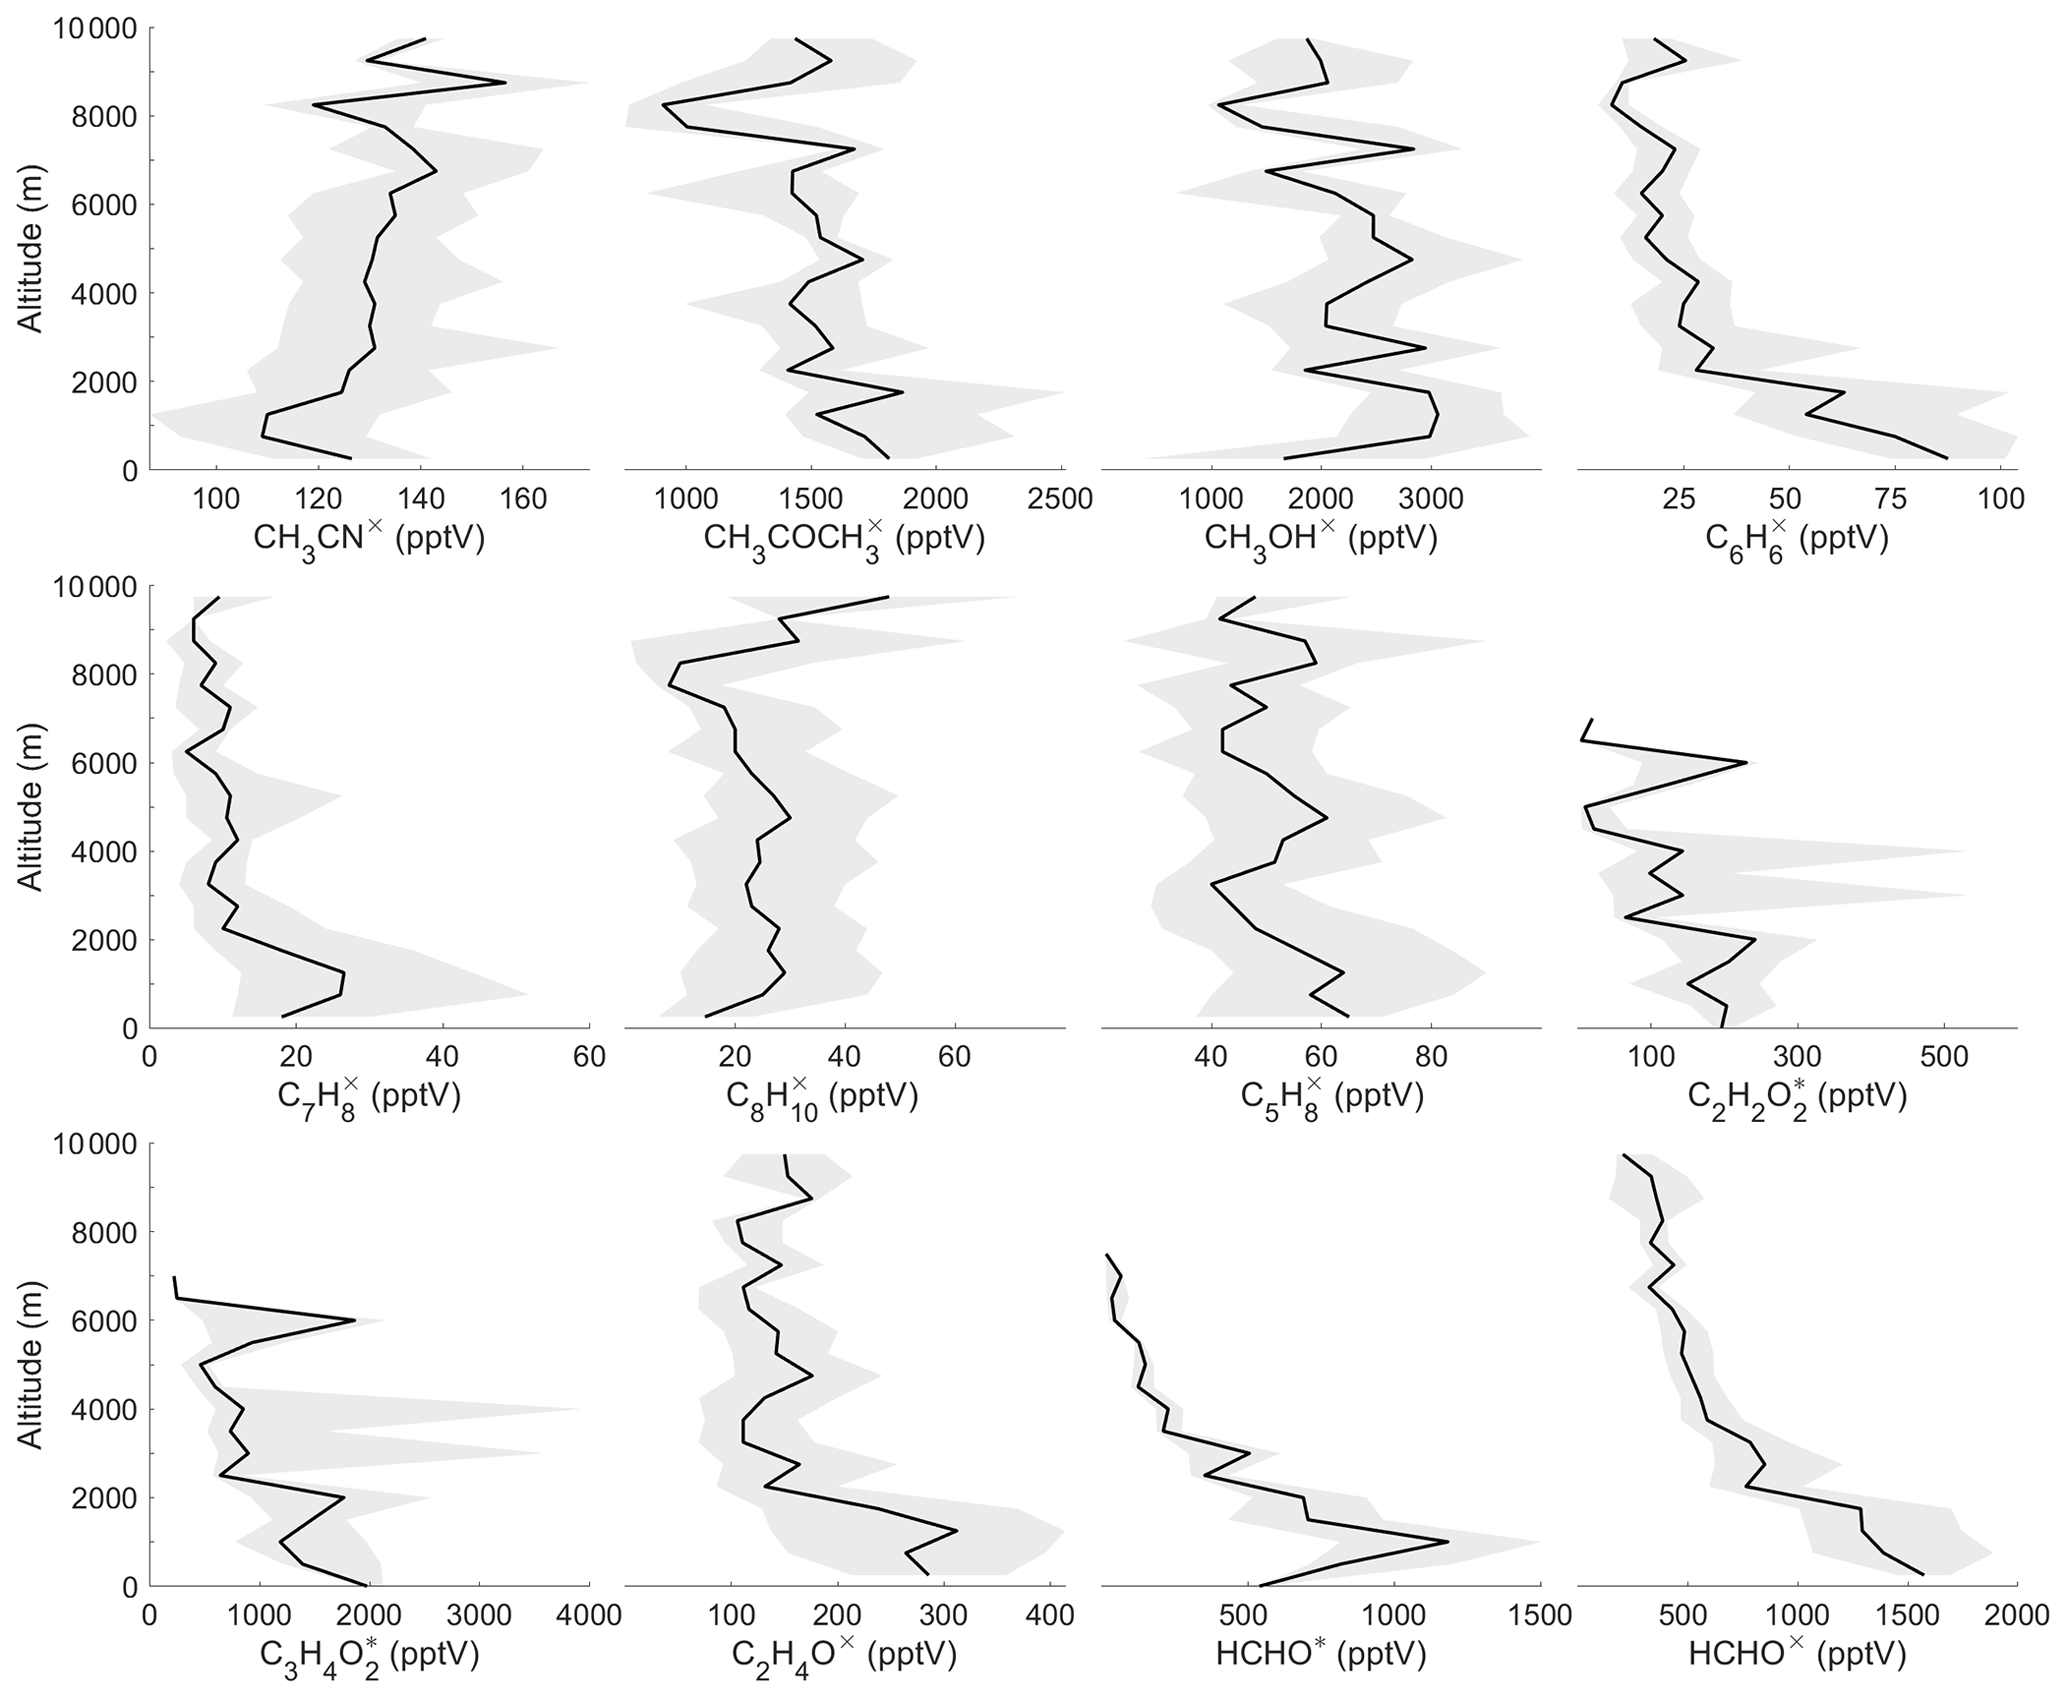
Figure 14Variation of VOC versus altitude measured by the HKMS (labelled with x) and the miniDOAS (labelled with ∗) instruments during EMeRGe over Europe. Shaded areas are the quartiles; solid lines represent median concentrations.
This vertical distribution is not as evident in glyoxal (C2H2O2) and methylglyoxal (C3H4O2) which result from the oxidation of C5H8 and BB. C2H2O2 is also an oxidation product of acetylene (C2H2) which is of anthropogenic origin. Methylglyoxal is produced in the oxidation of CH3COCH3, which is thought to have a dominant biogenic source (Andreae, 2019; Wennberg et al., 2018). Both gases are also formed during the oxidation of other VOCs, particularly alkenes, aromatics, and monoterpenes (Myriokefalitakis et al., 2008; Fu et al., 2008; Taraborrelli et al., 2021) and are present both as primary or secondary pollutants during BB events (e.g. Vrekoussis et al., 2009; Alvarado et al., 2020).
Acetonitrile (CH3CN) and acetone (CH3COCH3) are typically well mixed in the troposphere due to their longer lifetimes, which are on the order of months. The increase of median CH3CN with altitude identifies the LRT of BB emissions from North America and the local transport of BB events in Europe.
During EMeRGe, HCHO was measured by the in situ HKMS and the miniDOAS remote sensing instruments (see Table 2). These instruments probed slightly different air masses due their instrument characteristics (for averaging kernel of the miniDOAS instrument see Sect. S11 in the Supplement), and did not operated at strictly the same data rate and for the same times. For example, unlike HKMS, miniDOAS did not probe the polluted air masses during aircraft ascent and descent from OP. Despite differences in sampling volume, rate, and time, the instrument-specific average vertical distribution of HCHO measured aboard HALO by both instruments illustrates in a similar manner the differences in trace gas concentrations encountered in polluted and background air during the EMeRGe IOP (see Fig. 15). In the air masses classified as polluted, the HCHO results from direct emission and oxidation of VOC precursors and is discernibly higher than the lower boundary of the measurements. The HCHO in the less polluted or background air in Europe is then attributed to be predominantly released from CH4 oxidation.
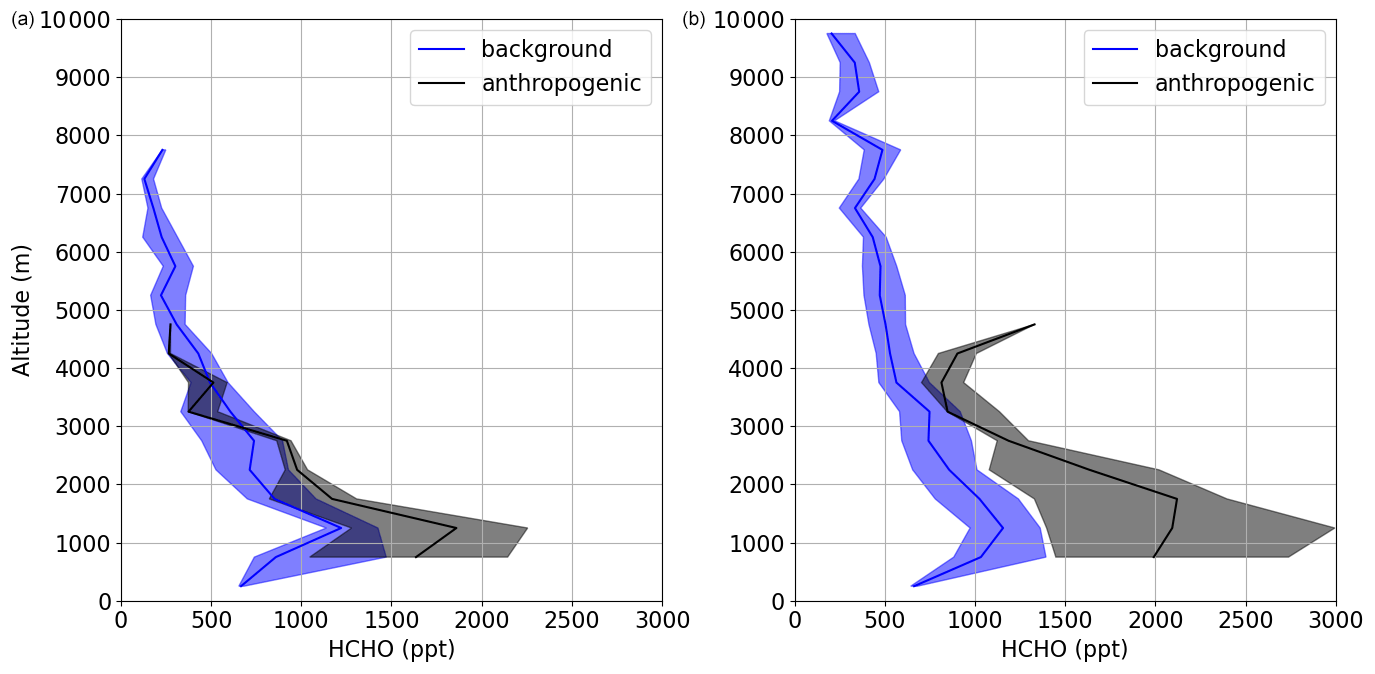
Figure 15Vertical profiles of HCHO (miniDOAS, a; HKMS, b) for pure anthropogenic emissions (C6H6 enhancement in absence of CH3CN) and background air (in the absence of C6H6 and CH3CN). Shaded areas are the quartiles; solid lines represent median concentrations.
The HCHO mixing ratios measured during the IOP in Europe are consistent with previous remote sensing observations over Southeast Asia (Burrows et al., 1999) and North America in summer (Kluge et al., 2020; Chance et al., 2000; Dufour et al., 2009; Boeke et al. 2011; De Smedt et al., 2015; Kaiser et al., 2015; Chan Miller et al., 2017, and references therein). They are also in the same range as those measured in the Po Valley (Heckel et al., 2005). The HCHO mixing ratios observed in the PBL and middle troposphere during EMeRGe are somewhat lower than all summer North American mixing ratios previously measured (see Fig. 16). The emissions of HCHO and its VOC precursors have been reported in previous studies to be lower in Europe than in North America (e.g. Dufour et al., 2009; De Smedt et al., 2015). However, as several EMeRGe flight tracks were carried out far from emission sources over the North Sea and the Mediterranean, this difference might be related to a larger marine influence to the air masses analysed over Europe.
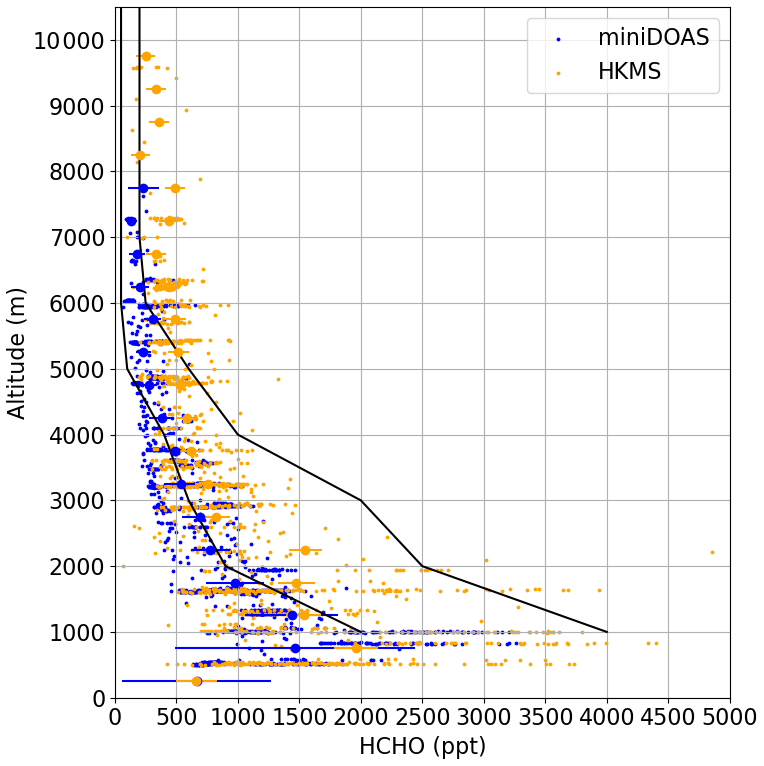
Figure 16HCHO measurements by the HKMS (in orange) and the miniDOAS instruments (in blue). Mean values (bigger dots) and the respective accuracies (horizontal bars) are also shown. The black lines indicate the range of previous HCHO measurements over North America in summer (Kluge et al., 2020). Note that HKMS and miniDOAS agree within their accuracies in spite of having different air sampling volumes, which did not perfectly overlap.
Concerning particle measurements, small particles in the diameter range 0.01 to 3 µm dominated inside pollution plumes. In the vertical distribution of the total aerosol number concentrations (Fig. 17a), the difference between anthropogenic and background air masses is more pronounced in the size range between 0.25 and 3 µm than in the size range between 0.01 and 3 µm. At altitudes below 4000 m the averaged total aerosol number concentrations show several maxima which are mainly caused by local pollution plumes. In contrast to all other profiles, there are two additional maxima in the number concentration compared to background aerosol for the size range 0.01 to 3 µm at around 6000 and 7500 m. These maxima are not apparent in the profiles of particle larger than 0.25 µm. The corresponding sequences can be associated with air masses from convective outflows giving rise to enhanced particle concentrations in the sub-100 nm size range.
Secondary organic aerosol (SOA) prevailed in the polluted air masses probed in Europe above 2000 m. In the free troposphere above 4000 m, the direct effect of anthropogenic emissions on the organic and inorganic aerosol components was observed to be small. The vertical profiles of the chemically resolved aerosol mass concentrations in Fig. 17b clearly show the enhanced concentrations in the anthropogenically influenced air masses compared to the background air masses. Differences in the median vertical profiles of the inorganic and organic aerosol (OA) suggest that organic aerosol in anthropogenic air masses is mainly formed by secondary processes. The OA maximum between 2000 and 4000 m observed in the anthropogenically influenced air masses can be explained by one particular measurement period above Spain during flight E-EU-09. The trajectory analysis shows an uplift and transport of anthropogenic influenced air masses from Madrid to the measurement location (see 4.3). Further possible reasons might be lower temperature leading to enhanced SOA formation in this altitude range but also a longer conversion time of VOCs to SOA in comparison to the conversion time for inorganic aerosol precursor gases. In contrast, the inorganic components of the aerosol, especially ammonium and sulfate ions, show a steady decrease in the anthropogenically influenced air masses until up to about 4000 m. Above that altitude, the difference between background and anthropogenic profiles becomes small for both organic and inorganic aerosol components. This is a very interesting finding, implying that the direct influence of anthropogenic emissions on the aerosol of the free troposphere over Europe is small.
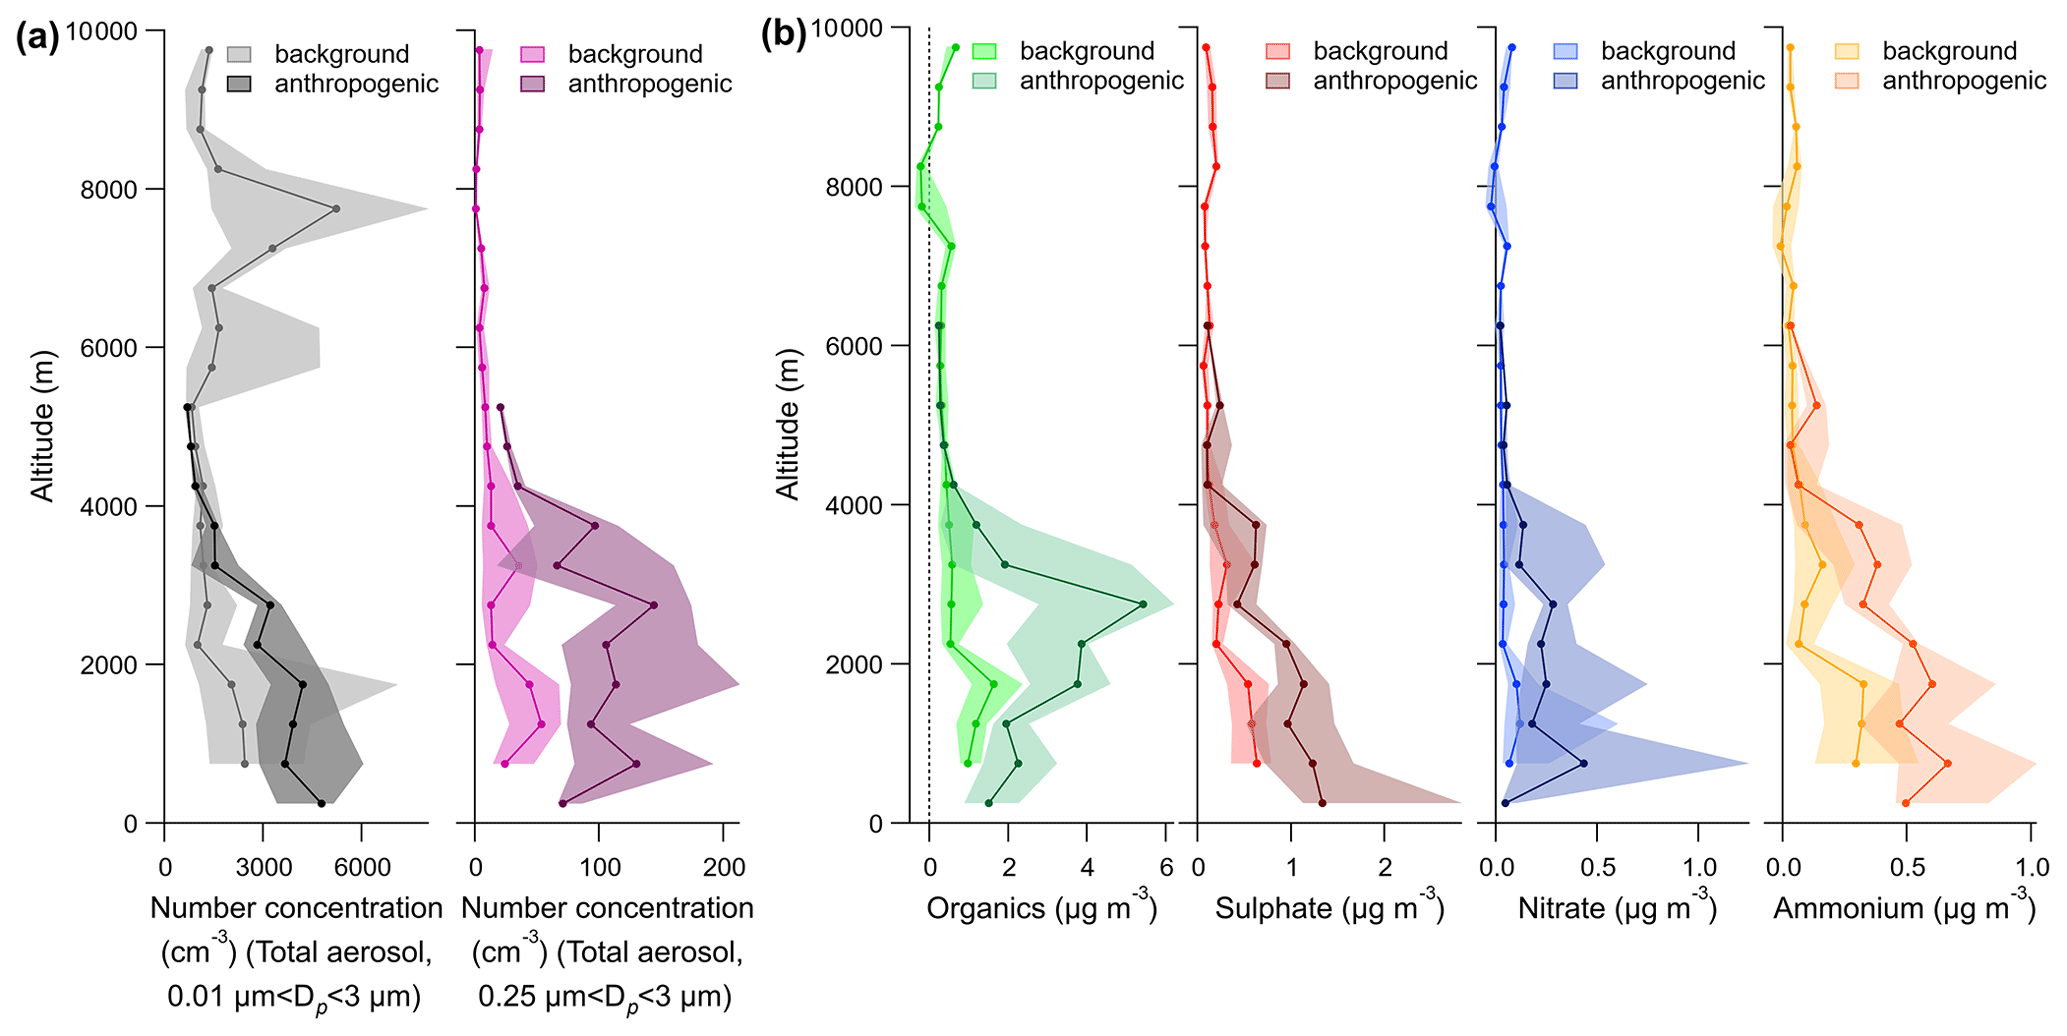
Figure 17As in Fig. 15 but for (a) total aerosol number concentrations for two different size ranges (0.01–3 and 0.25-3 µm) and (b) organic, sulfate, nitrate, and ammonium mass concentrations in the aerosol particles. The dots in the solid lines represent the medians averaged over altitude bins of 500 m, and the shaded areas are the quartiles.
4.3 Identification of MPC outflows
The identification of individual MPC sources was possible by using (a) enhancements in the concentration of selected atmospheric species, (b) backward trajectories and the last contact with PBL, (c) forward trajectories and calculation of the dispersion of MPC outflows, and (d) detection of released PFC tracers. Details about the plume identification and tagging approaches used during the EMeRGe IOP in Europe are given in the Supplement (Sect. S12).
MPCs were, as expected, identified as significant sources for reactive nitrogen species. The concentration of reactive nitrogen species within pollution plumes exceeded the background concentration by up to a factor of 10. With increasing distance to the MPC sources reactive nitrogen species were processed and finally removed from the atmosphere as indicated by correlations observed with CO.
MPC outflows not sampled by in situ instruments were identified during overpasses by the down-looking remote sensing instruments aboard HALO. Figure 18 shows HAIDI measurements at 8 km of the Milan outflow during E-EU-09. The measurements of HAIDI were used to estimate emissions and plume geometries, NO2 being an important target species. The HAIDI instrument has three scanning telescopes pointed at nadir, 45∘ forward and 45∘ backwards direction. On the left side of Fig. 18, the data from the nadir telescope scanner are shown at high spatial resolution (a pixel is approximately 400×400 m). The map shows a strong NO2 plume northeast of Milan. The plume substructures are also clearly visible. On the right side of the figure, the data from all three telescope scanners are plotted as a function of time at a lower spatial resolution. The time delay of about 80 s between the peak as seen in the forward and backward scanners indicates that this plume is close to the ground. Wind data from the lowest layer from the ECMWF ERA5 reanalysis product (Copernicus Climate Change Service, 2017) implied a wind angle of 293∘, which is consistent with this outflow from the urban area east of Milan. The low wind speed (0.6 m s−1), the complex plume shape, and the small relative angle between the HALO flight track and the plume direction might increase the uncertainty in the estimated NO2 emission rate of 607±67 kg d−1.
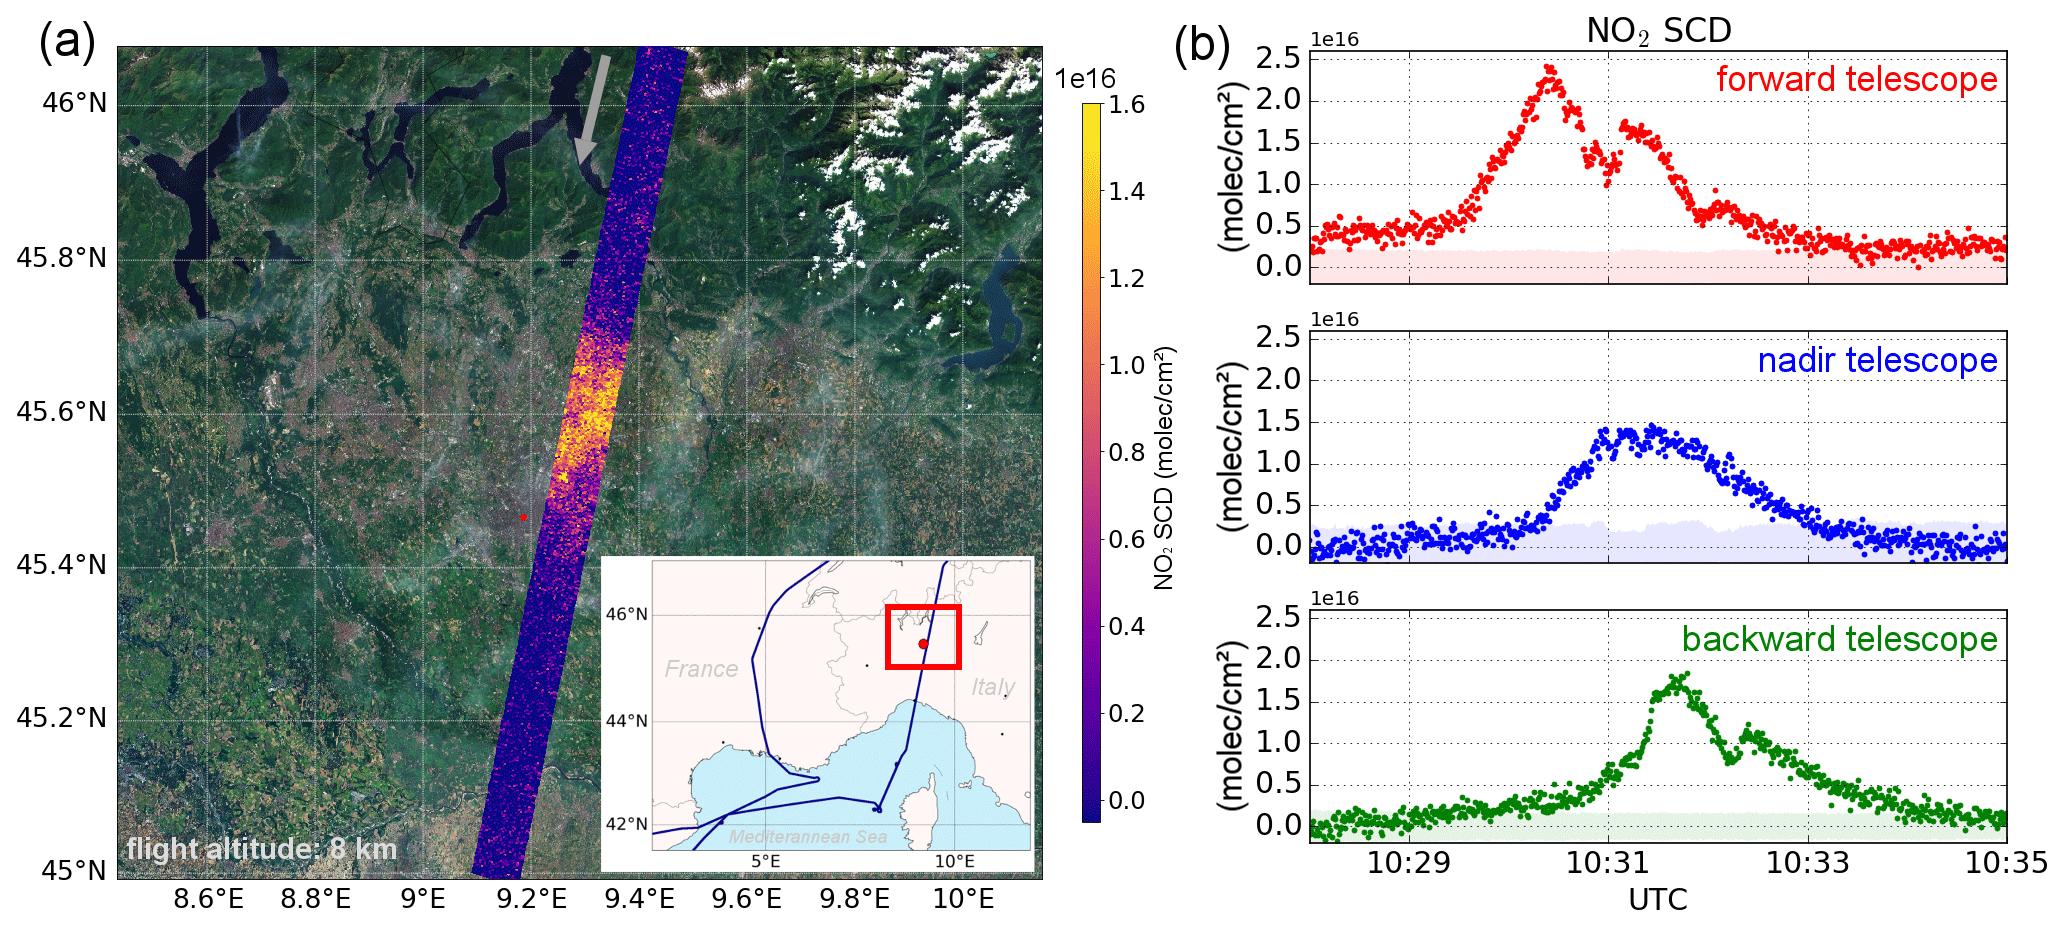
Figure 18HAIDI measurement at 8 km altitude of the Milan outflow during E-EU-09: (a) pixel-resolved NO2 slant column densities observed by the nadir camera (marked by the red square on the map). The grey arrow indicates the direction of the flight. An enhancement of up to 1.5×10¹⁶ molec cm−2 over the background is observed northeast of Milan (red-coloured circle), (b) NO2 slant column densities averaged over the whole swath for all three telescopes: forward (top) nadir (middle) and backward (bottom). The height of the plume centre is estimated from the time difference of the maxima. Sources of background imagery: ESRI, DigitalGlobe, GeoEye, i-cubed, USDAFSA, USGS, AEX, Getmapping, Aerogrid, IGN, IGP, swisstopo, and the GIS User Community.
Different ranges of δ13C values in VOCs were determined and attributed to MPC sources for the first time, e.g. for C6H6 in the Po Valley and Rome. Atmospheric residence times of the MPC plumes measured on board were retrieved from isotope measurements in VOC samples collected at MPC ground sites in London, Wuppertal, Milan, and Rome and aboard HALO. The vertical distribution of δ13C values in pentanal (C5H10O) and C6H6 are shown in Fig. 19, colour coded according to the different areas sampled, as given in the overview map in Fig. 4. In general, the δ13C values are in the expected range reported by previous studies (e.g. Rudolph et al., 2000; Goldstein and Shaw, 2003).The air samples taken during the EMeRGe IOP at ground stations exhibited different features in δ13C values for the southern and for the northern European MPCs. Lower δ13C values for C5H10O and C6H6, indicative of fresh emissions, were generally observed below 2000 m altitude. On average, C5H10O was less enriched in 13C in the Rome and Milan (−32.6 ‰) than in the London and Wuppertal samples (−31.4 ‰), whereas it was the opposite for C6H6, i.e. (−27.3 ‰) and (-29.0 ‰ ), respectively. Moreover, the δ13C ground values in Italy indicated more constant sources in C5H10O and C6H6 as in the northern MPCs, as was apparent from the standard deviations of 0.8 ‰ and 0.7 ‰ in contrast to 1.2 ‰ and 3.3 ‰, respectively.

Figure 19Vertical distribution of δ13C values in C5H10O (a, c) and C6H6 (b, d) in whole air samples taken on HALO and at the ground sites in London, Wuppertal, Milan, and Rome. Data for northbound flights (a–b) are colour coded for Paris MPC (black), the North Sea (red), the English Channel (violet), and BNL/Ruhr (orange). Data for southbound flights (c–d) are colour coded for Rome MPC (blue), Po Valley MPC (cyan), and Eastern Mediterranean (green). The coloured shadings refer to the standard deviation of δ13C values in altitude bins of 250 m. Mean δ13C values of the respective altitude bins are represented as solid colour-coded lines. The δ13C values at the lowest altitudes in each colour represent the results of air samples at the ground stations: London (red), Wuppertal (orange), Rome (blue), and Milan (cyan). Error bars in δ13C are given for each sample value. Remaining data are shown in grey.
The EMeRGe flights to the southern MPCs in Europe covered a larger altitude range than the flights to the northern MPCs. The upwind and downwind shuttles at different flight altitudes of the Rome MPC illustrated a general increase in δ13C in C5H10O and C6H6 with increasing altitude. This implies that chemically processed air was encountered during the transits over the Apennines. In comparison to C5H10O, the enrichment in 13C with altitude in C6H6 was not very pronounced. This is consistent with the longer lifetime of C6H6 and a well-mixed troposphere with a variety of ground sources mixed by convection (e.g. thunderstorms) in summer. Consequently, the values for δ13C in C5H10O represented local conditions, whereas those in C6H6 provided regional or LRT information. The isotopic signatures revealed a second layer with rather fresh emissions in the altitude region between 2000 and 3000 m which extended to 4000 m in the southern MPCs (e.g. Rome and the Po Valley). These observations were consistent with the trace gases and aerosol measurements.
Concerning the location and position of the city plumes, they were typically well forecasted by the CAMS global, MECO(n) regional, and HYSPLIT dispersion simulations using urban city tracers. Figure 20 shows an example with results from E-EU-08 on 26 July 2017 as the London and BNL/Ruhr MPC outflows were investigated. The HYSPLIT dispersion calculations of the CO city plumes were used to define the location of the outflows, which were measured along the eastern UK coast between 10:00 and 12:00 UTC and over the European continent between 13:20 and 14:15 UTC approximately. The plumes identified using enhanced mixing ratios of selected atmospheric species and the estimated air mass transport times are summarised in Table S13.1 in the Supplement. These plumes show mixtures of anthropogenic pollution (AP), BB, and biogenic emissions (BIO). Overall, the HYSPLIT dispersion and FLEXTRA backward calculations agreed reasonably in identifying fresh emitted London plumes such as B-02 and B-04 (see Fig. 13): the measured 22 and 19 ppbv CO increases over background are estimated by HYSPLIT as 25 and 22 ppbv (sum of all transport times). B-05 is a good example of significant mixing with aged plumes (12–24 h) which seem to dominate in B-06 and B-08 (see detail in Fig. 20). Plume B-09 is a good example of mixing of freshly emitted plumes from BNL/Ruhr (0–6 h) and aged emissions (>24 h) of London origin.
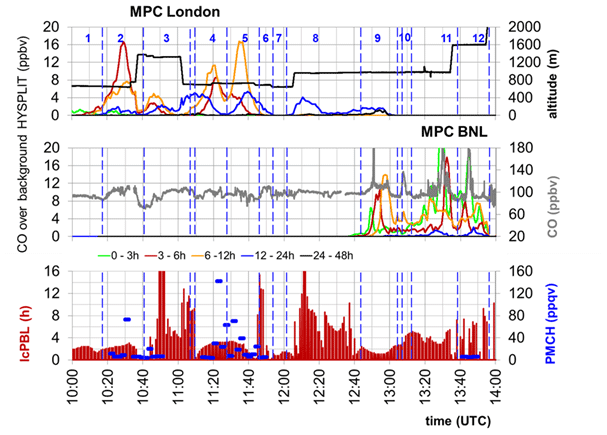
Figure 20Detail of the MPC outflow of London (B-01 to B-09) and BNL/Ruhr (B-09 to B-12) probed with HALO along the E-EU-08 flight track. Numbering in blue corresponds with the classification in Fig. 13 (“B-0” is omitted for clarity). The position of the plumes is also indicated by the blue lines. Dispersion of CO emissions of target MPCs and the transport time of the air mass calculated by HYSPLIT are depicted in the middle panel. The last contact with the PBL (lcPBL) calculated using FLEXTRA is also shown. Elevated perfluoromethylcyclohexane (PMCH) mixing ratios were measured for B-02, B-04, and B-05.
MPC outflows were successfully and unambiguously identified after transport times of between 5 and 26 h by tagging polluted air masses through ground-based releases of PFC tracers in the centre of MPCs. The aim of the PFC tracer experiments was to establish Lagrangian connections between polluted air masses in the centre of selected cities and downstream measurements aboard HALO guided by HYSPLIT forecasts of the dispersion of the tracer plumes. In Fig. 20, the perfluoromethylcyclohexane (PMCH) volume mixing ratios measured on board during E-EU-08 are shown. For B-02, B-04, and B-05, enhanced tracer values above the 8.5 ppqv atmospheric background in Europe were clearly detected.
The downwind impact of pollution from MPCs was identified by combining information from measurements on board in selected areas with backward and sensitivity trajectories. Figure 21 shows an example of the density distribution for forward trajectories (FTs) of Rome MPC outflows. The figure highlights the typical transport pattern towards the Adriatic coast and the representativeness of the HALO shuttles at different altitudes in the Mediterranean and along the Adriatic coast during the flights E-EU-03 and E-EU-06. The flight tracks for E-EU-03 and E-EU-06 are colour coded with the BC mass, a good tracer for urban emissions (Krüger et al., 2022). The elevated BC mass concentrations observed in the area of an increased FT density over the Adriatic indicates the measurement of urban emissions in the statistically expectable transport pattern for the urban outflow of Rome during the month of July. A comparison of the remote sensing observations of gases aboard HALO with their columnar amounts observed by ground-based measurements in the Rome area in the framework of the PANDONIA global network for air quality and atmospheric composition (https://www.pandonia-global-network.org/, last access: 21 June 2021) is discussed in Campanelli et al. (2022).
Regional transport of several European MPC outflows was successfully identified and measured: (a) London over the English Channel to central Europe, (b) Po Valley either north over the Alps or in a southeasterly direction towards the Adriatic, (c) Rome over the Apennines into the Adriatic, and (d) Madrid and Barcelona into the Western Mediterranean.
The downwind impact of the MPC outflows during EMeRGe was explored in respect of the vertical and horizontal extension of the observed plumes by combining information from transects and shuttles in selected areas. An example is shown in Fig. 22 for the B-01 to B-12 plumes during the E-EU-08 flight. The E-EU-08 track included a flight transect (a–b–c–d–e) at approximately 600 m altitude and a shuttle (600–1400 m) between b–c and c–d in the outflow of London from 10:00 to 12:00 UTC. A second shuttle (g–h–i) at 900, 1500, and 2400 m was made in the BNL outflow from 13:20 UTC approximately. Relevant changes in the HALO course and altitude are marked by coloured circles and letters in Fig. 22. Backward trajectories indicated that the air measured at around 10:30 UTC at 600 m (blue circle), 11:00 UTC (point c at 1400 and 600 m), 11:20 UTC (yellow circle), and 11:50 UTC at 600 m (pink circle) had passed over the London MPC a few hours before being probed at an altitude below 1000 m. Selected backward trajectories are shown in Fig. 22c. At these times, the measured enhancements in CO and NOy and the NONOy ratios were in reasonable agreement with the transport time predicted by HYSPLIT for the CO enhancement in the London MPC plumes in Fig. 20. For plume B-02, HYSPLIT predicted the London contribution to be a mixture of air masses transported in the previous 3 to 24 h. The air probed had up to 10 ppb of NOy and approximately 2 ppbv NO. The latter suppresses RO. OH and RO are produced but also react with NO and NO2. These measurements confirm the predicted mixing of relatively fresh emissions with aged and more photochemically processed air masses.
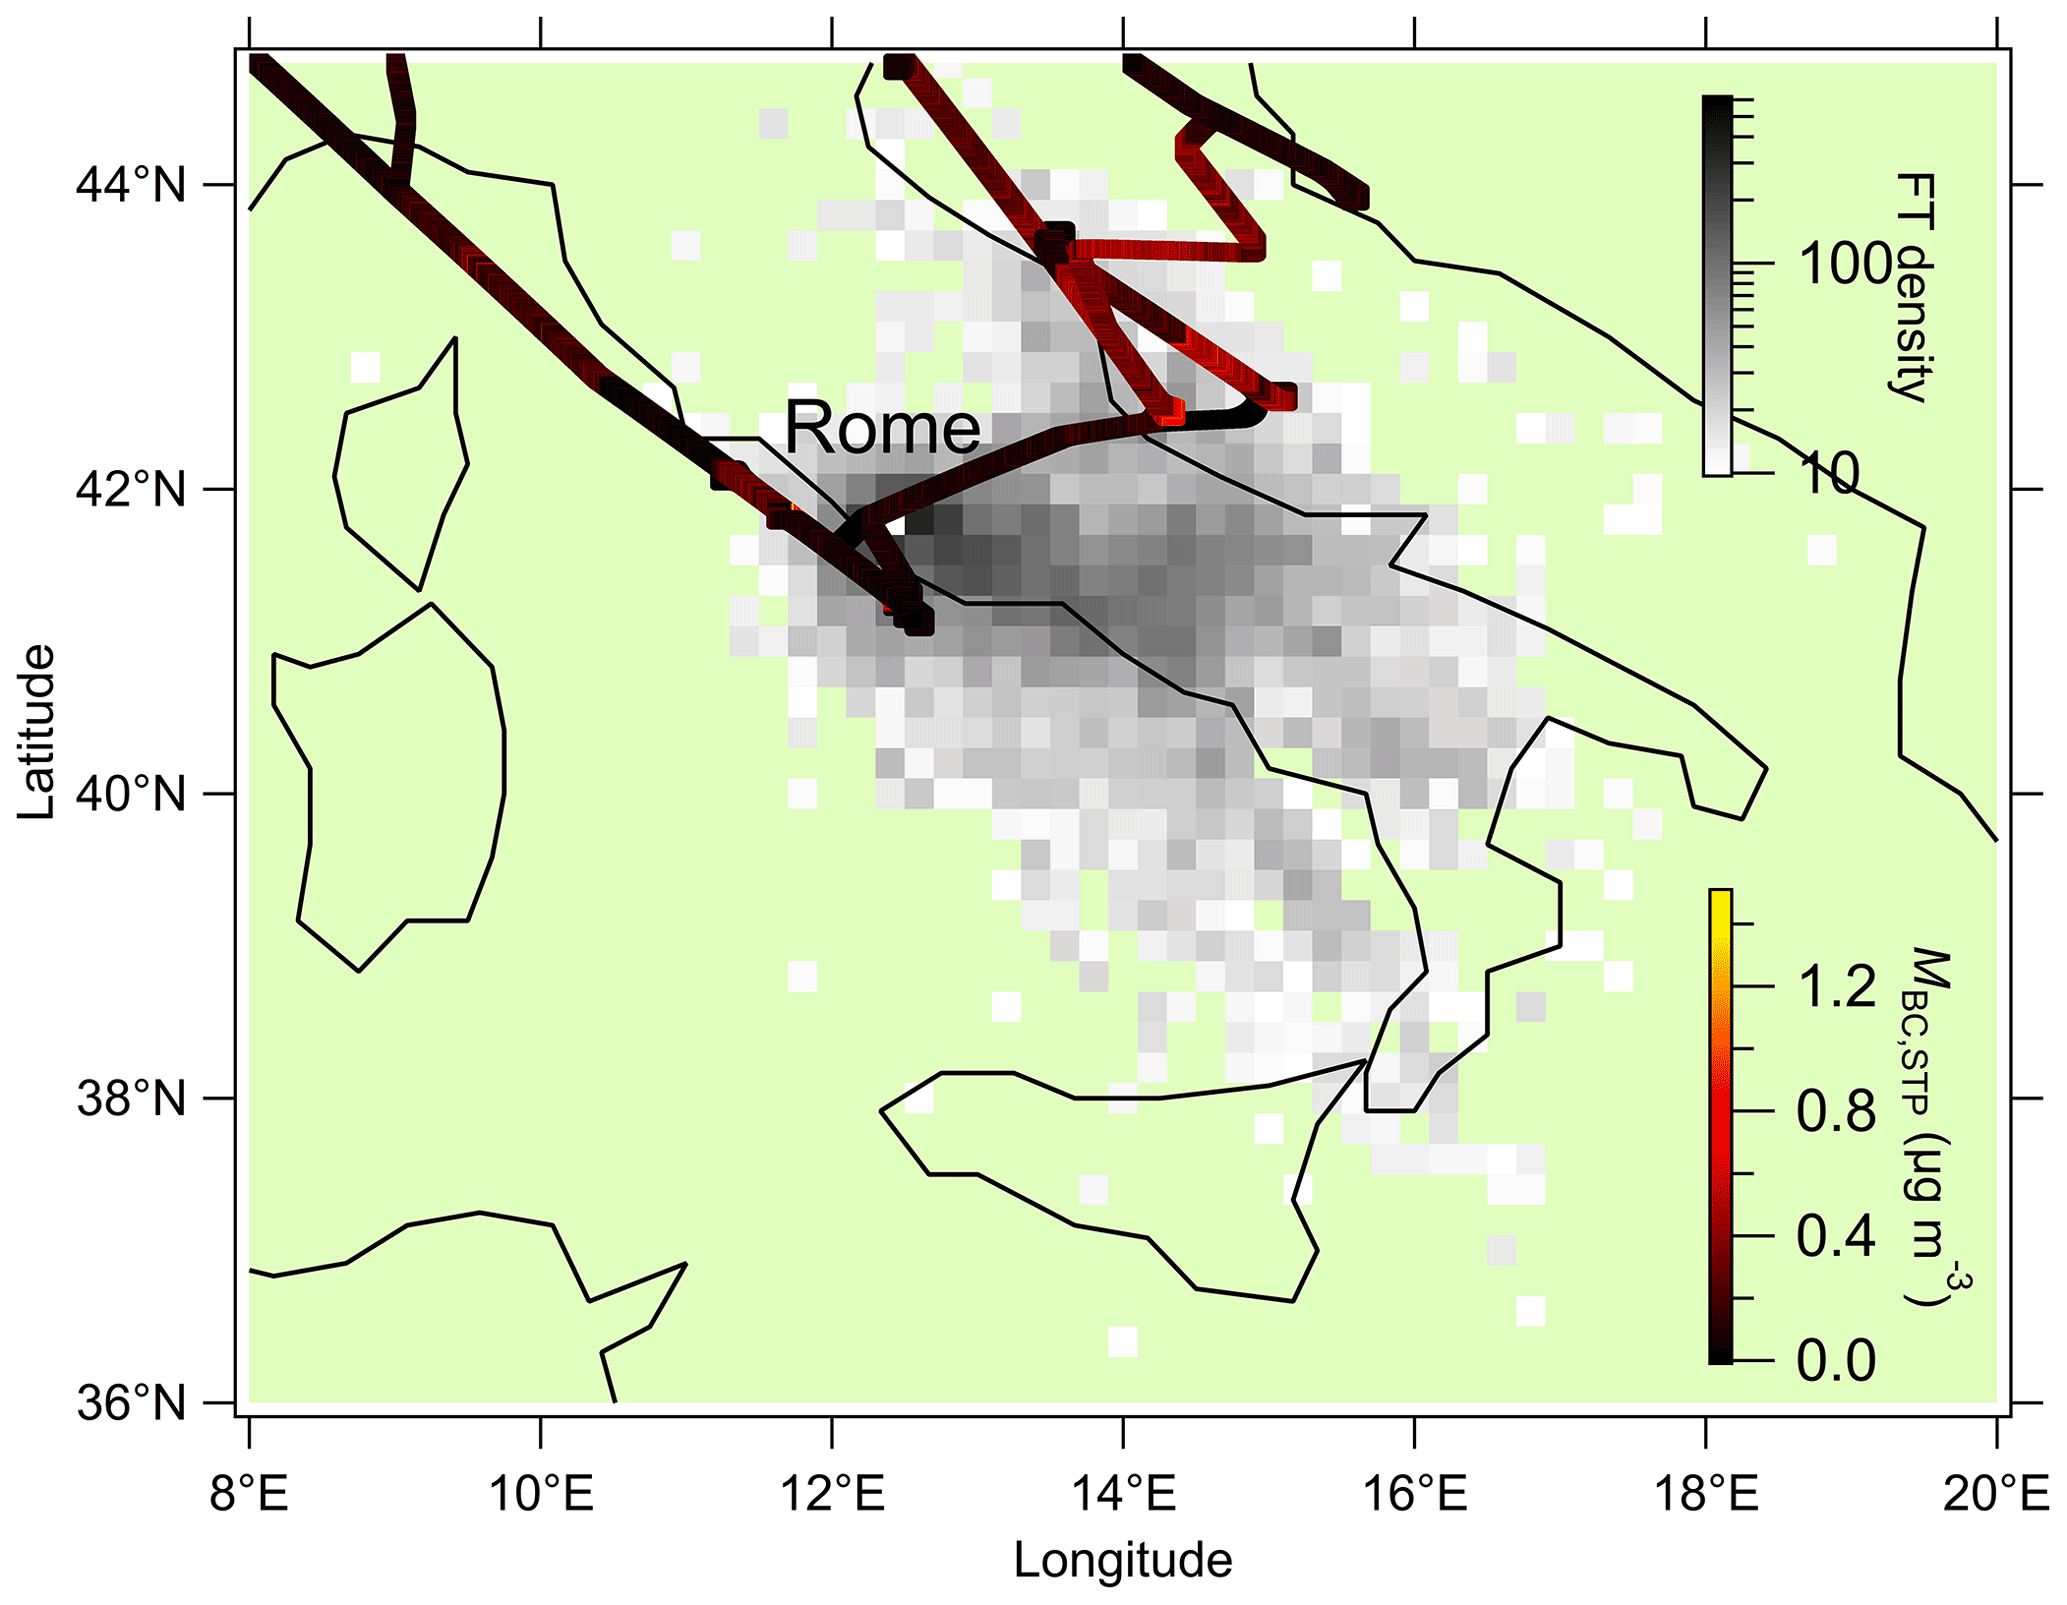
Figure 21Forward trajectory (FT) density plot for air masses starting in Rome (100 m a.g.l.) in the month of July from multiple years (2017 to 2020). The grey scale represents the counts of FT points in each grid cell. The flight track of E-EU-03 and E-EU-06 is colour-coded with the BC mass concentration. The FT density distribution was calculated as explained in Pöhlker et al. (2019). The FT starts at 100 m above ground level for the month of July in a multi-year period (2017 until 2020) by using the HYSPLIT package (version 4, revision 664, October 2014) (Stein et al., 2015; Rolph et al., 2017).
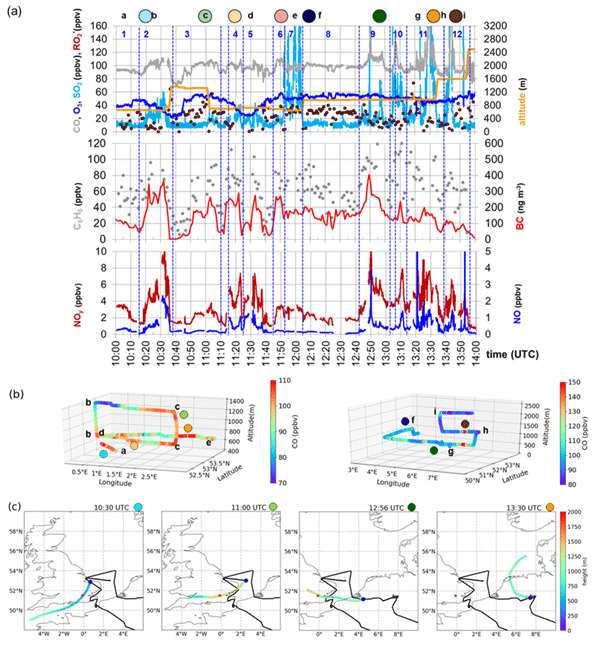
Figure 22(a) CO, O3, SO2, RO2*, NOy, NO, C6H6, and BC measured in the outflow of London and BNL during E-EU-08 on 26 July 2017. The position and numbering of the plumes are indicated by blue lines and numbers as classified in Fig. 22 (“B-0” is omitted for clarity) and (b) 3-D shuttles colour coded with the CO mixing ratios observed. Relevant changes in the HALO course and altitude are marked by colour circles and letters (a–i), and (c) selected backward trajectories (24 h). The red stars and the blue dot indicate the position of the MPCs of interest and of HALO, respectively.
The vertical distribution of CO in the plume during the shuttles is depicted in the 3-D diagrams in Fig. 22b. The CO measured indicates that the plume B-03 is well mixed horizontally with the plume B-06 up to 1400 m altitude. According to the backward trajectories (not shown), the plume at 11:52 UTC is transported from the northeast coast of UK and had no recent contact with the outflow of London. This is distinguishable by the high SO2 mixing ratios measured. The plumes B-08 and B-09 measured over the continent at 900 m were predicted to have been in contact with emissions of the London MPC within the previous 24 h (Figs. 20 and 22c). From 12:50 UTC, the air probed was expected to mix with recent emissions of the BNL MPC as indicated by the observed higher NO levels and enhancements in NOy, SO2, and C6H6 in Fig. 22a. The composition of the air measured during the shuttle between the way points g and h in Fig. 22a at 13:30 and 13:45 UTC and the backward trajectories indicated that the outflow from the BNL MPC was sampled in a plume extending from 1000 to 1500 m. This air mass was not detectable at 2500 m.
Distinct pollution and aerosol layering were observed over some of the investigated MPCs. Collocated ground-based remote sensing instruments improved the understanding of the evolution of the airborne observed scenarios and the attribution of the vertical distribution of pollutants probed during the shuttles. A particular case of interest was the vertical distribution of pollutants observed at the coast of Barcelona during E-EU-09. HYSPLIT CO dispersion simulations indicated that the Madrid outflow was transported over a long distance above the Iberian Peninsula to the northeastern coast at altitudes above 2000 m while in the lower layers the Barcelona outflow predominated, as illustrated in Fig. 23. In contrast with the air sampled at 500 m, the backward trajectories and HYSPLIT dispersion calculations indicated that the air probed from 15:15 to 15:25 UTC at 1600 m had passed over MPC Barcelona within 6–12 h before sampling. In these measurements, there was no indication of fresh NO emissions, and NOy, C6H6, and CO were significantly higher than at the lower altitude. The layering is attributed to be the result of the recirculation of emissions in the Barcelona outflow within the land-breeze regimes close to the coast. Later at this FL (green and red circles in Fig. 23), the backward trajectories and HYSPLIT estimations indicated sampling of regional emissions that had travelled along the coast from Valencia. This is consistent with the observed decreases in C6H6, NOy, and BC. In the upper FL at 15:45 UTC, NOy, C6H6, and CO significantly increased in air transported from Portugal (as in the 36 h backward trajectories) across the Iberian Peninsula at altitudes above 2000 m, after PBL contact with the MPC Madrid below 1000 m the evening before. According to the pollution control network of Madrid, the average CO surface concentration exceeded 350 ppb on the 27 July 2017, the zonal wind direction was WSW, and the average wind speeds were greater than 16 km h−1. The observed mixing ratio decreased when this feature at 3000 m disappeared. Re-entering and stratification of plumes having different processing along the Spanish coast has also been documented in the past (e.g. Millán et al., 1997, 2000, and references therein).
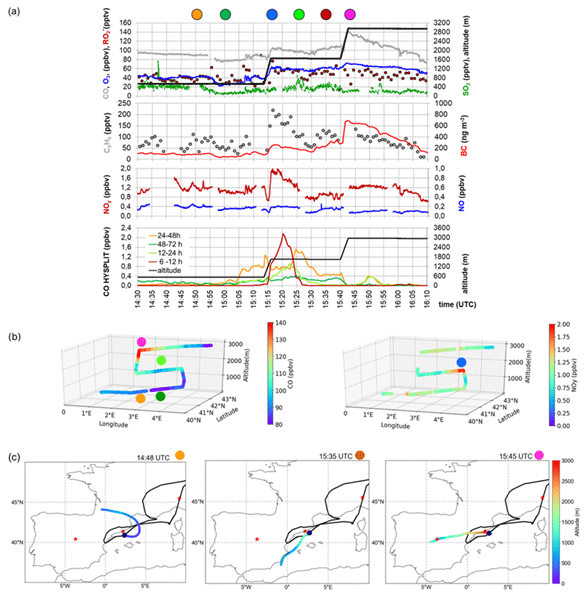
Figure 23Stratified pollution layers along the Spanish coast during the E-EU-09 flight on the 28 July 2017, (a) temporal variation of CO, O3, RO2*, NOy, NO, SO2, C6H6, and BC during the shuttle, (b) 3-D view of the shuttle colour coded with CO (left) and NOy (right) mixing ratios, and (c) selected backward trajectories (last 24 h). Coloured circles marked the corresponding times in panel (b). Red stars and the blue dot indicate the position of the MPCs of interest and of HALO, respectively.
The interpretation of these HALO measurements during E-EU-09 was enhanced by using data from the four closest ground-based remote sensing stations available in the framework of EMeRGe international. These are data of a lidar in Barcelona (BRC) and three ceilometers in Montseny (MSY), on top of the Serra del Montsec (MSA) (Titos et al., 2019), and in Burjassot (VLC) near Valencia. Figure 24 shows the location of the stations with respect to the HALO flight track. The stations MSY and MSA were approached at a flight altitude of 2600 m when HALO entered the air space above the Iberian Peninsula. Subsequently, HALO shuttles were carried out northeast of Valencia at 500, 1000, 2000, and 2600 m and east of Barcelona at 500, 1600, and 3000 m.

Figure 24Detail of E-EU-F09 flight track (in green) and the ground-based stations with coordinated remote sensing measurements in the vicinity: Montseny (MSY), Sierra del Montsec (MSA), Burjassot (VLC), and Barcelona (BRC). Red lines indicate the position of the HALO shuttles.
The lofted aerosol layer observed at all ground-based remote sensing stations from above the PBL up to 4000 m altitude was also probed by HALO (see Fig. 25). The profiles of the backscatter coefficient derived at MSY, MSA, VLC, and BRC on the 28 July 2017 are displayed in Figs. 26 and 27. The lofted aerosol layer in Fig. 25 corresponds with increased backscatter coefficients ranging from 0.4 to 1.9 (Mm ⋅ sr)−1.
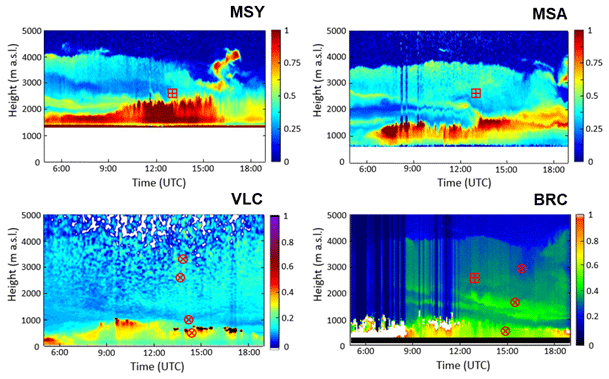
Figure 25Time series of range-corrected lidar signals from ground-based remote sensing measurements in MSY, MSA (both at a wavelength of 1064 nm), VLC (910 nm), and BRC (532 nm) on the 28 July 2017. Depicted are the signal strengths relative to the maximum signal of the corresponding measurement. Red circles show time and altitude of the HALO overpasses used for the comparison of airborne with ground-based remote sensing measurements (see Figs. 26 and 27). Red squares show further HALO overpasses.
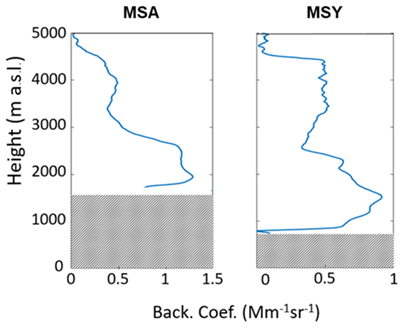
Figure 26Profiles of the backscatter coefficient derived at 1064 nm in MSA and MSY for the 28 July 2017 from 12:50 to 13:20 UTC. The grey shadings indicate the height of the ceilometers.
The composition of PM1 particles (i.e. with diameter up to 1 µm) was retrieved from the HALO in situ measurements at different altitudes during the shuttles. The observed PM1 composition near Burjassot is shown in Fig. 27. Although the ceilometer measurements refer to total aerosol and the in situ data only to PM1, both revealed two distinct aerosol layers: (a) a PBL below 1000 m altitude with enhanced concentrations of sulfate and ammonium and a backscatter coefficient between 2.0 and 2.7 (Mm ⋅ sr)−1, and (b) a lofted aerosol layer between 1500 and 3500 m altitude with higher organic, nitrate, and BC mass fraction. The difference in composition is likely related to different aerosol sources. While the boundary aerosol layer had a local origin, the lofted aerosol layer was influenced by the transport of regional emissions. This is consistent with the transport of the MPC Madrid outflow as indicated in Fig. 23.
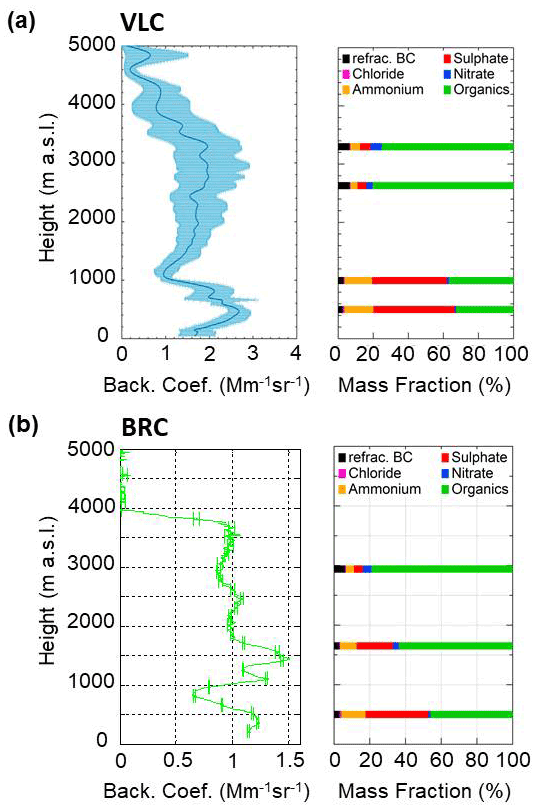
Figure 27Distinct aerosol layers observed near Burjassot/Valencia (VLC) and Barcelona (BRC). (a) Profile of the backscatter coefficient derived at 910 nm for 13:30–14:30 UTC in VLC (left), and fractional composition of PM1 measured (SP2 and AMS) aboard HALO (right), (b) the same derived in BRC at 532 nm for 14:45–15:45 UTC. The periods of comparison with the HALO data are 13:47–13:56 (9 min and 30 s) at 3300 m; 13:34–13:40 (5 min and 30 s) at 2630 m, 14:03–14:14 (11 min) at 1000 m, and 14:18–14:31 (13 min) at 500 m for VLC, and 15:43–16:00 (17 min) at 2940 m; 15:16–15:40 (24 min) at 1650 m and 14:47–15:14 (27 min) at 500 m for BRC.
Similarly, the lidar and in situ measurements close to Barcelona revealed a different aerosol composition of the PBL below 900 m and a lofted aerosol layer above 2000 m. In addition, a third aerosol layer evolved between 1000 and 1800 m altitude with a backscatter coefficient up to 1.5 (Mm ⋅ sr)−1. The mass fractions of ammonium, sulfate, and organic aerosol are between the values of those of the PBL and of the lofted aerosol layer above.
4.4 Mixing of MPC outflows with air masses of biogenic and natural origin: forest fires and dust
Plumes of anthropogenic, biogenic, and natural origin were often mixed in the air probed over Europe during the EMeRGe IOP.
The BB contribution of fresh wildfires in the Mediterranean area was substantial as indicated by VOCs, in particular CH3CN, and aerosol observations. For particles emitted from BB, a frequently used tracer is levoglucosan which is identified using the 60 ion (C2H4O in aerosol mass spectrometry (Schneider et al., 2006; Alfarra et al., 2007). However, the photochemical degradation of levoglucosan is fast in summer (Hennigan et al., 2010, 2011; Lai et al., 2014), and in the BB aerosol observed during the IOP in Europe it was generally processed too fast to be distinguished from other secondary aerosols.
A more robust indicator for particles from BB is BC. BC particles are formed in processes of incomplete combustion and are therefore an important component of both BB and urban aerosol particles (Bond et al., 2013). The microphysical properties of BC give insights into the combustion sources and atmospheric ageing time of the pollution plumes (Liu, 2014; Laborde, 2013). Figure 28 shows an example of average BC mass size distributions encountered during the E-EU-06 flight. Complex mixing of different open BB sources with lightly aged BB smoke from fires in Croatia was observed. Grassland and fires in Italy mostly from mixed forests and savannahs were the dominant combustion fuel. The plumes were classified according to the VOC observations (see Sect. S12 in the Supplement). This complex mix of biomass burning (BB, core diameter (Dc) =200 nm) BC sources, mixed occasionally further with anthropogenic emissions (BB+AP, Dc =210 nm). Rather pure anthropogenic urban haze (AP) with significantly smaller mean modal diameter (Dc =170 nm) was additionally measured. The resulting sizes agree with literature values for urban haze and BB smoke (e.g. Schwarz et al., 2008; Laborde et al., 2013; Liu et al., 2014; Holanda et al., 2020). During E-EU-06, the average total BC mass concentration was also substantially higher in relatively pure BB smoke and in the mixed conditions with urban haze (BB, 0.61±0.12 and BB+AP, 0.81±0.35 µg m−3, respectively) than in urban pollution (AP, 0.35±0.15 µg m−3).
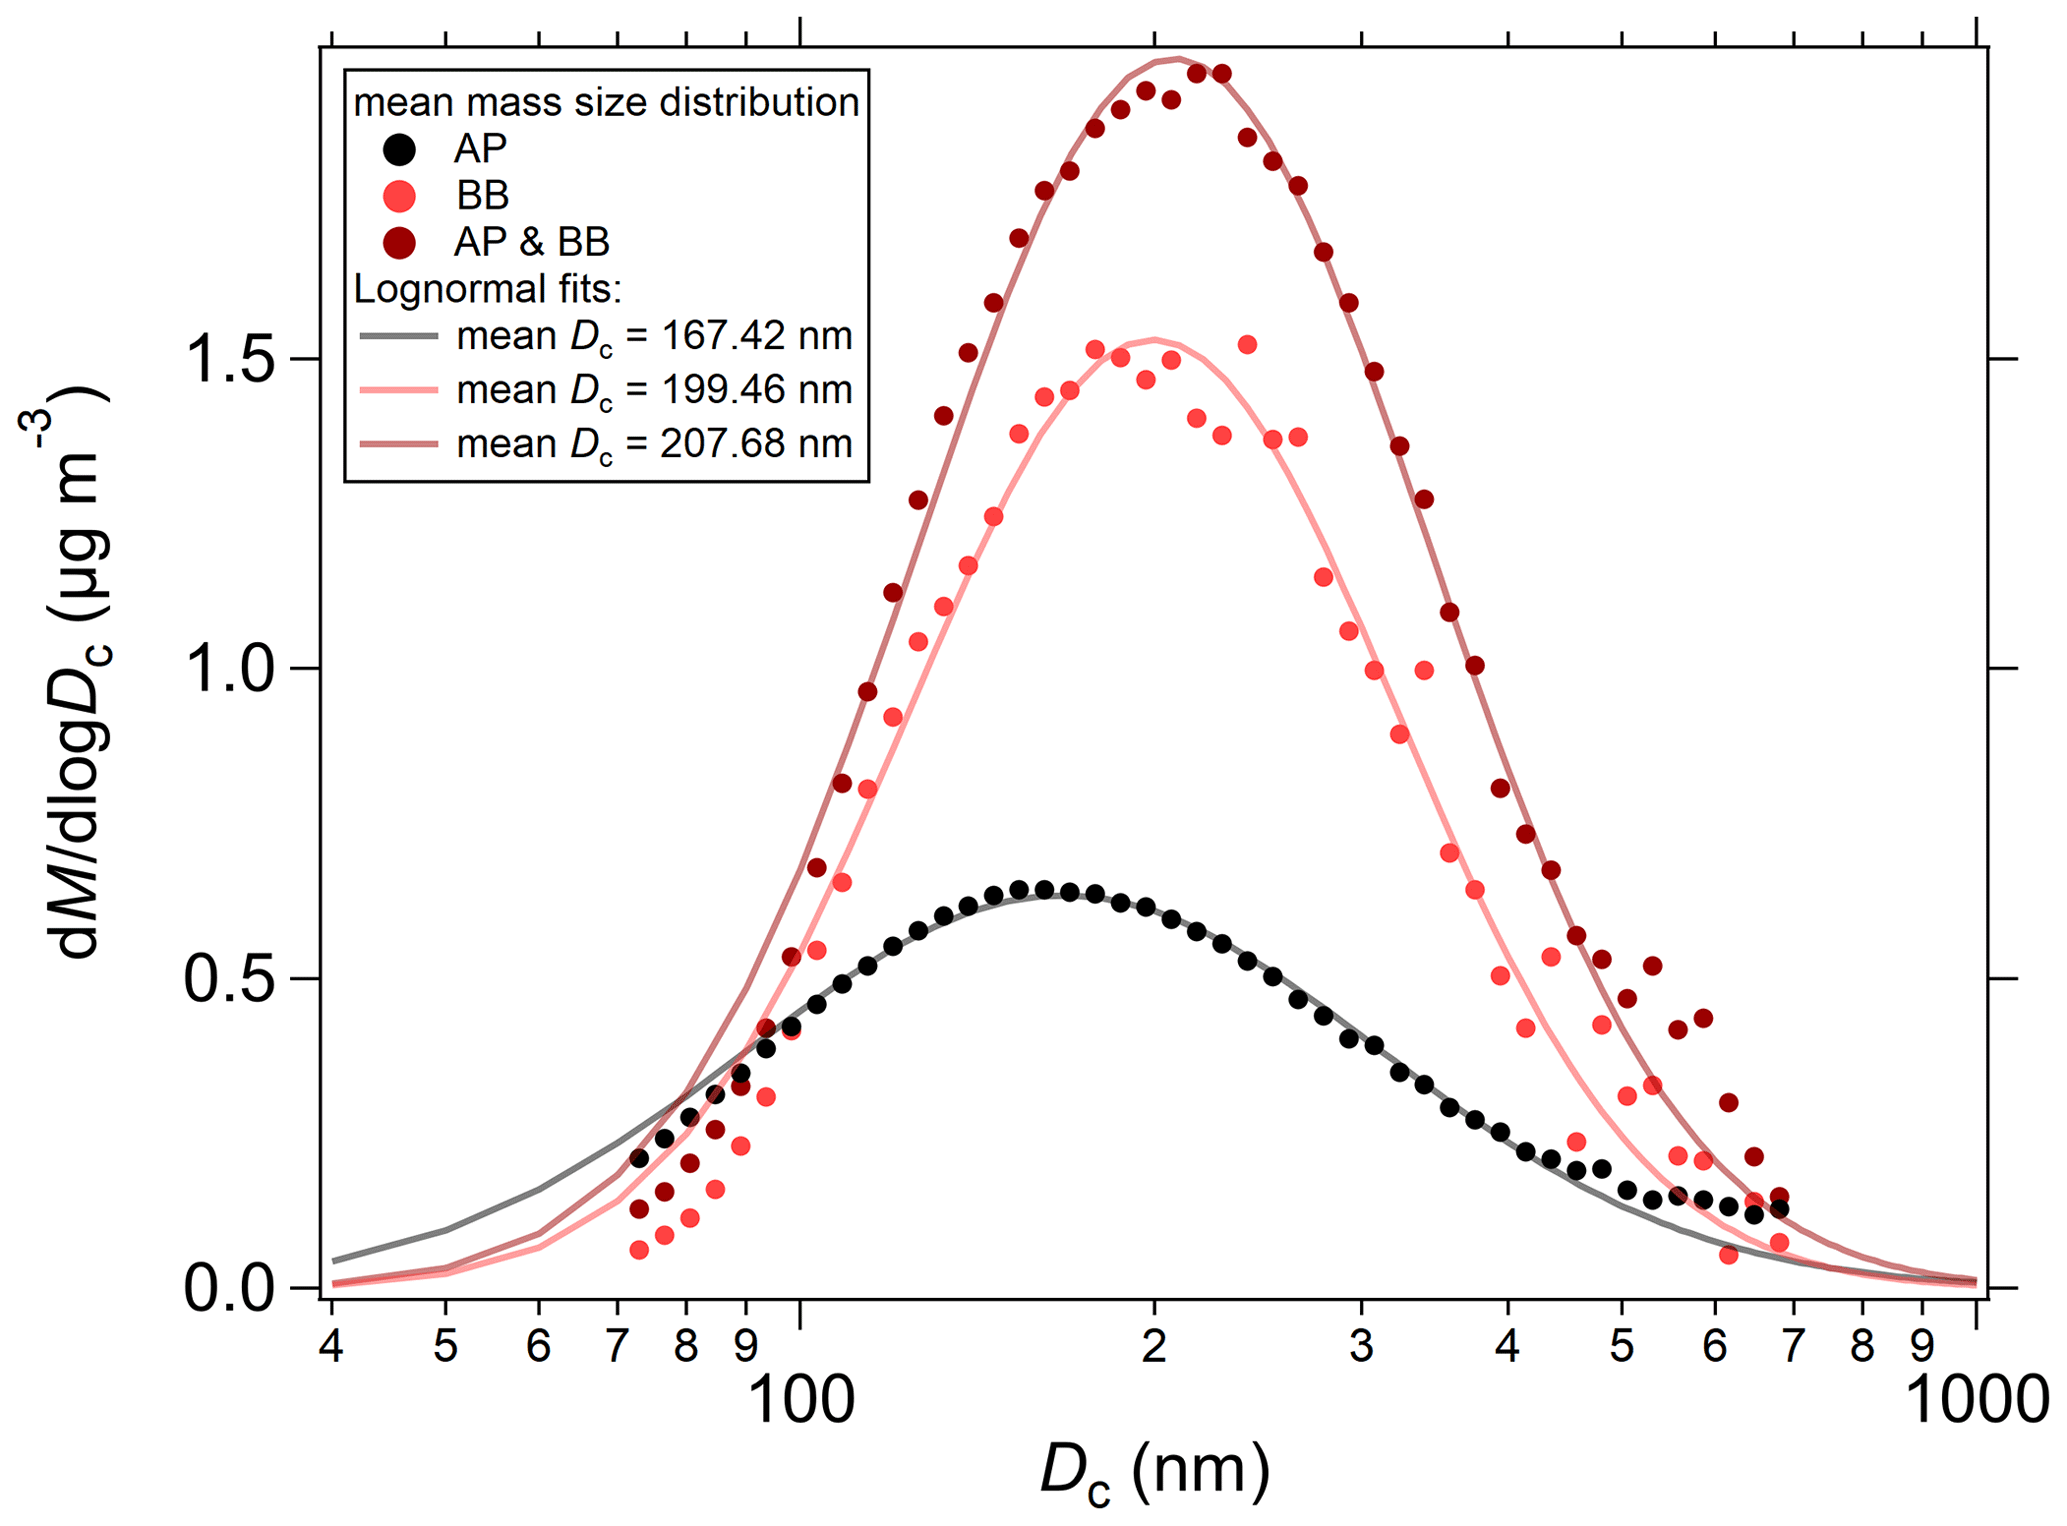
Figure 28Mean mass size distribution of black carbon particles measured in anthropogenic pollution (AP, black), BB (light red), pollution from anthropogenic/BB mix (AP and BB, dark red) during E-EU-06 on 20 July 2017. Dc: refractive black carbon core diameter. Lognormal fits were applied to the mean size distributions for nm.
Mineral dust events contributed significantly to some of the plumes measured over Europe during the EMeRGe IOP. Mineral dust was identified in the aerosol size distribution and the optical properties of air masses probed in southern Europe above the PBL. An example of the observed impact of dust on the aerosol size distributions close to the western coast of Italy is illustrated in Fig. 29. The concentration of particles with a diameter below 250 nm was analysed by the Differential Mobility Analyzer (DMA) in six steps of 30 s duration, resulting in a period of 3 min for each integrated measurement. The evaluated DMA data were then combined with the data from an Optical Particle Counter (OPC) for particles in the range from 0.25 to 3 µm. The first two sequences in Fig. 29 are taken at 2900 m and the third at 1300 m altitude during E-EU-03. The third period and lowest in altitude had the smallest total number concentration with a clear enhancement of the particles above 600 nm. According to FLEXTRA, HALO flew approximately 800 m above the PBL at the time of sampling. The increase in the coarse mode particles above the PBL implies mineral dust rather than sea salt. According to backward trajectories, the air mass probed had recent contact at altitudes below 1000 m with the dust plumes over the Mediterranean near Sardinia. In fact, both satellite- and ground-based observations indicated a Saharan dust event affecting the central Mediterranean air masses measured during E-EU-03 on 11 July 2017 (see Fig. 32 and the discussion below).
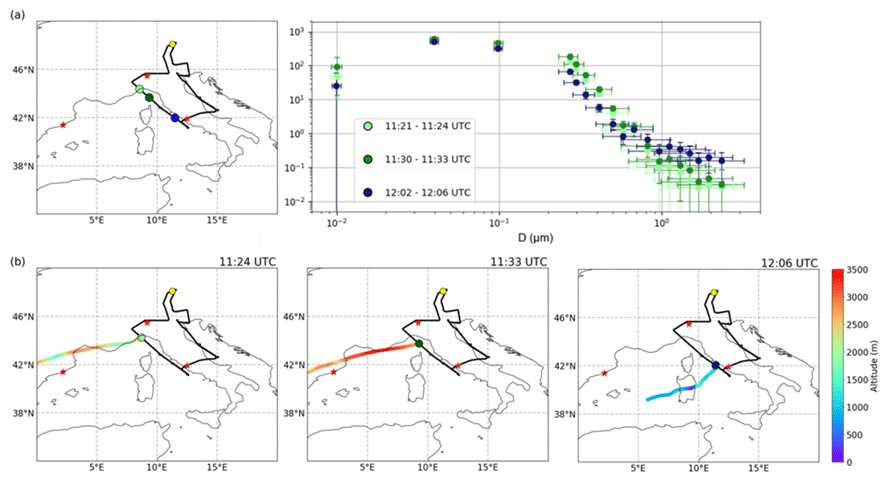
Figure 29Example of the effect of dust plumes on the aerosol concentration during E-EU-03 on the 11 July 2017. (a) Particle size distribution for three selected time periods (right) and position of the sample points in the flight track (left). The error bars on the y axis are the standard deviations of the mean measured concentrations. The error bars in x direction indicate the 16th and 84th percentile of the median diameters of the sensitivities of each size channel; (b) 48 h backward trajectories for the three periods selected. The red stars and the yellow dot indicate the position of the MPCs of interest and of the HALO base (OP), respectively.
The presence of mineral dust on 11 July 2017 is also confirmed by the continuous aerosol profile measurements made over Rome by the automated lidar ceilometer (ALC). HALO overpassed the Rome area around midday. Figure 30 shows a lofted aerosol layer with increased depolarisation indicative of the non-spherical mineral particles, at an altitude between 1000 and 2000 m from the morning. This layer then vertically mixed with local particles lifted by the PBL dynamics in the middle of the day, at the time of the DMA measurement. This indicates that HALO flew above a dust layer during the first two time periods of the DMA measurement, thus probing rather low concentrations of large particles. Subsequently, in time period 3, HALO dived into the dust layer and this explains the increase of particles larger than 600 nm in the DMA measurements. Additionally to the coarse mineral particles, aerosol properties observed over Rome both aboard the Sky Arrow aircraft and at the ground provide evidence for an important role of fine particle photo-nucleation in the Rome MPC, favoured by high radiation and temperatures (Campanelli et al., 2022; Barnaba et al., 2022).
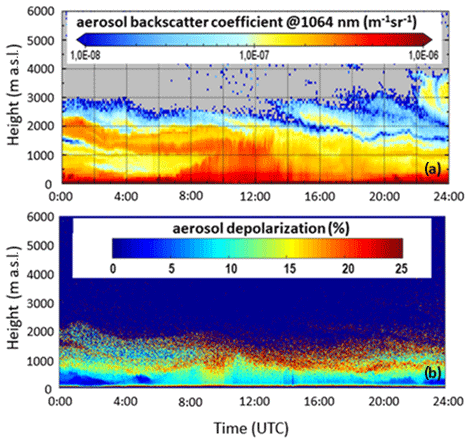
Figure 30Aerosol profile measurements performed in Rome (Italy) on 11 July 2017 by the Automated LIdar-CEilometer network (ALICEnet). Aerosol backscatter coefficient (m−1 sr−1) at 1064 nm (a) and aerosol depolarisation in % (b).
The transport of BB emissions from fires and mineral dust events was identified by combining HALO observations with remote sensing satellite retrievals. BB emission from fires was, e.g. probed during the E-EU-07 flight downwind of Marseille. The plume transport eastwards from near Marseille is well captured by SEVIRI with aerosol optical thickness (AOT) values around 0.25 at 0.55 µm in the afternoon, as shown in Fig. 31. This plume was probed by HALO in situ measurements at around 11:30 and 16:30 UTC. The BC mass concentrations depicted in the figure agree with the satellite data. The highest BC was measured at roughly 2000 m and exceeded 7 µg m−3. In the PBL, measured BC mass concentrations were as high as 1 µg m−3. The stratification of pollution plumes above the PBL is a commonly observed feature for BB emissions (Holanda et al., 2020).
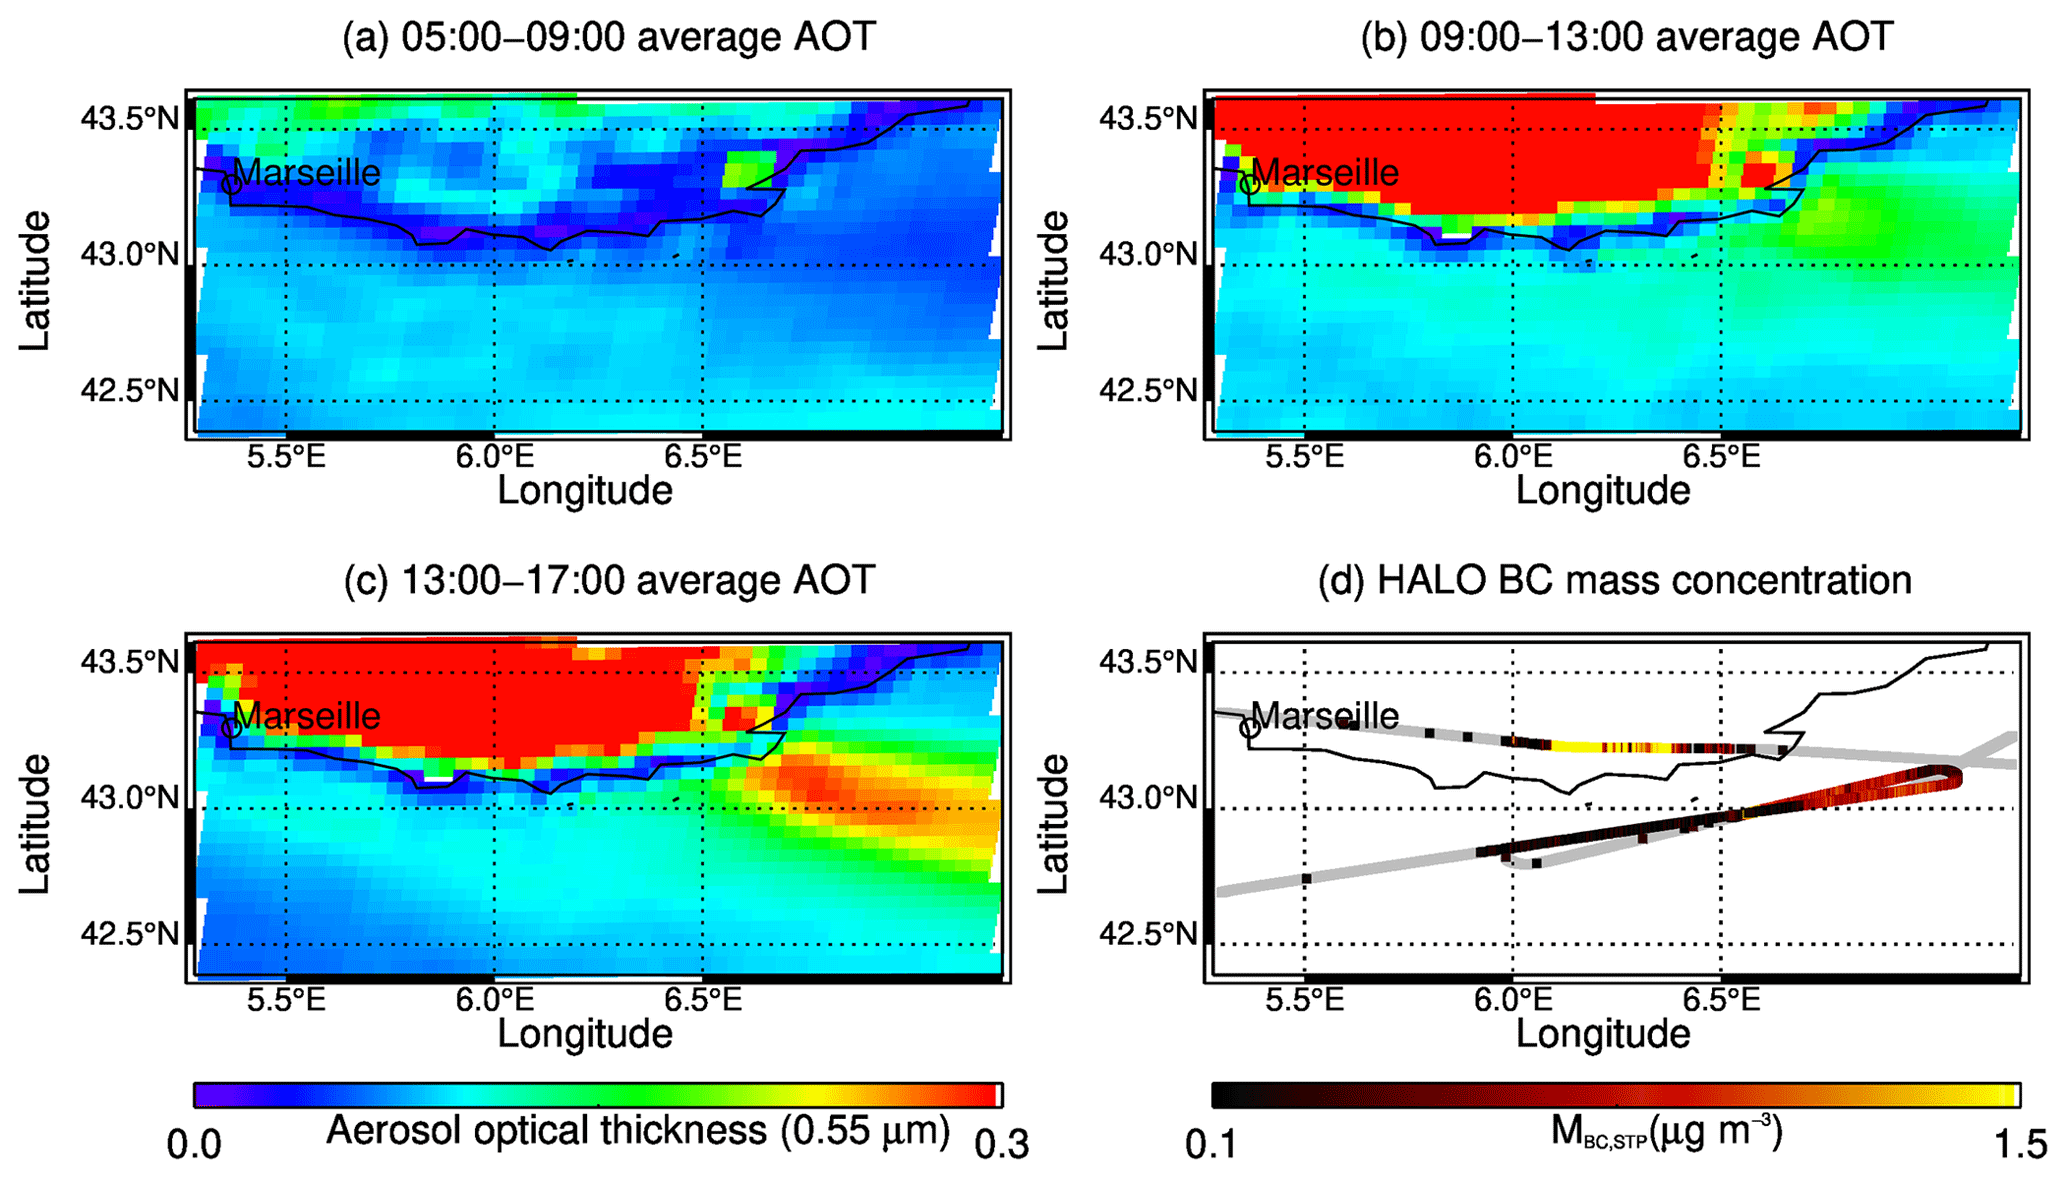
Figure 31(a–c) Aerosol optical thickness at 0.55 µm as retrieved from SEVIRI from 05:00 to 17:00 UTC on 24 July 2017. (d) E-EU-07 flight track, colour coded with BC mass concentration (MBC). For better contrast, the scale for MBC ranges from 0.1 to 1.5 µg m−3. Grey colour on the flight track indicates values below 0.1 µg m−3. The mass concentration reached values up to 7 µg m−3 at the French coast.
A further example is the transport of the Saharan dust event affecting the air masses measured during E-EU-03 on 11 July 2017 as explained in Fig. 29. Figure 32 shows the MODIS satellite RGB image at 10:30 UTC and the corresponding dust-related elevated AOT at 0.55 µm as retrieved from SEVIRI from 09:00 to 13:00 UTC.
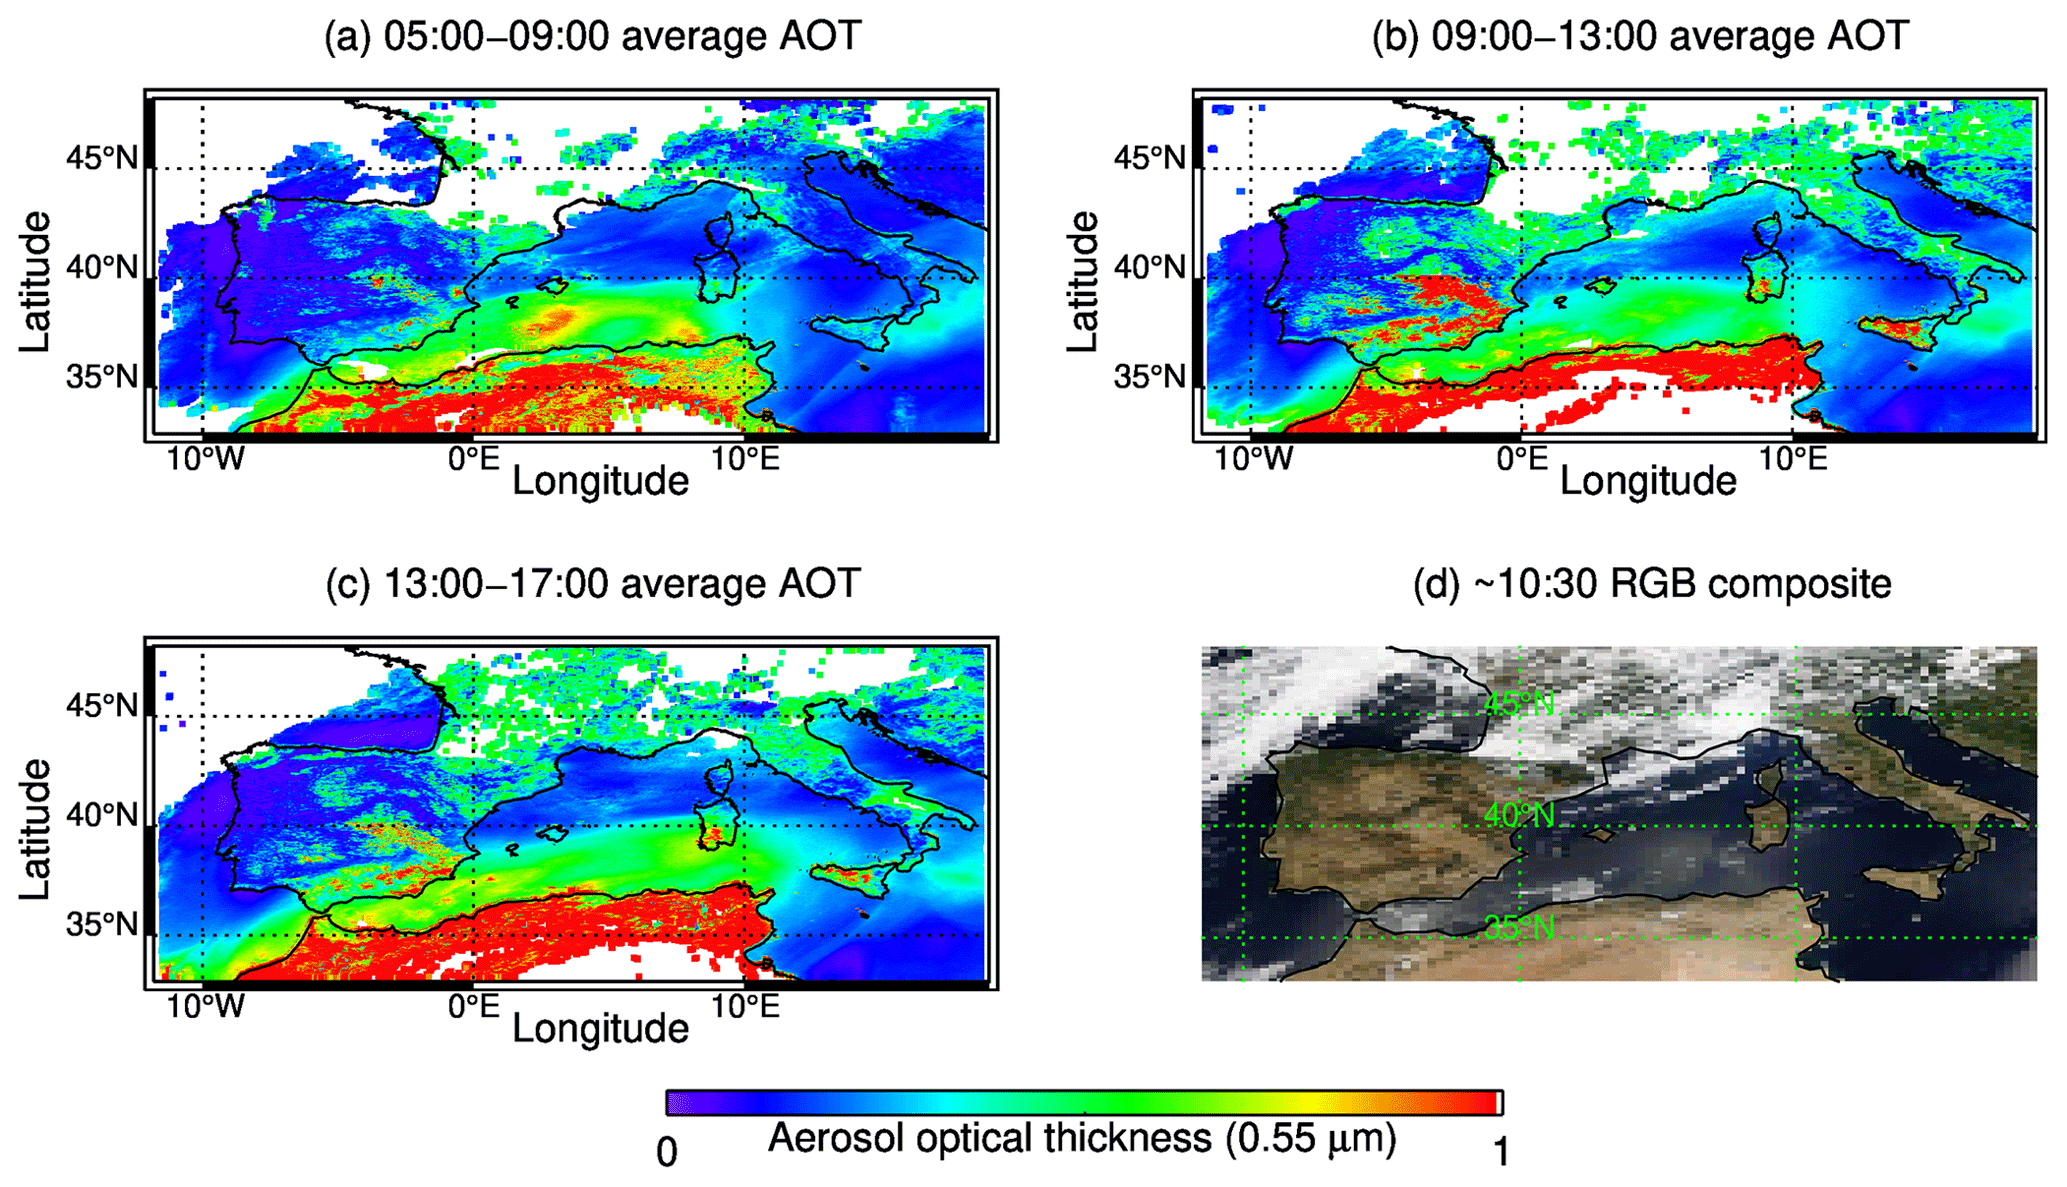
Figure 32(a–c) Aerosol optical thickness at 0.55 µm as retrieved from SEVIRI from 05:00 to 17:00 UTC on 11 July 2017, (d) MODIS RGB composite figure showing corrected reflectance at 10:30 UTC (https://worldview.earthdata.nasa.gov/, last access: 21 March 2022). The MODIS RGB composite is created combining red, green, and blue bands into one picture. White areas are clouds. The E-EU-03 flight track (in red) is superimposed in panel (d).
4.5 Photochemical processing of polluted air masses during transport
Photochemical processing of the MPC emissions during transport was substantial during EMeRGe as inferred from airborne observations of primary and secondary pollutants and the ratios between species having different chemical lifetime:
- a.
The NO-to-NOy ratio provided information about the reactivity of the air mass but was not a reliable chemical clock due to the complex and rapid chemistry involved in the air masses investigated. Depending on the chemical and physical conditions, the lifetime of NO versus the formation of other reactive nitrogen compounds was of the order of a few hours or less. Internal transformation processes within the family of total reactive nitrogen NOy do not alter their integrated concentration. However, the lifetime of NOy, which varies between hours and days, is also controlled by loss processes such as washout and aerosol formation.
- b.
The NOy-to-CO ratio was generally significantly higher for the processed polluted plumes than for the background air masses. For instance, during E-EU-08 the NOy-to-CO ratio was of the order of 0.01 to 0.02 in the air sampled outside the outflow of London and increased up to 0.1 in the London outflow plumes, as the air mass was processed and mixed. This ratio is usually used to study ageing of an air mass with respect to ozone and nitrogen chemistry (e.g. Stohl et al., 2002). The CO lifetime varies between several weeks and months (e.g. Emmons et al., 2010) and the NOCO ratio is expected to decline to background values within a few days, depending on the distance from the source as well as on the chemical and physical properties of the air mass.
- c.
The ratio between VOCs with comparable emission sources but significantly different chemical lifetimes such as C7HC6H6 was a good indicator for the presence of freshly or already processed anthropogenic emissions in the probed air within EMeRGe (Förster et al., 2022). This ratio is often used as a chemical clock to study emissions from gasoline-powered engines for traffic and industry (Gelencsér et al., 1997; Shaw et al., 2015; Warneke et al., 2001). The atmospheric lifetime of these aromatic hydrocarbons, i.e. 1.9 and 9.4 d, respectively (Garzón et al., 2015), is assumed to be controlled only by the reaction with OH radicals (Atkinson, 2000). Provided that the emission rates are known, the C7HC6H6 ratio is expected to decrease with increasing distance to the pollution source and can be used to estimate the photochemical age of the sampled air (Winkler et al., 2002; Warneke et al., 2007). However, the complex plume mixing before sampling and potential variations in the emission ratios of distinct VOC sources (e.g. Barletta et al., 2005) limited the use and feasibility of this chemical clock for the determination of the transport time of specific outflows in EMeRGe.
- d.
The combination of C7HC6H6 and NOCO ratios with the simultaneous observations of CO and organic ions in aerosol particles enabled the discrimination of dilution and processing in the plumes. Figure 33 shows an example of photochemical processing of the gas and the aerosol phases in ageing London plumes as measured by the C-ToF-AMS during E-EU-08. Aerosol mass spectrometer data using organic ions containing oxygen, e.g. CO ( 44) and C2H3O+ ( 43), were used to assess photochemical oxidation. Observations from laboratory and field studies indicate that during photochemical processing the ion signal of 43 decreases while that of 44 increases (Ng et al., 2010; Lambe et al., 2011). This metric is used to infer the degree of photochemical processing of organic aerosol in the atmosphere (e.g. Ng et al., 2011; Schroder et al., 2018; de Sá et al., 2018). The data in Fig. 33 are plotted in f44–f43 space, where f denotes the ratio of the respective ion to the total organic ion signal. In these metric, atmospheric processing moves the data points towards the upper left corner of the triangle indicated by the dotted lines (Ng et al., 2010). Since photo-oxidation of fresh plumes is fast and mixing of aged plumes with the background occurs, the use of aerosol composition to assess photochemical processing requires complementary information from other measurements to be reliable. This is achieved by using simultaneous measurements of CO to indicate dilution, while inferring atmospheric processing from the C7H8C6H6 and NOCO ratios. Lower CO concentrations due to plume dilution along transport correspond to higher photochemical processing in the upper part of the triangle. As NOy has a shorter lifetime than CO, the NOCO ratio indicates that the processing is taking place in addition to dilution. Therefore, lower NOCO and C7HC6H6 ratios in the upper part of the triangle indicate aged and processed air. In the case shown, the FLEXTRA backward trajectories revealed that the air masses identified as “background” were transported above the PBL and had no recent contact to the London MPC. The anthropogenically influenced air masses were a mixture of recent emissions and photochemically processed London outflow as mentioned in Sect. 4.3 (see also Fig. 36).
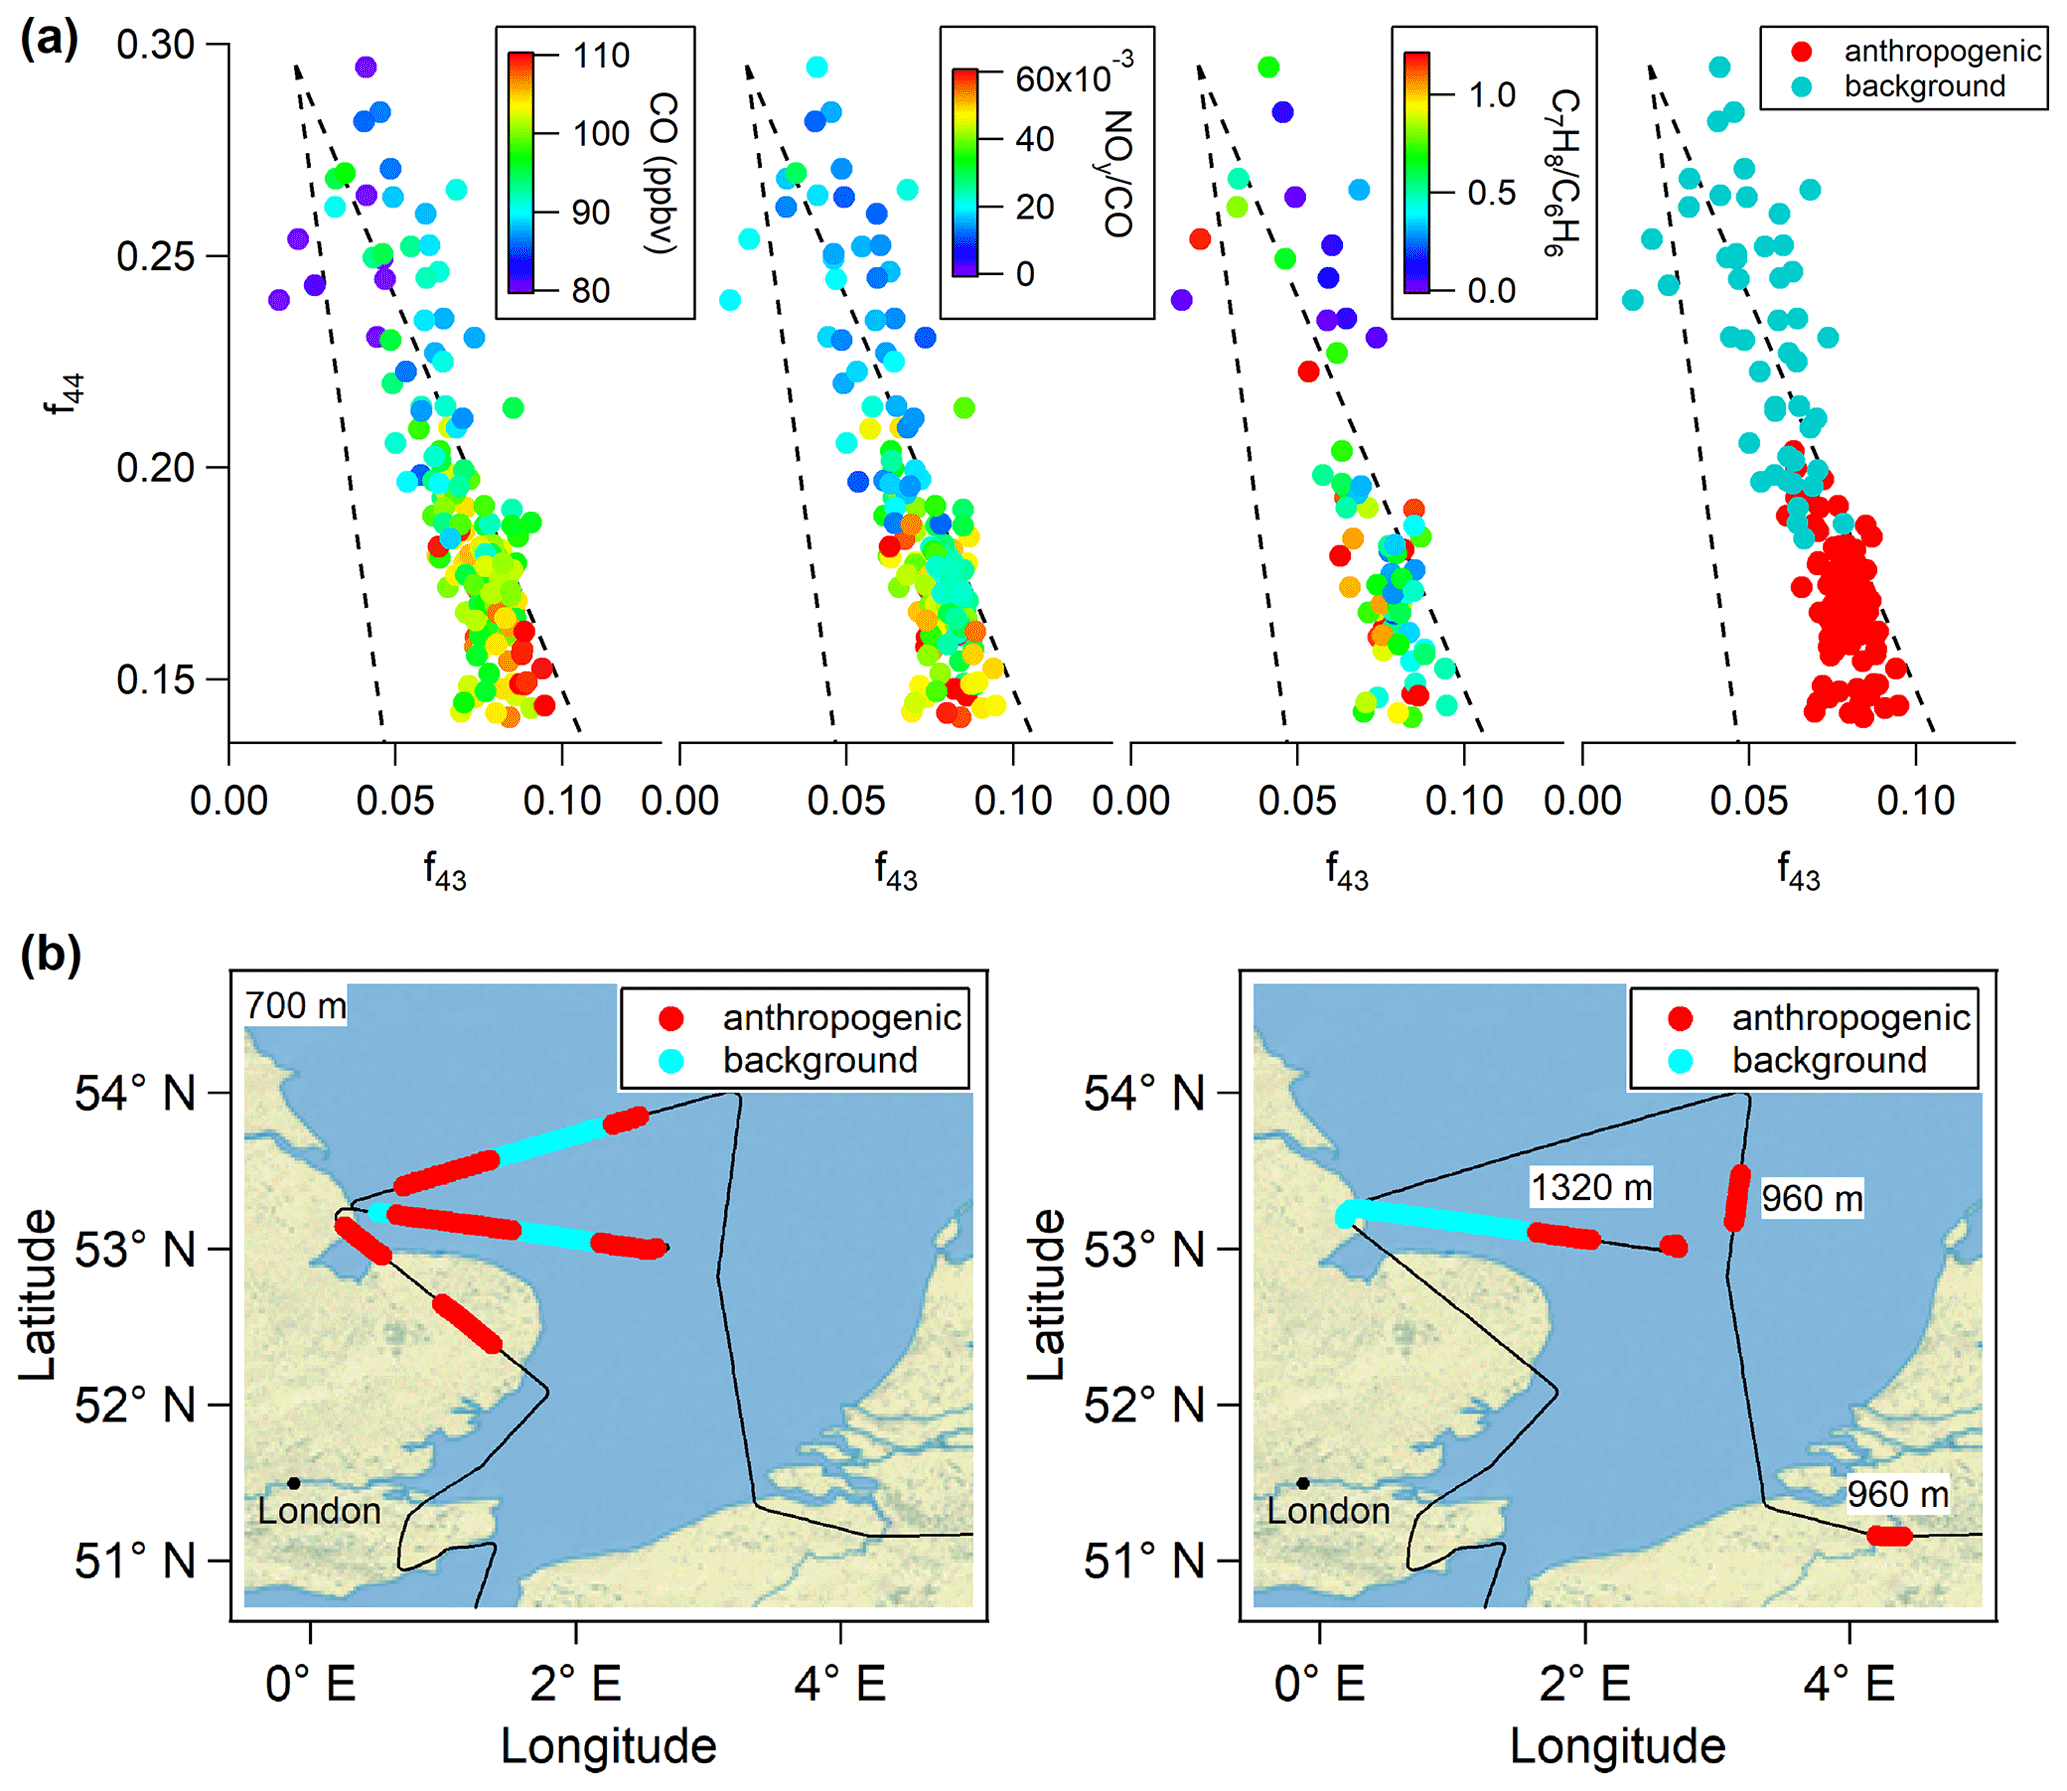
Figure 33(a) Scatter plots of C-ToF-AMS signal fractions at 44 (f44) and 43 (f43) of the London plume measured during the E-EU-08 on 26 July 2017 between 10:20 and 12:57 UTC. In this metric, the degree of photochemical processing increases to the upper left corner of the triangle which encompasses the range of typical atmospheric observations. The colour code indicates dilution (CO) and processing of the gas phase (NOy-to-CO and C7H8-to-C6H6 ratios). The right panel shows the assignment to unpolluted background air and air masses of anthropogenic polluted origin as introduced in Sect. 4.2b. Spatial distribution of the background and anthropogenic polluted air masses identified in panel (a). The flight altitudes are indicated in the graphs.
Photochemical processing of aerosol was evident during the transport of MPC plumes. Chemical processing was fast under European summer conditions and modified both the chemical properties and the partitioning between gas and particle phase in the air masses over Europe. The aerosol composition and mass loadings were to a large degree determined by the atmospheric dynamics; i.e. mass concentrations in the PBL were generally higher than above, and most of the MPC plumes were found to reside in the PBL. However, anthropogenically influenced air masses above the PBL were found to also contain higher aerosol mass concentrations than air masses not influenced by anthropogenic emissions. Plume air contained less oxygenated organic aerosol, but the transition to background air conditions was smooth, indicating that the aerosol oxidation was faster than the decay of benzene which was used for the plume tagging.
The photochemical activity as indicated by the presence of free radicals varied widely in the plumes. The RO mixing ratios observed in EMeRGe are shown in Fig. 34. The RO measured is the sum of HORO2, R being an organic chain which produces NO2 in its reaction with NO. Mixing ratios up to 120 pptv RO were measured in the air masses probed. Provided that insolation conditions (i.e. actinic fluxes) and the amount of precursors are similar, peroxy radicals are expected to be produced as long as plumes mix at any altitude. Generally, higher RO were measured below 45∘ N and 3000 m. This was in part due to the higher insolation and temperatures prevailing during the flights over the Mediterranean area, which accelerated photooxidation and the production of RO. Rates of photochemical production and loss of HO2 and RO2 were estimated by using airborne measurements and photostationary steady state calculations. In particular the measured photolysis frequencies are important to quantify the primary production of radicals and to elucidate the radical budget based on the measured RO concentrations. Overall, measured and estimated radical concentrations are in good agreement (George et al., 2022). Up to 4000 m, O3 photolysis was found to be the primary radical source (> 40 %) followed by HCHO photolysis in the air masses probed. HONO and HNO3 formation and heterogeneous losses on the aerosol surface dominated the peroxy radical losses in the polluted plumes encountered. The O3 production rates calculated from the RO measured on board are consistent with the values reported in urban pollution for NO < 1 ppbv (e.g. Tan et al., 2017; Whalley et al., 2018, 2021).
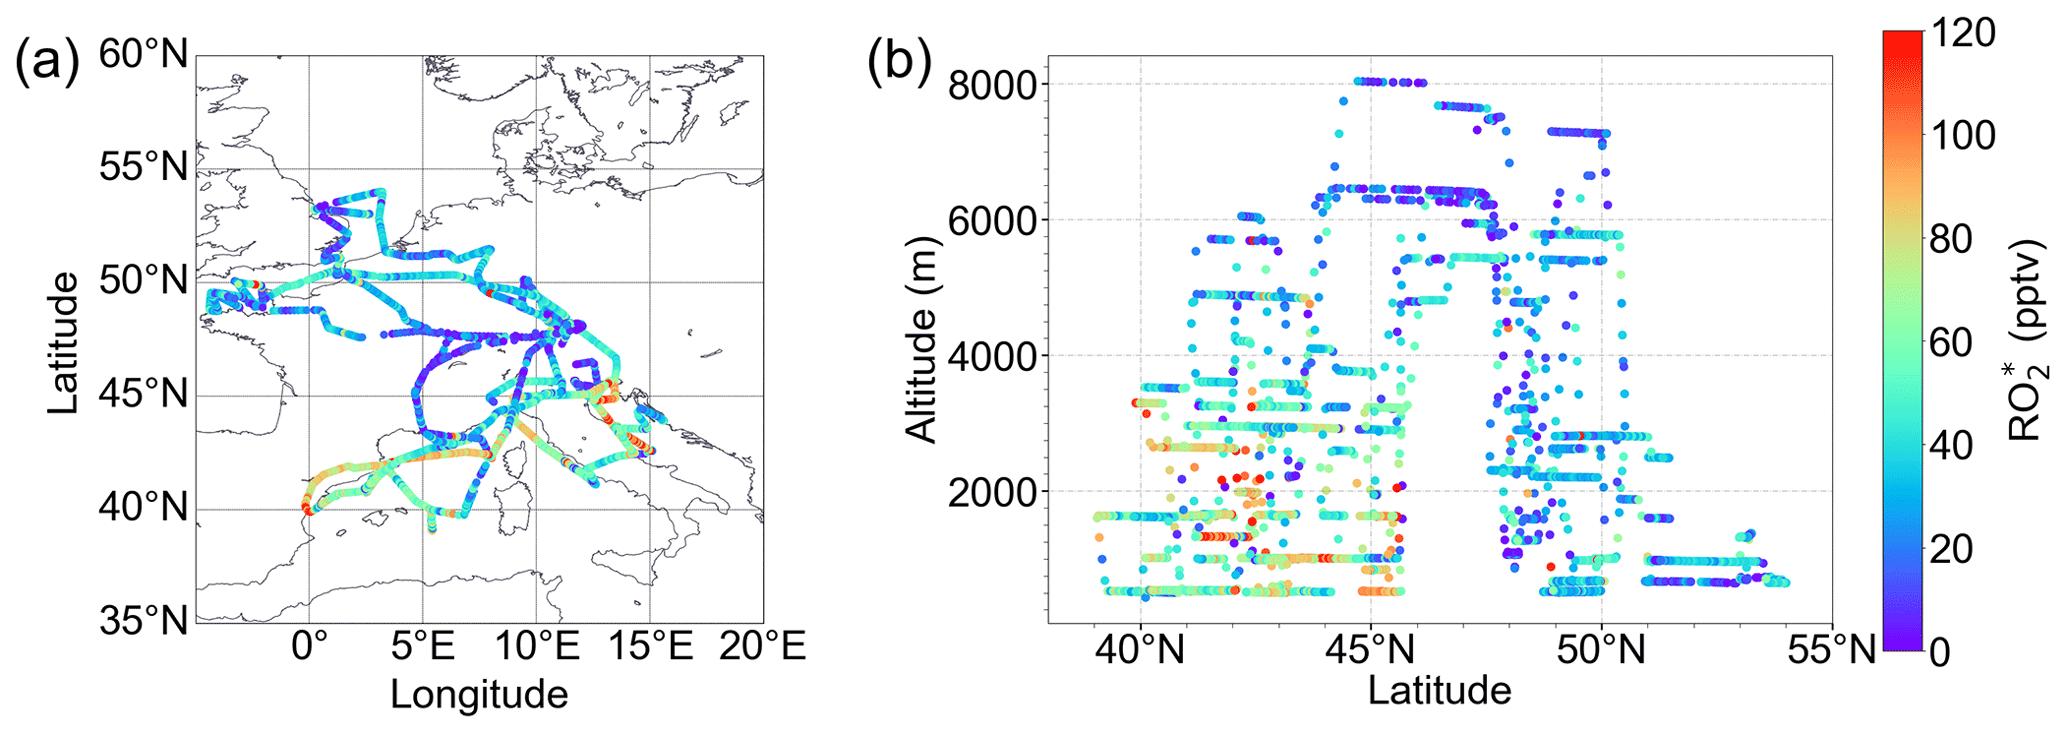
Figure 34RO spatial and vertical distribution measured along all EMeRGe flights in Europe.
During the EMeRGe IOP, the secondary photochemical formation of formic acid (HCOOH) was observed to be the main source of HCOOH in Europe, in pollution plumes of major cities aged 24 to 48 h. Figure 35 shows HCOOH enhancements above ambient background relative to CO enhancements in different MPC plumes as a function of plume age. Here, ΔHCOOH and ΔCO are determined from the measurements and the plume age from HYSPLIT simulations considering CO emissions from the Emissions Database for Global Atmospheric Research (EDGAR) and the dispersion of the plumes during transport. CO is used as an indicator of the strength of emissions from combustion in the individual MPC plumes and as tracer for the dilution of the plumes for the meteorological conditions during the measurements. Although HCOOH has primary sources, i.e. the emissions by fossil fuel combustion and BB, the secondary formation from gas-phase and aqueous photochemistry has been suggested to be dominant in the troposphere (Paulot et al., 2011). The ΔHCOOH to ΔCO ratios in Fig. 35 increase significantly with plume age indicating secondary formation of HCOOH to be the main source in the MPC plumes, mainly due to oxidation of C5H8 in the plume.
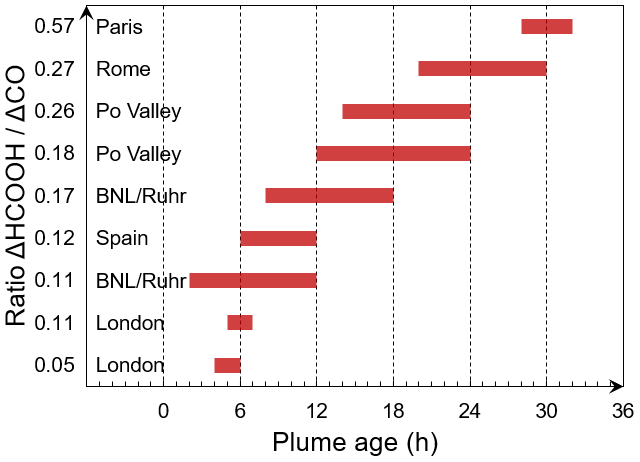
Figure 35Observed enhancements of formic acid (ΔHCOOH) in MPC plumes relative to observed CO enhancements (ΔCO) as a function of plume age from HYSPLIT simulations. The corresponding city plume is indicated next to the ratios.
Chemical ageing of MPC plumes was additionally assessed from the isotope measurements in VOC samples collected at MPC ground sites and aboard HALO. Figure 36 shows an example of the measured δ13C values of C5H10O and C6H6 observed during E-EU-08. Low carbon isotope ratios indicate fresh emissions, whereas higher values indicate an enrichment of the compound in 13C, which is linked to chemical ageing. The identified London outflow in Sect. 4.3 is also evident in the carbon isotope ratios obtained from HALO samples taken between 10:00 and 11:00 UTC. The latter remain in the range of the representative source values from whole air samples collected at the ground station in London. The higher δ13C values observed between 11:10 and 12:00 UTC indicate chemically processed London outflow air. Later in the flight, the δ13C values measured over the BNL/Ruhr area are in the range of the source values in air samples collected in Wuppertal. The range in δ13C values of ±1.5 ‰ in C5H10O (±3.5 ‰ in C6H6) implies a mixture of slightly aged air and rather fresh emissions from the Ruhr area.
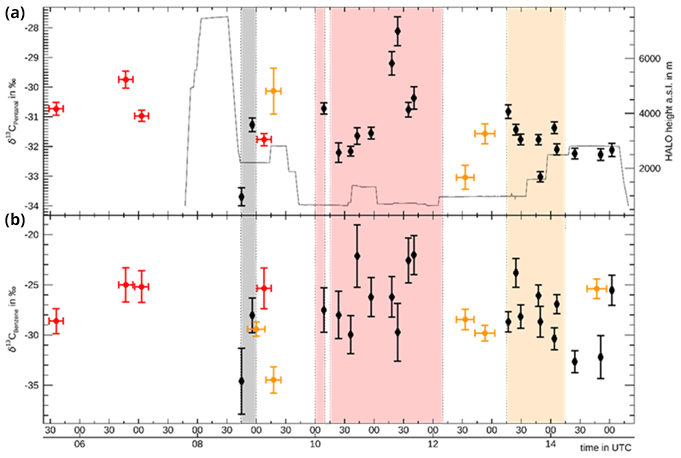
Figure 36δ13C values in C5H10O (a) and C6H6 (b) in whole air samples gathered with the whole air sampler MIRAH on the HALO aircraft (black) during E-EU-08 as well as on the ground sites in London (red) and Wuppertal (orange). The HALO flight altitude is given in grey on the top panel. Background shadings indicate different measurement regions during the flight according to Fig. 4: Paris (grey), south of London and North Sea region (red), and BNL/Ruhr (orange).
4.6 Model simulations of EMeRGe observations
First results of the global/regional chemistry-climate MECO(n) model (Kerkweg and Jöckel, 2012; Mertens et al., 2016) indicated that the emissions of NOx and/or their further processing in the model (deposition, washout, chemical transformation) reasonably agree with the HALO measurements. However, the simulation of complex plume structures would benefit from a higher model spatial resolution.
An example is given in Fig. 37 for the E-EU-05 flight on 17 July 2017, when the London plume was probed over the English Channel. The MECO(n) model couples a global and a regional chemistry climate model. In the set-up applied here, central Europe was resolved with up to 7 km horizontal resolution. The model data were sampled along the HALO flight paths with 60 s temporal resolution using the Modular Earth Submodel System (MESSy) submodel S4D (Jöckel et al., 2010). These sampled model data are used for a one-by-one comparison with the measurements. The EDGAR 4.3.1 emission inventory for the year 2010 was used (see Sect. S14 in the Supplement for further details).
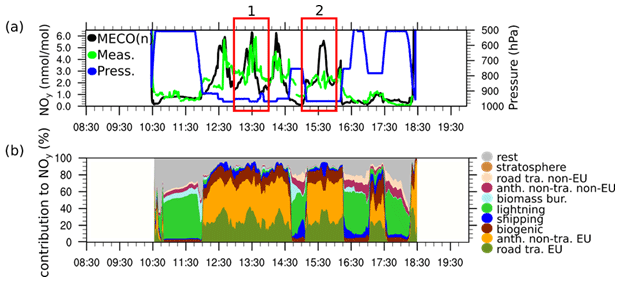
Figure 37(a) NOy mixing ratios measured (green) and simulated by the MECO(n) model (black) for E-EU-05 on 17 July 2017. The blue line denotes the pressure altitude of the aircraft (right axis). (b) Relative contributions of different emission sectors to the NOy mixing ratios simulated by MECO(n). Note that the NOy measurements were averaged to 60 s to fit the MECO(n) temporal resolution.
The enhancements of NOy between 12:00 and 16:00 UTC below 900 hPa in Fig. 37a are reasonably well simulated by the model except for the measurements at around 15:30 UTC which are strongly overestimated. To address this issue, two plumes marked as “1” and “2” in Fig. 37a were investigated in more detail. The model results and the measurements on the plume marked “1” are shown at 980 and 965 hPa in Fig. 38a. 980 hPa is the pressure of the model layer which is nearest to the HALO flight altitude at 13:30 UTC, while 965 hPa is the pressure of one model layer above. The model results show large horizontal and vertical inhomogeneities in the NOy mixing ratios indicating different mixtures instead of a single London plume. The NOy enhancement coincides with the London plume (marked with the turquoise square in Fig. 38a).

Figure 38NOy mixing ratios as simulated by MECO(n) (background) and measured during E-EU-05. The model results at 980 and 965 hPa are shown. Model results are averaged between (a) 13:00 and 14:00 UTC, and (b) 15:00 and 16:00 UTC. The measured mixing ratios of NOy during 13:00–14:00 UTC and 15:00–16:00 UTC are colour coded and highlighted by grey contours. Black lines indicate coast lines. The turquoise rectangles highlight the regions discussed in the text.
Similarly, Fig. 38b shows the model results and measurements for the plume marked “2”. Here, the model shows a large plume remnant in the western part (turquoise square in Fig. 38b) leading to the overestimation of mixing ratios around 15:30 UTC. The simulated mixing ratios in a higher model layer are lower and agree better with the observations. These results indicate that a vertical displacement of the plume remnant causes the mismatch between measurements and model results around 15:30 UTC.
MECO(n) results showed a positive bias in O3 and a negative bias in CO with respect to the EMeRGe measurements over Europe. This confirms previous comparisons with other observational data (see Mertens et al., 2016, 2020a, b) and is investigated for EMeRGe in separate sensitivity studies focusing on the representation of the NOx–VOC–O3 chemistry and the evaluation of the applied emission data sets.
The diagnostic capabilities of MECO(n), e.g. the tagging method by Grewe et al. (2017), were applied to individual EMeRGe flight tracks to investigate the impact of emissions on the atmospheric chemistry in Europe. Figure 37b shows the relative contribution of the different emission sectors to the measured NOy mixing ratios during the E-EU-05 as a stacked graph. According to this, emissions from European road transport, anthropogenic non-traffic and biogenic sectors dominate the NOy mixing ratios of the London plume with a similar relative contribution in all four plume crossings. For the NOy measurements in the free troposphere (until 12:00 UTC approximately), a large relative contribution of lightning emissions is calculated in the model. In these regions, however, the absolute mixing ratios are rather low. As the NOy lifetime is much longer in the upper troposphere than in the PBL, LRT of NOy might be more likely than encounters of fresh lightning NO plumes. A detailed description of the model and the source apportionment technique are provided in the Supplement (Sect. S14).
The tracer experiments during EMeRGe additionally tested the ability of models (HYSPLIT, FLEXPART, FLEXPART-WRF, FALL3D) to simulate the transport and dispersion of the tracer for different meteorological conditions and topography around the release sites. While the simulated position of the PFC plumes agreed with the measurements, the tracer mixing ratios calculated by the dispersion models were by a factor of 2 to 3 higher than detected. The degree of agreement between the tracer simulations and observations depended on the parameterisation of dispersion and the representation of the topography in the models, as well as the goodness of tracer sampling in the plume; e.g. matching the maximum PFC concentrations was not always possible due to restrictions by air traffic control and flight endurance. Sensitivity studies with different meteorological data sets (ECMWF's ERA5 and IFS) and advanced turbulence parameterisation options in the PBL highlighted the pivotal role of meteorological input data in transport simulations.
EMeRGe contributes to the long history of providing observations facilitating a continuous and incremental progress in the capability to forecast and simulate atmospheric composition and chemistry. The interpretation of the extensive EMeRGe observational data set provides a clear step forward in understanding the complex spatial distribution of trace gases and aerosol particles resulting from mixing, transport, and transformation of pollution plumes over Europe. The present work is an overview of the most salient results which are addressed in additional dedicated EMeRGe studies. The lessons learned from a continued analysis of the EMeRGe observations are also expected to be valuable to build upon and to improve airborne measurement strategies for future deployments focusing on pollution in Europe. First of all, the results of EMeRGe confirm the chemical complexity of the air masses over Europe as a result of the mixing of emissions from nearby MPC sources. EMeRGe airborne observations of primary and secondary pollutants and the ratios between species having different chemical lifetime were used as tracers of the degree of processing of the pollution plumes probed. The distinction between fresh and aged air was possible and gave a coherent picture for the applied methods and chemical clocks. However, high specific background measurements close to MPCs are needed, and following the ageing of the outflow of a single MPC is challenging. At large distances from the source, the use of gas and aerosol trace species is insufficient for unequivocally identifying MPC plumes. In this context, the relevance of PFC tracers and the support of adequate transport models become obvious. EMeRGe is one of the first airborne measurement campaigns using air mass tracer approaches and has successfully demonstrated its value. For future studies, sampling the same air mass inside a tagged MPC plume at several different ageing states, either by following the air mass or by crossing the plume at different distances from the source, would be beneficial to investigate the atmospheric processing of trace gases and organic aerosol as a function of time. For this (quasi-)Lagrangian approach the combination with either a Zeppelin-based measurement platform or with a small, slow-flying aircraft might be suitable to cope with air traffic control restrictions, in particular for low-level flights close to MPCs.
Satellite data have proven useful in assessing the overall pollution patterns and to put measurements during the campaign phase into a long-term perspective. For future campaigns, the new generation of geostationary air quality satellites, started with the South Korean GEMS instrument providing data at hourly resolution, will enable detailed tracing of transport patterns and chemical evolution. For flight planning, satellite observations are best used in combination with models which provide forecasting capability. In the case of EMeRGe, the use of CAMS tracer and full chemistry forecasts facilitated the measurement of several pollution plumes. Subsequent comparisons to the measurements reflect the quality of the forecasts and support the improvement of future model runs. The total column AOT derived from geostationary satellites provided valuable information for the EMeRGe campaign. The integration of satellite total column AOT and model-simulated aerosol extinction profile information enables further analysis of the component aerosol near the EMeRGe flight height. An important step to move further is the synergistically use of hyperspectral and multi-spectral satellite instruments for a better understanding of the aerosol component near the flight height and the component AOT (e.g. dust AOT, black carbon AOT).
An interesting aspect of EMeRGe is the high added value from measurements rarely used for the characterisation of urban pollution. In that sense, the measurement of stable carbon isotope ratios in VOC collected on the ground close to or at certain MPCs supported source apportionment and the estimation of integrated residence times of compounds in the air sampled aboard HALO. EMeRGe has significantly expanded the very rare coverage of stable carbon isotope data from different locations and atmospheric regions. This and future data sets are valuable to verify model results and to assess the physical and chemical processing of VOCs during transport.
Similarly, the sparse in situ data available for HCOOH have also been enhanced by EMeRGe. This major organic acid in the troposphere was found to be more abundant in MPC plumes than the sulfur and nitrogen precursor species of inorganic acids. The HCOOH production rates in the pollution plumes as a function of the plume ages during the EMeRGe IOP in Europe differ significantly to those encountered in Asia. Future studies are required to investigate sources and composition of organic compounds with respect to the effect on the formation and the properties of aerosols, clouds and acidity of precipitation in different seasons and for MPCs in different regions of the world. Furthermore, signatures of urban sources of long-lived GHGs like CH4 and CO2, identified in the airborne measurements in plumes close to the MPC regions in Europe, provided valuable insights on sources and expanded the knowledge on existing top-down studies by confirming urban emission hotspots. Accurate knowledge of GHG sources and sinks in MPCs establishes the link between air quality and climate change. In that respect, the impact of climate change (e.g. increasing number of fires, temperature effect on chemical processing, changes in radiation), and emission reduction strategies or the use of alternative fuels, on the composition and transformation of the outflows along transport requires increasing interest. Dedicated local flight experiments complemented with coordinated ground-based GHG measurements on several days and seasons for the same area are highly desirable to obtain a more comprehensive picture. This would show seasonal evolution and emission sources (e.g. residential biomass burning in winter), increase statistics, and reinforce the findings.
Finally, the EMeRGe set of airborne data is particularly expected to support photochemical transport models in assessing
-
the relative contribution of biogenic, BB, and anthropogenic sources to the VOC burden over Europe,
-
the net ozone production in the investigated MPC outflows in relation to the transport time and mixing of the pollution plumes,
-
the adequacy of radiative transfer model calculations and the prediction capabilities of photolysis frequencies,
-
the contribution of VOC species such as glyoxal and/or methylglyoxal to secondary aerosol formation in aged pollution plumes,
-
the adequacy of Ångström coefficients, aerosol fine-mode fraction products, and the geostationary satellite derived AOT to identify aerosol sources and transport features of mixing events of anthropogenic particles and mineral dust, and
-
the significance and representativeness of the transport and concentration patterns obtained during EMeRGe in summer 2017, which was a period with anomalous meteorological conditions in central Europe.
The EMeRGe data are available at the HALO database (https://doi.org/10.17616/R39Q0T, DLR, 2022) and can be accessed upon registration. Further data can be made available upon request to the corresponding author.
The supplement related to this article is available online at: https://doi.org/10.5194/acp-22-5877-2022-supplement.
MDAH led the preparation, writing, review, and editing of the manuscript. All authors were involved in the interpretation of data, review, and editing of the text. JPB, HZ, JoS, MV, KP, RK, HS, AZ, UP, and MDAH, member of the Scientific Steering Committee, supported by UPö and SB, originated and defined the EMeRGe measurement concept and campaigns, and contributed to the funding acquisition and project administration. HZ was responsible for the NO and NOy measurements. EF and HB were responsible for the VOC measurements. OOK, BAH, MLP, and CP were responsible for the CCN-rack measurements. KK and JoS were responsible for the C-ToF-MS measurements. MG, VN, YL, and MDAH were responsible for the RO2∗ measurements. TH was responsible for the CO2 and CH4 measurements. HS was responsible for the PFC tracer measurements. JW and DS were responsible for the AMETYST measurement. BS, FK, and KP were responsible for the miniDOAS and KB for the HAIDI measurements. LE was responsible for the SO2 and HCOOH measurements. MK and RK were responsible for MIRAH measurements. BB was responsible for the HALO-SR measurement. GS was responsible for the PAN measurements. US provided the evaluation of the HALO-FAAM measurement comparison exercise. EF, HZ, and HB provided the classification of pollution events. HH and AMB were responsible for the interpretation of meteorological and CAMS data. JS, AS, FB, MPa, MS, JLGA, MP, and MC provided the analysis of AERONET and ALICEnet data. AH, ABKH, and ND provided FLEXTRA trajectories, and RB provided HYSPLIT calculations of the CO dispersion of local emissions for EMeRGe. DW contributed to the forward trajectory density calculations. MM, PJ, and MK provided the analysis of the MeCO(n) data, and LM and AR provided that of the retrieved satellite data.
At least one of the (co-)authors is a member of the editorial board of Atmospheric Chemistry and Physics. The peer-review process was guided by an independent editor, and the authors also have no other competing interests to declare.
Publisher's note: Copernicus Publications remains neutral with regard to jurisdictional claims in published maps and institutional affiliations.
This article is part of the special issue “Effect of Megacities on the Transport and Transformation of Pollutants at Regional and Global Scales (EMeRGe) (ACP/AMT inter-journal SI)”. It is not associated with a conference.
The authors thank the following teams and individuals, without whom the EMeRGe in Europe IOP would not have been possible:
-
HALO flight organisation, permissions and related: the DLR-FX and the HALO EMeRGe team. Special thanks are given to Lisa Kaser, Frank Probst, Michael Großrubatscher, Stefan Grillenbeck, Marc Puskeiler, for flight coordination and planning, to Alexander Wolf, and Thomas Leder, the flight engineers and to the BAHAMAS team. The authors also thank enviscope GmbH in particular of Nicole Brehm and Rolf Maser for the support during the integration and preparation phase of the IOP in Europe.
-
Meteorological and chemical composition forecasting: Michael Gauss and Álvaro Valdebenito (MetNo) for provision of EMEP forecasts for the campaign and CAMS/ECMWF, in particular Johannes Flemming and Luke Jones for providing the atmospheric composition and tracer forecasts through the CAMS field campaign support (https://atmosphere.copernicus.eu/scientific-field-campaign-support, last access: 18 April 2018). The CAMS regional modelling team are also acknowledged for providing regional model forecast data for Europe.
-
Ground-based remote sensing observations: EARLINET for providing aerosol lidar measurements and DWD, ALICEnet, and RMI for ceilometer measurements. The support from AERONET, Service National d'Observation PHOTONS/AERONET-EARLINET part of the ACTRIS-France research infrastructure, and GOA-CF, part of ACTRIS-Spain, for their continuous efforts in providing high-quality measurements and products, and in particular of all PIs and co-PIs of the AERONET sites contributing to EMeRGe for maintaining their instruments and providing their data to the community, is greatly appreciated.
-
Luca Ferrero (GEMMA and POLARIS Research Centers, Department of Earth and Environmental Sciences, University of Milano-Bicocca) for the air samples collected at the ground in Milan (Italy) during the HALO flights.
-
Tracer releases: Jonathan E. Murray and Helen Graven and the Imperial College team for releasing the PFC tracer in London.
Katharina Kaiser and Johannes Schneider would like to thank Christiane Schulz and Philipp Schuhmann for support during the integration phase. Bruna A. Holanda, Ovid O. Krüger, Christopher Pöhlker, David Walter, Ulrich Pöschl, and Mira L. Pöhlker would like to thank Thomas Klimach, Björn Nilius, Jorge Saturno, Oliver Lauer, and Meinrat Andreae for support during the EMeRGe campaign in Europe and during the data analysis.
M. Dolores Andrés Hernández, Midhun George, Yangzhuoran Liu, and John Phillip Burrows thank Wilke Thomssen for support during the preparation and integration phases of EMeRGe and Heiko Schellhorn for continuous technical support and retrieval of model data during the campaigns.
The HALO deployment during EMeRGe was funded by a consortium comprising the German Research Foundation (DFG) Priority Program HALO-SPP 1294, the Institute of Atmospheric Physics of DLR, the Max Planck Society (MPG), and the Helmholtz Association.
Flora Kluge, Benjamin Schreiner, and Klaus Pfeilsticker acknowledge the support given by the DFG through the project nos. PF 384-16, PF 384-17, and PG 385-19. Ralf Koppmann and Marc Krebsbach acknowledge DFG funding through project no. KR3861_1-1. Katja Bigge acknowledges additional funding from the Heidelberg Graduate School for Physics. Johannes Schneider, Katharina Kaiser, and Stephan Borrmann acknowledge funding through the DFG (project no. 316589531). Lisa Eirenschmalz and Hans Schlager acknowledge support by DFG through project MEPOLL (SCHL1857/4-1). Anna B. Kalisz Hedegaard would like to thank DAAD and DLR for a Research Fellowship. Hans Schlager acknowledge financial support by the DLR TraK (Transport and Climate) project. Michael Sicard acknowledges support from the EU (GA nos. 654109, 778349, 871115, and 101008004) and the Spanish Government (ref. nos. CGL2017-90884-REDT, PID2019-103886RB-I00, RTI2018-096548-B-I00, and MDM-2016-0600).
Midhun George, Yangzhuoran Liu, M. Dolores Andrés Hernández, and John Phillip Burrows acknowledge financial support from the University of Bremen. FLEXPART simulations were performed on the HPC cluster Aether at the University of Bremen, financed by DFG within the scope of the Excellence Initiative. Anne-Marlene Blechschmidt was partly funded through the CAMS-84 project.
Jennifer Wolf acknowledges support from the German Federal Ministry for Economic Affairs and Energy – BMWi (project Digitally optimized Engineering for Services – DoEfS; contract no. 20X1701B).
Theresa Harlass thanks DLR VO-R for funding the young investigator research group “Greenhouse Gases”.
Mariano Mertens, Patrick Jöckel, and Markus Kilian acknowledge resources of the Deutsches Klimarechenzentrum (DKRZ) granted by the WLA project ID bd0617 for the MECO(n) simulations and the financial support from the DLR projects TraK (Transport und Klima) and the Initiative and Networking Fund of the Helmholtz Association through the project “Advanced Earth System Modelling Capacity” (ESM).
Bruna A. Holanda acknowledges the funding from Brazilian CNPq (process 200723/2015-4).
The article processing charges for this open-access
publication were covered by the University of Bremen.
This paper was edited by Gabriele Stiller and reviewed by two anonymous referees.
AERONET: AERONET aerosol data base, http://aeronet.gsfc.nasa.gov/, last access: 11 December 2020.
Alfarra, M. R., Prevot, A. S. H., Szidat, S., Sandradewi, J., Weimer, S., Lanz, V. A., Schreiber, D., Mohr, M., and Baltensperger, U.: Identification of the mass spectral signature of organic aerosols from wood burning emissions, Environ. Sci. Technol., 41, 5770–5777, https://doi.org/10.1021/es062289b, 2007.
Alvarado, L. M. A., Richter, A., Vrekoussis, M., Hilboll, A., Kalisz Hedegaard, A. B., Schneising, O., and Burrows, J. P.: Unexpected long-range transport of glyoxal and formaldehyde observed from the Copernicus Sentinel-5 Precursor satellite during the 2018 Canadian wildfires, Atmos. Chem. Phys., 20, 2057–2072, https://doi.org/10.5194/acp-20-2057-2020, 2020.
Andreae, M. O.: Emission of trace gases and aerosols from biomass burning - an updated assessment, Atmos. Chem. Phys., 19, 8523–8546, https://doi.org/10.5194/acp-19-8523-2019, 2019.
Andreae, M. O. and Rosenfeld, D.: Aerosol–cloud–precipitation interactions. Part 1. The nature and sources of cloud-active aerosols, Earth-Sci. Rev., 89, 13–41, 2008.
Andreae, M. O., Afchine, A., Albrecht, R., Holanda, B. A., Artaxo, P., Barbosa, H. M. J., Borrmann, S., Cecchini, M. A., Costa, A., Dollner, M., Fütterer, D., Järvinen, E., Jurkat, T., Klimach, T., Konemann, T., Knote, C., Krämer, M., Krisna, T., Machado, L. A. T., Mertes, S., Minikin, A., Pöhlker, C., Pöhlker, M. L., Pöschl, U., Rosenfeld, D., Sauer, D., Schlager, H., Schnaiter, M., Schneider, J., Schulz, C., Spanu, A., Sperling, V. B., Voigt, C., Walser, A., Wang, J., Weinzierl, B., Wendisch, M., and Ziereis, H.: Aerosol characteristics and particle production in the upper troposphere over the Amazon Basin, Atmos. Chem. Phys., 18, 921–961, https://doi.org/10.5194/acp-18-921-2018, 2018.
Atkinson, R.: Atmospheric chemistry of VOCs and NOx, Atmos. Environ., 34, 2063–2101, 2000.
Barletta, B, Meinardi, S., Rowland, F. S., Chan, C.-Y., Wang, X., Zou, S., Chan, L. Y., and Blake, D. R.: Volatile organic compounds in 43 Chinese cities, Atmos. Environ., 39, 5979–5990, https://doi.org/10.1016/j.atmosenv.2005.06.029, 2005.
Barnaba, F. and Gobbi, G. P.: Aerosol seasonal variability over the Mediterranean region and relative impact of maritime, continental and Saharan dust particles over the basin from MODIS data in the year 2001, Atmos. Chem. Phys., 4, 2367–2391, https://doi.org/10.5194/acp-4-2367-2004, 2004.
Barnaba, F., Angelini, F., Curci, G., and Gobbi, G. P.: An important fingerprint of wildfires on the European aerosol load, Atmos. Chem. Phys., 11, 10487–10501, https://doi.org/10.5194/acp-11-10487-2011, 2011.
Barnaba, F., Di Liberto, L., Bellini, A., Diemoz, H., Campanelli, M., Shuli, I., Gobbi, G. P., Andrés Hernández, M. D., and Burrows, J. P.: The intricate summer mixing of atmospheric particles in an urban Mediterranean environment: a 4D insight from airborne and and ground measurements in Rome (Italy) during EMeRGe, in preparation, 2022.
Beekmann, M., Prévôt, A. S. H., Drewnick, F., Sciare, J., Pandis, S. N., Denier van der Gon, H. A. C., Crippa, M., Freutel, F., Poulain, L., Ghersi, V., Rodriguez, E., Beirle, S., Zotter, P., von der Weiden-Reinmüller, S.-L., Bressi, M., Fountoukis, C., Petetin, H., Szidat, S., Schneider, J., Rosso, A., El Haddad, I., Megaritis, A., Zhang, Q. J., Michoud, V., Slowik, J. G., Moukhtar, S., Kolmonen, P., Stohl, A., Eckhardt, S., Borbon, A., Gros, V., Marchand, N., Jaffrezo, J. L., Schwarzenboeck, A., Colomb, A., Wiedensohler, A., Borrmann, S., Lawrence, M., Baklanov, A., and Baltensperger, U.: In situ, satellite measurement and model evidence on the dominant regional contribution to fine particulate matter levels in the Paris megacity, Atmos. Chem. Phys., 15, 9577–9591, https://doi.org/10.5194/acp-15-9577-2015, 2015.
Boeke, N. L., Marshall, J. D., Alvarez, S., Chance, K. V., Fried, A., Kurosu, T. P., Rappenglück, B., Richter, D., Walega, J., Weibring, P., and Millet, D. B.: Formaldehyde columns from the Ozone Monitoring Instrument: Urban versus background levels and evaluation using aircraft data and a global model, J. Geophys. Res., 116, D05303, https://doi.org/10.1029/2010JD014870, 2011.
Bohn, B. and Lohse, I.: Calibration and evaluation of CCD spectroradiometers for ground-based and airborne measurements of spectral actinic flux densities, Atmos. Meas. Tech., 10, 3151–3174, https://doi.org/10.5194/amt-10-3151-2017, 2017.
Bond, T. C., Doherty, S. J., Fahey, D. W., Forster, P. M., Berntsen, T., DeAngelo, B. J., Flanner, M. G., Ghan, S., Kärcher, B., Koch, D., Kinne, S., Kondo, Y., Quinn, P. K., Sarofim, M. C., Schultz, M. G., Schulz, M., Venkataraman, C., Zhang, H., Zhang, S., Bellouin, N., Guttikunda, S. K., Hopke, P. K., Jacobson, M. Z., Kaiser, J. W., Klimont, Z., Lohmann, U., Schwarz, J. P., Shindell, D., Storelvmo, T., Warren, S. G., and Zender, C. S.: Bounding the role of black carbon in the climate system: A scientific assessment, J. Geophys. Res.-Atmos., 118, 5380–5552, https://doi.org/10.1002/jgrd.50171, 2013.
Brands, M., Kamphus, M., Böttger, T., Schneider, J., Drewnick, F., Roth, A., Curtius, J., Voigt, C., Borbon, A., Beekmann, M., Bourdon, A., Perrin, T., and Borrmann, S.: Characterization of a Newly Developed Aircraft-Based Laser Ablation Aerosol Mass Spectrometer (ALABAMA) and First Field Deployment in Urban Pollution Plumes over Paris During MEGAPOLI 2009, Aerosol Sci. Technol., 45, 46–64, https://doi.org/10.1080/02786826.2010.517813, 2011.
Bréon, F. M., Vermeulen, A., and Descloitres, J.: An evaluation of satellite aerosol products against sun photometer measurements, Remote Sens. Environ., 115, 3102–3111, https://doi.org/10.1016/j.rse.2011.06.017, 2011.
Bréon, F. M., Broquet, G., Puygrenier, V., Chevallier, F., Xueref-Remy, I., Ramonet, M., Dieudonné, E., Lopez, M., Schmidt, M., Perrussel, O., and Ciais, P.: An attempt at estimating Paris area CO2 emissions from atmospheric concentration measurements, Atmos. Chem. Phys., 15, 1707–1724, https://doi.org/10.5194/acp-15-1707-2015, 2015.
Brito, J. and Zahn, A.: An unheated permeation device for calibrating atmospheric VOC measurements, Atmos. Meas. Tech., 4, 2143–2152, https://doi.org/10.5194/amt-4-2143-2011, 2011.
Burrows, J. P., Richter, A., Dehn, A., Deters, B., Himmelmann, S., Voigt, S., and Orphal, J.,: Atmospheric remote sensing reference data from GOME: Part 2 temperature dependent absorption cross-sections of O3 in the 231–794 nm range, J. Quant. Spectrosc. Ra., 61, 509–517, 1999.
Butler, T. M. and Lawrence, M. G.: The influence of megacities on global atmospheric chemistry: A modelling study, Environ. Chem., 6, 219–225, 2009.
Butler, T. M., Stock, Z. S., Russo, M. R., Denier van der Gon, H. A. C., and Lawrence, M. G.: Megacity ozone air quality under four alternative future scenarios, Atmos. Chem. Phys., 12, 4413–4428, https://doi.org/10.5194/acp-12-4413-2012, 2012.
Campanelli, M., Bassani, C., Iannarelli A.M., Casadio, S., Barnaba, F. ,Bigge, K., Wolf , J., Sauer, D. ,Hilboll A., Cacciani , Mueller, M., Tiefengraber, M., Cede A., Perrino , C., Dionisi , D., Casasanta G., Andrés Hernández, M.D., Burrows, J.P.: Gas and aerosol properties over Rome during EMeRGe flights from columnar and profiling observations, in preparation, 2022.
Campos Braga, R. C., Rosenfeld, D., Weigel, R., Jurkat, T., Andreae, M. O., Wendisch, M., Pöschl, U., Voigt, C., Mahnke, C., Borrmann, S., Albrecht, R. I., Molleker, S., Vila, D. A., Machado, L. A. T., and Grulich, L.: Further evidence for CCN aerosol concentrations determining the height of warm rain and ice initiation in convective clouds over the Amazon basin, Atmos. Chem. Phys., 17, 14433–-14456, https://doi.org/10.5194/acp-17-14433-2017, 2017.
Cassiani, M., Stohl, A., and Eckhardt, S.: The dispersion characteristics of air pollution from the world's megacities, Atmos. Chem. Phys., 13, 9975–-9996, https://doi.org/10.5194/acp-13-9975-2013, 2013.
Chan Miller, C., Jacob, D. J., Marais, E. A., Yu, K., Travis, K. R., Kim, P. S., Fisher, J. A., Zhu, L., Wolfe, G. M., Hanisco, T. F., Keutsch, F. N., Kaiser, J., Min, K.-E., Brown, S. S., Washenfelder, R. A., González Abad, G., and Chance, K.: Glyoxal yield from isoprene oxidation and relation to formaldehyde: chemical mechanism, constraints from SENEX aircraft observations, and interpretation of OMI satellite data, Atmos. Chem. Phys., 17, 8725–-8738, https://doi.org/10.5194/acp-17-8725-2017, 2017.
Chance, K., Palmer, P. I., Spurr, R. J. D., Martin, R. V., Kurosu, T. P., and Jacob, D.: Satellite observations of formaldehyde over North America from GOME, Geophys. Res. Lett., 27, 3461–3464, 2000.
Chen, H., Winderlich, J., Gerbig, C., Hoefer, A., Rella, C. W., Crosson, E. R., Van Pelt, A. D., Steinbach, J., Kolle, O., Beck, V., Daube, B. C., Gottlieb, E. W., Chow, V. Y., Santoni, G. W., and Wofsy, S. C.: High-accuracy continuous airborne measurements of greenhouse gases (CO2 and CH4) using the cavity ring-down spectroscopy (CRDS) technique, Atmos. Meas. Tech., 3, 375–-386, https://doi.org/10.5194/amt-3-375-2010, 2010.
Colette, A., Granier, C., Hodnebrog, Ø., Jakobs, H., Maurizi, A., Nyiri, A., Bessagnet, B., D'Angiola, A., D'Isidoro, M., Gauss, M., Meleux, F., Memmesheimer, M., Mieville, A., Rouïl, L., Russo, F., Solberg, S., Stordal, F., and Tampieri, F.: Air quality trends in Europe over the past decade: a first multi-model assessment, Atmos. Chem. Phys., 11, 11657–11678, https://doi.org/10.5194/acp-11-11657-2011, 2011.
Copernicus Climate Change Service (C3S): ERA5: Fifth generation of ECMWF atmospheric reanalyses of the global climate, Copernicus Climate Change Service Climate Data Store (CDS), https://cds.climate.copernicus.eu (last access: 25 April 2022), 2017.
Crippa, M., DeCarlo, P. F., Slowik, J. G., Mohr, C., Heringa, M. F., Chirico, R., Poulain, L., Freutel, F., Sciare, J., Cozic, J., Di Marco, C. F., Elsasser, M., Nicolas, J. B., Marchand, N., Abidi, E., Wiedensohler, A., Drewnick, F., Schneider, J., Borrmann, S., Nemitz, E., Zimmermann, R., Jaffrezo, J.-L., Prévôt, A. S. H., and Baltensperger, U.: Wintertime aerosol chemical composition and source apportionment of the organic fraction in the metropolitan area of Paris, Atmos. Chem. Phys., 13, 961–-981, https://doi.org/10.5194/acp-13-961-2013, 2013.
Denier van der Gon, H., Beevers, S., D'Allura, A., Finardi, S., Honoré, C., Kuenen, J., Perrussel, O., Radice, P., Theloke, J., Uzbasich, M., and Visschedijk, A.: Discrepancies Between Top-Down and Bottom-Up Emission Inventories of Megacities: The Causes and Relevance for Modeling Concentrations and Exposure, in: Air Pollution Modeling and its Application XXI, edited by: Steyn, D. G. and Castelli, S. T., NATO Sci. Peace Secur., 4, 194–204, 2011.
de Sá, S. S., Palm, B. B., Campuzano-Jost, P., Day, D. A., Hu, W., Isaacman-VanWertz, G., Yee, L. D., Brito, J., Carbone, S., Ribeiro, I. O., Cirino, G. G., Liu, Y., Thalman, R., Sedlacek, A., Funk, A., Schumacher, C., Shilling, J. E., Schneider, J., Artaxo, P., Goldstein, A. H., Souza, R. A. F., Wang, J., McKinney, K. A., Barbosa, H., Alexander, M. L., Jimenez, J. L., and Martin, S. T.: Urban influence on the concentration and composition of submicron particulate matter in central Amazonia, Atmos. Chem. Phys., 18, 12185–-12206, https://doi.org/10.5194/acp-18-12185-2018, 2018.
De Smedt, I., Stavrakou, T., Hendrick, F., Danckaert, T., Vlemmix, T., Pinardi, G., Theys, N., Lerot, C., Gielen, C., Vigouroux, C., Hermans, C., Fayt, C., Veefkind, P., Müller, J.-F., and Van Roozendael, M.: Diurnal, seasonal and long-term variations of global formaldehyde columns inferred from combined OMI and GOME-2 observations, Atmos. Chem. Phys., 15, 12519–-12545, https://doi.org/10.5194/acp-15-12519-2015, 2015.
Deutsches Zentrum für Luft- und Raumfahrt (DLR): Mission: EMERGE-EU, HALO database [data set], https://doi.org/10.17616/R39Q0T, 2022.
Diémoz, H., Barnaba, F., Magri, T., Pession, G., Dionisi, D., Pittavino, S., Tombolato, I. K. F., Campanelli, M., Della Ceca, L. S., Hervo, M., Di Liberto, L., Ferrero, L., and Gobbi, G. P.: Transport of Po Valley aerosol pollution to the northwestern Alps - Part 1: Phenomenology, Atmos. Chem. Phys., 19, 3065–-3095, https://doi.org/10.5194/acp-19-3065-2019, 2019a.
Diémoz, H., Gobbi, G. P., Magri, T., Pession, G., Pittavino, S., Tombolato, I. K. F., Campanelli, M., and Barnaba, F.: Transport of Po Valley aerosol pollution to the northwestern Alps – Part 2: Long-term impact on air quality, Atmos. Chem. Phys., 19, 10129–-10160, https://doi.org/10.5194/acp-19-10129-2019, 2019b.
Dodman, D.: Blaming cities for climate change? An analysis of urban greenhouse gas emissions inventories, Environ. Urban., 21, 185–202, 2009.
Dufour, G., Wittrock, F., Camredon, M., Beekmann, M., Richter, A., Aumont, B., and Burrows, J. P.: SCIAMACHY formaldehyde observations: constraint for isoprene emission estimates over Europe?, Atmos. Chem. Phys., 9, 1647–-1664, https://doi.org/10.5194/acp-9-1647-2009, 2009.
Emmons, L. K., Apel, E. C., Lamarque, J.-F., Hess, P. G., Avery, M., Blake, D., Brune, W., Campos, T., Crawford, J., DeCarlo, P. F., Hall, S., Heikes, B., Holloway, J., Jimenez, J. L., Knapp, D. J., Kok, G., Mena-Carrasco, M., Olson, J., O'Sullivan, D., Sachse, G., Walega, J., Weibring, P., Weinheimer, A., and Wiedinmyer, C.: Impact of Mexico City emissions on regional air quality from MOZART-4 simulations, Atmos. Chem. Phys., 10, 6195–6212, https://doi.org/10.5194/acp-10-6195-2010, 2010.
European Environment Agency (EEA): Air quality in Europe – 2019 report, Publications Office, Report No. 10/2019, https://doi.org/10.2800/822355, 2019.
European Strategy and Policy Analysis System, Global Trends to 2030 (ESPAS): The future of urbanization and Megacities, ESPAS Ideas Paper series, https://ec.europa.eu/assets/epsc/pages/espas (last access: 20 March 2020), 2019.
Finardi, S., Silibello, C., D'Allura, A., and Radice, P.: Analysis of pollutants exchange between the Po Valley and the surrounding European region, Urban Climate, 10, 682–702, https://doi.org/10.1016/j.uclim.2014.02.002, 2014.
Fisher, R., Lowry, D., Wilkin, O., Sriskantharajah, S., and Nisbet, E.G.: High-precision, automated stable isotope analysis of atmospheric methane and carbon dioxide using continuous-flow isotope-ratio mass spectrometry, Rapid Commun. Mass Sp., 20, 200–208, https://doi.org/10.1002/rcm.2300, 2006.
Flemming, F., Jones, L., and Blechschmidt, A.-M.: CAMS supports scientific aircraft campaigns, ECMWF Newsletter No. 160 – Summer 2019, https://www.ecmwf.int/en/publications/newsletters (last access: 20 March 2020), 2019.
Förster, E., Bönisch, H., Neumaier, M., Obersteiner, F., Zahn, A., Hilboll, A., Kalisz Hedegaard, A. B., Daskalakis, N., Vrekoussis, M., Lichtenstern, M., and Braesicke P.: Chemical and dynamical identification of emission outflows during the HALO campaign EMeRGe in Europe and Asia, in preparation, 2022.
Forzieri, G., Cescatti, A., Batista e Silva, F., and Feyen, L.: Increasing risk over time of weather-related hazards to the European population: a data-driven prognostic study, The Lancet Planetary Health, 1, e200–e208, 2017.
Freney, E. J., Sellegri, K., Canonaco, F., Colomb, A., Borbon, A., Michoud, V., Doussin, J.-F., Crumeyrolle, S., Amarouche, N., Pichon, J.-M., Bourianne, T., Gomes, L., Prevot, A. S. H., Beekmann, M., and Schwarzenböeck, A.: Characterizing the impact of urban emissions on regional aerosol particles: airborne measurements during the MEGAPOLI experiment, Atmos. Chem. Phys., 14, 1397–-1412, https://doi.org/10.5194/acp-14-1397-2014, 2014.
Freutel, F., Schneider, J., Drewnick, F., von der Weiden-Reinmüller, S.-L., Crippa, M., Prévôt, A. S. H., Baltensperger, U., Poulain, L., Wiedensohler, A., Sciare, J., Sarda-Estève, R., Burkhart, J. F., Eckhardt, S., Stohl, A., Gros, V., Colomb, A., Michoud, V., Doussin, J. F., Borbon, A., Haeffelin, M., Morille, Y., Beekmann, M., and Borrmann, S.: Aerosol particle measurements at three stationary sites in the megacity of Paris during summer 2009: meteorology and air mass origin dominate aerosol particle composition and size distribution, Atmos. Chem. Phys., 13, 933–-959, https://doi.org/10.5194/acp-13-933-2013, 2013.
Fu, T.-M., Jacob, D. J., Wittrock, F., Burrows, J. P., Vrekoussis, M., and Henze, D. K.: Global budgets of atmospheric glyoxal and methylglyoxal, and implications for formation of secondary organic aerosols, J. Geophys. Res.-Atmos., 113, D15303, https://doi.org/10.1029/2007JD009505, 2008.
Fu, Y., Tai, A. P. K., and Liao, H.: Impacts of historical climate and land cover changes on fine particulate matter (PM2.5) air quality in East Asia between 1980 and 2010, Atmos. Chem. Phys., 16, 10369–-10383, https://doi.org/10.5194/acp-16-10369-2016, 2016.
Gardi, C.: Urban Expansion, Land Cover and Soil Ecosystem Services, Taylor and Francis, Oxfordshire, United Kingdom, 302 pp., ISBN 13 9781317504702, 2017.
Garzon, J. P, Huertas, J. I., Magana, M., Huertas, M. E., Cardenas, B., Watanabe, T., Maeda, T., Wakamatsu, S., and Blanco, S.: Volatile organic compounds in the atmosphere of Mexico City, Atmos. Environ., 119, 425–429, 2015.
Gelencsér, A., Siszler, K., and Hlavay, J.: Toluene-Benzene Concentration Ratio as a Tool for Characterizing the Distance from Vehicular Emission Sources, Environ. Sci. Technol., 31, 2869–2872, https://doi.org/10.1021/es970004c, 1997.
General, S., Pöhler, D., Sihler, H., Bobrowski, N., Frieß, U., Zielcke, J., Horbanski, M., Shepson, P. B., Stirm, B. H., Simpson, W. R., Weber, K., Fischer, C., and Platt, U.: The Heidelberg Airborne Imaging DOAS Instrument (HAIDI) – a novel imaging DOAS device for 2-D and 3-D imaging of trace gases and aerosols, Atmos. Meas. Tech., 7, 3459–-3485, https://doi.org/10.5194/amt-7-3459-2014, 2014.
George, M., Andrés Hernández, M. D., Nenakhov, V., Liu, Y., and Burrows, J. P.: Airborne measurement of peroxy radicals using chemical amplification coupled with cavity ring-down spectroscopy: the PeRCEAS instrument, Atmos. Meas. Tech., 13, 2577–-2600, https://doi.org/10.5194/amt-13-2577-2020, 2020.
George, M., Andrés Hernández, M. D., Nenakhov, V., Liu, Y., Burrows, J. P., Bohn, B., Förster, E., Obersteiner, F., Zahn, A., Harlaß, T., Ziereis, H., Schlager, H., Schreiner, B., Kluge, F., Bigge, K., and Pfeilsticker, K.: On the understanding of tropospheric fast photochemistry: airborne observations of peroxy radicals during the EMeRGe-Europe campaign, Atmos. Chem. Phys. Discuss. [preprint], https://doi.org/10.5194/acp-2022-119, in review, 2022.
Gerbig, C., Kley, D., Volz-Thomas, A., Kent, J., Dewey, K., and McKenna, D. S.: Fast response resonance fluorescence CO measurements aboard the C-130: Instrument characterization and measurements made during North Atlantic Regional Experiment 1993, J. Geophys. Res., 101, 29229–29238, 1996.
Giles, D. M., Sinyuk, A., Sorokin, M. G., Schafer, J. S., Smirnov, A., Slutsker, I., Eck, T. F., Holben, B. N., Lewis, J. R., Campbell, J. R., Welton, E. J., Korkin, S. V., and Lyapustin, A. I.: Advancements in the Aerosol Robotic Network (AERONET) Version 3 database – automated near-real-time quality control algorithm with improved cloud screening for Sun photometer aerosol optical depth (AOD) measurements, Atmos. Meas. Tech., 12, 169–-209, https://doi.org/10.5194/amt-12-169-2019, 2019.
Gioli, B., Carfora, M. F., Magliulo, V., Metallo, M. C., Poli, A. A., Toscano, P., and Miglietta, F.: Aircraft mass budgeting to measure CO2 emissions of Rome, Italy, Environ. Monit. Assess., 186, 2053–2066, https://doi.org/10.1007/s10661-013-3517-4, 2014.
Gkikas, A., Hatzianastassiou, N., Mihalopoulos, N., Katsoulis, V., Kazadzis, S., Pey, J., Querol, X., and Torres, O.: The regime of intense desert dust episodes in the Mediterranean based on contemporary satellite observations and ground measurements, Atmos. Chem. Phys., 13, 12135–-12154, https://doi.org/10.5194/acp-13-12135-2013, 2013.
Goldstein, A. and Shaw, S.: Isotopes of volatile organic compounds: an emerging approach for studying atmospheric budgets and chemistry, Chem. Rev., 103, 5025–5048, https://doi.org/10.1021/cr0206566, 2003.
Grewe, V., Tsati, E., Mertens, M., Frömming, C., and Jöckel, P.: Contribution of emissions to concentrations: the TAGGING 1.0 submodel based on the Modular Earth Submodel System (MESSy 2.52), Geosci. Model Dev., 10, 2615–-2633, https://doi.org/10.5194/gmd-10-2615-2017, 2017.
Grimm, N. B., Faeth, S. H., Golubiewski, N. E., Redman, C. L., Wu, J., Bai, X., and Briggs, J. M.: Global change and the ecology of cities, Science, 319, 756–760, https://doi.org/10.1126/science.1150195, 2008.
Guerreiro, S. B., Dawson, R. J., Kilsby, C., Lewis, E., and Ford, A.: Future heat-waves, droughts and floods in 571 European cities, Environ. Res. Lett., 13, 034009, https://doi.org/10.1088/1748-9326/aaaad3, 2018.
Haywood, J. and Boucher, O.: Estimates of the direct and indirect radiative forcing due to tropospheric aerosols: A review, Rev. Geophys., 38, 513–543, https://doi.org/10.1029/1999RG000078, 2000.
Heckel, A., Richter, A., Tarsu, T., Wittrock, F., Hak, C., Pundt, I., Junkermann, W., and Burrows, J. P.: MAX-DOAS measurements of formaldehyde in the Po-Valley, Atmos. Chem. Phys., 5, 909–-918, https://doi.org/10.5194/acp-5-909-2005, 2005.
Helfter, C., Tremper, A. H., Halios, C. H., Kotthaus, S., Bjorkegren, A., Grimmond, C. S. B., Barlow, J. F., and Nemitz, E.: Spatial and temporal variability of urban fluxes of methane, carbon monoxide and carbon dioxide above London, UK, Atmos. Chem. Phys., 16, 10543–-10557, https://doi.org/10.5194/acp-16-10543-2016, 2016.
Hennigan, C. J., Sullivan, A. P., Collett, J. L., and Robinson, A. L.: Levoglucosan stability in biomass burning particles ex-posed to hydroxyl radicals, Geophys. Res. Lett., 37, L09806, https://doi.org/10.1029/2010GL043088, 2010.
Hennigan, C. J., Miracolo, M. A., Engelhart, G. J., May, A. A., Presto, A. A., Lee, T., Sullivan, A. P., McMeeking, G. R., Coe, H., Wold, C. E., Hao, W.-M., Gilman, J. B., Kuster, W. C., de Gouw, J., Schichtel, B. A., Collett Jr., J. L., Kreidenweis, S. M., and Robinson, A. L.: Chemical and physical transformations of organic aerosol from the photo-oxidation of open biomass burning emissions in an environmental chamber, Atmos. Chem. Phys., 11, 7669–-7686, https://doi.org/10.5194/acp-11-7669-2011, 2011.
Hilboll, A., Richter, A., and Burrows, J. P.: Long-term changes of tropospheric NO2 over megacities derived from multiple satellite instruments, Atmos. Chem. Phys., 13, 4145–-4169, https://doi.org/10.5194/acp-13-4145-2013, 2013.
Holanda, B. A., Pöhlker, M. L., Walter, D., Saturno, J., Sörgel, M., Ditas, J., Ditas, F., Schulz, C., Franco, M. A., Wang, Q., Donth, T., Artaxo, P., Barbosa, H. M. J., Borrmann, S., Braga, R., Brito, J., Cheng, Y., Dollner, M., Kaiser, J. W., Klimach, T., Knote, C., Krüger, O. O., Fütterer, D., Lavrič, J. V., Ma, N., Machado, L. A. T., Ming, J., Morais, F. G., Paulsen, H., Sauer, D., Schlager, H., Schneider, J., Su, H., Weinzierl, B., Walser, A., Wendisch, M., Ziereis, H., Zöger, M., Pöschl, U., Andreae, M. O., and Pöhlker, C.: Influx of African biomass burning aerosol during the Amazonian dry season through layered transatlantic transport of black carbon-rich smoke, Atmos. Chem. Phys., 20, 4757–-4785, https://doi.org/10.5194/acp-20-4757-2020, 2020.
Hoole, C., Hincks, S., and Rae, A.: The contours of a new urban world? Megacity population growth and density since 1975, Town Plann. Rev., 90, 653–678, https://doi.org/10.3828/tpr.2019.41, 2019.
Hüneke, T., Aderhold, O.-A., Bounin, J., Dorf, M., Gentry, E., Grossmann, K., Grooß, J.-U., Hoor, P., Jöckel, P., Kenntner, M., Knapp, M., Knecht, M., Lörks, D., Ludmann, S., Matthes, S., Raecke, R., Reichert, M., Weimar, J., Werner, B., Zahn, A., Ziereis, H., and Pfeilsticker, K.: The novel HALO mini-DOAS instrument: inferring trace gas concentrations from airborne UV/visible limb spectroscopy under all skies using the scaling method, Atmos. Meas. Tech., 10, 4209–-4234, https://doi.org/10.5194/amt-10-4209-2017, 2017.
Huntrieser, H. and Schlager, H.: Air Pollution Export from and Import to Europe: Experimental Evidence, in: The Handbook of Environmental Chemistry, Air Pollution: Intercontinental Transport of Air Pollution, edited by: Stohl, A., Springer Verlag, 69–98, 2004.
Huntrieser, H., Heland, J., Schlager, H., Forster, C., Stohl, A., Aufmhoff, H., Arnold, F., Scheel, H. E., Campana, M., Gilge, S., Eixmann, R., and Cooper, O.: Intercontinental air pollution transport from North America to Europe: Experimental evidence from airborne measurements and surface observations, J. Geophys. Res., 110, D01305, https://doi.org/10.1029/2004JD005045, 2005.
Im, U., Markakis, K., Koçak, M., Gerasopoulos, E., Daskalakis, N., Mihalopoulos, N., Poupkou, A., Kındap, T., Unal, A., and Kanakidou, M.: Summertime aerosol chemical composition in the Eastern Mediterranean and its sensitivity to temperature, Atmos. Environ., 50, 164-173, https://doi.org/10.1016/j.atmosenv.2011.12.044, 2012.
Jacob, D. J. and Winner, D. A.: Effect of climate change on air quality, Atmos. Environ., 43, 51–63, https://doi.org/10.1016/j.atmosenv.2008.09.051, 2009.
Jöckel, P., Kerkweg, A., Pozzer, A., Sander, R., Tost, H., Riede, H., Baumgaertner, A., Gromov, S., and Kern, B.: Development cycle 2 of the Modular Earth Submodel System (MESSy2), Geosci. Model Dev., 3, 717–752, https://doi.org/10.5194/gmd-3-717-2010, 2010.
Jonson, J. E., Schulz, M., Emmons, L., Flemming, J., Henze, D., Sudo, K., Tronstad Lund, M., Lin, M., Benedictow, A., Koffi, B., Dentener, F., Keating, T., Kivi, R., and Davila, Y.: The effects of intercontinental emission sources on European air pollution levels, Atmos. Chem. Phys., 18, 13655–13672, https://doi.org/10.5194/acp-18-13655-2018, 2018.
Kaiser, J., Wolfe, G. M., Min, K. E., Brown, S. S., Miller, C. C., Jacob, D. J., deGouw, J. A., Graus, M., Hanisco, T. F., Holloway, J., Peischl, J., Pollack, I. B., Ryerson, T. B., Warneke, C., Washenfelder, R. A., and Keutsch, F. N.: Reassessing the ratio of glyoxal to formaldehyde as an indicator of hydrocarbon precursor speciation, Atmos. Chem. Phys., 15, 7571–7583, https://doi.org/10.5194/acp-15-7571-2015, 2015.
Kalivitis, N., Gerasopoulos, E., Vrekoussis, M., Kouvarakis, G., Kubilay, N., Hatzianastassiou, N., Vardavas, I., and Mihalopoulos, N.: Dust transport over the eastern Mediterranean derived from Total Ozone Mapping Spectrometer, Aerosol Robotic Network, and surface measurements, J. Geophys. Res.-Atmos., 112, D03202, doi:10.1029/2006JD007510, 2007.
Kalnay, E., Kanamitsu, M., Kistler, R., Collins, W., Deaven, D., Gandin, L., Iredell, M., Saha, S., White, G., Woollen, J., Zhu, Y., Leetmaa, A., Reynolds, B., Chelliah, M., Ebisuzaki, W., Higgins, W., Janowiak, J., Mo, K. C., Ropelewski, C., Wang, J., Jenne, R., and Joseph, D.: The NCEP/NCAR 40-year reanalysis project, B. Am. Meteorol. Soc., 77, 437–470, 1996.
Kanakidou, M., Mihalopoulos, N., Kindap, T., Im, U., Vrekoussis, M., Gerasopoulos, E., Dermitzaki, E., Unal, A., Koçak, M., Markakis, K., Melas, D., Kouvarakis, G., Youssef, A. F., Richter, A., Hatzianastassiou, N., Hilboll, A., Ebojie, F., Wittrock, F., von Savigny, C., Burrows, J. P., Ladstaetter-Weissenmayer, A., and Moubasher, H.: Megacities as hot spots of air pollution in the East Mediterranean, Atmos. Environ., 45, 1223–1235, 2011.
Kerkweg, A. and Jöckel, P.: The 1-way on-line coupled atmospheric chemistry model system MECO(n) – Part 2: On-line coupling with the Multi-Model-Driver (MMD), Geosci. Model Dev., 5, 111–128, https://doi.org/10.5194/gmd-5-111-2012, 2012.
Klausner, T. M.: Aircraft-based in situ measurements of CH4 and CO2 downstream of European and Asian urban centres at local to synoptic scales, Dissertation, LMU München: Fakultät für Physik, https://doi.org/10.5282/edoc.26983, 2020.
Klausner, T., Mertens, M., Huntrieser, H., Galkowski, M., Kuhlmann, G., Baumann, R., Fiehn, A., Jöckel, P., Pühl, M., and Roitger, A.: Urban greenhouse gas emissions from the Berlin area: A case study using airborne CO2 and CH4 in situ observations in summer 2018, Elem. Sci. Anth., 8, 15, https://doi.org/10.1525/elementa.411, 2020.
Kluge, F., Hüneke, T., Knecht, M., Lichtenstern, M., Rotermund, M., Schlager, H., Schreiner, B., and Pfeilsticker, K.: Profiling of formaldehyde, glyoxal, methylglyoxal, and CO over the Amazon: normalized excess mixing ratios and related emission factors in biomass burning plumes, Atmos. Chem. Phys., 20, 12363–12389, https://doi.org/10.5194/acp-20-12363-2020, 2020.
Krüger, O. O., Holanda, B. A., Chowdhury, S., Pozzer, A., Walter, D., Pöhlker, C., Andrés Hernández, M. D., Burrows, J. P., Voigt, C., Lelieveld, J., Quaas, J., Pöschl, U., and Pöhlker, M. L.: Black carbon aerosol reductions during COVID-19 confinement quantified by aircraft measurements over Europe, Atmos. Chem. Phys. Discuss. [preprint], https://doi.org/10.5194/acp-2021-1100, in review, 2022.
Kuc, T., Rozanski, K., Zimnoch, M., Necki, J. M., and Korus, A.: Anthropogenic emissions of CO2 and CH4 in an urban environment, Applied Energy, 75, 193–203, https://doi.org/10.1016/S0306-2619(03)00032-1, 2003.
Kunkel, D., Lawrence, M. G., Tost, H., Kerkweg, A., Jöckel, P., and Borrmann, S.: Urban emission hot spots as sources for remote aerosol deposition, Geophys. Res. Lett., 39, L01808, https://doi.org/10.1029/2011GL049634, 2012.
Laborde, M., Crippa, M., Tritscher, T., Jurányi, Z., Decarlo, P. F., Temime-Roussel, B., Marchand, N., Eckhardt, S., Stohl, A., Baltensperger, U., Prévôt, A. S. H., Weingartner, E., and Gysel, M.: Black carbon physical properties and mixing state in the European megacity Paris, Atmos. Chem. Phys., 13, 5831–5856, https://doi.org/10.5194/acp-13-5831-2013, 2013.
Lai, C., Liu, Y., Ma, J., Ma, Q., and He, H.: Degradation kinetics of levoglucosan initiated by hydroxyl radical under different environmental conditions, Atmos. Environ., 91, 32–39, https://doi.org/10.1016/j.atmosenv.2014.03.054, 2014.
Lambe, A. T., Onasch, T. B., Massoli, P., Croasdale, D. R., Wright, J. P., Ahern, A. T., Williams, L. R., Worsnop, D. R., Brune, W. H., and Davidovits, P.: Laboratory studies of the chemical composition and cloud condensation nuclei (CCN) activity of secondary organic aerosol (SOA) and oxidized primary organic aerosol (OPOA), Atmos. Chem. Phys., 11, 8913–8928, https://doi.org/10.5194/acp-11-8913-2011, 2011.
Lawrence, M. G., Butler, T. M., Steinkamp, J., Gurjar, B. R., and Lelieveld, J.: Regional pollution potentials of megacities and other major population centers, Atmos. Chem. Phys., 7, 3969–3987, https://doi.org/10.5194/acp-7-3969-2007, 2007.
Lawrence, M. G. and Lelieveld, J.: Atmospheric pollutant outflow from southern Asia: a review, Atmos. Chem. Phys., 10, 11017–11096, https://doi.org/10.5194/acp-10-11017-2010, 2010.
Lelieveld, J., Berresheim, H., Borrmann, S., Crutzen, P. J., Dentener, F. J., Fischer, H., Feichter, J., Flatau, P. J., Heland, J., Holzinger, R., Korrmann, R., Lawrence, M. G, Levin, Z., Markowicz, K. M., Mihalopoulos, N., Minikin, A., Ramanathan, V., De Reus, M., Roelofs, G. J., Scheeren, H. A., Sciare, J., Schlager, H., Schultz, M., Siegmund, P., Steil, B., Stephanou, E. G., Stier, P., Traub, M., Warneke, C., Williams, J., and Ziereis, H.: Global air pollution crossroads over the Mediterranean, Science, 298, 794, https://doi.org/10.1126/science.1075457, 2002.
Lelieveld, J., Evans, J., Fnais, M., Giannadaki, D., and Pozzer, A.: The Contribution of Outdoor Air Pollution Sources to Premature Mortality on a Global Scale, Nature, 525, 367–371, 2015.
Lelieveld, J., Pozzer, A., Pöschl, U., Fnais, M., Haines, A., and Münzel, T.: Loss of life expectancy from air pollution compared to other risk factors: a worldwide perspective, Cardiovasc. Res., 116, 1910–1917, https://doi.org/10.1093/cvr/cvaa025, 2020.
Leung, D. M., Tai, A. P. K., Mickley, L. J., Moch, J. M., van Donkelaar, A., Shen, L., and Martin, R. V.: Synoptic meteorological modes of variability for fine particulate matter (PM2.5) air quality in major metropolitan regions of China, Atmos. Chem. Phys., 18, 6733–6748, https://doi.org/10.5194/acp-18-6733-2018, 2018.
Lian, J., Bréon, F.-M., Broquet, G., Zaccheo, T. S., Dobler, J., Ramonet, M., Staufer, J., Santaren, D., Xueref-Remy, I., and Ciais, P.: Analysis of temporal and spatial variability of atmospheric CO2 concentration within Paris from the GreenLITE™ laser imaging experiment, Atmos. Chem. Phys., 19, 13809–13825, https://doi.org/10.5194/acp-19-13809-2019, 2019.
Liu, D., Allan, J. D., Young, D. E., Coe, H., Beddows, D., Fleming, Z. L., Flynn, M. J., Gallagher, M. W., Harrison, R. M., Lee, J., Prevot, A. S. H., Taylor, J. W., Yin, J., Williams, P. I., and Zotter, P.: Size distribution, mixing state and source apportionment of black carbon aerosol in London during wintertime, Atmos. Chem. Phys., 14, 10061–10084, https://doi.org/10.5194/acp-14-10061-2014, 2014.
Mallaun, C., Giez, A., and Baumann, R.: Calibration of 3-D wind measurements on a single-engine research aircraft, Atmos. Meas. Tech., 8, 3177–3196, https://doi.org/10.5194/amt-8-3177-2015, 2015.
Mar, K. A.: Putting the brakes on climate change – it's about more than just CO2, Climanosco Research Articles, 3, 14 Jan 2021, https://doi.org/10.37207/CRA.3.1, 2021.
Mayer, M., Wang, C., Webster, M., and Prinn, R. G.: Linking local air pollution to global chemistry and climate, J. Geophys. Res., 105, 22869–22896, 2000.
Melchiorri, M., Florczyk, A. J., Freire, S., Ehrlich, D., Schiavina, M., Pesaresi, M., and Kemper, T.: Megacities Spatiotemporal Dynamics Monitored with the Global Human Settlement Layer, in: Proceedings of the REAL CORP 2018 Expanding Cities – Diminishing Space, edited by: Schrenk, M., Popovisch, V. V., Zeile, P., Elisei, P., Beyer, C., and Navratil, G., 4–6 April 2018, Wien, Austria, 285–294 pp., 2018.
Mertens, M., Kerkweg, A., Jöckel, P., Tost, H., and Hofmann, C.: The 1-way on-line coupled model system MECO(n) – Part 4: Chemical evaluation (based on MESSy v2.52), Geosci. Model Dev., 9, 3545–3567, https://doi.org/10.5194/gmd-9-3545-2016, 2016.
Mertens, M., Kerkweg, A., Grewe, V., Jöckel, P., and Sausen, R.: Attributing ozone and its precursors to land transport emissions in Europe and Germany, Atmos. Chem. Phys., 20, 7843–7873, https://doi.org/10.5194/acp-20-7843-2020, 2020a.
Mertens, M., Kerkweg, A., Grewe, V., Jöckel, P., and Sausen, R.: Are contributions of emissions to ozone a matter of scale? – a study using MECO(n) (MESSy v2.50), Geosci. Model Dev., 13, 363–383, https://doi.org/10.5194/gmd-13-363-2020, 2020b.
Millán, M. M., Salvador, R., Mantilla, E., and Kallos, G.: Photooxidant dynamics in the Mediterranean basin in summer: Results from European research projects, J. Geophys. Res., 102, 8811–8823, 1997.
Millán, M. M., Mantilla, E., Salvador, R., Carratalá, A., Sanz, M. J., Alonso, L., Gangoiti, G., and Navazo, M.: Ozone Cycles in the Western Mediterranean Basin: Interpretation of Monitoring Data in Complex Coastal Terrain, J. Appl. Meteorol., 39, 487–508, 2000.
Monks, P. S., Granier, C., Fuzzi, S., Stohl, A., Williams, M. L., Akimoto, H., Amann, M., Baklanov, A., Baltensperger, U., Bey, I., Blake, N., Blake, R. S., Carslaw, K., Cooper, O. R., Dentener, F., Fowler, D., Fragkou, E., Frost, G. J., Generoso, S., Ginoux, P., Grewe, V., Guenther, A., Hansson, H. C., Henne, S., Hjorth, J., Hofzumahaus, A., Huntrieser, H., Isaksen, I. S. A., Jenkin, M. E., Kaiser, J., Kanakidou, M., Klimont, Z., Kulmala, M., Laj, P., Lawrence, M. G., Lee, J. D., Liousse, C., Maione, M., McFiggans, G., Metzger, A., Mieville, A., Moussiopoulos, N., Orlandou, J. J., O'Dowd, C. D., Palmer, P. I., Parrish, D. D., Petzold, A., Platt, U., Pöschl, U., Prévôt, A. S. H., Reeves, C. E., Reimann, S., Rudich, Y., Sellegri, K., Steinbrecher, R., Simpson, D., ten Brink, H., Theloke, J., van der Werf, G. R., Vautard, R., Vestreng, V., Vlachokostas, C., and von Glasow, R.: Atmospheric composition change-global and regional air quality, Atmos. Environ., 43, 5268–5350, https://doi.org/10.1016/j.atmosenv.2009.08.021, 2009.
Myriokefalitakis, S., Vrekoussis, M., Tsigaridis, K., Wittrock, F., Richter, A., Brühl, C., Volkamer, R., Burrows, J. P., and Kanakidou, M.: The influence of natural and anthropogenic secondary sources on the glyoxal global distribution, Atmos. Chem. Phys., 8, 4965–4981, https://doi.org/10.5194/acp-8-4965-2008, 2008.
Ng, N. L., Canagaratna, M. R., Zhang, Q., Jimenez, J. L., Tian, J., Ulbrich, I. M., Kroll, J. H., Docherty, K. S., Chhabra, P. S., Bahreini, R., Murphy, S. M., Seinfeld, J. H., Hildebrandt, L., Donahue, N. M., DeCarlo, P. F., Lanz, V. A., Prévôt, A. S. H., Dinar, E., Rudich, Y., and Worsnop, D. R.: Organic aerosol components observed in Northern Hemispheric datasets from Aerosol Mass Spectrometry, Atmos. Chem. Phys., 10, 4625–4641, https://doi.org/10.5194/acp-10-4625-2010, 2010.
Ng, N. L., Canagaratna, M. R., Jimenez, J. L., Chhabra, P. S., Seinfeld, J. H., and Worsnop, D. R.: Changes in organic aerosol composition with aging inferred from aerosol mass spectra, Atmos. Chem. Phys., 11, 6465–6474, https://doi.org/10.5194/acp-11-6465-2011, 2011.
Odendahl, C., Springford, J., Johnson, S., and Murray, J.: The big European sort? The diverging fortunes of Europe's regions, Centre for European Reform, https://www.cer.eu/publications/archive/policy-brief/2019/big-european-sort-diverging-fortunes-europes-regions (last access: 20 February 2020), 2019.
O'Shea, S. J., Allen, G., Fleming, Z. L., Bauguitte, S. J.-B., Percival, C. J., Gallagher, M. W., Lee, J., Helfter, C., and Nemitz, E.: Area fluxes of carbon dioxide, methane, and carbon monoxide derived from airborne measurements around Greater London: A case study during summer 2012, J. Geophys. Res., 119, 4940–4952, https://doi.org/10.1002/2013JD021269, 2014.
Paulot, F., Wunch, D., Crounse, J. D., Toon, G. C., Millet, D. B., DeCarlo, P. F., Vigouroux, C., Deutscher, N. M., González Abad, G., Notholt, J., Warneke, T., Hannigan, J. W., Warneke, C., de Gouw, J. A., Dunlea, E. J., De Mazière, M., Griffith, D. W. T., Bernath, P., Jimenez, J. L., and Wennberg, P. O.: Importance of secondary sources in the atmospheric budgets of formic and acetic acids, Atmos. Chem. Phys., 11, 1989–2013, https://doi.org/10.5194/acp-11-1989-2011, 2011.
Pey, J., Querol, X., Alastuey, A., Forastiere, F., and Stafoggia, M.: African dust outbreaks over the Mediterranean Basin during 2001–2011: PM10 concentrations, phenomenology and trends, and its relation with synoptic and mesoscale meteorology, Atmos. Chem. Phys., 13, 1395–1410, https://doi.org/10.5194/acp-13-1395-2013, 2013.
Pikridas, M., Vrekoussis, M., Sciare, J., Mihalopoulos, N., Kleanthous, S., and Savvidis, C.: Spatial and temporal (short and long-term) variability of submicron, fine and sub-10µm particulate matter (PM1, PM2.5, PM10) in Cyprus, Atmos. Environ., 191, 79–93, https://doi.org/10.1016/j.atmosenv.2018.07.048, 2018.
Pitt, J. R., Allen, G., Bauguitte, S. J.-B., Gallagher, M. W., Lee, J. D., Drysdale, W., Nelson, B., Manning, A. J., and Palmer, P. I.: Assessing London CO2, CH4 and CO emissions using aircraft measurements and dispersion modelling, Atmos. Chem. Phys., 19, 8931–8945, https://doi.org/10.5194/acp-19-8931-2019, 2019.
Pöhlker, M. L., Pöhlker, C., Ditas, F., Klimach, T., Hrabe de Angelis, I., Araújo, A., Brito, J., Carbone, S., Cheng, Y., Chi, X., Ditz, R., Gunthe, S. S., Kesselmeier, J., Könemann, T., Lavrič, J. V., Martin, S. T., Mikhailov, E., Moran-Zuloaga, D., Rose, D., Saturno, J., Su, H., Thalman, R., Walter, D., Wang, J., Wolff, S., Barbosa, H. M. J., Artaxo, P., Andreae, M. O., and Pöschl, U.: Long-term observations of cloud condensation nuclei in the Amazon rain forest – Part 1: Aerosol size distribution, hygroscopicity, and new model parametrizations for CCN prediction, Atmos. Chem. Phys., 16, 15709–15740, https://doi.org/10.5194/acp-16-15709-2016, 2016.
Pöhlker, M. L., Ditas, F., Saturno, J., Klimach, T., Hrabě de Angelis, I., Araùjo, A. C., Brito, J., Carbone, S., Cheng, Y., Chi, X., Ditz, R., Gunthe, S. S., Holanda, B. A., Kandler, K., Kesselmeier, J., Könemann, T., Krüger, O. O., Lavrič, J. V., Martin, S. T., Mikhailov, E., Moran-Zuloaga, D., Rizzo, L. V., Rose, D., Su, H., Thalman, R., Walter, D., Wang, J., Wolff, S., Barbosa, H. M. J., Artaxo, P., Andreae, M. O., Pöschl, U., and Pöhlker, C.: Long-term observations of cloud condensation nuclei over the Amazon rain forest – Part 2: Variability and characteristics of biomass burning, long-range transport, and pristine rain forest aerosols, Atmos. Chem. Phys., 18, 10289–10331, https://doi.org/10.5194/acp-18-10289-2018, 2018.
Pöhlker, C., Walter, D., Paulsen, H., Könemann, T., Rodríguez-Caballero, E., Moran-Zuloaga, D., Brito, J., Carbone, S., Degrendele, C., Després, V. R., Ditas, F., Holanda, B. A., Kaiser, J. W., Lammel, G., Lavrič, J. V., Ming, J., Pickersgill, D., Pöhlker, M. L., Praß, M., Löbs, N., Saturno, J., Sörgel, M., Wang, Q., Weber, B., Wolff, S., Artaxo, P., Pöschl, U., and Andreae, M. O.: Land cover and its transformation in the backward trajectory footprint region of the Amazon Tall Tower Observatory, Atmos. Chem. Phys., 19, 8425–8470, https://doi.org/10.5194/acp-19-8425-2019, 2019.
Pöschl, U.: Atmospheric aerosols: Composition, transformation, climate and health effects, Angew. Chem. Int. Ed., 44, 7520–7540, https://doi.org/10.1002/anie.200501122, 2005.
Ramanathan, V., Crutzen, P. J., Kiehl, J. T., and Rosenfeld, D.: Aerosols, climate, and the hydrological cycle, Science, 294, 2119–2124, https://doi.org/10.1126/science.1064034, 2001.
Rautenhaus, M., Bauer, G., and Dörnbrack, A.: A web service based tool to plan atmospheric research flights, Geosci. Model Dev., 5, 55–71, https://doi.org/10.5194/gmd-5-55-2012, 2012.
Ren, Y., Baumann, R., and Schlager, H.: An airborne perfluorocarbon tracer system and its first application for a Lagrangian experiment, Atmos. Meas. Tech., 8, 69–80, https://doi.org/10.5194/amt-8-69-2015, 2015.
Rolph, G., Stein, A., and Stunder, B.: Real-time Environmental Applications and Display sYstem: READY, Environ. Modell. Software, 95, 210–228, https://doi.org/10.1016/j.envsoft.2017.06.025, 2017.
Rosenfeld, D., Lohmann, U., Raga, G. B., O'Dowd, C. D., Kulmala, M., Fuzzi, S., Reissell, A., and Andreae, M. O.: Flood or drought: How do aerosols affect precipitation?, Science, 321, 1309–1313, https://doi.org/10.1126/science.1160606, 2008.
Rudolph, J., Czuba, E., and Huang, L.: The stable carbon isotope fractionation for reactions of selected hydrocarbons with OH-radicals and its relevance for atmos-pheric chemistry, J. Geophys. Res., 105, 29329–29346, https://doi.org/10.1029/2000JD900447, 2000.
Saunois, M., Stavert, A. R., Poulter, B., Bousquet, P., Canadell, J. G., Jackson, R. B., Raymond, P. A., Dlugokencky, E. J., Houweling, S., Patra, P. K., Ciais, P., Arora, V. K., Bastviken, D., Bergamaschi, P., Blake, D. R., Brailsford, G., Bruhwiler, L., Carlson, K. M., Carrol, M., Castaldi, S., Chandra, N., Crevoisier, C., Crill, P. M., Covey, K., Curry, C. L., Etiope, G., Frankenberg, C., Gedney, N., Hegglin, M. I., Höglund-Isaksson, L., Hugelius, G., Ishizawa, M., Ito, A., Janssens-Maenhout, G., Jensen, K. M., Joos, F., Kleinen, T., Krummel, P. B., Langenfelds, R. L., Laruelle, G. G., Liu, L., Machida, T., Maksyutov, S., McDonald, K. C., McNorton, J., Miller, P. A., Melton, J. R., Morino, I., Müller, J., Murguia-Flores, F., Naik, V., Niwa, Y., Noce, S., O'Doherty, S., Parker, R. J., Peng, C., Peng, S., Peters, G. P., Prigent, C., Prinn, R., Ramonet, M., Regnier, P., Riley, W. J., Rosentreter, J. A., Segers, A., Simpson, I. J., Shi, H., Smith, S. J., Steele, L. P., Thornton, B. F., Tian, H., Tohjima, Y., Tubiello, F. N., Tsuruta, A., Viovy, N., Voulgarakis, A., Weber, T. S., van Weele, M., van der Werf, G. R., Weiss, R. F., Worthy, D., Wunch, D., Yin, Y., Yoshida, Y., Zhang, W., Zhang, Z., Zhao, Y., Zheng, B., Zhu, Q., Zhu, Q., and Zhuang, Q.: The Global Methane Budget 2000–2017, Earth Syst. Sci. Data, 12, 1561–1623, https://doi.org/10.5194/essd-12-1561-2020, 2020.
Schneider, J., Weimer, S., Drewnick, F., Borrmann, S., Helas, G., Gwaze, P., Schmid, O., Andreae, M. O., and Kirchner, U.: Massspectrometric analysis and aerodynamic properties of various types of combustion-related aerosol particles, Int. J. Mass. Spec., 258, 37–49, https://doi.org/10.1016/j.ijms.2006.07.008, 2006.
Schroder, J. C., Campuzano-Jost, P., Day, D. A., Shah, V., Larson, K., Sommers, J. M., Sullivan, A. P., Campos, T., Reeves, J. M., Hills, A., Hornbrook, R. S., Blake, N. J., Scheuer, E., Guo, H., Fibiger, D. L., McDuffie, E. E., Hayes, P. L., Weber, R. J., Dibb, J. E., Apel, E. C., Jaeglé, L., Brown, S. S., Thornton, J. A., and Jimenez, J. L.: Sources and secondary production of organic aerosols in the northeastern United States during WINTER, J. Geophys. Res.-Atmos., 123, 7771–7796, https://doi.org/10.1029/2018JD028475, 2018.
Schulz, C., Schneider, J., Amorim Holanda, B., Appel, O., Costa, A., de Sá, S. S., Dreiling, V., Fütterer, D., Jurkat-Witschas, T., Klimach, T., Knote, C., Krämer, M., Martin, S. T., Mertes, S., Pöhlker, M. L., Sauer, D., Voigt, C., Walser, A., Weinzierl, B., Ziereis, H., Zöger, M., Andreae, M. O., Artaxo, P., Machado, L. A. T., Pöschl, U., Wendisch, M., and Borrmann, S.: Aircraft-based observations of isoprene-epoxydiol-derived secondary organic aerosol (IEPOX-SOA) in the tropical upper troposphere over the Amazon region, Atmos. Chem. Phys., 18, 14979–15001, https://doi.org/10.5194/acp-18-14979-2018, 2018.
Schumann, U.: Measurement and model data comparisons for the HALO-FAAM formation flight during EMeRGe on 17 July 2017, Zenodo [data set], https://doi.org/10.5281/zenodo.4427965, 2020.
Schwarz, J. P., Gao, R. S., Spackman, J. R., Watts, L. A., Thomson, D. S., Fahey, D. W., Ryerson, T. B., Peischl, J., Holloway, J. S., Trainer, M., Frost, G. J., Baynard, T., Lack, D. A., de Gouw, J. A., Warneke, C., and Del Negro, L. A.: Measurement of the mixing state, mass, and optical size of individual black carbon particles in urban and biomass burning emissions, Geophys. Res. Lett., 35, L13810, https://doi.org/10.1029/ 2008GL033968, 2008.
Shaw, M. D., Lee, J. D., Davison, B., Vaughan, A., Purvis, R. M., Harvey, A., Lewis, A. C., and Hewitt, C. N.: Airborne determination of the temporo-spatial distribution of benzene, toluene, nitrogen oxides and ozone in the boundary layer across Greater London, UK, Atmos. Chem. Phys., 15, 5083–5097, https://doi.org/10.5194/acp-15-5083-2015, 2015.
Silver, B., Reddington, C. L., Arnold, S. R., and Spracklen, D. V.: Substantial changes in air pollution across China during 2015–2017, Environ. Res. Lett., 13, 114012, https://doi.org/10.1088/1748-9326/aac718, 2018.
Speidel, M., Nau, R., Arnold, F., Schlager, H., and Stohl, A.: Sulfur dioxide measurements in the lower, middle and upper troposphere: Deployment of an aircraft-based chemical ionization mass spectrometer with permanent in-flight calibration, Atmos. Environ., 41, 2427–2437, https://doi.org/10.1016/j.atmosenv.2006.07.047, 2007.
Stein, A. F., Draxler, R. R, Rolph, G. D., Stunder, B. J. B., Cohen, M. D., and Ngan, F.: NOAA's HYSPLIT atmospheric transport and dispersion modeling system, B. Am. Meteorol. Soc., 96, 2059–2077, https://doi.org/10.1175/BAMS-D-14-00110.1, 2015.
Stohl, A., Eckhardt, S., Forster, C., James, P., and Spichtinger, N.: On the pathways and timescales of intercontinental air pollution transport, J. Geophys. Res., 107, 4684, https://doi.org/10.1029/2001JD001396, 2002.
Stohl, A., Forster, C., Eckhardt, S., Spichtinger, N., Huntrieser, H., Heland, J., Schlager, H., Wilhelm, S., Arnold, F., and Cooper, O.: A backward modeling study of intercontinental pollution transport using aircraft measurements, J. Geophys. Res., 108, 4370, https://doi.org/10.1029/2002JD002862, 2003.
Tan, Z., Fuchs, H., Lu, K., Hofzumahaus, A., Bohn, B., Broch, S., Dong, H., Gomm, S., Häseler, R., He, L., Holland, F., Li, X., Liu, Y., Lu, S., Rohrer, F., Shao, M., Wang, B., Wang, M., Wu, Y., Zeng, L., Zhang, Y., Wahner, A., and Zhang, Y.: Radical chemistry at a rural site (Wangdu) in the North China Plain: observation and model calculations of OH, HO2 and RO2 radicals, Atmos. Chem. Phys., 17, 663–690, https://doi.org/10.5194/acp-17-663-2017, 2017.
Taraborrelli, D., Cabrera-Perez, D., Bacer, S., Gromov, S., Lelieveld, J., Sander, R., and Pozzer, A.: Influence of aromatics on tropospheric gas-phase composition, Atmos. Chem. Phys., 21, 2615–2636, https://doi.org/10.5194/acp-21-2615-2021, 2021.
Titos, G., Ealo, M., Román, R., Cazorla, A., Sola, Y., Dubovik, O., Alastuey, A., and Pandolfi, M.: Retrieval of aerosol properties from ceilometer and photometer measurements: long-term evaluation with in situ data and statistical analysis at Montsec (southern Pyrenees), Atmos. Meas. Tech., 12, 3255–3267, https://doi.org/10.5194/amt-12-3255-2019, 2019.
Turco, M., Rosa-Cánovas, J. J., Bedia, J., Jerez, S., Montávez, J. P., Llasat, M. C., and Provenzale, A.: Exacerbated Fires in Mediterranean Europe Due to Anthropogenic Warming Projected with Non-Stationary Climate-Fire Models, Nat. Commun. 9, 3821, https://doi.org/10.1038/s41467-018-06358-z, 2018.
United Nations: The 2018 Revision (ST/ESA/SER.A/420), Department of Economic and Social Affairs, Population Division World Urbanization Prospects, New York: United Nations, https://population.un.org/wup/Publications/Files/WUP2018-Report.pdf (last access: 19 April 2022), 2019.
United Nations Environment Programme (UNEP), World Meteorological Organization (WMO): Integrated Assessment of Black Carbon and Tropospheric Ozone, ISBN:92-807-3141-6, 2011.
Volz-Thomas, A., Xueref, I., and Schmitt, R.: Automatic gas chromatograph and calibration system for ambient measurements of PAN and PPN, Environ. Sci. Poll. Res., 9, 72–76, 2001.
von der Weiden-Reinmüller, S.-L., Drewnick, F., Zhang, Q. J., Freutel, F., Beekmann, M., and Borrmann, S.: Megacity emission plume characteristics in summer and winter investigated by mobile aerosol and trace gas measurements: the Paris metropolitan area, Atmos. Chem. Phys., 14, 12931–12950, https://doi.org/10.5194/acp-14-12931-2014, 2014.
Vrekoussis, M., Wittrock, F., Richter, A., and Burrows, J. P.: Temporal and spatial variability of glyoxal as observed from space, Atmos. Chem. Phys., 9, 4485–4504, https://doi.org/10.5194/acp-9-4485-2009, 2009.
Vrekoussis, M., Richter, A., Hilboll, A., Burrows, J. P., Gerasopoulos, E., Lelieveld, J., Barrie, L., Zerefos, C., and Mihalopoulos, N.: Economic crisis detected from space: Air quality observations over Athens/Greece, Geophys. Res. Lett., 40, 458–463, https://doi.org/10.1002/grl.50118, 2013.
Warneke, C., van der Veen, C., Luxembourg, S., de Gouw, J. A., and Kok, A.: Measurements of benzene and toluene in ambient air using proton-transfer-reaction mass spectrometry: calibration, humidity dependence, and field intercomparison, Int. J. Mass Spectrom., 207, 167–182, https://doi.org/10.1016/S1387-3806(01)00366-9, 2001.
Warneke, C., McKeen, S. A., de Gouw, J. A., Goldan, P. D., Kuster, W. C., Holloway, J. S., Williams, E. J., Lerner, B. M., Parrish, D. D., Trainer, M., Fehsenfeld, F. C, Kato, S., Atlas, E. L., Baker, A., and Blak, D. R.: Determination of urban volatile organic compound emission ratios and comparison with an emissions database, J. Geophys. Res., 112, D10S47, https://doi.org/10.1029/2006JD007930, 2007.
Wendisch, M., Pöschl, U., Andreae, M. O., Machado, L. A. T., Albrecht, R., Schlager, H., Rosenfeld, D., Martin, S. T., Abdelmonem, A., Afchine, A., Araújo, A. C., Artaxo, P., Aufmhoff, H., Barbosa, H. M. J., Borrmann, S., Braga, R., Buchholz, B., Cecchini, M. A., Costa, A., Curtius, J., Dollner, M., Dorf, M., Dreiling, V., Ebert, V., Ehrlich, A., Ewald, F., Fisch, G., Fix, A., Frank, F., Fütterer, D., Heckl, C., Heidelberg, F., Hüneke, T., Jäkel, E., Järvinen, E., Jurkat, T., Kanter, S., Kästner, U., Kenntner, M., Kesselmeier, J., Klimach, T., Knecht, M., Kohl, R., Kölling, T., Krämer, M., Krüger, M., Krisna, T. C., Lavric, J. V., Longo, K., Mahnke, C., Manzi, A. O., Mayer, B., Mertes, S., Minikin, A., MOlleker, S., Münch, S., Nillius, B., Pfeilsticker, K., Pöhlker, C., Roiger, A., Rose, D., Rosenow, D., Sauer, D., Schnaiter, M., Schneider, J., Schulz, C., de Souza, R. A. F., Spanu, A., Stock, P., Vila, D., Voigt, C., Walser, A., Walter, D., Weigel, R., Weinzierl, B., Werner, F., Yamasoe, M. A., Ziereis, H., Zinner, T., and Zöger, M.: The ACRIDICON-CHUVA campaign: Studying tropical deep convective clouds and precipitation over Amazonia using the new German research aircraft HALO, B. Am. Meteorol. Soc., 97, 1885–1908, https://doi.org/10.1175/BAMS-D-14-00255, 2016.
Wennberg, P. O., Bates, K. H., Crounse, J. D., Dodson, L. G., Mc-Vay, R. C., Mertens, L. A., Nguyen, T. B., Praske, E., Schwantes, R. H., Smarte, M. D., St Clair, J. M., Teng, A. P., Zhang, X., and Seinfeld, J. H.: Gas-Phase Reactions of Isoprene and Its Major Oxidation Products, Chem. Rev., 118, 3337–3390, https://doi.org/10.1021/acs.chemrev.7b00439, 2018.
Whalley, L. K., Stone, D., Dunmore, R., Hamilton, J., Hopkins, J. R., Lee, J. D., Lewis, A. C., Williams, P., Kleffmann, J., Laufs, S., Woodward-Massey, R., and Heard, D. E.: Understanding in situ ozone production in the summertime through radical observations and modelling studies during the Clean air for London project (ClearfLo), Atmos. Chem. Phys., 18, 2547–2571, https://doi.org/10.5194/acp-18-2547-2018, 2018.
Whalley, L. K., Slater, E. J., Woodward-Massey, R., Ye, C., Lee, J. D., Squires, F., Hopkins, J. R., Dunmore, R. E., Shaw, M., Hamilton, J. F., Lewis, A. C., Mehra, A., Worrall, S. D., Bacak, A., Bannan, T. J., Coe, H., Percival, C. J., Ouyang, B., Jones, R. L., Crilley, L. R., Kramer, L. J., Bloss, W. J., Vu, T., Kotthaus, S., Grimmond, S., Sun, Y., Xu, W., Yue, S., Ren, L., Acton, W. J. F., Hewitt, C. N., Wang, X., Fu, P., and Heard, D. E.: Evaluating the sensitivity of radical chemistry and ozone formation to ambient VOCs and NOx in Beijing, Atmos. Chem. Phys., 21, 2125–2147, https://doi.org/10.5194/acp-21-2125-2021, 2021.
Winkler, J., Blank, P., Glaser, K., Gomes, J. A. G., Habram, M., Jambert, C., Jaeschke, W., Konrad, S., Kurtenbach, R., Lenschow, P., Lörzer, J. C., Perros, P. E., Pesch, M., Prümke, H. J., Rappenglück, B., Schmitz, T., Slemr, F., Volz-Thomas, A., and Wickert, B.: Ground-Based and Airborne Measurements of Nonmethane Hydrocarbons in BERLIOZ: Analysis and Selected Results, J. Atmos. Chem., 42, 465–492, 2002.
Wintel, J., Hösen, E., Koppmann, R., Krebsbach, M., Hofzumahaus, A., and Rohrer, F.: Stable carbon isotope ratios of toluene in the boundary layer and the lower free troposphere, Atmos. Chem. Phys., 13, 11059–11071, https://doi.org/10.5194/acp-13-11059-2013, 2013.
World Health Organization (WHO): Review of evidence on health aspects of air pollution – REVIHAPP Project, WHO Regional Office for Europe, Copenhagen, Denmark, 2013.
Zahn, A., Weppner, J., Widmann, H., Schlote-Holubek, K., Burger, B., Kühner, T., and Franke, H.: A fast and precise chemiluminescence ozone detector for eddy flux and airborne application, Atmos. Meas. Tech., 5, 363–375, https://doi.org/10.5194/amt-5-363-2012, 2012.
Zhang, Y. H., Su, H., Zhong, L. J., Cheng, Y. F., Zeng, L. M., Wang, X. S., Xiang, Y. R., Wang, J. L., Gao, D. F., Shao, M., Fan, S. J., and Liu, S. C.: Regional ozone pollution and observation-based approach for analyzing ozone–precursor relationship during the PRIDE-PRD2004 campaign, Atmos. Environ., 42, 6203–6218, https://doi.org/10.1016/j.atmosenv.2008.05.002, 2008.
Zhu, T., Melamed, M., Parrish, D., Gauss, M., Gallardo Klenner, L., Lawrence, M., Konare, A., and Liousse, C.: Impacts of Megacities on air pollution and climate, WMO/IGAC, GAW Report No. 205, 2012.
Ziereis, H., Minikin, A., Schlager, H., Gayet, J. F., Auriol, F., Stock, P., Baehr, J., Petzold, A., Schumann, U., Weinheimer, A., Ridley, B., and Ström, J.: Uptake of reactive nitrogen on cirrus cloud particles during INCA, Geophys. Res. Lett., 31, L05115, doi:10.1029/2003GL018794, 2004.
Zimnoch, M., Necki, J., Chmura, L., Jasek, A., Jelen, D., Galkowski, M., Kuc, T., Gorczyca, Z., Bartyzel, J., and Rozanski, K.: Quantification of carbon dioxide and methane emissions in urban areas: Source apportionment based on atmospheric observations, Mitig. Adapt. Strat. Gl., 24, 1051–1071, https://doi.org/10.1007/s11027-018-9821-0, 2019.
- Abstract
- Introduction
- Background
- Specific scientific questions and characteristics of the EMeRGe IOP in Europe
- Transport and transformation of pollution plumes during the EMeRGe IOP in Europe
- Outlook
- Data availability
- Author contributions
- Competing interests
- Disclaimer
- Special issue statement
- Acknowledgements
- Financial support
- Review statement
- References
- Supplement