the Creative Commons Attribution 4.0 License.
the Creative Commons Attribution 4.0 License.
 | 28 Apr 2022
Volcanic SO2 layer height by TROPOMI/S5P: evaluation against IASI/MetOp and CALIOP/CALIPSO observations
Maria-Elissavet Koukouli
Konstantinos Michailidis
Isabelle A. Taylor
Antje Inness
Lieven Clarisse
Dimitris Balis
Dmitry Efremenko
Diego Loyola
Roy G. Grainger
Christian Retscher
Volcanic eruptions eject large amounts of ash and trace gases such as sulfur dioxide (SO2) into the atmosphere. A significant difficulty in mitigating the impact of volcanic SO2 clouds on air traffic safety is that these gas emissions can be rapidly transported over long distances. The use of space-borne instruments enables the global monitoring of volcanic SO2 emissions in an economical and risk-free manner. Within the European Space Agency (ESA) Sentinel-5p+ Innovation project, the S5P SO2 layer height (S5P+I: SO2LH) activities led to the improvements of the retrieval algorithm and generation of the corresponding near real-time S5P SO2 LH products. These are currently operationally provided, in near real-time, by the German Aerospace Center (DLR) within the framework of the Innovative Products for Analyses of Atmospheric Composition (INPULS) project. The main aim of this paper is to present its extensive verification, accomplished within the S5P+I: SO2LH project, over major recent volcanic eruptions, against collocated space-borne measurements from the IASI/Metop and CALIOP/CALIPSO instruments as well as assess its impact on the forecasts provided by the Copernicus Atmospheric Monitoring Service (CAMS). The mean difference between S5P and IASI observations for the Raikoke 2019, the Nishinoshima 2020 and the La Soufrière-St Vincent 2021 eruptive periods is ∼ 0.5 ± 3 km, while for the Taal 2020 eruption, a larger difference was found, between 3 ± 3 km and 4 ± 3 km. The comparison of the daily mean SO2 LH further demonstrates the capabilities of this near real-time product, with slopes between 0.8 and 1 and correlation coefficients ranging between 0.6 and 0.8. Comparisons between the S5P SO2 LH and the CALIOP/CALIPSO ash plumes revealed an expected bias at −2.5 ± 2 km, considering that the injected SO2 and ash plume locations do not always coincide over an eruption. Furthermore, the CAMS assimilation of the S5P SO2 LH product led to much improved model output against the non-assimilated IASI LH, with a mean difference of 1.5 ± 2 km, compared to the original CAMS analysis, and improved the geographical spread of the Raikoke volcanic plume following the eruptive days.
- Article
(14985 KB) - Full-text XML
-
Supplement
(1219 KB) - BibTeX
- EndNote


Over 10 years have passed since the ash cloud from the 2010 Icelandic Eyjafjallajökull volcano caused an unprecedented disruption to air traffic across Europe, affecting the flight schedules of approximately 10 million passengers and resulting in nearly USD 2 billion in lost airline revenue (Bolić and Sivčev, 2011). This eruption led to increased awareness of the threat of volcanic ash to air traffic in Europe, and numerous advances have taken place since then with respect to research, regulation, and cooperation (Reichardt et al., 2017). Apart from the ash cloud, the volcanic sulfur dioxide (SO2) plume is also hazardous to aircraft, as it forms the corrosive sulfuric acid and can further deposit sulfates in the engines (Prata, 2009). As the ash particles will deposit faster than SO2, after the first post-eruption hours the two clouds typically separate in elevation making the reliable detection, dispersal and forecast of both clouds during significant explosive eruptions on a global basis equally important (ICAO, 2019).
The disruption that the Eyjafjallajökull and Grímsvötn 2010 and 2011 eruptions had on airborne traffic has led the International Civil Aviation Organization, ICAO, to change the previous zero tolerance policy on volcanic ash to establishing ash concentration thresholds over Europe. Zehner (2012) have translated these thresholds into specific requirements for improved volcanic ash monitoring and forecasting services. These include the early detection of volcanic emissions and the near real-time (NRT) global monitoring of volcanic plumes, with open access and delivery of data (Brenot et al., 2014, 2021), and also the quantitative retrievals of volcanic ash as well as SO2 concentrations and altitudes from satellite instruments, and their validation.
Quantifying the SO2 load emitted during explosive eruptions provides insights into volcanic processes, assists in volcanic hazard mitigation and permits the climatic impact quantification of major eruptions (Carn et al., 2016). However, it is the accurate retrieval of the SO2 plume injection height that drives the majority of current scientific advancements in the field. Numerous eruptions have already been used as demonstrational case studies using a variety of space-borne observations and modeling techniques to infer the layer height (LH), such as eruptions by Mount Etna, Italy, (Boichu et al., 2015), Nabro, Eritrea (Clarisse et al., 2014), Jebel at Tair, Yemen (Eckhardt et al., 2008), Eyjafjallajökull and Grimsvötn, Iceland (Carboni et al., 2016), and Calbuco, Chile (Pardini et al., 2018), to name but a few.
Within the European Space Agency (ESA) Sentinel-5p+ Innovation SO2 Layer Height project (S5P+I: SO2LH) activities have led to the generation of a near real-time SO2 LH product based on the Sentinel-5P/TROPOMI observations, hereafter referred to as S5P SO2 LH. In this work, we present the direct evaluation of the retrieved SO2 LHs for four recent major eruptions against independent satellite information as well as its indirect verification via its assimilation into the Copernicus Atmospheric Monitoring Service (CAMS) forecast system.
The retrieval of the SO2 LH based on Sentinel-5P/TROPOMI measurements is performed using the already established “Full-Physics Inverse Learning Machine” algorithm (hereafter referred to as FP_ILM). It is based on Hedelt et al. (2019) and is an improvement of the FP_ILM algorithm developed by Efremenko et al. (2017) for the retrieval of the SO2 LH based on the Global Ozone Monitoring Experiment (GOME-2) instrument data using a principal component regression (PCR) technique. In general, the FP_ILM algorithm creates a mapping between the spectral radiance and atmospheric parameters using machine learning methods. The main advantage of the FP_ILM algorithm over classical direct fitting approaches is that the time-consuming training phase involving complex radiative transfer (RT) modeling and neural network (NN) training is performed offline. The final trained inversion operator itself is robust and computationally simple and therefore extremely fast and can be applied in NRT processing environments, as discussed in detail below. The FP_ILM algorithm was originally developed for the retrieval of cloud properties (Loyola et al., 2016) and has also been used for the retrieval of ozone profile shapes (Xu et al., 2017) as well as the retrieval of surface properties accounting for bidirectional reflectance distribution function (BRDF) effects (Loyola et al., 2020). Recently, Fedkin et al. (2021) have applied the FP_ILM algorithm to retrieve the SO2 LH based on Ozone Monitoring Instrument (OMI/Aura) observations.
The S5P SO2 LH algorithm was further optimized within the framework of the ESA S5P+I: SO2LH project. The S5P+I project has been initiated to develop novel scientific and operational applications, products and retrieval methods that exploit the potential of the Sentinel-5P mission's capabilities beyond its primary objective and was kicked-off at the end of June/beginning of July 2019 and successfully finished at the end of 2021 and addresses seven themes related to atmospheric composition and ocean color. The SO2LH theme is dedicated to the generation of an SO2 LH product for Sentinel-5p considering data production timeliness requirements. More details about the project can be found on the ESA S5P+I website (https://eo4society.esa.int/projects/sentinel-5p+innovation/, last access: 14 October 2021) as well as on the dedicated SO2 LH project website (https://atmos.eoc.dlr.de/so2-lh/, last access: 14 October 2021), where all algorithm and product-related documents are publicly available.
The optimized FP_ILM algorithm description
The FP_ILM S5P SO2 LH algorithm combines a principal component analysis (PCA) and an NN approach to retrieve the SO2 LH based on Sentinel-5P/TROPOMI backscattered UV earthshine measurements in the wavelength range between 311 and 335 nm. The PCA is used to reduce the dimensionality of the high-resolution spectral measurements and to extract the information related to the LH, whereas the NN is used to directly retrieve the LH based on the extracted principal components (PCs) and other input parameters.
In a first step, the FP_ILM algorithm is trained using synthetic spectral UV data generated with the Linearized Discrete Ordinate Radiative Transfer (LIDORT) model including inelastic rotational Raman scattering (RRS) implementation (Spurr et al., 2008). Approximately 500 000 reflectance spectra on a smart parameter grid (Loyola et al., 2016) in the wavelength range 311–335 nm have been generated, which are then convolved with the TROPOMI instrument spectral response function (ISRF). This simulated dataset is split into two datasets: 90 % are used for training the PCA and NN and the remaining 10 % are set aside and used as an independent test dataset to determine the accuracy of the FP_ILM training. A PCA is then applied to the training dataset to extract the first N=10 principle components to reduce the dimensionality of the spectral dataset. By characterizing the set of simulated measurements with fewer parameters, a simpler, more stable, and computationally efficient inversion scheme can be realized.
In the second step, the PCs of each training sample along with the total ozone vertical column density (O3 VCD), viewing angles, surface pressure and albedo are used as input to train a feedforward artificial NN, with the corresponding SO2 LH of each training sample as the output layer. The NN consists of two hidden layers with 40 nodes in the first and 10 nodes in the second layer. A hyperbolic tangent layer activation function (tanh) is used and a regularization is applied to prevent the NN from overfitting and to reduce the generalization error. Put together, the trained PCA operator and the trained NN form the FP_ILM inversion operator, which is then applied to real spectral measurements in the operational phase.
In the operational phase, the trained PC operator is applied to TROPOMI spectral measurements, which feature enhanced SO2 levels, such as after a volcanic eruption, to extract the first 10 PCs and thus reduce the spectral dimension. With this information (along with the other measured input parameters) the trained NN inverse function is then applied to retrieve the SO2 LH. Note that neither the SO2 SCD nor the SO2 VCD is input to the NN, since they depend on the SO2 LH both directly and indirectly via the air mass factor calculation and the temperature dependency of the absorption cross-section at the SO2 layer altitude.
In the operational TROPOMI/S5P ground segment, level 2 (L2) data are generated within 3 h after sensing. Once this L2 data are available and a volcanic eruption occurs, the SO2 LH algorithm is able to retrieve the corresponding LH within a few milliseconds per ground pixel. Even for a huge volcanic eruption with an SO2 cloud spanning about 3 % of the entire orbit (i.e., approximately 50 000 pixels), the whole SO2 LH retrieval is performed within 3 min. Note that the largest volcanic eruptions detected by satellites so far (e.g., Raikoke, Kasatochi, Sarychev, Nabro) lead to typically 1 %–3 % of ground pixels to be processed for a limited number of orbits. The FP_ILM algorithm is several orders of magnitude faster than any of the direct fitting approaches for UV LH retrievals developed so far.
Closed-loop retrievals with the independent test dataset show that the SO2 LH can be retrieved with an accuracy of less than 2 km for SO2 VCD > 20 Dobson units (DU, see Hedelt et al., 2019; SO2 LH algorithm theoretical baseline document, ATBD, Hedelt and Koukouli, 2021 and SO2 LH validation report, VR, Koukouli et al., 2021). Note here that in the presence of volcanic ash, which can be initially collocated with the SO2 cloud in the young volcanic plume, the retrieved SO2 LH can be underestimated by several kilometers since the FP_ILM inversion operators were trained without taking ash absorption into account (see an extensive discussion in S5P SO2 LH ATBD, Hedelt and Koukouli, 2021).
From the analysis presented in the S5P SO2 LH VR (Koukouli et al., 2021) it was deduced that the optimal accuracy was achieved when filtering the reported LH values using a quality assurance (QA) value (indicating the quality of the retrieval) greater than 0.5, a LH flag (indicating warnings and errors during the retrieval) less than 16 and an associated SO2 load greater than 20 DU. For the comparison against the independent datasets, the SO2 LH were then gridded onto a 0.1×0.1∘ spatial plane at 6 h intervals per eruptive day.
Two different IASI/Metop SO2 LHs are used for the evaluation of the S5P SO2 LHs: the EUMETSAT ACSAF Brescia v201510 product (Clarisse et al., 2012, 2014; Astoreca et al., 2018), hereafter IASI ULB/LATMOS, as well as the University of Oxford product (Carboni et al., 2012, 2016), hereafter IASI AOPP. The two IASI approaches vary to such an extent as is discussed below, that we can assume that they provide two semi-independent datasets available for the validation of the S5P SO2 LHs. In addition, the CALIOP/CALIPSO space-borne lidar observations of the ash plume (Winker et al., 2012; Prata et al., 2017) are compared to the S5P SO2 LHs for the case of the Raikoke stratospheric eruption. Furthermore, the S5P SO2 LH product was assimilated into a CAMS experiment (Inness et al., 2022), and the assimilated fields were compared to the independent IASI ULB/LATMOS observations, indirectly validating the S5P SO2 LH v4.0 product.
3.1 IASI ULB/LATMOS SO2 LH dataset
The IASI/MetOp SO2 ACSAF column data are fully described in Clarisse et al., 2012, where a algorithm for the sounding of volcanic SO2 plume above ∼ 5 km altitude was presented and applied to IASI. The algorithm is able to view a wide variety of total column ranges (from 0.5 to 5000 DU), exhibits a low theoretical uncertainty (3 %–5 %) and near real-time applicability and was thence demonstrated on the eruptions of Sarychev in Russia, Kasatochi in Alaska, Grimsvötn in Iceland, Puyehue-Cordon Caulle in Chile and Nabro in Eritrea. Furthermore, an expansion of the algorithm to also provide SO2 LHs for the Nabro eruption using forward trajectories and CALIOP coincident measurements is described in Clarisse et al. (2014). The IASI ULB/LATMOS dataset includes five SO2 column data at assumed LHs of 7, 10, 13, 16 and 25 km, as well as a retrieved best estimate for the SO2 LH. It is important to note that the SO2 LHs provided by this algorithm are quantized every 0.5 km, which renders simple scatter-type comparisons not as straightforward. This dataset is publicly available from https://iasi.aeris-data.fr/ (last access: 18 April 2022).
The observations by all Metop IASI instruments were treated as one, gridded onto a 0.1×0.1 grid at 6 h intervals or each day. The choice of the temporal field was applied since the S5P and Metop orbits differ on average by 3–4 h and this temporal range was found to be the optimal trade-off resulting in a successful collocative dataset while also ensuring the comparisons view the same parts of the SO2 plumes. Recall also that IASI, an infrared sounder, also performs observations 12 h later, during nighttime. For high enough latitudes, the time zones collapse onto one another, so in the case of high latitude volcanoes, such as Raikoke, a collocation closer in time can be achieved. For this dataset, the reported SO2 LHs were restricted to altitudes less than 25 km where a successful SO2 column retrieval was performed.
3.2 IASI AOPP SO2 LH dataset
The University of Oxford employs an optimal estimation scheme (Carboni et al., 2012, 2016) to estimate the SO2 column amount, the height of the SO2 profile and the surface radiating temperature from IASI/MetOp-A, /MetOp-B and /MetOp-C measurements. The Oxford retrieval has two steps. Firstly, a linear retrieval developed by Walker et al. (2011, 2012) is applied. In the retrieval scheme a detection is considered “positive” if the output of the linear retrieval is greater than a defined positive threshold (0.49 effective DU, following Walker et al., 2012). The detection limits are variable-dependent on the height of the plume and the atmospheric conditions. For a standard atmosphere (with no thermal contrast) the detection limits are estimated to be: 17 DU for a SO2 plume between 0–2 km, 3 DU between 2–4 km, and 1.3 DU between 4–6 km (Walker et al., 2011). The detection scheme can miss part of an SO2 plume under certain circumstances, such as low-altitude plumes, conditions of negative thermal contrast (i.e., where the surface is colder than the atmosphere), and where clouds are present above the SO2 plume, masking the signal from the underlying atmosphere. The IASI SO2 retrieval is not affected by underlying clouds. Secondly, an iterative retrieval is performed for the pixels that provide positive detection results. The scheme iteratively fits the forward model (simulations) with the measurements, through the error covariance matrix, to seek a minimum of a cost function. The forward model is based on RTTOV (Radiative Transfer for TIROS Operational Vertical Sounder (TOVS)) which is a very fast radiative transfer model for passive visible, infrared and microwave downward-viewing satellite radiometers, spectrometers and interferometers (Saunders et al., 1999). The error covariance matrix used is the global error covariance matrix described by Carboni et al. (2012), defined to represent the effects of atmospheric variability not represented in the forward model (FM), as well as instrument noise. A comprehensive error budget for every pixel is included in the retrieval.
A quality control was applied to the IASI AOPP dataset to include valid data points where the minimization routine converged within 10 iterations, the retrieved SO2 amount was positive, the retrieved plume pressure was between 0 and 1100 mbar and the cost function was less than 10. Additional filters were applied in this work to include only pixels with SO2 LH ≤ 25 km, SO2 LH error ≤ SO2 LH and the retrieved altitude ≠ a priori altitude at 400 mbar. The latter would indicate that the retrieval reverted back to the a priori for lack of signal in the measurement, hence would not provide any novel information to the retrieval. After the additional filters were applied, the IASI/AOPP dataset was also gridded onto a 0.1×0.1 grid at 6 h intervals per eruptive day.
3.3 CALIOP/CALIPSO volcanic LH dataset
Cloud-Aerosol and Lidar Infrared Pathfinder Observations (CALIPSO), is a joint NASA and Centre National d' Études Spatiales (CNES) satellite and part of the A-Train constellation of satellites. It is designed to study aerosols and clouds and aims to provide profiling information at a global scale for improving our knowledge and understanding of the role of the aerosols in the atmospheric processes. The main instrument, Cloud-Aerosol Lidar with Orthogonal Polarization (CALIOP), is a dual-wavelength (532 and 1064 nm) elastic backscatter lidar with the capability of polarization-sensitive observations at 532 nm (Winker et al., 2010). The high-resolution profiling ability coupled with accurate depolarization measurements make CALIPSO an indispensable tool to monitor specific aerosol species and clouds (Liu et al., 2008). CALIPSO is the first polarization lidar to provide global atmospheric measurements and is able to identify volcanic eruption plumes related to the SO2 LH identification and retrieval (e.g., Fedkin et al., 2021; Hedelt et al., 2019; Koukouli et al., 2014; Tournigand et al., 2020). The CALIPSO observations close to the volcanic source can be employed in SO2 LH validation studies, since ash (and/or aerosols) are initially collocated with the SO2 cloud, before the gas and ash plumes separate. Note that the footprint of CALIOP measurements is only 100 m, hence the global coverage is very low and detection of a volcanic ash plume is rare.
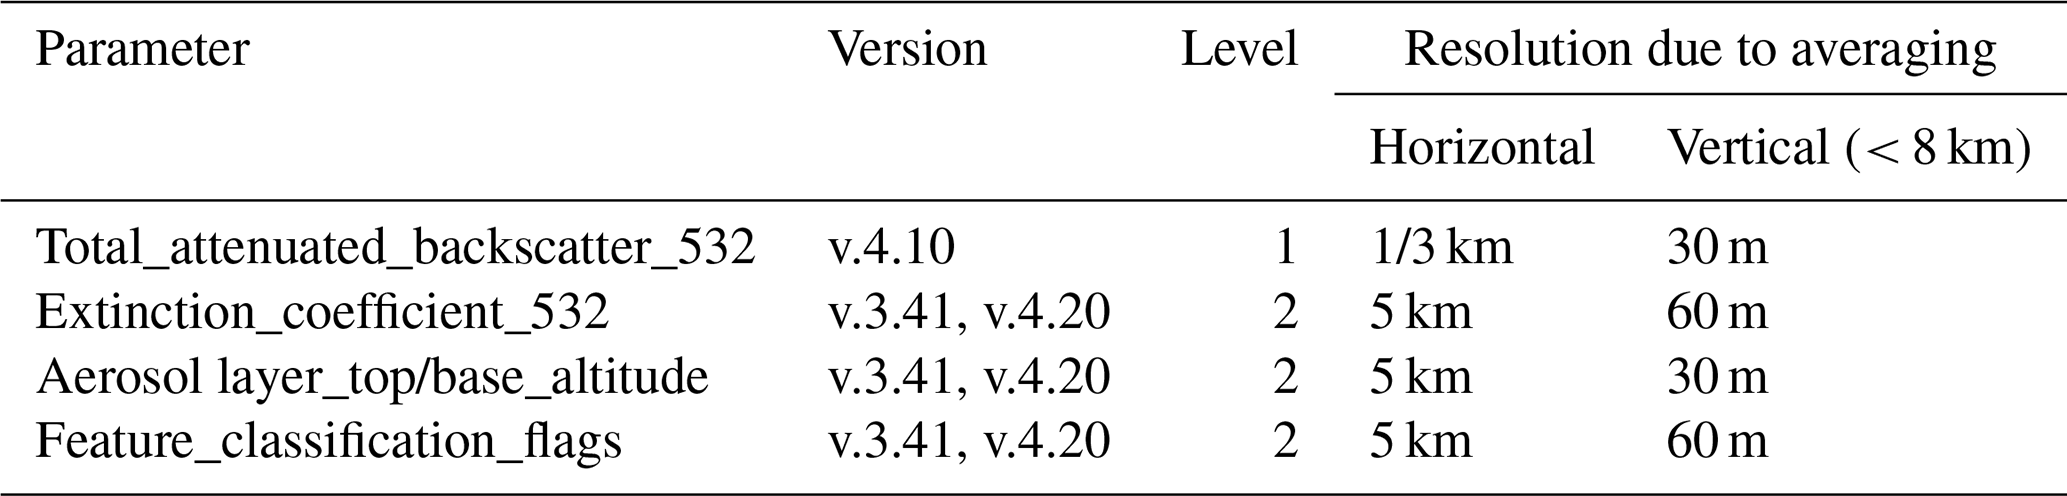
The CALIOP optical properties retrieval scheme is based on the successful cooperation of three major algorithm steps whose main mission objective is to produce the CALIPSO L2 data (Vaughan et al., 200; Omar et al., 2009). Finally, CALIPSO data consist of three basic types of information: (a) layer products, (b) profile products and (c) the vertical feature mask (VFM). Layer products provide layer-integrated or layer-averaged properties of detected aerosol and cloud layers. Profile products provide retrieved extinction and backscatter profiles within these layers. Because information on the spatial locations of cloud and aerosol layers is of fundamental importance, the VFM was developed to provide information on cloud and aerosol locations and types. Layer properties include layer top and base altitudes, as well as physical properties of the feature, such as the integrated volume depolarization ratio, some of which are described below. Layer top and base altitudes are reported in units of kilometers above mean sea level. Between −0.5 and ∼ 8.2 km, the vertical resolution of the lidar is 30 m. From ∼ 8.2 to ∼ 20.2 km, the vertical resolution of the lidar is 60 m. Above ∼ 20.2 km, the vertical resolution is 180 m. The on-board averaging scheme provides the highest resolution in the lower troposphere where the spatial variability of clouds and aerosols is the greatest and coarser resolutions higher in the atmosphere The CALIPSO data products used in this validation study are summarized in Table 1.
The CALIPSO version 4 (V4) product determines the locations of layers within the atmosphere, discriminates aerosols from clouds and categorizes aerosol layers as 1 of 11 subtypes, 7 in the troposphere and 4 in the stratosphere (Omar et al., 2009; Kim et al., 2018) providing also the optical depth of each detected aerosol layer (Winker et al., 2012). The most fundamental update in V4 is that aerosol layers are now classified as either tropospheric aerosol or of certain stratospheric aerosol feature types. The tropospheric aerosol types include the following subtypes: clean marine, dust, polluted, continental/smoke, clean continental, polluted dust, elevated smoke and dusty marine. Stratospheric aerosol subtypes have been introduced for ash, sulfate or other, smoke and polar stratospheric aerosol. Note that below the tropopause, ash and sulfate plumes are given by the tropospheric aerosol subtypes: volcanic ash is often classified as dust or polluted dust and volcanic sulfate is often classified as elevated smoke. As a result, contiguous aerosol features crossing the tropopause will have aerosol subtypes which switch from tropospheric to stratospheric subtypes, depending on the relationship between the attenuated backscatter centroid altitude of the layer identified by the feature finder and the tropopause altitude. Refer to the Data Quality Summary Document for further details (Vaughan et al., 2020).
3.3.1 CALIOP weighted extinction height
An important indicator for vertical profiles is the weighted extinction height, a parameter that gives in a single number an indication of the altitude of the detected aerosol plume distribution. This parameter is considered ideal for comparisons with aerosol LH from passive satellite sensors (e.g., GOME-2, IASI, TROPOMI) and the future Sentinel missions, since these retrievals are very sensitive to the location of the aerosol mass maximum within the detected layers. For the validation of the TROPOMI SO2 LH, we used CALIOP L2 version 4.10 aerosol extinction profiles at 5 km spatial resolution, retrieved from CALIOP observations of attenuated backscatter at 532 nm (Winker et al., 2010). Quality flags are also included in the L2 CALIOP products and are used to avoid cloud contamination of aerosol retrievals, which means that cloud features are identified and removed, as described in Winker et al. (2013) and Campbell et al. (2012).
To facilitate quantitative comparison of aerosol altitude, we used a mean extinction height calculated from the CALIOP extinction profile, following Koffi et al. (2012):
where Zi is the height from sea level in the ith lidar vertical level i (km), and βext,i is the aerosol extinction coefficient (km−1) at the same level. In the CALIOP L2 products, aerosol extinction is only retrieved for the layers in which aerosols are detected, depending on the instrument's signal-to-noise ratio (SNR). In the case when aerosols are present over clouds, ALHext will be situated in the center of the aerosol layer, with any undetected aerosol layers below the cloud layer not included in the calculations due to attenuation of the signal beyond the cloud layer. According to this validation method, the CALIOP 532 nm channel observations are chosen for analysis as the conclusions from the analysis of the results do not change when the 1064 nm channel observations are used instead (Nanda et al., 2020).
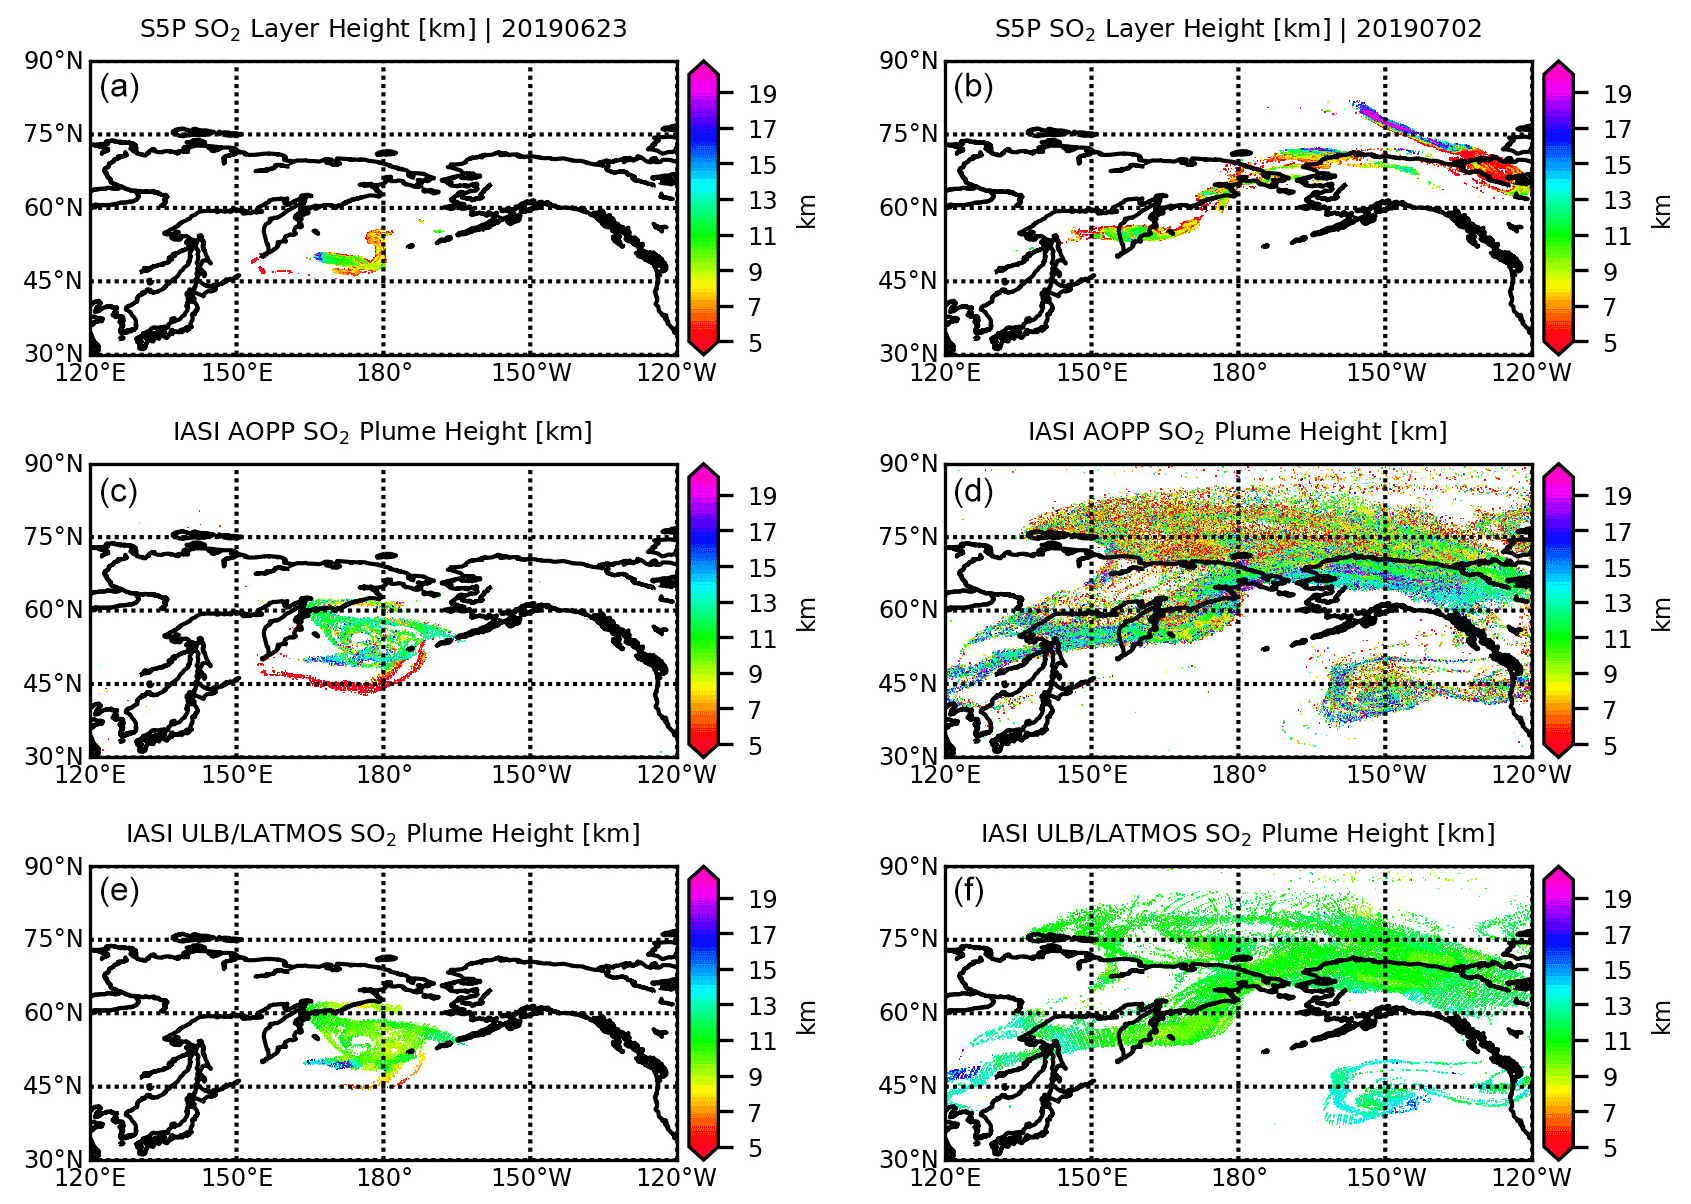
Figure 1SO2 LH for 2 example days of the Raikoke 2019 eruptive period, 23 June (a, c, e) and 2 July (b, d, f). S5P+I: SO2LH (a, b), IASI AOPP LH (c, d) and IASI ULB/LATMOS LH (e, f), including both ascending and descending orbits.
4.1 Comparisons with the IASI/Metop SO2 LH
4.1.1 Raikoke 2019
On 22 June 2019, a vast plume of ash and volcanic gases with more than 1000 DU of SO2 was emitted during the eruption of the Raikoke volcano, Kuril Islands (McKee et al., 2021). This eruption could be detected even 2 months after the end of eruptive event, which rendered it an important case study for testing different satellite observations retrieval methods; the original FP_ILM methodology applied to TROPOMI observations (Hedelt et al., 2019), a probabilistic enhancement method using the Cross-track Infrared Sounder (CrIS) on the Joint Polar Satellite System (JPSS) series of satellites (Hyman and Pavolonis, 2020), a synergistic analysis of different satellite observations and dispersion modeling (Kloss et al., 2021) and the recent application of the FP_ILM algorithm to OMI on Aura observations (Fedkin et al., 2021). This eruption was also used in numerical atmospheric modeling in simulating the dispersion of the Raikoke SO2 cloud in the UK Met Office numerical atmospheric-dispersion modeling environment (de Leeuw et al., 2021) and CAMS (Inness et al., 2022).
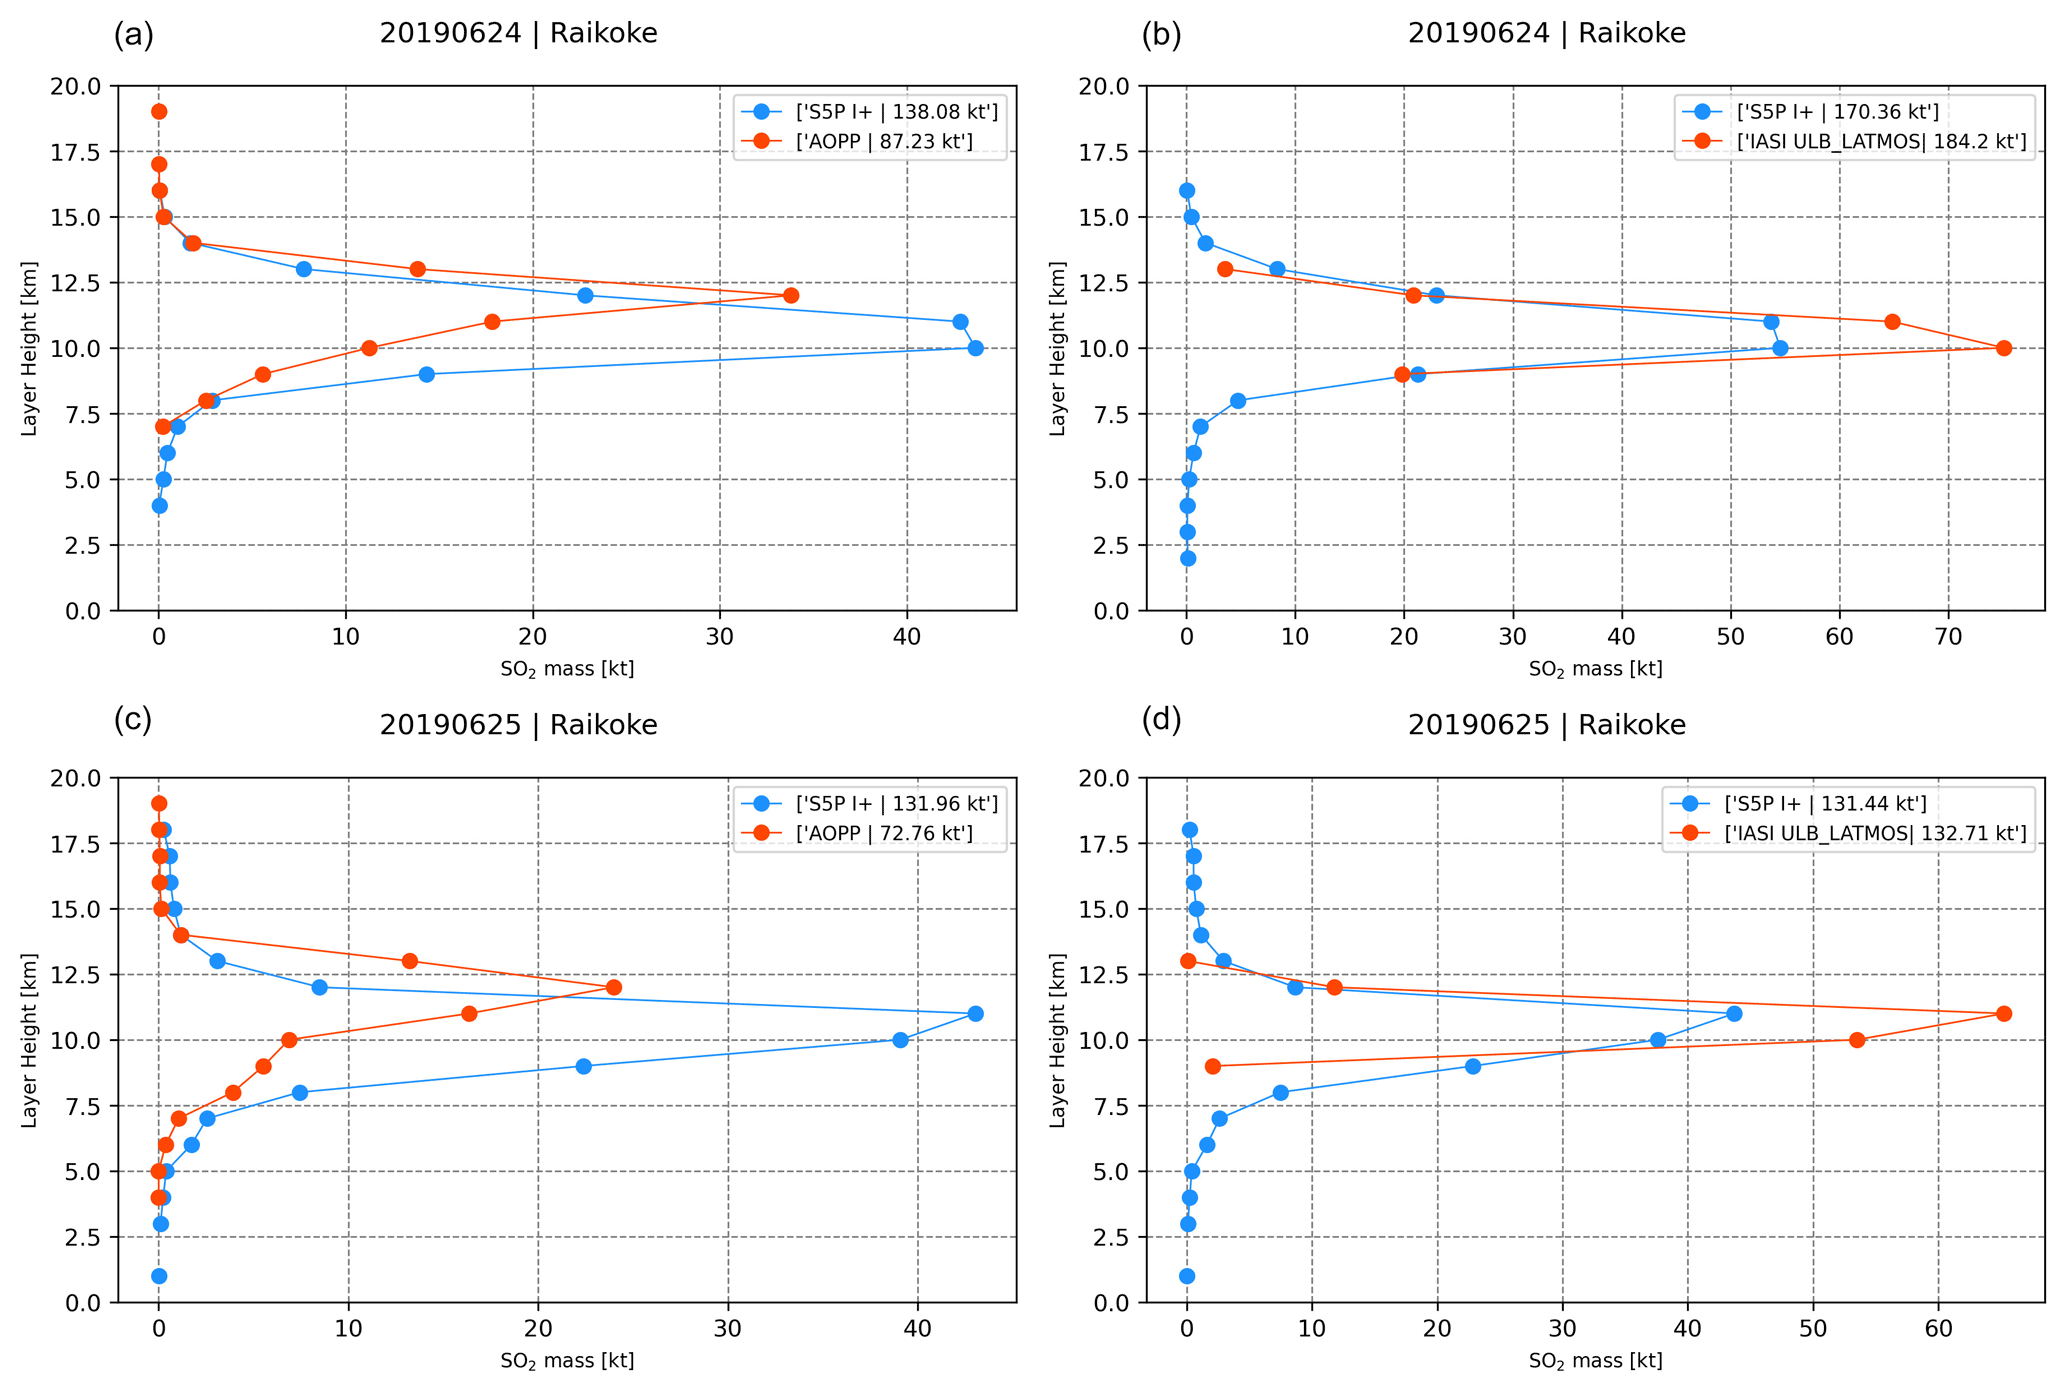
Figure 2SO2 integrated mass (kt) against plume altitude (km) for 2 example days of the Raikoke 2019 eruptive period–24 June (a, b) and 25 June (c, d)–for the S5P SO2 LH product in blue, IASI AOPP in orange (a, c), and IASI ULB/LATMOS in orange(b, d). In each set, the respective collocations are shown.
In Fig. 1, 2 example days of the 2019 Raikoke eruption, 23 June (left) and 2 July (right) are shown for the S5P SO2 LH (upper), the IASI AOPP LH (middle) and the IASI ULB/LATMOS LH (bottom) observations. These demonstrational figures do not represent collocative datasets, but show the spatial extent of the plumes reported by each dataset, after filtering and gridding are performed. Due to the restriction in SO2 load necessary (> 20 DU) in the S5P SO2 LH algorithm, the thinner parts of the plumes are not captured by the S5P observations; however, its NRT capabilities renders it an excellent tool for early detection in view of aviation safety. The equivalent maps for the SO2 load are presented in Fig. S1, where it is shown that the extensive plumes reported by both IASI products are associated with loads of less than ∼ 20 DU. A point to stress here is the undeniable fact that the S5P LH is retrieved in the UV wavelength range, which is sensitive to other atmospheric levels than the IR-based LH retrieval based on IASI data, hence different parts of the volcanic cloud are detected. Although the IASI LH gives a first estimate of the height of the volcanic cloud, this information cannot be used in S5P SO2 retrievals due to the difference in overpass time and pixel resolution. As the main limitation of the S5P LH product is that it can only be applied to modest to high volcanic eruptions, with SO2 VCD > 15–20 DU, weak volcanic eruptions, or the weaker parts of SO2 plumes cannot be retrieved. This point explains the different plume structure shown in Fig. S1.
The vertical distribution of the Raikoke SO2 plume can be examined in the integrated SO2 mass profiles presented in Fig. 2. The reported SO2 load was integrated every 1 km, between 0 and 20 km, on the collocated gridded datasets. In these 2 eruptive days, we note how the SO2 mass dispersed is placed with respect to the retrieved LH among the three datasets. Overall, the location of the peak SO2 mass is within 2 km between S5P and IASI; however, for IASI AOPP the amount of ejected SO2 mass is systematically lower in magnitude, even though it is well placed in height. This is most likely linked to the quality control applied to the IASI AOPP SO2 results, which excludes a number of pixels within the core part of the plume, due to the poor fit between the measured and modeled spectra.
Figure 3 shows the comparisons for the entire Raikoke eruptive period between the S5P SO2 LH and the IASI/AOPP LH (left) and the IASI ULB/LATMOS LH (right) in histogram mode. For both comparisons, the mean S5P SO2 LH is reported at 10.75 ± 3.50 km for the IASI/AOPP and at ∼ 10.20 ± 2.80 km for the IASI ULB/LATMOS collocations IASI/AOPP places the plume at ∼ 11.40 ± 2.50 km and IASI ULB/LATMOS at ∼ 10.00 ± 1.0 km, resulting in an excellent mean difference between sensors of ∼ ± 0.5 ± 3 km on average.
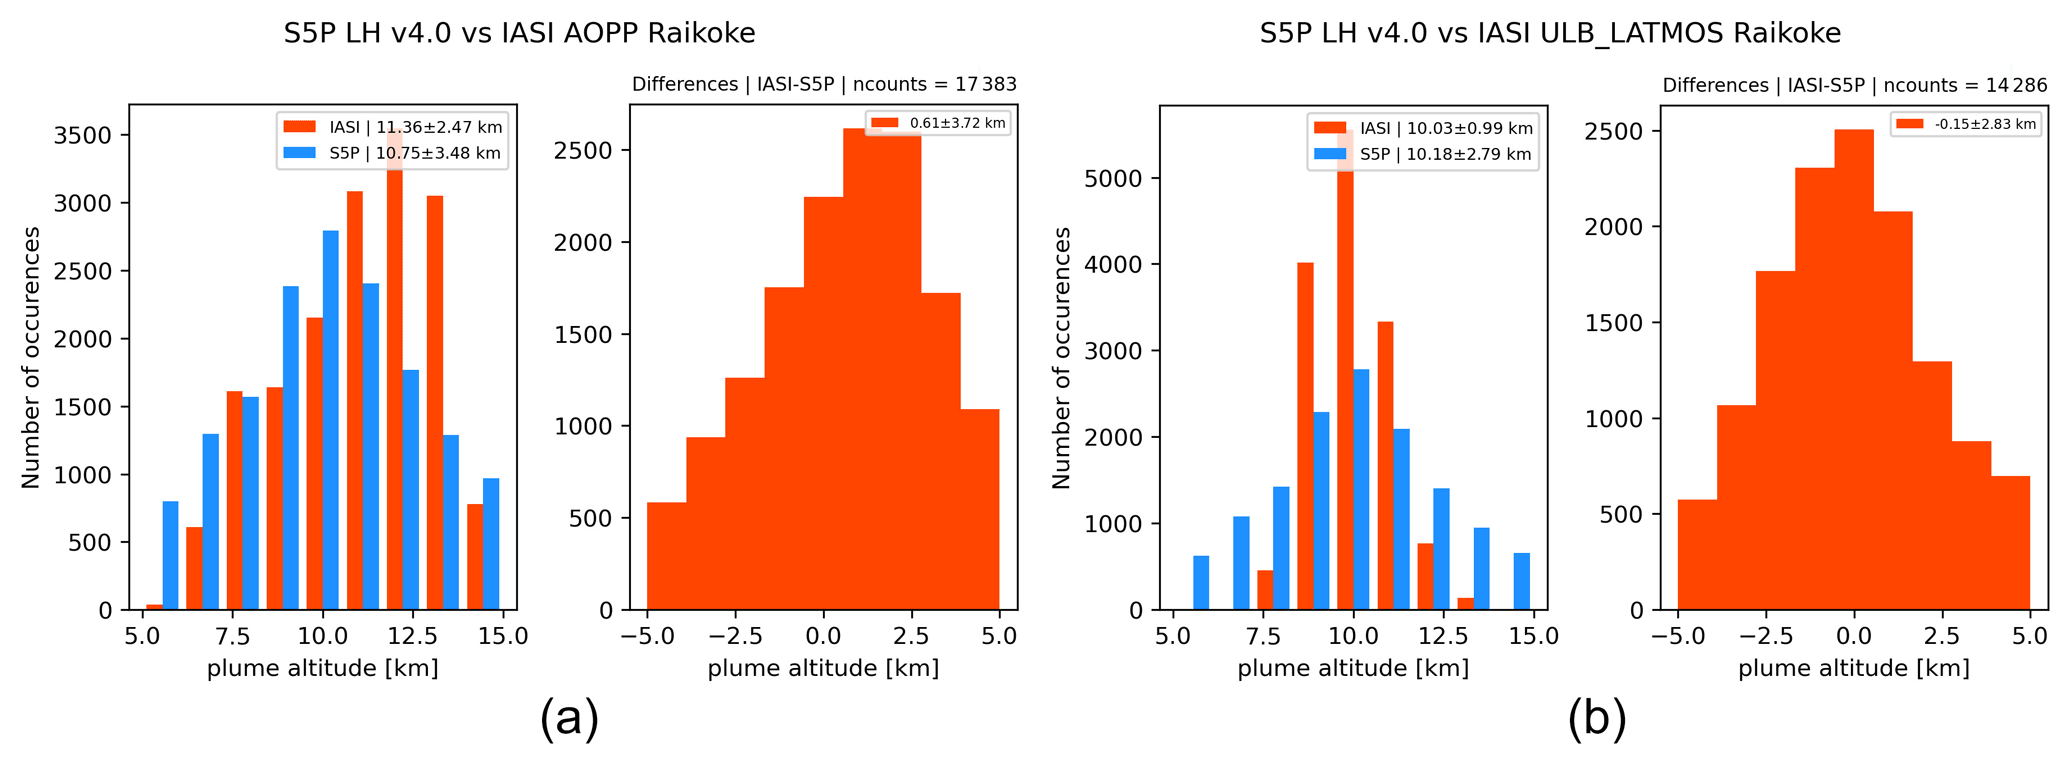
Figure 3Comparisons between spatiotemporally collocated plume heights for the Raikoke 2019, eruptive days. (a) Left panel, histogram distribution for the S5P LHs (blue) and the IASI/AOPP LHs (orange) and right panel, their absolute differences. (b) As per (a) for the comparisons to the IASI ULB/LATMOS dataset.
4.1.2 Taal 2020 and La Soufrière 2021 eruptions
The Taal volcano in Batangas, the Philippines, erupted on the afternoon of 12 January 2020, 43 years after its previous eruption in 1977. Strong explosions began around 15:00 and spewed an ash column exceeding 1km in thickness. By 19:30, volcanic activities intensified as continuous eruptions generated a tall, 10–15 km, steam-laden tephra column (Jing et al., 2020). Perttu et al. (2020) analyzed infrasound observations to the east of the volcano and estimated a plume height and duration for further ash dispersion modeling, reporting the plume at a mean height of 15 km. The high spectral resolution lidar of the Manila Observatory (http://www.observatory.ph/2020/01/17/taal-volcano-2020-eruption-impact-on-air-quality-part-i/, last access: 13 October 2021) reported a massive ash cloud ingested and transported above the 12 km altitude in the first post-eruption hours, a finding further corroborated by the volcanic ash detected by the advanced meteorological imager on board the GEOKOMPSAT-2A platform (Ahn et al., 2021) whose analysis also placed the ash cloud at 12 km. The presence of ash hinders the detection of the SO2 cloud by both UV-visible and infrared sensors and partially explains the larger spread in reported SO2 LHs by TROPOMI and IASI shown in Fig. S2. A large disagreement on the altitude of the SO2 plume is found between datasets in this case, with differences between −3 and −5 km between the observations, also attributable to the ∼ 3 h difference in sensing time and its importance when studying the first few hours after a volcanic eruption (see maps in Fig. S3 in the Supplement).
On the morning of 9 April 2021, the La Soufrière volcano on the Caribbean island of Saint Vincent began erupting, spewing ash at least 7.5 km in the air, for the first time since 1979. The volcano continued to erupt over the next several days, with multiple violent explosions. Ash blanketed Saint Vincent and winds carried ash to Barbados, about 120 miles (190 km) to the east. The Smithsonian Institute Global Volcanism Program, https://volcano.si.edu/volcano.cfm?vn=360150, last access: 13 October 2021, reported a period of explosive activity and strong pulses of ash emissions at 03:30 on 10 April, and the resulting ash plumes rose to ∼ 10–16 km altitude throughout the day. On 12 April, at 04:15, another large explosion produced an ash plume that rose to ∼ 13 km altitude. The spread of the SO2 plume sensed by TROPOMI and both IASI algorithms is shown in Fig. S4, where the SO2 plume reached very high altitudes, above 15 km, when close in location to the volcano and decreasing in height as it progressed to the east over the sea. For both comparisons in Fig. S5, the agreement of the collocative datasets is within 1 km, all instruments placing the SO2 plume at an average height of 14–15 km.
4.1.3 Summary of the comparisons with the IASI/Metop observations
The overall statistics for the comparisons of the SO2 plume altitude for four eruptions between 2019 and 2021 for S5P and the IASI AOPP comparisons are shown in Table 2, while those of the IASI ULB/LATMOS are given in Table 3. The collocations refer each time to those of each of the two sets. Note that for the Nishinoshima, Japan, eruptive period in July and August 2020, collocations are only available for the IASI ULB/LATMOS datasets. Overall, per eruptive period, the mean plume altitudes are similarly placed by both UV-visible and infrared instruments, with a mean difference of ∼ 0.20 ± 3.30 km for the Raikoke, Nishinoshima and La Soufrière eruptions and ∼ −3.60 ± 2.90 km for the Taal eruption.
Table 2Overall statistics for the comparison between S5P LH and IASI AOPP LH for the eruptive periods.
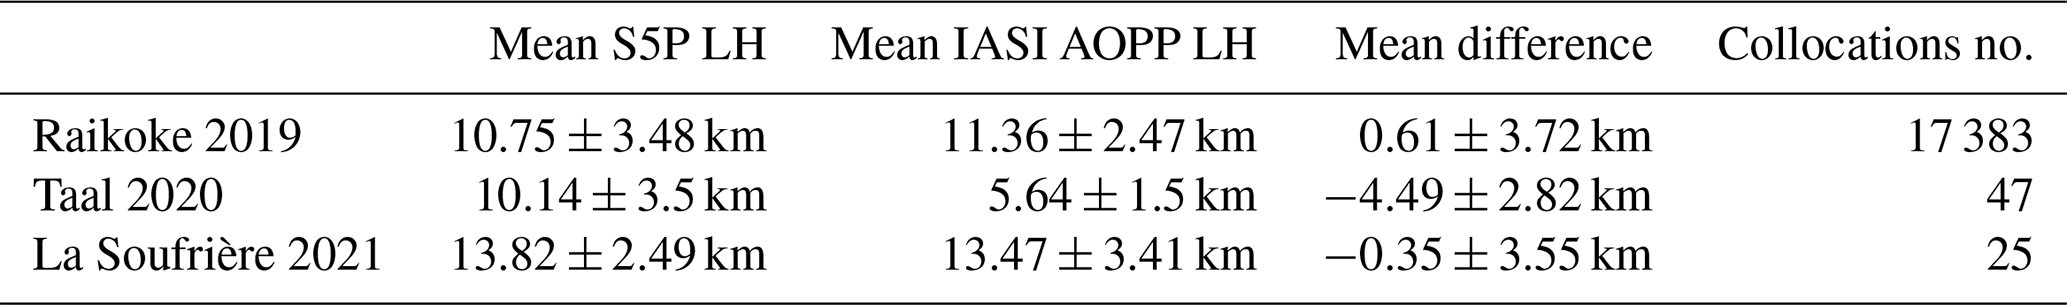
Table 3Overall statistics for the comparison between S5P LH and IASI ULB/LATMOS LH for the eruptive periods.
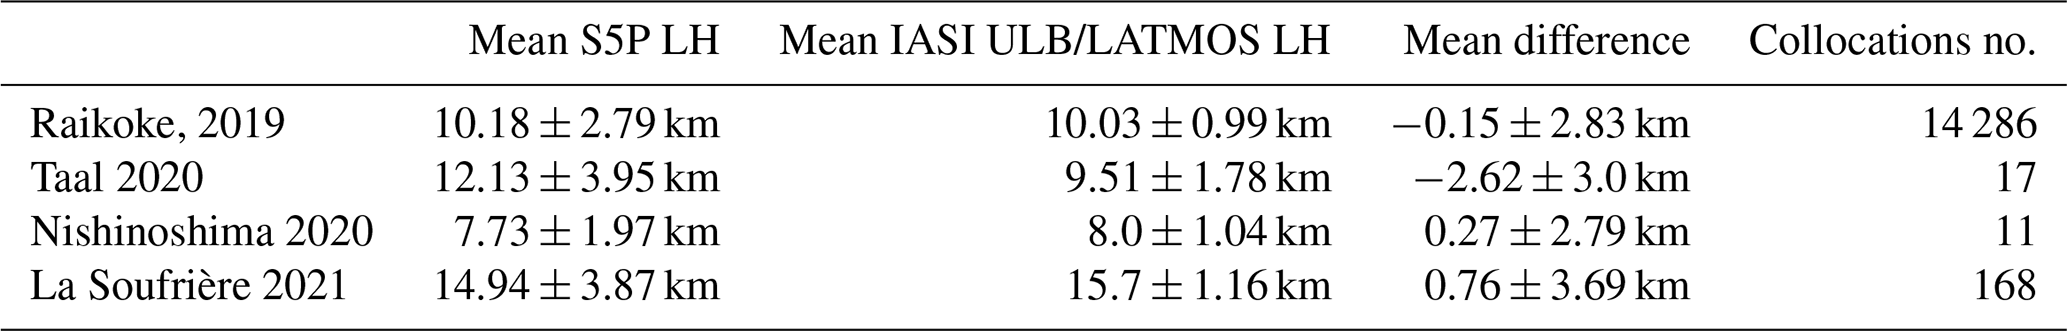

Figure 4Scatter plots of the mean daily average reported SO2 LHs by TROPOMI/S5P and (a) IASI/AOPP for the Raikoke, Taal and La Soufrière eruptions and (b) IASI ULB/LATMOS for the Raikoke, Taal and La Soufrière and Nishinoshima eruptions. The error bars represent the standard deviation of the mean, while the shaded areas represent the 95 % confidence interval of the fit.
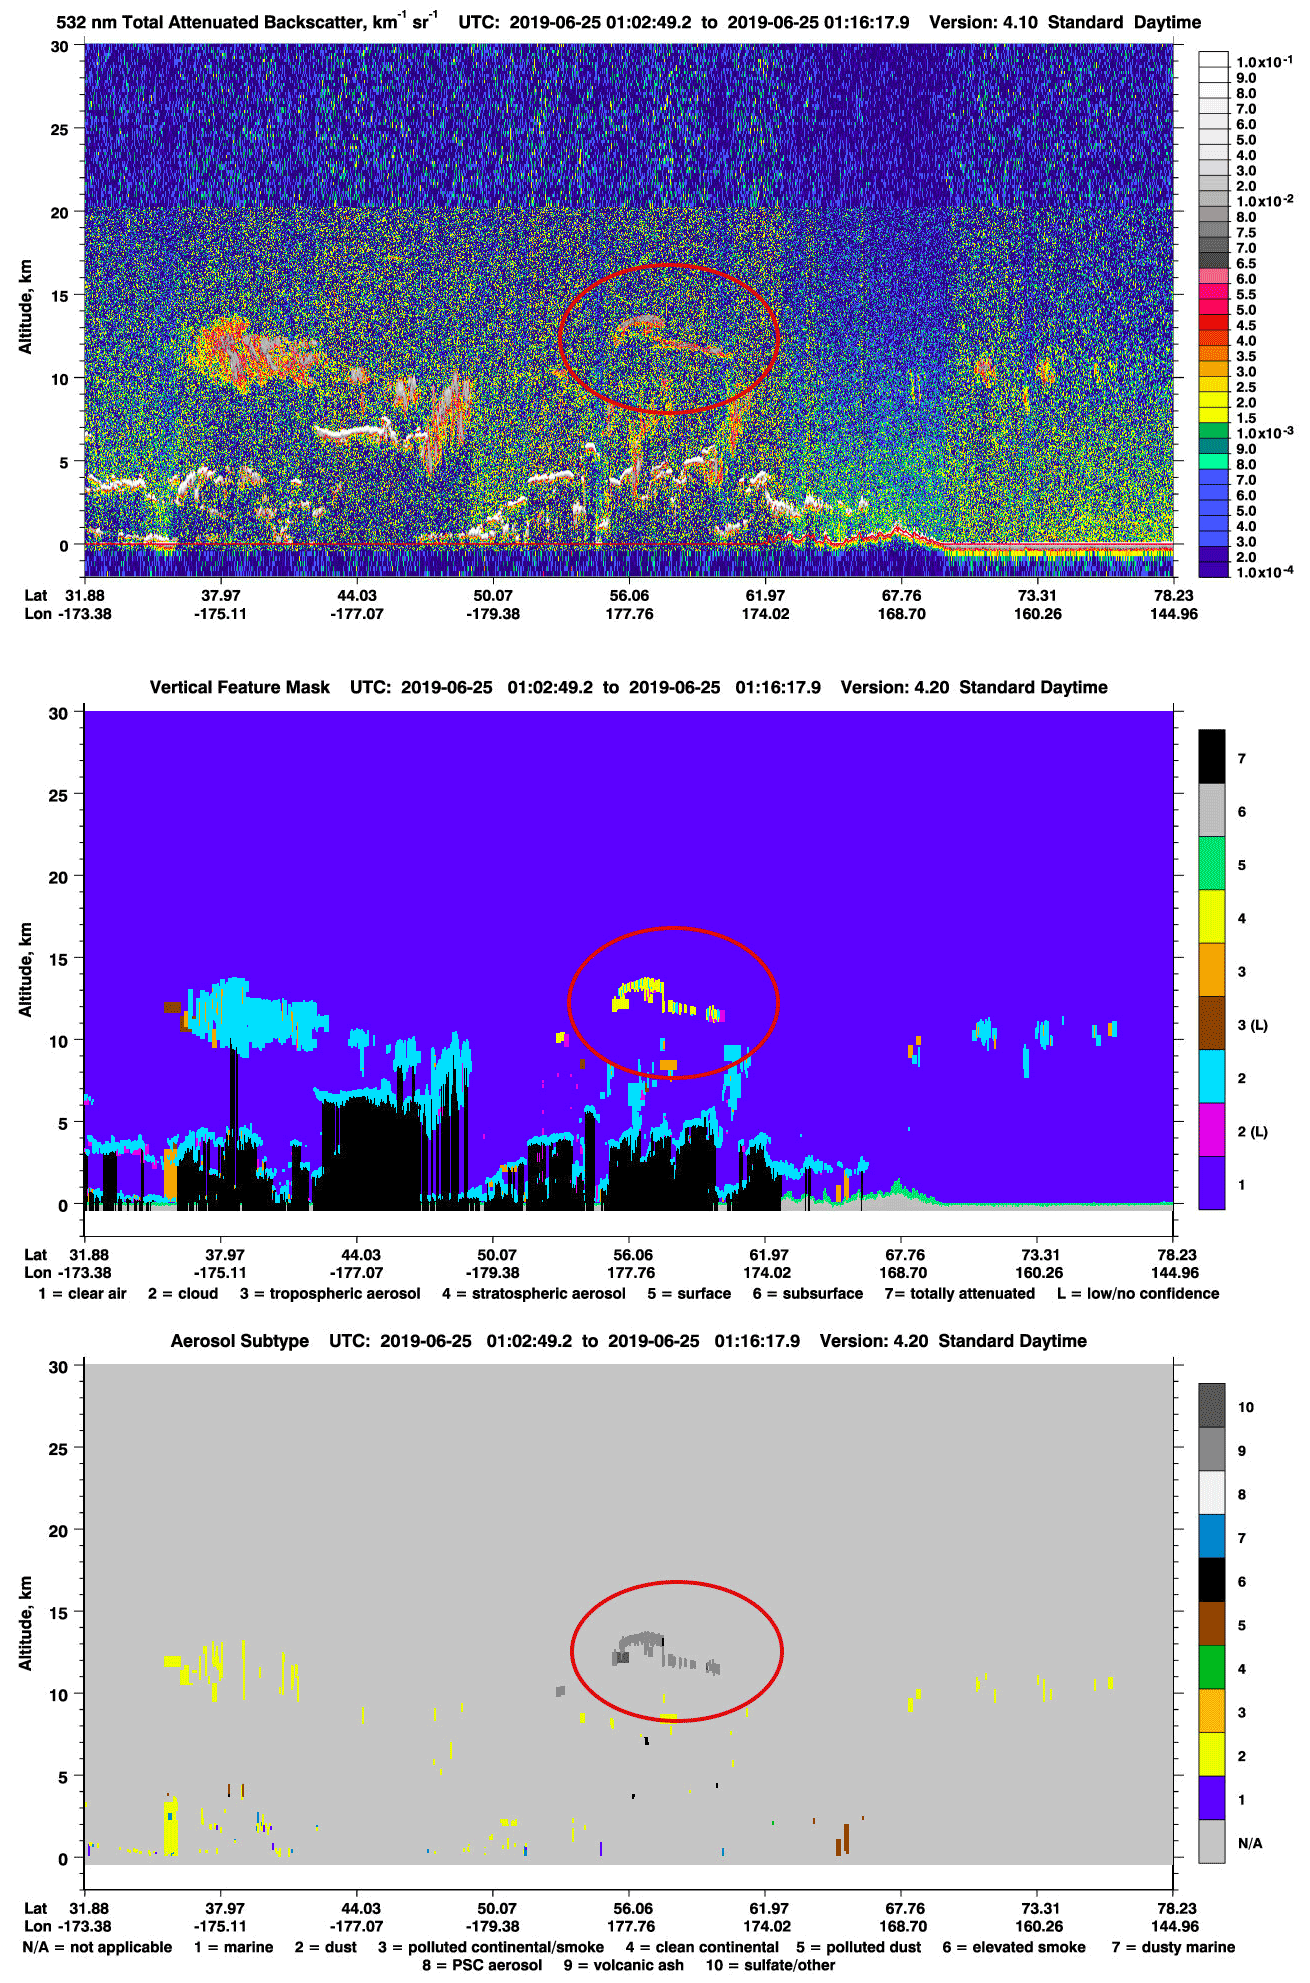
Figure 5CALIOP lidar measurements for the Raikoke eruption along the track indicated in Fig. 6 on 25 June 2019. (Top) Total attenuated backscatter profile (in sr−1 km−1), (middle) vertical feature mask image showing the location of all layers detected and (bottom) aerosol subtype. The area outlined in red denotes the volcanic feature detected from CALIOP. Images courtesy of NASA: https://www-calipso.larc.nasa.gov/products/ (last access: 18 April 2022).
The comparisons between S5P and IASI AOPP SO2 LHs are shown in Fig. 4, on the left, and IASI ULB/LATMOS on the right, for all eruptive days where the mean plume height reported for each of the 27 d of collocations is shown as a scatter plot. For the IASI AOPP SO2 LHs (left) the comparison is very promising, with a slope close to 0.91 ± 0.21, y-intercept of 1.20 ± 2.54 km and correlation coefficient of 0.66 for the 27 collocation days for the Raikoke, Taal and La Soufrière eruptions. The outlier point, where S5P reports a high LH at ∼ 10 km, while IASI AOPP reports low at ∼ 5 km, belongs to the Taal comparison, discussed previously. For ULB/LATMOS comparison, the mean SO2 LHs, as expected, follow a straight line with a slope of ∼ 0.98 ± 0.19 and y-intercept of ∼ 0.77 ± 2.06 km, and a correlation coefficient of 0.73. Nearly 20 d belong to the Raikoke eruptive period, and the rest to the Taal, Nishinoshima (only for ULB/LATMOS) and La Soufrière eruptions.
4.2 Comparisons with CALIOP/CALIPSO volcanic ash LH
4.2.1 Raikoke 2019
Within this study, the availability of overpasses of CALIOP/CALIPSO after the eruption of the Raikoke volcano on the 22 June was examined. Volcanic ash and sulfate aerosols are identified in CALIOP profiles based on collocated TROPOMI pixel values. The closest distances between the CALIOP footprint of the CALIPSO overpass and the locations of the TROPOMI center pixels are selected to create collocated datasets, usually with the two orbits being within 1 h of one another. To illustrate the reliability of the TROPOMI SO2 LH product, we discuss in detail a selected case of collocated and concurrent TROPOMI-CALIPSO observations close to the detected SO2 plume from the Raikoke eruption on 25 June 2019.
We use the 532 nm Total Attenuated Backscatter (TAB) data version 4.10 from one CALIPSO orbit in order to detect the aerosols and clouds and their heights. The TAB signal strength (Fig. 5, top) is color-coded in a manner that the blue background represents molecular and weak aerosol scattering while aerosols typically appear in the shades of red, orange and yellow. The gray scales represent the stronger cloud signals, while the weaker cloud signals, being similar in strength to the strong aerosol signals, also appear in the shades of red, orange and yellow. The TAB is sensitive to both water and ice droplets, as well as numerous types of atmospheric particles. The equivalent VFM image (Fig. 5, middle) shows the aerosol type, which is retrieved according to the aerosol classification algorithm for all the detected aerosol layers. The VFM describes the vertical and horizontal distribution of both aerosols and clouds. After detection of the aerosol features, they are then classified into types and subtypes. As shown in Fig. 5 (bottom), the plume scene is well captured and according to the V4 algorithm, is classified as volcanic ash and sulfate (Kim et al., 2018). The volcanic plume of the 25 June 2019 is outlined in red.
Figure 6 shows the TROPOMI SO2 LH pixels retrieved by the FP_ILM algorithm for SO2 VCDs greater than or equal to 20 DU, QA > 50 and LH flag < 16, overlaid with the calculated CALIPSO weighted extinction ALH pixel values (colored circles) which are color-coded according to the range of height values (in km). The CALIOP overpass time of this area is between 01:00 and 01:15 UTC, and the TROPOMI overpass time is between 01:25 and 01:30 UTC, a time difference of mere minutes. The TROPOMI plume shows several layers with SO2 LHs ranging from 5–6 km up to 14 km for this day. In the area of the plume observed by both TROPOMI and CALIOP (54–58∘ N and 176–178∘ E), the CALIOP VFM and aerosol subtype mask identify some volcanic ash at approximately 13 km altitude, and meteorological clouds mixed with tropospheric aerosols (dust, polluted dust and elevated smoke) at lower altitudes. The clouds below the ash plume are shown in blue in Fig. 5, middle panel.
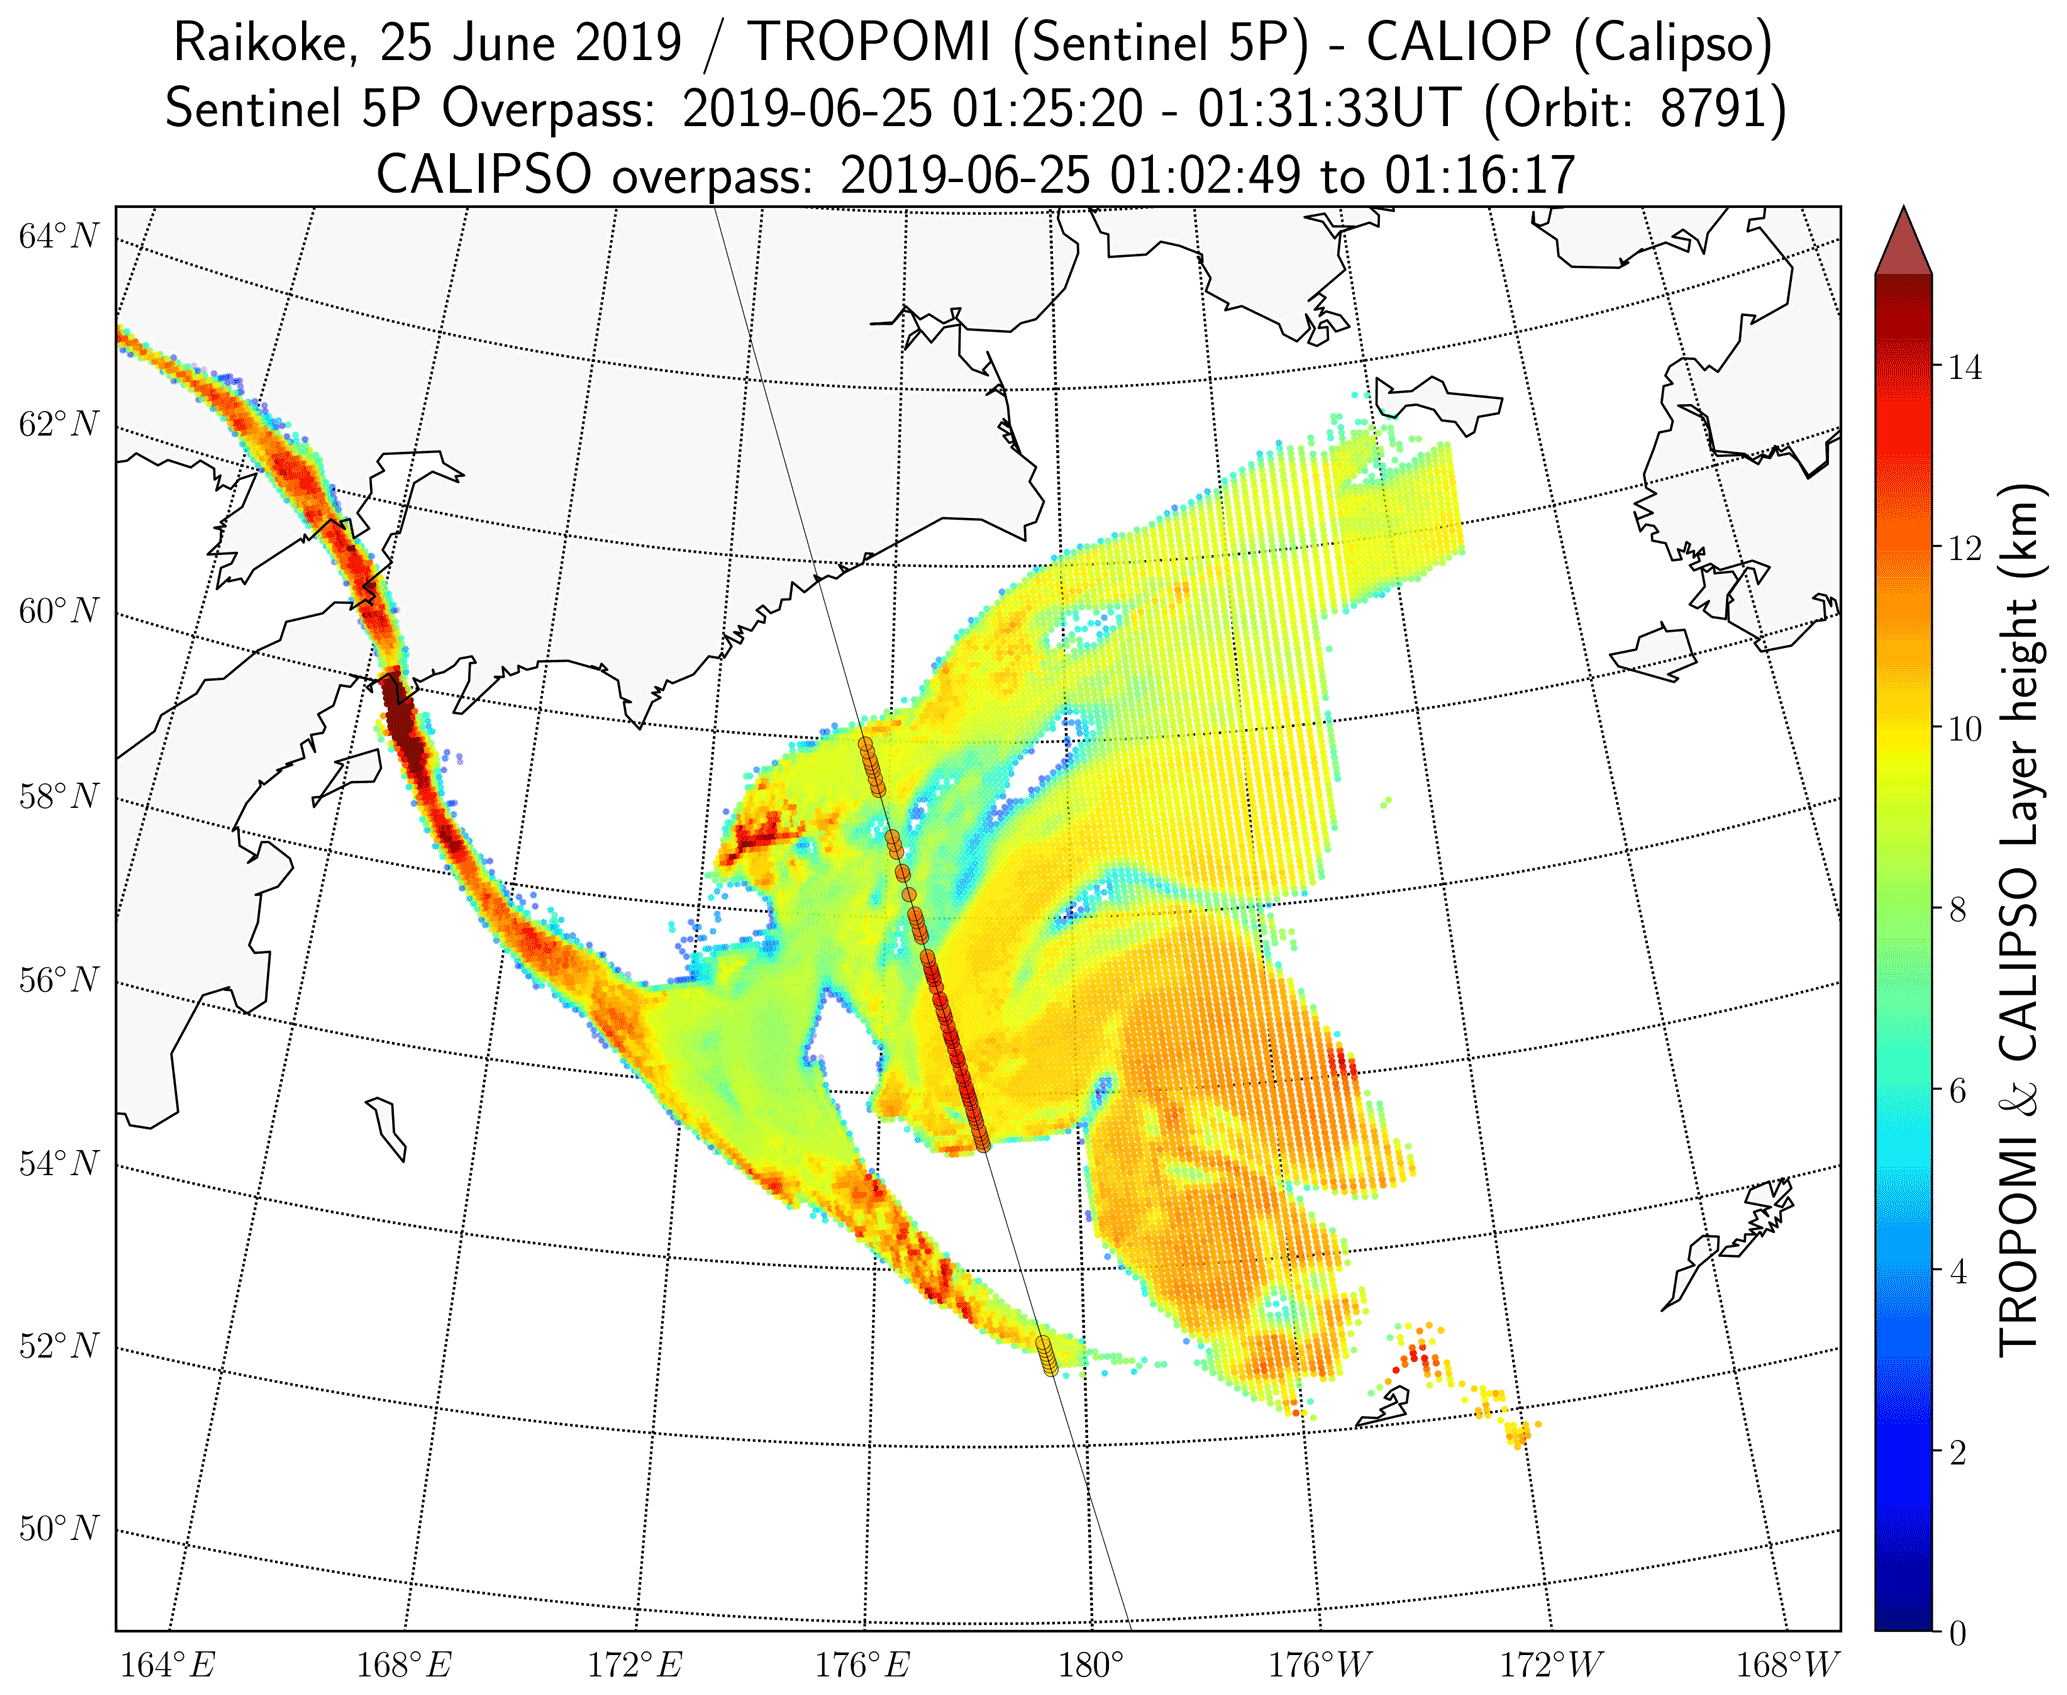
Figure 6TROPOMI SO2 LH pixels for the Raikoke volcanic eruption, measured on 25 June 2019. Only pixels with SO2 VCDs greater than or equal to 20 DU are shown. The black line indicates the CALIPSO ground track and the colored circles along the line indicate weighted extinction height product values (in km), for the results shown in Fig. 5.
The spatiotemporal collocation between TROPOMI and CALIOP on that day is near perfect (Fig. 7, left) and the spatial agreement between SO2 LH and CALIOP weighted extinction altitude is satisfactory, considering the differences between the ash and SO2 plumes, confirming the presence of volcanic plumes. Both instruments yield high altitude values; however, TROPOMI retrieves higher altitudes especially for the western part of the plume. A comparison scatterplot of collocated ash-flagged pixels is shown in Fig. 7, right. The pixel-by-pixel scatter of the 57 common points shows a high correlation of 0.73, even though the SO2 plume is placed approximately 2 km lower than the ash plume.

Figure 7(a) The latitude and longitudes of the collocated pixels. (b) Comparison between TROPOMI SO2 LH and CALIPSO weighted extinction height for 25 June 2019, color-coded depending on the TROPOMI SO2 column amount. The orange line is the regression line of the TROPOMI-CALIPSO observations; the gray line is the 1:1 line.
Overall, seven TROPOMI (at 22 June 02:20; 23 June 00:20; 24 June 00:00; 25 June 01:30; 28 June 02:00; 29 June 02:00 and 30 June 01:30) and CALIPSO collocated overpasses (at 22 June 02:30; 23 June 01:30; 24 June 00:30; 25 June 01:00; 28 June 03:00; 29 June 03:35 and 30 June 02:40) were identified. A statistical analysis has been performed using all resulting 241 collocated pixels for 22, 23, 24, 25, 28, 29 and 30 June 2019. Figure 8 shows the distribution of TROPOMI SO2 LH and CALIOP calculated weighted height differences for all days, as a scatter plot on the left and on a histogram representation on the right. The colored dots in the scatter plot denote each individual eruptive day. The overall agreement is adequate and as expected, with mean and median residual values around ∼ −2.4 and ∼ −3.0 km respectively, and a standard deviation of ∼ 1.7 km. The CALIOP ALHext is higher than TROPOMI SO2 LH in the majority of the cases. This could partially be due to CALIOP underestimating the aerosol layer thickness due to strong attenuation of the lidar signal at the top of the detected aerosol layer (Rajapakshe et al., 2017), whereas the TROPOMI SO2 LH product does not suffer from such attenuation.
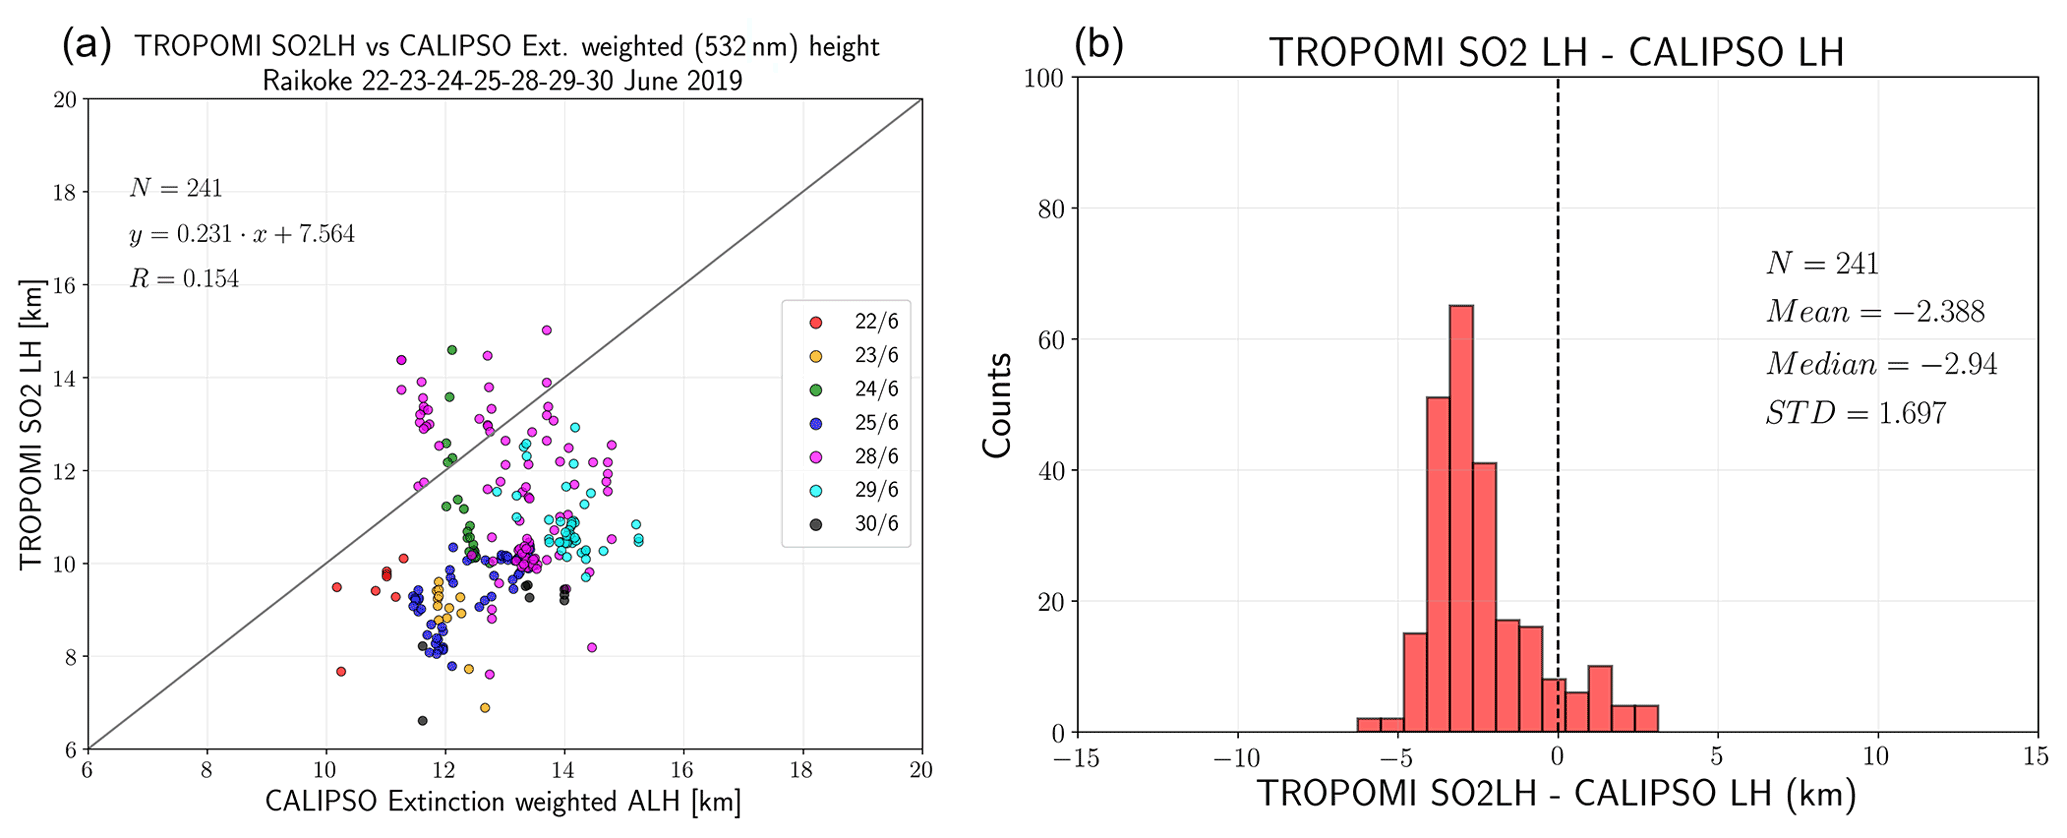
Figure 8(a) Scatter plot of the TROPOMI SO2 LH and CALIPSO weighted height for all collocated pixels on 22, 23, 24, 25, 28, 29 and 30 June 2019, for the Raikoke eruption. (b) Histogram distribution of the absolute differences between TROPOMI SO2 LH and the corresponding CALIPSO weighted extinction height measurements, calculated for the 241 collocated points.
4.2.2 Sinabung 2018, Nishinoshima 2020 and La Soufrière 2021 eruptions
On 19 February 2018, at 08:53 LT, the Indonesian stratovolcano Mount Sinabung on Sumatra (2460 m summit elevation) erupted jetting a large ash plume that quickly rose to heights of approximately 15–17 km. Although the eruption was spatiotemporally small an excellent overpass was found against the CALIPSO instrument (Fig. S6, left). The CALIOP track crossed the main part of the volcanic cloud, across the north-south axis. Its overpass time was between 07:08 and 07:22 UTC, a mere 45 min after the TROPOMI overpass time, between 06:24 and 06:26 UTC. The CALIPSO observations showed both the ash cloud as a layer around 5 km, as well as two vertical ash clouds extending from the volcano up to ∼ 10 km altitude. As shown in Fig. 9, where the S5P SO2 LH retrievals are shown in the red dots, the presence of clouds appeared along the CALIPSO path indicated by the stronger attenuated backscatter than the aerosol layer.
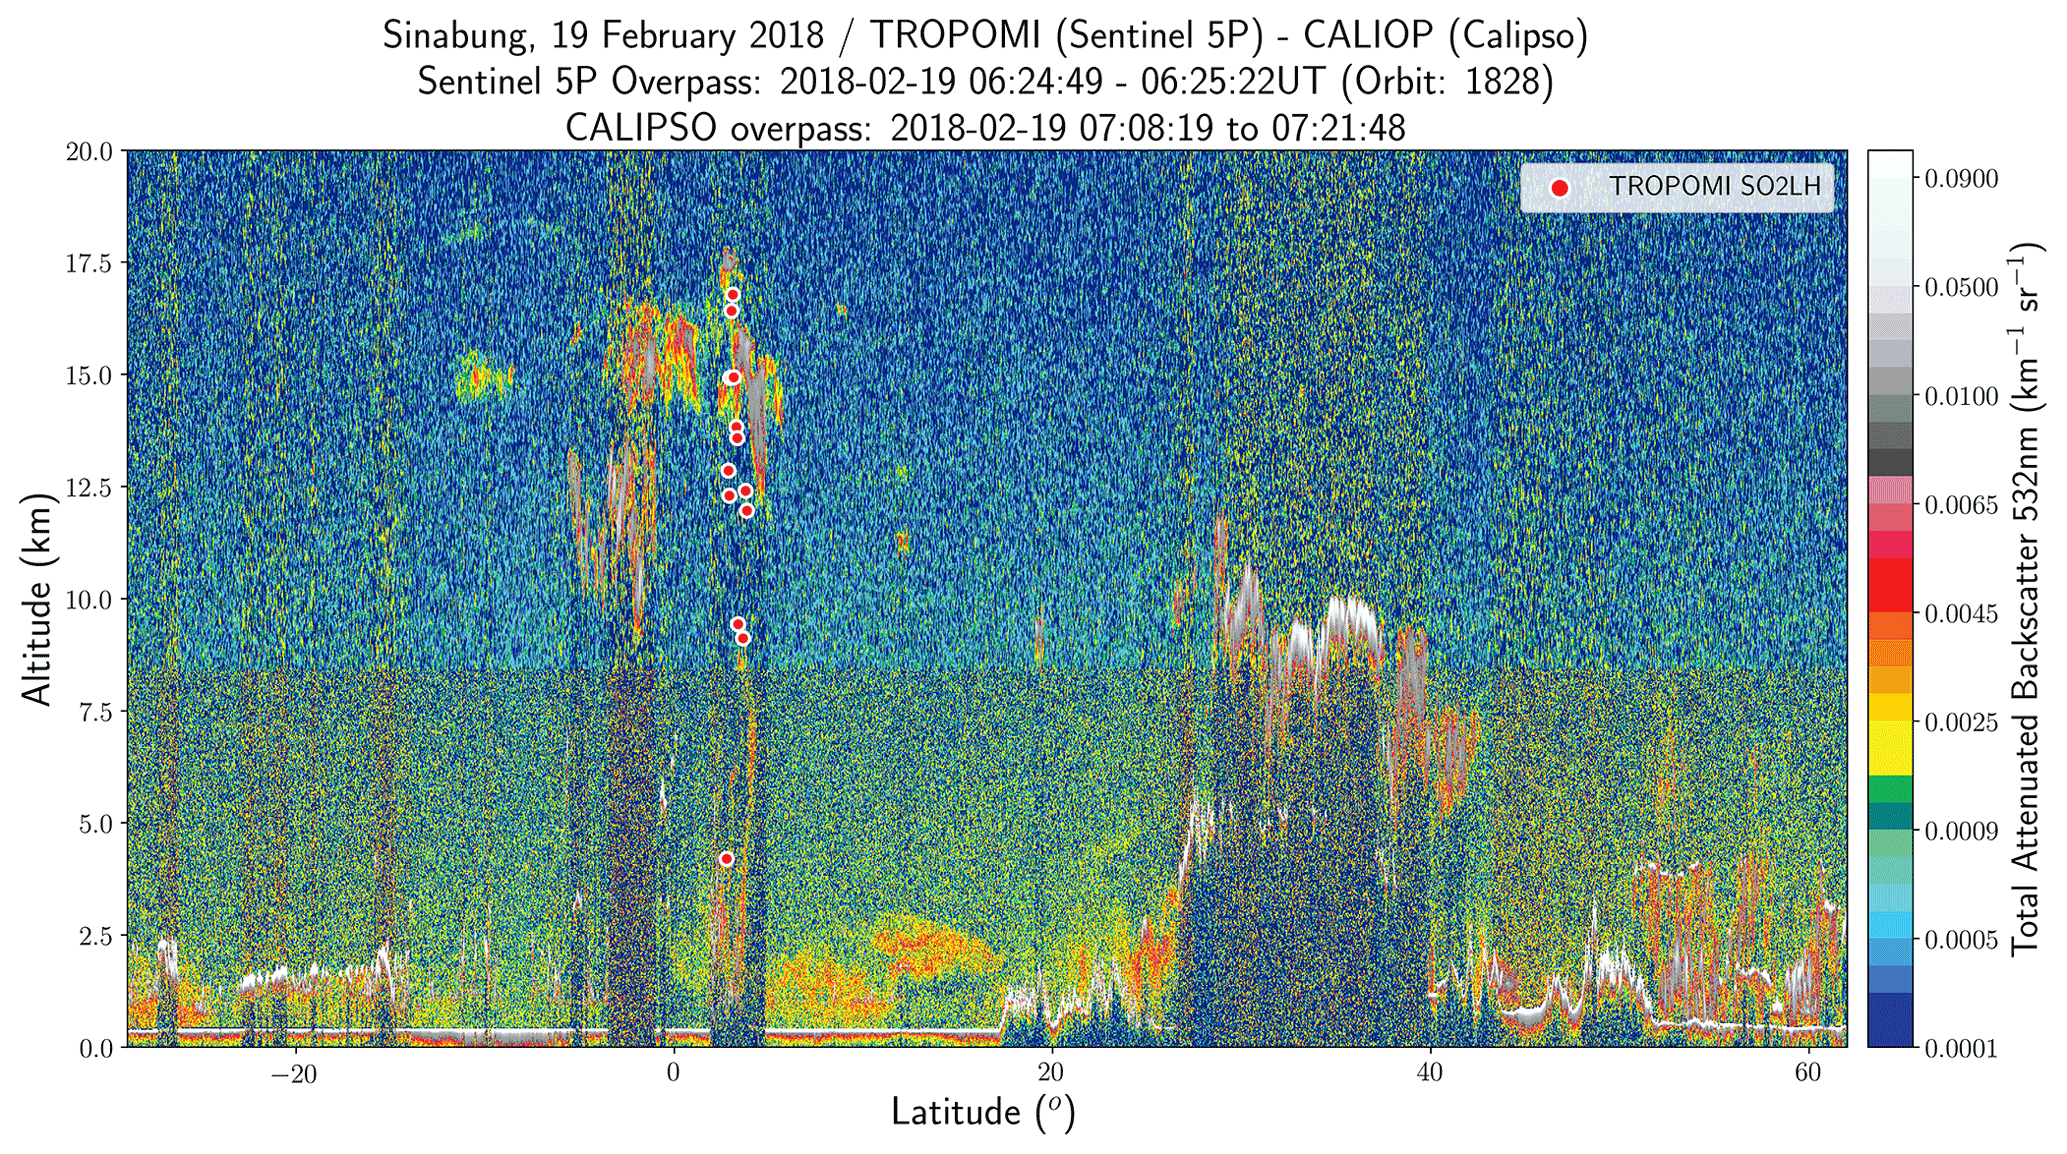
Figure 9Sinabung, 19 February 2018, 07:15 UTC. The colors show the CALIOP/CALIPSO total attenuated backscatter at 532 nm and the white-red dots show the TROPOMI SO2 LH.
This case of mixing between ash and clouds over a volcanic eruption renders the retrieval of the ash plume altitude by the lidar algorithm very difficult, since it cannot separate clouds from aerosols, especially when the aerosol amount is low. The CALIPSO feature mask (not shown here) hardly identifies any of the Sinabung backscatter signals as aerosol. The main plume, at ∼ 15 km is flagged as a cloud feature, while below this feature everything is masked as “totally attenuated”, which is not expected to be the case. Most probably liquid water or ice particles are contaminating the volcanic ash signal, as already discussed in Hedelt et al. (2019). Even though the maximum TROPOMI SO2 LH agrees with the maximum backscatter height between 2–3∘ latitude, a large spread of TROPOMI SO2 LHs is also reported. As discussed also in the work of de Laat et al. (2020), the presence of either a nearly transparent or a bright cloud may result in the TROPOMI algorithm reporting heights far lower than both the ash and the cloud plumes. For the cases of Nishinoshima 2020 and La Soufrière 2021 eruptions, both provided a satisfactory collocation to the CALIOP orbital path without the difficulties found in the case of Sinabung 2018, enabling a meaningful comparison to be made. For Nishinoshima, spatial collocations for 1 August 2020 are shown in Fig. S7 (left), while the scatterplot of height values is shown on the right. The geographical collocations between TROPOMI and CALIOP are not optimal; however, the agreement between SO2 LH and CALIOP weighted extinction altitude is satisfactory, and tends to confirm the presence of volcanic plumes. The CALIPSO observations confirm the presence of volcanic clouds around 5 km, while S5P reports slightly higher loads, at ∼ 7.5 km. For the case of La Soufrière, spatial collocations for 11 April 2021 are shown in Fig. S8 (left), and the scatterplot of collocations is shown Fig. S8 (right). In this case, both CALIPSO and TROPOMI collocated pixels confirm the presence of a volcanic cloud up to and around ∼ 20 km.
4.2.3 Summary of the comparisons with the CALIPSO/CALIOP observations
The combination of CALIOP and TROPOMI data measurements has permitted the identification of volcanic aerosol layers produced by three individual volcanic eruptions. A summary plot of the comparisons between S5P SO2 and CALIPSO ash LHs is presented as a scatter plot in Fig. 10, showing the mean ash and SO2 plume height reported for each of the 9 d of collocations. The comparison is very promising, with a slope close to 0.95, y-intercept of ∼ 1 km and correlation coefficient of 0.86 for the 9 collocation days for the Raikoke, Nishinoshima and La Soufrière eruptions. The majority of cases, 7 d, belong to the Raikoke eruptive period, and the remainder 2 d to Nishinoshima and La Soufrière eruptions. From Table 4 it is worth noting that the standard deviation of the mean heights reported by both instruments are low, typically much less than 1 km. This can most likely be attributed to the tight spatiotemporal collocation criteria that were possible for these comparisons. The behavior of altitude range differences are also corroborated by the works of Muser et al. (2020), De Leeuw et al. (2020) and Osborne et al. (2022). These studies highlight that, for coarse-mode ash, the aging process is the determining factor of the vertical distribution of aerosols and therefore the determining factor for the altitude at which the particles are transported, alongside the meteorological effects.
Table 4Statistics for the comparison between S5P and CALIPSO for the eruptive days studied.
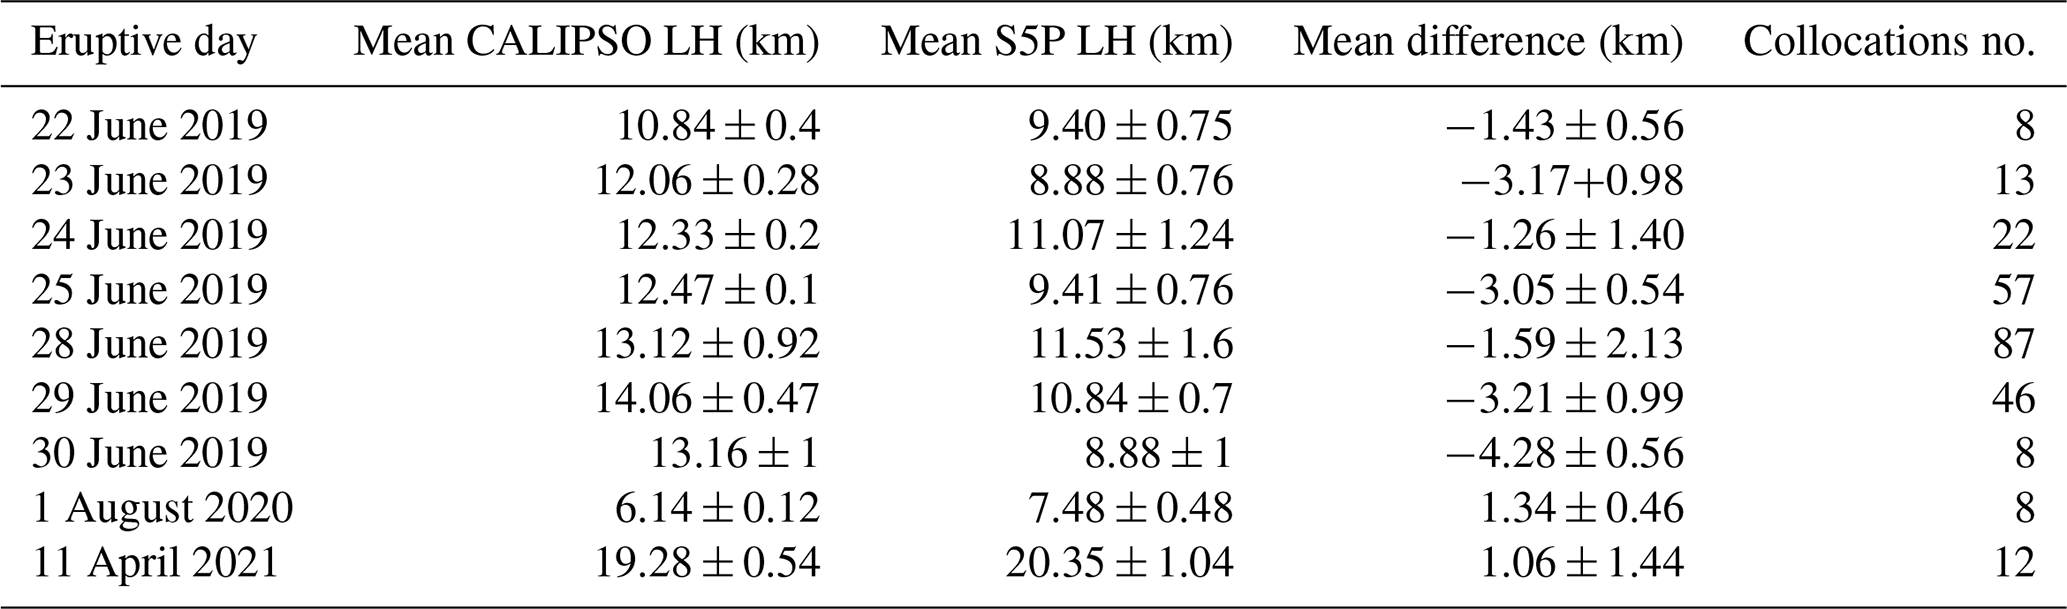

Figure 10Scatter plot of the mean daily average reported SO2 LHs by TROPOMI/S5P and CALIOP/CALIPSO for the 7 d of the Raikoke eruption and one each for Nishinoshima and La Soufrière eruptions studied.
Generally, we note that features identified as volcanic ash by the CALIOP aerosol subtype mask are captured by the TROPOMI algorithm, but the surrounding clouds often affect the retrieval. Formation of high-altitude condensed water or ice in the ash plume may shield part of the underlying SO2 and ash amounts. The comparison of the TROPOMI SO2 LH product within this project shows promising capability in detecting plumes of volcanic origin, with some limitations related to existing or subsequent creation of clouds. Furthermore, although ash and SO2 plumes are often collocated, especially during the first hours after eruption, this is not always the case, making direct comparisons challenging.
4.3 Application of the S5P SO2 LH in NRT data assimilation modeling
CAMS, operated by the European Centre for Medium-Range Weather Forecasts (ECMWF) on behalf of the European Commission, provides daily SO2 analyses and 5 d forecasts of volcanic SO2 in NRT by assimilating total column SO2 retrievals from TROPOMI and GOME-2 (Inness et al., 2022). As the operational NRT TROPOMI and GOME-2 retrievals do not provide any information about the height of the volcanic plumes, the SO2 increments are placed in the mid-troposphere, around 550 hPa (∼ 5 km) in the current operational CAMS configuration.
The procedure used to assimilate NRT TROPOMI/S5P and GOME2/Metop SO2 loads in the operational CAMS NRT data assimilation system was presented, alongside the simultaneous ingestion of the S5P SO2 LH, by Inness et al. (2022). The assimilation was tested for the Raikoke 2019 eruption and was contrasted to the operational CAMS forecasts obtained when assimilating only the TROPOMI SO2 load. In this paper 2 example days are shown to demonstrate how the CAMS assimilation of the S5P SO2 LH product leads to much improved model output against the non-assimilated IASI LHs, compared to the original CAMS analysis.
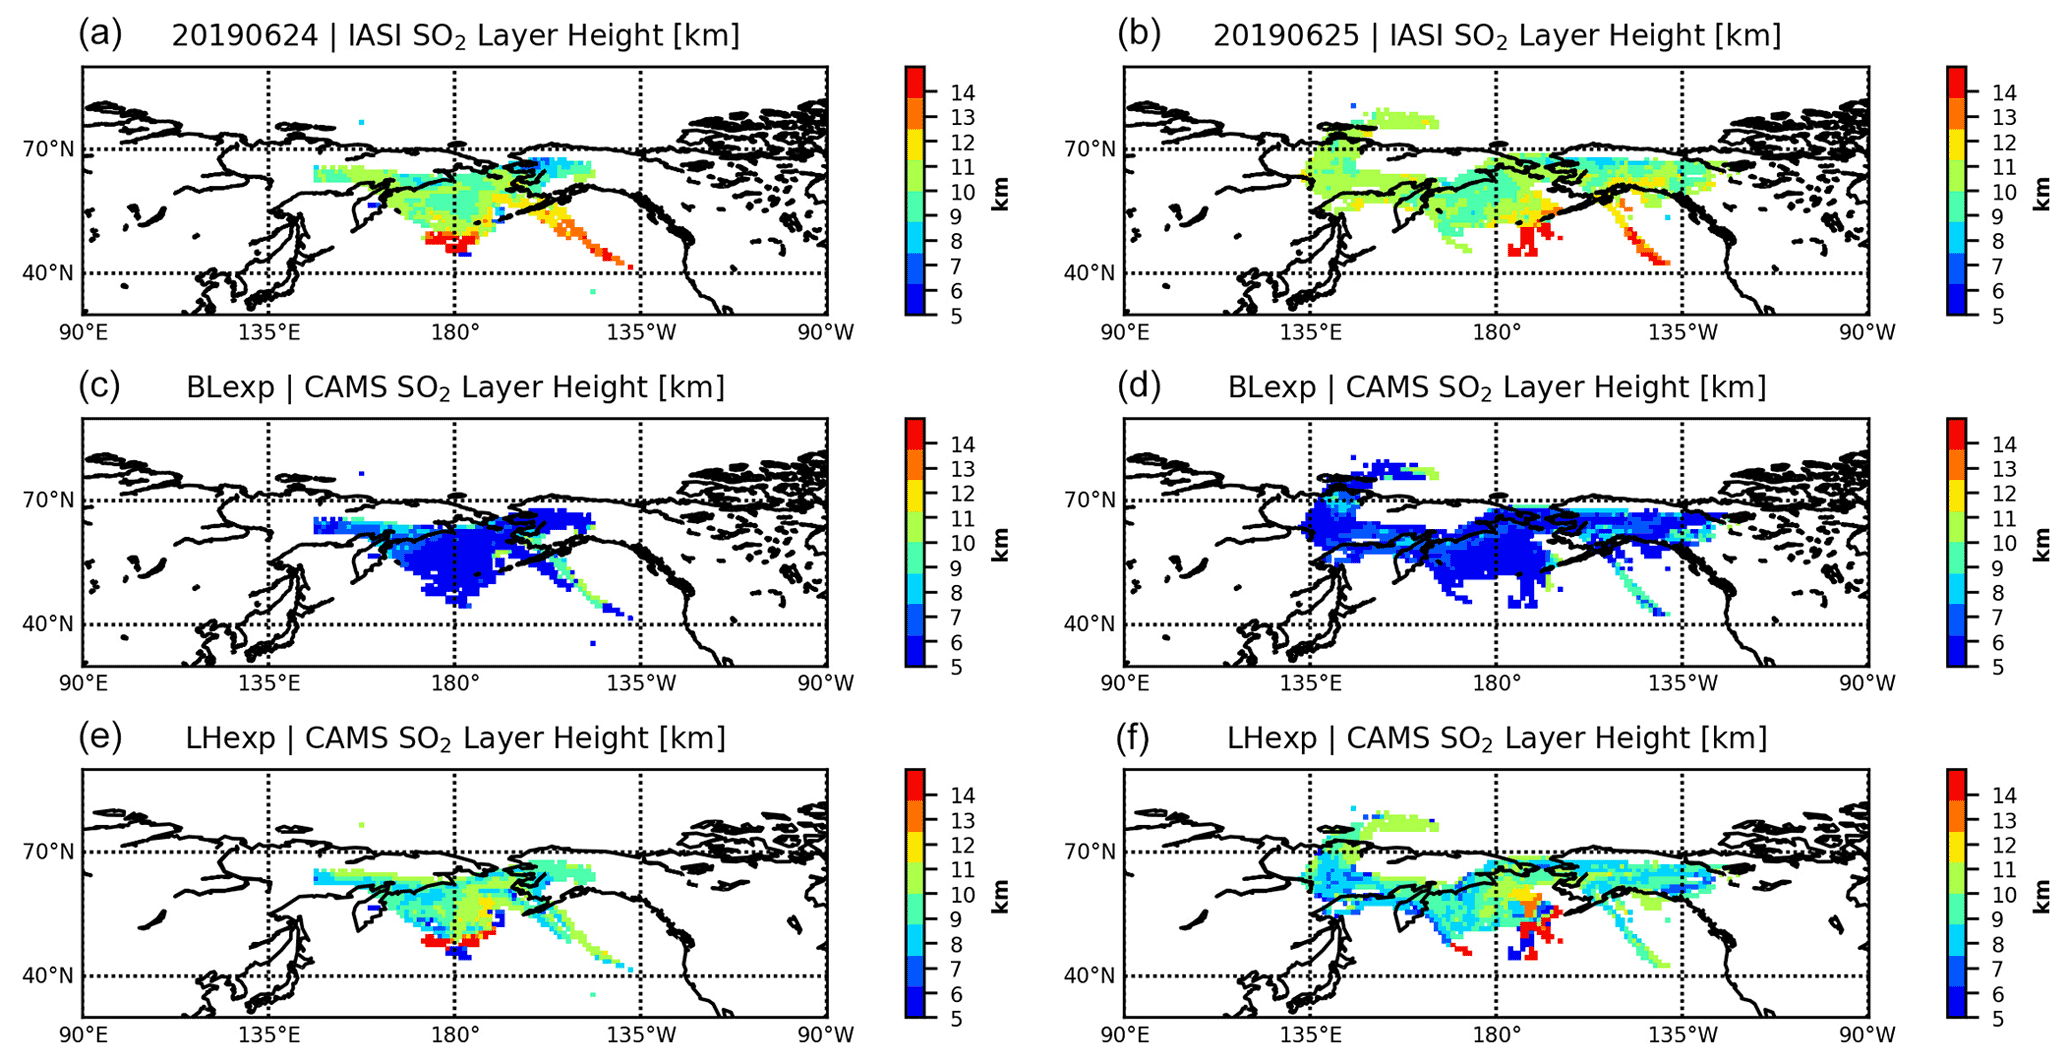
Figure 11Raikoke eruptive days of 24 (a, c, e) and 25 (b, d, f) June 2019. (a, b) The IASI ULB/LATMOS SO2 LH in km. (c, d) The CAMS BLexp SO2 LH (without assimilation). (e, f) The CAMS LHexp SO2 LH (with assimilation).
In Fig. 11, upper row, the IASI ULB/LATMOS SO2 LH, gridded onto the CAMS 1×1∘ spatial resolution and 3h temporal resolution, is shown for 24 (left column) and 25 (right column) June 2019, 5 d after the initial Raikoke eruption. In the middle panel, the operational CAMS SO2 LH (called BLexp) is presented which is deduced from placing the SO2 increment in the mid-troposphere, around 550 hPa, clearly in the wrong altitude for the Raikoke eruption which injected a huge amount of SO2 above the tropopause, well into the stratosphere. In Fig. 11, lower panel, it can be seen that a vast improvement to the CAMS forecast is achieved for both days when the S5P SO2 LH data are used (called LHexp) as the structure of the Raikoke SO2 plume is much improved and compares well with the independent IASI SO2 LHs shown in the upper panel. For the entire eruptive period of Raikoke between 22 and 29 June, the CAMS forecast, which assimilates the S5P SO2 LH data, improves the bias in the forecast height between CAMS and IASI to ∼ −1.5 ± 2.5 km, compared to a mean bias of ∼ −5 ± 2 km for the operational system. We can hence conclude that by assimilating the S5P SO2 LH data, the vertical location of the Raikoke SO2 plume in the CAMS system is improved, leading to better subsequent forecasts and making the S5P SO2 LH product suitable for NRT assimilation and forecasts of a possible strong future volcanic eruption.
The European Space Agency Sentinel-5p+ Innovation TROPOMI/S5P SO2 LH product has been verified against IASI/Metop SO2 LHs for the eruptive periods of the Raikoke volcano, 22 June to 30 July 2019, the Taal volcano, 13 January 2020, the Nishinoshima eruptive period during July and August 2020 and the La Soufrière eruptive days of 10 to 11 April 2021. Two different algorithms that provide plume altitudes from the IASI instruments were examined, the official EUMETSAT ACSAF algorithm, ULB/LATMOS, and the University of Oxford, AOPP, algorithm. Furthermore, collocations against ash LH observations by the space-borne CALIOP/CALIPSO lidar system were identified and assessed.
The main findings in the comparisons of the SO2 volcanic plumes, described in detail above, are:
-
For the Raikoke eruptive days: the difference between S5P and IASI/AOPP SO2 LH datasets is 0.61 ± 3.72 km, with IASI/AOPP SO2 LH reporting a mean height of ∼ 11.40 ± 2.5 km and S5P reporting ∼ 10.75 ± 3.5 km, in excellent agreement. Between S5P and IASI ULB/LATMOS SO2 LHs a similar mean difference of −0.15 ± 2.83 km is found with both sensors reporting on average LHs at ∼ 10.20 ± 2.80 and ∼ 10.00 ± 1.0 km respectively.
-
For the Taal eruptive day: the SO2 LHs reported differ substantially with IASI/AOPP reporting heights at 5.64 ± 1.5 km while S5P reports higher columns, at ∼ 10.14 ± 3.5 km. IASI ULB/LATMOS also reports lower heights, at 9.51 ± 1.78 km while and S5P places the plume at ∼ 12.13 ± 3.95 km with a mean difference of ∼ −2.62 ± 3.0 km.
-
For the Nishinoshima eruptive days: both sensors place the plume at the same altitude, with IASI ULB/LATMOS at ∼ 8.0 ± 1.04 km and S5P ∼ 7.73 ± 1.97 km and mean difference of ∼ 0.27 ± 2.79 km.
-
For the La Soufrière eruptive days: all three sensors report high plume altitudes, between 13 and 16 km. For the collocations between S5P and IASI/AOPP, the mean SO2 LH was found at 13.82 ± 2.49 and 13.47 ± 3.41 km respectively, with a mean difference of −0.35 ± 3.55 km. For the S5P and IASI ULB/LATMOS collocations, the mean SO2 LH was found at 14.94 ± 3.87 and 15.7 ± 1.16 km, respectively, with a mean difference of 0.76 ± 3.69 km.
-
Scatter plot comparisons of the daily mean volcanic SO2 plumes reveal common SO2 LH patterns for the two sensors, with substantial correlations ∼ 0.66 (0.72), slope ∼ 0.9 (0.98), y-intercept of 1.2 km (0.8 km) for the IASI/AOPP and the IASI ULB/LATMOS, respectively. The standard deviation of the mean is relatively high, on average ∼ 3 km; however, the mean heights are well within the 2 km accuracy requirement on the S5P SO2 LH product.
With respect to the comparisons between the S5P SO2 LH and the CALIOP/CALIPSO volcanic ash LH, we report that:
-
241 excellently spatiotemporally collocated points between CALIOP and TROPOMI were identified for 7 Raikoke eruptive days. CALIOP reported a range of mean heights between ∼ 11 and 14 km, while TROPOMI had a far narrower range between ∼ 9 and 11.5 km. Overall, the mean difference in heights was found to be −2.4 ± 1.7 km (−3.0 km median) for the 7 eruptive Raikoke days.
-
The comparisons for the Nishinoshima and La Soufrière eruptions showed good agreement with plumes reported at ∼ 7 km and ∼ 19.5 km, respectively, for the two eruptions, and a height difference between S5P and CALIPSO being within ∼ 1.0 km.
-
The mean daily height plot of the comparisons between S5P SO2 LHs and CALIOP/CALIPSO weighted ALH, as expected, follow a straight line, with slope of 0.95 and y-intercept of ∼ 1.0 km and excellent correlation coefficient at 0.86.
Finally, the CAMS assimilation of the NRT S5P SO2 LH led to much improved model fields against the non-assimilated IASI plume heights for the Raikoke eruptive period, with a mean difference of 1.5 ± 2 km against the independent IASI/Metop observations, and improved the geographical spread of the Raikoke volcanic plume following the main eruptive day.
The NRT S5P SO2 LH products are operationally generated by DLR within the framework of the Innovative Products for Analyses of Atmospheric Composition (INPULS) project, and are available upon request from Pascal Hedelt (pascal.hedelt@dlr.de). The IASI/MetOp ULB/LATMOS open source SO2 LH dataset is publicly available from https://iasi.aeris-data.fr/so2_iasi_a_arch/ (IASI Portal, 2021). The IASI/MetOp AOPP SO2 products are available on request from Isabelle Taylor (isabelle.taylor@physics.ox.ac.uk). The CALIPSO data were obtained from the online archive of the NASA Langley Research Center Atmospheric Science Data Center (ASDC, 2022, https://asdc.larc.nasa.gov/project/CALIPSO). The Copernicus Atmosphere Monitoring Service is operated by the European Centre for Medium-Range Weather Forecasts on behalf of the European Commission as part of the Copernicus program (http://copernicus.eu, last access: 18 April 2022) and CAMS data are freely available from http://atmosphere.copernicus.eu/data (Copernicus Atmosphere Data Store, 2022). The SO2 analysis experiments used in this paper are available from https://apps.ecmwf.int/research-experiments/expver/ (last access: 18 April 2022) with the DOIs: https://doi.org/10.21957/cygt-xf49 (ECMWF, 2022a) (BLexp), https://doi.org/10.21957/qfam-7474 (ECMWF, 2022b) (LHexp).
The supplement related to this article is available online at: https://doi.org/10.5194/acp-22-5665-2022-supplement.
MEK prepared the code to analyze all the different SO2 LH data, carried out all of the relevant validation parts and wrote most of the paper. KM prepared the code to analyze the CALIPSO data, carried out all of the relevant validation parts and wrote the relevant part of the paper. PH and DE provided the S5P/TROPOMI SO2 LH data. IT provided the IASI/Metop AOPP SO2 LH data under the supervision of RG. AI provided the CAMS experiments. LC is the PI of the IASI/Metop ULB/LATMOS SO2 LH data. DB and DL provided scientific support to this work. CR supervised the entire project. All co-authors provided useful feedback on the paper.
The contact author has declared that neither they nor their co-authors have any competing interests.
Publisher's note: Copernicus Publications remains neutral with regard to jurisdictional claims in published maps and institutional affiliations.
This work is performed in the framework of ESA Sentinel-5p+ Innovation: SO2 Layer Height project (S5P+I: SO2LH), https://eo4society.esa.int/projects/sentinel-5p-innovation-so2-layer-height-project/ (last access: 18 April 2022). The comparative results presented in this work have been produced using the Aristotle University of Thessaloniki high performance computing infrastructure and resources. Maria-Elissavet Koukouli would like to acknowledge the support provided by the IT Center of the Aristotle University of Thessaloniki throughout the progress of this research work, as well as the Atmospheric Toolbox®. Isabelle A. Taylor and Roy G. Grainger would like to acknowledge EUMETSAT for providing the IASI spectra and ECMWF (ECMWF, 2012) and CEDA for the meteorological profiles used in the IASI retrievals. Isabelle A. Taylor and Roy G. Grainger further acknowledge support from the NERC Centre for Observation and Modelling of Earthquakes, Volcanoes, and Tectonics (COMET). We thank the DLR Innovative Products for Analyses of Atmospheric Composition (INPULS) project, for continuously providing the S5P SO2 LH products in NRT.
This research has been supported by the European Space Agency (grant no. 4000127508/19/I-NS).
The article processing charges for this open-access publication were covered by the German Aerospace Center (DLR).
This paper was edited by Stelios Kazadzis and reviewed by two anonymous referees.
Ahn, S., Jee, J.-B., Lee, K.-T., and Oh, H.-J.: Enhanced Accuracy of Airborne Volcanic Ash Detection Using the GEOKOMPSAT-2A Satellite, Sensors, 21, 1359 https://doi.org/10.3390/s21041359, 2021.
Astoreca, R., Hurtmans, D., Clarisse, L., Coheur, P., George, M., Hadji-Lazaro, J., and Clerbaux, C.: ACSAF Product User Manual for the Near real-time IASI Brescia SO2 product, SAF/AC/ULB/PUM/002, v1.2, 2018.
Boichu, M., Clarisse, L., Péré, J.-C., Herbin, H., Goloub, P., Thieuleux, F., Ducos, F., Clerbaux, C., and Tanré, D.: Temporal variations of flux and altitude of sulfur dioxide emissions during volcanic eruptions: implications for long-range dispersal of volcanic clouds, Atmos. Chem. Phys., 15, 8381–8400, https://doi.org/10.5194/acp-15-8381-2015, 2015.
Bolić, T. and Sivčev, Ź.: Eruption of Eyjafjallajökull in Iceland: Experience of European Air Traffic Management, Transport. Res. Record, 2214, 136–143, https://doi.org/10.3141/2214-17, 2011.
Brenot, H., Theys, N., Clarisse, L., van Geffen, J., van Gent, J., Van Roozendael, M., van der A, R., Hurtmans, D., Coheur, P.-F., Clerbaux, C., Valks, P., Hedelt, P., Prata, F., Rasson, O., Sievers, K., and Zehner, C.: Support to Aviation Control Service (SACS): an online service for near-real-time satellite monitoring of volcanic plumes, Nat. Hazards Earth Syst. Sci., 14, 1099–1123, https://doi.org/10.5194/nhess-14-1099-2014, 2014.
Brenot, H., Theys, N., Clarisse, L., van Gent, J., Hurtmans, D. R., Vandenbussche, S., Papagiannopoulos, N., Mona, L., Virtanen, T., Uppstu, A., Sofiev, M., Bugliaro, L., Vázquez-Navarro, M., Hedelt, P., Parks, M. M., Barsotti, S., Coltelli, M., Moreland, W., Scollo, S., Salerno, G., Arnold-Arias, D., Hirtl, M., Peltonen, T., Lahtinen, J., Sievers, K., Lipok, F., Rüfenacht, R., Haefele, A., Hervo, M., Wagenaar, S., Som de Cerff, W., de Laat, J., Apituley, A., Stammes, P., Laffineur, Q., Delcloo, A., Lennart, R., Rokitansky, C.-H., Vargas, A., Kerschbaum, M., Resch, C., Zopp, R., Plu, M., Peuch, V.-H., Van Roozendael, M., and Wotawa, G.: EUNADICS-AV early warning system dedicated to supporting aviation in the case of a crisis from natural airborne hazards and radionuclide clouds, Nat. Hazards Earth Syst. Sci., 21, 3367–3405, https://doi.org/10.5194/nhess-21-3367-2021, 2021.
Campbell, J. R., Tackett, J. L., Reid, J. S., Zhang, J., Curtis, C. A., Hyer, E. J., Sessions, W. R., Westphal, D. L., Prospero, J. M., Welton, E. J., Omar, A. H., Vaughan, M. A., and Winker, D. M.: Evaluating nighttime CALIOP 0.532 μm aerosol optical depth and extinction coefficient retrievals, Atmos. Meas. Tech., 5, 2143–2160, https://doi.org/10.5194/amt-5-2143-2012, 2012.
Carboni, E., Grainger, R., Walker, J., Dudhia, A., and Siddans, R.: A new scheme for sulphur dioxide retrieval from IASI measurements: application to the Eyjafjallajökull eruption of April and May 2010, Atmos. Chem. Phys., 12, 11417–11434, https://doi.org/10.5194/acp-12-11417-2012, 2012.
Carboni, E., Grainger, R. G., Mather, T. A., Pyle, D. M., Thomas, G. E., Siddans, R., Smith, A. J. A., Dudhia, A., Koukouli, M. E., and Balis, D.: The vertical distribution of volcanic SO2 plumes measured by IASI, Atmos. Chem. Phys., 16, 4343–4367, https://doi.org/10.5194/acp-16-4343-2016, 2016.
Carn, S. A., Clarisse, L., and Prata, A. J.: Multi-decadal satellite measurements of global volcanic degassing, J. Volcanol. Geoth. Res., 311, 99–134, https://doi.org/10.1016/j.jvolgeores.2016.01.002, 2016.
Clarisse, L., Coheur, P.-F., Theys, N., Hurtmans, D., and Clerbaux, C.: The 2011 Nabro eruption, a SO2 plume height analysis using IASI measurements, Atmos. Chem. Phys., 14, 3095–3111, https://doi.org/10.5194/acp-14-3095-2014, 2014.
Clarisse, L., Hurtmans, D., Clerbaux, C., Hadji-Lazaro, J., Ngadi, Y., and Coheur, P.-F.: Retrieval of sulphur dioxide from the infrared atmospheric sounding interferometer (IASI), Atmos. Meas. Tech., 5, 581–594, https://doi.org/10.5194/amt-5-581-2012, 2012.
Copernicus Atmosphere Data Store: http://atmosphere.copernicus.eu/data, last access: 18 April 2022.
de Laat, A., Vazquez-Navarro, M., Theys, N., and Stammes, P.: Analysis of properties of the 19 February 2018 volcanic eruption of Mount Sinabung in S5P/TROPOMI and Himawari-8 satellite data, Nat. Hazards Earth Syst. Sci., 20, 1203–1217, https://doi.org/10.5194/nhess-20-1203-2020, 2020.
de Leeuw, J., Schmidt, A., Witham, C. S., Theys, N., Taylor, I. A., Grainger, R. G., Pope, R. J., Haywood, J., Osborne, M., and Kristiansen, N. I.: The 2019 Raikoke volcanic eruption – Part 1: Dispersion model simulations and satellite retrievals of volcanic sulfur dioxide, Atmos. Chem. Phys., 21, 10851–10879, https://doi.org/10.5194/acp-21-10851-2021, 2021.
Eckhardt, S., Prata, A. J., Seibert, P., Stebel, K., and Stohl, A.: Estimation of the vertical profile of sulfur dioxide injection into the atmosphere by a volcanic eruption using satellite column measurements and inverse transport modeling, Atmos. Chem. Phys., 8, 3881–3897, https://doi.org/10.5194/acp-8-3881-2008, 2008.
ECMWF: 6-hourly global SO2 data from BLexp Raikoke eruption June 2019, ECMWF [data set], https://doi.org/10.21957/cygt-xf49, last access: 18 April 2022a.
ECMWF: 6-hourly global SO2 data from LHexp Raikoke eruption June 2019, ECMWF [data set], https://doi.org/10.21957/qfam-7474, last access: 18 April 2022b.
Efremenko, D. S., Loyola, D. G. R., Hedelt, P., and Spurr, R. J. D.: Volcanic SO2 plume height retrieval from UV sensors using a full-physics inverse learning machine algorithm, Int. J. Remote Sens., 38, 1–27, https://doi.org/10.1080/01431161.2017.1348644, 2017.
European Centre for Medium-Range Weather Forecasts (ECMWF): ECMWF Operational Regular Gridded Data at 1.125 degrees resolution, NCAS British Atmospheric Data Centre, https://catalogue.ceda.ac.uk/uuid/a67f1b4d9db7b1528b800ed48198bdac (last access: 12 July 2021), 2012.
Fedkin, N. M., Li, C., Krotkov, N. A., Hedelt, P., Loyola, D. G., Dickerson, R. R., and Spurr, R.: Volcanic SO2 effective layer height retrieval for the Ozone Monitoring Instrument (OMI) using a machine-learning approach, Atmos. Meas. Tech., 14, 3673–3691, https://doi.org/10.5194/amt-14-3673-2021, 2021.
Hedelt, P. and Koukouli, M. E.: S5p+I – SO2 Layer Height Algorithm Theoretical Baseline Document (ATBD), Zenodo, https://doi.org/10.5281/zenodo.5118540, 2021.
Hedelt, P., Efremenko, D. S., Loyola, D. G., Spurr, R., and Clarisse, L.: Sulfur dioxide layer height retrieval from Sentinel-5 Precursor/TROPOMI using FP_ILM, Atmos. Meas. Tech., 12, 5503–5517, https://doi.org/10.5194/amt-12-5503-2019, 2019.
Hyman, D. M. and Pavolonis, M. J.: Probabilistic retrieval of volcanic SO2 layer height and partial column density using the Cross-track Infrared Sounder (CrIS), Atmos. Meas. Tech., 13, 5891–5921, https://doi.org/10.5194/amt-13-5891-2020, 2020.
ICAO: International Civil Aviation Organization, Flight Safety and Volcanic Ash, Roadmap for International Airways Volcano Watch (IAVW) in Support of International Air Navigation, 18.11.2019, v 4.0, https://www.icao.int/airnavigation/METP/MOGVA Reference Documents/IAVWRoadmap.pdf (last access: 19 January 2022), 2019.
IASI Portal: IASI/Metop-A SO2 total column Level 2 data, https://iasi.aeris-data.fr/so2_iasi_a_arch/, last access: 20 July 2021.
Inness, A., Ades, M., Balis, D., Efremenko, D., Flemming, J., Hedelt, P., Koukouli, M.-E., Loyola, D., and Ribas, R.: Evaluating the assimilation of S5P/TROPOMI near real-time SO2 columns and layer height data into the CAMS integrated forecasting system (CY47R1), based on a case study of the 2019 Raikoke eruption, Geosci. Model Dev., 15, 971–994, https://doi.org/10.5194/gmd-15-971-2022, 2022.
Jing, F., Chauhan, A., Singh, P. R., and Dash, P.: Changes in Atmospheric, Meteorological, and Ocean Parameters Associated with the 12 January 2020 Taal Volcanic Eruption, Remote Sensing, 12, 1026, https://doi.org/10.3390/rs12061026, 2020.
Kim, M.-H., Omar, A. H., Tackett, J. L., Vaughan, M. A., Winker, D. M., Trepte, C. R., Hu, Y., Liu, Z., Poole, L. R., Pitts, M. C., Kar, J., and Magill, B. E.: The CALIPSO version 4 automated aerosol classification and lidar ratio selection algorithm, Atmos. Meas. Tech., 11, 6107–6135, https://doi.org/10.5194/amt-11-6107-2018, 2018.
Kloss, C., Berthet, G., Sellitto, P., Ploeger, F., Taha, G., Tidiga, M., Eremenko, M., Bossolasco, A., Jégou, F., Renard, J.-B., and Legras, B.: Stratospheric aerosol layer perturbation caused by the 2019 Raikoke and Ulawun eruptions and their radiative forcing, Atmos. Chem. Phys., 21, 535–560, https://doi.org/10.5194/acp-21-535-2021, 2021.
Koffi, B., Schulz, M., Bréon, F.-M., Griesfeller, J., Winker, D., Balkanski, Y., Bauer, S., Berntsen, T., Chin, M., Collins, W. D., Dentener, F., Diehl, T., Easter, R., Ghan, S., Ginoux, P., Gong, S., Horowitz, L. W., Iversen, T., Kirkevåg, A., Koch, D., Krol, M., Myhre, G., Stier, P., and Takemura, T.: Application of the CALIOP layer product to evaluate the vertical distribution of aerosols estimated by global models: AeroCom phase I results, J. Geophys. Res.-Atmos., 117, D10201, https://doi.org/10.1029/2011JD016858, 2012.
Koukouli, M. E., Balis, D., Michailidis, K., and Hedelt, P.: S5p+I – SO2 Layer Height Validation Report (VR), Zenodo, https://doi.org/10.5281/zenodo.5118558, 2021.
Koukouli, M. E., Balis, D., Dimopoulos, S., and Siomos, N.: SACS-2/SMASH – Validation Report on the Eyjafjallajökull and Grimsvötn eruptions (v1.0), Zenodo, https://doi.org/10.5281/zenodo.5566654, 2014.
Liu, D., Wang, Z., Liu, Z., Winker, D., and Trepte, C.: A height resolved global view of dust aerosols from the first year CALIPSO lidar measurements, J. Geophys. Res., 113, D16214, https://doi.org/10.1029/2007JD009776, 2008.
Loyola, D. G., Pedergnana, M., and Gimeno Garcia, S.: Smart sampling and incremental function learning for very large high dimensional data, Neural Networks, 78, 75–87, https://doi.org/10.1016/j.neunet.2015.09.001, 2016.
Loyola, D. G., Xu, J., Heue, K.-P., and Zimmer, W.: Applying FP_ILM to the retrieval of geometry-dependent effective Lambertian equivalent reflectivity (GE_LER) daily maps from UVN satellite measurements, Atmos. Meas. Tech., 13, 985–999, https://doi.org/10.5194/amt-13-985-2020, 2020.
McKee, K., Smith, C. M., Reath, K., Snee, E., Maher, S., Matoza, R. S., Carn, S., Mastin, L., Anderson, K., Damby, D., Roman, D. C., Degterev, A., Rybin, A., Chibisova, M., Assink, J. D., de Negri Leiva, R., amd Perttu, A.: Evaluating the state-of-the-art in remote volcanic eruption characterization Part I: Raikoke volcano, Kuril Islands, J. Volcanol. Geoth. Res., 419, 107354, https://doi.org/10.1016/j.jvolgeores.2021.107354, 2021.
Muser, L. O., Hoshyaripour, G. A., Bruckert, J., Horváth, Á., Malinina, E., Wallis, S., Prata, F. J., Rozanov, A., von Savigny, C., Vogel, H., and Vogel, B.: Particle aging and aerosol–radiation interaction affect volcanic plume dispersion: evidence from the Raikoke 2019 eruption, Atmos. Chem. Phys., 20, 15015–15036, https://doi.org/10.5194/acp-20-15015-2020, 2020.
Nanda, S., de Graaf, M., Veefkind, J. P., Sneep, M., ter Linden, M., Sun, J., and Levelt, P. F.: A first comparison of TROPOMI aerosol layer height (ALH) to CALIOP data, Atmos. Meas. Tech., 13, 3043–3059, https://doi.org/10.5194/amt-13-3043-2020, 2020.
NASA Langley Research Center Atmospheric Science Data Center (ASDC): CALIPSO, https://asdc.larc.nasa.gov/project/CALIPSO, last access: 18 April 2022.
Omar, A., Winker, D., Kittaka, C., Vaughan, M., Liu, Z., Hu, Y. X., Trepte, C., Rogers, R., Ferrare, R., Lee, K., Kuehn, R., and Hostetler, C.: The CALIPSO automated aerosol classification and lidar ratio selection algorithm, J. Atmos. Ocean. Tech., 26, 1994–2014, https://doi.org/10.1175/2009jtecha1231.1, 2009.
Osborne, M. J., de Leeuw, J., Witham, C., Schmidt, A., Beckett, F., Kristiansen, N., Buxmann, J., Saint, C., Welton, E. J., Fochesatto, J., Gomes, A. R., Bundke, U., Petzold, A., Marenco, F., and Haywood, J.: The 2019 Raikoke volcanic eruption – Part 2: Particle-phase dispersion and concurrent wildfire smoke emissions, Atmos. Chem. Phys., 22, 2975–2997, https://doi.org/10.5194/acp-22-2975-2022, 2022.
Pardini, F., Burton, M., Arzilli, F., La Spina, G., and Polacci, M.: SO2 emissions, plume heights and magmatic processes inferred from satellite data: The 2015 Calbuco eruptions, J. Volcanol. Geoth. Res., 361, 12–24, https://doi.org/10.1016/j.jvolgeores.2018.08.001, 2018.
Perttu, A., Taisne, B., De Angelis, S., Assink, J. D., Tailpied, D., and Williams, R. A.: Estimates of plume height from infrasound for regional volcano monitoring, J. Volcanol. Geoth. Res., 402, 106997, https://doi.org/10.1016/j.jvolgeores.2020.106997, 2020.
Prata, A. J.: Satellite detection of hazardous volcanic clouds and the risk to global air traffic, Nat. Hazards, 51, 303–324, https://doi.org/10.1007/s11069-008-9273-z, 2009.
Prata, A. T., Young, S. A., Siems, S. T., and Manton, M. J.: Lidar ratios of stratospheric volcanic ash and sulfate aerosols retrieved from CALIOP measurements, Atmos. Chem. Phys., 17, 8599–8618, https://doi.org/10.5194/acp-17-8599-2017, 2017.
Rajapakshe, C., Zhang, Z., Yorks, J. E., Yu, H., Tan, Q., Meyer, K., Platnick, S., and Winker, D. M.: Seasonally transported aerosol layers over southeast Atlantic are closer to underlying clouds than previously reported, Geophys. Res. Lett., 44, 5818–5825, https://doi.org/10.1002/2017GL073559, 2017.
Reichardt, U., Ulfarsson, G. F., and Petursdottir, G.: Cooperation Between Science and Aviation-Sector Service Providers in Europe for Risk Management of Volcanic Ash, Transport. Res. Record, 2626, 99–105, https://doi.org/10.3141/2626-12, 2017.
Saunders, R. W., Matricardi, M., and Brunel, P.: An improved fast radiative transfer model for assimilation of satellite radiance observations, Q. J. Roy. Meteor. Soc., 125, 1407–1425, https://doi.org/10.1002/qj.1999.49712555615, 1999.
Tournigand, P.-Y., Cigala, V., Prata, A. J., Steiner, A. K., Kirchengast, G., Brenot, H., Clarisse, L., and Biondi, R.: The 2015 Calbuco Volcanic Cloud Detection Using GNSS Radio Occultation and Satellite Lidar, IGARSS 2020–2020 IEEE International Geoscience and Remote Sensing Symposium, 6834–6837, https://doi.org/10.1109/IGARSS39084.2020.9323356, 2020.
Vaughan, M., Powell, K., Kuehn, R., Young, S., Winker, D., Hostetler, C., Hunt, W., Liu, Z., McGill, M., and Getzewich, B.: Fully Automated Detection of Cloud and Aerosol Layers in the CALIPSO Lidar Measurements, J. Atmos. Ocean. Tech., 26, 2034–2050, https://doi.org/10.1175/2009JTECHA1228.1, 2009.
Vaughan, M., Pitts, M., Trepte, C., Winker, D., Detweiler, P., Garnier, A., Getzewich, B., Hunt, W., Lambeth, J., Lee, K.-P., Lucker, P., Murray, T., Rodier, S., Tremas, T., Bazureau, A., and Pelon, J.: Cloud-Aerosol LIDAR Infrared Pathfinder Satellite Observations (CALIPSO) data management system data products catalog, Release 4.92, NASA Langley Research Center Document PC-SCI-503, 225 pp., https://www-calipso.larc.nasa.gov/products/CALIPSO_DPC_Rev4x92.pdf, last access: 14 September 2020.
Walker, J. C., Dudhia, A., and Carboni, E.: An effective method for the detection of trace species demonstrated using the MetOp Infrared Atmospheric Sounding Interferometer, Atmos. Meas. Tech., 4, 1567–1580, https://doi.org/10.5194/amt-4-1567-2011, 2011.
Walker, J. C., Carboni, E., Dudhia, A., and Grainger, R. G.: Improved detection of sulphur dioxide in volcanic plumes using satellite-based hyperspectral infrared measurements: Application to the Eyjafjallajökull 2010 eruption, J. Geophys. Res., 117, D00U16, https://doi.org/10.1029/2011JD016810, 2012.
Winker, D. M., Tackett, J. L., Getzewich, B. J., Liu, Z., Vaughan, M. A., and Rogers, R. R.: The global 3-D distribution of tropospheric aerosols as characterized by CALIOP, Atmos. Chem. Phys., 13, 3345–3361, https://doi.org/10.5194/acp-13-3345-2013, 2013.
Winker, D. M., Liu, Z., Omar, A., Tackett, J., and Fairlie, D.: CALIOP observations of the transport of ash from the Eyjafjallajökull volcano in April 2010, J. Geophys. Res., 117, D00U15, https://doi.org/10.1029/2011JD016499, 2012.
Winker, D., Pelon, J., Coakley, J., Ackerman, S., Charlson, R., Colarco, P., Flamant, P., Fu, Q., Hoff, R., Kittaka, C., Kubar, T., Le Treut, H., McCormick, M., Megie, G., Poole, L., Powell, K., Trepte, C., Vaughan, M., and Wielicki, B.: The CALIPSO Mission: a global 3-D view of aerosols and clouds, B. Am. Meteorol. Soc., 91, 1211–1229, https://doi.org/10.1175/2010BAMS3009.1, 2010.
Xu, J., Schüssler, O., Loyola Rodriguez, D. G., Romahn, F., and Doicu, A.: A novel ozone profile shape retrieval using Full-Physics Inverse Learning Machine (FP_ILM), IEEE J. Sel. Topics Appl. Earth Observ. Remote Sens., 10, 5442–5457, https://doi.org/10.1109/JSTARS.2017.2740168, 2017.
Zehner, C. (Ed.): Monitoring Volcanic Ash from Space, ESA–EUMETSAT workshop on the 14 April to 23 May 2010 eruption at the Eyjafjöll volcano, South Iceland (ESA/ESRIN, 26–27 May 2010) ESA Publication STM-280, https://doi.org/10.5270/atmch-10-01, 2012.