the Creative Commons Attribution 4.0 License.
the Creative Commons Attribution 4.0 License.
 | 20 Apr 2022
Top-down and bottom-up estimates of anthropogenic methyl bromide emissions from eastern China
Haklim Choi
Mi-Kyung Park
Paul J. Fraser
Hyeri Park
Sohyeon Geum
Jens Mühle
Jooil Kim
Ian Porter
Peter K. Salameh
Christina M. Harth
Bronwyn L. Dunse
Paul B. Krummel
Ray F. Weiss
Simon O'Doherty
Dickon Young
Methyl bromide (CH3Br) is a potent ozone-depleting substance (ODS) that has both natural and anthropogenic sources. CH3Br has been used mainly for preplant soil fumigation, post-harvest grain and timber fumigation, and structural fumigation. Most non-quarantine and pre-shipment (non-QPS) uses were phased out by 2005 for non-Article 5 (developed) countries and by 2015 for Article 5 (developing) countries under the Montreal Protocol on Substances that Deplete the Ozone Layer; some uses have continued under critical-use exemptions (CUEs). Under the protocol, individual nations are required to report annual data on CH3Br production and consumption for quarantine–pre-shipment (QPS) uses, non-QPS uses, and CUEs to the United Nations Environment Programme (UNEP). In this study, we analyzed high-precision, in situ measurements of atmospheric mole fractions of CH3Br obtained at the Gosan station on Jeju Island, South Korea, from 2008 to 2019. The background mole fractions of CH3Br in the atmosphere at Gosan declined from 8.5±0.8 ppt (parts per trillion) in 2008 to 7.4±0.6 ppt in 2019 at a rate of ppt yr−1. At Gosan, we also observed periods of persistent mole fractions (pollution events) elevated above the decreasing background in continental air masses from China. Statistical back-trajectory analyses showed that these pollution events are predominantly traced back to CH3Br emissions from eastern China. Using an interspecies correlation (ISC) method with the reference trace species CFC-11 (CCl3F), we estimate anthropogenic CH3Br emissions from eastern China at an average of 4.1±1.3 Gg yr−1 in 2008–2019, approximately 2.9±1.3 Gg yr−1 higher than the bottom-up emission estimates reported to UNEP. Possible non-fumigation CH3Br sources – rapeseed production and biomass burning – were assessed, and it was found that the discrepancy is most likely due to unreported or incorrectly reported QPS and non-QPS fumigation uses. These unreported anthropogenic emissions of CH3Br are confined to eastern China and account for 30 %–40 % of anthropogenic global CH3Br emissions. They are likely due to delays in the introduction of CH3Br alternatives, such as sulfuryl fluoride (SO2F2), heat, and irradiation, and a possible lack of industry awareness of the need for regulation of CH3Br production and use.
- Article
(3940 KB) - Full-text XML
-
Supplement
(1220 KB) - BibTeX
- EndNote


Methyl bromide (CH3Br) is a colorless, odorless, non-flammable chemical that is a powerful ozone-depleting substance (ODS). Since CH3Br has a relatively short lifetime (0.8 years) compared to the other major ODSs (Yvon and Butler, 1996; Hu et al., 2012; Engel et al., 2019), changes in surface emissions tend to be reflected quickly in changes to atmospheric mole fractions. Unlike most other ODSs, CH3Br has both natural and anthropogenic sources. The principal natural emission sources are the ocean (Hu et al., 2012), salt marshes (Montzka et al., 2011), wetlands (Lee-Taylor and Holland, 2000), fungi (Lee-Taylor and Holland, 2000; Lee-Taylor et al., 2001), and plants such as mangroves or shrubs (Rhew et al., 2001; Manley et al., 2007). Anthropogenic emission sources include fumigation (Carpenter et al., 2014), agricultural and biofuel biomass burning (Andreae and Merlet, 2001), and the rapeseed industry (Gan et al., 1998; Mead et al., 2008). CH3Br has been particularly widely used for fumigation to eradicate various pests present in soils or in the storage, import, and export of grains and timbers. CH3Br is removed from the atmosphere by soil and ocean deposition, reactions with hydroxyl (OH), and photolysis mainly occurring in the lower stratosphere. The sources and sinks of CH3Br in the atmosphere are not in balance, with total sinks larger than total sources by about 40 Gg yr−1 (Carpenter et al., 2014). This is most likely due to insufficient understanding of existing sources (Yokouchi et al., 2002; Montzka et al., 2003). Recently, possible new sources have been identified. For example, emissions of CH3Br occur in the bread-baking process (Thornton et al., 2016) and from seaweed meadows (Weinberg et al., 2015), but their contributions were found not to have a significant impact on the global budget. The reasons for the imbalance between CH3Br sources and sinks remain unresolved.
CH3Br was listed in 1992 as an ODS under the Montreal Protocol on Substances that Deplete the Ozone Layer (MP), an international agreement for the protection of the stratospheric ozone layer. The parties to the protocol agreed to a schedule for the total phaseout of CH3Br use, beginning with a freeze on production and consumption in 1995 at the 1991 baseline level followed by step-down reductions in 1999, 2001, and 2003 and total phaseout by 2005 for non-Article 5 (developed) countries and a freeze at 1995–1998 average baseline levels and total phaseout in 2015 for Article 5 (developing) countries. Typically, 91 % of CH3Br consumption for non-quarantine and pre-shipment (non-QPS) uses was for soil fumigation and 9 % for storage products and structures in both non-Article 5 and Article 5 countries (methyl bromide technical options committee; MBTOC, 2018). Presently quarantine and pre-shipment (QPS) uses are exempt from the phaseout; however individual parties to the MP are required to annually report data on the CH3Br production and consumption for QPS uses, non-QPS uses, and critical-use exemptions (CUEs) to the United Nations Environment Programme (UNEP). Except for a small use of CH3Br for CUEs, the consumption of CH3Br for preplant soil fumigation and non-QPS commodities or structures has been mostly reduced, contributing to an overall reduction of nearly 60 000 t in the global consumption of CH3Br from 1998 to 2017 (MBTOC, 2018). The reported amounts of consumption of CH3Br for QPS that are not controlled (exempted from phaseout) under the MP have remained relatively constant over the past 20 years and now account for more than 98 % of the estimated consumption of CH3Br currently reported due to the phaseout of other regulated uses (TEAP, 2020). Despite no formal regulation, most parties to the MP are making efforts to minimize the use of CH3Br for QPS use and replace it with suitable alternatives such as heat treatment, phosphine (PH3), ethyl formate (C2H5OCHO), sulfuryl fluoride (SO2F2), and ethanedinitrile (NCCN). As a consequence of this CH3Br phaseout, the global atmospheric mole fraction of CH3Br decreased from 9.2 ppt (parts per trillion) at the peak in 1996–1998 to 6.6 ppt in 2015, but then it showed a slight positive growth of 0.14 ppt yr−1 (2.1 % yr−1) from 2015 to 2016 (Engel et al., 2019).
Global anthropogenic emissions of CH3Br can be estimated using “bottom-up” methods from consumption and production data across various activities reported to UNEP annually by individual nations using activity-dependent emission factors (e.g., 65 % for reported non-QPS consumption and 84 % for the reported QPS consumption; MBTOC, 2006). Significant uncertainties result from the emission factors and the speciation of CH3Br consumption across various activities (Vaughn et al., 2018). As QPS uses of CH3Br are generally highly emissive, consumption for these activities can be more accurately converted into emissions from the categories of QPS usage (MBTOC, 2018).
“Top-down” estimates of global CH3Br emissions are derived from modeling of measured atmospheric mole fractions and atmospheric transport processes, for example using the Advanced Global Atmospheric Gases Experiment (AGAGE) 12-box model of the atmosphere, assuming an atmospheric lifetime for CH3Br (Cunnold et al., 1994; Prinn et al., 2005; Rigby et al., 2013). Regional characteristics of CH3Br emissions however cannot be obtained with the AGAGE 12-box model or a similar model because they do not have the resolution to account for the synoptic scale of the atmospheric flow. Since the MP control of CH3Br consumption applies at a national level, rather than globally, it is important to estimate the top-down emissions at a regional to national scale (Weiss and Prinn, 2011). China is the largest producer and consumer of agricultural products in the world and therefore has potentially large anthropogenic sources of CH3Br and is an important region for understanding CH3Br emissions in East Asia. Several studies have estimated the regional or national emissions from China based on top-down approaches using atmospheric observations. Blake et al. (2003) estimated the CH3Br emissions of 2.6 Gg yr−1 in China (South China 2.0 Gg yr−1 and North China 0.6 Gg yr−1) from aircraft observations in 2001. An inverse modeling study (Vollmer et al., 2009) using high-frequency ground measurements suggested emissions from China had decreased to 0.24 Gg yr−1 in 2006–2008. However, those results were based on a limited period of observations (e.g., a few months to years) and could not analyze the long-term variations and trends in CH3Br emissions. Since then, there have been no further studies tracking the CH3Br emission trends in East Asia.
In this study, we present the 12-year high-precision, high-frequency record of atmospheric CH3Br mole fractions observed at Gosan station on Jeju Island, South Korea, and analyze the observed variations in atmospheric CH3Br. We estimate annual emissions of CH3Br mainly from anthropogenic sources in eastern China, based on the empirical interspecies correlations between CH3Br and CFC-11 during pollution episodes from eastern China and the well-defined eastern China CFC-11 emissions. This is the first study to present the long-term changes in CH3Br emissions from eastern China, after the phaseout period. In the following sections, in Sect. 2, we first introduce the Gosan station and the in situ, ground-based instrumentation for CH3Br measurements, and long-term seasonal and annual variations in atmospheric CH3Br mole fractions are discussed. Moreover, we suggest potential source regions that show high sensitivities to the enhanced CH3Br mole fractions based on air mass back-trajectory statistics and describe the interspecies correlation method to estimate emissions of CH3Br. In Sects. 3 and 4, the observation-based emission estimates of CH3Br in eastern China are further discussed considering the existing discrepancy between the global bottom-up and top-down emissions of CH3Br.
2.1 Instrumentation and measurement data
The coastal atmospheric observation station Gosan (GSN; 33.3∘ N, 126.2∘ E; 72 m a.s.l.) at the southwestern tip of Jeju Island, South Korea (see Fig. 1), is ideally located to monitor regional background mole fractions of atmospheric trace gases due to minimal influence of local anthropogenic pollution sources and the strong pollution outflows from China, Korea, and Japan in East Asia (Kim et al., 2012; Li et al., 2011, 2014; Park et al., 2018).
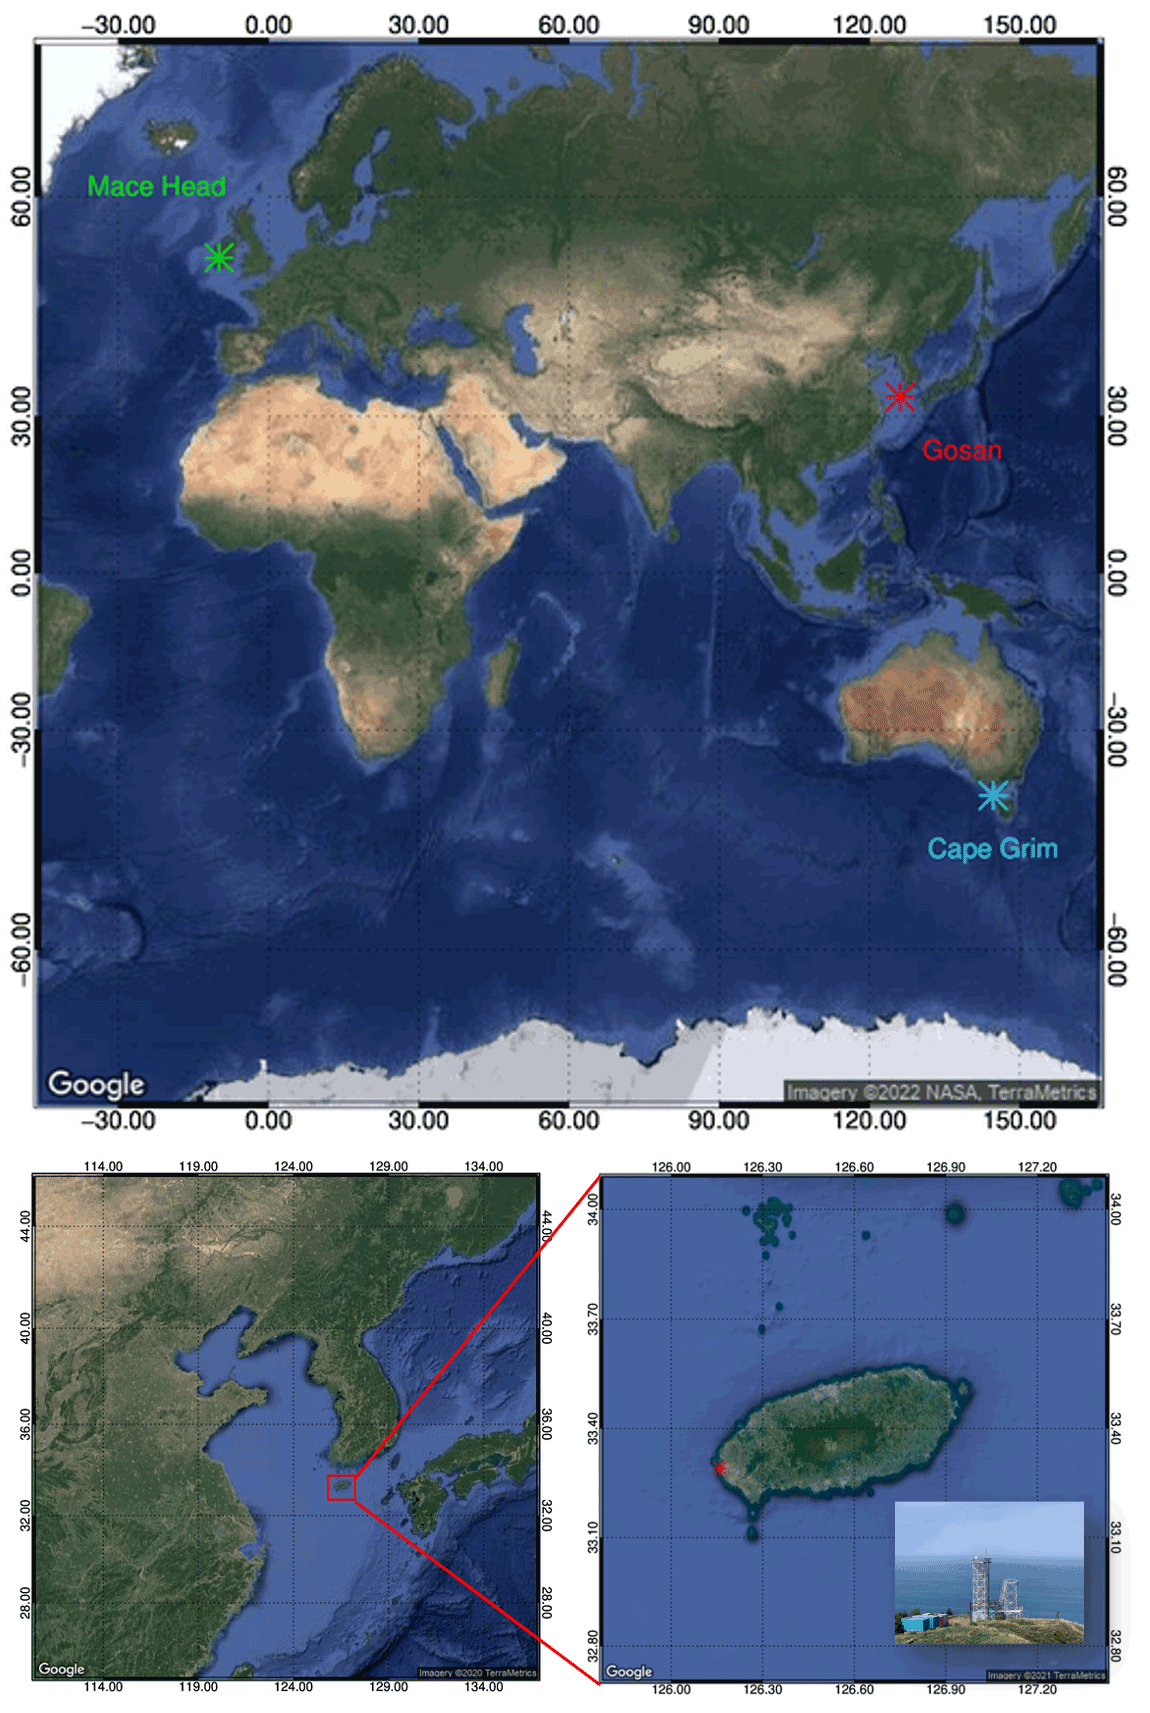
Figure 1Gosan station (33.3∘ N, 126.9∘ E; 72 m a.s.l.) on Jeju Island, South Korea (red asterisk). Air samples are taken at 17 m (∼100 m a.s.l.) from a tower next to the coastal cliff. The geographic locations of Ireland's Mace Head (53.3∘ N, 9.9∘ W) and Australia's Cape Grim (40.7∘ S, 144.7∘ E), representing the remote background monitoring stations in the Northern Hemisphere and Southern Hemisphere, are indicated by green and blue asterisks, respectively. (Map data: © Google Earth.)
The in situ measurement system at Gosan, a “Medusa” gas chromatography mass spectrometer (GC-MS) equipped with a cryogenic pre-concentration system (Miller et al., 2008; Prinn et al., 2018), monitors more than 40 halogenated compounds including CFC-11 and CH3Br. As a part of AGAGE (Prinn et al., 2018), Gosan station has been conducting continuous high-precision and high-frequency observations approximately every 2 h (12 times per day) from 2008 to the present. The precision values (1σ) of all species, determined from repeated analysis (n=12) of an ambient standard, are better than 1 % (e.g., the precision of CH3Br is < 0.1 %). The atmospheric abundances of most of the Medusa compounds are calibrated on scales maintained by the Scripps Institution of Oceanography (SIO) (e.g., SIO-05 scale for CH3Br in this study).
Long-term, high-frequency CH3Br data observed during 2008–2019 at Gosan and background mole fraction data from Mace Head, Ireland (53.3∘ N, 9.9∘ W), and Cape Grim, Australia (40.7∘ S, 144.7∘ E), are shown in Fig. 2. Mace Head and Cape Grim, the primary sites of AGAGE, have been measuring various well-established trace gases including halogen compounds in the atmosphere for a long time and are historically representative remote background monitoring stations for the Northern Hemisphere and Southern Hemisphere, respectively (Prinn et al., 2018). Therefore, they are suitable sites for evaluating the measurement performance and seasonal variation in CH3Br at Gosan.
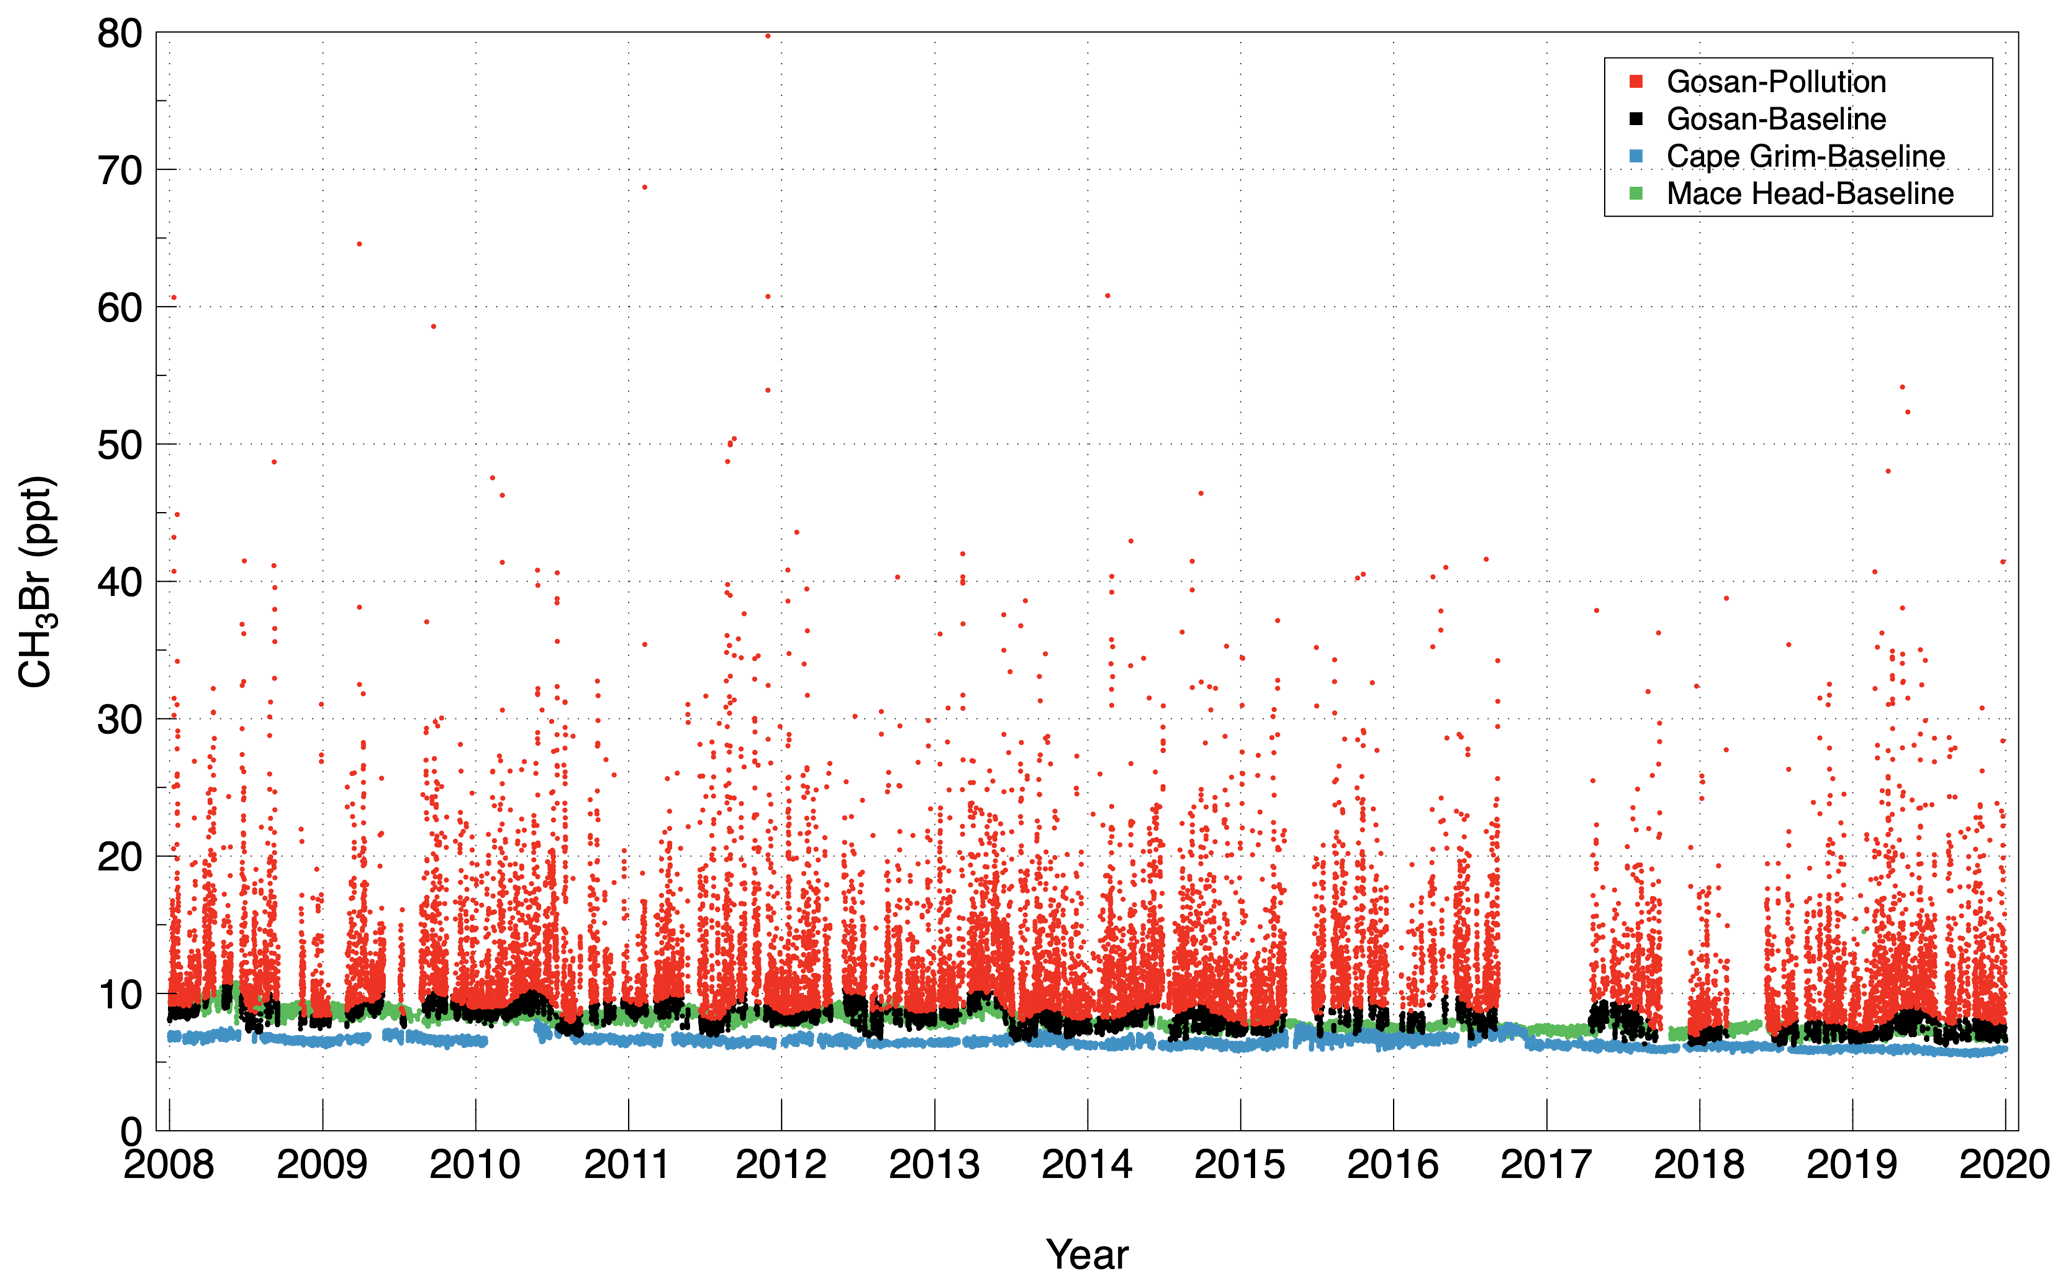
Figure 2Mole fractions of CH3Br in the atmosphere at Gosan for the period 2008–2019. The baseline data (black) are selected using a statistical method (O'Doherty et al., 2001); the polluted data (red) are elevated above the baseline data. The baseline data from Mace Head, Ireland (green), and Cape Grim, Australia (blue), over the same period are shown as mid-latitude references for the Northern Hemisphere and Southern Hemisphere, respectively.
Regional background mole fractions of CH3Br were determined by removing pollution events after applying a polynomial fit to the lower 99.7 % (within 3σ) of the Gaussian distribution derived from the 121 d observations for 60 d before and after each observed data point (O'Doherty et al., 2001). The baseline mole fractions at Gosan and Mace Head (Northern Hemisphere) are higher than those of Cape Grim (Southern Hemisphere), while the annual cycles at Gosan and Mace Head are similar.
The annual average CH3Br baseline mole fraction at Gosan decreased steadily from 8.5±0.8 ppt in 2008 to 7.4±0.6 ppt in 2019 (Table 1), declining at a rate of ppt yr−1 (−1.5 % yr−1). This rate of decline for CH3Br is consistent with the global trend of atmospheric CH3Br determined from AGAGE in situ and NOAA (National Oceanic and Atmospheric Administration) flask data in 2011–2012 that were reported in Carpenter et al. (2014), which has been attributed to the influence of the CH3Br restrictions on non-QPS use imposed by the Montreal Protocol.
Table 1Annual means, standard deviations, and the number of data of each CH3Br baseline and actual polluted signals at Gosan from 2008 to 2019 that are represented in Fig. 2.

The monthly mean CH3Br baseline mole fractions for 2008–2019 are shown in Fig. 3. The seasonal variations show a steady increase in spring, reaching a maximum in May, then dropping in June–July, and followed by a constant level for the last 5 months of the year. The various sources and sinks of CH3Br likely show seasonal variability, and the summertime minima in CH3Br can be largely explained by the atmospheric mole fractions of OH reaching a maximum during the boreal summer (Cox, 2002; Simmonds et al., 2004) and long-range transport of southern hemispheric air parcels that cross over the tropical regions (Li et al., 2018).
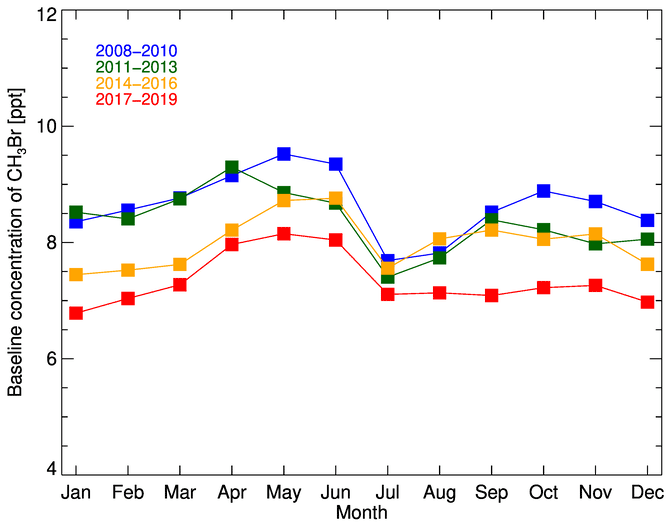
Figure 3Monthly mean CH3Br baseline mole fractions at Gosan for 2008–2019. Each color represents the average of the 3-year interval for the period. Note that there are data missing for several months in 2016, 2017, and 2018, mainly due to typhoon damage to Gosan station and repair of Medusa.
Despite the continuous decrease in background mole fractions, we observed clear pollution signals (shown in red in Fig. 2) through the entire study period, representing persistent inflow to Gosan of air masses influenced by regional CH3Br emission sources and thus containing elevated mole fractions of CH3Br. The annual means of the enhancement mole fraction (pollution − baseline; hereafter, enhancement) are consistently in a range of 3.6 to 4.6 ppt as given in Fig. 4. Note that there are data-missing periods for several months due to the impact of Typhoon Chaba on Gosan (5 October 2016–14 April 2017), failure and repair of the base-plate temperature controller (29 September–8 December 2017), and replacements of mass spectrometer filaments (5 March–9 June 2018).
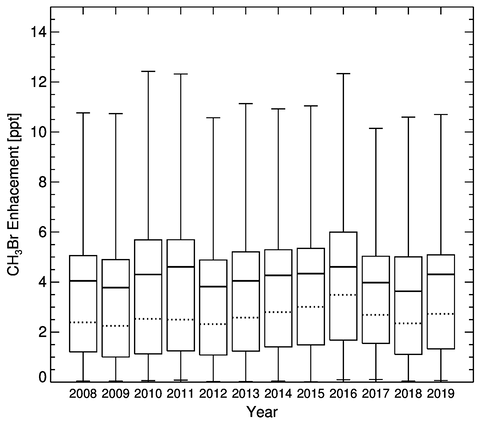
Figure 4Box–whisker plot of annual enhancements of CH3Br at Gosan for 2008–2019. The box encloses the interquartile range (IQR) defined as the 25th–75th percentiles, and whiskers represent maximum (top) and minimum (bottom) enhancements. The solid and dotted lines in the boxes represent the mean and median value of the data, respectively.
2.2 Statistical method to identify the potential CH3Br source regions
The regional distribution of potential CH3Br sources in East Asia was derived by applying statistical analysis of back trajectories corresponding to the observed CH3Br enhancements at Gosan from 2008 to 2019. Air mass back trajectories were generated using the HYSPLIT (Stein et al., 2015) model from the NOAA Air Resources Laboratory with meteorological data output from the Global Data Assimilation System ( horizontal resolution, 23 vertical layers, ftp://arlftp.arlhq.noaa.gov/pub/archives/gdas1, last access: 11 March 2022). The HYSPLIT 6 d air mass backward trajectories were initialized 500 m above the Gosan observation station, at a height where topographical influences can be minimized (Li et al., 2014). To minimize the error that arises from a small number of outlier trajectories, only grids with more than 12 over-passing trajectories were used to define a potential source region (Reimann et al., 2004; method described in Supplement).
Figure 5 shows the distribution of potential CH3Br source regions in East Asia for 2008–2019, widely distributed over eastern China and southern Korea. In particular, high-potential source regions for CH3Br emissions are seen along the Yangtze River that connects Shanghai, Nanjing, Hefei, and Wuhan. The port of Shanghai has been one of the busiest container ports in the world since 2010, with high volumes of port traffic and a large population (Robert et al., 2020). For example, Shanghai handled 43.3 million 20 ft equivalent units (TEUs) in 2019 (https://safety4sea.com/port-of-shanghai-worlds-busiest-container-port-for-2019/, last access: 11 March 2021). In several cases, high CH3Br mole fractions were observed in narrow-width air mass back trajectories that showed long residence times over the port of Shanghai (see Fig. S1 in the Supplement; additionally simulated by the FLEXible PARTicle dispersion model (FLEXPART) to confirm the dispersion effect instead of single trajectories of HYSPLIT), which would be consistent with Shanghai being a likely major port for QPS usage of CH3Br.

Figure 5Potential source regions for CH3Br emissions derived by back-trajectory analyses of enhanced CH3Br mole fractions measured at Gosan station from 2008 to 2019. The location of Gosan station is represented as a black triangle.
The high-potential source regions include not only modern industrial urban areas but also the vast alluvial plains along the Yangtze River and its main tributaries. Note that this statistical analysis has little sensitivity to emissions from southwestern–western China and tends to overestimate source strengths near the modeling boundary due to the limits of the 5–6 d backward trajectory domain of the HYSPLIT model. Therefore, those parts of China have been excluded from further discussion (Park et al., 2018). Also note that this statistical trajectory analysis tends to underestimate emissions at sub-grid-scale hotspots because the measured concentration is distributed evenly over the grid cell (Stohl, 1996). Also, the dilution effects on distant source emissions are not considered in this statistical approach (Vollmer et al., 2006). Therefore, the emissions from nearby sources might be overestimated due to the higher CH3Br concentration. For this reason, the emission potential of South Korea, shown in Fig. 5, may be lower. We do not attempt to identify more exact locations of CH3Br emission sources based on this approach because of its potential uncertainties; nevertheless it is clear that significant emissions of CH3Br originate predominantly from eastern China and South Korea.
2.3 Interspecies correlation method to estimate emissions of CH3Br
In the previous section, it was noted that most of the air masses exhibiting enhanced CH3Br mole fractions flow into Gosan from China and Korea. We classify the air mass origins into 17 regions (see Fig. S2a for the regional domains) based on the 6 d kinematic back trajectories of the HYSPLIT model. If a trajectory arriving at Gosan had entered the boundary layer (as defined by HYSPLIT) only within the regional domains for eastern China-1 (region 15), eastern China-2 (region 16), and Shandong provinces (region 17), it was defined as an air mass originating from eastern China. The air mass classification applied to the CH3Br time series is illustrated in Fig. S2b. The proportions of CH3Br pollution events from 2008 to 2019 classified into China, North Korea and South Korea, and other regions were 37 %, 44 %, and 19 %, respectively. Among them, 98 % of air masses classified as China correspond to eastern China (∼35 % of the total).
2.3.1 Interspecies correlation method
To estimate emissions of CH3Br from eastern China, we applied an interspecies correlation (ISC) method (Palmer et al., 2003; Dunse et al., 2005; Yokouchi et al., 2006; Millet et al., 2009; Li et al., 2011; Shao et al., 2011; Wang et al., 2014; Park et al., 2018). Described as a “ratio method”, this approach can derive the emissions of a trace gas of interest from the correlation of its enhancement above the baseline with that of a reference compound. This empirical ratio approach can estimate regional emissions of various substances in a simple and robust manner compared to inverse methods that require complex computational processes in combination with chemical transport models. For a reference tracer in the ISC method, the following conditions are required: (i) a long lifetime and thus low chemical reactivity during transport from source to observation site, (ii) well-quantified emission sources, and (iii) approximate co-location of the source regions for the reference and target species resulting in significant correlations with the target species. Several previous studies have used carbon monoxide (CO) as a reference species for ISC (Palmer et al., 2003; Dunse et al., 2005; Guo et al., 2009; Wang et al., 2014). CO can be observed readily at the target species observation sites and has often documented emissions from anthropogenic sources, usually as a component of regional air quality emission inventories. One of the issues of using CO as a reference species in ISC is that the emission inventories usually document anthropogenic CO sources only, whereas the observations see CO emissions from anthropogenic and natural sources, biomass burning for example. Therefore, in the CO observational data record, CO pollution episodes have to be identified as predominantly anthropogenic before inclusion in the ISC emission calculations, which complicates matters.
Instead, we selected CFC-11 as the reference compound because CFC-11 has a long lifetime (50–60 years) with low chemical reactivity, it has been measured simultaneously with CH3Br at Gosan showing strong correlations (Li et al., 2011), and the CFC-11 emissions from eastern China for 2008–2019 have been very well quantified by four different inverse models (Rigby et al., 2019; Park et al., 2021).
Atmospheric observations of CH3Br, CFC-11, benzene, toluene, and ethane (Fig. 6) show significant correlations between CH3Br and CFC-11, for example on 19 and 21 May 2010. The volatile organic compounds (VOCs), like benzene, toluene, and ethane, are emitted from biomass burning, showing a noteworthy simultaneous increment and suggesting that biomass burning in eastern China could be a potential CH3Br source. This point is discussed in detail in the next section.
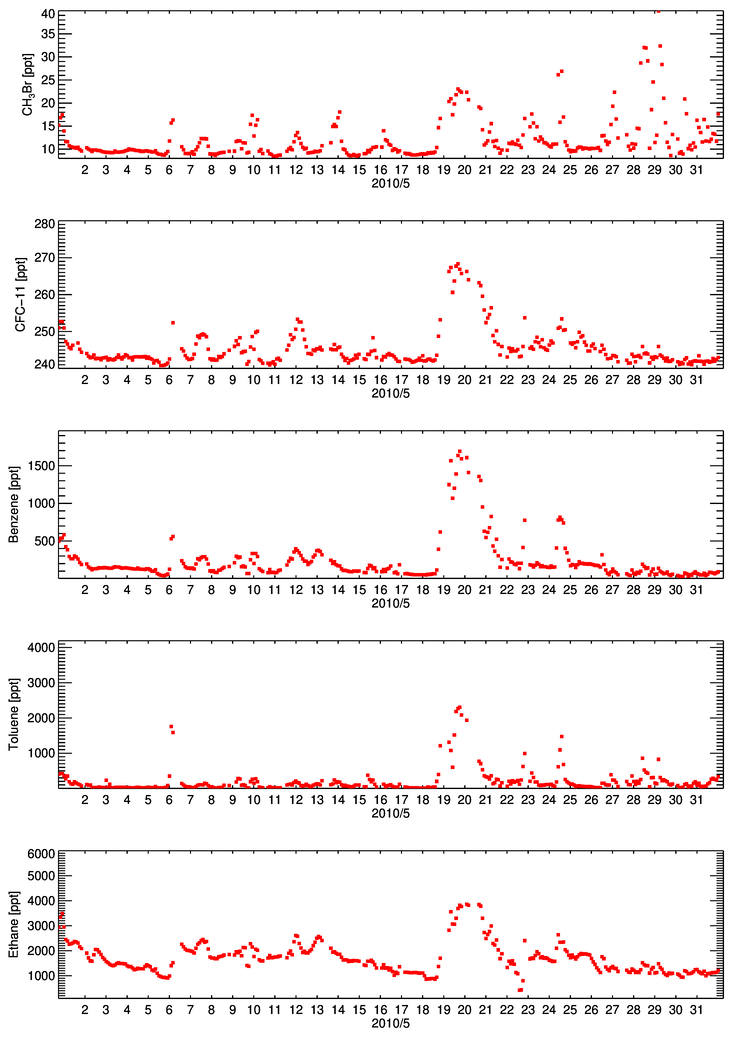
Figure 6Observed mole fractions of CH3Br, CFC-11, benzene, toluene, and ethane at Gosan during May 2010; note the highly correlated pollution events between CH3Br and CFC-11 and also the mole fractions of VOCs (benzene, toluene, and ethane), which are likely related to the biomass burning and general anthropogenic combustion processes increasing simultaneously.
The emissions of CFC-11 are from anthropogenic sources only – there are no natural sources of CFC-11. Although the emission sources of CFC-11 and CH3Br are not necessarily co-located on an emission activity basis, we can still apply the ISC method to estimate the magnitude of country-/regional-scale emissions of CH3Br when they occur within the same country/region where CFC-11 is emitted. When the likely CFC-11 and CH3Br sources are not co-located on a fine scale but are co-located on a regional scale, then it is important to make the CFC-11 and CH3Br observations sufficiently distant (hundreds of kilometers) from the source region so that the initial individual plumes of CFC-11 and CH3Br emissions from separate sources become well mixed.
In this study, the emissions of CH3Br in eastern China are derived using the following equation:
where EMB and ECFC-11 are the emissions of CH3Br and CFC-11, respectively; α is a slope of the linear regression between enhancements of CH3Br and CFC-11 (ΔCH3Br and ΔCFC-11); and MMB and MCFC-11 are the molecular weights of CH3Br and CFC-11, respectively. The intercept term of the linear regression can be ignored because it is generally not significantly different than zero, confirmed by the similar slope terms from linear and linear through-the-origin regressions (Dunse et al., 2005).
The uncertainty in CH3Br emissions is associated with uncertainties in α and ECFC-11 and determined by an error propagation method as follows:
where σMB is the uncertainty in estimated CH3Br emissions and and σα are the uncertainties in ECFC-11 and α, respectively.
2.3.2 Emissions of reference tracer
We use known emission estimates of CFC-11 from eastern China, which were derived by inverse modeling of Gosan CFC-11 observation data (Rigby et al., 2019; Park et al., 2021). Atmospheric mole fractions for CFC-11 observed over the same period as CH3Br are shown in Fig. S3. CFC-11 emissions were estimated from four different Bayesian inverse methods based on two different Lagrangian atmospheric chemical transport models: the UK Met Office Numerical Atmospheric-dispersion Modelling Environment (NAME; Jones et al., 2007) and FLEXPART (Stohl et al., 2005; Pisso et al., 2019). The details for the modeling frameworks are described in Rigby et al. (2019) and Park et al. (2021). For ECFC-11 and σCFC-11 in Eqs. (1) and (2), the emissions of CFC-11 and their uncertainties are derived from the four inversion models used (Park et al., 2021). The average value of estimated emissions of CFC-11 for eastern China ranged from 5.7 to 20.4 Gg yr−1 over the period 2008–2019 (Park et al., 2021).
2.3.3 Linear regression
Several studies have used ordinary least squares (OLS) as a linear regression method due to its simplicity. With OLS, the errors in both independent variables are not considered. However, if both variables have uncertainties like the observation data used in this study, both errors must be considered when performing a linear regression between the two variables. Some other linear regression methods considering the XY errors have been suggested to overcome the limitation of OLS. Dunse et al. (2005) used the FITEXY method (Press et al., 2007), Wang et al. (2014) used the orthogonal distance regression (ODR; Wallace et al., 2012), and Park et al. (2018) used the Williamson–York regression (WYR; Cantrell, 2008) to estimate the emissions of the trace gases by the ISC method. A recent study (Wu and Yu, 2018) suggested that the weighted Deming regression (WDR; hereafter, DR) method estimates a more accurate slope and intercept by minimizing the residual errors for both X and Y among the various linear regression methods, particularly for atmospheric data with measurement error. As mentioned earlier, the calculated slopes can be different depending on which linear regression fit is used. Therefore, we applied not only the DR approach but also the FITEXY and WYR methods to determine annual slopes between the observed enhancements of CH3Br and CFC-11 during 2008 to 2019. The results for the FITEXY and WYR methods are similar. Even though the co-matched observation points were slightly scattered in the range of large enhancements, DR generated best fits representing the overall correlations trends. Millet et al. (2009) required a Pearson correlation coefficient (r) over 0.3. In order to distinguish the contamination due to natural sources of CH3Br and consider the origin of anthropogenic sources, we used only the data in which CH3Br and CFC-11 enhancement occurred at the same time for linear regression. Figure 7 shows the resulting annual slopes. For most of the observations, CH3Br enhancements show a correlation with those for CFC-11 with r larger than 0.4 (e.g., typically, r=0.48 in 2011). They do not maintain a high correlation (r>0.4) for every single year since most of the enhancements of CH3Br and CFC-11 were less than 5 ppt and high-pollution events occurred only occasionally within a year. Note that r in 2019 was very low (r<0.1) because of a tendency for the data in 2019 to bifurcate due to the occurrence of some high-concentration cases from different source regions to the source regions for the majority of the low enhancement concentrations. For 2019, we adopted the slope of and uncertainty in the regression line in 2010, which were used to estimate the emissions of CH3Br for 2019 by using the ISC method. Nevertheless, CFC-11 seems suitable as a reference compound to trace anthropogenic emissions from eastern China. Further, in general, if outliers are included in the analysis within the regression process, r may not be robust and the regression slope may be heavily biased by the outliers (Devlin et al., 1975). Therefore, we applied robust WDR, which can cover the overall scatter trend well, and it demonstrated that there was no significant difference between the regression results using all observation data and the outliers removed (see Fig. S4). In addition, the WDR slopes are well consistent with the annual medians of the individual ratios between ΔCH3Br and ΔCFC-11 data (see Table S1 in the Supplement), which are known to be less sensitive to outliers compared to the means (Miller et al., 2012), implying that the resulting slopes are robust to outlier data points and represent well the individual ratios between CH3Br and CFC-11 enhancements as well.

Figure 7The annual correlation between the enhancement of CH3Br and CFC-11 above the baseline measured at Gosan from 2008 to 2019. The linear trend line was derived by the weighted Deming regression method.
Figure 8 shows the annual CH3Br emission estimates derived for eastern China by the ISC method from atmospheric measurements at Gosan from 2008 to 2019. The bar plots represent annual CH3Br emissions with 1σ uncertainties, which were determined based on CFC-11 emissions derived from four different inversion frameworks. The results derived from different inversion methods agree to within the stated uncertainties for most years. Note that the emission estimate in 2013 calculated from the NAME-HB CFC-11 inversion was 2.6 Gg yr−1, while those from other inversions were larger than 5 Gg yr−1. Despite the uncertainty ranges for the CFC-11 inversion results and for the least-squares fits in the ISC method, the resulting CH3Br emissions from eastern China have remained relatively constant in a range of 2.4±1.3 to 7.1±1.3 Gg yr−1 (on average 4.1±1.3 Gg yr−1) for the period 2008–2019. This represents 40 %–50 % of the summed global emissions of CH3Br for QPS (on average 8.0 Gg yr−1) and non-QPS (on average 2.2 Gg yr−1) fumigation usage in 2008–2019 (see Table S2; Carpenter et al., 2014; TEAP, 2020).
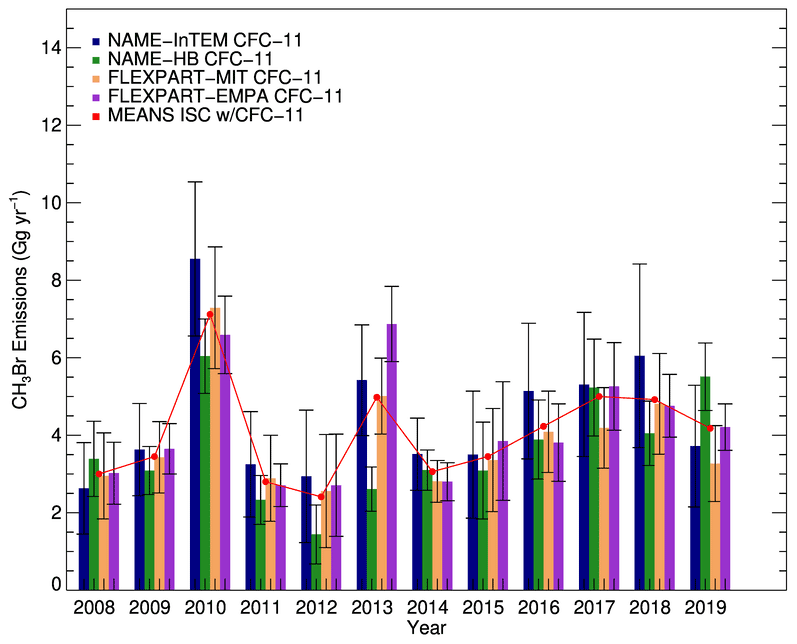
Figure 8CH3Br emission estimates derived for eastern China by ISC from the observation data of CH3Br and CFC-11 at Gosan during 2008–2019. CFC-11 emissions were taken from Park et al. (2021) and are estimated using four independent inverse model frameworks (NAME-HB, NAME-InTEM, FLEXPART-MIT, and FLEXPART-Empa). The bar plot of each color denotes the emissions of CH3Br with 1σ uncertainty derived from each inversion of CFC-11, and the average of the four different inversions is shown in red.
The emissions of CH3Br peaked in 2010 at 7.1±1.3 Gg yr−1 and then decreased to 2.4±1.3 ppt in 2012, followed by a slight increasing trend in later years. The abrupt increase in CH3Br emissions in 2010 is difficult to explain in terms of the consumption and production data reported to the Ozone Secretariat for both controlled uses and QPS uses of CH3Br. The consumption in 2010 and 2012 was less than 1.5 Gg yr−1, and possible emissions were between 1.0–1.4 Gg yr−1. The cause or causes of the relatively large emissions in 2010 and 2013 are unknown. The years of 2010 and 2013 were unusual in that much more wildfire occurred modulated by the El Niño–Southern Oscillation (ENSO) in China compared to other years. Southwestern China showed an ENSO-related maximum in fire occurrences in 2010 and southeastern China in 2013 (Fang et al., 2021). These rare wildfires can impact on that. The increase in CH3Br emissions for 2014–2018 possibly reflects the impact of increased QPS CH3Br use in traded commodities as reported to UNEP (MBTOC, 2018).
Figure 9 shows the comparison between bottom-up emissions of CH3Br for China reported to UNEP and top-down emissions of CH3Br derived by ISC for eastern China using CFC-11 as the reference emissions. The detailed values of each category are described in Table 2. The bottom-up emissions of CH3Br used in fumigation are determined by applying an emission factor of 65 % to the reported non-QPS consumption and 84 % to the reported QPS consumption (MBTOC, 2006).

Figure 9Top-down emissions of CH3Br for eastern China estimated by ISC using CFC-11 as the reference tracer (Fig. 7). The bottom-up emissions of CH3Br for China are based on the reported consumption data to UNEP for quarantine–pre-shipment (QPS), non-QPS, and critical-use exemption (CUE) categories. The solid black line and gray-shaded region denote the mean and standard deviation of estimated CH3Br emissions from four independent inversion frameworks.
Table 2Bottom-up and top-down emissions of CH3Br from 2008 to 2019 as presented in Fig. 9. The bottom-up emissions are the sum of QPS, non-QPS, and CUE emissions that are converted by emission factors (65 % for non-QPS and for the QPS) from consumption as reported to UNEP for all of China (data available at the Ozone Secretariat website, http://ozone.unep.org, last access: 15 April 2022). The top-down emissions were derived for eastern China by the ISC method with CFC-11 as the reference tracer.
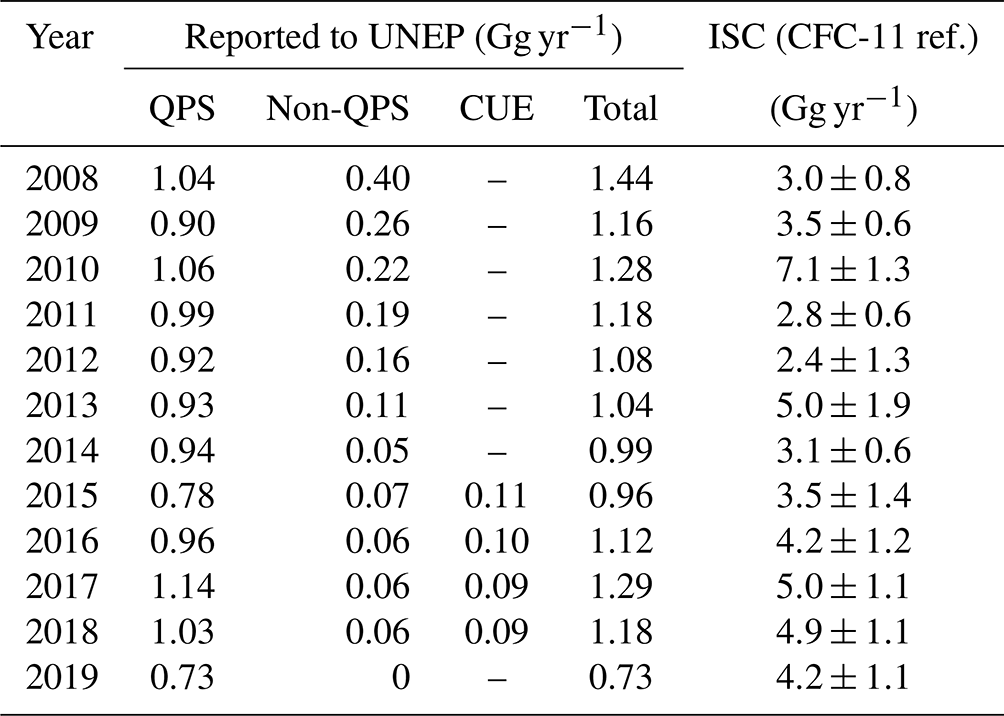
QPS: quarantine–pre-shipment; CUE: critical-use exemptions; UNEP: United Nations Environment Programme.
As mentioned earlier, the increase in bottom-up emissions of CH3Br over the period 2014–2018 is consistent with an increase in consumption for QPS fumigation. However, in 2019, the reported non-QPS and QPS consumptions were reduced to zero and 0.87 Gg yr−1, respectively. The average of the bottom-up emissions of CH3Br from China is 1.1±0.2 Gg yr−1 in the period of 2008–2019.
Overall, the variations in both bottom-up and top-down emissions exhibit qualitative agreement, with peak emissions in 2010, a decrease in 2011 and 2012, a slight increase until 2017 and 2018 (except for the large top-down emissions in 2010 and 2013 discussed above), and then a decrease again in 2019. However, there is an obvious, significant discrepancy between the absolute values of both data sets. Considering the bottom-up emissions were based on reported data for all of China and the top-down emissions were derived for eastern China, the actual difference in derived emissions of CH3Br is likely to be larger. Assuming that the emissions from eastern China represent all Chinese emissions, the mean difference between the bottom-up and top-down estimates over the entire period 2008–2019 is 2.9±1.3 Gg yr−1. The largest difference was in 2010 (5.8 Gg yr−1), with top-down emissions (7.1 Gg) nearly a factor of 6 times greater than the bottom-up emissions (1.2 Gg). The causes of these large discrepancies in estimated emissions of CH3Br are not obvious.
We have examined some possibilities.
- i.
Rapeseed industry. In the life cycle of rapeseed, CH3Br is largely emitted during the flowering period in the 2 months after sowing (Jiao et al., 2020). Rapeseed in the Northern Hemisphere generally blooms in the warm weather from March to May. So seasonal emissions from the arable land of rapeseed may be related to the observed springtime increase in CH3Br polluted mole fractions at Gosan (see Fig. S5).
China is the third-largest producer of rapeseed in the world after the European Union and Canada, accounting for 12 % of the total rapeseed production in 2015–2016, and the arable land lies mainly along the Yangtze River, which is suitable for growing rapeseed (Khir et al., 2017). Previous studies have reported that the global emissions of CH3Br by the rapeseed industry range from 2.8±0.7 Gg yr−1 (Jiao et al., 2020) to 5 Gg yr−1 (Gan et al., 1998; Mead et al., 2008). Considering the proportion of eastern China in the global rapeseed industry, the emissions of CH3Br by rapeseed in eastern China could be about 0.3–0.6 Gg yr−1.
- ii.
Biomass burning of agricultural residues. Owing to the almost total phaseout of CH3Br for non-QPS uses to date, the largest contributor to global anthropogenic emissions of CH3Br is biomass burning, such as agricultural open-field burning and use of biofuels (about 23 Gg yr−1; Carpenter et al., 2014). As shown in Fig. 6, the elevated mole fractions of VOCs (toluene, benzene, ethane), which are associated with biomass burning, are correlated with elevated mole fractions of CH3Br, suggesting that there may be some contribution of biomass burning to the observed CH3Br enhancements. Note the sources of VOC pollution are generally not entirely due to biomass burning, as VOCs are emitted by combustion processes in general (e.g., fossil fuel use and combustion).
Approximately 140 Tg of agricultural residues is burned in fields across all of China every year (Zhao et al., 2017). Biomass burning in eastern China is predominantly due to the burning of agricultural crop residues (∼60 Tg yr−1), mainly wheat residues (in May–June) and rice and corn residues (in September–October) (Zhang et al., 2020). This eastern China biomass burning seasonality may contribute slightly partly due to the seasonality in elevated levels of CH3Br seen at Gosan (May–June and September–October; see Fig. S5).
The global annual emissions of CH3Br from the burning of agricultural waste are uncertain. Recently, Andreae (2019) revised the emission factor (EF) of CH3Br by agricultural residues based on a field experiment to 1.1 g t−1 of dry matter burned, and based on this, the global biomass burning emissions of CH3Br by agricultural residue estimates were 0.3 Gg yr−1. Using this EF, the emissions of CH3Br from biomass burning of agricultural residues in eastern China would be approximately 0.07 Gg yr−1.
- iii.
Post-harvest treatment. Historically, CH3Br consumption resulted from soil fumigation (non-QPS), structural fumigation (non-QPS), and post-harvest fumigation (mainly QPS). Currently, the phaseout of CH3Br has been successfully implemented under the Montreal Protocol for non-QPS applications, in particular the decrease in consumption of CH3Br for soil fumigation. Chemicals (e.g., chloropicrin, metam sodium, dazomet) and non-chemical methods (steam, soilless culture, resistant varieties) have been successfully introduced as alternatives to CH3Br use as soil fumigants (Mao et al., 2016; MBTOC, 2018). For QPS applications, phosphine has been widely used as a substitute for CH3Br in post-treatment of commodities, but it is known that some pests have developed resistance to phosphine (Jagadeesan and Nayak, 2017; Xinyi et al., 2017). SO2F2 is used in China as an alternative to non-QPS use of CH3Br for the preplant soil fumigation as well as the QPS disinfestation of some durable products and post-harvest commodities (Cao et al., 2014; Gressent et al., 2021). Interestingly, the spatial distribution of the potential emission source regions estimated from the SO2F2 pollution observed at Gosan is very similar to that for CH3Br (Fig. S6). In addition, the mole fractions of SO2F2 and CH3Br increase contemporaneously, and the correlations between the enhancements of both substances and CFC-11 are significant (Figs. S7 and S8). This implies temporal and spatial co-emissions of SO2F2 with anthropogenic CH3Br into the atmosphere. Gressent et al. (2021) showed that SO2F2 emissions in China were predominantly generated by post-harvest treatment rather than structural fumigation among its main uses and were distributed within a large portion in eastern China. It seems that CH3Br and SO2F2 use sources were spatially co-located; thus they are not completely replaced and co-emitted with their jumbled usage. Using these Gressent et al. (2021) SO2F2 emissions, the CH3Br emissions from eastern China for post-harvest treatment derived by the ISC method from the observations of SO2F2 and CH3Br at Gosan were 0.9±0.2 Gg yr−1 for the period 2014–2019 (Table S3). Thus, the post-harvest use of CH3Br in eastern China results in approximately 1 Gg yr−1 of anthropogenic CH3Br emissions.
- iv.
Unreported or inaccurately reported emissions from fumigation usage. The CH3Br emissions proposed above in (i)–(iii) can account for about half of the discrepancy (2.9 Gg yr−1) between top-down and bottom-up estimates for eastern China. The sources of the remaining discrepancies (∼1.4 Gg yr−1) in CH3Br emissions remain unknown.
Errors in the reported inventory for regulated uses cannot be ruled out because it is unsure whether the limits on new QPS use have been adhered to (MBTOC, 2018). Besides, despite the successful reduction in anthropogenic CH3Br emissions globally, the possibility of unidentified sources of emissions has been raised in multi-year MBTOC assessment reports (Porter and Fraser, 2020). As a similar example, we note that, although CFC-11 was a very important target chemical for phaseout under the Montreal Protocol, unexpected CFC-11 emission increases were found due to unreported production and use in eastern China during 2013–2018 (Rigby et al., 2019; Park et al., 2021). In addition, it may be premature to conclude that CH3Br non-QPS use in China has been completely replaced by the alternatives discussed above. Since CH3Br represents the least cost-effective fumigation method, the transition to the use of alternatives may be delayed without strong regulations and/or financial incentives and/or social awareness. The fact that CH3Br emissions derived from atmospheric observations in this study are significantly larger than reported emissions suggests that unreported fumigation use of CH3Br may have occurred during the transition to alternative fumigation methods or that other sources, such as emissions from industrial wastes, have been overlooked.
Atmospheric CH3Br has both natural and anthropogenic sources and plays a significant role in stratospheric ozone destruction. For this reason, CH3Br non-QPS uses as a soil, commodity treatment, and structural fumigant are being phased out globally under the Montreal Protocol on Substances that Deplete the Ozone Layer, and its QPS use as a commodity fumigant is regulated.
To understand the temporal trend in atmospheric CH3Br abundances and its emission sources in East Asia, we analyzed the mole fractions of CH3Br observed at Gosan (Jeju Island, South Korea) for 12 years from 2008 to 2019. The baseline mole fractions indicating the regional state of the background atmosphere decreased by ppt yr−1 (−1.5 % yr−1) during the period, with seasonal variations increasing in spring and decreasing in summer. Despite the decreasing trend of the CH3Br baseline, relatively constant-strength pollution events occurred in every year.
A statistical backward trajectory analysis showed that emissions of CH3Br in the region were highest from eastern China compared to other surrounding countries. Top-down emission estimates of CH3Br from eastern China were determined by using an ISC method with CFC-11 as the reference tracer defining anthropogenic CH3Br emissions. The ISC-based CH3Br emission rates were 4.1±1.3 Gg yr−1 on average during 2008–2019 and, despite the CH3Br phaseout for non-QPS applications in Article 5 countries, which includes China, in 2015, significant CH3Br emissions have continued. These CH3Br emissions determined from atmospheric observations are significantly different from the bottom-up emission estimates predicted from consumption data reported to UNEP (1.1±0.2 Gg yr−1). The possible contributions of the rapeseed industry and biomass burning to this discrepancy were assessed to be approximately 0.3–0.6 and 0.07 Gg yr−1, respectively. However, this is insufficient to explain the approximate 3 Gg yr−1 difference between top-down (4.1 Gg yr−1) and bottom-up (1.1 Gg yr−1) estimates.
The remaining discrepancy (3.5 Gg yr−1) that ruled out the non-fumigation sources (rapeseed industry and biomass burning of agricultural residues) from total top-down CH3Br emissions is most likely due to fumigation use that was not reported and/or was inaccurately reported or emissions from unknown sources, such as industrial waste or other sources. Correlations between CH3Br and SO2F2 pollution levels at Gosan suggest that the post-harvest use of CH3Br in eastern China contributes 0.9±0.2 Gg yr−1 to this 3.5 Gg yr−1 discrepancy. These data may suggest that the transition from CH3Br to SO2F2 or other alternatives for post-harvest fumigation in eastern China is only partially complete. Unreported use for fumigation may be related to the delay in introducing alternative technologies into CH3Br fumigation in eastern China and/or the lack of social awareness of the regulation, during the transitional period to alternative technologies.
Most of our estimated emissions of CH3Br are from eastern China, and these CH3Br emissions, likely from unreported or inaccurately reported fumigation usage, are significant enough to account for 30–40% of global emissions for fumigation usage. Further analysis of CH3Br emissions from all of China would enhance understanding of these potentially unreported/underestimated emissions. Our method has limitations in considering all sources of CH3Br and thus has inherent uncertainties. Nevertheless, it is important to investigate the accuracy of bottom-up emission inventories for anthropogenic sources of CH3Br using comparisons with observation-derived top-down emission estimates as presented here.
The total tropospheric bromine (in units of ppt) from long-lived brominated substances (CH3Br and halons) controlled by the MP has been decreasing since reaching a peak in 1998, mainly due to the decline in CH3Br. However, the contributions of halons to declining tropospheric bromine have become predominant since 2012 (Carpenter et al., 2014). In recent years, CH3Br has accounted for a significant proportion of the total amount of bromine in the troposphere from long-lived compounds. Consequently, if any potentially unreported non-QPS and QPS emissions from fumigation usage could be reduced and eventually stopped in developing countries, a further reduction in atmospheric CH3Br mole fractions would occur very quickly due to the short half-life of CH3Br. For this reason, continued monitoring of atmospheric CH3Br mole fractions in East Asia and improvements in inverse modeling approaches are presently seen as a key priority in order to locate and identify specific emission sources.
Data used in this study are available from the AGAGE (Advanced Global Atmospheric Gases Experiment) database (http://agage.eas.gatech.edu/data_archive/agage/gc-ms-medusa/; Agage, 2022).
The supplement related to this article is available online at: https://doi.org/10.5194/acp-22-5157-2022-supplement.
HC, SP, and PJF designed the study. HC, SP, PJF, IP, JM, and JK interpreted the analyzed results and wrote the manuscript. HC, SP, MP, HP, and SG carried out the measurement of CH3Br and CFC-11 at Gosan. JM, PKS, CMH, and RFW supported the calibration and long-term precision for the observations at Gosan. SOD and DY provided the in situ measurement data from Mace Head. PJF, BLD, and PBK provided the in situ measurement data from Cape Grim.
The contact author has declared that neither they nor their co-authors have any competing interests.
Publisher's note: Copernicus Publications remains neutral with regard to jurisdictional claims in published maps and institutional affiliations.
This research was supported by the National Research Foundation of Korea (NRF) grant funded by the Korean government (MSIT). Support for contributions by Jooil Kim, Jens Mühle, Christina M. Harth, Peter K. Salameh, and Ray F. Weiss came from National Aeronautics and Space Administration. Support for contributions by Paul J. Fraser, Bronwyn L Dunse, and Paul B. Krummel came from National Aeronautics and Space Administration, the Australian Bureau of Meteorology, CSIRO, and the Australian Department of Agriculture, Water and the Environment (DAWE). Support for contributions by Ian Porter was provided by La Trobe University.
This research has been supported by the National Research Foundation of Korea (grant no. 2020R1A2C3003774), National Aeronautics and Space Administration (grant nos. NNX16AC96G, NNX16AC97G, and NNX16AC98G), the Australian Bureau of Meteorology, CSIRO, the Australian Department of Agriculture, Water and the Environment, and La Trobe University.
This paper was edited by Jerome Brioude and reviewed by Isaac Vimont and one anonymous referee.
Agage: Index of/data_archive/agage/gc-ms-medusa, Agage [data set], https://agage2.eas.gatech.edu/data_archive/agage/gc-ms-medusa/, last access: 15 April 2022.
Andreae, M. O.: Emission of trace gases and aerosols from biomass burning – an updated assessment, Atmos. Chem. Phys., 19, 8523–8546, https://doi.org/10.5194/acp-19-8523-2019, 2019.
Andreae, M. O. and Merlet, P.: Emission of trace gases and aerosols from biomass burning, Global Biogeochem. Cy., 15, 955–966, https://doi.org/10.1029/2000GB001382, 2001.
Blake, N. J., Blake, D. R., Simpson, I. J., Meinardi, S., Swanson, A. L., Lopez, J. P., Katzenstein, A. S., Barletta, B., Shirai, T., Atlas, E., Sachse, G., Avery, M., Vay, S., Fuelberg, H. E., Kiley, C. M., Kita, K., and Rowland, F. S.: NMHCs and halocarbons in Asian continental outflow during the Transport and Chemical Evolution over the Pacific (TRACE-P) field campaign: Comparison with PEM-West B, J. Geophys. Res., 108, 8806, https://doi.org/10.1029/2002jd003367, 2003.
Cantrell, C. A.: Technical Note: Review of methods for linear least-squares fitting of data and application to atmospheric chemistry problems, Atmos. Chem. Phys., 8, 5477–5487, https://doi.org/10.5194/acp-8-5477-2008, 2008.
Cao, A., Guo, M., Yan, D., Mao, L., Wang, Q., Li, Y., Duan, X., and Wang, P.: Evaluation of sulfuryl fluoride as a soil fumigant in China, Pest Manage. Sci., 70, 219–227, https://doi.org/10.1002/ps.3535, 2014.
Carpenter, L. J., Reimann, S., Burkholder, J. B., Clerbaux, C., Hall, B. D., Hossaini, R., Laube, J. C., Yvon-Lewis, S. A., Blake, D. R., Dorf, M., Dutton, G. S., Fraser, P. J., Froidevaux, L., Hendrick, F., Hu, J., Jones, A., Krummel, P. B., Kuijpers, L. J. M., Kurylo, M. J., Liang, Q., Mahieu, E., Mühle, J., O'Doherty, S., Ohnishi, K., Orkin, V. L., Pfeilsticker, K., Rigby, M., Simpson, I. J., Yokouchi, Y., Engel, A., and Montzka, S. A.: Update on Ozone-Depleting Substances (ODSs) and Other Gases of Interest to the Montreal Protocol (Chapter 1), in: Scientific Assessment of Ozone Depletion: 2014, Global Ozone Research and Monitoring Project-Report No. 55, World Meteorological Organization, Geneva, Switzerland, 2014.
Cox, M. L.: A regional study of the natural and anthropogenic sources and sinks of the major halomethanes. Ph.D. Thesis, Monash University, School of Mathematical Sciences, Clayton, Victoria, Australia, https://doi.org/10.26180/14964660.v1, 2002.
Cunnold, D. M., Fraser, P. J., Weiss, R. F., Prinn, R. G., Simmonds, P. G., Miller, B. R., Alyea, F. N., and Crawford, A. J.: Global trends and annual releases of CCl3F and CCl2F2 estimated from ALE/GAGE and other measurements from July 1978 to June 1991, J. Geophys. Res., 99, 1107–1126, https://doi.org/10.1029/93jd02715, 1994.
Devlin, S. J., Gnanadesikan, R., and Kettenring, J. R.: Robust estimation and outlier detection with correlation coefficients, Biometrika, 62, 531–545, https://doi.org/10.1093/biomet/62.3.531, 1975.
Dunse, B. L., Steele, L. P., Wilson, S. R., Fraser, P. J., and Krummel, P. B.: Trace gas emissions from Melbourne, Australia, based on AGAGE observations at Cape Grim, Tasmania, 1995–2000, Atmos. Environ., 39, 6334–6344, https://doi.org/10.1016/j.atmosenv.2005.07.014, 2005.
Engel, A., Rigby, M., Burkholder, J. B., Fernandez, R. P., Froidevaux, L., Hall, B. D., Hossaini, R., Saito, T., Vollmer, M. K., and Yao, B.: Update on Ozone-Depleting Substances (ODS) and Other Gases of Interest to the Montreal Protocol, Chap. 1, in: Scientific Assessment of Ozone Depletion: 2018, Global Ozone Research and Monitoring Project-Report No. 58, World Meteorological Organization, Geneva, Switzerland, 2019.
Fang, K., Yao, Q., Guo, Z., Zheng, B., Du, J., Qi, F., Yan, P., Li, J., Ou, T., Liu, J., He, M., and Trouet, V.: ENSO modulates wildfire activity in China, Nat. Commun., 12, 1–8, https://doi.org/10.1038/s41467-021-21988-6, 2021.
Gan, J., Yates, S. R., Ohr, H. D., and Sims, J. J.: Production of methyl bromide by terrestrial higher plants, Geophys. Res. Lett., 25, 3595–3598, https://doi.org/10.1029/98gl52697, 1998.
Gressent, A., Rigby, M., Ganesan, A. L., Prinn, R. G., Manning, A. J., Mühle, J., Salameh, P. K., Krummel, P. B., Fraser, P. J., Steele, L. P., Mitrevski, B., Weiss, R. F., Harth, C. M., Wang, R. H., O'Doherty, S., Young, D., Park, S., Li, S., Yao, B., Reimann, S., Vollmer, M. K., Maione, M., Arduini, J., and Lunder, C. R.: Growing Atmospheric Emissions of Sulfuryl Fluoride, J. Geophys. Res.-Atmos., 126, e2020JD034327, https://doi.org/10.1029/2020JD034327, 2021.
Guo, H., Ding, A. J., Wang, T., Simpson, I. J., Blake, D. R., Barletta, B., Meinardi, S., Rowland, F. S., Saunders, S. M., Fu, T. M., Hung, W. T., and Li, Y. S.: Source origins, modeled profiles, and apportionments of halogenated hydrocarbons in the greater Pearl River Delta region, southern China, J. Geophys. Res.-Atmos., 114, D11302, https://doi.org/10.1029/2008JD011448, 2009.
Hu, L., Yvon-Lewis, S., Liu, Y., and Bianchi, T. S.: The ocean in near equilibrium with atmospheric methyl bromide, Global Biogeochem. Cy., 26, GB3016, https://doi.org/10.1029/2011GB004272, 2012.
Jagadeesan, R. and Nayak, M. K.: Phosphine resistance does not confer cross-resistance to sulfuryl fluoride in four major stored grain insect pests, Pest Manage. Sci., 73, 1391–1401, https://doi.org/10.1002/ps.4468, 2017.
Jiao, Y., Acdan, J., Xu, R., Deventer, M. J., Zhang, W., and Rhew, R. C.: Global Methyl Halide Emissions From Rapeseed (Brassica napus) Using Life Cycle Measurements, Geophys. Res. Lett., 47, e2020GL089373, https://doi.org/10.1029/2020GL089373 2020.
Jones, A. R., Thomson, D. J., Hort, M. C., and Devenish, B.: The U.K. Met Office's Next-Generation Atmospheric Dispersion Model, NAME III BT – Air Pollution Modeling and Its Application XVII, in: Air Pollution Modeling and Its Application XVII, 24–29 October 2004, New York, USA, edited by: Borrego, C. and Norman, A.-L., Springer, 580–589, 2007.
Khir, K. A., Ismail, N., and Balu, N.: Competitiveness of the rapeseed industry in China, Oil Palm Industry, Econ. J., 17, 8–24, 2017.
Kim, J., Li, S., Mühle, J., Stohl, A., Kim, S. K., Park, S., Park, M. K., Weiss, R. F., and Kim, K. R.: Overview of the findings from measurements of halogenated compounds at Gosan (Jeju Island, Korea) quantifying emissions in East Asia, J. Integr. Environ. Sci., 9, 71–80, https://doi.org/10.1080/1943815X.2012.696548, 2012.
Lee-Taylor, J. M. and Holland, E. A.: Litter decomposition as a potential natural source of methyl bromide, J. Geophys. Res.-Atmos., 105, 8857–8864, https://doi.org/10.1029/1999JD901112, 2000.
Lee-Taylor, J. M., Brasseur, G. P., and Yokouchi, Y.: A preliminary three-dimensional global model study of atmospheric methyl chloride distributions, J. Geophys. Res.-Atmos., 106, 34221–34233, https://doi.org/10.1029/2001JD900209, 2001.
Li, S., Kim, J., Kim, K. R., Mühle, J., Kim, S. K., Park, M. K., Stohl, A., Kang, D. J., Arnold, T., Harth, C. M., Salameh, P. K., and Weiss, R. F.: Emissions of halogenated compounds in east asia determined from measurements at Jeju Island, Korea, Environ. Sci. Technol., 45, 5668–5675, https://doi.org/10.1021/es104124k, 2011.
Li, S., Kim, J., Park, S., Kim, S. K., Park, M. K., Mühle, J., Lee, G., Lee, M., Jo, C. O., and Kim, K. R.: Source identification and apportionment of halogenated compounds observed at a remote site in East Asia, Environ. Sci. Technol., 48, 491–498, https://doi.org/10.1021/es402776w, 2014.
Li, S., Park, S., Lee, J. Y., Ha, K. J., Park, M. K., Jo, C. O., Oh, H., Mühle, J., Kim, K. R., Montzka, S. A., O'Doherty, S., Krummel, P. B., Atlas, E., Miller, B. R., Moore, F., Weiss, R. F., and Wofsy, S. C.: Chemical evidence of inter-hemispheric air mass intrusion into the Northern Hemisphere mid-latitudes, Sci. Rep., 8, 1–7, https://doi.org/10.1038/s41598-018-22266-0, 2018.
Manley, S. L., Wang, N. Y., Walser, M. L., and Cicerone, R. J.: Methyl halide emissions from greenhouse-grown mangroves, Geophys. Res. Lett., 34, L01806, https://doi.org/10.1029/2006GL027777, 2007.
Mao, L., Wang, Q., Yan, D., Li, Y., Ouyang, C., Guo, M., and Cao, A.: Flame soil disinfestation: A novel, promising, non-chemical method to control soilborne nematodes, fungal and bacterial pathogens in China, Crop Prot., 83, 90–94, https://doi.org/10.1016/j.cropro.2016.02.002, 2016.
MBTOC – Methyl Bromide Technical Options Committee: Report of the Methyl Bromide Technical Options Committee: 2006 assessment, United Nations Environment Program, Nairobi, Kenya, https://wedocs.unep.org/20.500.11822/29894 (last access: 15 April 2022), 2006.
MBTOC – Methyl Bromide Technical Options Committee: Report of the Methyl Bromide Technical Options Committee: 2018 Assessment, United Nations Environment Program, Nairobi, Kenya, https://ozone.unep.org/sites/default/files/2019-04/MBTOC-assessment-report-2018_1.pdf (last acces: 15 April 2022), 2018.
Mead, M. I., White, I. R., Nickless, G., Wang, K. Y., and Shallcross, D. E.: An estimation of the global emission of methyl bromide from rapeseed (Brassica napus) from 1961 to 2003, Atmos. Environ., 42, 337–345, https://doi.org/10.1016/j.atmosenv.2007.09.020, 2008.
Miller, B. R., Weiss, R. F., Salameh, P. K., Tanhua, T., Greally, B. R., Mühle, J., and Simmonds, P. G.: Medusa: A sample preconcentration and GC/MS detector system for in situ measurements of atmospheric trace halocarbons, hydrocarbons, and sulfur compounds, Anal. Chem., 80, 1536–1545, https://doi.org/10.1021/ac702084k, 2008.
Miller, J. B., Lehman, S. J., Montzka, S. A., Sweeney, C., Miller, B. R., Karion, A., Wolak, C., Dlugokencky, E. J., Southon, J., Turnbull, J. C., and Tans, P. P.: Linking emissions of fossil fuel CO2 and other anthropogenic trace gases using atmospheric 14CO2, J. Geophys. Res.-Atmos., 117, D08302, https://doi.org/10.1029/2011JD017048, 2012.
Millet, D. B., Atlas, E. L., Blake, D. R., Blake, N. J., Diskin, G. S., Holloway, J. S., Hudman, R. C., Meinardi, S., Ryerson, T. B., and Sachse, G. W.: Halocarbon emissions from the United States and Mexico and their global warming potential, Environ. Sci. Technol., 43, 1055–1060, https://doi.org/10.1021/es802146j, 2009.
Montzka, S. A., Fraser, P. J., Butler, J. H., Connell, P. S., Cunnold, D. M., Daniel, J. S., Derwent, R. G., Lal, S., McCulloch, A., Oram, D. E., Reeves, C. E., Sanhueza, E., Steele, L. P., Velders, G. J. M., Weiss, R. F., and Zander, R. J.: Controlled substances and other source gases, Chapter 1 in Scientific Assessment of Ozone Depletion: 2002, Global Ozone Research and Monitoring Project-Report No. 47, World Meteorological Organization, Geneva, Switzerland, 2003.
Montzka, S. A., Reimann, S., Engel, A., Krüger, K., O'Doherty, S., Sturges, W. T., Blake, D., Dorf, M., Fraser, P., Froidevaux, L., Jucks, K., Kreher, K., Kurylo, M. J., Mellouki, A., Miller, J., Nielsen, O.-J., Orkin, V. L., Prinn, R. G., Rhew, R., Santee, M. L., Stohl, A., and Verdonik, D.: Ozone-Depleting Substances (ODSs) and Related Chemicals, Chapter 1, in: Scientific Assessment of Ozone Depletion: 2010, World Meteorological Organization, Geneva, Switzerland, 2011.
O'Doherty, S., Simmonds, P. G., Cunnold, D. M., Wang, H. J., Sturrock, G. A., Fraser, P. J., Ryall, D., Derwent, R. G., Weiss, R. F., Salameh, P., Miller, B. R., and Prinn, R. G.: In situ chloroform measurements at Advanced Global Atmospheric Gases Experiment atmospheric research stations from 1994 to 1998, J. Geophys. Res.-Atmos., 106, 20429–20444, https://doi.org/10.1029/2000JD900792, 2001.
Palmer, P. I., Jacob, D. J., Mickley, L. J., Blake, D. R., Sachse, G. W., Fuelberg, H. E., and Kiley, C. M.: Eastern Asian emissions of anthropogenic halocarbons deduced from aircraft concentration data, J. Geophys. Res.-Atmos., 108, 4753, https://doi.org/10.1029/2003jd003591, 2003.
Park, S., Li, S., Mühle, J., O'Doherty, S., Weiss, R. F., Fang, X., Reimann, S., and Prinn, R. G.: Toward resolving the budget discrepancy of ozone-depleting carbon tetrachloride (CCl4): an analysis of top-down emissions from China, Atmos. Chem. Phys., 18, 11729–11738, https://doi.org/10.5194/acp-18-11729-2018, 2018.
Park, S., Western, L. M., Saito, T., Redington, A. L., Henne, S., Fang, X., Prinn, R. G., Manning, A. J., Montzka, S. A., Fraser, P. J., Ganesan, A. L., Harth, C. M., Kim, J., Krummel, P. B., Liang, Q., Mühle, J., O'Doherty, S., Park, H., Park, M.-K., Reimann, S., Salameh, P. K., Weiss, R. F., and Rigby, M.: A decline in emissions of CFC-11 and related chemicals from eastern China, Nature, 590, 433–437, https://doi.org/10.1038/s41586-021-03277-w, 2021.
Pisso, I., Sollum, E., Grythe, H., Kristiansen, N. I., Cassiani, M., Eckhardt, S., Arnold, D., Morton, D., Thompson, R. L., Groot Zwaaftink, C. D., Evangeliou, N., Sodemann, H., Haimberger, L., Henne, S., Brunner, D., Burkhart, J. F., Fouilloux, A., Brioude, J., Philipp, A., Seibert, P., and Stohl, A.: The Lagrangian particle dispersion model FLEXPART version 10.4, Geosci. Model Dev., 12, 4955–4997, https://doi.org/10.5194/gmd-12-4955-2019, 2019.
Porter, I. and Fraser, P.: Progress and remaining challenges with the phase-out of methyl bromide under the Montreal Protocol, Acta Hortic., 1270, 249–262, https://doi.org/10.17660/ActaHortic.2020.1270.31, 2020.
Press, W. H., Teukolsky, S. A., Vetterling, W. T., and Flannery, B. P.: Numerical Recepies in C, 3rd Edn., Cambridge University Press, Cambridge, New York, ISBN-13 978-0521880688, 2007.
Prinn, R. G., Huang, J., Weiss, R. F., Cunnold, D. M., Fraser, P. J., Simmonds, P. G., McCulloch, A., Harth, C., Reimann, S., Salameh, P., O'Doherty, S., Wang, R. H. J., Porter, L. W., Miller, B. R., and Krummel, P. B.: Evidence for variability of atmospheric hydroxyl radicals over the past quarter century, Geophys. Res. Lett., 80, 1536–1545, https://doi.org/10.1029/2004GL022228, 2005.
Prinn, R. G., Weiss, R. F., Arduini, J., Arnold, T., DeWitt, H. L., Fraser, P. J., Ganesan, A. L., Gasore, J., Harth, C. M., Hermansen, O., Kim, J., Krummel, P. B., Li, S., Loh, Z. M., Lunder, C. R., Maione, M., Manning, A. J., Miller, B. R., Mitrevski, B., Mühle, J., O'Doherty, S., Park, S., Reimann, S., Rigby, M., Saito, T., Salameh, P. K., Schmidt, R., Simmonds, P. G., Steele, L. P., Vollmer, M. K., Wang, R. H., Yao, B., Yokouchi, Y., Young, D., and Zhou, L.: History of chemically and radiatively important atmospheric gases from the Advanced Global Atmospheric Gases Experiment (AGAGE), Earth Syst. Sci. Data, 10, 985–1018, https://doi.org/10.5194/essd-10-985-2018, 2018.
Reimann, S., Schaub, D., Stemmler, K., Folini, D., Hill, M., Hofer, P., Buchmann, B., Simmonds, P. G., Greally, B. R., and O'Doherty, S.: Halogenated greenhouse gases at the Swiss High Alpine Site of Jungfraujoch (3580 m a.s.l.): Continuous measurements and their use for regional European source allocation, J. Geophys. Res.-Atmos., 109, D05307, https://doi.org/10.1029/2003jd003923, 2004.
Rhew, R. C., Miller, B. R., Vollmer, M. K., and Weiss, R. F.: Shrubland fluxes of methyl bromide and methyl chloride, J. Geophys. Res.-Atmos., 106, 20875–20882, https://doi.org/10.1029/2001JD000413, 2001.
Rigby, M., Prinn, R. G., O'Doherty, S., Montzka, S. A., McCulloch, A., Harth, C. M., Mühle, J., Salameh, P. K., Weiss, R. F., Young, D., Simmonds, P. G., Hall, B. D., Dutton, G. S., Nance, D., Mondeel, D. J., Elkins, J. W., Krummel, P. B., Steele, L. P., and Fraser, P. J.: Re-evaluation of the lifetimes of the major CFCs and CH3CCl3 using atmospheric trends, Atmos. Chem. Phys., 13, 2691–2702, https://doi.org/10.5194/acp-13-2691-2013, 2013.
Rigby, M., Park, S., Saito, T., Western, L. M., Redington, A. L., Fang, X., Henne, S., Manning, A. J., Prinn, R. G., Dutton, G. S., Fraser, P. J., Ganesan, A. L., Hall, B. D., Harth, C. M., Kim, J., Kim, K. R., Krummel, P. B., Lee, T., Li, S., Liang, Q., Lunt, M. F., Montzka, S. A., Mühle, J., O'Doherty, S., Park, M. K., Reimann, S., Salameh, P. K., Simmonds, P., Tunnicliffe, R. L., Weiss, R. F., Yokouchi, Y., and Young, D.: Increase in CFC-11 emissions from eastern China based on atmospheric observations, Nature, 569, 546–550, https://doi.org/10.1038/s41586-019-1193-4, 2019.
Roberts, T., Williams, I., and Preston, J.: The Southampton system: a new universal standard approach for port-city classification, Marit. Policy Manage., 48, 530–542, https://doi.org/10.1080/03088839.2020.1802785, 2020.
Shao, M., Huang, D., Gu, D., Lu, S., Chang, C., and Wang, J.: Estimate of anthropogenic halocarbon emission based on measured ratio relative to CO in the Pearl River Delta region, China, Atmos. Chem. Phys., 11, 5011–5025, https://doi.org/10.5194/acp-11-5011-2011, 2011.
Simmonds, P. G., Derwent, R. G., Manning, A. J., Fraser, P. J., Krummel, P. B., O'Doherty, S., Prinn, R. G., Cunnold, D. M., Miller, B. R., Wang, H. J., Ryall, D. B., Porter, L. W., Weiss, R. F., and Salameh, P. K.: AGAGE observations of methyl bromide and methyl chloride at Mace Head, Ireland, and Cape Grim, Tasmania, 1998–2001, J. Atmos. Chem., 47, 243–269, https://doi.org/10.1023/B:JOCH.0000021136.52340.9c, 2004.
Stein, A. F., Draxler, R. R., Stunder, B. J. B., Cohen, M. D., and Ngan, F.: NOAA's HYSPLIT atmospheric transport and dispersion modeling system, B. Am. Meteorol. Soc., 96, 2059–2077, https://doi.org/10.1175/BAMS-D-14-00110.1, 2015.
Stohl, A.: Trajectory statistics – A new method to establish source-receptor relationships of air pollutants and its application to the transport of particulate sulfate in Europe, Atmos. Environ., 30, 579–587, https://doi.org/10.1016/1352-2310(95)00314-2, 1996.
Stohl, A., Forster, C., Frank, A., Seibert, P., and Wotawa, G.: Technical note: The Lagrangian particle dispersion model FLEXPART version 6.2, Atmos. Chem. Phys., 5, 2461–2474, https://doi.org/10.5194/acp-5-2461-2005, 2005.
TEAP – Technology and Economic Assessment Panel: Report of the Technology and Economic Assessment Panel (Volume 1), United Nations Environment Program, Nairobi, Kenya, https://ozone.unep.org/system/files/documents/TEAP-2021-Progress-report.pdf (last access: 15 April 2022), 2020.
Thornton, B. F., Horst, A., Carrizo, D., and Holmstrand, H.: Methyl chloride and methyl bromide emissions from baking: An unrecognized anthropogenic source, Sci. Total Environ., 551, 327–333, https://doi.org/10.1016/j.scitotenv.2016.01.213, 2016.
Vaughn, T. L., Bell, C. S., Pickering, C. K., Schwietzke, S., Heath, G. A., Pétron, G., Zimmerle, D. J., Schnell, R. C., and Nummedal, D.: Temporal variability largely explains top-down/bottom-up difference in methane emission estimates from a natural gas production region, P. Natl. Acad. Sci. USA, 115, 11712–11717, https://doi.org/10.1073/pnas.1805687115, 2018.
Vollmer, M. K., Reimann, S., Folini, D., Porter, L. W., and Steele, L. P.: First appearance and rapid growth of anthropogenic HFC-245fa (CHF2CH2CF3) in the atmosphere, Geophys. Res. Lett., 33, L20806, https://doi.org/10.1029/2006GL026763, 2006.
Vollmer, M. K., Zhou, L. X., Greally, B. R., Henne, S., Yao, B., Reimann, S., Stordal, F., Cunnold, D. M., Zhang, X. C., Maione, M., Zhang, F., Huang, J., and Simmonds, P. G.: Emissions of ozone-depleting halocarbons from China, Geophys. Res. Lett., 36, L15823, https://doi.org/10.1029/2009GL038659, 2009.
Wallace, H. W., Jobson, B. T., Erickson, M. H., McCoskey, J. K., VanReken, T. M., Lamb, B. K., Vaughan, J. K., Hardy, R. J., Cole, J. L., Strachan, S. M., and Zhang, W.: Comparison of wintertime CO to NOx ratios to MOVES and MOBILE6.2 on-road emissions inventories, Atmos. Environ., 63, 289–297, https://doi.org/10.1016/j.atmosenv.2012.08.062, 2012.
Wang, C., Shao, M., Huang, D., Lu, S., Zeng, L., Hu, M., and Zhang, Q.: Estimating halocarbon emissions using measured ratio relative to tracers in China, Atmos. Environ., 89, 816–826, https://doi.org/10.1016/j.atmosenv.2014.03.025, 2014.
Weinberg, I., Bahlmann, E., Eckhardt, T., Michaelis, W., and Seifert, R.: A halocarbon survey from a seagrass dominated subtropical lagoon, Ria Formosa (Portugal): flux pattern and isotopic composition, Biogeosciences, 12, 1697–1711, https://doi.org/10.5194/bg-12-1697-2015, 2015.
Weiss, R. F. and Prinn, R. G.: Quantifying greenhouse-gas emissions from atmospheric measurements: A critical reality check for climate legislation, Philos. T. Roy. Soc. A, 369, 1925–1942, https://doi.org/10.1098/rsta.2011.0006, 2011.
Wu, C. and Yu, J. Z.: Evaluation of linear regression techniques for atmospheric applications: the importance of appropriate weighting, Atmos. Meas. Tech., 11, 1233–1250, https://doi.org/10.5194/amt-11-1233-2018, 2018.
Xinyi, E., Subramanyam, B., and Li, B.: Responses of phosphine susceptible and resistant strains of five stored-product insect species to chlorine dioxide, J. Stored Prod. Res., 72, 21–27, https://doi.org/10.1016/j.jspr.2017.03.002, 2017.
Yokouchi, Y., Toom-Sauntry, D., Yazawa, K., Inagaki, T., and Tamaru, T.: Recent decline of methyl bromide in the troposphere, Atmos. Environ., 36, 4985–4989, https://doi.org/10.1016/S1352-2310(02)00650-7, 2002.
Yokouchi, Y., Taguchi, S., Saito, T., Tohjima, Y., Tanimoto, H., and Mukai, H.: High frequency measurements of HFCs at a remote site in east Asia and their implications for Chinese emissions, Geophys. Res. Lett., 33, L21814, https://doi.org/10.1029/2006GL026403, 2006.
Yvon, S. A. and Butler, J. H.: An improved estimate of the oceanic lifetime of atmospheric CH3Br, Geophys. Res. Lett., 23, 53–56, https://doi.org/10.1029/95GL03022, 1996.
Zhang, T., de Jong, M. C., Wooster, M. J., Xu, W., and Wang, L.: Trends in eastern China agricultural fire emissions derived from a combination of geostationary (Himawari) and polar (VIIRS) orbiter fire radiative power products, Atmos. Chem. Phys., 20, 10687–10705, https://doi.org/10.5194/acp-20-10687-2020, 2020.
Zhao, H., Zhang, X., Zhang, S., Chen, W., Tong, D. Q., and Xiu, A.: Effects of agricultural biomass burning on regional haze in China: A review, Atmosphere (Basel), 8, 88, https://doi.org/10.3390/atmos8050088, 2017.
- Abstract
- Introduction
- Data and analysis
- Estimated CH3Br emissions from eastern China
- Potential of anthropogenic sources that contribute to CH3Br emissions
- Summary and conclusion
- Data availability
- Author contributions
- Competing interests
- Disclaimer
- Acknowledgements
- Financial support
- Review statement
- References
- Supplement