the Creative Commons Attribution 4.0 License.
the Creative Commons Attribution 4.0 License.
 | 13 Apr 2022
Ground-based investigation of HOx and ozone chemistry in biomass burning plumes in rural Idaho
Andrew J. Lindsay
Daniel C. Anderson
Rebecca A. Wernis
Yutong Liang
Allen H. Goldstein
Scott C. Herndon
Joseph R. Roscioli
Christoph Dyroff
Ed C. Fortner
Philip L. Croteau
Francesca Majluf
Jordan E. Krechmer
Tara I. Yacovitch
Walter B. Knighton
Ozone (O3), a potent greenhouse gas that is detrimental to human health, is typically found in elevated concentrations within biomass burning (BB) smoke plumes. The radical species OH, HO2, and RO2 (known collectively as ROx) have central roles in the formation of secondary pollutants including O3 but are poorly characterized for BB plumes. We present measurements of total peroxy radical concentrations ([XO2] ≡ [HO2] + [RO2]) and additional trace-gas and particulate matter measurements from McCall, Idaho, during August 2018. There were five distinct periods in which BB smoke impacted this site. During BB events, O3 concentrations were enhanced, evident by ozone enhancement ratios () that ranged up to 0.06 ppbv ppbv−1. [XO2] was similarly elevated during some BB events. Overall, instantaneous ozone production rates (P(O3)) were minimally impacted by the presence of smoke as [NOx] enhancements were minimal. Measured XO2 concentrations were compared to zero-dimensional box modeling results to evaluate the Master Chemical Mechanism (MCM) and GEOS-Chem mechanisms overall and during periods of BB influence. The models consistently overestimated XO2 with the base MCM and GEOS-Chem XO2 predictions high by an average of 28 % and 20 %, respectively. One period of BB influence had distinct measured enhancements of 15 pptv XO2 that were not reflected in the model output, likely due to the presence of unmeasured HOx sources. To the best of our knowledge, this is the first BB study featuring peroxy radical measurements.
- Article
(9435 KB) - Full-text XML
-
Supplement
(11286 KB) - BibTeX
- EndNote


Unprecedented wildfire activity has been observed in recent years. For example, Brazil's Amazon rainforest wildfires in 2019 (Cardil et al., 2020) and Australia's bush fires in 2019–2020 (Yu et al., 2020) were both marked by historically high amounts of land burned. The United States has also observed several staggering wildfire seasons characterized by hundreds of fatalities and tens of thousands of homes destroyed. For example, the 2018 season included California's deadliest fire ever (the Camp Fire), which was responsible for 85 deaths (CAL-FIRE, 2021), burned a total of 3.5×10⁶ ha of land, and elicited government spending of USD 3.1 billion for fire suppression (NIFC, 2019). Due to climate change, the impacts associated with wildfire are projected to worsen. Many regions, including much of the western United States, are becoming warmer and drier, causing increases in fuel aridity. These conditions are conducive to increases in land area burned, extended fire seasons, and frequent extreme fires (Spracklen et al., 2009; Yue et al., 2014, 2013; Goss et al., 2020). As a result, the amount of land area burned in the western United States is expected to increase by 24 %–124 % by the mid-21st century (Yue et al., 2014, 2013).
Wildfire smoke degrades air quality both locally and far downwind. Wildfire smoke is associated with respiratory and cardiovascular health risks (Liu et al., 2015; Reid et al., 2016; DeFlorio-Barker et al., 2019; Stowell et al., 2019). These health risks will result in modest increases of respiratory illness hospitalizations as wildfire smoke will more frequently impact densely populated areas (J. C. Liu et al., 2016). Smoke from biomass burning (BB), a term that includes wildfires, changes in composition as it is transported downwind. The initial composition is based on direct BB emissions: particulate matter (PM), NOx, and organic compounds spanning a wide range of volatilities. These emissions then transform through photochemical reactions that form secondary pollutants such as ozone (O3) and secondary organic aerosol (SOA). The formation of O3 within BB smoke is of concern because O3 poses additional health concerns and is a prominent greenhouse gas. While the large quantities of PM within BB smoke are primarily responsible for BB smoke health concerns (Liu et al., 2015; DeFlorio-Barker et al., 2019; Reid et al., 2016), health risks from O3 exposure include lung irritation, decreases in lung and cardiac function, higher susceptibility to respiratory infection, and early mortality (Bell et al., 2006; Park et al., 2004; Jerrett et al., 2009; Turner et al., 2016; Silva et al., 2013). Tropospheric ozone is the third most important anthropogenic greenhouse gas after CO2 and CH4. Increases in tropospheric ozone between the pre-industrial era and the present, from 1750 to 2011, have accounted for 0.40 W m−2 of radiative forcing. For perspective, CH4 and CO2 increases are responsible for 0.48 and 1.82 W m−2 of radiative forcing, respectively (Stocker et al., 2013).
Mitigating O3 pollution will be increasingly challenging as background O3 concentrations are increasing in some regions. Long-term aircraft observations across the Northern Hemisphere indicate average increases of tropospheric O3 of 5 % per decade (Gaudel et al., 2020). More specifically, western US O3 concentrations have been increasing 0.41 ppbv yr−1 despite declining concentrations in the eastern United States (Cooper et al., 2012). As biomass burning accounts for an estimated 3.5 % of global tropospheric O3 formation (Jaffe and Wigder, 2012), this source of O3 will be more important with projected wildfire activity (Jacob and Winner, 2009; Yue et al., 2015). Cities in the western US, which often have existing O3 pollution issues, have their air quality degraded by BB smoke. For example, a study focused on eight predominantly western US cities found wildfire smoke to correlate with 19 % of exceedances to the previous 75 ppbv O3 NAAQS (National Ambient Air Quality Standard) standard despite smoke only being present 4.1 % of the total days studied between May and the end of September (Gong et al., 2017). This NAAQS O3 standard is in terms of maximum 8 h daily concentration and has been set to a more stringent standard of 70 ppbv since 2015.
The correlation between O3 concentrations and BB smoke is not completely straightforward. Depleted O3 concentrations can be found in freshly emitted smoke plumes due to NO emissions reacting with background O3. Aged plumes have also been observed with depleted O3. This has been attributed to meteorological conditions (Wentworth et al., 2018), NOx sequestration via peroxy acetyl nitrate (PAN) formation (Alvarado et al., 2010), and significant PM emissions that attenuate sunlight and limit photochemistry (Xu et al., 2021). Ozone depletion is further exemplified by the wide variation in reported ozone enhancement ratios (). While most reported ratios are positive, indicating net O3 formation, negative values have also been reported and indicate depletion. ratios in temperate and boreal forest (those typical of the United States) are on average 0.018, 0.15, and 0.22 ppbv ppbv−1 for smoke plumes aged <2, 2–5, and >5 d, respectively (Jaffe and Wigder, 2012). The wide variation in net O3 production within BB smoke is related to several factors, including fire dynamics, the extent of emissions, and meteorological conditions. Each of these factors influence the underlying ROx (“ROx” = OH, HO2, and RO2) chemistry that controls oxidation processes and secondary pollutant formation.
ROx chemistry has rarely been studied within BB plumes. The peroxy radicals HO2 and RO2 (R = organic group) oxidize nitric oxide (NO) to form NO2 (Reactions R1 and R2). During the day, the resulting NO2 is converted to O3 by photolysis (Reactions R3 and R4).
Here, M represents a collision partner such as N2 or O2. Within these smoke plumes, the concentration and composition of ROx species depend on fire emissions, photochemical conditions, and smoke age. BB emissions include direct HOx precursors, but individual emission factors and ratios are highly variable between fires. Fire dynamics alone have a significant effect on emissions. Flaming conditions have greater combustion efficiencies and are characterized by smaller emission factors of volatile organic compounds (VOCs) and PM, while reactive nitrogen emissions are dominated by HONO, NO, and NO2 (Burling et al., 2010; Roberts et al., 2020). Smoldering fire conditions have greater VOC emission ratios and PM emissions but lower NOx emissions (Yokelson et al., 1996). Different fuel sources, such as specific tree species, shrubs, grasses, and crops, have unique emission profiles (Koss et al., 2018). Direct HOx precursor emissions of formaldehyde (HCHO), acetaldehyde (CH3CHO), and nitrous acid (HONO) are greater than those from more typical urban combustion sources. HONO within BB plumes is short-lived, with a chemical lifetime ranging 10 to 30 min due to photolysis. This rapid photolysis yields OH and NO and has caused HONO to act as the dominant ROx source in some freshly emitted smoke plumes (Peng et al., 2020; Yokelson et al., 2009). Ozone formation in young BB plumes is, in almost all cases, initially NOx-saturated (VOC-limited) but transitions to being NOx-limited as the NOx is photochemically processed to nitric acid and organic nitrates (Xu et al., 2021; Alvarado et al., 2015; Müller et al., 2016; Folkins et al., 1997). In particular, NO2 can be efficiently sequestered in the form of peroxyacetyl nitrate (PAN) due to the importance of the acetaldehyde emissions and the relative importance of the CH3C(O)OO radical (Peng et al., 2021). The subsequent thermal decomposition of PAN into air masses in which ozone production is NOx-limited can potentially lead to sustained O3 formation far downwind of a fire. BB emissions also include unique VOCs that are typically unaccounted for by chemical mechanisms employed by models. For instance, the importance of furanoids for model predictions of secondary pollution formation has only recently been studied (Müller et al., 2016; Coggon et al., 2019; Decker et al., 2019; Salvador et al., 2021; Robinson et al., 2021).
For the best understanding of the composition and concentration of radicals, direct measurements and improved models are necessary. Measurements of any ROx compounds within BB plumes are rare. Only one study has reported direct measurements of OH in a BB smoke plume, which found that freshly emitted BB plumes (22–43 min aged) had OH concentrations 5 times greater than those of background air (Yokelson et al., 2009). Our understanding of ROx chemistry in BB smoke has historically relied on calculations and models (Mason et al., 2001; Hobbs et al., 2003; de Gouw et al., 2006; Akagi et al., 2012; X. Liu et al., 2016; Müller et al., 2016; Parrington et al., 2013). Elevated OH concentrations have been suggested for freshly emitted smoke (Hobbs et al., 2003; Akagi et al., 2012), while low OH concentrations were calculated for aged plumes of ∼4 d in western Canada (de Gouw et al., 2006). There are few studies that have focused on peroxy radical chemistry within BB studies, and it appears there have been no direct measurements in BB smoke. Model-suggested peroxy radical concentrations have exhibited a wide range of values (Mason et al., 2001; Parrington et al., 2013; X. Liu et al., 2016; Baylon et al., 2018), in some cases reaching unrealistically high values ([HO2 + RO2] ≫200 pptv for wildfires in Nova Scotia, Canada, as presented in Parrington et al., 2013).
This paper focuses on smoke observations collected in McCall, Idaho, in the Pacific Northwest – a region particularly prone to wildfire – as part of the joint NCAR WE-CAN (Western Wildfire Experiment for Cloud Chemistry, Aerosol Absorption, and Nitrogen) and NOAA FIREX (Fire Influence on Regional to Global Environments Experiment) study. Increases in wildfire activity are anticipated for parts of this region, including much of Idaho, because of climate change (Halofsky et al., 2020). Presented are possibly the first measurements of total peroxy radicals in biomass burning plumes, enabling a unique investigation into the impacts of biomass burning on photochemistry and ozone production and the accuracy of commonly used atmospheric chemistry models.

Figure 1The McCall, Idaho, site is indicated by the red star, and wildfire locations are indicated by orange circles. Panel (a) shows detected wildfires between 15 and 24 August 2018. Panel (b) includes bihourly HYSPLIT back trajectories for the representative smoke impacted day of 17 August. Shown here are active wildfires of 15 through 17 August, as back trajectories end 24 h back. Fire locations were retrieved using the NOAA Hazard Mapping System (HMS) (NOAA, 2021).
2.1 Campaign description
Measurements were collected in McCall, Idaho, during the WE-CAN/FIREX 2018 campaign. McCall (elevation ∼1.5 km) is a rural town in Valley County, Idaho, approximately 160 km north of Boise, Idaho (Fig. 1), within the West Mountains of Idaho. While much of the local area is used for cattle grazing, the town attracts tourists year-round for outdoor recreation due to the presence of mountains, surrounding forests, and a large lake.
The McCall field site included two mobile laboratories and one building. Each were outfitted with instrumentation for gas- and particle-phase measurements. The largest mobile lab was the Aerodyne Mobile Laboratory (AML) (Herndon et al., 2005). The AML split its time between stationary sampling in McCall and mobile measurements in other parts of Idaho and surrounding states. Unlike the AML, the second mobile lab, known as the Miniature Aerodyne Mobile Lab (minAML), was permanently stationed at the McCall site. Our analyses focus on the date ranges 16–18 and 21–24 August when the AML was stationed at the McCall site.
2.2 ECHAMP
ECHAMP (Ethane CHemical AMPlifier) is a chemical amplification-based instrument that was used to measure total peroxy radical concentrations ([HO2] + [RO2], or simply [XO2]). ECHAMP was stationed within the minAML and sampled on a 2 min time base. The sampling and calibration methods have been described in detail elsewhere (Anderson et al., 2019; Wood et al., 2017), and only a brief summary including details specific to the McCall deployment is described here.
ECHAMP “amplifies” each sampled XO2 molecule into a greater number of NO2 molecules. The enhancement in NO2 concentration from “amplification” is then divided by an amplification factor to determine [XO2]. Amplification is achieved by mixing sampled air with elevated concentrations of NO and C2H6 to take advantage of a radical propagation scheme (Reactions 1–2 and 5–8). Since these reactions can proceed multiple times, each XO2 produces up to 20 NO2 molecules. There are two sampling channels: in the amplification channel there is an immediate addition of C2H6 and NO, whereas in the background channel the C2H6 addition is delayed to avoid Reaction (5), and all peroxy radicals are converted into HONO (Wood et al., 2017). The NO2 within the two channels is transported to and measured by respective cavity attenuated phase shift (CAPS) NO2 monitors (Kebabian et al., 2008).
Ambient air is first sampled at 2.5 SLPM into a 0.635 cm PFA tee and immediately diluted with 0.8 SLPM O2. The sampled air then flows through 10 cm of 0.476 cm i.d. PFA tubing protruding out of an inlet box. This ECHAMP inlet box is a weatherproof container with dimensions of 39 cm × 44 cm × 16 cm and was mounted 3 m a.g.l. on scaffolding. The sampled air then entered a glass cross that was internally coated with halocarbon wax. Connected orthogonally from the sampling lines were two 15.2 cm long (0.476 cm i.d) reaction chambers. The reaction chambers each subsampled at a flow rate of 0.83 L min−1 . The remaining flow rate of 1.64 SLPM traveled by a Vaisala HMP60 probe that measured temperature and humidity. The reaction chambers included additions of NO, C2H6, and N2. In amplification mode, 20 sccm of 39.3 ppmv NO in N2 and 50 sccm of 25 % C2H6 in N2 were added at the beginning of the reaction chamber, while 50 sccm of N2 is added in a downstream position. In the background mode, the locations for the N2 and C2H6 additions are reversed. The final concentrations of NO and C2H6 in the reaction chambers were 0.827 ppmv and 1.32 %, respectively. These reaction chambers alternate in 1 min intervals between background and amplification modes leading to the overall 2 min sampling time. The resulting mixtures from both channels were transported in approximately 23 m of their respective tubing to the minAML that housed both CAPS monitors.
Dilution of sampled air with O2 is a new addition to ECHAMP and is similar in some ways to its use by the perCIMS method (Hornbrook et al., 2011). The elevated O2 concentration (40 %) increases the ratio of the rate of the propagation reaction (Reaction R8; C2H5O + O2 → CH3CHO + HO2) to the rate of ethyl nitrite formation (C2H5O+NO + M → C2H5ONO + M), which is a termination reaction. Dilution also dries the sampled air, leading to lower and less variable relative humidity. This is beneficial as the amplification factor decreases with increasing RH (Anderson et al., 2019; Wood et al., 2017). The humidity dependence of the amplification factor is due to humidity-dependent reactions of HO2 and the HO2–H2O adduct reacting with NO to form HNO3 (Reichert et al., 2003; Butkovskaya et al., 2009) and HO2 wall losses (Mihele and Hastie, 1998; Reichert et al., 2003).
ECHAMP was calibrated to the methyl peroxy radical CH3O2 over a range of relative humidities (RHs) using the CH3I photolysis method as described in Anderson et al. (2019) six times at McCall. The calibrant was prepared by mixing humidified zero air (ZA) with trace amounts of CH3I from a permeation source. The resulting mixture flows to a quartz tube, where CH3I is photolyzed at 254 nm by an O3-free Hg lamp. The resulting CH3O2 calibrant is then added in excess flow to the ECHAMP inlet. To quantify the CH3O2 produced, both reaction chambers were initially operated in background mode and the CH3O2 source modulated on and off by alternating the flow between a UV photolysis cell and a bypass chamber. An improvement over the prior version of this calibration method was the elimination of dead volume in the chamber. Further details regarding this calibration technique including recent improvements are provided in the Supplement. Calibrations were also conducted using the H2O photolysis method (Anderson et al., 2019). Unfortunately, inconsistent results were obtained, and at the end of the project we discovered that the quartz photolysis cell was broken. Therefore, calibrations using the H2O photolysis method were disregarded, and only the CH3I calibrations were used. Based on the uncertainties in the individual calibration points, the variability among individual calibration points, and uncertainties regarding sampling losses, we ascribe an uncertainty of 34 % (2σ) to the measurements. See Sect. S1 for more information.
2.3 Additional measurements
On board the AML, quantum cascade tunable infrared laser direct absorption spectrometers (QC-TILDAS; Aerodyne Research Inc.) (McManus et al., 2015) were used to measure (1) NO and NO2; (2) CO, N2O, and H2O; (3) HCHO and HCOOH; (4) CH4 and C2H6; and (5) HCN. Ozone was measured by a 2B-Tech UV absorption instrument (model 205). While particulate matter and VOCs can positively interfere with photometric O3 measurements (Huntzicker and Johnson, 1979; Long et al., 2021), comparison to a separate Ox measurement revealed minimal interferences in the 2B-Tech O3 observations (see Sect. S2). VOC measurements were made by an ARI Vocus (proton-transfer-reaction high-resolution time-of-flight (PTR-HR-ToF) mass spectrometer) (Krechmer et al., 2018). Measured VOCs include isoprene, acetaldehyde, acetone, acetic acid, benzene, toluene, C2 benzenes, C3 benzenes, methanol, total monoterpenes, and the sum of methyl vinyl ketone (MVK) and methacrolein (MACR). BB-related VOCs measured with the Vocus include furan, methyl furan, furfural, the sum of methyl furfural and catechol, and guaiacol. Chemically resolved measurements of particulate matter mass concentrations were made by an ARI soot particle aerosol mass spectrometer (SP-AMS) (Canagaratna et al., 2007). Additional particle-phase measurements were made with an ARI aerosol chemical speciation monitor (ACSM), permanently stationed at the McCall site building (Ng et al., 2011).
On board the minAML, NO2 was measured with a CAPS monitor and VOCs with the Berkeley Comprehensive Thermal Desorption Aerosol Gas Chromatograph (cTAG) (Wernis et al., 2021). The cTAG measures concentrations of VOCs, intermediate volatility organic compounds, and semi-volatile organic compounds, spanning an alkane-equivalent volatility range from C5 to C30 every hour via pre-concentration followed by thermal desorption and gas chromatography–time-of-flight mass spectrometry (GC-TOF-MS). This paper uses isoprene, speciated monoterpenes, 2-methyl-3-buten-2-ol (MBO), styrene, benzene, and toluene measurements taken by cTAG.
Meteorological measurements were made both on the AML and permanently at the McCall site. Temperature, wind speed, and wind direction were collected by a 3D R.M. Young (Model 81000RE) sonic anemometer stationed permanently at the McCall site at a height of 10 m. Additional wind was measured with a 3D R.M. Young (Model 81000RE) sonic anemometer mounted to the AML rooftop and corrected for speed and truck orientation with data from a Hemisphere GPS compass (model Vector V103). Temperature, RH, and wind data are shared in the Supplement (Fig. S3). Daily maximum temperatures ranged 22 to 28 ∘C, while minimum temperatures ranged 4 to 13 ∘C. Solar irradiance was measured by a permanently stationed ARISense air quality sensor system (Cross et al., 2017). This was used to derive photolysis frequencies of interest, such as , by scaling measured irradiance to outputs from the National Center for Atmospheric Research (NCAR) Tropospheric Ultraviolet and Visible (TUV) radiation model. This process for deriving photolysis frequencies is described in greater detail in the Supplement.
For most calculations and chemistry analyses, measured concentrations of other compounds were synchronized to the 2 min ECHAMP timescale. This was achieved by averaging greater frequency measurements and linearly interpolating lower frequency measurements. Most measurements fall in the former category and were measured at a 1 Hz sampling rate. VOCs from cTAG were obtained at an hourly rate and were therefore linearly interpolated.
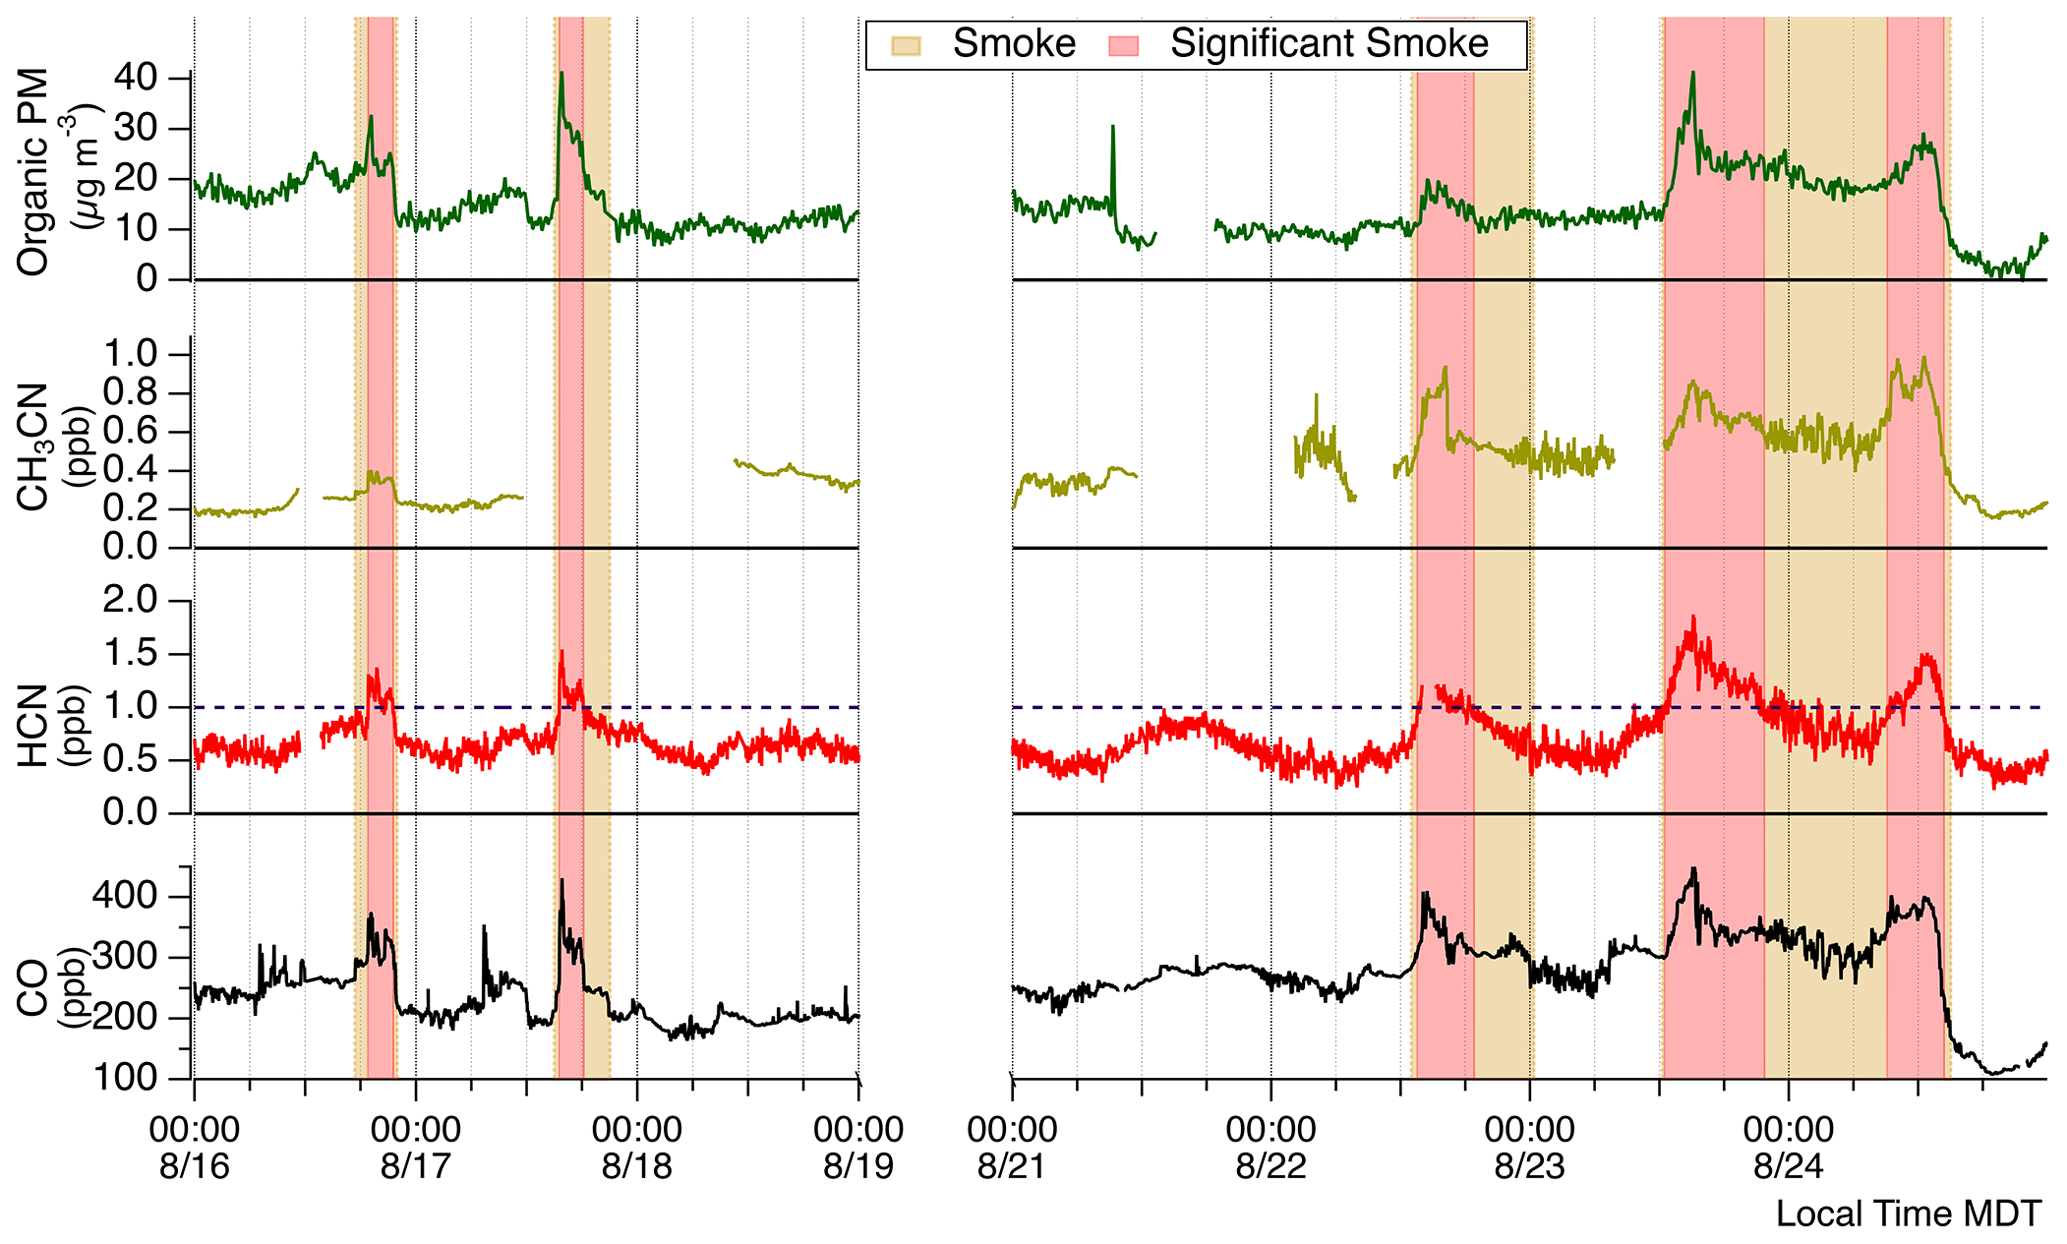
Figure 2Time series of smoke tracers. Tan shading represents smoke presence, while red shading signifies significant smoke periods. Significant smoke periods are defined by HCN concentrations greater than 1 ppbv. This smoke-defining concentration is indicated by the dashed purple line.

Figure 3Time series of O3, NO, NO2, total peroxy radicals (XO2), and aldehydes (HCHO and CH3CHO). Modeled frequencies and calculated parameters of P(Ox) and P(ROx) are also provided. The red shading indicates periods of smoke influence, while somewhat smoky periods are shaded tan. P(Ox) is shown in both 16 min averages (blue circles) and 2 min data (gray points). The dashed trace is entirely simulated by NCAR TUV model, whereas the rest of the data are derived from ARISense solar irradiance measurements.
2.4 Smoke events
Time periods impacted by smoke were identified with observations of the biomass burning tracers HCN, CH3CN, organic aerosol (OA), and CO. HCN was used as the primary tracer for BB smoke. Nitriles are commonly used as tracers for BB, and HCN is particularly useful in the absence of nearby vehicle sources. Emissions of HCN are essentially inert within BB plumes with an atmospheric lifetime of 2 to 4 months (Li et al., 2000). HCN emission ratios are dependent on the biomass burning fuel type (Koss et al., 2018; Coggon et al., 2016) and can vary with fire dynamics (Roberts et al., 2020). Figure 2 presents McCall site observations and indicates smoke-impacted time periods when ECHAMP was actively sampling and the AML was present. The lowest concentrations of HCN, CH3CN, CO, and OA were all observed on 24 August, suggesting the air sampled up until then was always somewhat affected by BB emissions. We experienced five distinct smoke-impacted periods evident by clear enhancements of HCN along with organic PM and CO. The periods of greatest smoke influence (red shaded regions in Fig. 2) were identified by sustained periods of HCN concentrations greater than 1 ppbv. General smoke presence (tan shaded regions in Fig. 2) was identified before and after each significant smoke period when background smoke tracer concentrations remained elevated compared to stable background air. There were distinct smoke periods in the early evenings of 16 and 17 August. These occurred from 18:48 to 21:55 MDT on 16 August and 15:27 to 18:15 MDT on 17 August. While appreciable enhancements in CO were observed during both of these periods, a significant OA enhancement of ∼20 µg m−3 was only observed during 17 August. For the period 21 to 24 August, smoke events occurred at earlier times. Periods of significant smoke influence on 22, 23, and 24 August were from 12:55 to 16:34, 12:26 to 17:07, and 07:42 to 15:00 MDT, respectively. The 22 August smoke event had minimal enhancement of OA. The smoke event on 23 August was quite distinct with the greatest HCN concentrations observed for the entire campaign. After this 23 August significant smoke period highlighted in Fig. 2, concentrations of HCN, CO, and OA decreased but remained at levels above background concentrations until the 24 August event. Following the 24 August significant smoke period, CO and OA decreased to their lowest observed concentrations indicating that we were sampling an air mass with minimal smoke influence.
We identify the sources of the observed smoke by pairing NOAA Air Resources Laboratory HYbrid Single Particle Lagrangian Integrated Trajectory (HYSPLIT) (Stein et al., 2015) model back trajectories with satellite-detected wildfire locations (Lindaas et al., 2017; Rogers et al., 2020). Figure 1a shows all wildfires detected for the date range we focus our analyses on. Three well-documented fires are indicated: the Mesa Fire, the Rattlesnake Creek Fire, and the Rabbit Foot Fire. The Mesa Fire, located 38.3 km southwest of McCall, was responsible for burning 34 700 acres (∼ 14 000 ha) and started on 26 July 2018 (FWAC, 2021b). The Rattlesnake Creek Fire started on 23 July 2018 and burned over 8000 acres (>3300 ha) (FWAC, 2021c). The Rabbit Foot Fire began on 2 August 2018, burned 36 000 acres (∼15 000 ha), and was not contained until November (FWAC, 2021a). Figure 1b shows 17 August as a representative smoke-impacted day. Shown are bihourly HYSPLIT 48 h long back trajectories initialized from the McCall site at 10 m a.g.l. using archived Global Data Assimilation System (GDAS) 1∘ meteorological data. Based on fire tracer observations (see Fig. 2), the 17 August significant smoke period started at ∼ 15:30 MDT and persisted until 18:15 MDT. This is consistent with the 16:00 and 18:00 MDT back trajectories that show that air sampled during that period was transported past an active fire approximately 60 km southwest of the McCall, Idaho, site. Though an uncontrolled portion of the Mesa Fire may have also contributed to these smoky conditions, the HYSPLIT trajectories would suggest earlier smoke influence possibly starting near 14:00 MDT. The smoke likely traveled between 3–5 h to get to the McCall site from the unspecified active fire for the 17 August example shown. Figures showing HYSPLIT trajectories for other smoke-influenced days are included (Sect. S4). The likely sources and smoke ages for other events are detailed here. The 16 August smoke event was likely sourced from the same unspecified wildfire ranging in age between 4–10 h. The smoke on 22 August was likely 12–18 h or longer and sourced from an unspecified fire located east between the McCall site and the Rabbit Foot Fire. The 23 August smoke was likely sourced from the southwest from another unspecified fire at an age of 12–18 h, though the Mesa Fire may have contributed here. The smoky conditions of the morning of 24 August were likely from wildfires in central Oregon aged 18–30 h until especially clean air was sourced from northern Oregon beginning at approximately 12:00 MDT.
2.5 Calculations
Ozone enhancement ratios from smoke influence were determined for the most distinct BB events of 16, 17, and 24 August. For the 17 and 24 August events, the ozone enhancement ratio was determined using the York bivariate linear regression method (York et al., 2004) using a continuous section of O3 and CO data that includes 60 min of background air, a transitional smoke period (tan shaded regions in Fig. 2), and 60 min of significant smoke period data (red shaded regions in Fig. 2). Enhancements in NO2 were typically under 0.2 ppbv, and so the difference between considering ΔOx (Ox = O3 + NO2) and ΔO3 was negligible. The linear regressions are included in the Supplement (Fig. S8). for the 16 August event was determined using Eq. (1) with O3 and CO data collected during a stable period at the start of the significant smoke period and a stable background prior to smoke presence.
This event had a temporary depletion in O3 by ∼20 ppbv for the start of smoke significance and then returned to near-background levels of O3. values were not calculated for the remaining 22 and 23 August smoke events. These events had less distinct O3 enhancements and occurred at times when O3 also increased during non-smoky time periods.
The gross instantaneous OX production rate P(OX), often referred to as P(O3), is the rate at which NO is converted to NO2 by reaction with HO2 or RO2 (Eq. 2). Since we measure the sum of HO2 and RO2, we calculate P(Ox) with Eq. (3) using ECHAMP XO2 and AML-based QC-TILDAS NO measurements. Noting that the differences between and most rate constants are small (Anderson et al., 2019), we use an effective rate constant (keff) equal to . P(Ox) from box model results were calculated using Eq. (2) and the model HO2 and speciated RO2 concentrations.
Instantaneous ROx production rates P(ROx) from measured compounds were calculated using Eq. (4). Each term represents a compound that undergoes photolysis to produce two ROx radicals, with compound-specific photolysis rate constants (frequencies) indicated by the J variables. Our calculated values for P(ROx) are limited by the lack of measurements for HONO, which is the dominant HOx source in freshly emitted BB smoke (Peng et al., 2020; Robinson et al., 2021). While HONO has a lifetime of ∼20 min during daylight hours, dark plume conditions and possible photochemical formation on aerosol particles may lead to sustained HONO concentrations. Ozonolysis of measured alkenes had minimal contribution to daytime P(ROx) values and was therefore omitted from this calculation but is included in model predictions.
2.6 Zero-dimensional modeling
The Framework for 0-D Atmospheric Modeling (F0AM) box model (v3.2) (Wolfe et al., 2016) was used to evaluate ECHAMP XO2 measurements and further investigate BB impacts on instantaneous chemistry. F0AM simulations were conducted for the ECHAMP 2 min time basis for dates on which AML concomitant measurements were present. Modeling was conducted separately for the two date ranges of interest of 16 to 18 and 21 to 24 August and then combined for analysis. We primarily focus on results acquired by employing a subset of the Master Chemical Mechanism (MCM) version 3.3.1 (Saunders et al., 2003; Jenkin et al., 2003, 2015) that included only the relevant chemical species in order to avoid unnecessary reactions and improve model time consumption. The model was constrained with all available measurements (see Supplement for full list), including concentrations of ozone, formaldehyde, acetaldehyde, acetone, isoprene, speciated monoterpenes, MVK, MACR, and MBO. While F0AM allows for total NOx to be constrained, we instead constrained NO and NO2 individually. Model results obtained using total NOx constraints led to nearly identical daytime XO2 predictions but with unrealistic nighttime XO2 values. The base MCM mechanism, referred to as “MCM-base” from here on, was augmented for two additional F0AM simulations. First, the MCM-base was expanded by including additional chemistry for BB-related VOCs (referred to as “MCM-BBVOC”) of furan, methyl furan, furfural, methyl furfural, and guaiacol by manually adding the relevant chemical reactions to the MCM as detailed by Coggon et al. (2019). Second, a mechanism referred to as “MCM-BBVOC-het” included heterogeneous chemistry for HO2 loss on organic aerosols in addition to the previously detailed BB VOC chemistry. The heterogeneous loss rates are dependent on the predicted [HO2] values, organic aerosol surface area concentration, an uptake coefficient (γ), and mean molecular speed (Tang et al., 2014). Aerosol surface area concentrations were not measured and were instead calculated from mass concentration measurements by applying a specific surface area. The default specific surface area was set to 4 m2 g−1. This setting falls slightly below the typical values measured for an urban environment of Tokyo, Japan (Hatoya et al., 2016). The default uptake coefficient was 0.20, as recommended by Jacob (2000). We explored the sensitivity of model results to both the specific surface area and uptake coefficient parameters by varying settings. We also share F0AM results acquired using the GEOS-Chem chemical mechanism. This version of the GEOS-Chem mechanism uses version 9-02 (Mao et al., 2013) with isoprene chemistry updates (Marais et al., 2016; Fisher et al., 2016; Travis et al., 2016; Kim et al., 2015). A small first-order dilution was implemented for all model experiments so that all compounds would have 24 h lifetimes in order to prevent unreasonable accumulation of secondary species with background concentrations for all unmeasured compounds set to 0 ppbv (Wolfe et al., 2016). Initial concentrations of unmeasured species were also set to 0 ppbv for the model results presented in this paper. Minimal changes in model results were observed for additional simulations that included a “spin-up” period in order to determine initial concentrations of unmeasured compounds. As mentioned earlier, HONO is a particularly important ROx precursor in BB plumes. In addition to it not being measured during this study, the zero-dimensional models utilized cannot be expected to accurately predict HONO concentrations since a portion of the HONO in the sampled air masses was undoubtedly emitted directly by the smoke. Furthermore, there are no HONO formation processes in the chemical mechanisms besides its homogenous formation from the reaction of OH with NO (i.e., there are no heterogeneous formation mechanisms). A complete description of our model setup, including observational constraints and uncertainties, is provided in the Supplement (see Sect. S7).
3.1 Smoke influence on ozone and its precursors
Figure 3 shows site observations of O3 and relevant measurements of NOx, total peroxy radicals, and aldehydes. Typically O3 increased from ∼20 ppbv overnight up to daily maximum concentrations between 50 and 60 ppbv, with the greatest O3 concentrations of near 70 ppbv observed on 23 August. NOx concentrations were consistently low, with typical daytime [NO] and [NO2] values below 0.1 and 1.0 ppbv, respectively, suggesting O3 production in the NOx-limited regime (Sillman et al., 1990). Ozone production is further discussed in Sect. 3.2. XO2 typically reached daily maximum concentrations between 40 and 60 pptv. Distinct increases in [O3] and [XO2] were observed during some BB events. The 17 August event had the clearest impact, with [O3] increasing ∼10 ppbv and [XO2] increasing ∼15 pptv over 45 min, resulting in the maximum [XO2] observed of near 70 pptv for the entire campaign. The 16 and 24 August smoke events had distinct [O3] increases but with less notable change in [XO2]. For 24 August, smoke impacted the site throughout the morning and persisted into the afternoon. Ozone concentrations were ∼53 ppbv for over an hour until smoky conditions dispersed. Ozone concentrations then decreased and remained near 46 ppbv, demonstrating a 7 ppbv elevation associated with the presence of smoke. No distinct impact on XO2 was observed for this event. The smoke impact on 16 August was unique as [O3] was depleted by ∼10 ppbv upon smoke arrival, returned to near-background concentrations, then was again depleted by ∼10 ppbv as smoke exited. Enhancements in [NO2] during these periods of depleted O3 were small – only 0.5 and 1.0 ppbv – thus [Ox] was depleted as well. This variation in [O3] and smoke tracers was likely due to different regions of this smoke plume impacting the site at different times. The edges of the plume may have been sampled at the beginning and end of the smoke period and the plume center sampled during the period with the greatest O3 concentrations. XO2 responded similarly to O3 and was depleted by ∼10 pptv upon the arrival and departure of smoke. The 23 August event was particularly smoky, with the greatest smoke tracer concentrations of HCN, CO, and organic PM, as well as the highest concentrations of O3 for the entire campaign.

Figure 4Correlation between O3 and smoke tracer HCN for all observations between 09:00 and 22:00 MDT (a), 14:00 and 16:00 MDT (b), and 16:00 and 18:00 MDT (c). Data points are colored by date collected.
For the entire campaign, there is a positive correlation between daytime O3 (and Ox) concentrations and smoke tracer HCN (Fig. 4a), with the highest values for both observed on 23 August. Most periods of elevated HCN occurred during the times of day when [O3] was usually high, even in the absence of smoke (afternoon or early evening), so the overall positive correlation between O3 and HCN may be partially coincidental. The positive correlation remains, however, when the analysis is restricted to 2 h periods of afternoon and early evening data to limit the time-of-day dependence (Fig. 4b and c). These more specific O3–HCN comparisons remain impacted by day-to-day variability in O3 from changes in background O3 values, meteorology, and BB HCN and O3 precursor emissions. Smoke age also plays a role in this correlation plot. Based on literature trends where values increase with smoke age until an eventual plateau (Jaffe and Wigder, 2012; Baker et al., 2016; Xu et al., 2021), young smoke plumes are likely to have smaller O3 enhancements relative to smoke tracers like HCN compared to aged plumes. Clusters of data points at HCN concentrations below 0.75 ppbv are observed for the 18 and 24 August data sets. For 18 August, there was no distinct BB-influenced period and little variability in [HCN]. This led to the cluster of 18 August data points with [O3] near 60 ppbv. The 24 August data cluster near 50 pbbv [O3] captures the stable period after [O3] is depleted by ∼7 ppbv upon smoke departure followed by a slow build in concentration. A similar figure with O3 plotted against CO but for times specific to the arrival or departure of smoke is shown in the Supplement (Fig. S8).
Daily maximum P(ROx) values calculated from measured compounds ranged from 0.45 to 0.65 pptv s−1 (Fig. 3). P(ROx) was dominated by HCHO photolysis and the reaction of O(1D) (from O3 photolysis) with water vapor. ROx production from photolysis of acetaldehyde and acetone was of minor importance. Aldehydes were enhanced for some of the BB events. Typically, HCHO ranged between 1.5 and 4.5 ppbv, and BB events led to enhancements of near 2 ppbv for the 16, 17, and 24 August events. This led to distinct impacts on P(ROx) and is most evident for the 24 August event. Distinct enhancements in O3 for the 17 and 24 August events similarly affected P(ROx). While measurements of [XO2] generally reflect P(ROx) trends, this was not the case for the 17 August event. As XO2 increased by ∼27 % upon the arrival of the smoke-affected air mass, P(ROx) from measured compounds increased by at most 5 %. Changes in NOx were mostly negligible during this period, though [NO] remained below 0.1 ppbv, indicating that small changes in [NO] could have had a large impact on [XO2]. Increases in both [O3] and [HCHO] of ∼20 % did not contribute to a significant increase in P(ROx) due to a ∼30 % decrease in [H2O] (see Fig. S16) and a ∼10 % decrease in photolysis frequencies. The sudden increase in measured [XO2] when there were only small changes in P(ROx), NOx, and VOCs suggests the prominence of unmeasured ROx sources such as HONO. Peng et al. (2020) suggested HONO enhancement ratios (ΔHONO/ΔCO) of ∼0.1 pptv ppbv−1 for western US wildfire BB plumes aged 3 h, the likely age of our smoke plume sampled here, causing HONO photolysis to remain a significant ROx source even after 3 h of aging. On average, HONO accounted for >90 % and 50 % of P(ROx) in 30 min aged plumes and 3 h aged plumes, respectively (Peng et al., 2020).
3.2 Ozone production
We describe the extent of ozone formation for the 16, 17, and 24 August BB-influenced periods using the commonly used metric. These values depict the O3 produced in transit to the McCall site while accounting for plume dilution or overall smoke influence of the site air sampled. values were −0.02, 0.06, and 0.03 ppb ppbv−1 for the 16, 17, and 24 August smoke events, respectively. These calculated values fall within the wide variability and range of literature values for boreal and temperate forest fire smoke plumes aged less than 2 d, including numerous examples of ozone depletion for aged plumes (Jaffe and Wigder, 2012). Though the smoke was likely sourced from the same wildfire for the 16 and 17 August events (Sect. 2.4), we observe O3 depletion on 16 August and O3 enhancement on 17 August. values were not calculated for the 22 and 23 August smoke events as we were unable to attribute the observed increases of O3 to smoke influence as they occurred at the same time that O3 usually increased during non-smoky time periods, as mentioned in Sect. 2.5. Ox enhancement ratios are not presented but differed insignificantly from O3 enhancement ratios as NO2 concentrations were much lower than O3 concentrations (see Fig. 3).
Instantaneous O3 production rates are calculated using NO and XO2 concentrations (Fig. 3). Gaps in P(Ox) are due to measurement gaps in XO2 when ECHAMP was offline for calibrations and diagnostic tests. The highest P(Ox) values occurred on 17 and 18 August during non-smoky periods between 10:00 and 12:00 MDT, reaching formation rates slightly greater than 8 ppbv h−1. For the entire campaign, median P(Ox) peaked at 11:00 MDT at 5.8 ppbv h−1. As NO concentrations were low and rarely exceeded 1 ppbv, changes in [NO] had a near-linear impact on P(Ox). Noisy P(Ox) periods, such as the entire afternoon of 16 August, are mainly attributed to the atmospheric variability of and measurement precision for NO. Overall, there is little correlation between P(Ox) and smoke tracers. However, elevated P(Ox) during the 17 August event is somewhat evident. The ∼27 % increase in XO2 and near-constant value for NO led to this temporary increase in P(Ox). P(Ox) increased from ∼2.5 to 8.9 ppb h−1 during the transition from background air to significant smoke, remained elevated for 34 min, and then returned to near-background P(Ox) rates. The overall lack of impact of BB influence on P(Ox) is further depicted in the P(Ox) diurnal cycle of Fig. 5. Modeled P(Ox) results for the same time period are also presented in Fig. 5a with the green median trend. These model results were acquired using F0AM with the MCM-BBVOC mechanism. Modeled P(Ox) is consistently greater than measured values, with the greatest discrepancy occurring in the 07:45 to 08:15 MDT period. This difference is due to modeled [XO2] being greater than measured [XO2]. While we present results acquired using four unique chemical mechanisms, model-predicted P(Ox) was always greater than measurements, though within the combined uncertainties.

Figure 5P(Ox) results derived from 2 min XO2 observations. Panel (a) shows the diurnal profile of all calculated P(Ox) values. The data points are colored by smoke tracer HCN. The green and blue traces represent 15 min median values of P(Ox) as determined using measurements and model results, respectively. The provided model results were acquired with F0AM using the MCM-BBVOC mechanism. Panel (b) shows the variation of P(Ox) with NO. Data are colored by P(ROx) and sized by [HCN].
Figure 5b shows the relationship between P(Ox), [NO], and P(ROx). For P(ROx) values above 0.4 ppt s−1, P(Ox) increases almost linearly with [NO] up until at least 400 ppt, consistent with ozone formation being NOx-limited. The vast majority of NO concentrations are below 400 pptv. P(Ox) at lower P(ROx) values (less than 0.2 ppt s−1) exhibits much more noise and are typically below 2 ppb h−1.
3.3 Model evaluation
To investigate our understanding of photochemistry in biomass burning plumes we conducted zero-dimensional modeling constrained by our available measurements excluding ECHAMP XO2 observations. Figure 6 shows a time series of model-predicted HO2, speciated RO2, OH, and OH reactivity acquired using the MCM 3.3.1 with added BB VOC chemistry (“MCM-BBVOC”). Additional results included in the Supplement were acquired using the three other mechanisms: MCM-base, MCM-BBVOC-het, and the base GEOS-Chem mechanism (Figs. S11–S13). Model [OH] (Fig. 6) had daily peak values ranging from 0.10 to 0.15 pptv (2–3×10⁶ molec. cm−3). The MCM-base [OH] results were typically higher but generally agreed within 5 % of the other two altered MCM mechanisms. Daytime GEOS-Chem OH concentrations were typically ∼75 % higher than the base MCM prediction. OH predictions were generally unaffected by smoke influence for all mechanisms though upon smoke arrival on 17 August [OH] decreased from ∼0.12 to 0.05 pptv for the MCM-BBVOC mechanism, with similar results observed with the other mechanisms. Modeled XO2 comprises HO2 (typically ∼45 %–50 %) and CH3O2 (∼20 %–25 %) and the remaining portion a combination of CH3CO3, RO2 derived from isoprene oxidation, and other organic peroxy radicals. Measured XO2, as included in Fig. 3, is overlaid on Fig. 6. Daytime modeled [XO2] (between 09:00 to 21:00 MDT), using the MCM-base, MCM-BBVOC, MCM-BBVOC-het, and GEOS-chem mechanisms, is consistently greater than measured [XO2] on average by 28 %, 34 %, 27 %, and 20 %, respectively (Fig. 7), all of which are within the combined 2σ measurement uncertainty (34 %) and predicted model uncertainty (25 %), though there are periods in which model values are greater than measured XO2 by nearly a factor of 2 (i.e., the afternoon of 18 August). The inclusion of BB chemistry (MCM-BBVOC) increased XO2 predictions (compared to MCM-base results), and the inclusion of heterogeneous HO2 uptake (MCM-BBVOC-het) led to slight decreases (compared to MCM-BBVOC results). The rapid increase in [XO2] observed on 17 August was not captured under any model conditions. As discussed in Sect. 3.1, this discrepancy from 17 August is likely at least partially due to the impact of HONO, which was not measured and unlikely properly accounted for by the zero-dimensional model. Observed XO2 on 23 August was high compared to all other days observed, while modeled XO2 is only somewhat greater than other days. Comparison between daytime XO2 observations and model results (Fig. 7) was determined using the York bivariate linear regression method (York et al., 2004). Both measured and modeled [XO2] are low at night (below 10 pptv). Model XO2 predictions with all chemical mechanisms agreed within 10 %.
The OH reactivities from the MCM-BBVOC mechanism ranged from 5 to 25 s−1 (Fig. 6). These OH reactivities are divided into several categories based on direct measurements and an “other” category for non-measured model outputs. The “other” category was often the greatest category, contributing as much as 40 % of the total reactivity at times. Incorporating heterogeneous losses to the BB VOC mechanism (MCM-BBVOC-het results) had nearly no effect on OH reactivity, and removing BB chemistry (MCM-base results) led to a smaller range in OH reactivity – from 5 to 20 s−1. The GEOS-CHEM OH reactivities were lowest, ranging 3 to 14 s−1, due to this mechanism having a limited number of reactions, causing fewer measured compounds to be constrained. The BB VOC category shown (catechol, furan, methyl furan, furfural, methyl furfural, and guaiacol) was often the greatest contributor to the portion of OH reactivity attributed to measured compounds. BB VOC values were typically 2 to 5 s−1, accounting for 10 % to 30 % of measured reactivity. This category played a lesser role in the MCM-base mechanism as only one measured compound was included – catechol – leading to at most 10 % of measured reactivity. Reactivity from carbonyls (HCHO, CH3CHO, acetone, and methyl ethyl ketone (MEK)) typically contributed 15 % to 20 % of the measured reactivity. The inorganic category typically accounted for 10 % of measured reactivity, or 1 to 3 s−1, and was dominated by CO. The four biogenic categories included were isoprene, monoterpenes (measured monoterpenes sorted into α-pinene, β-pinene, and limonene), MVK/MACR (methyl vinyl ketone and methacrolein), and MBO (2-methyl-3-buten-2-ol). These categories typically account for between 30 % to 50 % of the OH reactivity attributed to measured species. Other measured reactivity categories were minor and included aromatics (benzene, toluene, C2 benzenes, C3 benzenes, and phenol), alkanes (CH4, C2H6, and ethyne), and acids (formic acid and acetic acid). The “other” category had greatest contributions from carbonyl compounds. Changes in OH reactivity were observed for some smoke periods. Subtle changes were noted during the 16 and 17 August events due to changes in the inorganic, carbonyl, biogenic, and BB VOC portions. A noticeable decrease in reactivity from 10 to <5 s−1 occurred on 24 August upon smoke departure. Decreases in nearly all reactivity categories contributed with notable contributions due to depletion in aldehyde concentrations and [CO]. This period sustained the lowest reactivities for the entire data set while also having the lowest concentrations of smoke tracers.
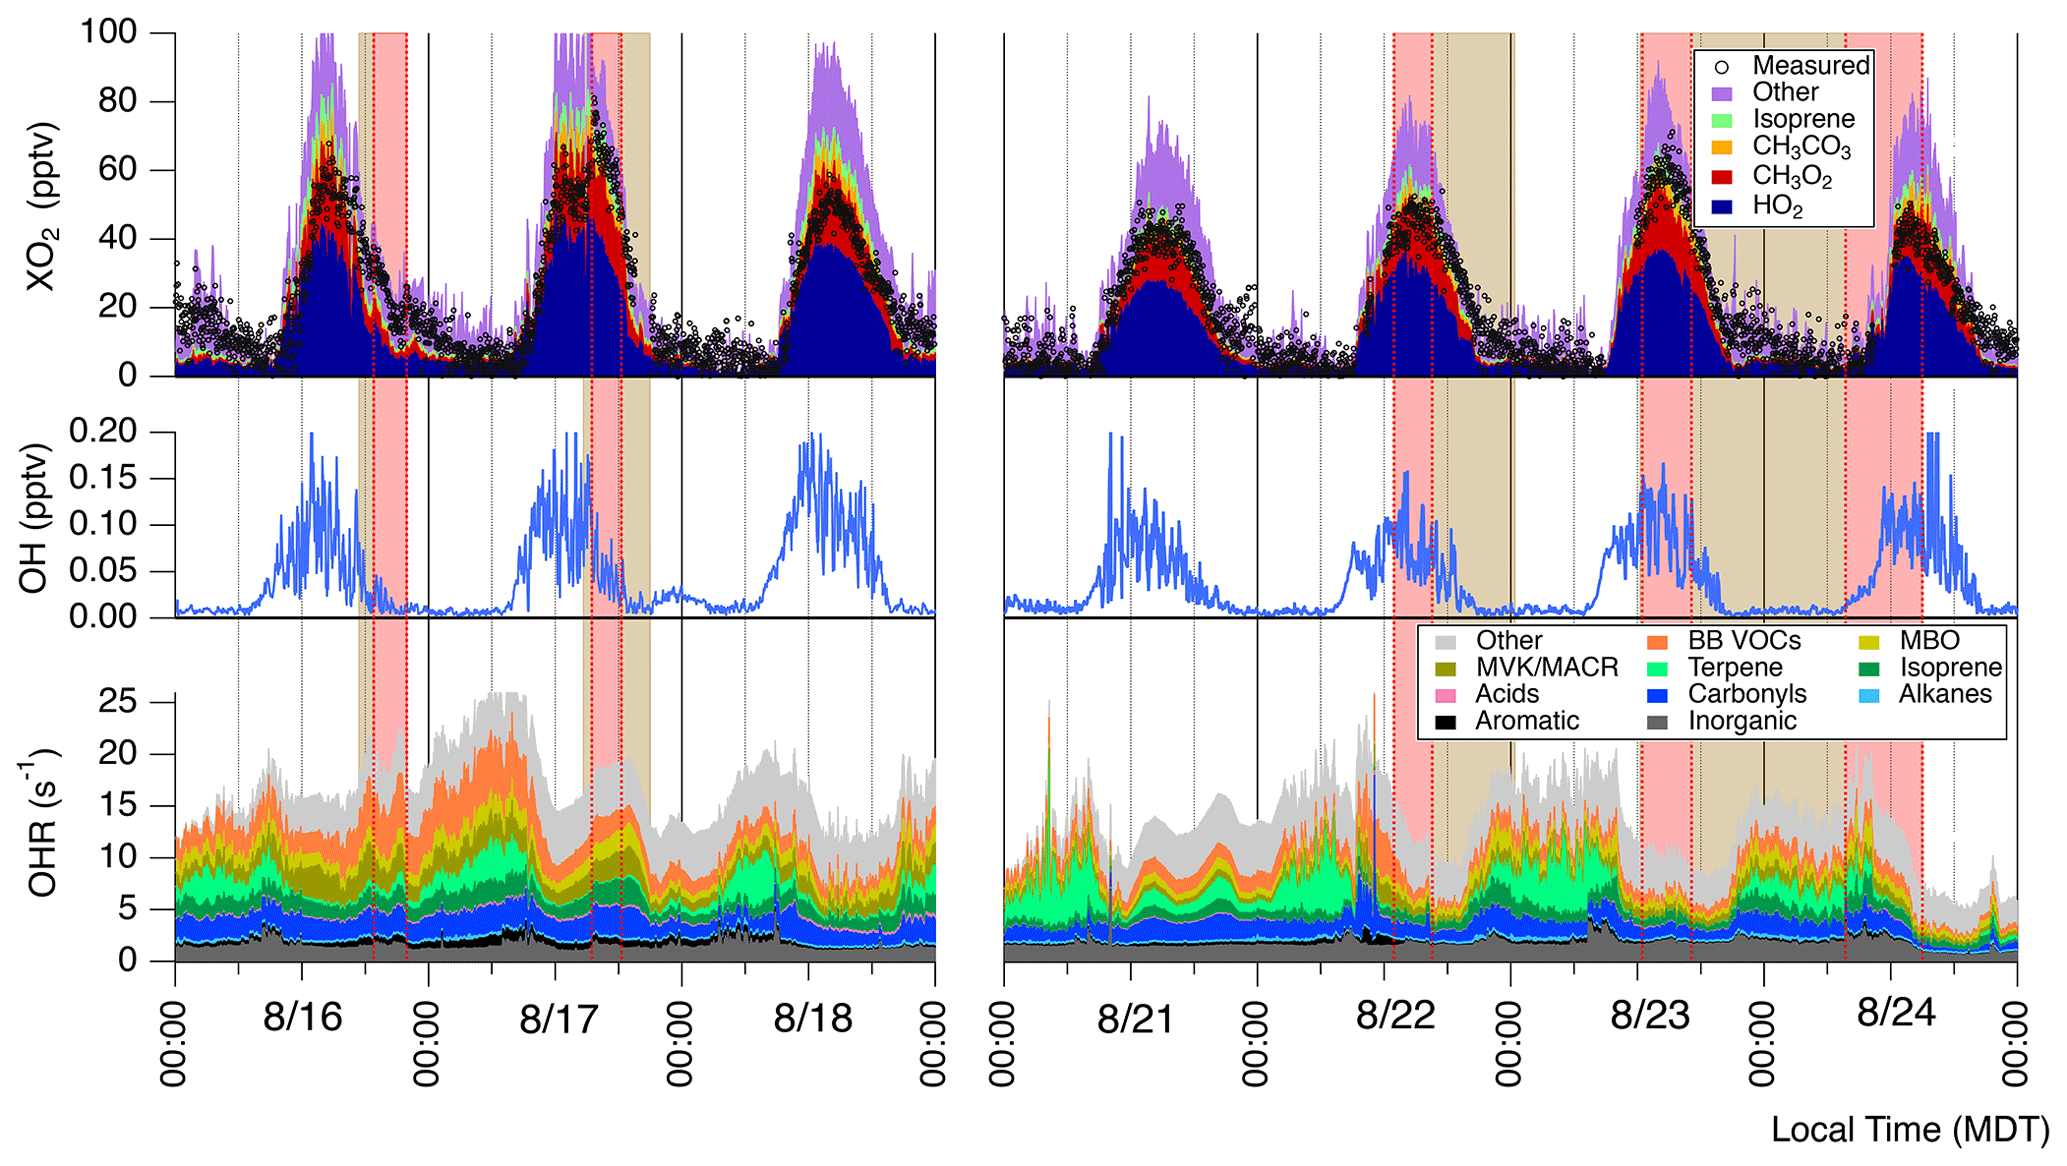
Figure 6Time series of modeled OH, HO2, speciated RO2, and OH reactivity (OHR). These results were acquired using the MCM-BBVOC mechanism. Periods of smoke are shaded as per Fig. 2. Measured XO2 is included as black markers for comparison. Note that the isoprene XO2 category includes several RO2 species produced from isoprene oxidation.
Figure 8 shows modeled ROx production and termination acquired using MCM-BBVOC-het mechanism for the period of 16 through 18 August. ROx production is sorted into several categories, and only net rates are provided for reversible processes (e.g., net decomposition of peroxy nitrates). The sum of measurement-based P(ROx), comprising the reaction of O(1D) with H2O and the photolysis of HCHO, CH3CHO, and acetone, is overlaid in Fig. 8 (shown speciated in Fig. 3) and typically accounts for between 50 %–60 % of total modeled values. For modeled P(ROx), O(1D) + H2O and HCHO photolysis both contribute ∼25 % of predicted ROx production during midday. Photolysis of carbonyls accounts for most of the remaining modeled daytime P(ROx), though only a fraction (less than 15 %) of this category is from the measured carbonyl compounds acetaldehyde and acetone. Unmeasured carbonyls account for the rest, with methylglyoxal and glycolaldehyde accounting for 26 % and 8 %, respectively. Predicted methylglyoxal concentrations were typically between 0.4 and 0.6 ppbv. These concentrations are about an order of magnitude greater than those measured at mountaintop sites (Mitsuishi et al., 2018; Kawamura et al., 2013) but lower than those observed at a suburban site in China (Liu et al., 2020) and in biomass burning plumes observed in the Amazon (Kluge et al., 2020). Methylglyoxal is largely formed from the oxidation of MVK and MACR, themselves oxidation products of isoprene. A BB-VOC-related dicarbonyl, 4-oxo-2-pentenal (listed as C5DICARB within MCM), which is formed from methyl furan oxidation, accounted for 13 % of P(ROx) from carbonyl photolysis. Photolysis of acids and alcohols contributes up to ∼10 % of modeled P(ROx). Nighttime P(ROx) is typically ∼0.1 pptv s−1 and is primarily from alkene ozonolysis (>80 %) and the reaction of alkenes with NO3. Net formation of peroxy nitrates RO2NO2, mainly PAN, was the dominant modeled ROx sink from the morning until ∼12:00 MDT most days. Given that neither PAN nor the acetyl peroxy radical (CH3CO3) was directly measured and that a zero-dimensional model cannot be expected to accurately model PAN concentrations due to its long lifetime, this result is highly uncertain. Midday ROx termination was dominated by ROx self-reactions, with ∼75 % of L(ROx) from HO2 + RO2 and the remainder of L(ROx) almost entirely from HO2 + HO2. Reactions between RO2 and other RO2 played a comparatively minor role (<5 % L(ROx)). Other L(ROx) categories consisted of reactions of RO2 + NO, RO + NO2, and OH + NO2. Heterogeneous uptake of HO2 generally had small contributions to L(ROx) but at times of elevated PM concentrations such as the BB-influenced periods 17, 23, and 24 August accounted for up to ∼10 % of total ROx termination (see Sect. 3.4 for further discussion). Results from the 21 through 24 August period (see Fig. S17) are similar to the results presented above for 16–18 August, though the unmeasured portion of P(ROx) is smaller for the former. This resulted from the considerably smaller concentrations of MVK, MACR, isoprene, and BB VOCs measured during this period. The smaller portions for the carbonyls and “alcohols, acids” categories led to smaller P(ROx) totals that peaked near 0.7 pptv s−1 rather than the calculated 1.2 pptv s−1 for the period shown in Fig. 8.

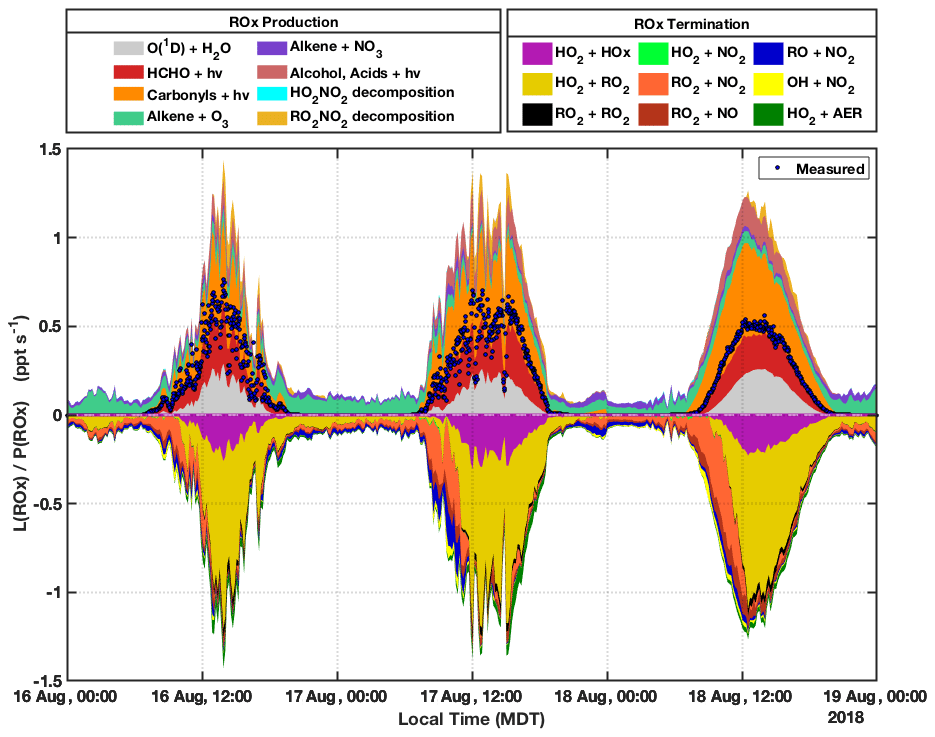
Figure 8Modeled ROx production and termination for 16, 17, and 18 August. The results provided were modeled with F0AM using the MCM-BBVOC-het mechanism. Net rates are provided for reversible processes. ROx termination L(ROx) and ROx production P(ROx) are separated into several straightforward categories as represented in their respective legends. Heterogeneous HO2 loss is represented by the HO2 + AER (AER = aerosol) category. P(ROx) derived from direct measurements, as presented in Fig. 3, is shown for comparison and is represented by the blue markers. The modeled results are shown in 10 min intervals and were averaged from the 2 min basis, while measurement-based P(ROx) is shown in 2 min intervals.
3.4 Model sensitivity
There are important fundamental limitations to how well a zero-dimensional model can describe the McCall measurements. Concentrations of several radical precursors such as nitrous acid, glycolaldehyde, methylglyoxal, and glyoxal were not constrained by measurements and were instead determined by the model. For days on which dilute biomass burning plumes arrived suddenly, it is unrealistic to expect that the model can accurately determine the concentrations of these compounds which depend on the history of the air mass. XO2 predictions are sensitive to several model inputs. Since some secondary compounds' concentrations build up in the model and can drive significant ROx production, we explore the sensitivity of model XO2 predictions to the first-order dilution rate constant applied to all compounds. Shortening the dilution lifetime from 24 to 6 h (the minimum value suggested by Wolfe et al., 2016) decreases model XO2 predictions and reduces the GEOS-Chem XO2 overprediction from 20 % to 2 % (Fig. S15). The most important unmeasured radical precursors that are affected by this dilution are methylglyoxal, glycolaldehyde, and 4-oxo-2-pentenal due to their collective contribution to P(ROx). We also investigate model XO2 sensitivity to NOx. Increasing NOx inputs by 50 % decreases peak daily XO2 predictions by roughly 10 %.
As the 15 pptv increase in [XO2] observed on 17 August is not captured by model simulations, we include HONO as an additional model constraint in additional GEOS-Chem simulations (see Sect. S8). Constrained HONO concentrations were determined by the product of selected values to the measured CO mixing ratios during BB periods. To achieve a similar ∼15 pptv XO2 enhancement as measured during the 17 August BB event, a HONO enhancement ratio of near 3 pptv ppbv−1 is required, which provides an additional 0.15–0.60 ppbv HONO throughout the BB period. This value is 30 times larger than observed by Peng et al. (2020) for similarly aged plumes. While this value is likely unrealistic, larger ratios have been reported by Peng et al. (2020). Other unmeasured ROx precursors were likely present and at least partially responsible for the elevated XO2 concentrations observed.
Model sensitivity to heterogeneous HO2 uptake was also investigated. The introduction of heterogeneous losses of HO2 had overall minimal impacts (see Fig. 7 MCM-BBVOC-het results), even though a fairly high HO2 uptake coefficient of 0.2 was used (Abbatt et al., 2012). Heterogeneous losses decreased modeled [OH] and [XO2] by an average of 3.4 % and 2.9 %, respectively, though the impact is more evident for smoke periods with elevated PM. Our analysis of HO2 heterogeneous uptake is limited by the uncertainty in the HO2 uptake coefficient and the specific surface area parameter. To investigate the sensitivity of model results to these parameters, these parameters were varied for several GEOS-Chem model simulations (see Figs. S9 and S10). We focus our heterogeneous chemistry sensitivity tests on a 40 min period during the 17 August BB event in which OA concentrations were 30 µg m−3. Inclusion of heterogeneous chemistry with standard parameter settings (γ=0.2) leads to a 11 % decrease in [HO2], whereas use of a much higher and likely unrealistic HO2 uptake coefficient of 0.5 resulted in a 25 % HO2 decrease. A similar HO2 decrease results from using a higher specific surface area of 10 m2 g−1. Use of a smaller HO2 uptake coefficient of 0.02 led to a nearly negligible decrease in [HO2]. Constraining the OA concentration at 100 µg m−3 for the same period – much higher than actually observed – leads to heterogeneous [HO2] loss of 3 % for an uptake coefficient of 0.02 and 30 % for an uptake coefficient of 0.2. The only conditions in which heterogeneous loss of HO2 to BB smoke would appear to be important would be for less dilute plumes ([OA]] >100 µg m−3) and a high uptake coefficient (γ>0.2).
Peroxy radicals were measured during the FIREX 2018 campaign in McCall, Idaho in order to better characterize ROx chemistry and study O3 formation within BB plumes. There were five distinct BB-influenced periods that were identified using smoke tracers, primarily HCN. HYSPLIT back trajectories were paired with satellite data to suggest smoke sources and plume age. Most smoke periods had distinct enhancements in O3, with enhancement ratios of up to 0.06 ppbv ppbv−1. Zero-dimensional box model results for XO2 were generally greater than measured XO2. These simulated results were acquired with F0AM using a variety of chemical mechanisms – GEOS-Chem, MCM, and two expanded versions of MCM. All model iterations followed the general trends observed for [XO2] measurements, though a measured 15 pptv XO2 enhancement during a 17 August BB event was not captured by any model iteration. This includes simulated results acquired using expanded versions of the MCM that had additional BB VOC chemistry and heterogeneous HO2 and OH losses intended to better capture BB influence. Heterogeneous losses overall had minimal impact on XO2, even though BB smoke periods with elevated organic PM levels often near 30 µg m−3 led to decreases in [HO2] by 10 %. Heterogeneous chemistry was investigated using a variety of HO2 uptake coefficients and aerosol specific surface areas. At the greatest settings, these variables led to decreases in HO2 of at most 25 % and 25 %, respectively, during a period with PM above 30 µg m−3. Both measured and modeled XO2 concentrations were used to calculate P(Ox). The presence of smoke had an overall negligible impact on P(Ox) as NOx enhancements were minimal.
Quantification of P(ROx) suffered from lack of constraints for several compounds including HONO, methylglyoxal, and glycolaldehyde. HONO photolysis likely contributed to the enhanced concentrations in [XO2] measured during the 17 August BB period, though a rather large value near 3.0 ppbv ppbv−1 is necessary for a similar XO2 enhancement. An additional gas-phase process in need of validation by measurements is the role of PAN formation as a ROx sink during the morning. The importance of unmeasured ROx precursors was especially sensitive to the first-order dilution rate constant applied to all unmeasured species. Finally, the role of heterogeneous HO2 uptake as a ROx sink would benefit from more direct measurements of particle size distribution and knowledge of HO2 uptake coefficients. Heterogeneous HO2 uptake was minimal for the dilute BB plumes studied here, and it would appear to only be important in less dilute BB plumes if the uptake coefficient is relatively high (e.g., 0.2).
Peroxy radical measurements are available at https://doi.org/10.26023/CY1Q-QT7V-G80R (Lindsay and Wood, 2022). Other supporting measurements are available at https://data.eol.ucar.edu/master_lists/generated/we-can/ (last access: 25 March 2022, EOL, 2022) and upon request.
The supplement related to this article is available online at: https://doi.org/10.5194/acp-22-4909-2022-supplement.
AJL and ECW wrote the manuscript. All authors discussed results and commented on the manuscript. AJL, ECW, and DCA were responsible for XO2 measurements. JRR, CD, and SCH operated and were responsible for the O3 instrument and the TILDAS instruments for trace gases. FM, JEK, and WBK contributed with VOCUS measurements. RAW, YL, and AHG contributed with cTAG VOC measurements. EF and PLC were responsible for particle-phase measurements. TIY and SCH coordinated the ARI data analysis.
The contact author has declared that neither they nor their co-authors have any competing interests.
Publisher’s note: Copernicus Publications remains neutral with regard to jurisdictional claims in published maps and institutional affiliations.
We profoundly thank Michele Crester and the Brundage Mountain Company for the use of the Activity Barn in McCall, Idaho, as our sampling location. We acknowledge the work of additional scientists Leonid Nichman and Nathan Kreisberg for their operation and support of instruments in the field. We thank Eben Cross of QuantAQ, Inc. in Somerville, MA, for providing ARISense solar irradiance data. We also acknowledge Jason Curry, Connor Daube, and Salvador Cartagena of Aerodyne Research Inc. for their general assistance, including the transport of the mobile laboratories.
This research has been supported by the National Oceanic and Atmospheric Administration (grant nos. NA16OAR4310105, NA16OAR4310104, and NA16OAR4310107).
This paper was edited by Andreas Hofzumahaus and reviewed by three anonymous referees.
Abbatt, J., Lee, A., and Thornton, J.: Quantifying trace gas uptake to tropospheric aerosol: recent advances and remaining challenges, Chem. Soc. Rev., 41, 6555–6581, https://doi.org/10.1039/C2cs35052a, 2012.
Akagi, S. K., Craven, J. S., Taylor, J. W., McMeeking, G. R., Yokelson, R. J., Burling, I. R., Urbanski, S. P., Wold, C. E., Seinfeld, J. H., Coe, H., Alvarado, M. J., and Weise, D. R.: Evolution of trace gases and particles emitted by a chaparral fire in California, Atmos. Chem. Phys., 12, 1397–1421, https://doi.org/10.5194/acp-12-1397-2012, 2012.
Alvarado, M. J., Logan, J. A., Mao, J., Apel, E., Riemer, D., Blake, D., Cohen, R. C., Min, K.-E., Perring, A. E., Browne, E. C., Wooldridge, P. J., Diskin, G. S., Sachse, G. W., Fuelberg, H., Sessions, W. R., Harrigan, D. L., Huey, G., Liao, J., Case-Hanks, A., Jimenez, J. L., Cubison, M. J., Vay, S. A., Weinheimer, A. J., Knapp, D. J., Montzka, D. D., Flocke, F. M., Pollack, I. B., Wennberg, P. O., Kurten, A., Crounse, J., Clair, J. M. St., Wisthaler, A., Mikoviny, T., Yantosca, R. M., Carouge, C. C., and Le Sager, P.: Nitrogen oxides and PAN in plumes from boreal fires during ARCTAS-B and their impact on ozone: an integrated analysis of aircraft and satellite observations, Atmos. Chem. Phys., 10, 9739–9760, https://doi.org/10.5194/acp-10-9739-2010, 2010.
Alvarado, M. J., Lonsdale, C. R., Yokelson, R. J., Akagi, S. K., Coe, H., Craven, J. S., Fischer, E. V., McMeeking, G. R., Seinfeld, J. H., Soni, T., Taylor, J. W., Weise, D. R., and Wold, C. E.: Investigating the links between ozone and organic aerosol chemistry in a biomass burning plume from a prescribed fire in California chaparral, Atmos. Chem. Phys., 15, 6667–6688, https://doi.org/10.5194/acp-15-6667-2015, 2015.
Anderson, D. C., Pavelec, J., Daube, C., Herndon, S. C., Knighton, W. B., Lerner, B. M., Roscioli, J. R., Yacovitch, T. I., and Wood, E. C.: Characterization of ozone production in San Antonio, Texas, using measurements of total peroxy radicals, Atmos. Chem. Phys., 19, 2845–2860, https://doi.org/10.5194/acp-19-2845-2019, 2019.
Baker, K., Woody, M., Tonnesen, G., Hutzell, W., Pye, H., Beaver, M., Pouliot, G., and Pierce, T.: Contribution of regional-scale fire events to ozone and PM2.5 air quality estimated by photochemical modeling approaches, Atmos. Environ., 140, 539–554, https://doi.org/10.1016/j.atmosenv.2016.06.032, 2016.
Baylon, P., Jaffe, D., Hall, S., Ullmann, K., Alvarado, M., and Lefer, B.: Impact of biomass burning plumes on photolysis rates and ozone formation at the Mount Bachelor Observatory, J. Geophys. Res.-Atmos., 123, 2272–2284, https://doi.org/10.1002/2017JD027341, 2018.
Bell, M. L., Peng, R. D., and Dominici, F.: The exposure–response curve for ozone and risk of mortality and the adequacy of current ozone regulations, Environmental health perspectives, Environ. Health Persp., 114, 532–536, https://doi.org/10.1289/ehp.8816, 2006.
Burling, I. R., Yokelson, R. J., Griffith, D. W. T., Johnson, T. J., Veres, P., Roberts, J. M., Warneke, C., Urbanski, S. P., Reardon, J., Weise, D. R., Hao, W. M., and de Gouw, J.: Laboratory measurements of trace gas emissions from biomass burning of fuel types from the southeastern and southwestern United States, Atmos. Chem. Phys., 10, 11115–11130, https://doi.org/10.5194/acp-10-11115-2010, 2010.
Butkovskaya, N., Rayez, M.-T., Rayez, J.-C., Kukui, A., and Le Bras, G.: Water vapor effect on the HNO3 yield in the HO2+NO reaction: experimental and theoretical evidence, J. Phys. Chem. A, 113, 11327–11342, https://doi.org/10.1021/jp811428p, 2009.
CAL-FIRE Camp Fire: https://www.fire.ca.gov/incident/?incident=75dafe80-f18a-4a4a-9a37-4b564c5f6014, last access: 18 August 2021.
Canagaratna, M., Jayne, J., Jimenez, J., Allan, J., Alfarra, M., Zhang, Q., Onasch, T., Drewnick, F., Coe, H., and Middlebrook, A.: Chemical and microphysical characterization of ambient aerosols with the aerodyne aerosol mass spectrometer, Mass Spectrom. Rev., 26, 185–222, https://doi.org/10.1002/mas.20115, 2007.
Cardil, A., De-Miguel, S., Silva, C. A., Reich, P. B., Calkin, D., Brancalion, P. H., Vibrans, A. C., Gamarra, J. G., Zhou, M., and Pijanowski, B. C.: Recent deforestation drove the spike in Amazonian fires, Environ. Res. Lett., 15, 121003, https://doi.org/10.1088/1748-9326/abcac7, 2020.
Coggon, M. M., Veres, P. R., Yuan, B., Koss, A., Warneke, C., Gilman, J. B., Lerner, B. M., Peischl, J., Aikin, K. C., and Stockwell, C. E.: Emissions of nitrogen-containing organic compounds from the burning of herbaceous and arboraceous biomass: Fuel composition dependence and the variability of commonly used nitrile tracers, Geophys. Res. Lett., 43, 9903–9912, https://doi.org/10.1002/2016GL070562, 2016.
Coggon, M. M., Lim, C. Y., Koss, A. R., Sekimoto, K., Yuan, B., Gilman, J. B., Hagan, D. H., Selimovic, V., Zarzana, K. J., Brown, S. S., Roberts, J. M., Müller, M., Yokelson, R., Wisthaler, A., Krechmer, J. E., Jimenez, J. L., Cappa, C., Kroll, J. H., de Gouw, J., and Warneke, C.: OH chemistry of non-methane organic gases (NMOGs) emitted from laboratory and ambient biomass burning smoke: evaluating the influence of furans and oxygenated aromatics on ozone and secondary NMOG formation, Atmos. Chem. Phys., 19, 14875–14899, https://doi.org/10.5194/acp-19-14875-2019, 2019.
Cooper, O. R., Gao, R. S., Tarasick, D., Leblanc, T., and Sweeney, C.: Long-term ozone trends at rural ozone monitoring sites across the United States, 1990–2010, J. Geophys. Res.-Atmos., 117, https://doi.org/10.1029/2012JD018261, 2012.
Cross, E. S., Williams, L. R., Lewis, D. K., Magoon, G. R., Onasch, T. B., Kaminsky, M. L., Worsnop, D. R., and Jayne, J. T.: Use of electrochemical sensors for measurement of air pollution: correcting interference response and validating measurements, Atmos. Meas. Tech., 10, 3575–3588, https://doi.org/10.5194/amt-10-3575-2017, 2017.
de Gouw, J. A., Warneke, C., Stohl, A., Wollny, A., Brock, C., Cooper, O., Holloway, J., Trainer, M., Fehsenfeld, F., and Atlas, E. L.: Volatile organic compounds composition of merged and aged forest fire plumes from Alaska and western Canada, J. Geophys. Res.-Atmos., 111, D10303, https://doi.org/10.1029/2005JD006175, 2006.
Decker, Z. C., Zarzana, K. J., Coggon, M., Min, K.-E., Pollack, I., Ryerson, T. B., Peischl, J., Edwards, P., Dubeì, W. P., and Markovic, M. Z.: Nighttime chemical transformation in biomass burning plumes: a box model analysis initialized with aircraft observations, Environ. Sci. Technol., 53, 2529–2538, https://doi.org/10.1021/acs.est.8b05359, 2019.
DeFlorio-Barker, S., Crooks, J., Reyes, J., and Rappold, A. G.: Cardiopulmonary effects of fine particulate matter exposure among older adults, during wildfire and non-wildfire periods, in the United States 2008–2010, Environ. Health Persp., 127, 037006, https://doi.org/10.1289/EHP3860, 2019.
EOL: WE-CAN Data Sets, UCAR/NCAR – Earth Observing Laboratory [data set], https://data.eol.ucar.edu/master_lists/generated/we-can/, last access: 25 March 2022.
Fisher, J. A., Jacob, D. J., Travis, K. R., Kim, P. S., Marais, E. A., Chan Miller, C., Yu, K., Zhu, L., Yantosca, R. M., Sulprizio, M. P., Mao, J., Wennberg, P. O., Crounse, J. D., Teng, A. P., Nguyen, T. B., St. Clair, J. M., Cohen, R. C., Romer, P., Nault, B. A., Wooldridge, P. J., Jimenez, J. L., Campuzano-Jost, P., Day, D. A., Hu, W., Shepson, P. B., Xiong, F., Blake, D. R., Goldstein, A. H., Misztal, P. K., Hanisco, T. F., Wolfe, G. M., Ryerson, T. B., Wisthaler, A., and Mikoviny, T.: Organic nitrate chemistry and its implications for nitrogen budgets in an isoprene- and monoterpene-rich atmosphere: constraints from aircraft (SEAC4RS) and ground-based (SOAS) observations in the Southeast US, Atmos. Chem. Phys., 16, 5969–5991, https://doi.org/10.5194/acp-16-5969-2016, 2016.
Folkins, I., Wennberg, P., Hanisco, T., Anderson, J., and Salawitch, R.: OH, HO2, and NO in two biomass burning plumes: Sources of HOx and implications for ozone production, Geophys. Res. Lett., 24, 3185–3188, https://doi.org/10.1029/97GL03047, 1997.
FWAC Mesa Fire: https://www.fireweatheravalanche.org/wildfire/incident/50013/idaho/mesa-fire, last access: 8 August 2021b.
FWAC Rabbit Foot Fire: https://www.fireweatheravalanche.org/wildfire/incident/51954/idaho/rabbit-foot-fire, last access: 5 July 2021a.
FWAC Rattlesnake Creek Fire: https://www.fireweatheravalanche.org/wildfire/incident/48778/idaho/rattlesnake-creek-fire, last access: 18 August 2021c.
Gaudel, A., Cooper, O. R., Chang, K.-L., Bourgeois, I., Ziemke, J. R., Strode, S. A., Oman, L. D., Sellitto, P., Nédélec, P., and Blot, R.: Aircraft observations since the 1990s reveal increases of tropospheric ozone at multiple locations across the Northern Hemisphere, Sci. Adv., 6, eaba8272, https://doi.org/10.1126/sciadv.aba8272, 2020.
Gong, X., Kaulfus, A., Nair, U., and Jaffe, D. A.: Quantifying O3 Impacts in Urban Areas Due to Wildfires Using a Generalized Additive Model, Environ. Sci. Technol., 51, 13216–13223, https://doi.org/10.1021/acs.est.7b03130, 2017.
Goss, M., Swain, D. L., Abatzoglou, J. T., Sarhadi, A., Kolden, C. A., Williams, A. P., and Diffenbaugh, N. S.: Climate change is increasing the likelihood of extreme autumn wildfire conditions across California, Environ. Res. Lett., 15, 094016, https://doi.org/10.1088/1748-9326/ab83a7, 2020.
Halofsky, J. E., Peterson, D. L., and Harvey, B. J.: Changing wildfire, changing forests: the effects of climate change on fire regimes and vegetation in the Pacific Northwest, USA, Fire Ecol., 16, 4, https://doi.org/10.1186/s42408-019-0062-8, 2020.
Hatoya, K., Okuda, T., Funato, K., and Inoue, K.: On-line measurement of the surface area concentration of aerosols in Yokohama, Japan, using the diffusion charging method, Asian J. Atmos. Environ., 10, 1–12, https://doi.org/10.5572/ajae.2016.10.1.001, 2016.
Herndon, S. C., Jayne, J. T., Zahniser, M. S., Worsnop, D. R., Knighton, B., Alwine, E., Lamb, B. K., Zavala, M., Nelson, D. D., and McManus, J. B.: Characterization of urban pollutant emission fluxes and ambient concentration distributions using a mobile laboratory with rapid response instrumentation, Faraday Discuss., 130, 327–339, https://doi.org/10.1039/b500411j, 2005.
Hobbs, P. V., Sinha, P., Yokelson, R. J., Christian, T. J., Blake, D. R., Gao, S., Kirchstetter, T. W., Novakov, T., and Pilewskie, P.: Evolution of gases and particles from a savanna fire in South Africa, J. Geophys. Res.-Atmos., 108, 8485, https://doi.org/10.1029/2002JD002352, 2003.
Hornbrook, R. S., Crawford, J. H., Edwards, G. D., Goyea, O., Mauldin III, R. L., Olson, J. S., and Cantrell, C. A.: Measurements of tropospheric HO2 and RO2 by oxygen dilution modulation and chemical ionization mass spectrometry, Atmos. Meas. Tech., 4, 735–756, https://doi.org/10.5194/amt-4-735-2011, 2011.
Huntzicker, J. J. and Johnson, R. L.: Investigation of an ambient interference in the measurement of ozone by ultraviolet absorption photometry, Environ. Sci. Technol., 13, 1414–1416, https://doi.org/10.1021/es60159a005, 1979.
Jacob, D. J.: Heterogeneous chemistry and tropospheric ozone, Atmos. Environ., 34, 2131–2159, https://doi.org/10.1016/S1352-2310(99)00462-8, 2000.
Jacob, D. J. and Winner, D. A.: Effect of climate change on air quality, Atmos. Environ., 43, 51–63, https://doi.org/10.1016/j.atmosenv.2008.09.051, 2009.
Jaffe, D. A. and Wigder, N. L.: Ozone production from wildfires: A critical review, Atmos. Environ., 51, 1–10, https://doi.org/10.1016/j.atmosenv.2011.11.063, 2012.
Jenkin, M. E., Saunders, S. M., Wagner, V., and Pilling, M. J.: Protocol for the development of the Master Chemical Mechanism, MCM v3 (Part B): tropospheric degradation of aromatic volatile organic compounds, Atmos. Chem. Phys., 3, 181–193, https://doi.org/10.5194/acp-3-181-2003, 2003.
Jenkin, M. E., Young, J. C., and Rickard, A. R.: The MCM v3.3.1 degradation scheme for isoprene, Atmos. Chem. Phys., 15, 11433–11459, https://doi.org/10.5194/acp-15-11433-2015, 2015.
Jerrett, M., Burnett, R. T., Pope III, C. A., Ito, K., Thurston, G., Krewski, D., Shi, Y., Calle, E., and Thun, M.: Long-term ozone exposure and mortality, New Engl. J. Medicine, 360, 1085–1095, https://doi.org/10.1056/NEJMoa0803894, 2009.
Kawamura, K., Okuzawa, K., Aggarwal, S. G., Irie, H., Kanaya, Y., and Wang, Z.: Determination of gaseous and particulate carbonyls (glycolaldehyde, hydroxyacetone, glyoxal, methylglyoxal, nonanal and decanal) in the atmosphere at Mt. Tai, Atmos. Chem. Phys., 13, 5369–5380, https://doi.org/10.5194/acp-13-5369-2013, 2013.
Kebabian, P. L., Wood, E. C., Herndon, S. C., and Freedman, A.: A practical alternative to chemiluminescence-based detection of nitrogen dioxide: Cavity attenuated phase shift spectroscopy, Environ. Sci. Tech., 42, 6040–6045, https://doi.org/10.1021/es703204j, 2008.
Kim, P. S., Jacob, D. J., Fisher, J. A., Travis, K., Yu, K., Zhu, L., Yantosca, R. M., Sulprizio, M. P., Jimenez, J. L., Campuzano-Jost, P., Froyd, K. D., Liao, J., Hair, J. W., Fenn, M. A., Butler, C. F., Wagner, N. L., Gordon, T. D., Welti, A., Wennberg, P. O., Crounse, J. D., St. Clair, J. M., Teng, A. P., Millet, D. B., Schwarz, J. P., Markovic, M. Z., and Perring, A. E.: Sources, seasonality, and trends of southeast US aerosol: an integrated analysis of surface, aircraft, and satellite observations with the GEOS-Chem chemical transport model, Atmos. Chem. Phys., 15, 10411–10433, https://doi.org/10.5194/acp-15-10411-2015, 2015.
Kluge, F., Hüneke, T., Knecht, M., Lichtenstern, M., Rotermund, M., Schlager, H., Schreiner, B., and Pfeilsticker, K.: Profiling of formaldehyde, glyoxal, methylglyoxal, and CO over the Amazon: normalized excess mixing ratios and related emission factors in biomass burning plumes, Atmos. Chem. Phys., 20, 12363–12389, https://doi.org/10.5194/acp-20-12363-2020, 2020.
Koss, A. R., Sekimoto, K., Gilman, J. B., Selimovic, V., Coggon, M. M., Zarzana, K. J., Yuan, B., Lerner, B. M., Brown, S. S., Jimenez, J. L., Krechmer, J., Roberts, J. M., Warneke, C., Yokelson, R. J., and de Gouw, J.: Non-methane organic gas emissions from biomass burning: identification, quantification, and emission factors from PTR-ToF during the FIREX 2016 laboratory experiment, Atmos. Chem. Phys., 18, 3299–3319, https://doi.org/10.5194/acp-18-3299-2018, 2018.
Krechmer, J., Lopez-Hilfiker, F., Koss, A., Hutterli, M., Stoermer, C., Deming, B., Kimmel, J., Warneke, C., Holzinger, R., and Jayne, J.: Evaluation of a new reagent-ion source and focusing ion–molecule reactor for use in proton-transfer-reaction mass spectrometry, Anal. Chem., 90, 12011–12018, https://doi.org/10.1021/acs.analchem.8b02641, 2018.
Li, Q., Jacob, D. J., Bey, I., Yantosca, R. M., Zhao, Y., Kondo, Y., and Notholt, J.: Atmospheric hydrogen cyanide (HCN): Biomass burning source, ocean sink?, Geophys. Res. Lett., 27, 357–360, https://doi.org/10.1029/1999GL010935, 2000.
Lindaas, J., Farmer, D. K., Pollack, I. B., Abeleira, A., Flocke, F., Roscioli, R., Herndon, S., and Fischer, E. V.: Changes in ozone and precursors during two aged wildfire smoke events in the Colorado Front Range in summer 2015, Atmos. Chem. Phys., 17, 10691–10707, https://doi.org/10.5194/acp-17-10691-2017, 2017.
Lindsay, A. and Wood, E.: Drexel ECHAMP (Ethane CHemical AMPlification) total peroxy radical data Version 1, UCAR/NCAR – Earth Observing Laboratory [data set], https://doi.org/10.26023/CY1Q-QT7V-G80R, last access: 25 March 2022.
Liu, J., Li, X., Li, D., Xu, R., Gao, Y., Chen, S., Liu, Y., Zhao, G., Wang, H., and Wang, H.: Observations of glyoxal and methylglyoxal in a suburban area of the Yangtze River Delta, China, Atmos. Environ., 238, 117727, https://doi.org/10.1016/j.atmosenv.2020.117727, 2020.
Liu, J. C., Pereira, G., Uhl, S. A., Bravo, M. A., and Bell, M. L.: A systematic review of the physical health impacts from non-occupational exposure to wildfire smoke, Environ. Res., 136, 120–132, https://doi.org/10.1016/j.envres.2014.10.015, 2015.
Liu, J. C., Mickley, L. J., Sulprizio, M. P., Dominici, F., Yue, X., Ebisu, K., Anderson, G. B., Khan, R. F., Bravo, M. A., and Bell, M. L.: Particulate air pollution from wildfires in the Western US under climate change, Clim. Change, 138, 655–666, https://doi.org/10.1007/s10584-016-1762-6, 2016.
Liu, X., Zhang, Y., Huey, L., Yokelson, R., Wang, Y., Jimenez, J., Campuzano-Jost, P., Beyersdorf, A., Blake, D., and Choi, Y.: Agricultural fires in the southeastern US during SEAC4RS: Emissions of trace gases and particles and evolution of ozone, reactive nitrogen, and organic aerosol, J. Geophys. Res.-Atmos., 121, 7383–7414, https://doi.org/10.1002/2016JD025040, 2016.
Long, R. W., Whitehill, A., Habel, A., Urbanski, S., Halliday, H., Colón, M., Kaushik, S., and Landis, M. S.: Comparison of ozone measurement methods in biomass burning smoke: an evaluation under field and laboratory conditions, Atmos. Meas. Tech., 14, 1783–1800, https://doi.org/10.5194/amt-14-1783-2021, 2021.
Mao, J., Paulot, F., Jacob, D. J., Cohen, R. C., Crounse, J. D., Wennberg, P. O., Keller, C. A., Hudman, R. C., Barkley, M. P., and Horowitz, L. W.: Ozone and organic nitrates over the eastern United States: Sensitivity to isoprene chemistry, J. Geophys. Res.-Atmos., 118, 11256–211268, https://doi.org/10.1002/jgrd.50817, 2013.
Marais, E. A., Jacob, D. J., Jimenez, J. L., Campuzano-Jost, P., Day, D. A., Hu, W., Krechmer, J., Zhu, L., Kim, P. S., Miller, C. C., Fisher, J. A., Travis, K., Yu, K., Hanisco, T. F., Wolfe, G. M., Arkinson, H. L., Pye, H. O. T., Froyd, K. D., Liao, J., and McNeill, V. F.: Aqueous-phase mechanism for secondary organic aerosol formation from isoprene: application to the southeast United States and co-benefit of SO2 emission controls, Atmos. Chem. Phys., 16, 1603–1618, https://doi.org/10.5194/acp-16-1603-2016, 2016.
Mason, S. A., Field, R. J., Yokelson, R. J., Kochivar, M. A., Tinsley, M. R., Ward, D. E., and Hao, W. M.: Complex effects arising in smoke plume simulations due to inclusion of direct emissions of oxygenated organic species from biomass combustion, J. Geophys. Res.-Atmos., 106, 12527–12539, https://doi.org/10.1029/2001JD900003, 2001.
McManus, J., Zahniser, M., Nelson, D., Shorter, J., Herndon, S., Jervis, D., Agnese, M., McGovern, R., Yacovitch, T., and Roscioli, J.: Recent progress in laser-based trace gas instruments: performance and noise analysis, Appl. Phys. B, 119, 203–218, https://doi.org/10.1007/s00340-015-6033-0, 2015.
Mihele, C. and Hastie, D.: The sensitivity of the radical amplifier to ambient water vapour, Geophys. Res. Lett., 25, 1911–1913, https://doi.org/10.1029/98GL01432, 1998.
Mitsuishi, K., Iwasaki, M., Takeuchi, M., Okochi, H., Kato, S., Ohira, S.-I., and Toda, K.: Diurnal variations in partitioning of atmospheric glyoxal and methylglyoxal between gas and particles at the ground level and in the free troposphere, ACS Earth Space Chem., 2, 915–924, https://doi.org/10.1021/acsearthspacechem.8b00037, 2018.
Müller, M., Anderson, B. E., Beyersdorf, A. J., Crawford, J. H., Diskin, G. S., Eichler, P., Fried, A., Keutsch, F. N., Mikoviny, T., Thornhill, K. L., Walega, J. G., Weinheimer, A. J., Yang, M., Yokelson, R. J., and Wisthaler, A.: In situ measurements and modeling of reactive trace gases in a small biomass burning plume, Atmos. Chem. Phys., 16, 3813–3824, https://doi.org/10.5194/acp-16-3813-2016, 2016.
Ng, N. L., Herndon, S. C., Trimborn, A., Canagaratna, M. R., Croteau, P., Onasch, T. B., Sueper, D., Worsnop, D. R., Zhang, Q., and Sun, Y.: An Aerosol Chemical Speciation Monitor (ACSM) for routine monitoring of the composition and mass concentrations of ambient aerosol, Aerosol Sci. Technol., 45, 780–794, https://doi.org/10.1080/02786826.2011.560211, 2011.
NIFC Suppression Costs: https://www.nifc.gov/fireInfo/fireInfo_documents/SuppCosts.pdf (last access: 1 November 2020), 2019.
NOAA Hazard Mapping System Fire and Smoke Product: https://www.ospo.noaa.gov/Products/land/hms.html{#}data, last access: 24 June 2021.
Park, S. K., O'Neill, M. S., Vokonas, P. S., Sparrow, D., and Schwartz, J.: Effects of air pollution on heart rate variability: the VA normative aging study, Environ. Health Persp., 113, 304–309, https://doi.org/10.1289/ehp.7447, 2004.
Parrington, M., Palmer, P. I., Lewis, A. C., Lee, J. D., Rickard, A. R., Di Carlo, P., Taylor, J. W., Hopkins, J. R., Punjabi, S., Oram, D. E., Forster, G., Aruffo, E., Moller, S. J., Bauguitte, S. J.-B., Allan, J. D., Coe, H., and Leigh, R. J.: Ozone photochemistry in boreal biomass burning plumes, Atmos. Chem. Phys., 13, 7321–7341, https://doi.org/10.5194/acp-13-7321-2013, 2013.
Peng, Q., Palm, B. B., Melander, K. E., Lee, B. H., Hall, S. R., Ullmann, K., Campos, T., Weinheimer, A., Apel, E., and Hornbrook, R. S.: HONO Emissions from Western US Wildfires Provide Dominant Radical Source in Fresh Wildfire Smoke, Environ. Sci. Technol., 54, 5954–5963, https://doi.org/10.1021/acs.est.0c00126, 2020.
Peng, Q., Palm, B. B., Fredrickson, C. D., Lee, B. H., Hall, S. R., Ullmann, K., Campos, T., Weinheimer, A. J., Apel, E. C., and Flocke, F.: Observations and Modeling of NOx Photochemistry and Fate in Fresh Wildfire Plumes, ACS Earth Space Chem., 5, 2652–2667, https://doi.org/10.1021/acsearthspacechem.1c00086, 2021.
Reichert, L., Andres Hernandez, M., Stöbener, D., Burkert, J., and Burrows, J.: Investigation of the effect of water complexes in the determination of peroxy radical ambient concentrations: Implications for the atmosphere, J. Geophys. Res.-Atmos., 108, 4–16, https://doi.org/10.1029/2002JD002152, 2003.
Reid, C. E., Brauer, M., Johnston, F. H., Jerrett, M., Balmes, J. R., and Elliott, C. T.: Critical review of health impacts of wildfire smoke exposure, Environ. Health Persp., 124, 1334–1343, https://doi.org/10.1289/ehp.1409277, 2016.
Roberts, J. M., Stockwell, C. E., Yokelson, R. J., de Gouw, J., Liu, Y., Selimovic, V., Koss, A. R., Sekimoto, K., Coggon, M. M., Yuan, B., Zarzana, K. J., Brown, S. S., Santin, C., Doerr, S. H., and Warneke, C.: The nitrogen budget of laboratory-simulated western US wildfires during the FIREX 2016 Fire Lab study, Atmos. Chem. Phys., 20, 8807–8826, https://doi.org/10.5194/acp-20-8807-2020, 2020.
Robinson, M. A., Decker, Z. C., Barsanti, K. C., Coggon, M. M., Flocke, F. M., Franchin, A., Fredrickson, C. D., Gilman, J. B., Gkatzelis, G. I., and Holmes, C. D.: Variability and time of day dependence of ozone photochemistry in western wildfire plumes, Environ. Sci. Technol., 55, 10280–10290, https://doi.org/10.1021/acs.est.1c01963, 2021.
Rogers, H. M., Ditto, J. C., and Gentner, D. R.: Evidence for impacts on surface-level air quality in the northeastern US from long-distance transport of smoke from North American fires during the Long Island Sound Tropospheric Ozone Study (LISTOS) 2018, Atmos. Chem. Phys., 20, 671–682, https://doi.org/10.5194/acp-20-671-2020, 2020.
Salvador, C. M. G., Tang, R., Priestley, M., Li, L., Tsiligiannis, E., Le Breton, M., Zhu, W., Zeng, L., Wang, H., Yu, Y., Hu, M., Guo, S., and Hallquist, M.: Ambient nitro-aromatic compounds – biomass burning versus secondary formation in rural China, Atmos. Chem. Phys., 21, 1389–1406, https://doi.org/10.5194/acp-21-1389-2021, 2021.
Saunders, S. M., Jenkin, M. E., Derwent, R. G., and Pilling, M. J.: Protocol for the development of the Master Chemical Mechanism, MCM v3 (Part A): tropospheric degradation of non-aromatic volatile organic compounds, Atmos. Chem. Phys., 3, 161–180, https://doi.org/10.5194/acp-3-161-2003, 2003.
Sillman, S., Logan, J. A., and Wofsy, S. C.: The sensitivity of ozone to nitrogen oxides and hydrocarbons in regional ozone episodes, J. Geophys. Res.-Atmos., 95, 1837–1851, https://doi.org/10.1029/JD095iD02p01837, 1990.
Silva, R. A., West, J. J., Zhang, Y., Anenberg, S. C., Lamarque, J.-F., Shindell, D. T., Collins, W. J., Dalsoren, S., Faluvegi, G., and Folberth, G.: Global premature mortality due to anthropogenic outdoor air pollution and the contribution of past climate change, Environ. Res. Lett., 8, 034005, https://doi.org/10.1088/1748-9326/8/3/034005, 2013.
Spracklen, D. V., Mickley, L. J., Logan, J. A., Hudman, R. C., Yevich, R., Flannigan, M. D., and Westerling, A. L.: Impacts of climate change from 2000 to 2050 on wildfire activity and carbonaceous aerosol concentrations in the western United States, J. Geophys. Res.-Atmos., 114, D20301, https://doi.org/10.1029/2008JD010966, 2009.
Stein, A., Draxler, R. R., Rolph, G. D., Stunder, B. J., Cohen, M., and Ngan, F.: NOAA's HYSPLIT atmospheric transport and dispersion modeling system, B. Am. Meteorol. Soc., 96, 2059–2077, https://doi.org/10.1175/BAMS-D-14-00110.1, 2015.
Stocker, T. F., Qin, D., Plattner, G.-K., Alexander, L. V., Allen, S. K., Bindoff, N. L., Bréon, F.-M., Church, J. A., Cubasch, U., and Emori, S.: Technical summary, in: Climate change 2013: the physical science basis. Contribution of Working Group I to the Fifth Assessment Report of the Intergovernmental Panel on Climate Change, Cambridge University Press, 33–115, 2013.
Stowell, J. D., Geng, G., Saikawa, E., Chang, H. H., Fu, J., Yang, C.-E., Zhu, Q., Liu, Y., and Strickland, M. J.: Associations of wildfire smoke PM2.5 exposure with cardiorespiratory events in Colorado 2011–2014, Environ. Int., 133, 105151, https://doi.org/10.1016/j.envint.2019.105151, 2019.
Tang, M. J., Cox, R. A., and Kalberer, M.: Compilation and evaluation of gas phase diffusion coefficients of reactive trace gases in the atmosphere: volume 1. Inorganic compounds, Atmos. Chem. Phys., 14, 9233–9247, https://doi.org/10.5194/acp-14-9233-2014, 2014.
Travis, K. R., Jacob, D. J., Fisher, J. A., Kim, P. S., Marais, E. A., Zhu, L., Yu, K., Miller, C. C., Yantosca, R. M., Sulprizio, M. P., Thompson, A. M., Wennberg, P. O., Crounse, J. D., St. Clair, J. M., Cohen, R. C., Laughner, J. L., Dibb, J. E., Hall, S. R., Ullmann, K., Wolfe, G. M., Pollack, I. B., Peischl, J., Neuman, J. A., and Zhou, X.: Why do models overestimate surface ozone in the Southeast United States?, Atmos. Chem. Phys., 16, 13561–13577, https://doi.org/10.5194/acp-16-13561-2016, 2016.
Turner, M. C., Jerrett, M., Pope III, C. A., Krewski, D., Gapstur, S. M., Diver, W. R., Beckerman, B. S., Marshall, J. D., Su, J., and Crouse, D. L.: Long-term ozone exposure and mortality in a large prospective study, American journal of respiratory and critical care medicine, 193, 1134–1142, https://doi.org/10.1164/rccm.201508-1633OC, 2016.
Wentworth, G. R., Aklilu, Y.-a., Landis, M. S., and Hsu, Y.-M.: Impacts of a large boreal wildfire on ground level atmospheric concentrations of PAHs, VOCs and ozone, Atmos. Environ., 178, 19–30, https://doi.org/10.1016/j.atmosenv.2018.01.013, 2018.
Wernis, R. A., Kreisberg, N. M., Weber, R. J., Liang, Y., Jayne, J., Hering, S., and Goldstein, A. H.: Development of an in situ dual-channel thermal desorption gas chromatography instrument for consistent quantification of volatile, intermediate-volatility and semivolatile organic compounds, Atmos. Meas. Tech., 14, 6533–6550, https://doi.org/10.5194/amt-14-6533-2021, 2021.
Wolfe, G. M., Marvin, M. R., Roberts, S. J., Travis, K. R., and Liao, J.: The Framework for 0-D Atmospheric Modeling (F0AM) v3.1, Geosci. Model Dev., 9, 3309–3319, https://doi.org/10.5194/gmd-9-3309-2016, 2016.
Wood, E. C., Deming, B. L., and Kundu, S.: Ethane-based chemical amplification measurement technique for atmospheric peroxy radicals, Environ. Sci. Technol. Lett., 4, 15–19, https://doi.org//10.1021/acs.estlett.6b00438, 2017.
Xu, L., Crounse, J. D., Vasquez, K. T., Allen, H., Wennberg, P. O., Bourgeois, I., Brown, S. S., Campuzano-Jost, P., Coggon, M. M., and Crawford, J. H.: Ozone chemistry in western US wildfire plumes, Sci. Adv., 7, eabl3648, https://doi.org/10.1126/sciadv.abl3648, 2021.
Yokelson, R. J., Griffith, D. W., and Ward, D. E.: Open-path Fourier transform infrared studies of large-scale laboratory biomass fires, J. Geophys. Res.-Atmos., 101, 21067–21080, https://doi.org/10.1029/96JD01800, 1996.
Yokelson, R. J., Crounse, J. D., DeCarlo, P. F., Karl, T., Urbanski, S., Atlas, E., Campos, T., Shinozuka, Y., Kapustin, V., Clarke, A. D., Weinheimer, A., Knapp, D. J., Montzka, D. D., Holloway, J., Weibring, P., Flocke, F., Zheng, W., Toohey, D., Wennberg, P. O., Wiedinmyer, C., Mauldin, L., Fried, A., Richter, D., Walega, J., Jimenez, J. L., Adachi, K., Buseck, P. R., Hall, S. R., and Shetter, R.: Emissions from biomass burning in the Yucatan, Atmos. Chem. Phys., 9, 5785–5812, https://doi.org/10.5194/acp-9-5785-2009, 2009.
York, D., Evensen, N. M., Martýnez, M. L., and De Basabe Delgado, J.: Unified equations for the slope, intercept, and standard errors of the best straight line, Am. J. Phys., 72, 367–375, https://doi.org/10.1119/1.1632486, 2004.
Yu, P., Xu, R., Abramson, M. J., Li, S., and Guo, Y.: Bushfires in Australia: a serious health emergency under climate change, Lancet Planet. Health, 4, e7–e8, https://doi.org/10.1016/S2542-5196(19)30267-0, 2020.
Yue, X., Mickley, L. J., Logan, J. A., and Kaplan, J. O.: Ensemble projections of wildfire activity and carbonaceous aerosol concentrations over the western United States in the mid-21st century, Atmos. Environ., 77, 767–780, https://doi.org/10.1016/j.atmosenv.2013.06.003, 2013.
Yue, X., Mickley, L. J., and Logan, J. A.: Projection of wildfire activity in southern California in the mid-twenty-first century, Clim. Dynam., 43, 1973–1991, https://doi.org/10.1007/s00382-013-2022-3, 2014.
Yue, X., Mickley, L. J., Logan, J. A., Hudman, R. C., Martin, M. V., and Yantosca, R. M.: Impact of 2050 climate change on North American wildfire: consequences for ozone air quality, Atmos. Chem. Phys., 15, 10033–10055, https://doi.org/10.5194/acp-15-10033-2015, 2015.