the Creative Commons Attribution 4.0 License.
the Creative Commons Attribution 4.0 License.
 | 07 Apr 2022
Observations of particle number size distributions and new particle formation in six Indian locations
Mathew Sebastian
Sobhan Kumar Kompalli
Vasudevan Anil Kumar
Sandhya Jose
S. Suresh Babu
Govindan Pandithurai
Sachchidanand Singh
Rakesh K. Hooda
Vijay K. Soni
Jeffrey R. Pierce
Ville Vakkari
Eija Asmi
Daniel M. Westervelt
Antti-Pekka Hyvärinen
Vijay P. Kanawade
Atmospheric new particle formation (NPF) is a crucial process driving aerosol number concentrations in the atmosphere; it can significantly impact the evolution of atmospheric aerosol and cloud processes. This study analyses at least 1 year of asynchronous particle number size distributions from six different locations in India. We also analyze the frequency of NPF and its contribution to cloud condensation nuclei (CCN) concentrations. We found that the NPF frequency has a considerable seasonal variability. At the measurement sites analyzed in this study, NPF frequently occurs in March–May (pre-monsoon, about 21 % of the days) and is the least common in October–November (post-monsoon, about 7 % of the days). Considering the NPF events in all locations, the particle formation rate (JSDS) varied by more than 2 orders of magnitude (0.001–0.6 cm−3 s−1) and the growth rate between the smallest detectable size and 25 nm (GRSDS-25 nm) by about 3 orders of magnitude (0.2–17.2 nm h−1). We found that JSDS was higher by nearly 1 order of magnitude during NPF events in urban areas than mountain sites. GRSDS did not show a systematic difference. Our results showed that NPF events could significantly modulate the shape of particle number size distributions and CCN concentrations in India. The contribution of a given NPF event to CCN concentrations was the highest in urban locations (4.3 × 103 cm−3 per event and 1.2 × 103 cm−3 per event for 50 and 100 nm, respectively) as compared to mountain background sites (2.7 × 103 cm−3 per event and 1.0 × 103 cm−3 per event, respectively). We emphasize that the physical and chemical pathways responsible for NPF and factors that control its contribution to CCN production require in situ field observations using recent advances in aerosol and its precursor gaseous measurement techniques.
- Article
(10176 KB) - Full-text XML
-
Supplement
(904 KB) - BibTeX
- EndNote


Cooling by atmospheric aerosols offsets a significant fraction of the radiative forcing of greenhouse gases (Paasonen et al., 2013) directly by scattering and absorbing solar radiation and indirectly by altering cloud microphysical properties via activation of cloud condensation nuclei (CCN; Rosenfeld et al., 2014; Sarangi et al., 2018). New particle formation (NPF), as a result of gas-to-particle conversion, is the largest source of aerosol numbers to the terrestrial atmosphere (Kulmala et al., 2007; Zhang et al., 2012). While nucleated particles from NPF are initially very small molecular clusters (1–2 nm; Kerminen et al., 2012), these molecular clusters can grow to large sizes within a few hours to a few days and ultimately reach CCN active sizes (> 50–100 nm; Pierce and Adams, 2007; Westervelt et al., 2013). Thus, CCN forms the direct microphysical link between aerosols and clouds and plays a vital role in the hydrological cycle and climate.
In India, several intensive field campaigns such as the Indian Ocean Experiment (INDOEX; Ramanathan et al., 2001), Indian Space Research Organization (ISRO)-Geosphere-Biosphere Programme (GBP)-Land campaign II (Tripathi et al., 2006; Tare et al., 2006), and Integrated Campaign for Aerosols, gases, and Radiation Budget (ICARB; Moorthy et al., 2008; Nair et al., 2020; Kompalli et al., 2020) have measured sub-micron particle number size distributions (PNSDs). There are also short- and long-term field observations of sub-micron PNSDs in a variety of diverse locations in India (Hyvärinen et al., 2010; Kanawade et al., 2014a; Shika et al., 2020; Tripathi et al., 1988; Komppula et al., 2009; Singh et al., 2004; Moorthy et al., 2011; Babu et al., 2016; Kompalli et al., 2018). However, there are sparse studies in India characterizing seasonal variation in PNSDs and number concentrations (Kanawade et al., 2014a; Hyvärinen et al., 2010; Komppula et al., 2009; Hooda et al., 2018; Laj et al., 2020) and atmospheric NPF (Sebastian et al., 2021b; Siingh et al., 2018; Neitola et al., 2011; Moorthy et al., 2011; Kanawade et al., 2014b, c; Kanawade et al., 2020a). The characterization of PNSDs is critical because they are controlled by an evolving balance between NPF, condensation of vapor on pre-existing particles, evaporation of particles, coagulation, and sedimentation (IPCC, 2013). Previous field measurements and modeling studies globally demonstrated a substantial enhancement in CCN number concentrations from nucleation (Yu et al., 2020; Wiedensohler et al., 2009; Sihto et al., 2011; Rose et al., 2017; Tröstl et al., 2016; Kalivitis et al., 2015; Westervelt et al., 2013; Pierce et al., 2012; Pierce et al., 2014; Westervelt et al., 2014; Kerminen et al., 2012; Kerminen et al., 2018; Merikanto et al., 2009; Gordon et al., 2017). For instance, Merikanto et al. (2009) revealed that 45 % of the global low-level CCN at 0.2 % supersaturation originates from nucleation. Westervelt et al. (2014) also found that nucleation contributes to about half of the boundary layer CCN (at supersaturation of 0.2 %), with an estimated uncertainty range of 49 % to 78 %, which is sensitive to the choice of nucleation scheme. In contrast, Reddington et al. (2011), using the global model GLOMAP against ground-based measurements at 15 European sites, found that CCN-sized particle number concentrations were driven by processes other than nucleation at more than 10 sites. They explained that the weakened response of CCN-sized particles to boundary layer nucleation arises from an increase in coagulation and condensation sinks for ultrafine particles, thereby reducing the condensational growth of ultrafine particles to CCN active sizes (Kuang et al., 2009; Pierce and Adams, 2007). Tröstl et al. (2016) also revealed that only a small fraction of total particles of less than 50 nm grew beyond 90 nm (50–100 particles cm−3), even on a timescale of several days. Therefore, to better understand atmospheric NPF and its contribution to the boundary layer CCN budget, we need highly resolved spatiotemporal observational data in diverse environments globally, aided with aerosol model simulations, to help to interpret field observations.
Overall, studies pertinent to the impact of NPF on aerosol–cloud interactions are highly sparse in India. The sources of aerosols, and gaseous precursors required for secondary aerosol formation, depict considerable spatiotemporal heterogeneity over India. Therefore, observational aerosols and precursors data must be synthesized to understand the processes that govern NPF and its contribution to CCN concentrations in different settings of India. The primary objective of this study is to harmonize observational PNSDs data from six diverse locations in India to present analyses of PNSDs, atmospheric NPF, and the contribution of NPF to CCN concentrations.
2.1 Observation sites and aerosol sampling instrumentation
Figure 1 shows the geographical location of measurement sites on the surface elevation map. Table 1 provides details of measurement sites and particle data analyzed in this study.
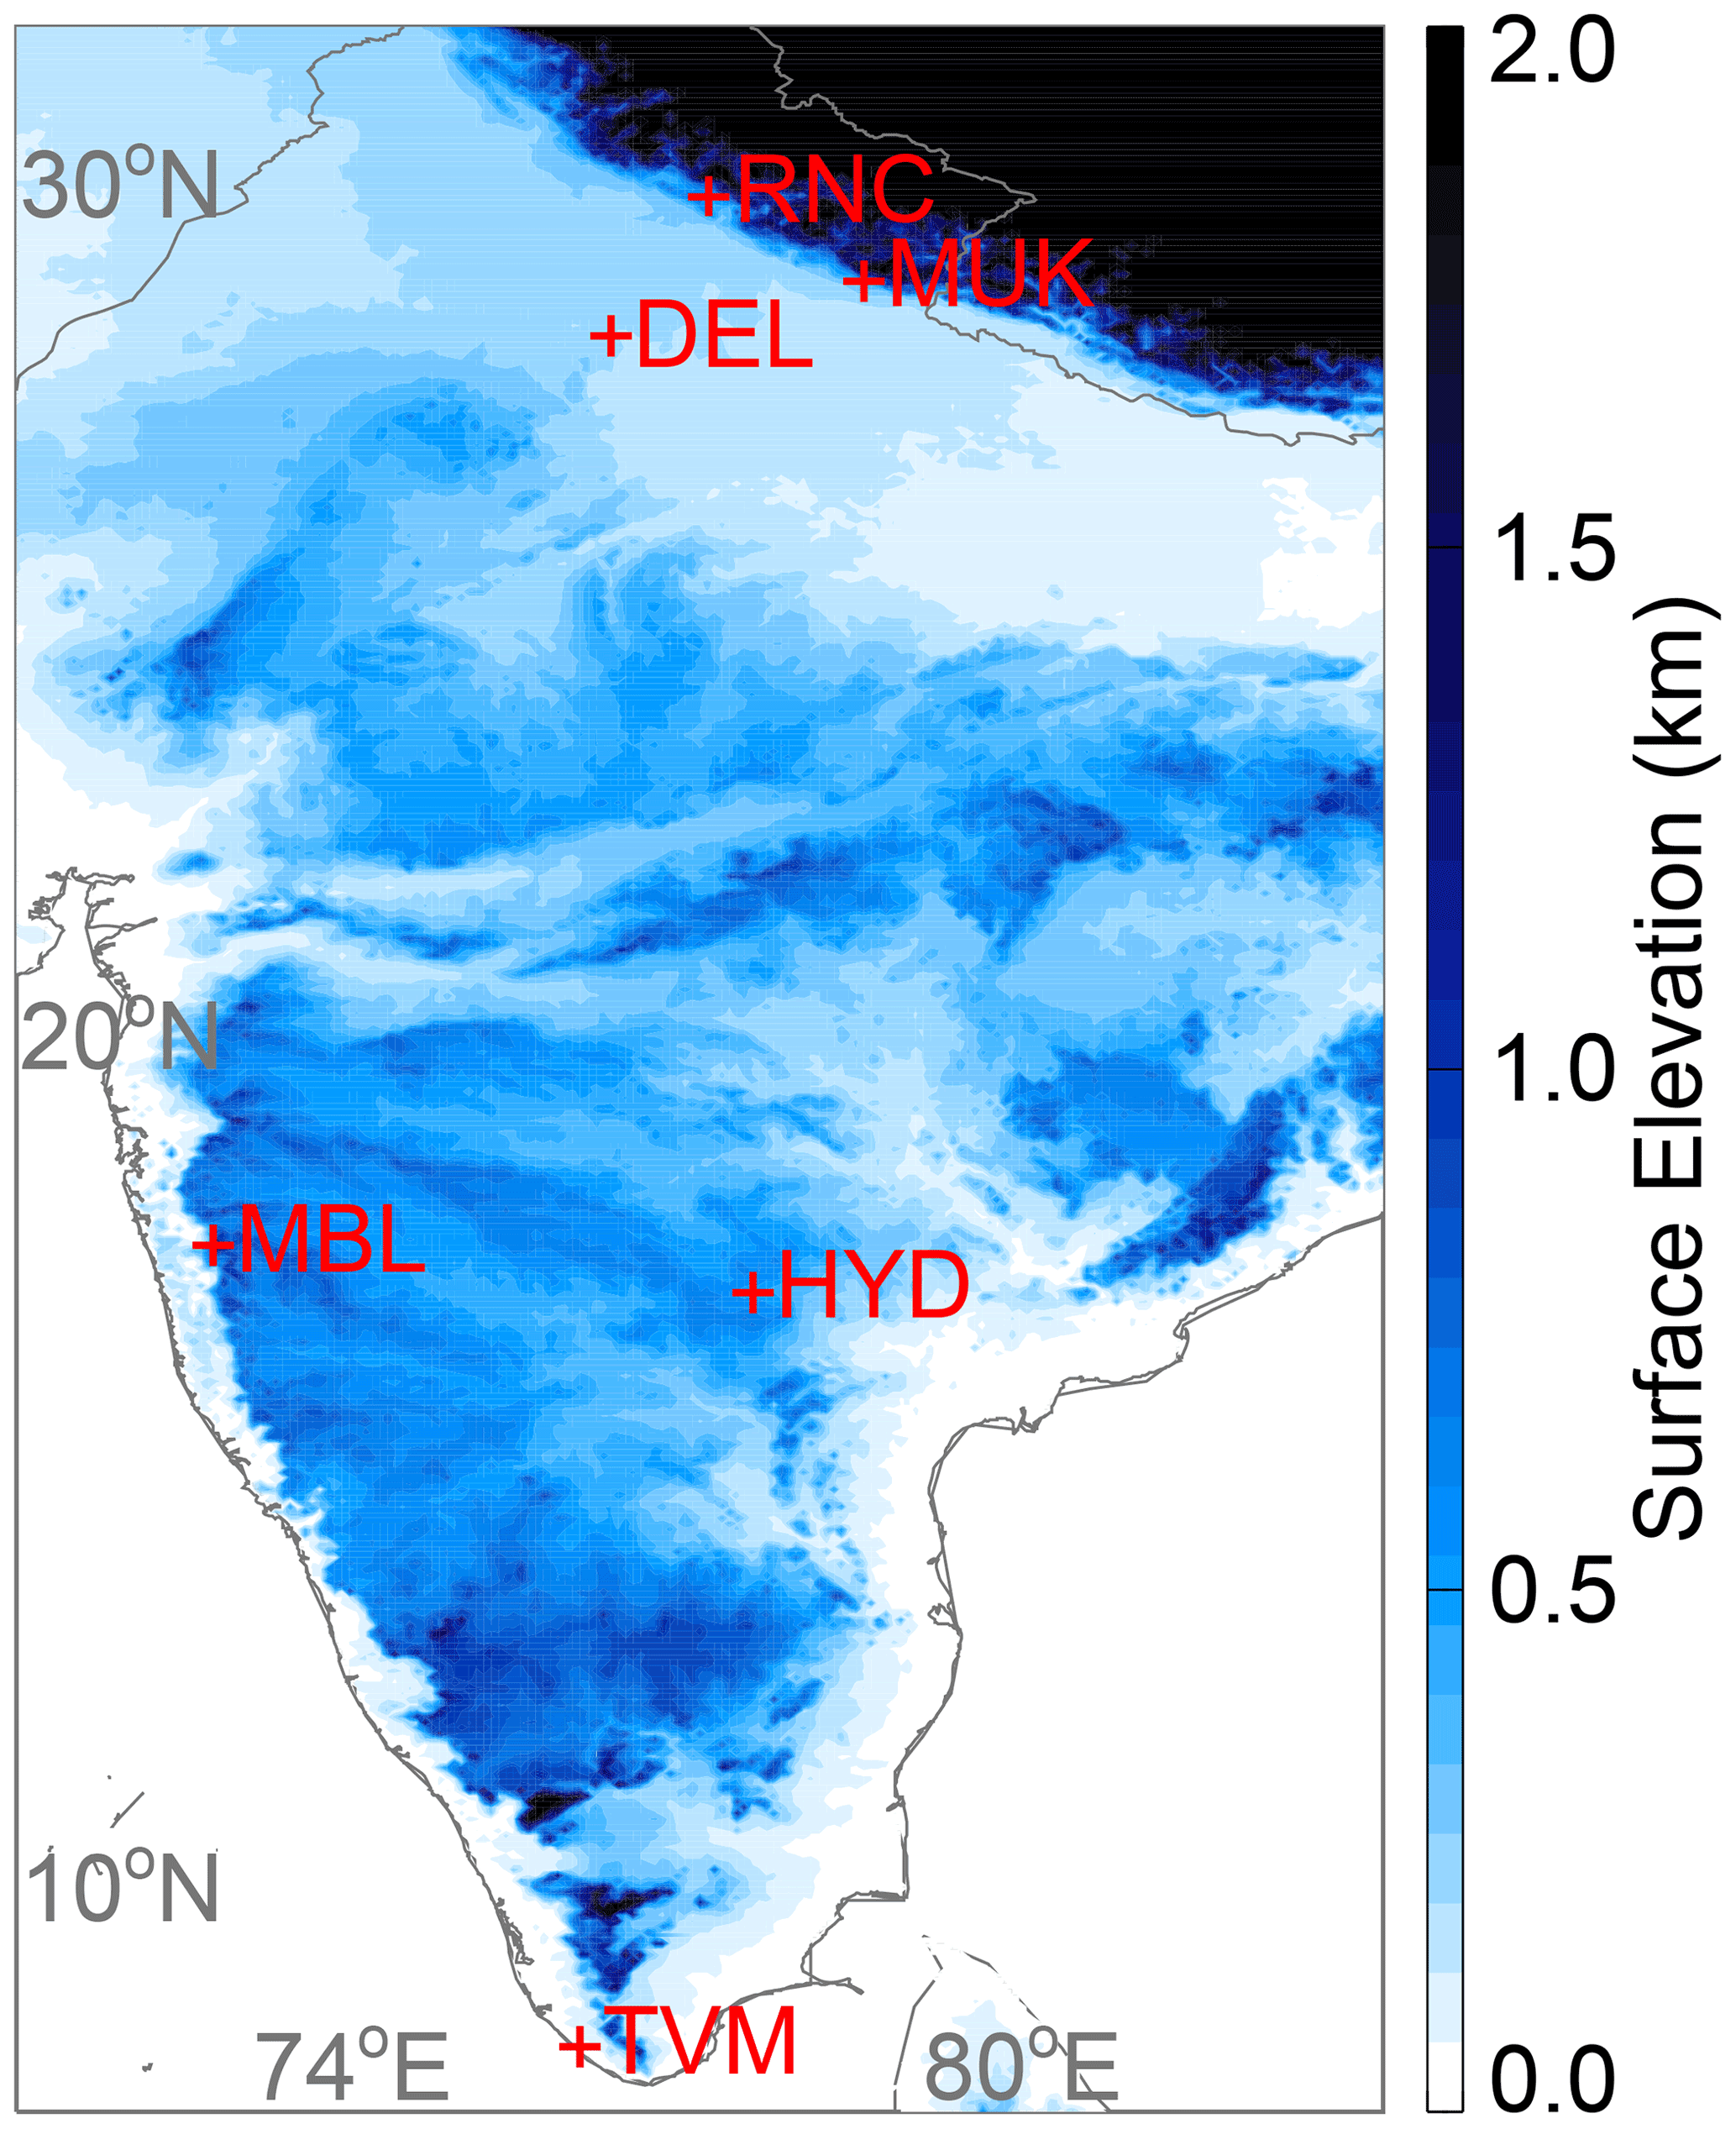
Figure 1The geographical location of measurement sites on the surface elevation map. Measurement sites such as Ranichauri (RNC), Mukteshwar (MUK), Mahabaleshwar (MBL), Hyderabad (HYD), Thiruvananthapuram (TVM), and Delhi (DEL) are shown by the red plus sign. The global 1 arcsec (30 m) SRTM digital surface elevation data are obtained from the United States Geological Survey (https://www.usgs.gov/centers/eros/science/usgs-eros-archive-digital-elevation-shuttle-radar-topography-mission-srtm-1#overview, last access: July 2018).
Table 1Details of the measurement sites and particle number size distribution measurements analyzed in this study.
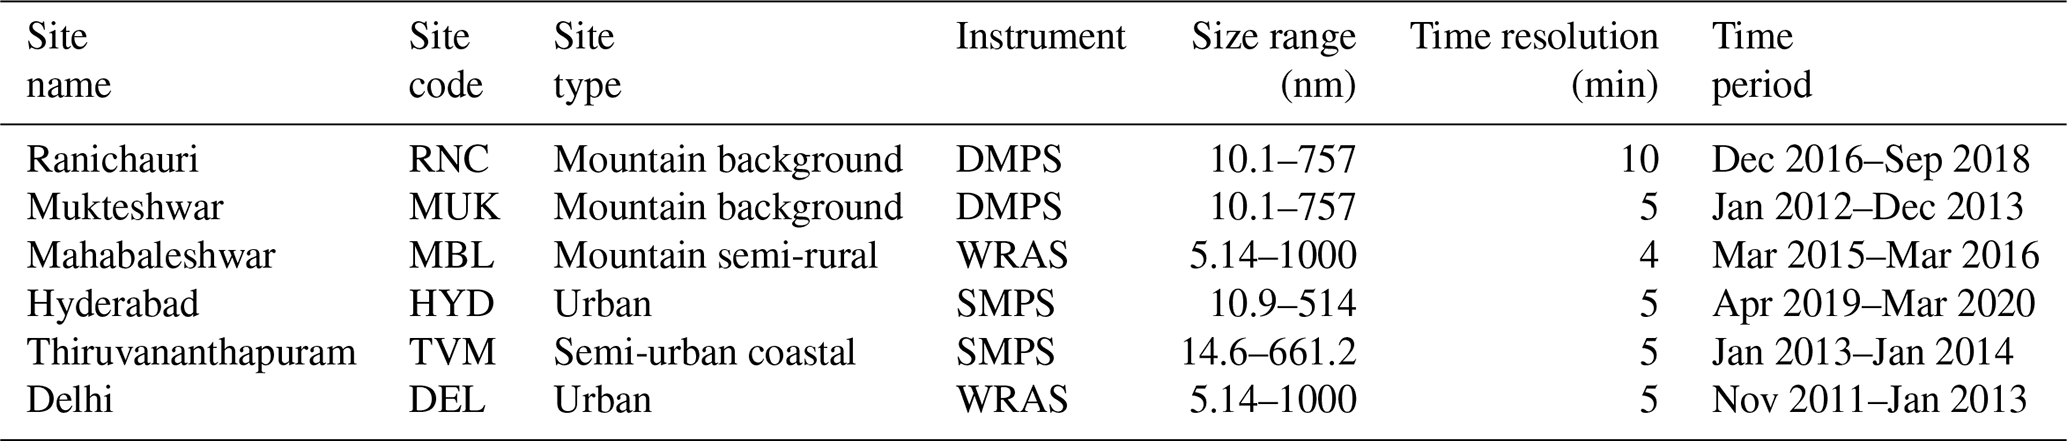
DMPS: differential mobility particle sizer, WRAS: wide-range aerosol spectrometer, SMPS: scanning mobility particle sizer
Ranichauri observation site (RNC; 30.2∘ N, 78.25∘ E; ∼ 1930 m above mean sea level, a.m.s.l.) is located in the Tehri–Garhwal district of Uttarakhand state in the southern slope of the western Himalaya. The RNC site is situated on an isolated hilltop within the campus of the College of Forestry in the Ranichauri village. The RNC site is a climate monitoring station managed by the India Meteorological Department (IMD). It is a mountain background remote observatory (Sebastian et al., 2021b) and located about 70 km to the northeast of Rishikesh city, about 100 km to the northwest of the Srinagar city, and about 100 km to the east of Dehradun. Here, particle number size distributions ranging from 10 to 757 nm (30 size bins) are measured using a differential mobility particle sizer (DMPS, Finnish Meteorological Institute assembled) from December 2016 to September 2018 (Sebastian et al., 2021b). The DMPS consisted of a Vienna-type differential mobility analyzer (DMA) that classifies the charged particles according to their electrical mobility and a TSI 3772 condensation particle counter (CPC) that counts particles of the selected mobility. The sample air was drawn inside through a stainless-steel inlet tube of about 2 m in length and dried to less than 40 % relative humidity with a Nafion dryer (Perma Pure model MD-700-48). Diffusion losses in the inlet and inside the DMPS instrument were considered in the data inversion. The inversion method was identical to that presented by Wiedensohler et al. (2012) for the Finnish Meteorological Institute (FMI) DMPS.
Mukteshwar observation site (MUK; 29.43∘ N, 79.62∘ E, 2180 m a.m.s.l.) is located in the Nainital district of Uttarakhand state in the southern slope of the central Himalaya. The Mukteshwar village is situated 3 km to the northeast of the measurement site, at a similar altitude, with ∼ 800 inhabitants (Census of India, 2011). MUK can be considered a mountain background site, with an annual mean black carbon (BC) concentration of 0.9 µg m−3. The town of Almora (1650 m a.m.s.l., 34 000 inhabitants) is located at about 16 km to the north, Nainital (1960 m a.m.s.l., 41 000 inhabitants) is located at about 25 km to the southwest, and the city of Haldwani (424 m a.m.s.l., 150 000 inhabitants) is located at about 32 km to the southwest of MUK. Delhi, the major metropolitan city (215 m a.m.s.l., 16.8 million inhabitants), is located approximately 250 km to the southwest. Systematic measurements of aerosol properties have been conducted at MUK since 2005 in Indo-Finnish cooperation with the Finnish Meteorological Institute (Hooda et al., 2018 and references therein). Here, we used only 2 years (January 2012 to December 2013) of measurements of particle number size distributions in the range of 10 to 757 nm (30 size bins). The air sampling procedure was similar to that of RNC. More details of the site and aerosol sampling can be found in Hyvärinen et al. (2009).
Delhi observation site (DEL; 28.64∘ N, 77.17∘ E, 215 m a.m.s.l.) is located at CSIR-National Physical Laboratory (NPL). Delhi, India's capital and the largest metropolitan city in South Asia, is located on the northwestern Indo Gangetic Plain (IGP) in northern India. Delhi has a population of 16.8 million, with a population density of 11 320 km−2 (Census of India, 2011). The Great Indian Desert (Thar Desert) of Rajasthan state is located to the southwest, hot central plains to the south, and hilly regions to the north and east of Delhi. Long-range transported air masses often influence Delhi's air quality from the northwest (agricultural residue burning from Punjab and Haryana in October–November) and southwest (dust storms from Thar and Arabian Peninsula in April–June; Kanawade et al., 2020b; Srivastava et al., 2014). A wide-range aerosol spectrometer (WRAS, manufactured by GRIMM, Germany), installed on the second floor of the NPL main building, was used to measure particle number size distributions. WRAS consists of a scanning mobility particle sizer (SMPS) and an environmental dust monitor (EDM). GRIMM-SMPS system consists of a Vienna-type monodisperse differential mobility analyzer (M-DMA). DMA classifies the particle according to their electrical mobility, which is then counted using a CPC. EDM uses an optical particle counter (OPC), which works on the light scattering technology for particle counting, gives the particle number size distribution in the range from 250 nm to 32 µm (Grimm and Eatough, 2009). The WRAS system uses a stainless-steel inlet tube with an integrated Nafion drier to dry the aerosol samples. A detailed description of the site and aerosol sampling is given elsewhere (Jose et al., 2021). Thus, the WRAS system gives the particle number size distribution in the range from 5.5 nm to 32 µm (72 size bins). A detailed description and principle of the instrument are discussed elsewhere (Grimm and Eatough, 2009). In this study, we used particle number size distributions in the range of 5.14 to 1000 nm from November 2011 to January 2013.
Mahabaleshwar observation site (MBL; 17.92∘ N, 73.65∘ E; 1378 m a.m.s.l.) is located in a small town named Mahabaleshwar in the forested Western Ghats range in the Satara district of Maharashtra state. In MBL, a High-Altitude Cloud Physics Laboratory (HACPL) was established by the Indian Institute of Tropical Meteorology (IITM), Pune, in 2012, to study monsoon clouds in this region. HACPL site details are found elsewhere (Anil Kumar et al., 2021). Mahabaleshwar town is a tourist attraction consisting of dense vegetation, residential houses, hotels, and a rural market. Pune city is located on the leeward side of the Western Ghats about 100 km to the north, Mumbai is located approximately 250 km to the northwest, and Satara city is located approximately 50 km to the southeast of Mahabaleshwar. Measurements of particle number size distributions were carried out using the GRIMM-WRAS system. A detailed description and principle of the instrument are discussed elsewhere (Grimm and Eatough, 2009). The WRAS has a stainless-steel inlet tube with an integrated Nafion dryer to reduce relative humidity to ∼ 40 %. In this study, we used particle number size distributions in the range of 5.14 to 1000 nm from March 2015 to March 2016.
Hyderabad observation site (HYD; 17.46∘ N, 78.32∘ E; 542 m a.m.s.l.), University of Hyderabad, is located in the outskirts of Hyderabad city. HYD details can be found in Sebastian et al. (2021a). Briefly, particle number size distributions in the range from 10.9 to 514 nm (108 size bins) were measured using TSI SMPS, which consists of an electrostatic classifier with a long DMA (TSI LDMA, model 3082) and a butanol CPC (TSI, model 3772), on the second floor of the Earth Sciences building located on the University of Hyderabad campus from April 2019 to March 2020. The scanning cycle of SMPS was 300 s, yielding a particle number size distribution every 5 min.
Thiruvananthapuram (Trivandrum) observation site (TVM; 8.55∘ N, 76.97∘ E, 3 m a.m.s.l.) is located in a tropical semi-urban coastal city with a population of ∼ 1 million (Census of India, 2011) on the southwestern coast of the Indian peninsular. The observations were carried out at the Space Physics Laboratory (SPL) within the Thumba Equatorial Rocket Launching Station, which is about 500 m due east of the Arabian Sea coast and 10 km northwest of the urban area of Thiruvananthapuram. The experimental site is free from major industrial or urban activities (Babu et al., 2016). TVM station is a part of the Aerosol Radiative Forcing over India (ARFI) project network of the Indian Space Research Organisation – Geosphere-Biosphere Program (ISRO-GBP). Measurements of particle number size distributions in the range from 14.6 to 661.2 nm (108 size bins) were made using TSI SMPS, which consists of an electrostatic classifier with an LDMA (3081) and a water-based CPC (3786) from January 2013 to January 2014. The ambient air was sampled from a height of 3 m above ground level through a manifold inlet fitted with a PM10 size cut impactor at 16.67 L min−1 flow rate. Subsequently, the flow was distributed among various aerosol instruments connected with electrically conductive tubing. A diffusion dryer (make: TSI; model: 3062) employing silica gel was used to restrict high relative humidity conditions. More details about the site and prevailing meteorology are described in Babu et al. (2016).
Particle number size distributions are categorized by season. We have defined four seasons as indicated in Table 2. The overall particle number size distribution data coverage was adequate (> 60 %) at the RNC, MUK, MBL, and HYD sites (Fig. 2) for determining the main seasonal and annual features of particle number size distributions and NPF characteristics. The data coverage at TVM (34 %) and DEL (47 %) was lower. We also analyzed the number concentration of three sub-micron aerosol modes: Aitken mode (25–100 nm), accumulation mode (100–514 nm), and total particles (< 514 nm). Figure S1 in the Supplement shows the HYbrid Single-Particle Lagrangian Integrated Trajectory (HYSPLIT, Draxler and Draxler, 2010) calculated 3 d air mass backward trajectories arriving at 500 m above the ground level at all sites for winter, pre-monsoon, monsoon, and post-monsoon seasons. RNC and MUK generally experience a mixture of relatively cleaner free tropospheric air and polluted air from the highly polluted Indo-Gangetic Plain. MBL experiences marine air masses during pre-monsoon and monsoon seasons and continental air masses during post-monsoon and winter. HYD experiences mixed marine and continental air masses from the northeast during post-monsoon and winter seasons and from southeast and west during pre-monsoon and monsoon, respectively. TVM predominantly experiences air masses of marine origin throughout the year, with continental influence during the winter season. DEL mostly experiences air masses from the northwest during pre-monsoon, post-monsoon, and winter seasons and from southeast and southwest during monsoon season.
Table 2Seasons are defined in the analysis and average weather conditions.
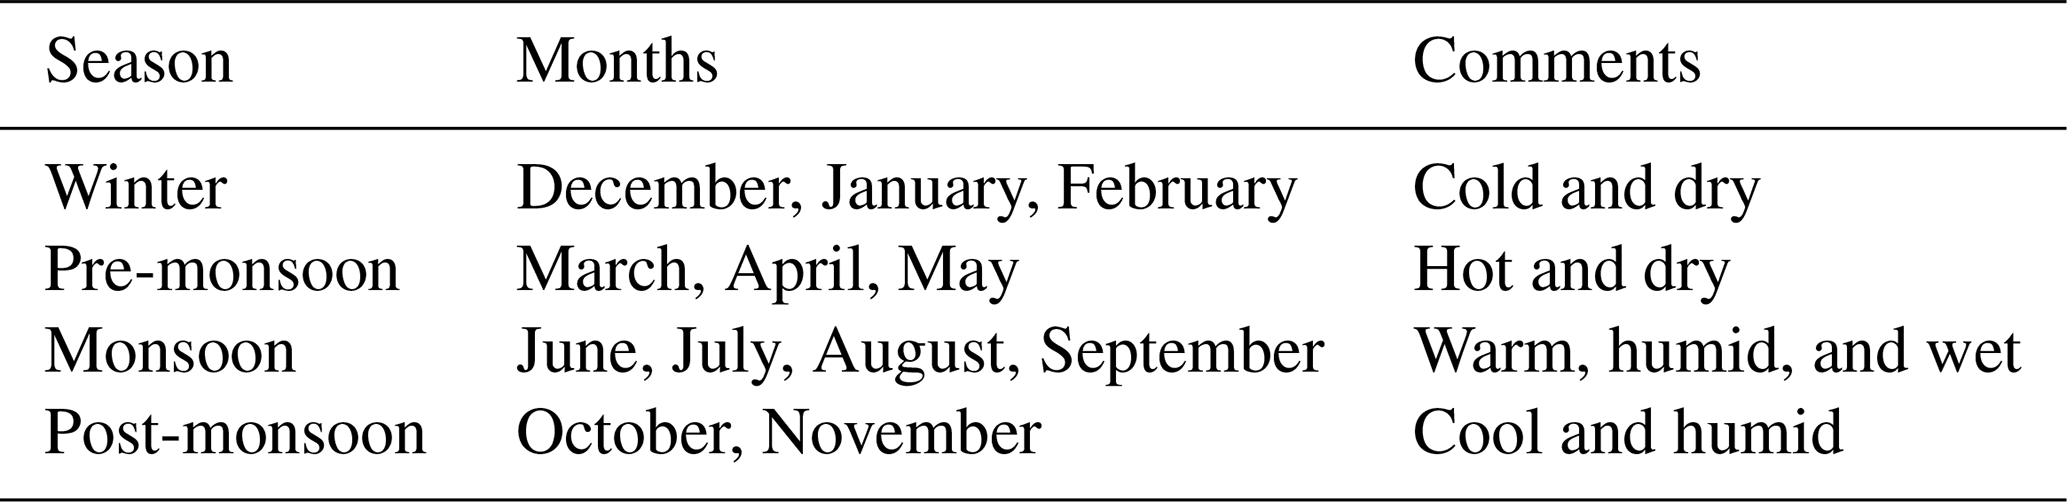
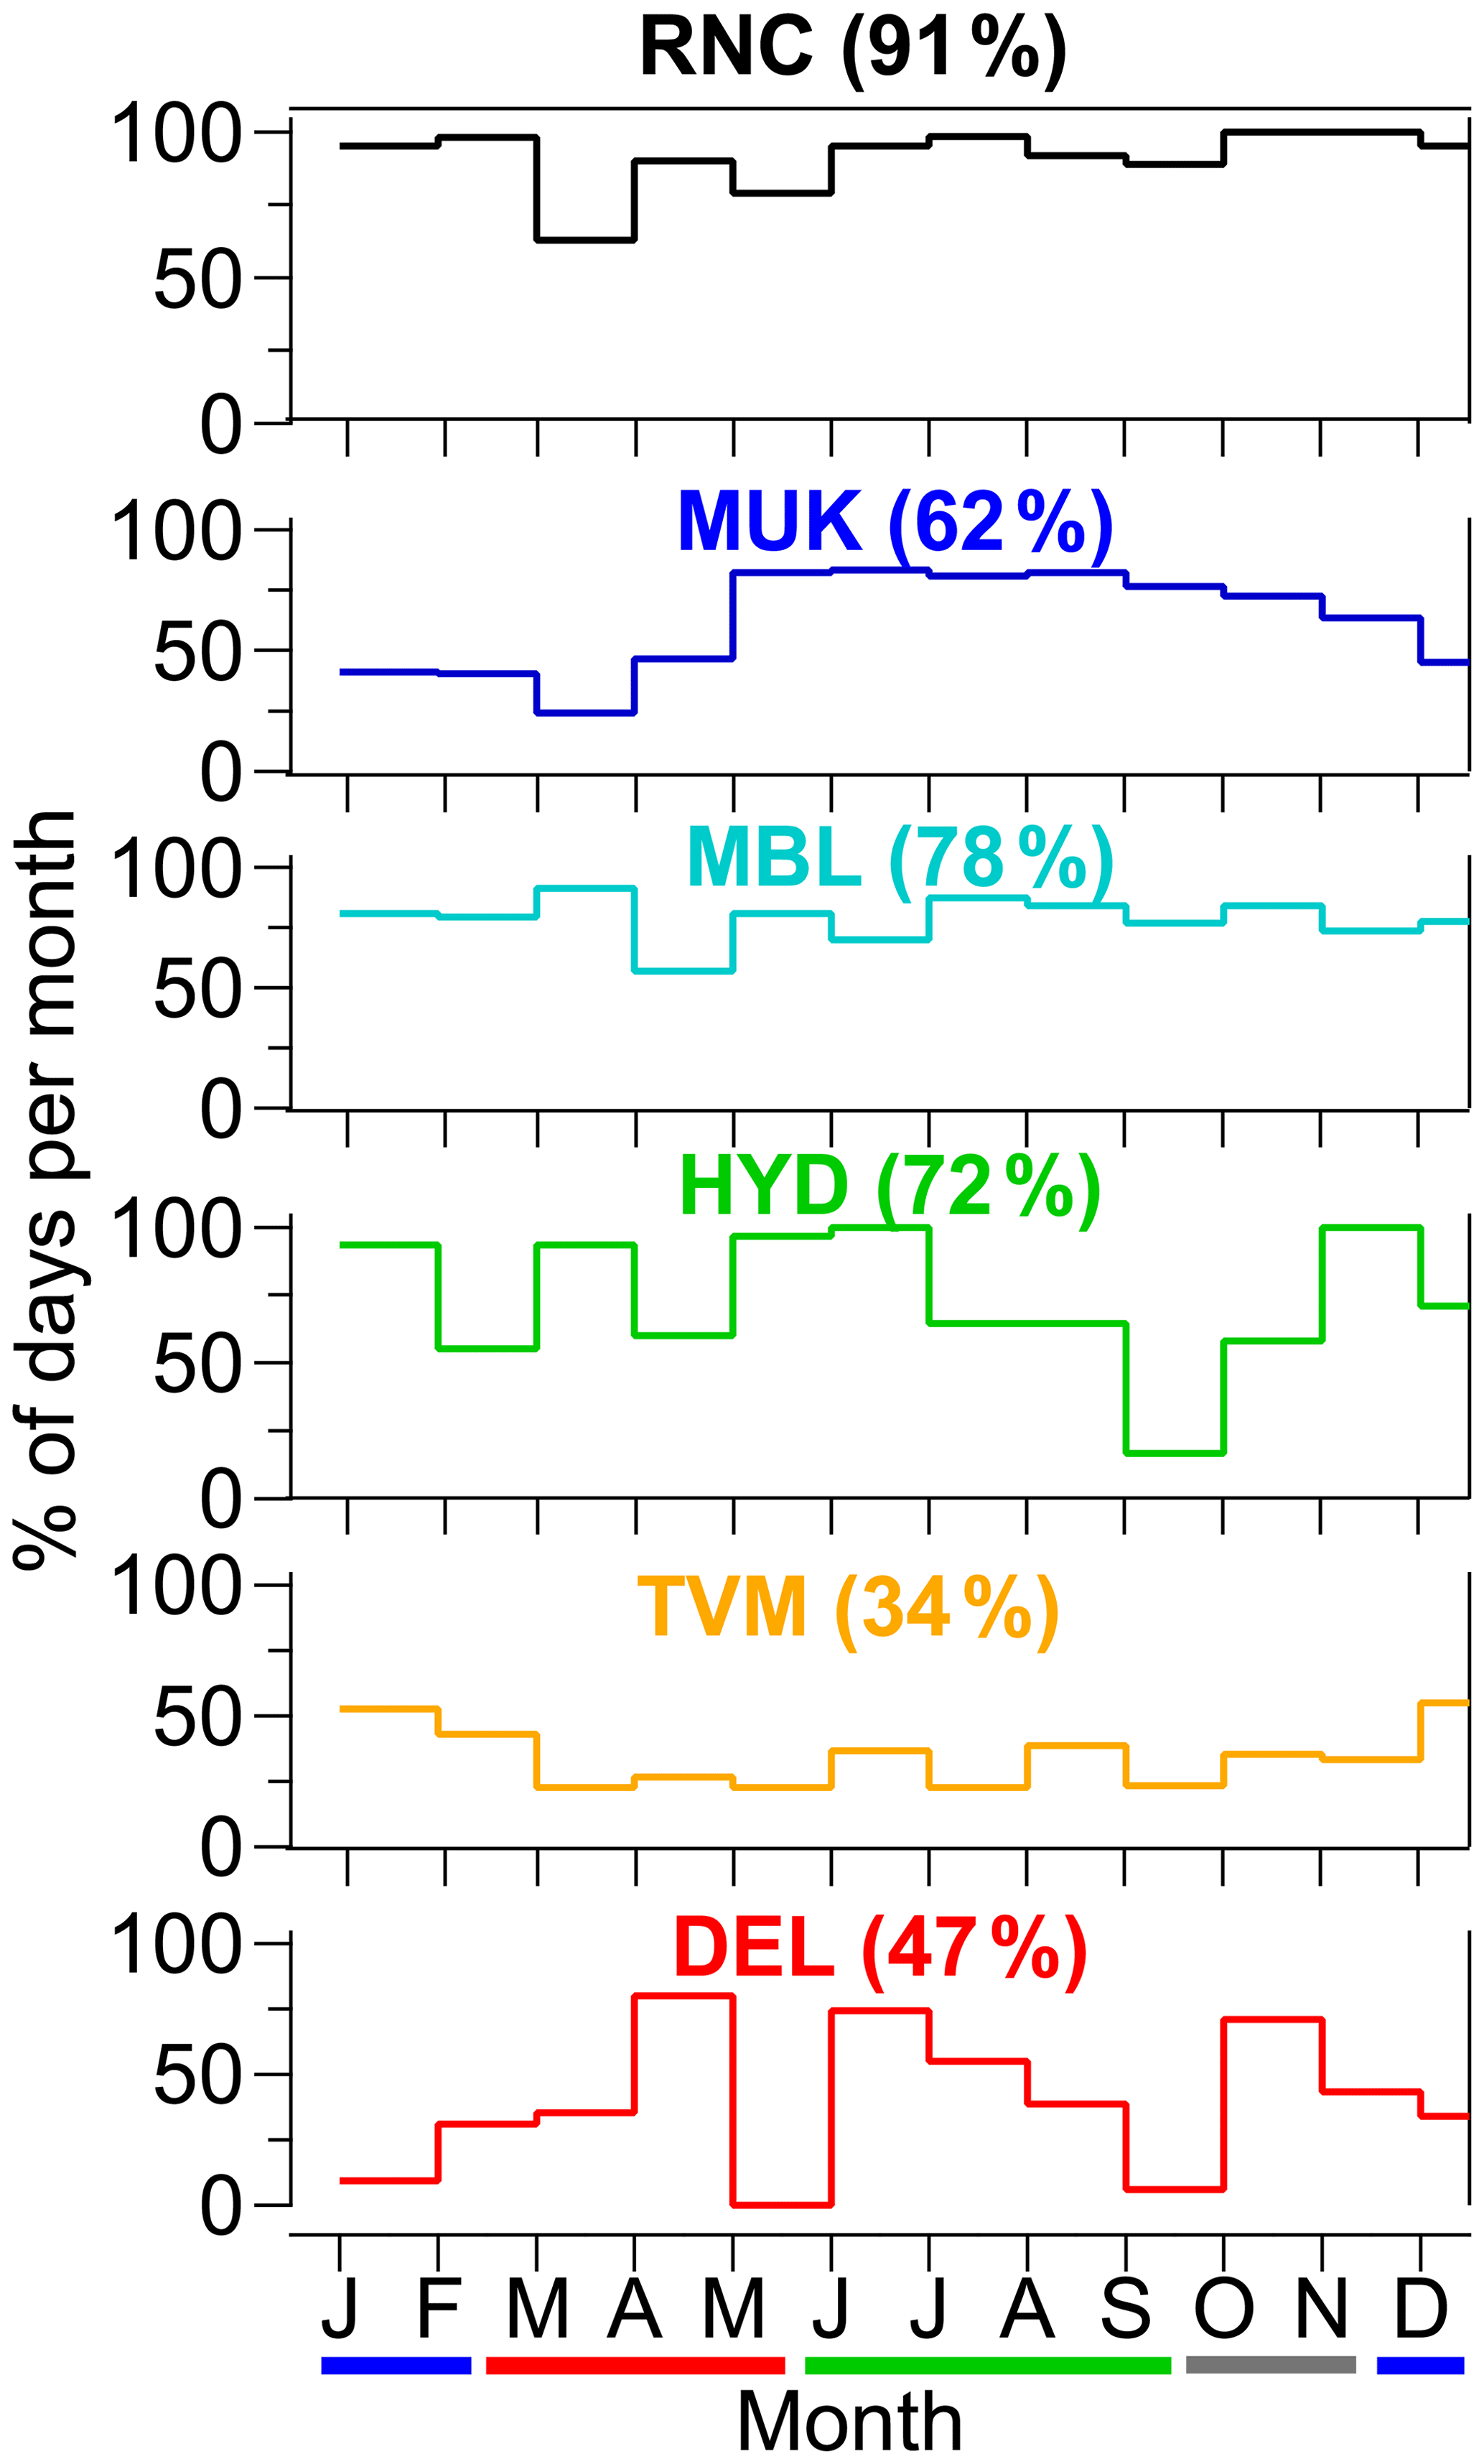
Figure 2Particle number size distributions data coverage (% of days per month) at the sites. The values in the bracket indicate total data coverage. The thick blue, red, green, and gray lines indicate winter, pre-monsoon, monsoon, and post-monsoon months. Note that measurements are from different time periods for each site (see Table 1).
2.2 New particle formation event classification and features
We classified observation days into three types of events: NPF event day, non-event day, and undefined event day using visual inspection of the particle number size distributions, following the methodology given by Dal Maso et al. (2005). A day was classified as an NPF event day by the presence of a distinctly new mode of particles with a diameter smaller than 25 nm and steady growth in diameter of this new mode such that the particle number size distributions display a noontime “banana” shaped aerosol growth. The particle mode diameter (i.e., the local maximum of the particle number size distribution) was obtained by fitting a log-normal distribution to the measured particle number size distribution. A day without any evidence of a distinctly new mode of particles of diameters smaller than 25 nm was identified as a non-event day. Those days which were difficult to be classified as any one of the above two event types were identified as undefined event days. For NPF events, the particle growth rate was calculated by fitting a first-order polynomial line through growing particle mode diameter between the smallest detectable size (SDS) of the instrument (e.g., 10 nm for RNC) and 25 nm as a function of time and calculating its slope (GRSDS-25 nm). The formation rate of a particle at the SDS (JSDS) was also found using the simplified approximation of the general dynamic equation (GDE), describing the evolution of the particle number size distribution as given below:
where the first term in Eq. (1) is the rate of the change of nucleation mode particle number concentrations, the second term is the coagulation loss of nucleation mode particles, and the third term is the flux out of the size range of SDS-25 nm, i.e., condensational growth (Dal Maso et al., 2005). A direct comparison of JSDS and GRSDS-25 nm between the sites is not possible because of the different size ranges covered by the instruments.
2.3 Increase in CCN concentrations from NPF
The increase in CCN concentrations from any given NPF event can be estimated by comparing the CCN concentration before the event (NCCNprior) and the maximum CCN concentration during the event (NCCNmax) following the methodology developed by Kerminen et al. (2012), which we modified further. In typical ambient in-cloud supersaturations, the total number of particles from 50 to > 100 nm can be considered as a proxy for CCN concentrations assuming fixed chemical composition (Westervelt et al., 2013; Kerminen et al., 2012). NCCNprior was chosen to be a 1 h average concentration of particles larger than 50 nm (and 100 nm) just before the start of the NPF event. The start of the NPF event is the time when nucleation mode particle number concentrations increase rapidly during an NPF event. NCCNmax was taken as a maximum 1 h average concentration of particles larger than 50 nm (and 100 nm) during the event. The NCCNmax is not the best representation of CCN concentration after the NPF event because it is not possible to estimate the end of an NPF event. However, it gives a rough estimate of the observed maximum number of primary and secondary particles present in the atmosphere during an event (Kerminen et al., 2012). For non-event days, the seasonally averaged start of the NPF event time was chosen to calculate NCCNprior. NCCNmax on non-event days was taken to be similar to NPF event days, as a maximum 1 h average concentration of particles larger than 50 nm (and 100 nm). The second term in Eq. (2) gives approximate CCN concentrations from processes other than NPF. Then, the absolute increase in CCN concentration from NPF is calculated as given below:
The first term on the right-hand side in Eq. (2) indicates the CCN increase during an NPF event, while the second term indicates the CCN increase during a non-event. However, the atmospheric condition on non-event days is generally different from NPF event days; therefore, the calculated increase in CCN concentrations from NPF may be imprecise.
3.1 Variability in particle number size distributions and number concentrations
Figure 3 shows the annual and seasonal median and 25th and 75th percentile values of particle number size distributions at all the sites. The thick line represents the median value, whereas the shaded area indicates particle number size distribution between 25th and 75th percentiles. The mountain sites (RNC, MUK, and MBL) all show similar mode diameters, with the lowest concentrations at RNC. Among the urban areas (HYD, TVM, and DEL), TVM has the largest mode diameter, which is frequently influenced by the influx of marine air masses containing high moisture and coarser sea salt aerosols (Fig. 3a; Babu et al., 2016). The peak number concentration of PNSDs is the highest in pre-monsoon (MAM) than in other seasons at the mountain background sites RNC and MUK (Fig. 3b–c), while it was similar in winter and pre-monsoon at MBL (Fig. 3d). These elevated concentrations are accompanied by a smaller mode diameter of the Aitken mode particles. The highest number concentration is attributed to the frequent occurrence of NPF in these locations in pre-monsoon (Sebastian et al., 2021b; Neitola et al., 2011). The contribution of newly formed particles to total particles is also visible in the 75th percentile PNSDs at these sites. The number size distributions of particles were significantly the lowest in monsoon and post-monsoon.
The median number size distribution of particles at HYD is the highest in pre-monsoon and post-monsoon (Fig. 3e). The highest particle number concentrations in pre-monsoon and post-monsoon can be attributed to the frequent occurrence of NPF in these seasons at the site. The influence of NPF is also noticeable in the 75th percentile PNSDs. The PNSD is consistently the lowest in monsoon, attributed to the wet scavenging of particles. The concentrations of Aitken and accumulation mode particles are the highest in winter compared to the other seasons. The mode diameter of PNSDs at TVM is comparatively similar in all seasons (Fig. 3f). At DEL, the mode diameter of PNSDs is the highest in winter compared to the other seasons (Fig. 3g). The shallow boundary layer height, stagnant atmospheric conditions, and high emission rates of aerosol precursors in winter (Kanawade et al., 2020b) allow particles to stay close to the surface and grow larger under high relative humidity and high condensable vapor concentrations. The median PNSD is consistently the lowest in monsoon at TVM due to extensive wet scavenging. The strong seasonality in PNSDs is similar to those reported earlier in India (Hooda et al., 2018; Komppula et al., 2009; Gani et al., 2020; Kanawade et al., 2014a). The uni- and bi-modal parameters of the particle number size distributions presented in Fig. 3 are tabulated in Table S1 in the Supplement.
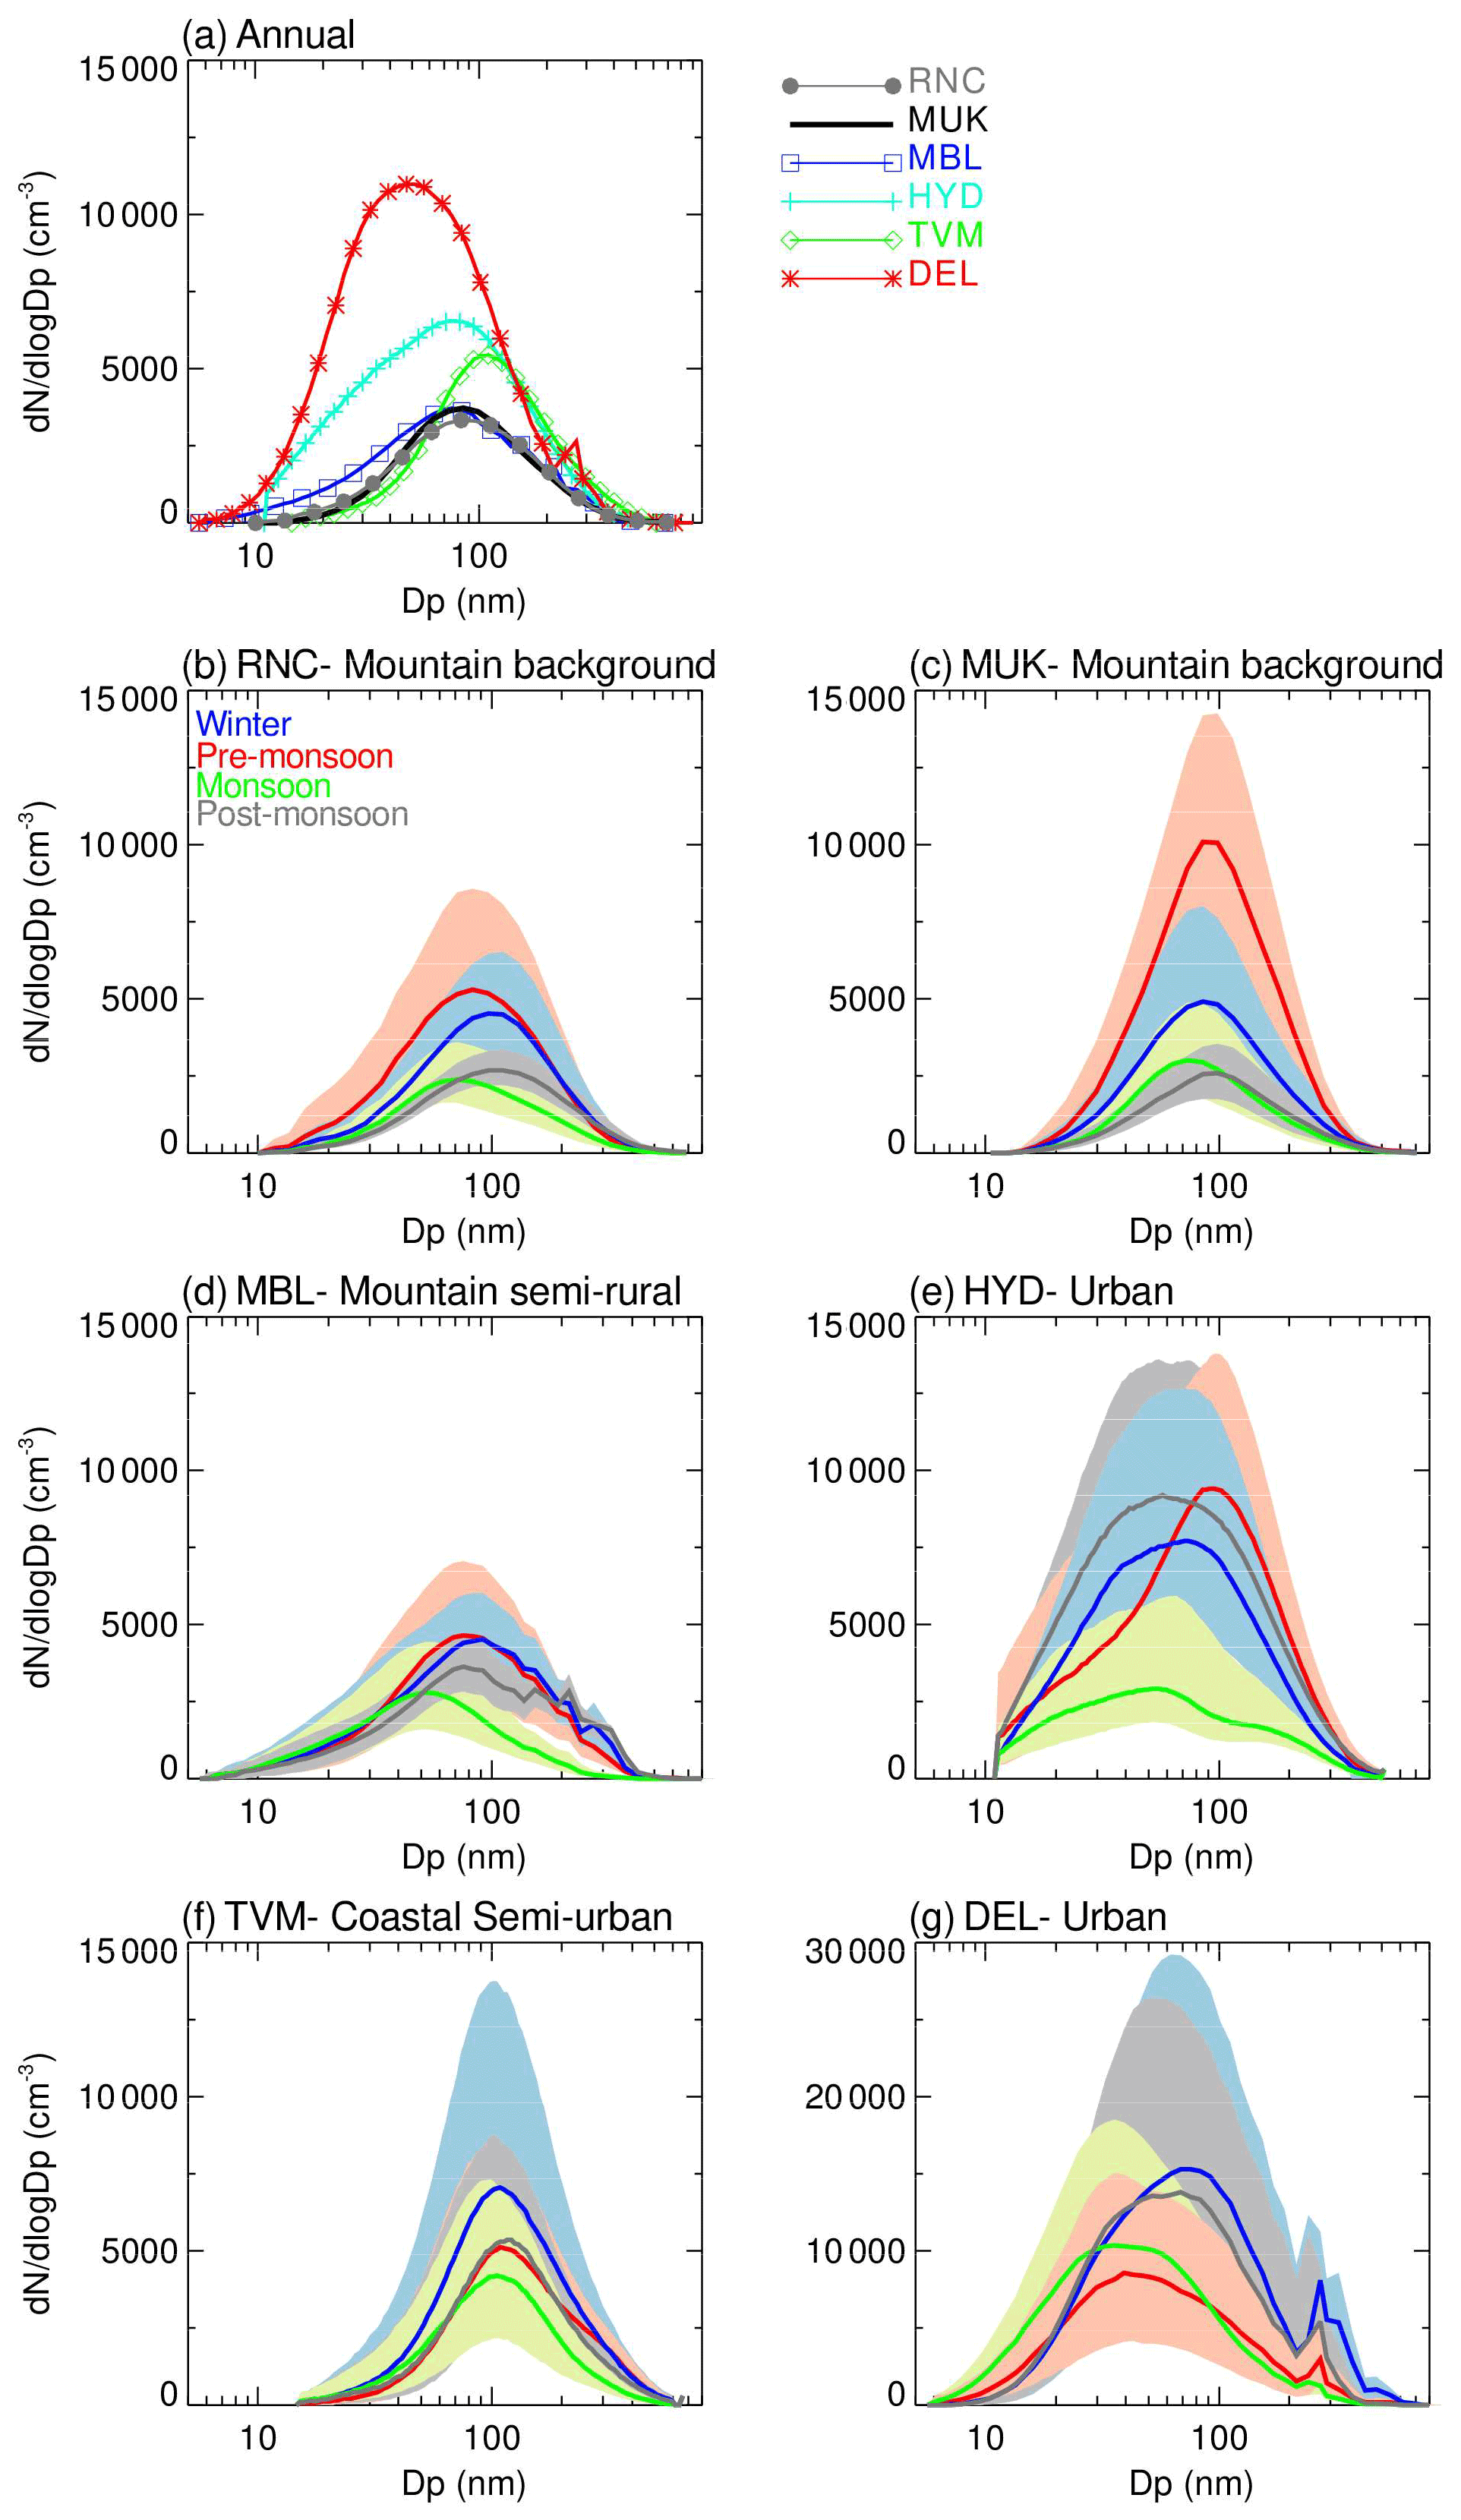
Figure 3(a) Annual and (b–g) seasonal median particle number size distributions at all the sites. The solid line indicates the median, and the light-colored shading indicates 25th and 75th percentile distributions. The blue line and shading indicate winter (DJF), red line and shading indicate pre-monsoon (MAM), green line and shading indicate monsoon (JJAS), and gray line and shading indicate post-monsoon season (ON). Note that the y axis scale is different for the DEL site. Note that measurements are from different time periods for each site (see Table 1).
Figure 4 shows the average observed PNSDs evolving over the day for each season, as a contour plot, at all the sites. For the mountain background sites RNC and MUK, the average seasonal contour plot indicates daytime NPF in pre-monsoon. However, winter, monsoon, and post-monsoon had the lowest concentrations of smaller particles that are not associated with NPF. For MBL, NPF occurred in winter, pre-monsoon, and post-monsoon. For all urban sites (HYD, TVM, and DEL), the average seasonal contour plot indicates the highest concentration of particles in the morning and evening peak traffic hours, in addition to daytime NPF. In Sect. 3.2, we have considered this high particle concentration from evening peak traffic while investigating the frequency of occurrence of NPF and its contribution to CCN concentrations.
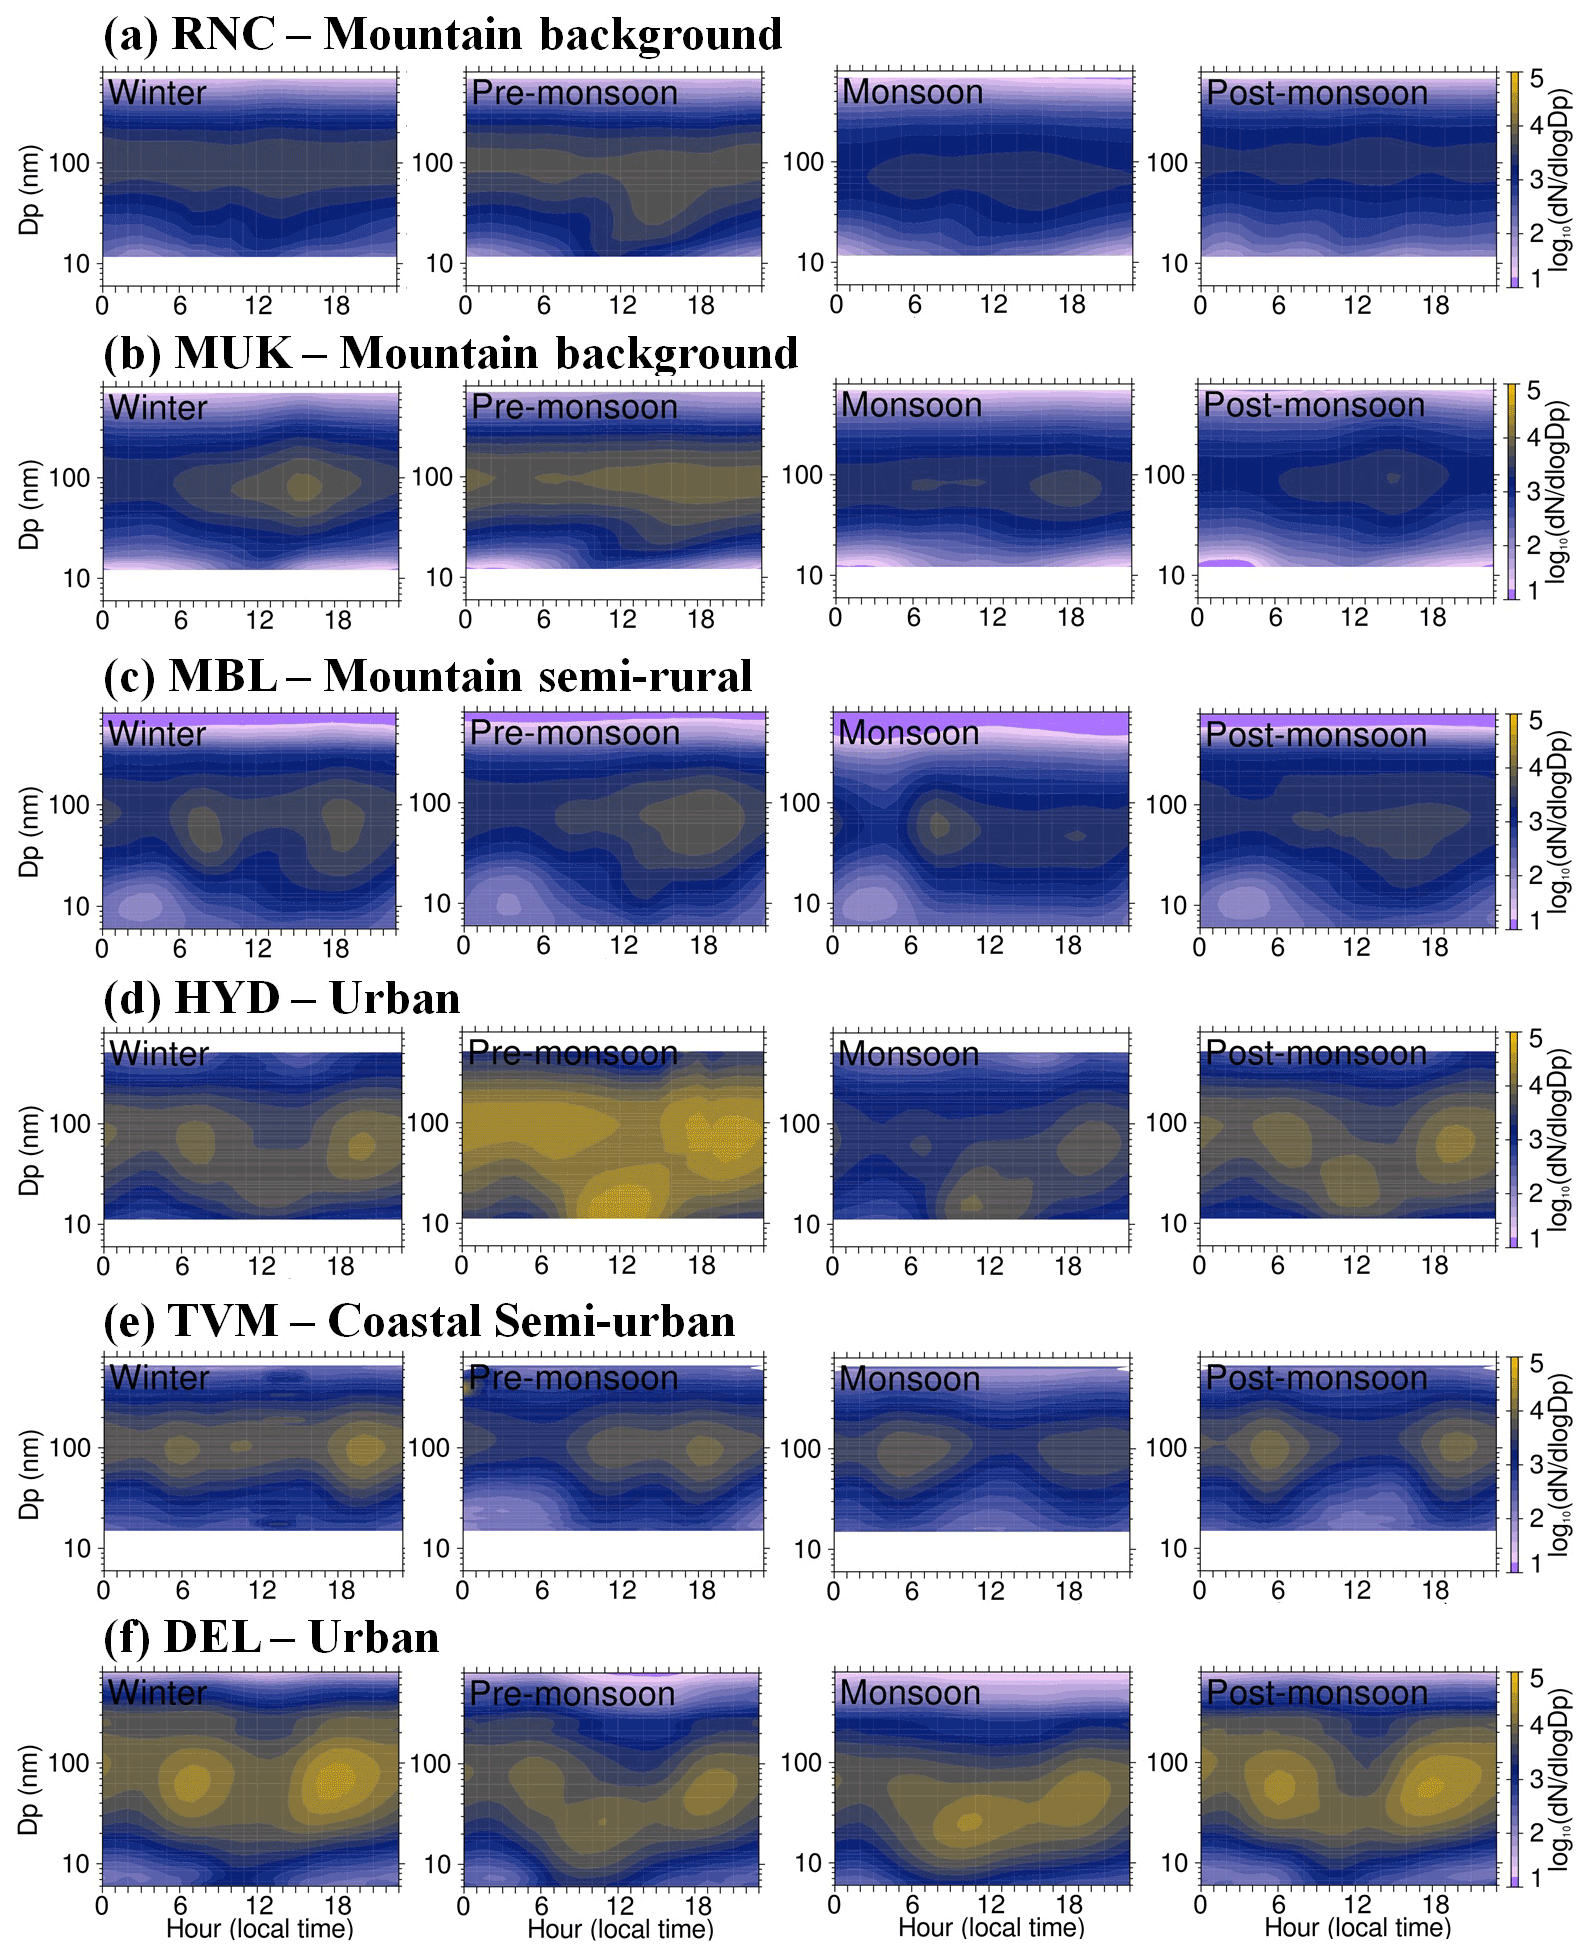
Figure 4The diurnal–seasonal median particle number size distributions at all the sites: (a) Ranichauri, (b) Mukteshwar, (c) Mahabaleshwar, (d) Hyderabad, (e) Thiruvananthapuram, and (f) Delhi. Note that measurements are from different time periods for each site (see Table 1).
Figure 5 shows the box–whisker plot of the seasonal number concentrations of Aitken, accumulation, and total particles at all the sites. The periods of study are different for all the sites, where direct comparison of particle number concentrations is not possible. The median Aitken mode particle number concentrations are the lowest at RNC (1.4 × 103 cm−3) and the highest at DEL (7.1 × 103 cm−3). The median accumulation mode particle number concentrations are the lowest at MUK (0.9 × 103 cm−3) and the highest at DEL (2.4 × 103 cm−3). The total particle number concentrations are the lowest at MUK (2.7 × 103 cm−3) and the highest at DEL (12.5 × 103 cm−3). The median particle number concentrations are about five-fold higher in urban locations (HYD, TVM, and DEL) than mountain sites (RNC, MUK, and MBL). Overall, the size-segregated particle number concentrations show strong seasonal spatial variability, with the lowest concentrations at the mountain sites and the highest at the urban sites. Further, the size-segregated particle number concentrations also show larger variability in each urban location than in the mountain sites. Next, we discuss the seasonality in the number concentration of Aitken, accumulation, and total particles in all locations to understand space- and time-varying heterogeneity in particle number concentrations.

Figure 5Box–whisker plot of seasonal number concentrations of (a) Aitken mode, (b) accumulation mode, and (c) total particles using the entire data. The blue, red, green, and gray colors indicate winter (DJF), pre-monsoon (MAM), monsoon (JJAS), and post-monsoon (ON) months. The solid square indicates the mean, horizontal line indicates the median, the top and bottom of the box indicate 25th and 75th percentile values, and the top and bottom whiskers indicate 10th and 90th percentile values. Note that measurements are from different time periods for each site (see Table 1).
The relative occurrence of the number concentrations of size-segregated (Aitken and accumulation) particles was calculated to determine the maximum concentrations of a given particle mode in different seasons at all sites. The histograms of the relative occurrence of Aitken mode particle number concentrations at all the sites are presented in Fig. 6a–f. The mountain background sites RNC and MUK show a similar seasonality in number concentration histograms of Aitken mode particles, with the highest concentrations in the pre-monsoon season. The lowest concentrations are observed in monsoon and post-monsoon due to increased removal of particles by wet scavenging. MBL does not show notable seasonality in the number concentration histograms of Aitken mode particles. HYD, TVM, and DEL are urban environments but show different seasonality in the number concentration histograms of Aitken mode particles. DEL shows the highest Aitken mode particle number concentrations in winter and post-monsoon; TVM shows the highest concentrations in winter. In contrast, HYD shows comparable number concentrations in winter, pre-monsoon, and post-monsoon. The highest Aitken mode number concentrations in pre-monsoon at the mountain background sites are attributed to the high frequency of NPF occurrence in pre-monsoon (see Sect. 3.2.1). The highest Aitken mode number concentrations in winter at the urban sites can be explained by the high pre-existing particle concentration. DEL has the highest concentration of Aitken mode particles during winter owing to the anthropogenic sources and the stagnant atmospheric conditions during the season (Kanawade et al., 2020b). The difference in seasonality in the number concentration histograms of Aitken mode particles can be explained by the differences in the atmospheric conditions (e.g., prevailing synoptic air masses; mesoscale processes such as planetary boundary layer, PBL, dynamics; and particle removal processes) and considerable heterogeneity in aerosol composition (natural versus anthropogenic aerosol emission sources); DEL is representative of a sub-tropical climate, HYD is representative of a tropical climate, and TVM is representative of a tropical coastal climate.
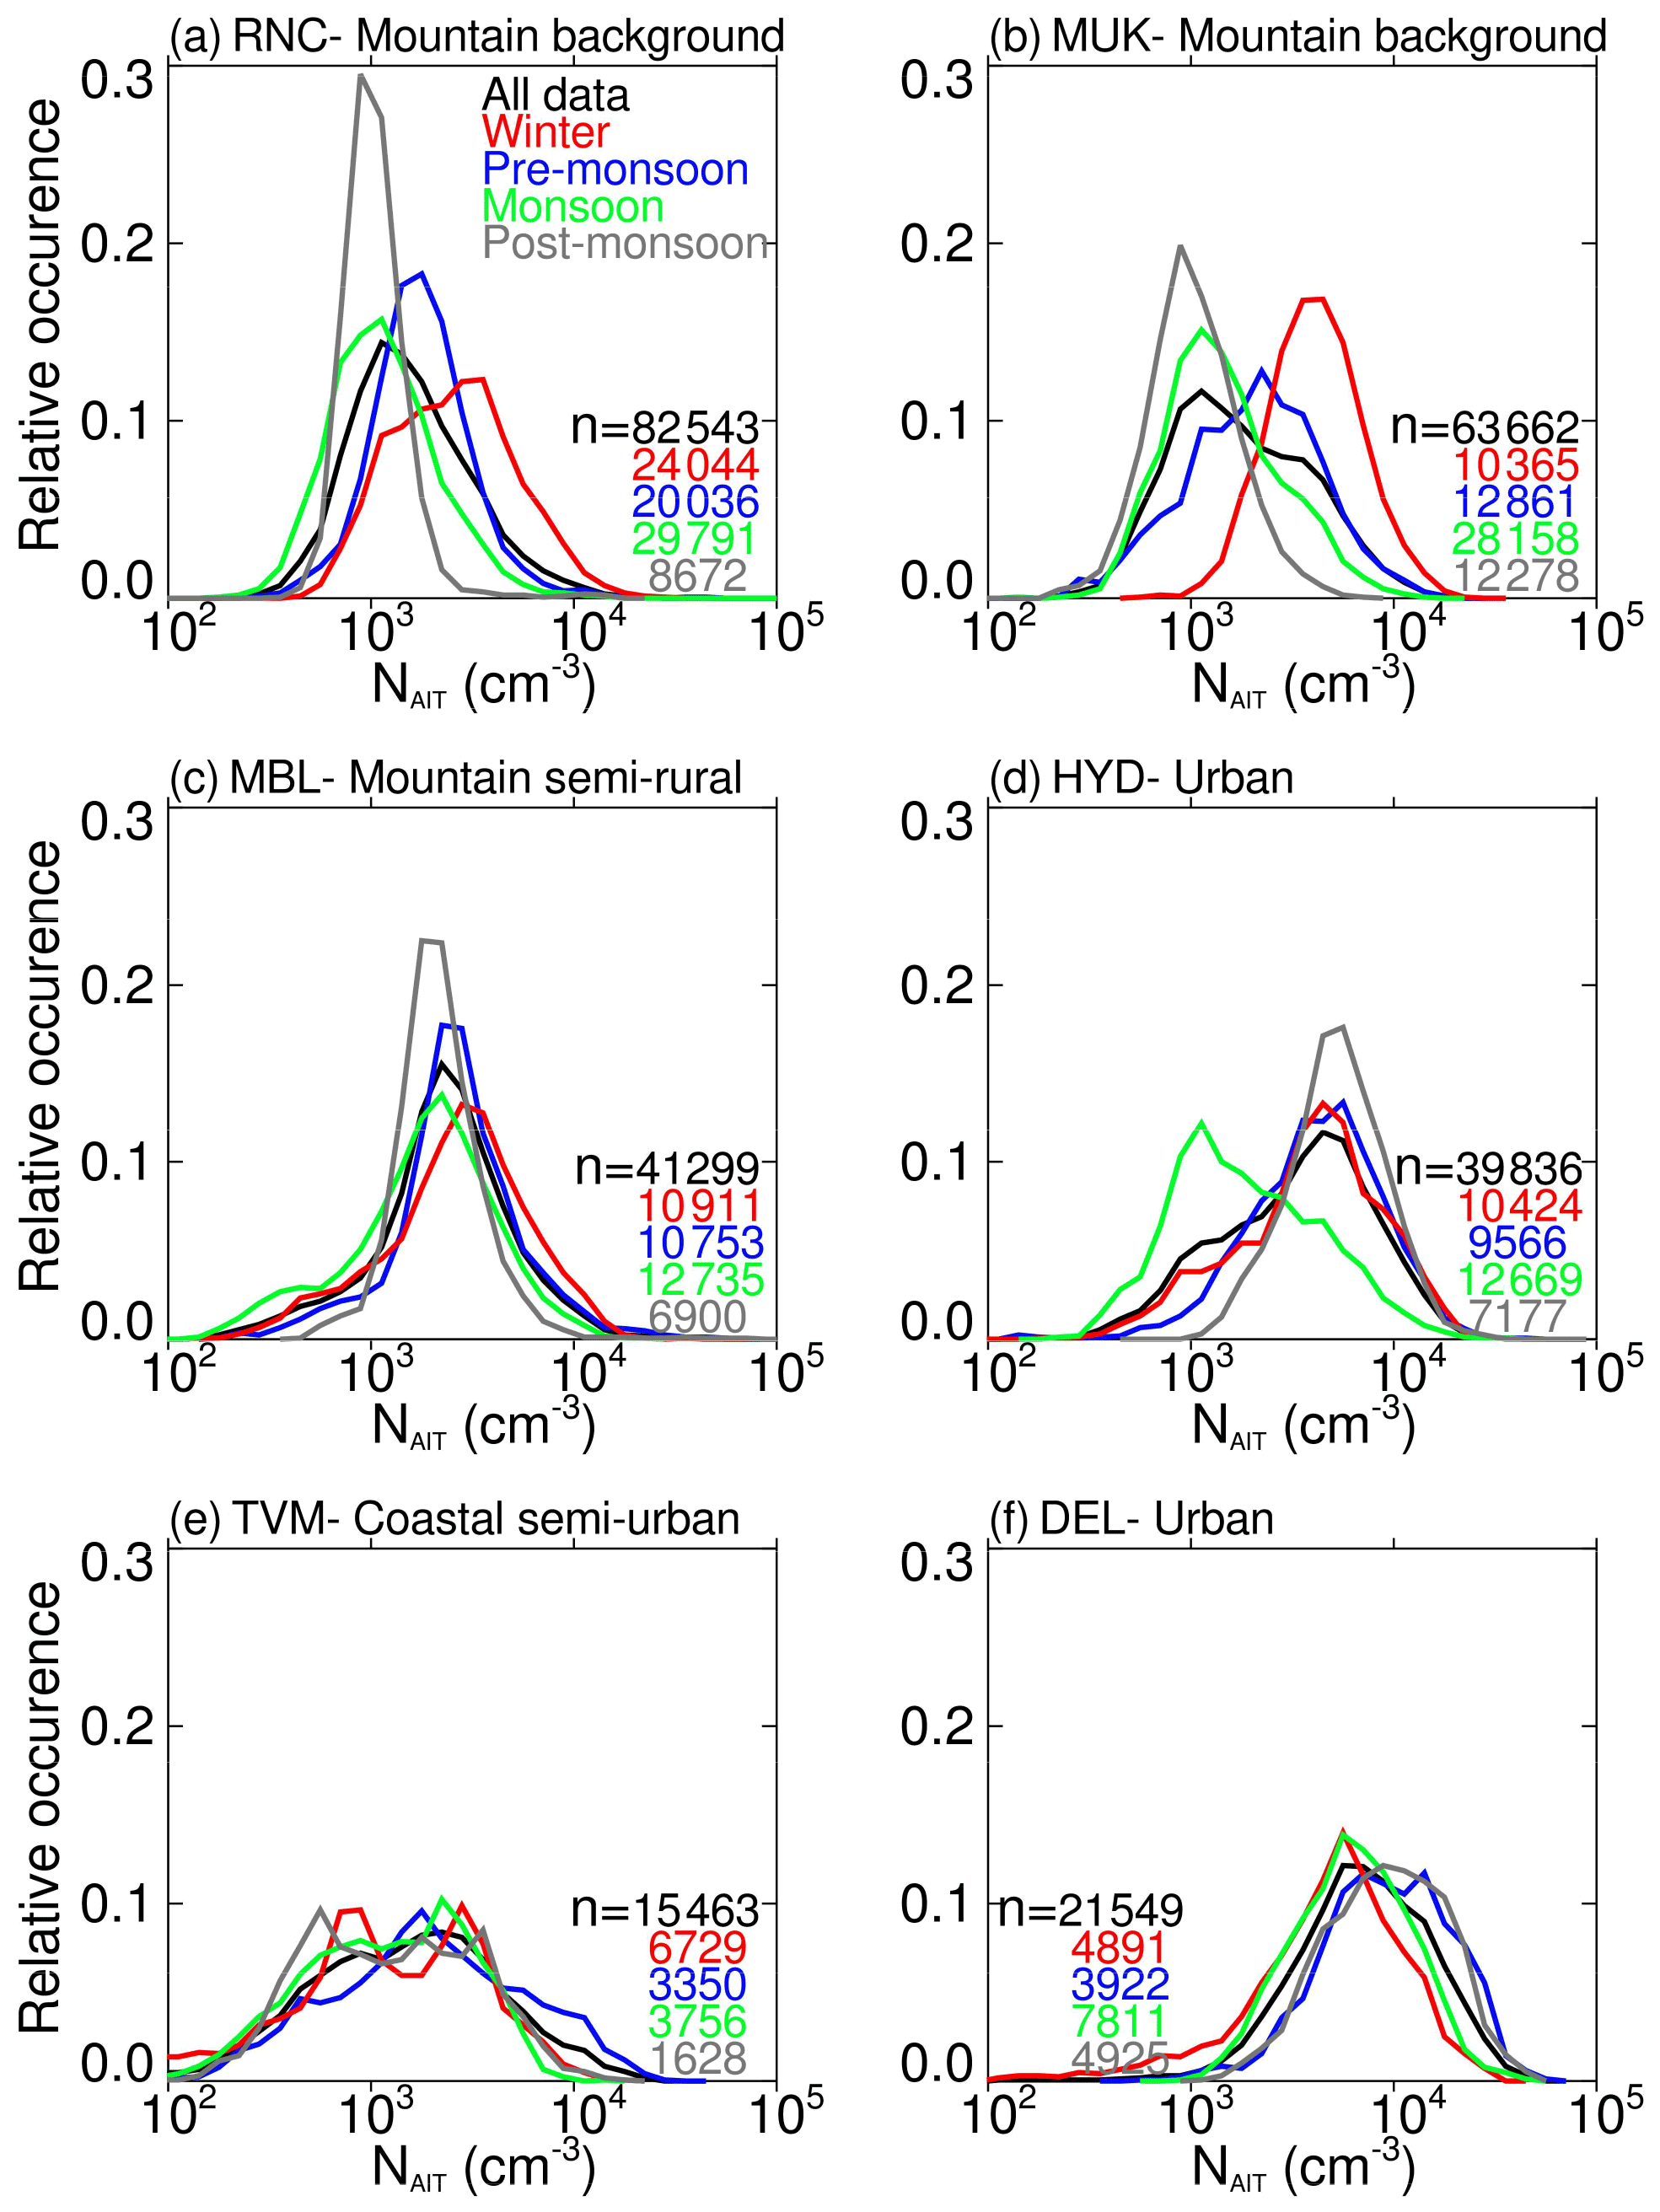
Figure 6Histogram of the relative occurrence of Aitken mode particle number concentrations at the sites. The concentration bins are logarithmically spaced on the x axis, and the y axis shows the relative occurrence of values in each bin compared to the total number of valid observations. The black, blue, red, green, and gray lines indicate all data, winter (DJF), pre-monsoon (MAM), monsoon (JJAS), and post-monsoon (ON), respectively. n indicates the number of 10 min averaged valid data points. Note that measurements are from different time periods for each site (see Table 1).
Similar histograms of accumulation mode particles are presented in Fig. 7a–f. The seasonality in accumulation mode particles is slightly different as compared to Aitken mode particles at some sites. RNC shows similar number concentration histograms of accumulation mode particles in winter and pre-monsoon instead of dissimilar histograms for Aitken mode particles. The number concentration histograms of accumulation mode particles at MUK are similar to Aitken mode particles. MBL shows similar number concentration histograms in winter, pre-monsoon, and post-monsoon, with the lowest concentrations in monsoon due to wet scavenging. Among the urban sites, DEL shows the highest accumulation mode concentrations in post-monsoon and winter. TVM and HYD show the highest accumulation mode concentrations in winter and post-monsoon, respectively. The seasonality in total particles was also similar to Aitken mode particles, indicating that they constituted the most considerable fraction of total particles at all the sites (Fig. S2). However, it is difficult to separate a fraction of Aitken or accumulation mode particles that originated from NPF from that of the primary emissions, especially in urban areas where the primary emission rates of aerosols are very high (Thomas et al., 2019). The survival probability of newly formed particles to > 50–100 nm size depends on many factors such as the frequency and intensity of the NPF occurrence, availability of condensable vapors, pre-existing particles, and atmospheric conditions. In Sect. 3.2.3, we estimate the absolute increase of CCN concentrations from NPF following the methodology given by Kerminen et al. (2012) and modified to calculate CCN concentrations for any given NPF event.
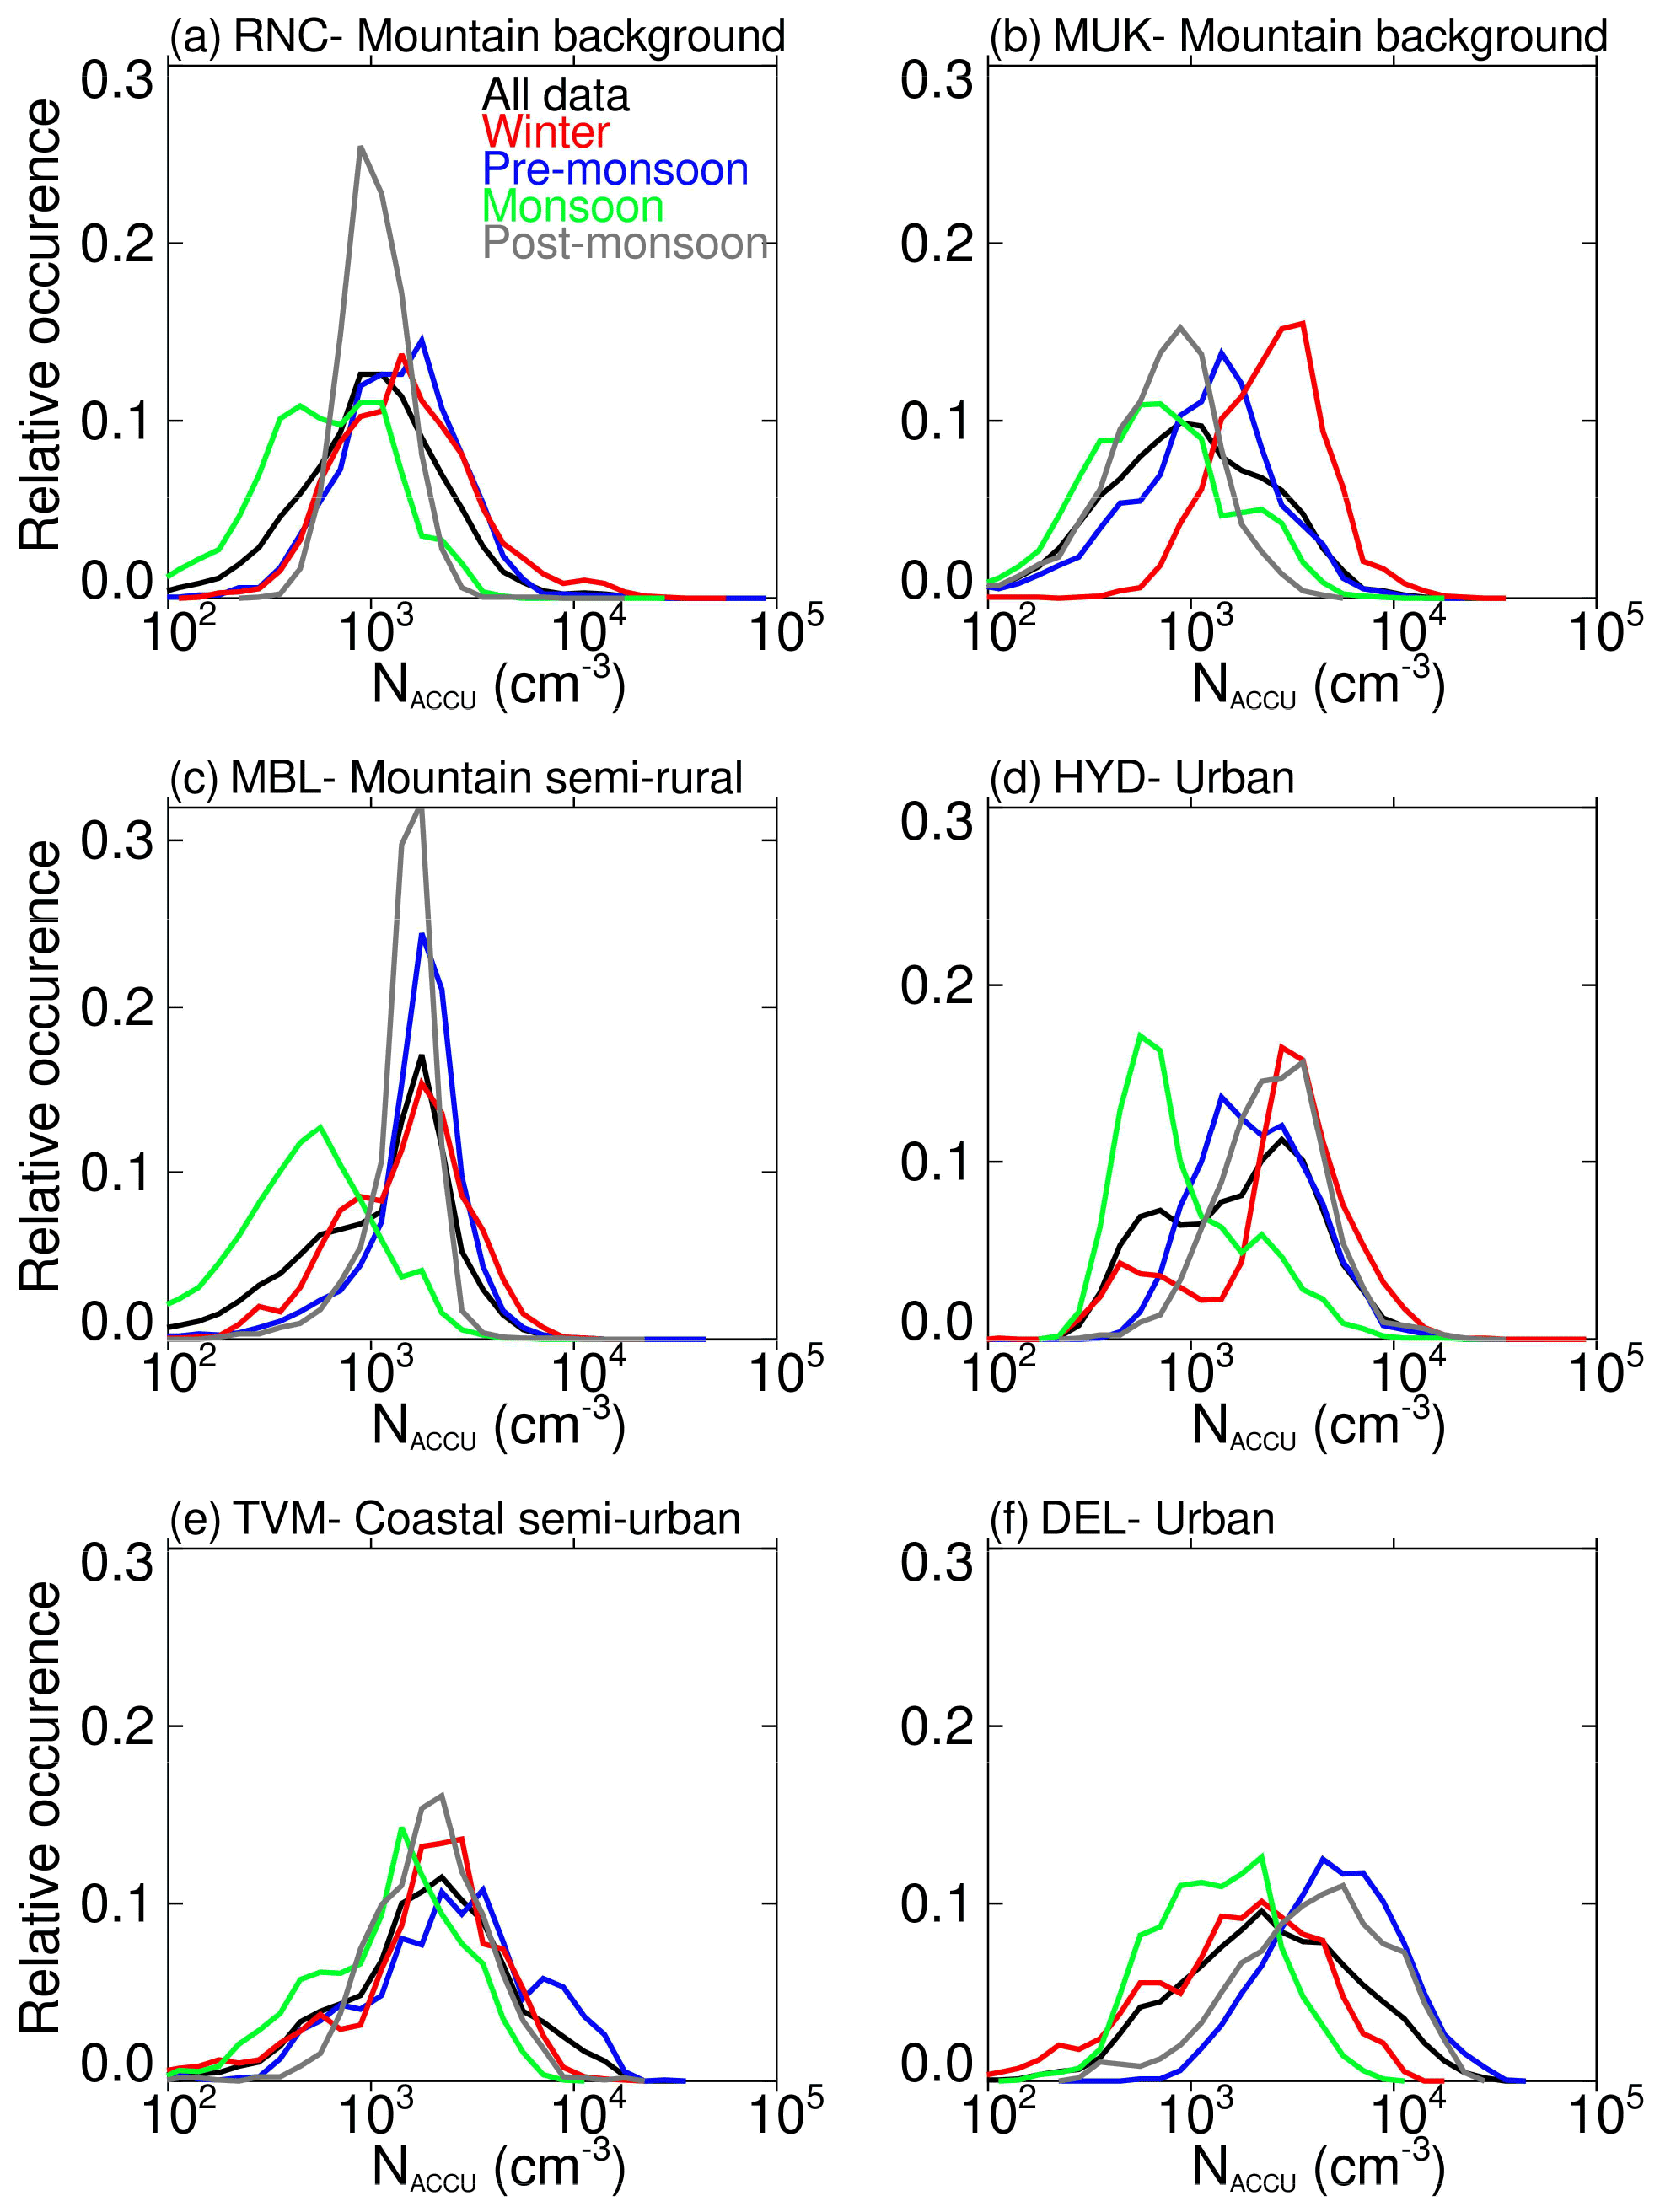
Figure 7Histogram of the relative occurrence of accumulation mode particle number concentrations at the sites. The concentration bins are logarithmically spaced on the x axis, and the y axis shows the relative occurrence of values in each bin compared to the total number of valid observations. The black, blue, red, green, and gray lines indicate all data, winter (DJF), pre-monsoon (MAM), monsoon (JJAS), and post-monsoon (ON), respectively. n indicates the number of 10 min averaged valid data points. Note that measurements are from different time periods for each site (see Table 1).
3.2 New particle formation and its contribution to CCN concentrations
3.2.1 NPF event characteristics
The frequency of occurrence of NPF events, the particle formation rate of nucleation mode particles (JSDS), and the particle growth rate of nucleation mode particles (GRSDS-25 nm) are typically derived to quantify the NPF (Kerminen et al., 2018; Nieminen et al., 2018; Kulmala et al., 2004). These NPF characteristics are closely associated with aerosol precursor concentrations, pre-existing aerosol particles, and atmospheric conditions. As a result, the frequency of occurrence of NPF events varies from one location to another as well as seasonally. NPF is thought to occur frequently during the spring (pre-monsoon) and rarely during the winter (Kanawade et al., 2012; Dal Maso et al., 2005; Nieminen et al., 2018). However, NPF events were also observed frequently during thermal winter (Kulmala et al., 2004; Pikridas et al., 2012) and fall (September, October, and November; Rodríguez et al., 2005). These studies indicate that there is no universal pattern in the occurrence of NPF events. Figure 8 shows the percentage of NPF, non-event, and undefined event days based on valid observation days at all the sites. Out of a total of 586 valid observation days at RNC, NPF events occurred on 21 d (3.9 %), whereas 493 (83.7 %) were non-event days. Out of a total of 440 valid observation days at MUK, NPF events occurred on 13 d (2.9 %), whereas 321 (73.1 %) were non-event days. Out of a total of 281 valid observation days at MBL, NPF events occurred on 16 d (5.9 %), whereas 188 (66.1 %) were non-event days. Out of a total of 270 valid observation days at HYD, NPF events occurred on 38 d (16.3 %), whereas 124 (44.8 %) were non-event days. Out of a total of 133 valid observation days at TVM, NPF events occurred on 23 d (16.6 %), whereas 55 (41.4 %) were non-event days. Out of a total of 139 valid observation days at DEL, NPF events occurred on 39 d (28.1 %), whereas 30 (21.1 %) were non-event days. The frequencies of NPF occurrence at all six sites are tabulated in Table S2.
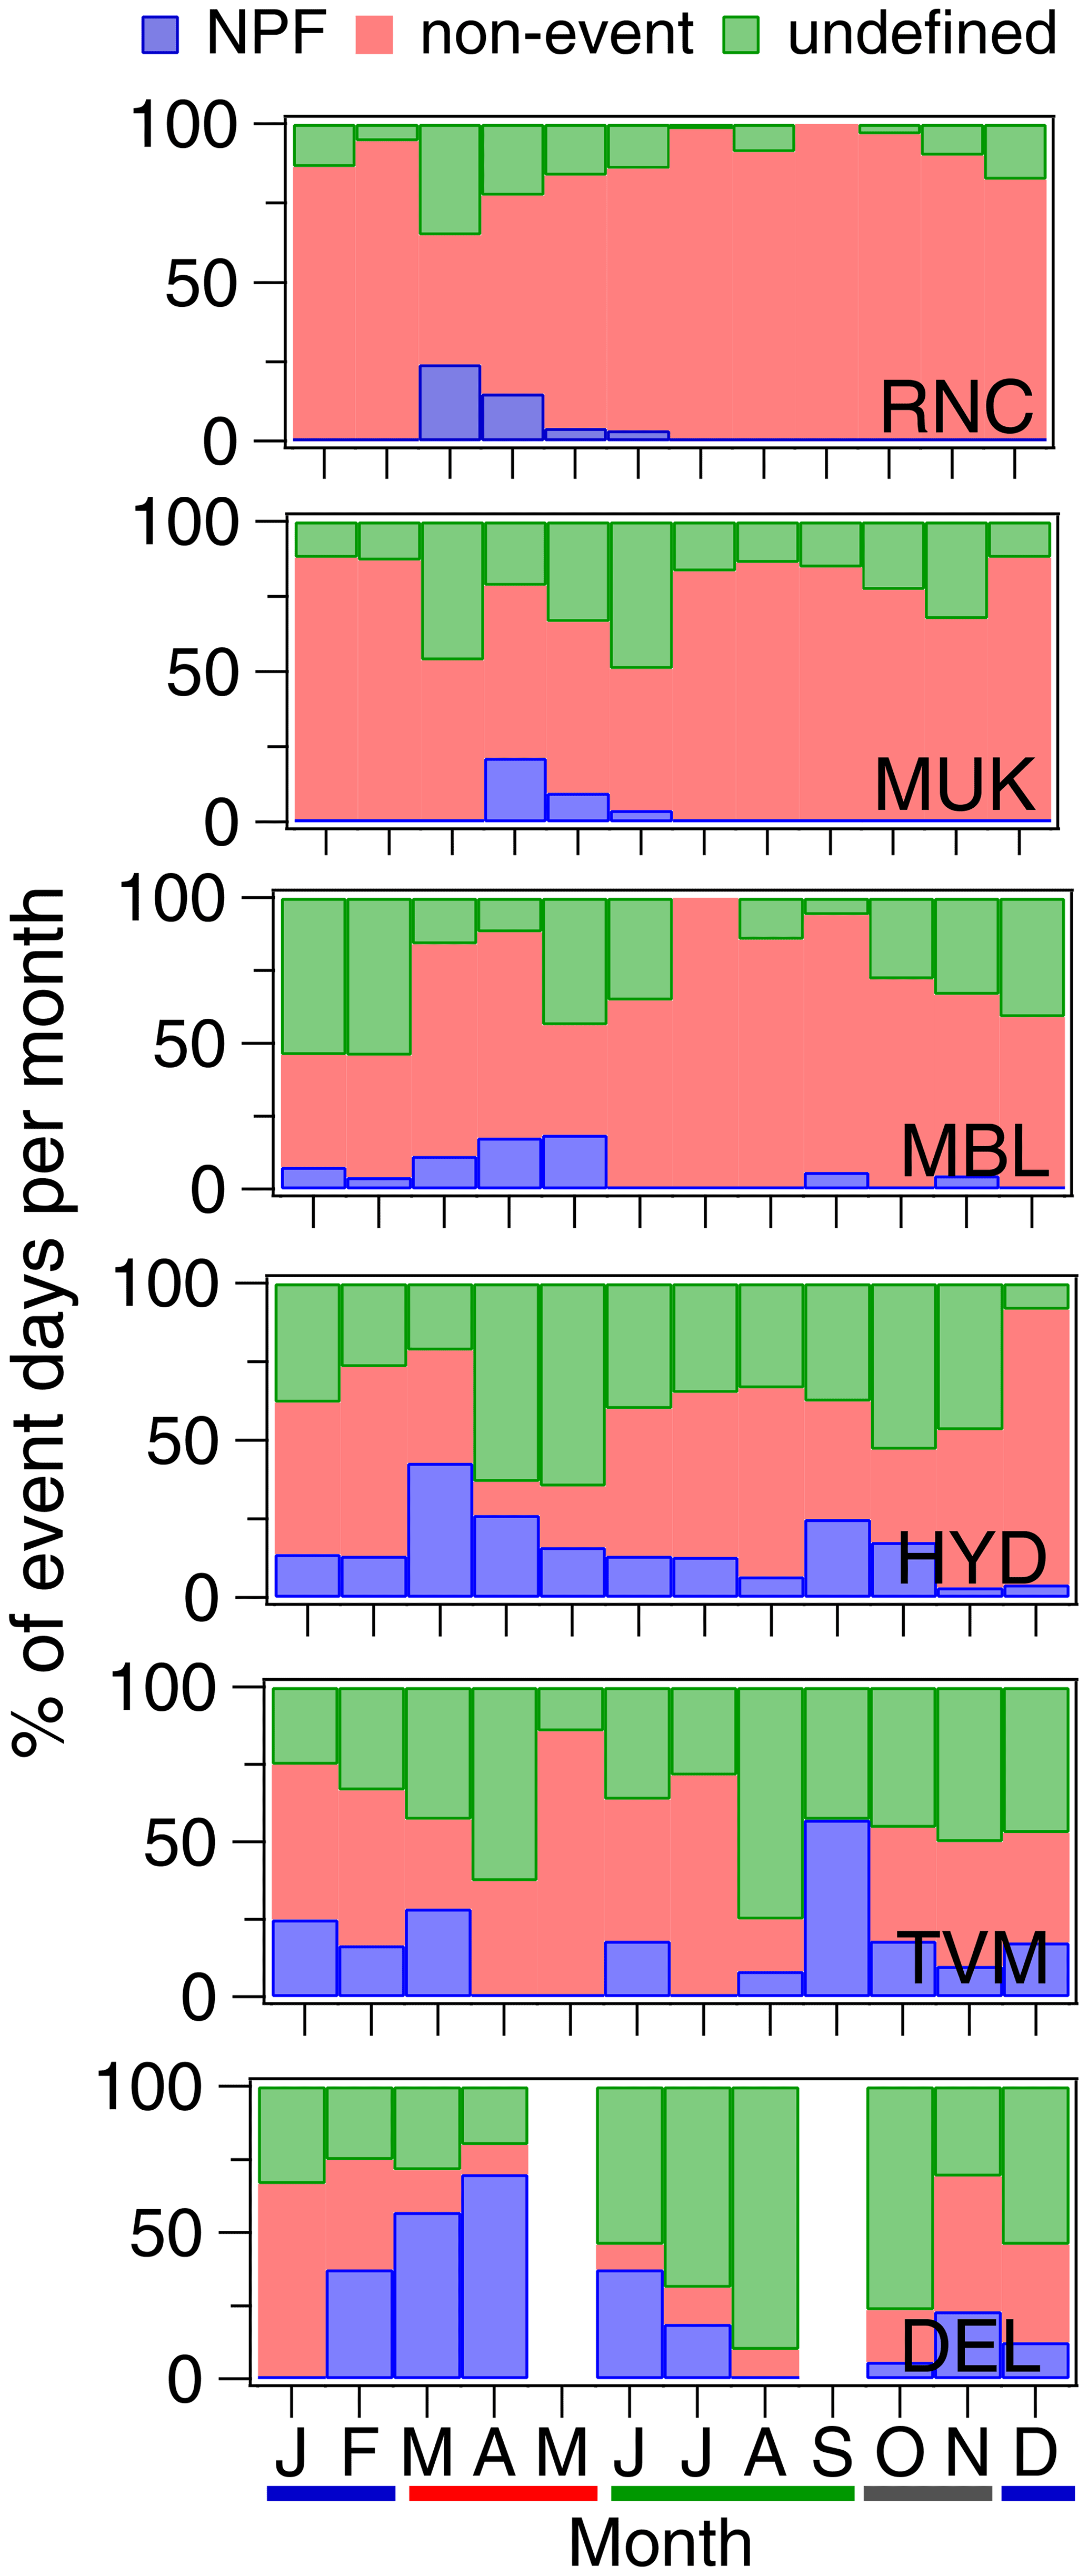
Figure 8Monthly percentage of occurrence of NPF, non-event, and undefined events days based on total valid observations days at all the sites. The thick blue, red, green, and gray lines indicate winter, pre-monsoon, monsoon, and post-monsoon months. Note that measurements are from different time periods for each site (see Table 1).
3.2.2 Particle formation rate and growth rate
Overall, the frequency of occurrence of NPF is the highest in pre-monsoon as compared to other seasons. There is also an exception to this, with the highest frequency of NPF occurrence in the late monsoon (September) at TVM. Babu et al. (2016) reported that NPF events over this site occurred due to a mixing of contrasting air masses due to the combined effect of mesoscale land–sea breeze circulation and local ABL dynamics. Though prevailing air masses are oceanic, the wind speeds and total rainfall were lower during September than other monsoonal months. A cleaner synoptic air mass (i.e., lower background concentrations and condensation sink), combined with the occurrence of well-defined mesoscale land–sea breeze transitions and horizontal convergence of contrasting air masses during September, was responsible for the highest NPF frequency. Among the sites, the mountain background sites in the western Himalaya (RNC and MUK) have the lowest annual mean frequency of occurrence of NPF (3.9 % and 2.9 %, respectively), with the highest seasonal frequency of occurrence of NPF in pre-monsoon. Previous studies also showed the infrequent occurrence of NPF at RNC (Sebastian et al., 2021b) and MUK (Neitola et al., 2011), with the highest frequency in pre-monsoon. The highest NPF frequency in pre-monsoon was connected to the PBL lifting up to the measurement site elevation, which appeared to transport aerosol precursors from nearby polluted lower-altitude regions (Hooda et al., 2018; Raatikainen et al., 2014). However, NPF occurred frequently (39 %) at the Nepal Climate Observatory-Pyramid (NCO-P) site in the eastern Himalaya (Venzac et al., 2008). A recent study also observed a very high NPF frequency (69 %) at NCO-P from November to December when cleaner conditions prevailed, with little transportation from the polluted lower-altitude regions (Bianchi et al., 2021). They showed that up-valley winds bring gaseous aerosol precursors to higher altitudes. These precursors are oxidized into compounds of very low volatility and are subsequently converted into new particles during their transport to the site. The above discussion indicates that the RNC and MUK mountain background sites in the western Himalayas are strikingly different from the NCO-P site in the eastern Himalayas (Bianchi et al., 2021). The annual NPF frequency at RNC and MUK is lower than MBL and the high-altitude sites in Europe (Nieminen et al., 2018). DEL has the highest frequency of occurrence of NPF events in pre-monsoon (63.8 %), followed by HYD (28.4 %) and MBL (15.9 %). The TVM coastal semi-urban site witnesses frequent NPF events under the influence of continental air masses. As the air masses change from continental to mixed or marine origin, the NPF event frequency decreases (Babu et al., 2016). NPF was also observed commonly at other urban sites in India (Kanpur and Pune) under a high source of aerosol precursors when pre-existing particle concentrations reduced sufficiently due to dilution (Kanawade et al., 2020a; Kanawade et al., 2014b). While the severe air pollution episode in Delhi in November 2016 suppressed NPF, co-condensation of vapors of anthropogenic origin along with water onto primary particles assisted rapid particle growth (1.6 to 30.3 nm h−1; Kanawade et al., 2020b). The emission of precursor compounds from traffic and other sources in Beijing, China, also contributed significantly to molecular cluster formation, particle growth, and secondary aerosol mass formation, leading to haze formation under favorable meteorological conditions (Kulmala et al., 2021). In Europe, atmospheric conditions (such as the solar radiation and relative humidity) appear to dictate NPF occurrence at rural sites, whereas the increased concentrations of precursor gases are more important for the occurrence of NPF in urban areas (Bousiotis et al., 2021). This explains why NPF occurs more frequently in urban areas than rural, remote or high-altitude locations (Guo et al., 2020; Nieminen et al., 2018; Sellegri et al., 2019). This also indicates that the balance between the precursor concentration and pre-existing particles plays a vital role in the NPF occurrence. Owing to large spatial heterogeneity in aerosol precursor emissions and background aerosol concentrations in India, the chemical species contributing to aerosol nucleation and growth have not been identified (Kanawade et al., 2021).
Figure 9 shows a scatter plot of the JSDS and the GRSDS-25 nm as a function of the condensation sink at each site. A fairly good correlation between JSDS and GRSDS-25 nm at each site (Pearson correlation coefficient of 0.48, 0.78, 0.85, 0.33, 0.68, and 0.18 at RNC, MUK, MBL, HYD, TVM, and DEL, respectively) indicates that JSDS and GRSDS-25 nm are strongly coupled. The large scatter in data points is a result of important factors influencing the NPF, such as nucleation mechanisms (Dunne et al., 2016), the availability of other condensable vapors that are needed to stabilize molecular clusters containing sulfuric acid (Kirkby et al., 2011; Schobesberger et al., 2015), and atmospheric conditions (Bousiotis et al., 2021). A recent study showed that amines stabilize the nucleating cluster while organics contribute to higher concentrations of condensable vapors, particularly in urban areas (Xiao et al., 2021). The mean particle formation rates and growth rates for all six sites are tabulated in Table S2. Considering all the sites, GRSDS-25 nm during NPF events varied from 0.2 to 17.2 nm h−1. Overall, JSDS and GRSDS-25 nm are within the observed large range of values in diverse environments in India and elsewhere (Nieminen et al., 2018; Kerminen et al., 2018; Kulmala et al., 2004). Expectedly, the mean condensation sink at the start of the NPF event is higher at the urban sites than the mountain sites. The mean condensation sink at the urban sites (16.1 × 10⁻³ s−1) was twice that of the mountain sites (7.9 × 10⁻³ s−1). A previous study also showed that the higher pre-existing particles at Kanpur than at Pune suppressed the particle formation rate but favored particle growth under high concentrations of condensable vapors (Kanawade et al., 2014b).
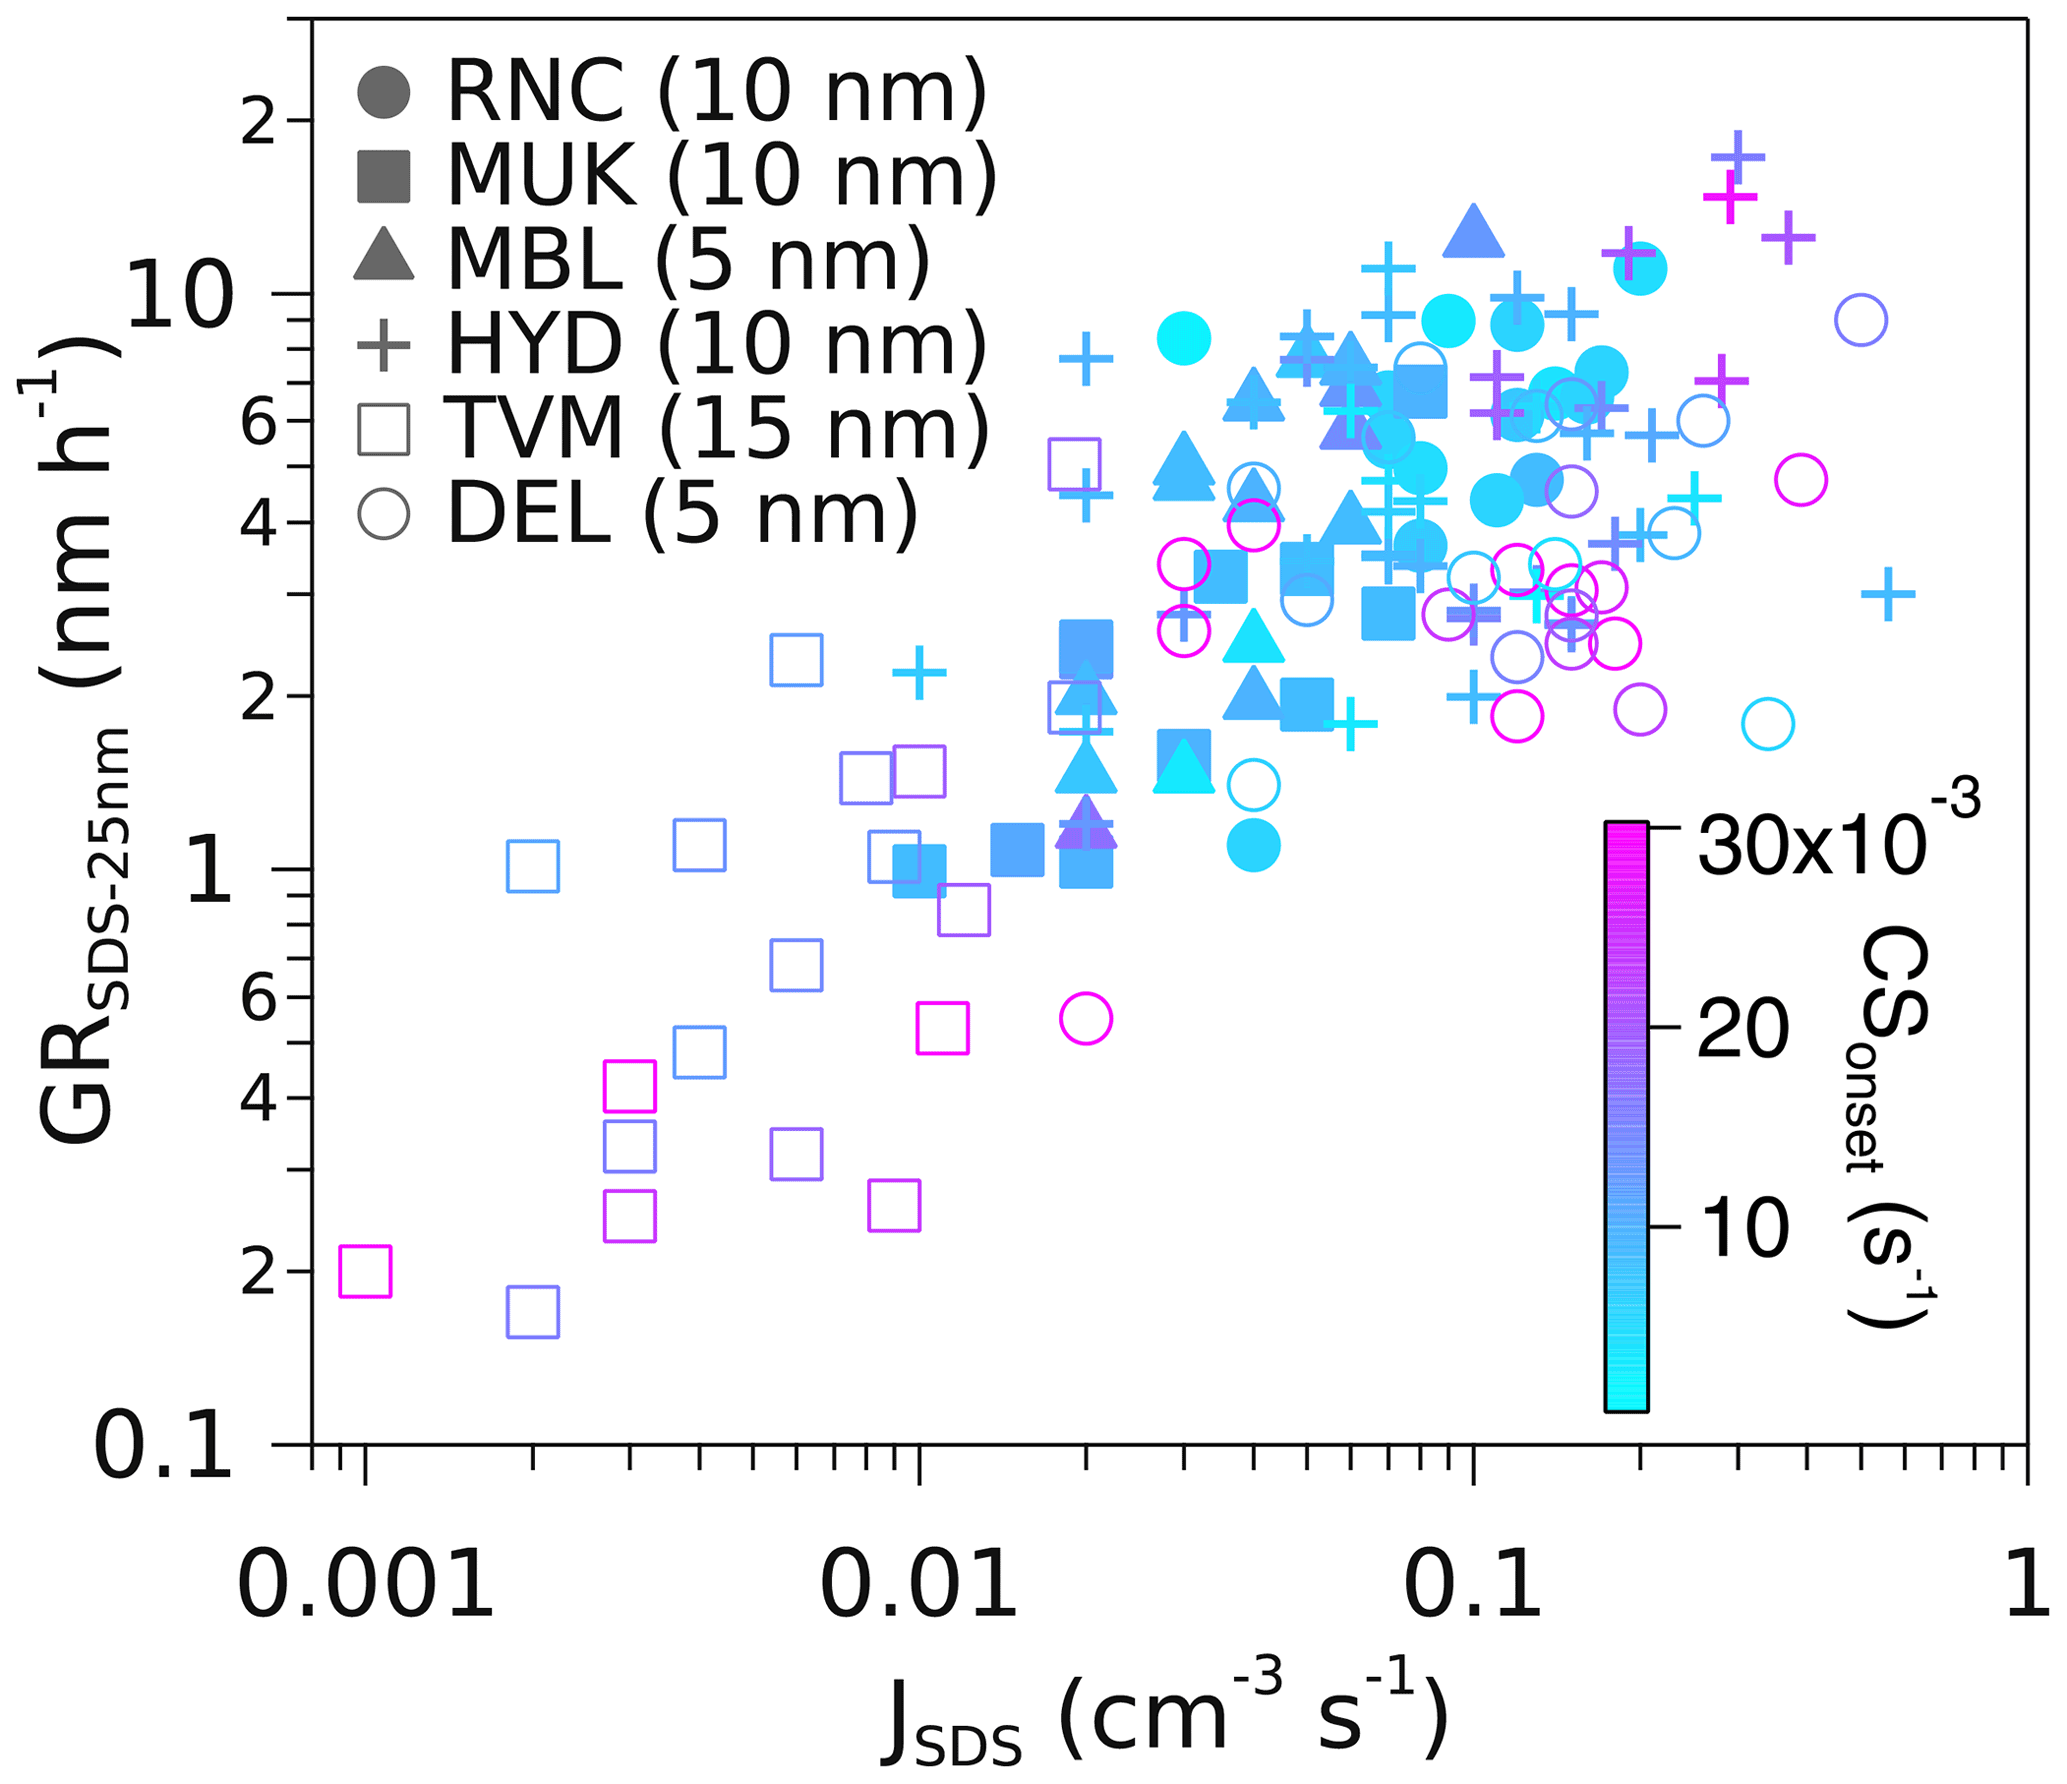
Figure 9Scatter plot of the particle formation rate and the growth rate as a function of the condensation sink at each site. The condensation sink at the start of the event (CSonset) is taken as a 1 h average CS just before the start of the NPF event. The smallest detectable size (SDS) of the nucleation mode at each site is shown in the bracket. Note that measurements are from different time periods for each site (see Table 1).
3.2.3 Increase in CCN concentrations during NPF events
To reach climatologically relevant sizes, the newly formed particles must grow by condensation while avoiding coagulation removal by pre-existing particles because these freshly formed particles are small and highly diffusive (Vehkamäki and Riipinen, 2012). Based on the observed range of particle growth rates at all the sites (0.2 to 17.3 nm h−1), newly formed particles may take from a few hours to 1–2 d to grow to CCN active sizes (> 50–100 nm). Over such timescales, it is observationally challenging to separate CCN originating from NPF from those emanating from the growth of small primary particles and direct emissions of CCN active sized particles. The increase in CCN concentrations during any given NPF event was estimated following the methodology developed by Kerminen et al. (2012), which we modified to remove CCN originating from the growth of small primary particles and direct emissions of CCN active sized particles based on non-event days.
Figure 10 shows the box–whisker plot of the absolute increase in CCN concentrations (50 and 100 nm) at all the sites. Considering all NPF events at mountain sites, the increase in CCN50 ranged from 0.168 × 103 cm−3 to 5.2 × 103 cm−3 per event, with a median value of 2.7 × 103 cm−3 per event, whereas the increase in CCN100 ranged from 0.02 × 10³ to 1.9 × 103 cm−3 per event, with a median value of 1.0 × 103 cm−3 per event. The increases in CCN50 and CCN100 are about two-fold lower than the free tropospheric site, Chacaltaya (5240 m a.m.s.l., Bolivia), for NPF events that started in the boundary layer (5.1 × 10³ and 1.5 × 103 cm−3 per event for 50 and 100 nm, respectively; Rose et al., 2017). The median increase in CCN50 and CCN100, respectively, at RNC (2.3 × 10³ and 0.9 × 103 cm−3 per event) and MUK (2.9 × 10³ and 0.9 × 103 cm−3 per event) are comparable to those reported at Botsalano (2.5 × 10³ and 0.8 × 103 cm−3 per event; 1420 m a.m.s.l., South Africa), but about three-fold higher than those reported at a remote continental site in Finland (1.0 × 10³ and 0.2 × 103 cm−3 per event; Kerminen et al., 2012). Considering all NPF events at the urban sites, the CCN50 increase ranged from 0.08 × 10³ to 9.4 × 103 cm−3 per event, with a median value of 4.3 × 103 cm−3 per event, whereas CCN100 increase ranged from 0.03 × 10³ to 4.9 × 103 cm−3 per event, with a median value of 1.2 × 103 cm−3 per event. These values are about two-fold lower compared to values reported at the station of San Pietro Capofiume, in a polluted region of the Po Valley; 7.3 × 10³ and 2.4 × 103 cm−3 per event, respectively, for 50 and 100 nm (Laaksonen et al., 2005). High background number concentrations of CCN50 and CCN100 in Delhi resulted in a smaller relative increase of CCN from NPF during the post-monsoon and winter seasons when compared to the other sites. In order to comprehensively investigate the atmospheric CCN budget and the contribution of NPF to it, Kerminen et al. (2012) pointed out that the analysis should include not only NPF events but also non-event days. Therefore, the modified methodology applied here following Kerminen et al. (2012) provides the best representative of the increase in CCN concentrations for an NPF event.
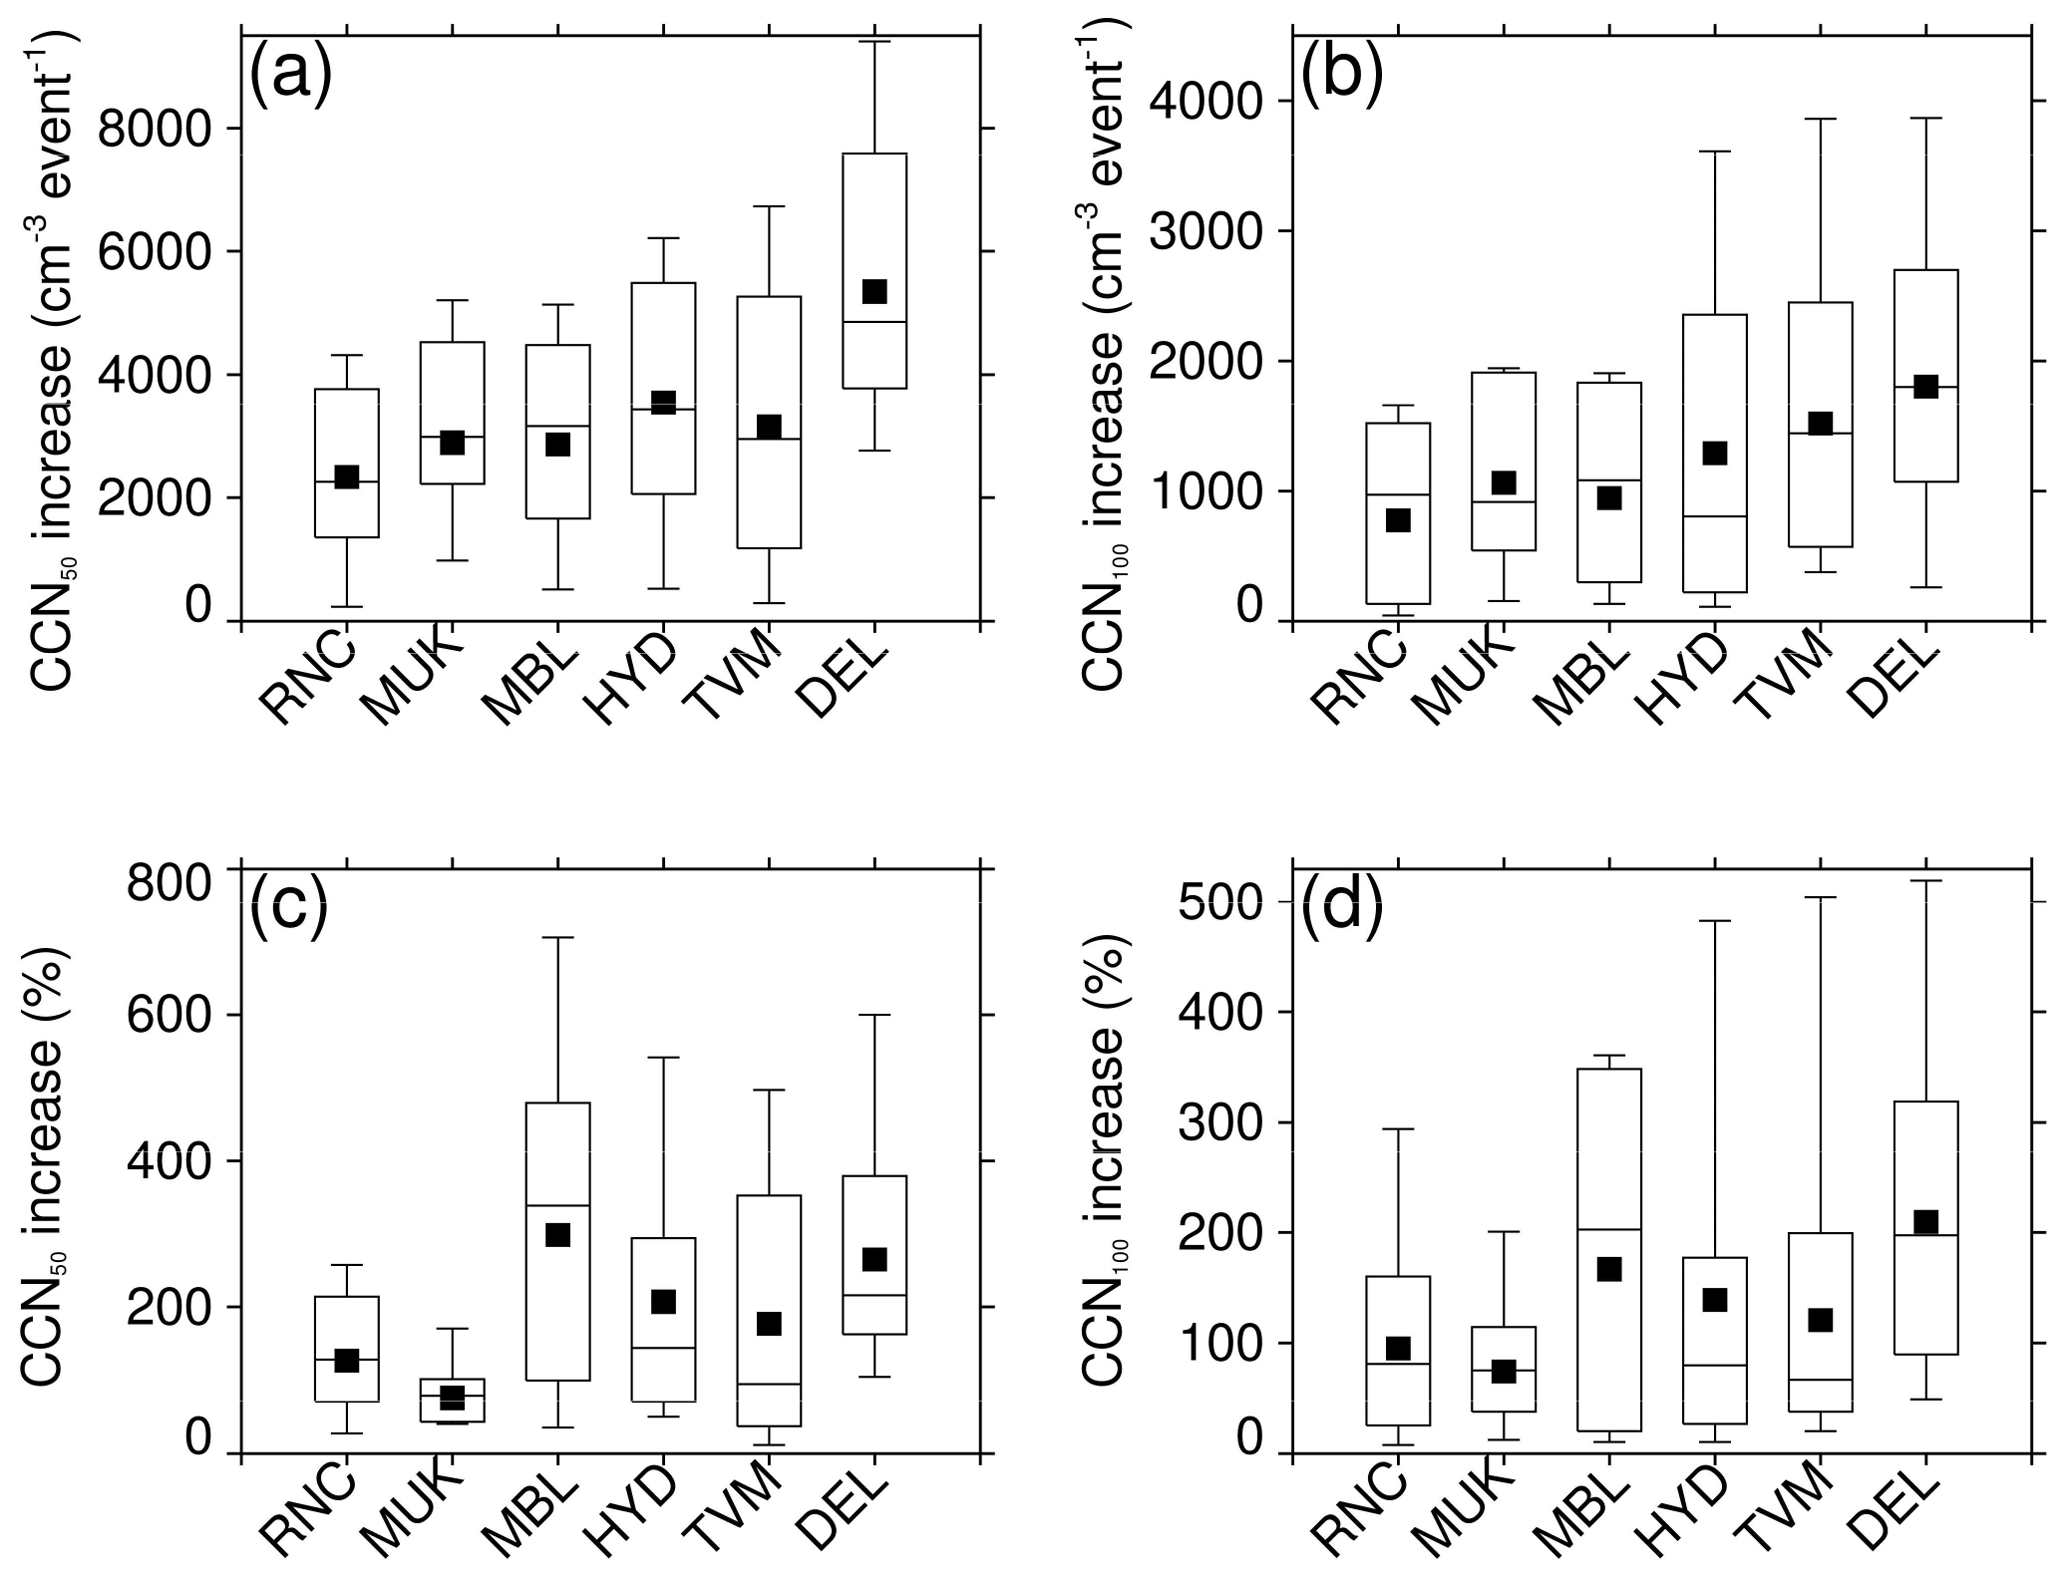
Figure 10Box–whisker plot of absolute increase in CCN concentrations for (a) 50 and (b) 100 nm particles and percentage increase in CCN concentrations for (c) 50 and (d) 100 nm at all the sites based on observed NPF and non-event days. The solid square indicates the mean, the horizontal line indicates the median, the top and bottom of the box indicate 25th and 75th percentile values, and the top and bottom whiskers indicate 10th and 90th percentile values. Note that measurements are from different time periods for each site (see Table 1).
The sites with low pre-existing particle concentrations (hence, low condensation sink values), high solar radiation, and cooler temperatures at high altitudes (or in the free tropospheric; RNC, MUK, and MBL) should favor NPF with enhanced frequency as compared to near-surface urban environments (HYD, TVM, and DEL) wherein pre-existing particles concentration are high, leading to faster removal of nucleating vapors. However, NPF in polluted environments occurs more often than expected, with enhanced growth rates (Yu et al., 2017). Guo et al. (2014) also reported that NPF leads to winter-time haze formation in Beijing. Kulmala et al. (2021) recently showed that > 65 % of the number concentration of haze particles resulted from NPF in Beijing. The observation sites at altitudes higher than 1000 m a.m.s.l. also favored NPF at the high condensation sinks, and linked precursor gases needed to initiate nucleation and early growth (Sellegri et al., 2019). Therefore, the low condensation sinks are not necessarily required to trigger nucleation and early growth, provided there are high vapor production rates. The high pre-existing particle concentration is also an indication of precursor-laden air. However, when the condensation sink gets very high, it inhibits aerosol nucleation. Further, at Hyderabad, about half of the NPF events did not display aerosol nucleation (sub-3 nm particle formation) with subsequent growth of these particles to larger sizes (> 10 nm), perhaps due to lower organic vapor concentrations (Sebastian et al., 2021a). Rose et al. (2017) also reported a higher frequency of NPF occurrence for boundary layer (48 %) than for free troposphere (39 %) conditions at the Chacaltaya mountain (5240 m a.m.s.l.), Bolivia. Thus potential CCN formation was higher for NPF events initiated in the boundary layer (67 %) than in the free troposphere (53 %). Sellegri et al. (2019) reviewed the CCN concentrations from NPF events in the boundary layer and high-altitude locations. They revealed that the CCN production is the highest at San Pietro Capofiume, a polluted region of the Po Valley (7.3 × 103 cm−3; Laaksonen et al., 2005) as compared to high-altitude sites (Rose et al., 2017; Kerminen et al., 2012). Our findings are similar to these studies, showing higher increases in CCN concentrations in urban locations (HYD, TVM, and DEL) compared to mountain locations (RNC, MUK, and MBL) in India. It is not possible to track nucleated particles until they become CCN, and they are always mixed with CCN originating from primary sources. This makes it extremely difficult to estimate CCN arising from a given NPF event. In light of the above discussion, these results offer some insights into potential CCN concentrations originating from NPF.
In this study, we used at least 1 year of asynchronous particle number size distribution measurements from six locations in India, consisting of mountain background sites (Ranichauri and Mukteshwar), a mountain semi-rural site (Mahabaleshwar), urban sites (Delhi and Hyderabad), and a semi-urban coastal site (Thiruvananthapuram). The results from this study provide some insights into the processes influencing particle number size distributions and CCN concentrations in different environments (mountain and urban) of India.
We found that the regional NPF was most common in the pre-monsoon (spring) at all the measurement sites, with an exception at TVM, where NPF occurred mostly in the late monsoon season (September), which was linked to the inflow of continental air masses that provided a source of low volatile vapors for nucleation. During pre-monsoon, DEL has the highest frequency of NPF occurrence (63.8 %), followed by HYD (28.4 %) and MBL (15.9 %). NPF was the least common during winter at all the sites, particularly at the mountain background sites (RNC and MUK), which were without a single NPF event. The high solar insolation (active photochemistry) and the elevated boundary layer (efficient ventilation leading to low pre-existing particles near the surface) explain the most frequent occurrence of NPF in the pre-monsoon (spring), but this is not a universal NPF frequency pattern in India or elsewhere globally. We found that JSDS during NPF events tends to increase with increasing anthropogenic influence, and is 1 order of magnitude higher in urban areas (0.12 cm−3 s−1) than mountain sites (0.06 cm−3 s−1). We did not find any systematic pattern in GRSDS-25 nm, with the highest GRSDS-25 nm at RNC (6.3 nm h−1) and the lowest at TVM (1.1 nm h−1). The observed values of the NPF frequency, JSDS, and GRSDS-25 nm indicate that regional NPF events can significantly influence the evolution of particles in the atmosphere. We found that NPF modulates the shape of the particle number size distributions significantly, especially at the mountain background sites (RNC and MUK), which are not directly influenced by the local direct emissions of aerosols (traffic and industry). The number size distribution of particles is higher in pre-monsoon at mountain background sites, whereas it is higher in winter at the urban sites, with the exception of HYD. All sites generally show lower concentrations of particles in monsoon due to increased removal by wet scavenging. The histograms of size-segregated particle number concentrations show large variability from one site to another, reflecting the varying contribution of different processes to the total aerosol loading. For instance, the Aitken mode particle concentrations were the highest in pre-monsoon at the mountain background sites (RNC and MUK), whereas they were the highest in winter at the urban sites (HYD, TVM, and DEL). Among the sites, the lowest measured median total particle number concentration was found at MUK (2.7 × 103 cm−3) and the highest at DEL (12.5 × 103 cm−3).
We found that the increase in CCN concentrations during an NPF event is higher in urban locations (4.3 × 10³ and 1.2 × 103 cm−3 per event for 50 and 100 nm, respectively) compared to mountain background sites (2.7 × 10³ and 1.0 × 103 cm−3 per event for 50 and 100 nm, respectively). We modified Kerminen and colleagues' approach for removing the potential contribution of primary CCN active particles to give the best possible estimate for the increase in CCN concentrations during a given NPF event. Such analyses should be supplemented by regional model simulations or high spatial resolution measurements of NPF and CCN concentrations.
Particle number size distributions data were analyzed in IGOR Pro 8.0. Figure 8 was created in IGOR Pro 8.0, while all other figures were created in IDL 8.0.
Particles data will be made available upon a reasonable request to the corresponding author.
The supplement related to this article is available online at: https://doi.org/10.5194/acp-22-4491-2022-supplement.
VPK conceived the idea and designed the research. MS and VPK carried out comprehensive data analysis. MS carried out CCN estimation analysis and interpretation with critical input from JRP, VV, and VPK. MS, SKK, VAK, and SJ performed particle size distribution measurements and analysis. MS and VPK wrote the first draft, and MS edited it with critical input from all co-authors.
The contact author has declared that neither they nor their co-authors have any competing interests.
Publisher's note: Copernicus Publications remains neutral with regard to jurisdictional claims in published maps and institutional affiliations.
Vijay P. Kanawade was supported by the Department of Science & Technology (DST)-Science Engineering Research Board (SERB; ECR/2016/001333) and DST-Climate Change Division Program (Aerosol/89/2017). Vijay K. Soni acknowledges the technical support from Sanjay Rawat for maintaining the climate monitoring station at Ranichauri. IITM and HACPL are fully funded by the Ministry of Earth Sciences (MoES), Govt. of India. The data collection at Thiruvananthapuram was carried out under the Aerosol Radiative Forcing over India (ARFI) project of the Indian Space Research Organisation-Geosphere Biosphere Program (ISRO-GBP). Rakesh K. Hooda, Ville Vakkari, Eija Asmi, and Antti-P. Hyvärinen acknowledge Academy of Finland Flagship funding (grant no. 337552). Rakesh K. Hooda and Antti-P. Hyvärinen also acknowledge the team of TERI, Mukteshwar and Ved P. Sharma for technical support. Jeffrey R. Pierce was supported by the Atmospheric System Research program, part of the US Department of Energy's Office of Biological and Environmental Research within the Office of Science, under grant DE-SC0019000.
This research has been supported by the Department of Science & Technology (DST)-Science Engineering Research Board (grant no. ECR/2016/001333).
This paper was edited by Tuukka Petäjä and reviewed by two anonymous referees.
Anil Kumar, V., Hazra, A., Pandithurai, G., Kulkarni, G., Mohan, G. M., Mukherjee, S., Kumar, A. V., Hazra, A., Pandithurai, G., Kulkarni, G., Mohan, G. M., Mukherjee, S., Leena, P. P., Patil, R. D., and Prasad, D. S. V. V. D.: Atmospheric ice nucleating particle measurements and parameterization representative for Indian region, Atmos. Res., 253, 105487, https://doi.org/10.1016/j.atmosres.2021.105487, 2021.
Babu, S. S., Kompalli, S. K., and Moorthy, K. K.: Aerosol number size distributions over a coastal semi urban location: Seasonal changes and ultrafine particle bursts, Sci. Total Environ., 563–564, 351–365, https://doi.org/10.1016/j.scitotenv.2016.03.246, 2016.
Bianchi, F., Junninen, H., Bigi, A., Sinclair, V. A., Dada, L., Hoyle, C. R., Zha, Q., Yao, L., Ahonen, L. R., Bonasoni, P., Buenrostro Mazon, S., Hutterli, M., Laj, P., Lehtipalo, K., Kangasluoma, J., Kerminen, V. M., Kontkanen, J., Marinoni, A., Mirme, S., Molteni, U., Petäjä, T., Riva, M., Rose, C., Sellegri, K., Yan, C., Worsnop, D. R., Kulmala, M., Baltensperger, U., and Dommen, J.: Biogenic particles formed in the Himalaya as an important source of free tropospheric aerosols, Nat. Geosci., 14, 4–9, https://doi.org/10.1038/s41561-020-00661-5, 2021.
Bousiotis, D., Brean, J., Pope, F. D., Dall'Osto, M., Querol, X., Alastuey, A., Perez, N., Petäjä, T., Massling, A., Nøjgaard, J. K., Nordstrøm, C., Kouvarakis, G., Vratolis, S., Eleftheriadis, K., Niemi, J. V., Portin, H., Wiedensohler, A., Weinhold, K., Merkel, M., Tuch, T., and Harrison, R. M.: The effect of meteorological conditions and atmospheric composition in the occurrence and development of new particle formation (NPF) events in Europe, Atmos. Chem. Phys., 21, 3345–3370, https://doi.org/10.5194/acp-21-3345-2021, 2021.
Census of India: Provisional population totals: rural-urban distribution, Vol. 2, Issue 1 of Census of India, 2011, India, India: Office of the Registrar General & Census Commissioner, 2011.
Dal Maso, M., Kulmala, M., Riipinen, I., Wagner, R., Hussein, T., Aalto, P. P., and Lehtinen, K. E. J.: Formation and growth of fresh atmospheric aerosols: eight years of aerosol size distribution data from SMEAR II, Hyytiälä, Finland, Boreal Environ. Res., 10, 323–336, 2005.
Draxler, R. R. and Draxler, G. D.: HYSPLIT – HYbrid Single-Particle Lagrangian Integrated Trajectory Model, http://ready.arl.noaa.gov/HYSPLIT.php (last access: January 2022), 2010.
Dunne, E. M., Gordon, H., Kürten, A., Almeida, J., Duplissy, J., Williamson, C., Ortega, I. K., Pringle, K. J., Adamov, A., Baltensperger, U., Barmet, P., Benduhn, F., Bianchi, F., Breitenlechner, M., Clarke, A., Curtius, J., Dommen, J., Donahue, N. M., Ehrhart, S., Flagan, R. C., Franchin, A., Guida, R., Hakala, J., Hansel, A., Heinritzi, M., Jokinen, T., Kangasluoma, J., Kirkby, J., Kulmala, M., Kupc, A., Lawler, M. J., Lehtipalo, K., Makhmutov, V., Mann, G., Mathot, S., Merikanto, J., Miettinen, P., Nenes, A., Onnela, A., Rap, A., Reddington, C. L. S., Riccobono, F., Richards, N. A. D., Rissanen, M. P., Rondo, L., Sarnela, N., Schobesberger, S., Sengupta, K., Simon, M., Sipilä, M., Smith, J. N., Stozkhov, Y., Tomé, A., Tröstl, J., Wagner, P. E., Wimmer, D., Winkler, P. M., Worsnop, D. R., and Carslaw, K. S.: Global atmospheric particle formation from CERN CLOUD measurements, Science, 354, 1119–1124, https://doi.org/10.1126/science.aaf2649, 2016.
Gani, S., Bhandari, S., Patel, K., Seraj, S., Soni, P., Arub, Z., Habib, G., Hildebrandt Ruiz, L., and Apte, J. S.: Particle number concentrations and size distribution in a polluted megacity: the Delhi Aerosol Supersite study, Atmos. Chem. Phys., 20, 8533–8549, https://doi.org/10.5194/acp-20-8533-2020, 2020.
Gordon, H., Kirkby, J., Baltensperger, U., Bianchi, F., Breitenlechner, M., Curtius, J., Dias, A., Dommen, J., Donahue, N. M., Dunne, E. M., Duplissy, J., Ehrhart, S., Flagan, R. C., Frege, C., Fuchs, C., Hansel, A., Hoyle, C. R., Kulmala, M., Kürten, A., Lehtipalo, K., Makhmutov, V., Molteni, U., Rissanen, M. P., Stozkhov, Y., Tröstl, J., Tsagkogeorgas, G., Wagner, R., Williamson, C., Wimmer, D., Winkler, P. M., Yan, C., and Carslaw, K. S.: Causes and importance of new particle formation in the present-day and preindustrial atmospheres, J. Geophys. Res.-Atmos., 122, 8739–8760, https://doi.org/10.1002/2017jd026844, 2017.
Grimm, H. and Eatough, D. J.: Aerosol Measurement: The Use of Optical Light Scattering for the Determination of Particulate Size Distribution, and Particulate Mass, Including the Semi-Volatile Fraction, J. Air Waste Manage., 59, 101–107, https://doi.org/10.3155/1047-3289.59.1.101, 2009.
Guo, S., Hu, M., Zamora, M. L., Peng, J., Shang, D., Zheng, J., Du, Z., Wu, Z., Shao, M., Zeng, L., Molina, M. J., and Zhang, R.: Elucidating severe urban haze formation in China, P. Natl. Acad. Sci. USA, 111, 17373–17378, https://doi.org/10.1073/pnas.1419604111, 2014.
Guo, S., Hu, M., Peng, J., Wu, Z., Zamora, M. L., Shang, D., Du, Z., Zheng, J., Fang, X., Tang, R., Wu, Y., Zeng, L., Shuai, S., Zhang, W., Wang, Y., Ji, Y., Li, Y., Zhang, A. L., Wang, W., Zhang, F., Zhao, J., Gong, X., Wang, C., Molina, M. J., and Zhang, R.: Remarkable nucleation and growth of ultrafine particles from vehicular exhaust, P. Natl. Acad. Sci. USA, 117, 3427–3432, https://doi.org/10.1073/pnas.1916366117, 2020.
Hooda, R. K., Kivekäs, N., O'Connor, E. J., Collaud Coen, M., Pietikäinen, J.-P., Vakkari, V., Backman, J., Henriksson, S. V., Asmi, E., Komppula, M., Korhonen, H., Hyvärinen, A.-P., and Lihavainen, H.: Driving Factors of Aerosol Properties Over the Foothills of Central Himalayas Based on 8.5 Years Continuous Measurements, J. Geophys. Res.-Atmos., 123, 13421–413442, https://doi.org/10.1029/2018jd029744, 2018.
Hyvärinen, A. P., Lihavainen, H., Komppula, M., Sharma, V. P., Kerminen, V. M., Panwar, T. S., and Viisanen, Y.: Continuous measurements of optical properties of atmospheric aerosols in Mukteshwar, northern India, J. Geophys. Res.-Atmos., 114, D08207, https://doi.org/10.1029/2008JD011489, 2009.
Hyvärinen, A.-P., Lihavainen, H., Komppula, M., Panwar, T. S., Sharma, V. P., Hooda, R. K., and Viisanen, Y.: Aerosol measurements at the Gual Pahari EUCAARI station: preliminary results from in-situ measurements, Atmos. Chem. Phys., 10, 7241–7252, https://doi.org/10.5194/acp-10-7241-2010, 2010.
IPCC: Climate Change 2013: The Physical Science Basis. Contribution of Working Group I to the Fifth Assessment Report of the Intergovernmental Panel on Climate Change, Cambridge, United Kingdom and New York, NY, USA, 1535 pp., 2013.
Jose, S., Mishra, A. K., Lodhi, N. K., Sharma, S. K., and Singh, S.: Characteristics of Aerosol Size Distributions and New Particle Formation Events at Delhi: An Urban Location in the Indo-Gangetic Plains, Front. Earth Sci., 9, 750111, https://doi.org/10.3389/feart.2021.750111, 2021.
Kalivitis, N., Kerminen, V.-M., Kouvarakis, G., Stavroulas, I., Bougiatioti, A., Nenes, A., Manninen, H. E., Petäjä, T., Kulmala, M., and Mihalopoulos, N.: Atmospheric new particle formation as a source of CCN in the eastern Mediterranean marine boundary layer, Atmos. Chem. Phys., 15, 9203–9215, https://doi.org/10.5194/acp-15-9203-2015, 2015.
Kanawade, V. P., Benson, D. R., and Lee, S.-H.: Statistical analysis of 4-year observations of aerosol sizes in a semi-rural continental environment, Atmos. Environ., 59, 30–38, https://doi.org/10.1016/j.atmosenv.2012.05.047, 2012.
Kanawade, V. P., Tripathi, S. N., Bhattu, D., and Shamjad, P. M.: Sub-micron particle number size distributions characteristics at an urban location, Kanpur, in the Indo-Gangetic Plain, Atmos. Res., 147–148, 121–132, https://doi.org/10.1016/j.atmosres.2014.05.010, 2014a.
Kanawade, V. P., Tripathi, S. N., Siingh, D., Gautam, A. S., Srivastava, A. K., Kamra, A. K., Soni, V. K., and Sethi, V.: Observations of new particle formation at two distinct Indian subcontinental urban locations, Atmos. Environ., 96, 370–379, https://doi.org/10.1016/j.atmosenv.2014.08.001, 2014b.
Kanawade, V. P., Shika, S., Pöhlker, C., Rose, D., Suman, M. N. S., Gadhavi, H., Kumar, A., Nagendra, S. M. S., Ravikrishna, R., Yu, H., Sahu, L. K., Jayaraman, A., Andreae, M. O., Pöschl, U., and Gunthe, S. S.: Infrequent occurrence of new particle formation at a semi-rural location, Gadanki, in tropical Southern India, Atmos. Environ., 94, 264–273, https://doi.org/10.1016/j.atmosenv.2014.05.046, 2014c.
Kanawade, V. P., Tripathi, S. N., Chakraborty, A., and Yu, H.: Chemical Characterization of Sub-micron Aerosols during New Particle Formation in an Urban Atmosphere, Aerosol Air Qual. Res., 20, 1294–1305, https://doi.org/10.4209/aaqr.2019.04.0196, 2020a.
Kanawade, V. P., Srivastava, A. K., Ram, K., Asmi, E., Vakkari, V., Soni, V. K., Varaprasad, V., and Sarangi, C.: What caused severe air pollution episode of November 2016 in New Delhi?, Atmos. Environ., 222, 117125, https://doi.org/10.1016/j.atmosenv.2019.117125, 2020b.
Kanawade, V. P., Sebastian, M., Hooda, R. K., and Hyvärinen, A. P.: Atmospheric new particle formation in India: Current understanding, knowledge gaps and future directions, Atmos. Environ., 270, 118894, https://doi.org/10.1016/j.atmosenv.2021.118894, 2021.
Kerminen, V.-M., Paramonov, M., Anttila, T., Riipinen, I., Fountoukis, C., Korhonen, H., Asmi, E., Laakso, L., Lihavainen, H., Swietlicki, E., Svenningsson, B., Asmi, A., Pandis, S. N., Kulmala, M., and Petäjä, T.: Cloud condensation nuclei production associated with atmospheric nucleation: a synthesis based on existing literature and new results, Atmos. Chem. Phys., 12, 12037–12059, https://doi.org/10.5194/acp-12-12037-2012, 2012.
Kerminen, V.-M., Chen, X., Vakkari, V., Petäjä, T., Kulmala, M., and Bianchi, F.: Atmospheric new particle formation and growth: review of field observations, Environ. Res. Lett., 13, 103003, https://doi.org/10.1088/1748-9326/aadf3c, 2018.
Kirkby, J., Curtius, J., Almeida, J., Dunne, E., Duplissy, J., Ehrhart, S., Franchin, A., Gagne, S., Ickes, L., Kurten, A., Kupc, A., Metzger, A., Riccobono, F., Rondo, L., Schobesberger, S., Tsagkogeorgas, G., Wimmer, D., Amorim, A., Bianchi, F., Breitenlechner, M., David, A., Dommen, J., Downard, A., Ehn, M., Flagan, R. C., Haider, S., Hansel, A., Hauser, D., Jud, W., Junninen, H., Kreissl, F., Kvashin, A., Laaksonen, A., Lehtipalo, K., Lima, J., Lovejoy, E. R., Makhmutov, V., Mathot, S., Mikkila, J., Minginette, P., Mogo, S., Nieminen, T., Onnela, A., Pereira, P., Petaja, T., Schnitzhofer, R., Seinfeld, J. H., Sipila, M., Stozhkov, Y., Stratmann, F., Tome, A., Vanhanen, J., Viisanen, Y., Vrtala, A., Wagner, P. E., Walther, H., Weingartner, E., Wex, H., Winkler, P. M., Carslaw, K. S., Worsnop, D. R., Baltensperger, U., and Kulmala, M.: Role of sulphuric acid, ammonia and galactic cosmic rays in atmospheric aerosol nucleation, Nature, 476, 429–433, 2011.
Kompalli, S. K., Babu, S. S., Udayasoorian, C., and Jayabalakrishnan, R. M.: Role of anthropogenic emissions and meteorology on ultrafine particle bursts over a high altitude site in Western Ghats during pre-monsoon, J. Atmos. Sol.-Terr. Phys., 179, 378–388, https://doi.org/10.1016/j.jastp.2018.09.001, 2018.
Kompalli, S. K., Nair, V. S., Jayachandran, V., Gogoi, M. M., and Babu, S. S.: Particle number size distributions and new particle formation events over the northern Indian Ocean during continental outflow, Atmos. Environ., 238, 117719, https://doi.org/10.1016/j.atmosenv.2020.117719, 2020.
Komppula, M., Lihavainen, H., Hyvärinen, A. P., Kerminen, V.-M., Panwar, T. S., Sharma, V. P., and Viisanen, Y.: Physical properties of aerosol particles at a Himalayan background site in India, J. Geophys. Res.-Atmos., 114, D12202, https://doi.org/10.1029/2008jd011007, 2009.
Kuang, C., McMurry, P. H., and McCormick, A. V.: Determination of cloud condensation nuclei production from measured new particle formation events, Geophys. Res. Lett., 36, L09822, https://doi.org/10.1029/2009gl037584, 2009.
Kulmala, M., Vehkamäki, H., Petäjä, T., Dal Maso, M., Lauri, A., Kerminen, V.-M., Birmili, W., and McMurry, P. H.: Formation and growth rates of ultrafine atmospheric particles: a review of observations, J. Aerosol Sci., 35, 143–176, https://doi.org/10.1016/j.jaerosci.2003.10.003, 2004.
Kulmala, M., Riipinen, I., Sipilä, M., Manninen, H. E., Petäjä, T., Junninen, H., Maso, M. D., Mordas, G., Mirme, A., Vana, M., Hirsikko, A., Laakso, L., Harrison, R. M., Hanson, I., Leung, C., Lehtinen, K. E. J., and Kerminen, V.-M.: Toward Direct Measurement of Atmospheric Nucleation, Science, 318, 89–92, https://doi.org/10.1126/science.1144124, 2007.
Kulmala, M., Dada, L., Daellenbach, K. R., Yan, C., Stolzenburg, D., Kontkanen, J., Ezhova, E., Hakala, S., Tuovinen, S., Kokkonen, T. V., Kurppa, M., Cai, R., Zhou, Y., Yin, R., Baalbaki, R., Chan, T., Chu, B., Deng, C., Fu, Y., Ge, M., He, H., Heikkinen, L., Junninen, H., Liu, Y., Lu, Y., Nie, W., Rusanen, A., Vakkari, V., Wang, Y., Yang, G., Yao, L., Zheng, J., Kujansuu, J., Kangasluoma, J., Petäjä, T., Paasonen, P., Järvi, L., Worsnop, D., Ding, A., Liu, Y., Wang, L., Jiang, J., Bianchi, F., and Kerminen, V.-M.: Is reducing new particle formation a plausible solution to mitigate particulate air pollution in Beijing and other Chinese megacities?, Faraday Discuss., 226, 334–347, https://doi.org/10.1039/D0FD00078G, 2021.
Laaksonen, A., Hamed, A., Joutsensaari, J., Hiltunen, L., Cavalli, F., Junkermann, W., Asmi, A., Fuzzi, S., and Facchini, M. C.: Cloud condensation nucleus production from nucleation events at a highly polluted region, Geophys. Res. Lett., 32, L06812, https://doi.org/10.1029/2004GL022092, 2005.
Laj, P., Bigi, A., Rose, C., Andrews, E., Lund Myhre, C., Collaud Coen, M., Lin, Y., Wiedensohler, A., Schulz, M., Ogren, J. A., Fiebig, M., Gliß, J., Mortier, A., Pandolfi, M., Petäja, T., Kim, S.-W., Aas, W., Putaud, J.-P., Mayol-Bracero, O., Keywood, M., Labrador, L., Aalto, P., Ahlberg, E., Alados Arboledas, L., Alastuey, A., Andrade, M., Artíñano, B., Ausmeel, S., Arsov, T., Asmi, E., Backman, J., Baltensperger, U., Bastian, S., Bath, O., Beukes, J. P., Brem, B. T., Bukowiecki, N., Conil, S., Couret, C., Day, D., Dayantolis, W., Degorska, A., Eleftheriadis, K., Fetfatzis, P., Favez, O., Flentje, H., Gini, M. I., Gregorič, A., Gysel-Beer, M., Hallar, A. G., Hand, J., Hoffer, A., Hueglin, C., Hooda, R. K., Hyvärinen, A., Kalapov, I., Kalivitis, N., Kasper-Giebl, A., Kim, J. E., Kouvarakis, G., Kranjc, I., Krejci, R., Kulmala, M., Labuschagne, C., Lee, H.-J., Lihavainen, H., Lin, N.-H., Löschau, G., Luoma, K., Marinoni, A., Martins Dos Santos, S., Meinhardt, F., Merkel, M., Metzger, J.-M., Mihalopoulos, N., Nguyen, N. A., Ondracek, J., Pérez, N., Perrone, M. R., Petit, J.-E., Picard, D., Pichon, J.-M., Pont, V., Prats, N., Prenni, A., Reisen, F., Romano, S., Sellegri, K., Sharma, S., Schauer, G., Sheridan, P., Sherman, J. P., Schütze, M., Schwerin, A., Sohmer, R., Sorribas, M., Steinbacher, M., Sun, J., Titos, G., Toczko, B., Tuch, T., Tulet, P., Tunved, P., Vakkari, V., Velarde, F., Velasquez, P., Villani, P., Vratolis, S., Wang, S.-H., Weinhold, K., Weller, R., Yela, M., Yus-Diez, J., Zdimal, V., Zieger, P., and Zikova, N.: A global analysis of climate-relevant aerosol properties retrieved from the network of Global Atmosphere Watch (GAW) near-surface observatories, Atmos. Meas. Tech., 13, 4353–4392, https://doi.org/10.5194/amt-13-4353-2020, 2020.
Merikanto, J., Spracklen, D. V., Mann, G. W., Pickering, S. J., and Carslaw, K. S.: Impact of nucleation on global CCN, Atmos. Chem. Phys., 9, 8601–8616, https://doi.org/10.5194/acp-9-8601-2009, 2009.
Moorthy, K. K., Satheesh, S. K., Babu, S. S., and Dutt, C. B. S.: Integrated Campaign for Aerosols, gases and Radiation Budget (ICARB): An overview, J. Earth Syst. Sci., 117, 243–262, https://doi.org/10.1007/s12040-008-0029-7, 2008.
Moorthy, K. K., Sreekanth, V., Prakash Chaubey, J., Gogoi, M. M., Suresh Babu, S., Kumar Kompalli, S., Bagare, S. P., Bhatt, B. C., Gaur, V. K., Prabhu, T. P., and Singh, N. S.: Fine and ultrafine particles at a near–free tropospheric environment over the high-altitude station Hanle in the Trans-Himalaya: New particle formation and size distribution, J. Geophys. Res.-Atmos., 116, D20212, https://doi.org/10.1029/2011jd016343, 2011.
Nair, V. S., Jayachandran, V. N., Kompalli, S. K., Gogoi, M. M., and Babu, S. S.: Cloud condensation nuclei properties of South Asian outflow over the northern Indian Ocean during winter, Atmos. Chem. Phys., 20, 3135–3149, https://doi.org/10.5194/acp-20-3135-2020, 2020.
Neitola, K., Asmi, E., Komppula, M., Hyvärinen, A.-P., Raatikainen, T., Panwar, T. S., Sharma, V. P., and Lihavainen, H.: New particle formation infrequently observed in Himalayan foothills – why?, Atmos. Chem. Phys., 11, 8447–8458, https://doi.org/10.5194/acp-11-8447-2011, 2011.
Nieminen, T., Kerminen, V.-M., Petäjä, T., Aalto, P. P., Arshinov, M., Asmi, E., Baltensperger, U., Beddows, D. C. S., Beukes, J. P., Collins, D., Ding, A., Harrison, R. M., Henzing, B., Hooda, R., Hu, M., Hõrrak, U., Kivekäs, N., Komsaare, K., Krejci, R., Kristensson, A., Laakso, L., Laaksonen, A., Leaitch, W. R., Lihavainen, H., Mihalopoulos, N., Németh, Z., Nie, W., O'Dowd, C., Salma, I., Sellegri, K., Svenningsson, B., Swietlicki, E., Tunved, P., Ulevicius, V., Vakkari, V., Vana, M., Wiedensohler, A., Wu, Z., Virtanen, A., and Kulmala, M.: Global analysis of continental boundary layer new particle formation based on long-term measurements, Atmos. Chem. Phys., 18, 14737–14756, https://doi.org/10.5194/acp-18-14737-2018, 2018.
Paasonen, P., Asmi, A., Petäjä, T., Kajos, M. K., Äijälä, M., Junninen, H., Holst, T., Abbatt, J. P. D., Arneth, A., Birmili, W., van der Gon, H. D., Hamed, A., Hoffer, A., Laakso, L., Laaksonen, A., Richard Leaitch, W., Plass-Dülmer, C., Pryor, S. C., Räisänen, P., Swietlicki, E., Wiedensohler, A., Worsnop, D. R., Kerminen, V.-M., and Kulmala, M.: Warming-induced increase in aerosol number concentration likely to moderate climate change, Nat. Geosci., 6, 438–442, https://doi.org/10.1038/ngeo1800, 2013.
Pierce, J. R. and Adams, P. J.: Efficiency of cloud condensation nuclei formation from ultrafine particles, Atmos. Chem. Phys., 7, 1367–1379, https://doi.org/10.5194/acp-7-1367-2007, 2007.
Pierce, J. R., Leaitch, W. R., Liggio, J., Westervelt, D. M., Wainwright, C. D., Abbatt, J. P. D., Ahlm, L., Al-Basheer, W., Cziczo, D. J., Hayden, K. L., Lee, A. K. Y., Li, S.-M., Russell, L. M., Sjostedt, S. J., Strawbridge, K. B., Travis, M., Vlasenko, A., Wentzell, J. J. B., Wiebe, H. A., Wong, J. P. S., and Macdonald, A. M.: Nucleation and condensational growth to CCN sizes during a sustained pristine biogenic SOA event in a forested mountain valley, Atmos. Chem. Phys., 12, 3147–3163, https://doi.org/10.5194/acp-12-3147-2012, 2012.
Pierce, J. R., Westervelt, D. M., Atwood, S. A., Barnes, E. A., and Leaitch, W. R.: New-particle formation, growth and climate-relevant particle production in Egbert, Canada: analysis from 1 year of size-distribution observations, Atmos. Chem. Phys., 14, 8647–8663, https://doi.org/10.5194/acp-14-8647-2014, 2014.
Pikridas, M., Riipinen, I., Hildebrandt, L., Kostenidou, E., Manninen, H., Mihalopoulos, N., Kalivitis, N., Burkhart, J. F., Stohl, A., Kulmala, M., and Pandis, S. N.: New particle formation at a remote site in the eastern Mediterranean, Journal geophys. Res.-Atmos., 117, D12205, https://doi.org/10.1029/2012JD017570, 2012.
Raatikainen, T., Hyvärinen, A. P., Hatakka, J., Panwar, T. S., Hooda, R. K., Sharma, V. P., and Lihavainen, H.: The effect of boundary layer dynamics on aerosol properties at the Indo-Gangetic plains and at the foothills of the Himalayas, Atmos. Environ., 89, 548–555, https://doi.org/10.1016/j.atmosenv.2014.02.058, 2014.
Ramanathan, V., Crutzen, P. J., Lelieveld, J., Mitra, A. P., Althausen, D., Anderson, J., Andreae, M. O., Cantrell, W., Cass, G. R., Chung, C. E., Clarke, A. D., Coakley, J. A., Collins, W. D., Conant, W. C., Dulac, F., Heintzenberg, J., Heymsfield, A. J., Holben, B., Howell, S., Hudson, J., Jayaraman, A., Kiehl, J. T., Krishnamurti, T. N., Lubin, D., McFarquhar, G., Novakov, T., Ogren, J. A., Podgorny, I. A., Prather, K., Priestley, K., Prospero, J. M., Quinn, P. K., Rajeev, K., Rasch, P., Rupert, S., Sadourny, R., Satheesh, S. K., Shaw, G. E., Sheridan, P., and Valero, F. P. J.: Indian Ocean Experiment: An integrated analysis of the climate forcing and effects of the great Indo-Asian haze, J. Geophys. Res.-Atmos., 106, 28371–28398, https://doi.org/10.1029/2001JD900133, 2001.
Reddington, C. L., Carslaw, K. S., Spracklen, D. V., Frontoso, M. G., Collins, L., Merikanto, J., Minikin, A., Hamburger, T., Coe, H., Kulmala, M., Aalto, P., Flentje, H., Plass-Dülmer, C., Birmili, W., Wiedensohler, A., Wehner, B., Tuch, T., Sonntag, A., O'Dowd, C. D., Jennings, S. G., Dupuy, R., Baltensperger, U., Weingartner, E., Hansson, H.-C., Tunved, P., Laj, P., Sellegri, K., Boulon, J., Putaud, J.-P., Gruening, C., Swietlicki, E., Roldin, P., Henzing, J. S., Moerman, M., Mihalopoulos, N., Kouvarakis, G., Ždímal, V., Zíková, N., Marinoni, A., Bonasoni, P., and Duchi, R.: Primary versus secondary contributions to particle number concentrations in the European boundary layer, Atmos. Chem. Phys., 11, 12007–12036, https://doi.org/10.5194/acp-11-12007-2011, 2011.
Rodríguez, S., Van Dingenen, R., Putaud, J.-P., Martins-Dos Santos, S., and Roselli, D.: Nucleation and growth of new particles in the rural atmosphere of Northern Italy—relationship to air quality monitoring, Atmospheric Environ., 39, 6734–6746, https://doi.org/10.1016/j.atmosenv.2005.07.036, 2005.
Rose, C., Sellegri, K., Moreno, I., Velarde, F., Ramonet, M., Weinhold, K., Krejci, R., Andrade, M., Wiedensohler, A., Ginot, P., and Laj, P.: CCN production by new particle formation in the free troposphere, Atmos. Chem. Phys., 17, 1529–1541, https://doi.org/10.5194/acp-17-1529-2017, 2017.
Rosenfeld, D., Sherwood, S., Wood, R., and Donner, L.: Climate Effects of Aerosol-Cloud Interactions, Science, 343, 379–380, https://doi.org/10.1126/science.1247490, 2014.
Sarangi, C., Kanawade, V. P., Tripathi, S. N., Thomas, A., and Ganguly, D.: Aerosol-induced intensification of cooling effect of clouds during Indian summer monsoon, Nat. Commun., 9, 3754, https://doi.org/10.1038/s41467-018-06015-5, 2018.
Schobesberger, S., Franchin, A., Bianchi, F., Rondo, L., Duplissy, J., Kürten, A., Ortega, I. K., Metzger, A., Schnitzhofer, R., Almeida, J., Amorim, A., Dommen, J., Dunne, E. M., Ehn, M., Gagné, S., Ickes, L., Junninen, H., Hansel, A., Kerminen, V.-M., Kirkby, J., Kupc, A., Laaksonen, A., Lehtipalo, K., Mathot, S., Onnela, A., Petäjä, T., Riccobono, F., Santos, F. D., Sipilä, M., Tomé, A., Tsagkogeorgas, G., Viisanen, Y., Wagner, P. E., Wimmer, D., Curtius, J., Donahue, N. M., Baltensperger, U., Kulmala, M., and Worsnop, D. R.: On the composition of ammonia–sulfuric-acid ion clusters during aerosol particle formation, Atmos. Chem. Phys., 15, 55–78, https://doi.org/10.5194/acp-15-55-2015, 2015.
Sebastian, M., Kanawade, V. P., and Pierce, J. R.: Observation of sub-3nm particles and new particle formation at an urban location in India, Atmos. Environ., 256, 118460, https://doi.org/10.1016/j.atmosenv.2021.118460, 2021a.
Sebastian, M., Kanawade, V., Soni, V., Asmi, E., Westervelt, D., Vakkari, V., Hyvärinen, A. P., Pierce, J., and Hooda, R.: New Particle Formation and Growth to Climate-Relevant Aerosols at a Background Remote Site in the Western Himalaya, J. Geophys. Res.-Atmos., 126, D033267, https://doi.org/10.1029/2020JD033267, 2021b.
Sellegri, K., Rose, C., Marinoni, A., Lupi, A., Wiedensohler, A., Andrade, M., Bonasoni, P., and Laj, P.: New Particle Formation: A Review of Ground-Based Observations at Mountain Research Stations, Atmosphere, 10, 493, https://doi.org/10.3390/atmos10090493, 2019.
Shika, S., Gadhavi, H., Suman, M. N. S., Ravikrishna, R., and Gunthe, S. S.: Atmospheric aerosol properties at a semi-rural location in southern India: particle size distributions and implications for cloud droplet formation, SN Appl. Sci., 2, 1007, https://doi.org/10.1007/s42452-020-2804-2, 2020.
Sihto, S.-L., Mikkilä, J., Vanhanen, J., Ehn, M., Liao, L., Lehtipalo, K., Aalto, P. P., Duplissy, J., Petäjä, T., Kerminen, V.-M., Boy, M., and Kulmala, M.: Seasonal variation of CCN concentrations and aerosol activation properties in boreal forest, Atmos. Chem. Phys., 11, 13269–13285, https://doi.org/10.5194/acp-11-13269-2011, 2011.
Siingh, D., Gautam, A. S., Buchunde, P., and Kamra, A. K.: Classification of the new particle formation events observed at a tropical site, Pune, India, Atmos. Environ., 190, 10–22, https://doi.org/10.1016/j.atmosenv.2018.07.025, 2018.
Singh, R. P., Dey, S., Tripathi, S. N., Tare, V., and Holben, B.: Variability of aerosol parameters over Kanpur, northern India, J. Geophys. Res.-Atmos., 109, D23206, https://doi.org/10.1029/2004JD004966, 2004.
Srivastava, A. K., Soni, V. K., Singh, S., Kanawade, V. P., Singh, N., Tiwari, S., and Attri, S. D.: An early South Asian dust storm during March 2012 and its impacts on Indian Himalayan foothills: A case study, Sci. Total Environ., 493, 526–534, https://doi.org/10.1016/j.scitotenv.2014.06.024, 2014.
Tare, V., Tripathi, S. N., Chinnam, N., Srivastava, A. K., Dey, S., Manar, M., Kanawade, V. P., Agarwal, A., Kishore, S., Lal, R. B., and Sharma, M.: Measurements of atmospheric parameters during Indian Space Research Organization Geosphere Biosphere Program Land Campaign II at a typical location in the Ganga Basin: 2. Chemical properties, J. Geophys. Res.-Atmos., 111, D23210, https://doi.org/10.1029/2006JD007279, 2006.
Thomas, A., Sarangi, C., and Kanawade, V. P.: Recent Increase in Winter Hazy Days over Central India and the Arabian Sea, Sci. Rep., 9, 17406, https://doi.org/10.1038/s41598-019-53630-3, 2019.
Tripathi, R. M., Khandekar, R. N., and Mishra, U. C.: Size distribution of atmospheric aerosols in urban sites in India, Sci. Total Environ., 77, 237–244, https://doi.org/10.1016/0048-9697(88)90059-9, 1988.
Tripathi, S. N., Tare, V., Chinnam, N., Srivastava, A. K., Dey, S., Agarwal, A., Kishore, S., Lal, R. B., Manar, M., Kanawade, V. P., Chauhan, S. S. S., Sharma, M., Reddy, R. R., Gopal, K. R., Narasimhulu, K., Reddy, L. S. S., Gupta, S., and Lal, S.: Measurements of atmospheric parameters during Indian Space Research Organization Geosphere Biosphere Programme Land Campaign II at a typical location in the Ganga basin: 1. Physical and optical properties, J. Geophys. Res.-Atmos., 111, D23209, https://doi.org/10.1029/2006JD007278, 2006.
Tröstl, J., Herrmann, E., Frege, C., Bianchi, F., Molteni, U., Bukowiecki, N., Hoyle, C. R., Steinbacher, M., Weingartner, E., Dommen, J., Gysel, M., and Baltensperger, U.: Contribution of new particle formation to the total aerosol concentration at the high-altitude site Jungfraujoch (3580 m asl, Switzerland), J. Geophys. Res.-Atmos., 121, 11692–611711, https://doi.org/10.1002/2015jd024637, 2016.
Vehkamäki, H. and Riipinen, I.: Thermodynamics and kinetics of atmospheric aerosol particle formation and growth, Chem. Soc. Rev., 41, 5160–5173, https://doi.org/10.1039/C2CS00002D, 2012.
Venzac, H., Sellegri, K., Laj, P., Villani, P., Bonasoni, P., Marinoni, A., Cristofanelli, P., Calzolari, F., Fuzzi, S., Decesari, S., Facchini, M.-C., Vuillermoz, E., and Verza, G. P.: High frequency new particle formation in the Himalayas, P. Natl. Acad. Sci. USA, 105, 15666–15671, https://doi.org/10.1073/pnas.0801355105, 2008.
Westervelt, D. M., Pierce, J. R., Riipinen, I., Trivitayanurak, W., Hamed, A., Kulmala, M., Laaksonen, A., Decesari, S., and Adams, P. J.: Formation and growth of nucleated particles into cloud condensation nuclei: model–measurement comparison, Atmos. Chem. Phys., 13, 7645–7663, https://doi.org/10.5194/acp-13-7645-2013, 2013.
Westervelt, D. M., Pierce, J. R., and Adams, P. J.: Analysis of feedbacks between nucleation rate, survival probability and cloud condensation nuclei formation, Atmos. Chem. Phys., 14, 5577–5597, https://doi.org/10.5194/acp-14-5577-2014, 2014.
Wiedensohler, A., Cheng, Y. F., Nowak, A., Wehner, B., Achtert, P., Berghof, M., Birmili, W., Wu, Z. J., Hu, M., Zhu, T., Takegawa, N., Kita, K., Kondo, Y., Lou, S. R., Hofzumahaus, A., Holland, F., Wahner, A., Gunthe, S. S., Rose, D., Su, H., and Pöschl, U.: Rapid aerosol particle growth and increase of cloud condensation nucleus activity by secondary aerosol formation and condensation: A case study for regional air pollution in northeastern China, J. Geophys. Res.-Atmos., 114, D00G08, https://doi.org/10.1029/2008jd010884, 2009.
Wiedensohler, A., Birmili, W., Nowak, A., Sonntag, A., Weinhold, K., Merkel, M., Wehner, B., Tuch, T., Pfeifer, S., Fiebig, M., Fjäraa, A. M., Asmi, E., Sellegri, K., Depuy, R., Venzac, H., Villani, P., Laj, P., Aalto, P., Ogren, J. A., Swietlicki, E., Williams, P., Roldin, P., Quincey, P., Hüglin, C., Fierz-Schmidhauser, R., Gysel, M., Weingartner, E., Riccobono, F., Santos, S., Grüning, C., Faloon, K., Beddows, D., Harrison, R., Monahan, C., Jennings, S. G., O'Dowd, C. D., Marinoni, A., Horn, H.-G., Keck, L., Jiang, J., Scheckman, J., McMurry, P. H., Deng, Z., Zhao, C. S., Moerman, M., Henzing, B., de Leeuw, G., Löschau, G., and Bastian, S.: Mobility particle size spectrometers: harmonization of technical standards and data structure to facilitate high quality long-term observations of atmospheric particle number size distributions, Atmos. Meas. Tech., 5, 657–685, https://doi.org/10.5194/amt-5-657-2012, 2012.
Xiao, M., Hoyle, C. R., Dada, L., Stolzenburg, D., Kürten, A., Wang, M., Lamkaddam, H., Garmash, O., Mentler, B., Molteni, U., Baccarini, A., Simon, M., He, X.-C., Lehtipalo, K., Ahonen, L. R., Baalbaki, R., Bauer, P. S., Beck, L., Bell, D., Bianchi, F., Brilke, S., Chen, D., Chiu, R., Dias, A., Duplissy, J., Finkenzeller, H., Gordon, H., Hofbauer, V., Kim, C., Koenig, T. K., Lampilahti, J., Lee, C. P., Li, Z., Mai, H., Makhmutov, V., Manninen, H. E., Marten, R., Mathot, S., Mauldin, R. L., Nie, W., Onnela, A., Partoll, E., Petäjä, T., Pfeifer, J., Pospisilova, V., Quéléver, L. L. J., Rissanen, M., Schobesberger, S., Schuchmann, S., Stozhkov, Y., Tauber, C., Tham, Y. J., Tomé, A., Vazquez-Pufleau, M., Wagner, A. C., Wagner, R., Wang, Y., Weitz, L., Wimmer, D., Wu, Y., Yan, C., Ye, P., Ye, Q., Zha, Q., Zhou, X., Amorim, A., Carslaw, K., Curtius, J., Hansel, A., Volkamer, R., Winkler, P. M., Flagan, R. C., Kulmala, M., Worsnop, D. R., Kirkby, J., Donahue, N. M., Baltensperger, U., El Haddad, I., and Dommen, J.: The driving factors of new particle formation and growth in the polluted boundary layer, Atmos. Chem. Phys., 21, 14275–14291, https://doi.org/10.5194/acp-21-14275-2021, 2021.
Yu, F., Luo, G., Nair, A. A., Schwab, J. J., Sherman, J. P., and Zhang, Y.: Wintertime new particle formation and its contribution to cloud condensation nuclei in the Northeastern United States, Atmos. Chem. Phys., 20, 2591–2601, https://doi.org/10.5194/acp-20-2591-2020, 2020.
Yu, H., Ren, L., and Kanawade, V. P.: New Particle Formation and Growth Mechanisms in Highly Polluted Environments, Current Pollution Reports, 3, 245–253, https://doi.org/10.1007/s40726-017-0067-3, 2017.
Zhang, R., Khalizov, A., Wang, L., Hu, M., and Xu, W.: Nucleation and Growth of Nanoparticles in the Atmosphere, Chem. Rev., 112, 1957–2011, https://doi.org/10.1021/cr2001756, 2012.