the Creative Commons Attribution 4.0 License.
the Creative Commons Attribution 4.0 License.
 | 28 Mar 2022
Development and evolution of an anomalous Asian dust event across Europe in March 2020
Erika Brattich
Claudio Cassardo
Pietro Morozzi
Alessandro Bracci
Angela Marinoni
Silvana Di Sabatino
Federico Porcù
Alessandro Zappi
This paper concerns an in-depth analysis of an exceptional incursion of mineral dust over southern Europe in late March 2020 (27–30 March 2020). This event was associated with an anomalous circulation pattern leading to several days of PM10 (particulate matter with an aerodynamic diameter less than 10 µm) exceedances in connection with a dust source located in central Asia; this is a rare source of dust for Europe, which is more frequently affected by dust outbreaks from the Sahara Desert. The synoptic meteorological configuration was analyzed in detail, and the aerosol evolution during the transit of the dust plume over northern Italy was assessed at high time resolution by means of optical particle counting at three stations, namely Bologna, Trieste, and Mt. Cimone, allowing for the revelation of the transport timing among the three locations. Back-trajectory analyses supported by Copernicus Atmosphere Monitoring Service (CAMS) maps allowed for the location of the mineral dust source area in the Aralkum region. Therefore, the event was analyzed by observing the particle number size distribution with the support of chemical composition analysis. It is shown that the PM10 exceedance recorded is associated with a large fraction of coarse particles, which is in agreement with mineral dust properties. Both the in situ number size distribution and the vertical distribution of the dust plume were cross-checked using lidar ceilometer and aerosol optical depth (AOD) data from two nearby stations and showed that the dust plume (in contrast to those originating from the Sahara Desert) traveled close to the ground (up to a height of about 2 km). The limited mixing layer height caused by high concentrations of absorbing and scattering aerosols caused the mixing of mineral dust with other locally produced ambient aerosols, thereby potentially increasing its morbidity effects.
- Article
(10947 KB) - Full-text XML
- BibTeX
- EndNote


Mineral dust originating from desert regions is one of the main components of the ambient aerosol affecting air quality and human health, cloud formation, ocean ecosystems, and climate (Knippertz and Stuut, 2014; Schepanski, 2018). Despite its significance, mineral dust still represents one of the largest uncertainties in climate modeling (Adebiyi and Kok, 2020; Intergovernmental Panel on Climate Change, 2014). Mineral dust is often transported at a large scale, influencing vast continental and ocean areas (Barkan and Alpert, 2010). The most immediate effect of mineral dust in a specific area is the (sometimes dramatic) increase in particulate matter (PM) mass loading (Brattich et al., 2015a), mainly in the coarse fraction. Several studies have also demonstrated that mineral dust can affect cloud processing (Bangert et al., 2012) and the biogeochemical cycles of ecosystems (Okin et al., 2004). Numerous studies have documented the health effects of mineral dust transport in various parts of the world (Domínguez-Rodríguez et al., 2021; Fubini and Fenoglio, 2007; Keil et al., 2016; Sajani et al., 2011; Stafoggia et al., 2016), owing to the conjunct impact of mineralogy, allergens, and pathogens (García-Pando et al., 2014). For these reasons, it is essential to study the mineral dust composition in connection with its atmospheric path, source region, physicochemical properties, and modifications associated with environmental, climatic, and health issues.
The most important dust source regions at the global scale are the northern African Sahara region, the Arabian Desert, the central Asia deserts (the Kyzylkum in Uzbekistan and Kazakhstan, and the Karakum in Turkmenistan), the Gobi and the Taklamakan deserts in eastern Asia, the Dasht-e Margo (the desert region between Pakistan, Iran, and Afghanistan), the Great Basin (USA), the Kalahari Desert (southern Africa), and the central Australia deserts (Calidonna et al., 2020; Prospero et al., 2002; Washington et al., 2003). Recently another prominent source of mineral dust has been drawing research interest: the semiarid region between the Persian Gulf and the Caspian Sea. Several studies (Gholamzade Ledari et al., 2020; Kaskaoutis et al., 2018; Rashki et al., 2018) have reported the transport of mineral dust originating from this region, usually towards central and eastern Asia. With the purpose of evaluating the wind regime and dust activity in this region, a particular index, the Caspian Sea–Hindu Kush index (CasHKI), has been introduced and studied in a long-term time series in previous studies (Kaskaoutis et al., 2018). Previous works have suggested that the Caspian Sea high largely impacts dust activity and the transport of dust plumes over central and southwestern Asia (Hamidianpour et al., 2021; Kaskaoutis et al., 2016; Labban et al., 2021). In turn, the combination of the Caspian Sea high with the low over the North Sea creates the North Sea–Caspian pattern (NCP) that significantly modulates climatic conditions and potentially even dust activity over the Middle East and the Mediterranean (Brunetti and Kutiel, 2011; Kutiel and Benaroch, 2002).
The primary source of desert dust reaching southern Europe, including Italy, is the Sahara Desert (Brattich et al., 2015a; Calidonna et al., 2020). Typically, Saharan dust transport to the central Mediterranean occurs during cyclonic conditions in winter, spring, and fall, and during anticyclonic conditions in summer (Gobbi et al., 2019). In general, dust storms in the central Mediterranean are more frequent in the spring–summer periods, whereas they are rare in the cold seasons (Brattich et al., 2015a; Duchi et al., 2016) to late winter (Fubini and Fenoglio, 2007; Intergovernmental Panel on Climate Change, 2014). Saharan dust outbreaks in Italy are mainly driven by pressure lows south of the peninsula, causing counterclockwise northward pulling of African desert air masses. While typically keeping its meridional character, this synoptic condition has been found to shift seasonally from the eastern northern African coastal boundary in the spring to the western northern African coastal boundary in the summer (Brattich et al., 2015a). Apart from regional-scale mechanisms, the transport of Saharan dust to the Mediterranean is essentially driven by large-scale dynamics and particularly by changes in atmospheric circulation patterns such as the North Atlantic Oscillation (NAO) (e.g., Kaskaoutis et al., 2019, and references therein).
In contrast to the vast literature on Saharan dust, the present work examines an outstanding mineral dust event whose characteristics are, to the best of our knowledge, unprecedented. The event described concerns a singular and massive incursion of mineral dust reaching Europe from central Asia in late March 2020, which was a period marked by a series of peculiarities that were not necessarily connected, such as an extensive, persistent, and intense eastern circulation, fairly infrequent at these latitudes, owing to basic dynamic constraints; the SARS-CoV-2 lockdown; and the concurrent, although seemingly out of context, large ozone hole in the Arctic (Manney et al., 2020). In particular, the trajectory of the dust plume was fairly unusual because, as previously reported, dust storms from central Asia are usually transported to the southwest over the eastern part of Iran, over Afghanistan, or towards the east-southeast, i.e., the Pamirs, the Tian Shan mountains, and western China (Li et al., 2019; Zhang et al., 2020, and references therein). Furthermore, dust activity in central Asia is directly and indirectly influenced by atmospheric dynamics and teleconnection patterns such as the El Niño–Southern Oscillation (ENSO), the Arctic Oscillation (AO), the NAO, and the Siberian high (Zhang et al., 2020, and references therein).
The mineral dust incursion originating from the Caspian region widely bounced across the Italian media, as it led to PM10 (particulate matter with an aerodynamic diameter less than 10 µm) concentration levels well above the European Union (EU) air quality threshold, wedging over an area historically characterized by frequent and significant exceedances of this pollutant, such as the Po Valley (Tositti et al., 2014), mainly due to the accumulation of anthropogenic emissions. As a result, this event led to harsh, although controversial, connections between air quality across the regional airshed and the virus spread (Belosi et al., 2021; Prather et al., 2020).
In contrast to the extensive literature on Saharan dust, as previously mentioned, mineral dust from the Caspian region has undergone far less investigation, although it has recently been drawing increasing attention from researchers owing to a multitude of climatic and environmental implications (Li et al., 2021). This arid region is indeed an area of increasing desertification owing to climate change as well as to decades of disastrous environmental management, including the desiccation of the Aral Sea, with a loss of 90 % of its original water volume over the last few decades (Behzod et al., 2012; Breckle and Wucherer, 2012; Loodin, 2020; Sharma et al., 2018; Shen et al., 2016; Shi et al., 2014; Zhang et al., 2020).
The mineral dust incursion event from central Asia described in this paper occurred at the end of March 2020 and, to the best of our knowledge, has not been the object of an in-depth analysis to date, although it has been mentioned in a few papers devoted to other topics (Masic et al., 2020; Šikoparija, 2020) and has also been qualitatively described on remote sensing or meteorological web pages (Mahovic et al., 2020; SNPA, 2020).
In this work, we present an in-depth analysis of this outstanding event based on the collection of high-resolution optical particle counter number size distribution data observed at three sites in northeastern Italy: two urban observatories in Bologna and Trieste, and the high-altitude WMO-GAW (World Meteorological Organization–Global Atmosphere Watch) global observatory at Mt. Cimone (https://cimone.isac.cnr.it/, last access: 30 November 2021). Data analysis includes an accurate meteorological assessment in order to identify the peculiar synoptic conditions leading to the event. Back-trajectory analysis was used to identify the source region. Aerosol behavior during the dust incursion over Italy was analyzed by optical particle spectrometry, while multiple data based on reanalysis (Copernicus Atmosphere Monitoring Service, CAMS) and remote sensing (lidar and AErosol RObotic NETwork, AERONET, sun photometers) were employed to gain a dynamical 3D characterization of the mineral dust transport.
Following Sect. 1 and a description of the measurement techniques (Sect. 2), the discussion of the results (Sect. 3) is organized as follows: (1) an in-depth synoptic analysis and a directional analysis of the event are provided; (2) an analysis of the aerosol size distribution in Bologna, Trieste, and Mt. Cimone before, during, and after the event is presented; (3) the influence on the aerosol mass load is examined; and (4) the trend in the aerosol optical depth (AOD), the vertical distribution, and the chemical composition of the dust event are explored. Finally, the main conclusions are summarized in Sect. 4.
2.1 Sampling sites
The Caspian dust event was investigated during a long-term air quality campaign by three optical particle counters (OPCs; see Sect. 2.2 for details) located at three different sampling sites. Details of the three instruments are summarized in Table 1.
Table 1Technical specifications of the three OPCs used: a LOAC instrument from Meteomodem, a multichannel monitor from FAI Instruments, and a GRIMM 1.108 instrument from AMOF.
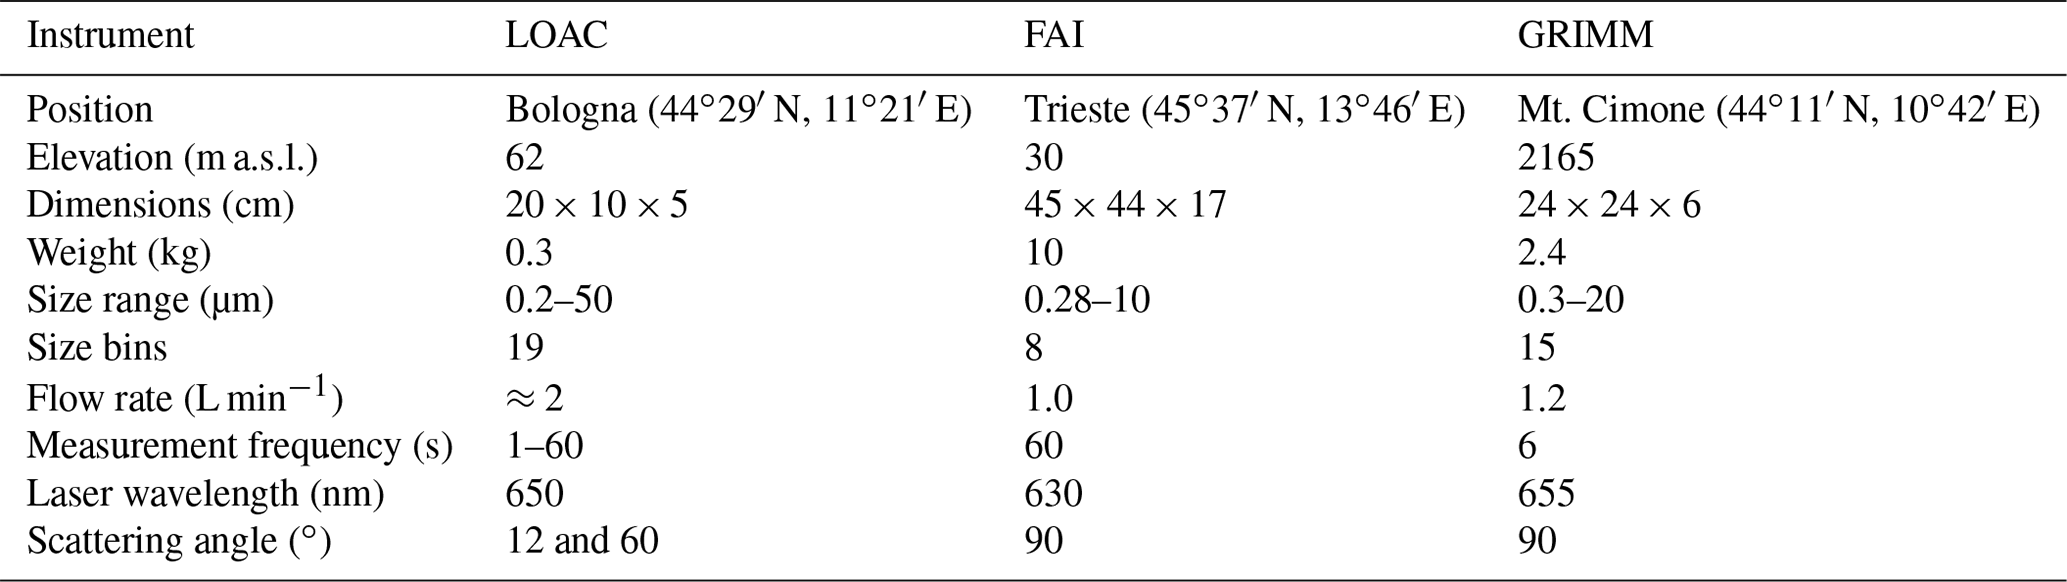
In Bologna (BO), sampling was carried out with an OPC called LOAC (light optical aerosol counter; Meteomodem, Ury, France; size range from 0.2 to 50 µm) (Brattich et al., 2020b; Renard et al., 2016a, b). The instrument was installed on the rooftop of the Department of Physics and Astronomy of the University of Bologna (44∘29′58′′ N, 11∘21′14′′ E; 62 m a.s.l.). In addition, meteorological conditions (temperature, pressure, relative humidity, rain rate, wind speed, and direction) in Bologna were also collected by a Davis Vantage Pro2 weather station (Davis Instruments, Hayward, CA, USA) at a 10 min interval, located close to LOAC.
In Trieste (TS), an OPC multichannel monitor (FAI Instruments s.r.l., Rome, Italy; size range from 0.28 to 10 µm) (Dinoi et al., 2017) was placed in the Via Pitacco air quality station (45∘37′29′′ N, 13∘46′46′′ E; 30 m a.s.l.), managed by the Regional Agency for Environmental Protection of Friuli Venezia Giulia Region (ARPA FVG – Agenzia Regionale per la Protezione dell'Ambiente del Friuli Venezia Giulia). Meteorological data for Trieste are available as open data on the ARPA FVG website (https://www.osmer.fvg.it/, last access: 30 November 2021) at a 1 min time step.
The summit of Mt. Cimone (CMN; 44∘11′37′′ N, 10∘42′02′′ E; 2165 m a.s.l.) is the location of the only WMO-GAW global station in Italy (and within the Mediterranean Basin). The atmospheric measurements carried out at CMN can be considered representative of the baseline conditions of the Mediterranean Basin free troposphere. A GRIMM 1.108 OPC (AMOF, Leeds, UK; size range from 0.3 to 20 µm) has been continuously running since August 2002 to observe the accumulation- and coarse-mode aerosol number size distribution. The OPC is placed on a TSP (total suspended particle) heated air inlet designed in the framework of the EUSAAR (European Supersites for Atmospheric Aerosol Research) project and following the ACTRIS (Aerosol, Clouds and Trace gases Research InfraStructure) recommendation for aerosol inlets.
For all sites, the data analysis for the present work covers the period between 20 March and 5 April 2020, namely from 1 week before the beginning of the dust transport event to northern Italy (27 March) until 1 week after the end of the event (31 March).
2.2 Optical particle counters (OPCs)
Optical particle counters (OPCs) are widely used for aerosol characterization (Brattich et al., 2015a, 2019, 2020b; Bulot et al., 2019; Kim et al., 2019). The advantages of this class of aerosol instrumentation over the traditional filter-based instruments are their portability, their relatively low cost, the availability of aerosol size distribution, and the possibility to acquire PM data continuously and at high time resolution (down to one measurement per second) (Brattich et al., 2020b).
OPCs exploit the principle of light scattering from aerosol particles, generally using a monochromatic high-energy source such as a laser beam to detect and count particles. According to Mie scattering theory (Mie, 1908; Renard et al., 2016a), the intensity of scattered light is related to the particles' size, while the number of pulses of scattered light reaching the detector is related to the number of particles. This kind of instrument can retrieve a semicontinuous real-time analysis of the suspended particulate matter as a function of its diameter. In particular, the LOAC evaluates the scattering at two angles, 12 and 60∘, with the first being almost insensitive to the particles' refractive index and the second being strongly sensitive to the refractive index (Renard et al., 2016a). The FAI and GRIMM spectrometers detect aerosol particles from the scattered signal at 90∘. All of the OPC sensors operate at a 1 L min−1 air volume flow rate and with a scan frequency of 1 min. For the sake of homogeneity, all of the data were averaged at a 1 h time resolution. All OPC data are reported as a number concentration, in counts per cubic decimeter (no. L−1).
Table 2Size bins of the three OPCs. All reported values are in micrometers (µm).
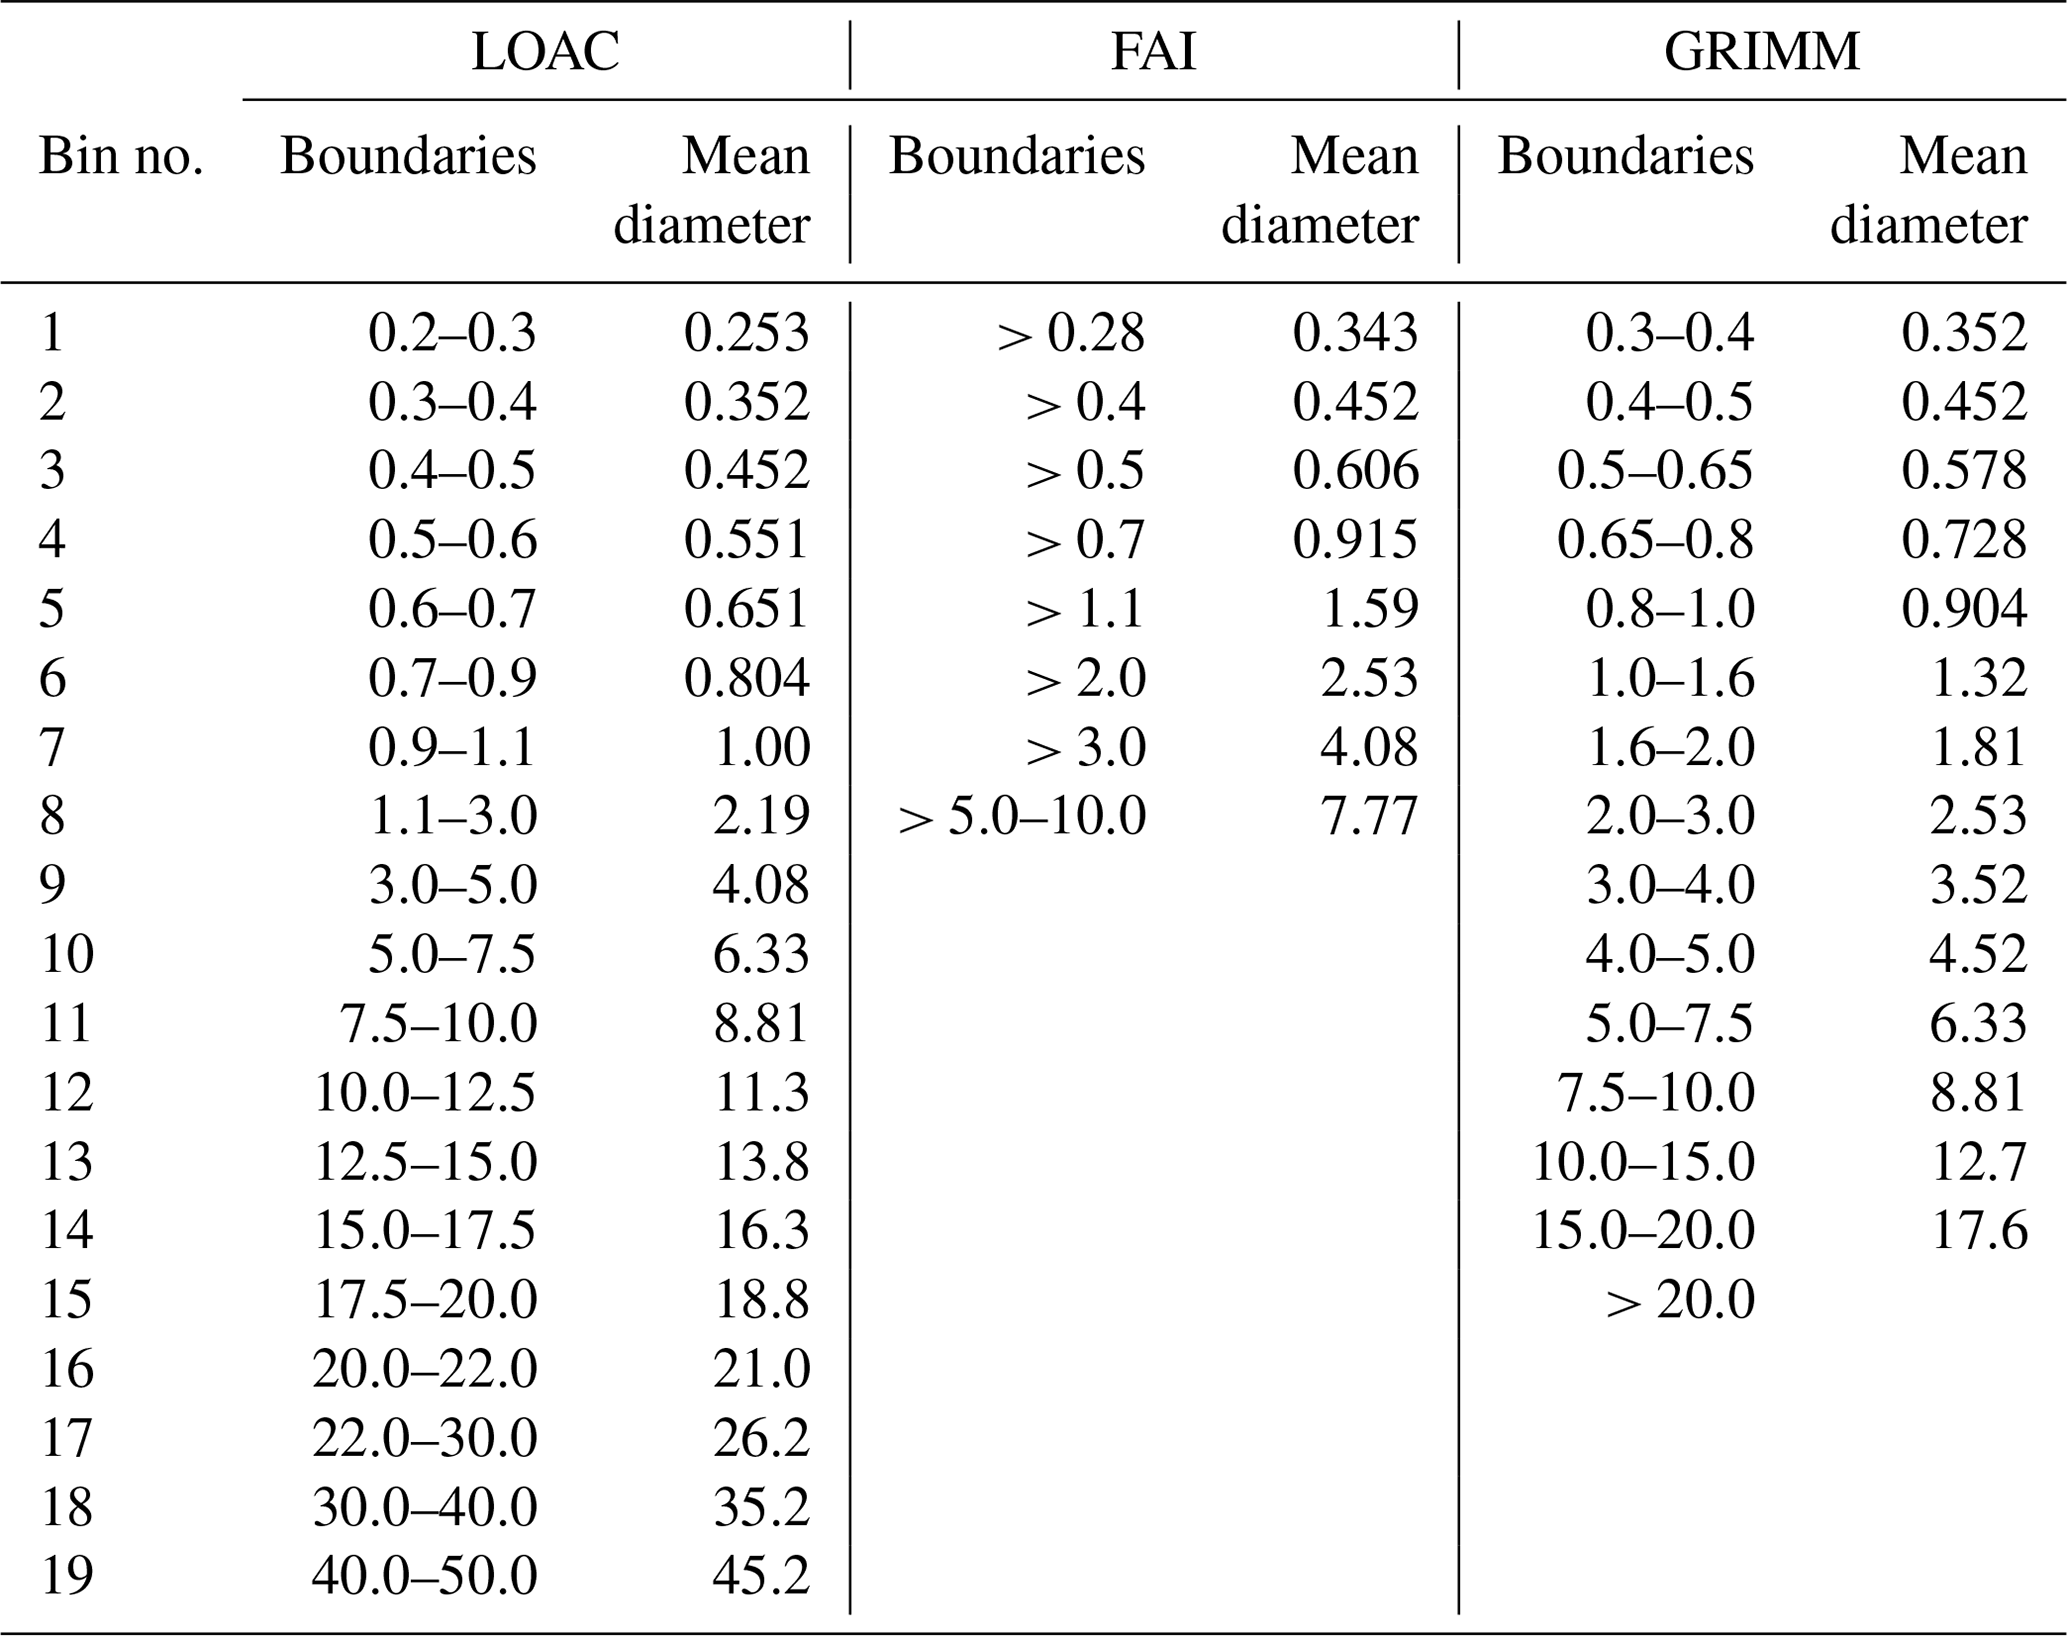
The LOAC aerosol range is between 0.20 and 50 µm, the FAI working range is between 0.30 and 10 µm, and the GRIMM working range lies between 0.3 and 20 µm. The particle size distribution is obtained over 19 size bins for LOAC, 8 size bins for the FAI instrument, and 15 size bins for the GRIMM instrument, as reported in Table 2. A mean bin diameter was calculated for each size interval as indicated by Eq. (1) (Crilley et al., 2018):
where LB and UB are the lower and the upper bin boundaries, respectively. While LOAC and GRIMM have well-defined minimum and maximum particle diameters for each bin, the FAI OPC works in an integral mode: the count value of each bin was obtained by subtracting the value of the following one, and the LB of the latter bin was set as the UB for the computation of D.
Table 3Fractions analyzed with the LOAC, FAI, and GRIMM instruments, with the corresponding bin combinations (sums or differences).
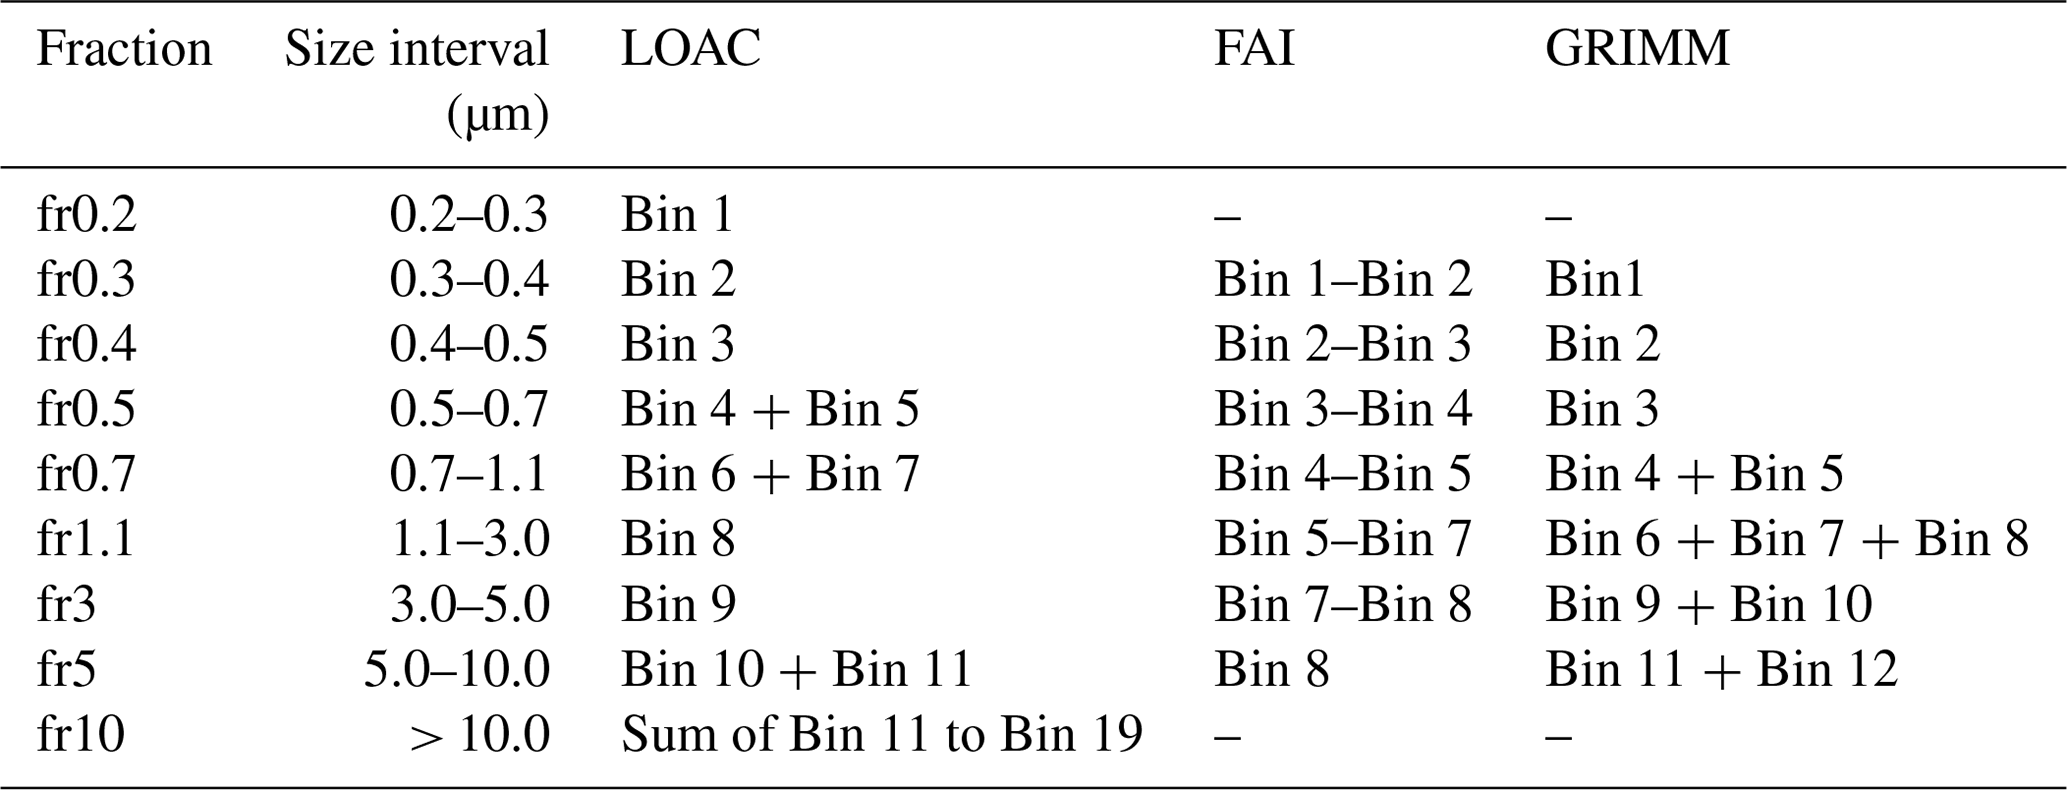
Owing to the different ranges and number of bins of the OPCs used (Table 2), experimental data were homogenized as follows. Seven aerosol fractions were considered for comparison of the three OPC outputs, while two additional fractions were evaluated for LOAC only: fr0.3, fr0.4, fr0.5, fr0.7, fr1.1, fr3, and fr5 for all OPCs; and fr0.2 and fr10 for LOAC only. Table 3 describes the processed fractions and the bin combinations used for the comparison. Table 2 shows that the GRIMM instrument could also be used to evaluate fr10. However, previous studies (Duchi et al., 2016; Marinoni et al., 2008; Sajani et al., 2012) have highlighted that the presence of coarse particles is unusual on the top of CMN, except in cases of Saharan dust (Marinoni et al., 2008). Moreover, as described further on, the event analyzed here had limited vertical development and did not significantly affect the top of Mt. Cimone (as shown by the low counts in the coarser bins at this station). Therefore, we decided not to consider fr10 for CMN.
Computations and graphs of time series, particle size distributions, and number concentration to mass conversions were performed with R software (R Core Team, 2021). Polar plots of the OPC fractions were calculated considering all data from 20 March to 6 April with the “openair” R package (Carslaw and Beevers, 2013; Carslaw and Ropkins, 2012).
2.3 Synoptic-scale conditions
The main synoptic-scale patterns related to the abovementioned dust transport have been investigated based on the meteorological fields provided by the Global Forecast System (GFS) coupled model, produced by the National Centers for Environmental Prediction (NCEP). In particular, we have analyzed the pressure field at sea level (SLP) and the geopotential height at 500 (Z500) and 850 (Z850) hPa at 00:00 UTC for each day during the period of the event.
Furthermore to locate and follow such long-range transport, we have used the regional air quality products of the Copernicus Atmosphere Monitoring Service (CAMS) (Marécal et al., 2015) in terms of the particulate matter concentration (specifically the PM10 fraction) at the height of 50 m above the surface. In detail, we have analyzed the output provided by the CAMS that merges model and observation data and ensures a high spatial resolution (∼ 0.1∘) (CAMS, 2015).
Back trajectories were also evaluated to confirm the origin of the studied mineral dust event from central Asia. Back trajectories are computed simulating the transport of air masses for a determined time frame until these reach a given “receptor” point at a specific time instant (Fleming et al., 2012; Rolph et al., 2017). In this specific case, 96 h back trajectories were computed using the Hybrid Single-Particle Lagrangian Integrated Trajectory (HYSPLIT_4) model (Rolph et al., 2017; Stein et al., 2015) considering the three locations of the OPCs as receptor sites (see Sect. 2.1) over the whole period of the event. The computation was performed every 6 h starting from 27 March at 00:00 UTC until 31 March at 18:00 UTC using GFS meteorological data at a 0.25∘ (27.8 km) resolution (National Centers for Environmental Prediction/National Weather Service/NOAA/US Department of Commerce, 2015). For each receptor site, trajectories were computed at different heights to determine the impact of the arrival height on the trajectory analysis: 100, 1000, and 2000 m a.g.l. for Bologna (BO) and Trieste (TS); 1700, 2200, 2700, and 3200 m a.g.l. for Mt. Cimone (CMN).
2.4 Particulate matter concentrations and chemical speciation data
In addition to measurements from the OPCs, daily mean PM10 concentrations measured with automatic low-volume SWAM 5a dual-channel monitors (FAI Instruments, Rome, Italy) at two air quality stations of the ARPAE (Agenzia Prevenzione Ambiente Energia Emilia-Romagna) Regional Environmental Protection Agency in Bologna (Porta San Felice and Giardini Margherita – urban traffic and urban background stations, respectively) were used. Data were obtained using the “saqgetr” R package (Grange, 2019).
Furthermore, chemical speciation data (ions, carbonaceous fraction, and elements) sampled in Bologna and available as open data from ARPAE (https://www.arpae.it/it, last access: 30 November 2021) were also analyzed to complement the other analyses. The two abovementioned air quality stations are located 2 km from the LOAC site, to the west and the south, respectively. The data are validated daily, monthly, and every 6 months, and they are certified according to the UNI EN ISO 9001:2015 standard.
2.5 AERONET (AErosol RObotic NETwork)
Aerosol optical depth (AOD) daily averages data retrieved from the Aerosol Robotic Network (AERONET) ground-based remote sensing aerosol network Venice site (Acqua Alta oceanographic tower – AAOT; 45∘19′ N, 12∘30′ E) were used as an independent method to confirm the dust aerosol transport event at the end of March 2020.
AERONET collaboration provides globally distributed observations of spectral aerosol optical depth (AOD), inversion products, and precipitable water in diverse aerosol regimes. For this work, version 3 AOD data and inversions computed for Level 2.0, i.e., quality assured (with pre- and post-field calibration applied, automatically cloud cleared, and manually inspected), were utilized. Total-mode, fine-mode, and coarse-mode AOD at 500 nm (standard reference wavelength) were computed using a best-fit second-order polynomial according to the spectral deconvolution algorithm (SDA) by O'Neill et al. (2003). Finally, the AERONET inversion code provides aerosol optical properties in the total atmospheric column derived from the direct and diffuse radiation measured by AERONET Cimel sun–sky radiometers (NASA, 2006). The output includes both retrieved aerosol parameters, which comprehend the volume size distribution, and parameters calculated based on the retrieved aerosol properties. The inversion algorithms are based on the following assumptions: (1) the atmosphere is considered to be plane-parallel, (2) the vertical distribution of aerosol is assumed to be homogeneous in the almucantar inversion and bi-layered for the principal plane inversion, and (3) aerosol particles are assumed to be partitioned into spherical and nonspherical components.
2.6 Lidar ceilometer
Aerosol vertical profiles collected in Milan (Diémoz et al., 2019; Ferrero et al., 2021) (45∘31′ N, 9∘12′ E; 130 m a.s.l.; ∼ 200 km northwest of Bologna) have been used to identify the signature of dust transport as well as to investigate its vertical extension and altitude. Such profiles were gathered by a Nimbus CHM 15k system (Lufft, Germany) running within the Italian Automated Lidar–Ceilometer network (ALICEnet, http://www.alice-net.eu, last access: 30 November 2021), coordinated by the Institute of Atmospheric Sciences and Climate (CNR-ISAC) in partnership with other Italian research institutions and environmental agencies. It is a high-performance system providing vertical profiles of aerosols and clouds in the first 15 km of the atmosphere with a temporal resolution of 30 s and a vertical resolution of 15 m (Dionisi et al., 2018). ALICEnet measurements have been and are currently usefully employed to detect the altitude and temporal evolution of cloud layers (Ferrero et al., 2021) and to track the transport of polluted (Diémoz et al., 2019) or mineral dust aerosol plumes (Gobbi et al., 2019) at different sites along the Italian Peninsula.
3.1 Synoptic analysis
As documented later on, the source region of the investigated episode of severe dust transport was the central Asian southern desert region located between the eastern coast of the Caspian Sea and the steppes near the central Asian mountain ranges. Most of Turkmenistan and eastern Uzbekistan, as well as the central Asian desert ecoregion to the north, can be considered a cold desert, in agreement with the inherent climatic class (BWk, according to the Köppen classification), with hot summers, cold winters, and an annual precipitation of 125–170 mm yr−1, with winter and spring as the wettest seasons (Li et al., 2019, 2021). In order to analyze the weather patterns during the event, we have decided to analyze the pressure and wind fields at sea level (SLP) and the geopotential heights of 500 (Z500) and 850 (Z850) hPa in the period from 20 to 30 March 2020. Figure 1 shows the Z850 geopotential maps, and Fig. 2 shows the corresponding PM10 (50 m height) concentration maps and the surface horizontal wind derived from CAMS reanalysis for the period from 24 to 31 March 2020, which can be considered as the period in which the dust transport took place. Figure A1 in the Appendix shows the same Z500 geopotential maps.
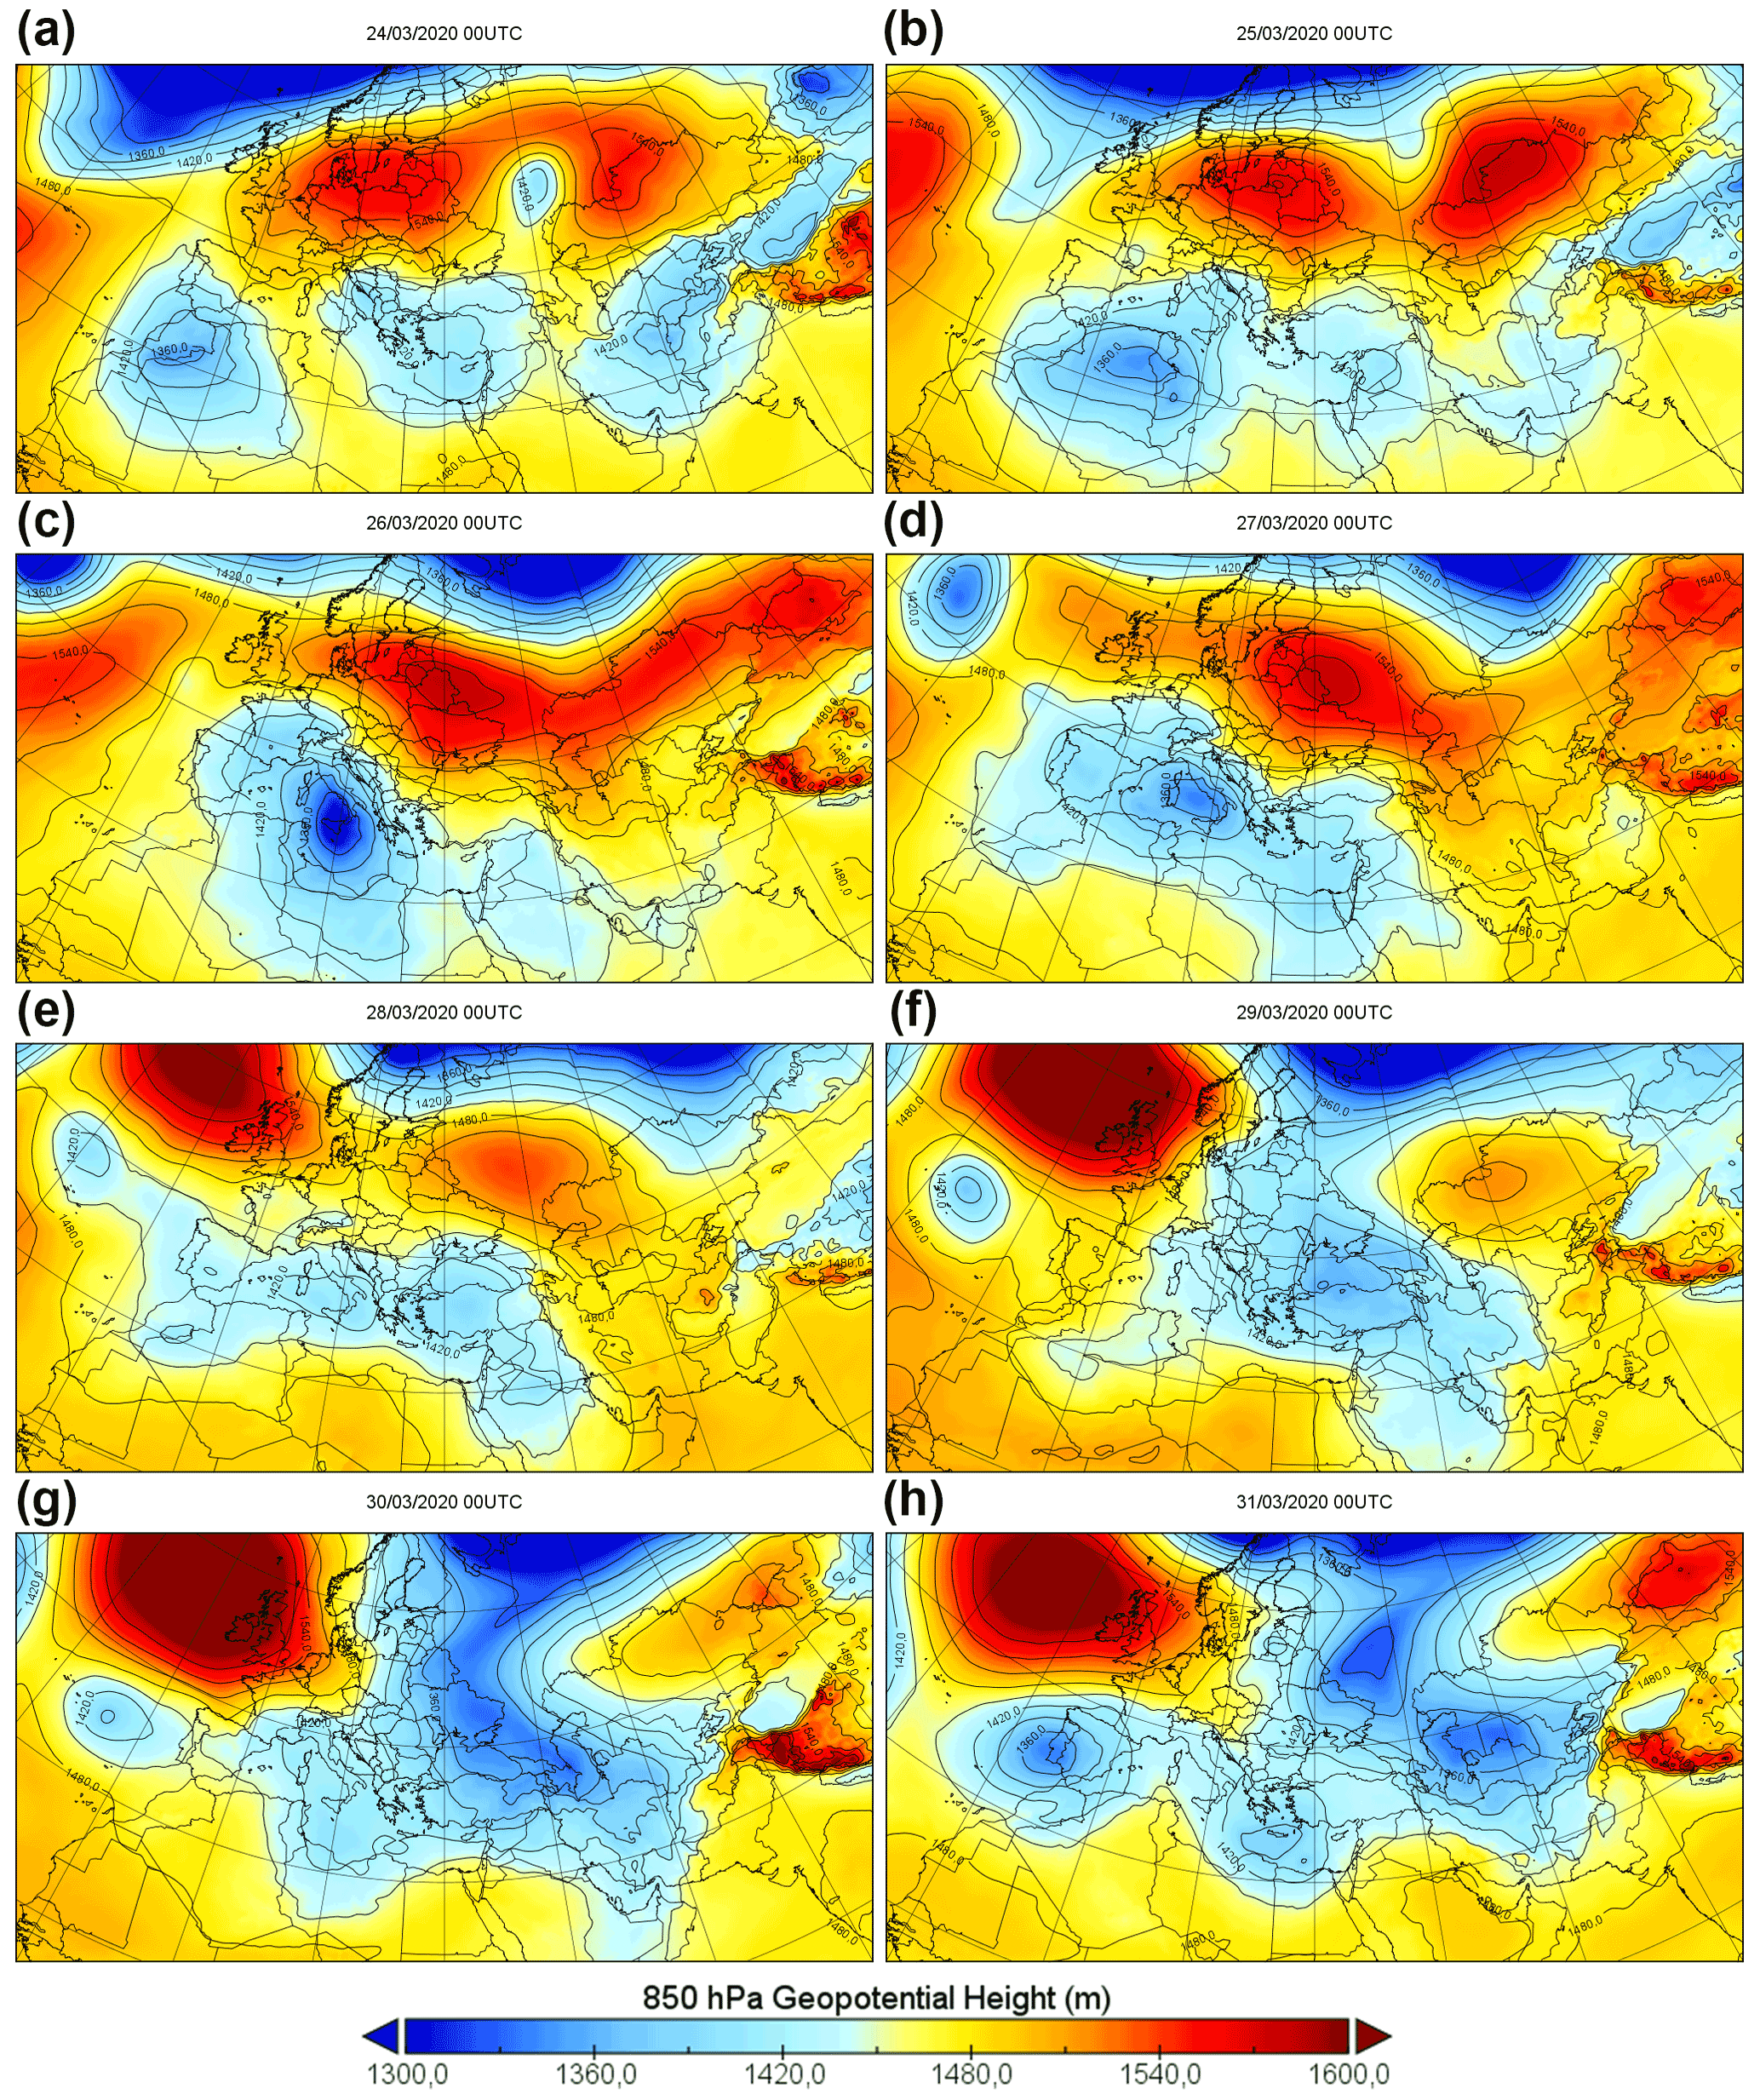
Figure 1Maps of the geopotential (colors and isolines, in m2 s−2) at 850 hPa relative to each day in the period from 24 to 31 March at 00:00 UTC (a–h). The maps were created with Panoply starting from ERA5 reanalysis. Panels (a) to (h) refer to the respective days from 24 to 31 March 2020.
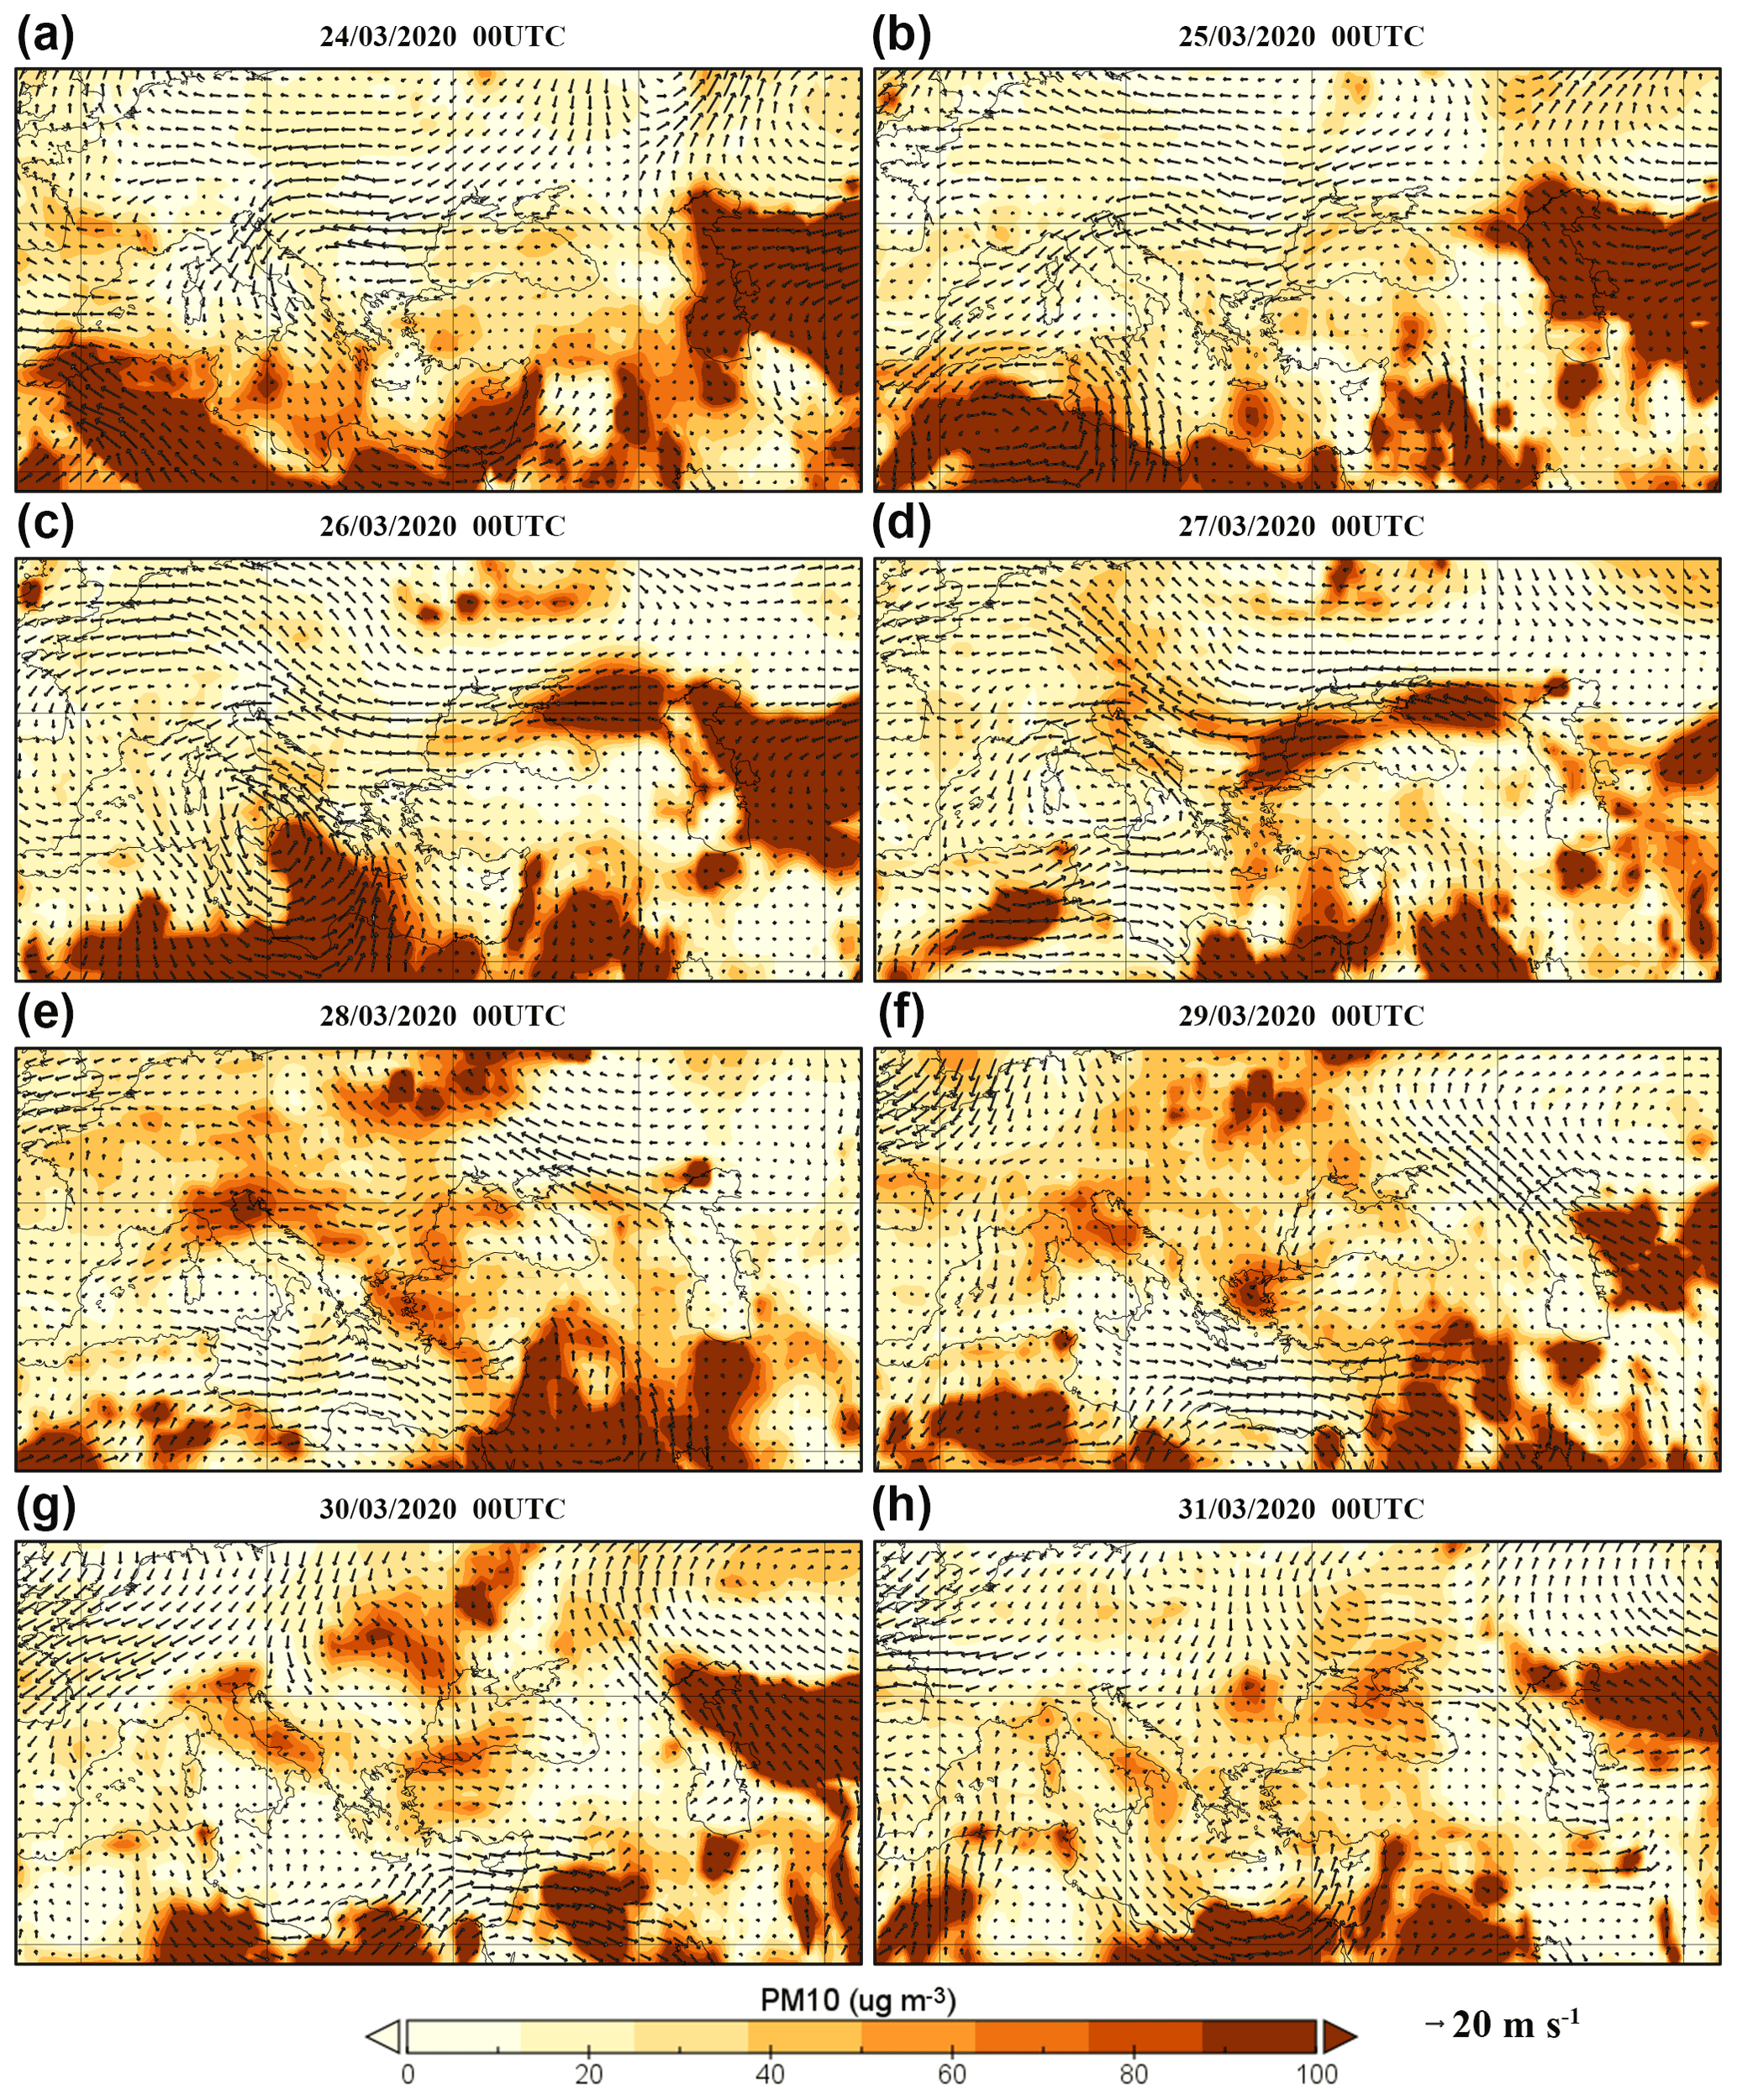
Figure 2Maps of the PM10 (colors, in µg m−3) and horizontal surface wind (arrows) relative to each day in the period from 24 to 31 March at 00:00 UTC (a–h). The maps were created with Panoply starting from ERA5 reanalysis. Panels (a) to (h) refer to the respective days from 24 to 31 March 2020.
On 20 March, at 500 hPa, the geopotential height was high in the western Mediterranean Basin and western Europe due to a ridge that expanded from Libya to Italy and Poland, whereas the pressure field at sea level and the geopotential height at 850 hPa were uniform. Over the Caspian deserts, the circulation was weak, although southern winds in the northern region were flowing towards Uzbekistan and Kazakhstan, and the 850 hPa winds were flowing westwards from the east of the Caspian Sea. On this date, there were three areas showing high dust concentrations: northern Africa, western Kazakhstan and Turkmenistan, and Iraq and Syria (originating from the Arabian Peninsula).
During the following 3 d, regarding Z500, the European anticyclone elongated in a northeasterly direction, reaching Scandinavia on 23 March, and a trough concurrently developed from Russia and extended to Bosnia and Albania. Regarding the SLP and Z850, an anticyclone developed over southern Sweden, activating a weak easterly flow directed from the southern Urals to Croatia. Over the Caspian deserts, there was a complete change in circulation, and winds turned westwards during 22 March east of the Caspian Sea before turning northwards over the Caspian Sea. At that moment, dust transport (in the subsequent days) towards Europe and, therefore, Italy began. Note that the characteristics of the southward extension of the Siberian high during these days, as well as the associated pressure gradients, were favorable to the development of the dust storm over the Caspian region, as indicated by previous works (Hamidianpour et al., 2021; Labban et al., 2021; Li et al., 2019, 2021). Over the central Mediterranean Sea, a strong southerly flow from Libya, pivoting on a minimum between Tunisia and Sicily, established, carrying Saharan dust over the Ionian Sea and Sicily on 22 March and over Greece and western Turkey on 23 March.
On 24 March (Figs. 1a, 2a, A1a), at Z500, a narrow ridge was extending from the Azores to the Baltic states, while a minimum formed between the Caspian deserts and Italy. Regarding the SLP and Z850, a strong anticyclone was present over Lithuania and Belarus. Moreover, a minimum north of the Caspian Sea caused an intense easterly flow from the Caspian deserts to the eastern Black Sea. Another southward flow was present over eastern Europe, directed over the western Black Sea, which subsequently turned right, becoming a westward flow and moving towards Italy. At that time, the Italian Adriatic regions were already affected by a strong northeasterly flow, although without dust transport, as the Caspian desert dust cloud was just approaching the eastern Black Sea on the evening of that day. Simultaneously, due to the cyclonic curvature of the flow over the eastern Mediterranean Sea, some dust started to move from Syria to Turkey, while Saharan dust flow towards Italy was temporarily paused.
On 25 March (Figs. 1b, 2b, A1b), at Z500, a cutoff was gradually filling over Italy, surrounded by a ridge from the UK to Belarus and another ridge west of Urals, in Asia. Regarding SLP, isobars outlined an almost linear corridor of flow between the Caspian deserts and Bosnia and Croatia, which veered north across the Bora door (a section of the Alps through which the Bora wind reaches Italy from the Balkan region) and entered in northeastern Italy. Regarding Z850, a remarkable flow was present between Romania and Croatia. The Caspian desert dust cloud crossed the Black Sea during this day, still traveling near the surface. Important for the next evolution was also the minimum present in the SLP and at Z850 over Tunisia, which was responsible for a new Saharan dust transport towards the Ionian Sea and Sicily. Meanwhile, the Syrian dust continued moving westwards, reaching Bulgaria, probably mixed with Saharan dust that was moving northwards from Egypt.
On 26 March (Figs. 1c, 2c, A1c), the previously mentioned anticyclone extended towards the Black Sea, joining with the anticyclone over Egypt, while the cutoff retreated to Italy and the western Mediterranean Sea, promoting the shift of the SLP and Z850 anticyclone to the north of the Black Sea. The minimum over Tunisia shifted to the Ionian Sea, thereby strengthening the flow along a corridor extending from the Caspian deserts across the Black Sea up to Romania and Bulgaria and then to the Adriatic Sea. Under these conditions, the most intense flow was observed from the Black Sea to the Adriatic Sea. In the evening, the Aralkum Desert dust cloud reached Croatia and the Adriatic Sea, where it merged with the Sirocco wind associated with the Ionian Sea cyclone, which is responsible for Saharan dust transport towards southern Italy and, in minimal part, the Italian central Adriatic regions. Meanwhile, a strong southeasterly wind established over the eastern Mediterranean Sea, favoring dust transport from Iraq and Saudi Arabia across Syria up to western Turkey and Greece. At this stage, the area between Romania, Croatia, Greece, Albania, Bulgaria, and Turkey was affected simultaneously by dust coming from three different source areas, namely northern Africa, the Arabic Peninsula, and the eastern Caspian deserts; this represents something really unusual.
On 27 March (Figs. 1d, 2d, A1d), the trough at Z500 was located in the western Mediterranean Basin, surrounded by anticyclones and ridges. The SLP and Z850 cyclone moved over the Tyrrhenian Sea, while the anticyclone also expanded over Romania. As a consequence, the main flow from the Caspian deserts, moving across the Black Sea, headed towards Greece, veering toward the northwest and thereafter affecting the Adriatic Sea and eastern Italy. The Caspian desert dust cloud touched down on the coast of the Adriatic regions (Friuli Venezia Giulia, Emilia-Romagna, and Marche) in the evening. Over the Aegean Sea, in contrast, there was dust that can probably be considered a mixture of two sources (the Caspian deserts and Arabic Peninsula) which was pushed westwards by the strong easterly flow present over eastern Europe and the eastern Mediterranean Sea.
On 28 March (Figs. 1e, 2e, A1e), due to the weakening of the geopotential field at Z500 and Z850, as well as the SLP field, the flow from Romania to Italy considerably weakened. The circulation over northeastern Italy changed due to the influence of the anticyclonic curvature induced by a large SLP high located between Iceland and Ireland, pivoting a strong northerly surface flow from Scandinavia. A first impulse of cool easterly air masses shifted along the surface across the Po Valley in the early morning, forming a shallow front (with few clouds) that was able to transport the dust cloud up to the border of the Piedmont region (northwestern Italy) during the afternoon. Over eastern Italy, in contrast, the local breeze circulation prevailed.
During the evening, a second easterly impulse crossed the Po Valley, this time accompanied by more clouds but without precipitation; during the morning of 29 March (Figs. 1f, 2f, A1f), it also reached the northwestern Italian regions (Piedmont, Aosta Valley, and Liguria). At that time, approximately half of Italy was affected by the Caspian desert dust cloud, although the concentration had already decreased over the northeast sector owing to a northerly air mass from the Alps. On that date, the SLP and geopotential at Z850 and Z500 abruptly decreased in a corridor from the Baltic states to Greece, thereby completely interrupting the easterly flow of dusty air, which remained active just over the eastern Mediterranean Basin. During the afternoon of 29 March, the inflow of the Arctic air mass moving across the Alps displaced the mineral-dust-rich air mass over the Po Valley in a southwards direction.
Finally, on 30 March (Figs. 1g, 2g, A1g), the cold front pushed by the Arctic airflow fully embraced the Po Valley, definitely cleaning most of northern Italy, as was visible on the morning of 31 March (Figs. 1h, 2h, A1h).

Figure 3Back trajectories (96 h backwards) ending at Bologna on (a) 27 March at 18:00 UTC, (b) 28 March at 18:00 UTC, (c) 29 March at 18:00 UTC, and (d) 30 March at 12:00 UTC.
The easterly origin of the air mass causing the dust event over northern Italy was also confirmed by back-trajectory analyses. Using the three measurement sites (BO, TS, and CMN) as receptor points, 96 h back trajectories were computed. The most relevant back trajectories are reported in Fig. 3 for BO and in Appendix A for TS (Fig. A2) and CMN (Fig. A3).
In particular, Fig. 3a shows the back trajectory ending on 27 March at 18:00 UTC at BO. This date corresponds to the first peak due to the Caspian dust observed at TS by the FAI OPC and is considered to be the beginning of the event in Italy. Figure 3a already indicates an airflow originating between the Caspian and Aral seas, with some intrusions from the Black and Mediterranean seas. The Caspian origin of air masses becomes even more evident during the following days (Fig. 3b, c). Subsequently (Fig. 3d), on 30 March, a northern stream started to flow over northern Italy, cleaning the air of dust. The observation drawn from these back trajectories confirms what was suggested by the synoptic analysis: the calculated trajectories, within the limits of the computational uncertainty, suggest that the Caspian dust reached Trieste, passing through the Bora door, before arriving in Bologna.
This evidence is also confirmed by the computed back trajectories for the TS measurement site shown in Fig. A2. The ending times in Fig. A2 are the same as Fig. 3, and the conclusions that can be drawn are similar: an airflow originating from the Caspian region reached Trieste on 27 March (Fig. A2a), and it continued during the following days (Fig. A2b, c) until a northern stream cleaned the air starting on 30 March (Fig. A2d).
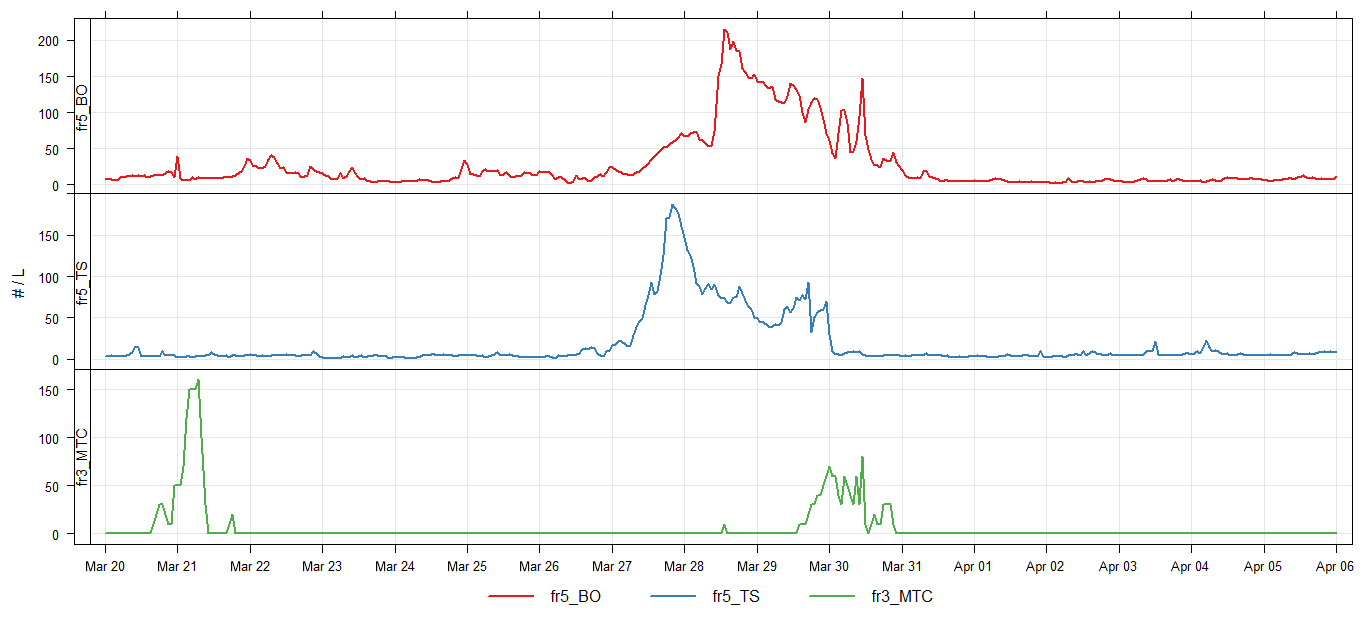
Figure 4Temporal trends of fr5 (5.0 to 10.0 µm) at Bologna (red line) and Trieste (blue line) and of fr3 (3.0 to 5.0 µm) at Mt. Cimone (green line). Values are in counts per cubic decimeter (no. L−1).
Figure A3, in contrast, shows some of the calculated back trajectories for Mt. Cimone. In this case, an air mass with a possible northern African origin, with a strong component from the Aegean Sea, reached the site on 27 March (Fig. A3a), although it did not cause visible peaks in the OPC time series (Figs. 4c, A4c). Furthermore, the peaks observed on 28–29 March (Fig. A3b, c) can again be associated with an airflow originating from the Caspian region.
3.2 Optical aerosol counters (OPCs)
3.2.1 Temporal trends and particle size distributions
The mineral dust outbreak produced a remarkable increase in particle number densities at all of the three sites investigated, i.e., Bologna, Trieste, and the top of Mt. Cimone. This increase was remarkably high for the coarse fractions, which is a typical feature of mineral dust, in particular at both of the urban stations.
Figure 4 reports the temporal evolution of the coarse fractions limited, for the sake of simplicity, to fr5 (diameter of 5–10 µm) for BO and TS and to fr3 (diameter of 3–5 µm) for CMN. For the latter, fr3 was considered, instead of fr5, due to a large number of data below the detection limit for size bins > 7.5 µm, as previously reported in Sect. 2. This is consistent with a possible loss of larger particles due to gravitational settling during transport/interactions at higher altitude (Mallios et al., 2020). The complete OPC series are available in Appendix A (Fig. A4).
As reported in Fig. 4, the coarse particle number densities were very low before and after the event, reflecting the typical size distribution at urban locations in the cold season. Conversely, the fairly low level in the fine fraction (Fig. A4) is likely due (besides the typical seasonal pattern at this latitude characterized by a decrease in the warmer season; Perrino et al., 2014), at least in part, to the consequences of the lockdown imposed to stem the spread of the SARS-CoV-2 pandemic in Italy, from early March 2020 (Chauhan and Singh, 2020; Donzelli et al., 2020; Malpede and Percoco, 2021). The Asian dust plume impacted TS first, on 27 March during the afternoon, reaching BO (about 200 km southwest) the day after (please note the time lag of the order of 1 d at the two stations in Fig. 4a and b). Overall, the event duration was about 3 d, ceasing on 30 March in Trieste and on 31 March in Bologna. During this period, a general increase in the suspended particle concentration, especially in the coarse fraction, was observed at all of the stations, which is in agreement with mineral dust properties and the resulting influence of mineral dust on the PM mass load recorded at several European stations at the time (Mahovic et al., 2020). The dust plume reached CMN (Fig. 4c) on 28 March, but the maximum concentrations were slightly lagged, peaking between the afternoon of 29 March and 30 March. Another peak in the CMN series is visible on 21 March, likely due to Saharan dust reaching high altitude, which is not discussed because it is beyond the scope of the present work.

Figure 5Polar plots of (a) fr5 for Bologna, (c) fr5 for Trieste, and (e) fr3 for Mt. Cimone; the gray dashed circumferences indicate wind speed in meters per second (m s−1). The wind speed (red line) and wind direction (blue points) from 20 March to 6 April 2020 for (b) Bologna, (d) Trieste, and (f) Mt. Cimone are also shown.
OPC data were associated with the meteorological parameters collected at the three sites. In particular, the connection with local wind speed and direction was evaluated using polar plots (Carslaw and Beevers, 2013). For the present study, we computed polar plots of fr5 for both cities and of fr3 for CMN, as reported in Fig. 5. A conditional probability function (CPF) at the 90th percentile was used for computation in order to minimize pollution source effects and focus the computation only on the dust transport event (Kurniawati et al., 2019). Polar plots of both cities (Fig. 5a, c) show a maximum CPF probability corresponding to the wind blowing from an eastern direction, agreeing with the advection of dust from the Caspian region to the study area. The wind speed corresponding to the two wind intensity maxima was about 3 m s−1 for Bologna and 7 m s−1 for Trieste. In contrast, the polar plot of CMN (Fig. 5e) shows a probability maximum for slow winds (3–5 m s−1) coming from the southwest, corresponding to 30 and 31 March (Figs. 4, 5f). Such a maximum is mainly due to the low intensity of the wind rather than to its direction. Indeed, the previous days are characterized by a strong northeasterly wind (compatible with the dust origin area), even stronger than 25 m s−1, which was a situation under which the OPC was not able to register any increase in particles. In TS, the transport of the dust plume was also preceded by a strong easterly wind, from about 15 to 20 m s−1 (Fig. 5d); however, the wind intensity decreased to 2–5 m s−1 during the event. In this case, another strong easterly current coming from the Bora door cleaned the air and ended the event. BO wind (Fig. 5b), in comparison, did not show a clear pattern. The weak winds registered in Bologna, which were even lower than 1 m s−1 during the event, are typical of the Po Valley basin. The easterly wind direction remains the most remarkable feature, as this source area is fairly infrequent for air masses arriving in Italy, although it is acknowledged, especially in the spring (Battiston et al., 1988; Brattich et al., 2015b, 2020a; Dimitriou and Kassomenos, 2014).
The temporal behavior of the particle number densities as a function of size is not the same (Fig. A4). At the three stations, mineral dust transport showed a stronger increase for the coarse fraction, whereas the increase in fine particles, although present, was generally slighter. Mt. Cimone, in contrast, showed an apparent strong increase in the fine fractions but not in the coarse ones, suggesting a depletion due to the influence of gravitational settling on particles with height.
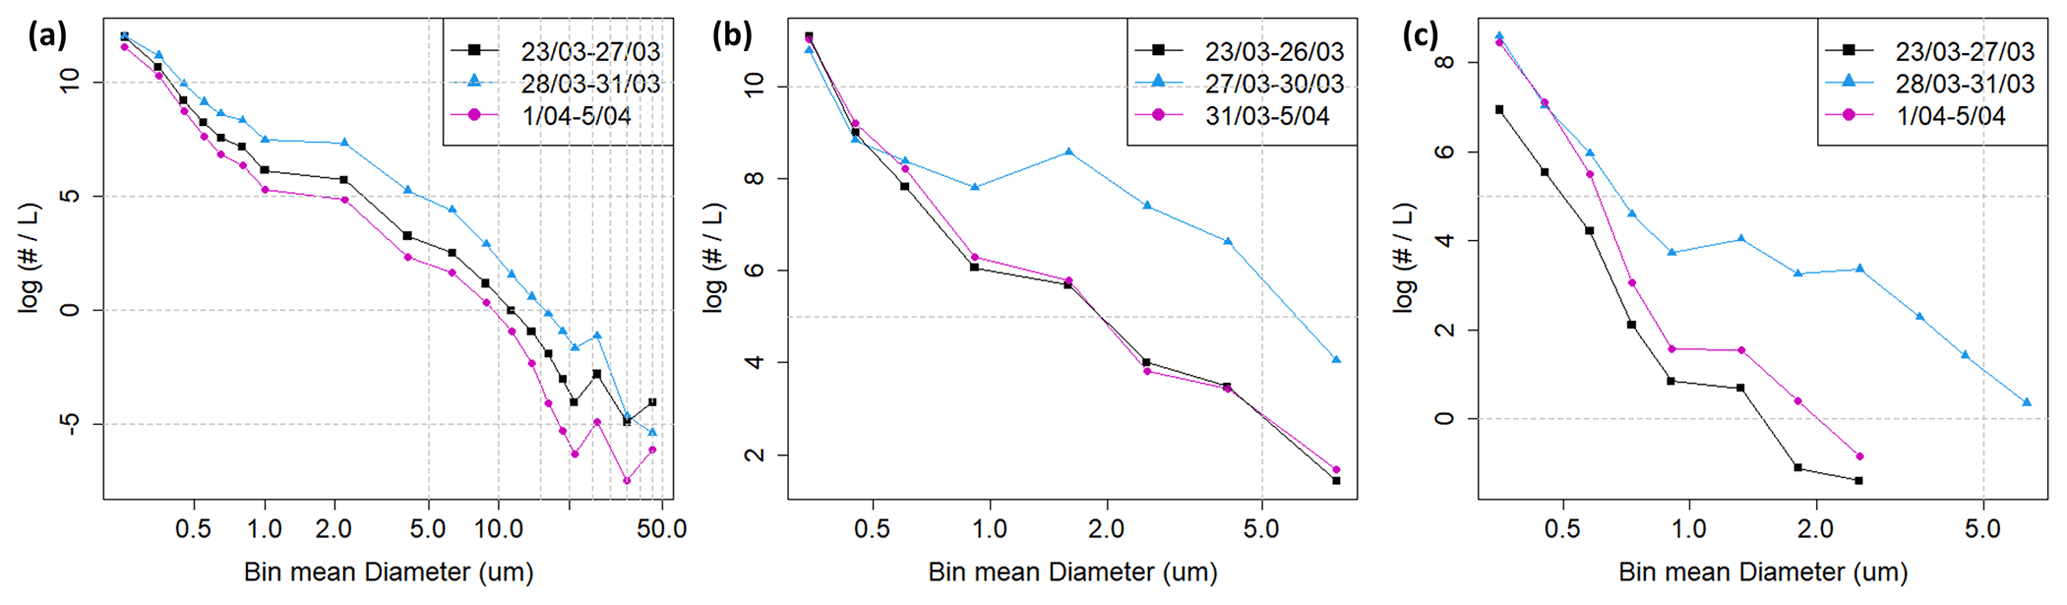
Figure 6Particle size distributions for the OPCs: (a) LOAC (Bologna), (b) FAI (Trieste), and (c) GRIMM (Mt. Cimone). Abscissa values are in micrometers (µm), and ordinate values are in log (no. L−1). The abscissa axis is on a logarithmic scale.
This information can be summarized by comparing the particle size distributions at the three stations before (black line), during (blue line), and after (pink line) the event, as reported in Fig. 6. An overall increase in the number densities is observed at all sites during the dust event. However, as reported in Fig. 6, the most significant deviations of the event period from both the pre- and post-event periods were observed starting from 0.7 µm at BO and TS, whereas the finest particles also underwent an increase during the event at CMN. This confirms that the primary influence of the dust was on coarse particles, rather than on finer ones, at least in the two cities. This finding is different from Saharan dust outbreaks, as, in this latter case, the finest fractions also increased, at least among the size range determined by OPC and/or from lidar observations (Brattich et al., 2015a; Denjean et al., 2016).
3.2.2 Particle mass concentrations
Number densities were eventually converted into daily PM10 mass loads (Fig. 7). Details of the algorithm used for such conversion are described elsewhere (Brattich et al., 2020b). In short, the algorithm uses the lower and upper boundaries of each bin size to calculate a “mean” bin diameter (Eq. 1), which is then used to calculate PM concentrations. The last computation is based on an average PM density of 1.65 g cm−3, usually applied to urban aerosol composition, which may not accurately fit mineral dust aerosols with a different chemical composition (Brattich et al., 2020b; Gholamzade Ledari et al., 2020). The calculated daily PM10 mean at BO reached respective values of 79 and 74 µg m−3 on 28 and 29 March (with an absolute maximum of 168 µg m−3 on 28 March at 13:00 UTC), with a negative bias of about 12 %–15 % with respect to the experimental values recorded by the Regional Environmental Protection Agency in Bologna, revealing an expected underestimate (Fig. 7a). Calculated PM10 values were even higher at TS, where respective values of 107 and 124 µg m−3 were reached on 27 and 28 March (with maxima of 275 at 19:00 UTC and 246 µg m−3 at 23:00 UTC on 27 March). Recorded PM10 values in Bologna and Trieste were remarkably higher than the EU PM10 threshold (European Parliament, 2008) and 3–5 times the WHO recommendation (WHO, 2006); moreover, the estimation of the desert dust load following the method suggested by Barnaba et al. (2017) indicated values in the range of 66–108 µg m−3 at these two cities (Fig. 7b).
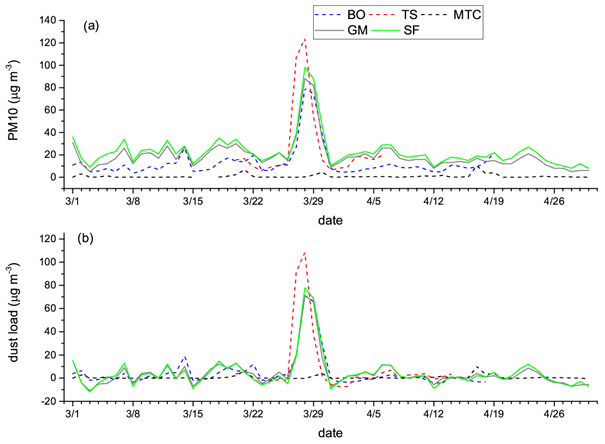
Figure 7Daily mean PM10 values (a) and dust load (b) calculated over the March–April 2020 period. Dashed lines represent values calculated from the counts of the optical particle counters in Bologna (BO), Trieste (TS), and Mt. Cimone (CMN), while solid lines represent concentration values recorded in Bologna at two air quality stations from the network (Giardini Margherita, GM, and Porta San Felice, SF). (Please note that dates are displayed using a month/day format in this figure.)
In BO, the OPC also registered PM10 concentrations slightly above the EU threshold on 30 March (54 µg m−3), while two relative maxima were detected on 27 March (36.4 µg m−3) and 22 March (35.0 µg m−3). The PM10 mean values of the days before the event (from 20 to 26 March, excluding 22 March), which can be considered as representative of the typical background of the region (likely due to the limited influence of vehicular emissions during the lockdown and the low influence of industrial activities in Bologna), were 15.0 and 10.3 µg m−3 prior to and after the mineral dust outbreak event, respectively. A tail of the event was also observed at TS on 29 March, with a concentration of 79.4 µg m−3. The PM10 daily mean value of the days before the event at TS was 11.4 µg m−3, whereas the daily mean of the days immediately following the event (31 March–6 April) was 13.9 µg m−3.
An increase in calculated PM10 was also observed at Mt. Cimone, with a maximum of 11 µg m−3 on 30 March at 11:00 UTC. Although this value is very low compared with those of Bologna and Trieste, the increase is outstanding if compared with the mean PM10 values observed before and after the event (0.11 and 0.35 µg m−3, respectively); these values are in agreement with the winter relative minima previously reported, due to the height (2165 m a.s.l.) and the cold-season decoupling of the mountain top from the planetary boundary layer (PBL) (Tositti et al., 2013).
3.3 Ancillary analyses
3.3.1 AERONET (AErosol RObotic NETwork)
Figure 8 shows the aerosol optical depth (AOD) data retrieved from the AERONET ground-based remote sensing aerosol network at the Venice site (Acqua Alta oceanographic tower – AAOT; 45∘19′ N, 12∘30′ E) around the period of the mineral dust outbreak event analyzed herein. Figure 8 very clearly shows the peculiar, steadily high aerosol optical depth value in the period from 2 to 30 March as well as the simultaneously low value of the fine-mode fraction, confirming the abrupt change in aerosol optical properties due to the dust intrusions, in agreement with the OPC data previously described and similar to previous observations of dust intrusions over Italy (Boselli et al., 2021; Brattich et al., 2015a; Romano and Perrone, 2016). The decrease in AOD with wavelength observed on 28 March (Fig. 7a), i.e., right at the beginning of the dust incursion over northern Italy, is smaller than during the following days, which is likely caused by the larger fraction of coarse particles present in the atmospheric column and by the correspondingly low fraction of fine particles (Fig. 8b).
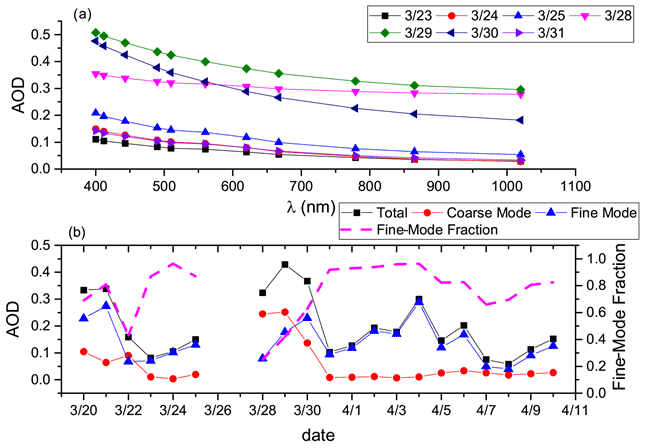
Figure 8(a) Aerosol optical depth (AOD) at different wavelengths and for different days in March 2020 detected at the Venice AERONET site. (b) Time series of the total-, coarse-, and fine-mode AOD as well as the fine-mode fraction observed in March–April 2020 at the Venice AERONET site. (Please note that dates are displayed using a month/day format in this figure.)
Even the volumetric size distributions retrieved by AERONET indicate the prominence of the coarse mode, i.e., of particles with an aerodynamic diameter > 1 µm, on 28 and 29 March, which is in agreement with these observations and with the particle size distributions from OPC readings at BO and TS (Fig. A5).
3.3.2 Lidar ceilometer
Images from a lidar ceilometer from ALICEnet (Dionisi et al., 2018) located in Milan were employed to derive information on the aerosol vertical distribution and on the dynamics of the lowest atmospheric layers. The sensor achieves excellent signal quality thanks to its stable wavelength and its Nd:YAG narrow-beam microchip laser operating in the 1064 nm range. In addition, its technology enables efficient daylight suppression and reduces temperature fluctuations to a minimum. Figure 9 shows the vertical profiles observed during the event, displaying an approximate thickness of about 2 km a.g.l. This observation indicates another peculiarity of this mineral dust event, which, in contrast to Saharan dust plumes that typically reach and shift aloft between 1500 and 4000 m a.s.l. (Jorba et al., 2004; Soupiona et al., 2020), traveled at a relatively low atmospheric altitude, due to the reasonably low temperatures at the source and to the reduced convective activity resulting from the higher latitude and season compared with the Sahara Desert. The relatively low travel height of the dust plume caused gravitational settling of the heaviest particles in the proximity of the ground, in agreement with the size distribution data observed at Mt. Cimone (as shown in Fig. A4c).
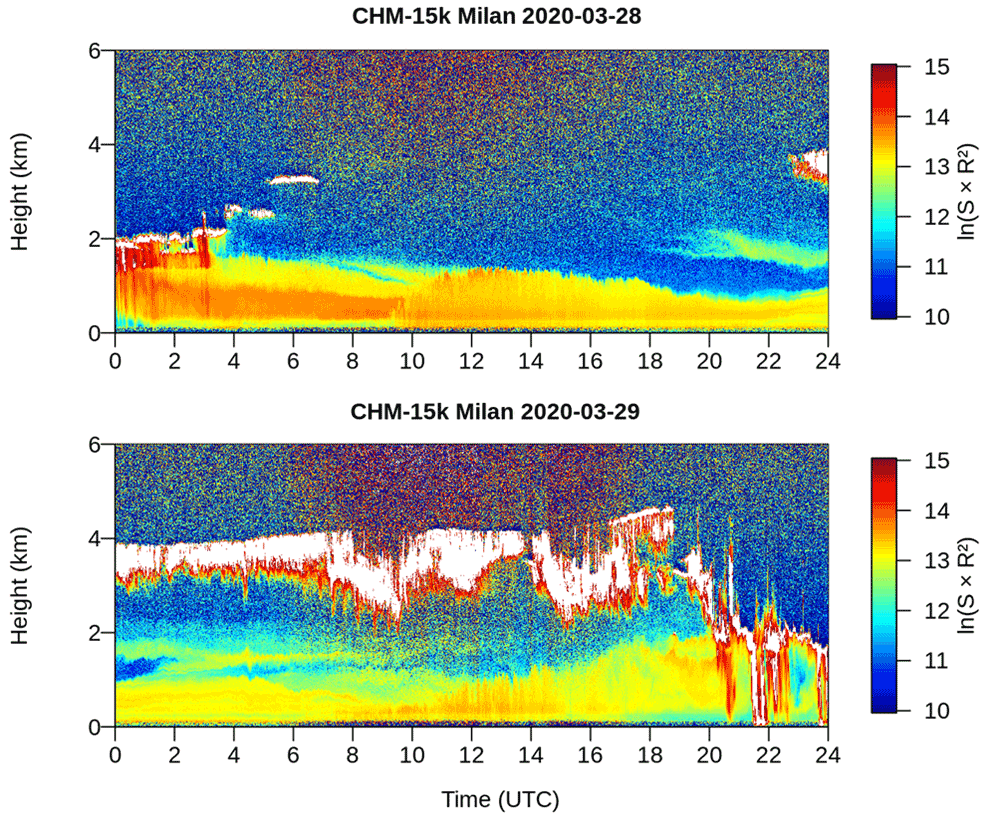
Figure 9Vertical profiling from the automated lidar ceilometer located in Milan on 28 and 29 March 2020.
Figure 9 also shows that the yellow layer was somewhat deeper during the first 3 h of 28 March than during the rest of the day; this observation likely indicates that the dust plume was capped by a cloud top early in the morning, which may have been caused by the irruption of the easterly cold front towards the Po Valley. The layer was shallower from 04:00 UTC onward. Signals of convective activity appeared between 10:00 and 15:00 UTC, as indicated by the more intense orange vertical swipes linked to the rising thermals. In the evening, the layer was even shallower due to nocturnal cooling suppressing vertical motions. In general, the thinning of the mixing layer during dust transport events, also confirmed by the analysis of the radiosounding observations from the period, was linked to the high concentrations of aerosols in the troposphere, which reduced the amount of solar radiation reaching the ground, in turn reducing sensible heat fluxes that drive the diurnal evolution of temperature and the PBL (Li et al., 2017; Pandolfi et al., 2014; Salvador et al., 2019). From 20:00 UTC onward, 2 km high clouds appeared, probably linked to the arrival of the cold front from the north-northeast, while the yellow layer rose again because of wind-induced turbulence. The following day, thermals again appeared between 08:00 and 15:00 UTC, and the signal of Arctic air masses can be observed from 20:00 UTC onward.
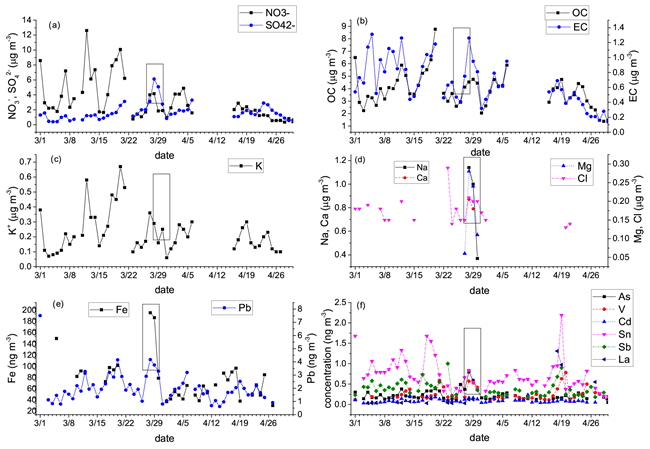
Figure 10Concentration of major components and trace elements analyzed in PM2.5 particulate samples at the Bologna Gobetti air quality station during the March–April 2020 period: (a) nitrate NO and sulfate SO; (b) carbonaceous components – organic and elemental carbon (OC and EC); (c) potassium ion (K+); (d) Na, Ca, Mg, and Cl; (e) Fe and Pb; and (f) As, V, Cd, Sn, Sb, and La. The boxes enclose the dates of the dust incursion over northern Italy. (Please note that dates are displayed using a month/day format in this figure.)
3.3.3 Chemical composition
The change in optical properties caused by the arrival of the dust plume is in agreement with the concurrent change in aerosol composition at the Bologna Gobetti station (Fig. 10). Indeed, the arrival of the dust plume from the Aralkum Desert was connected with an increase in some major particulate components (i.e., nitrate, sulfate, and elemental carbon) and in some trace elements (i.e., K, Pb, Na, Ca, Mg, and Fe). This observation points out that not only did crustal materials (Ca, Mg, and Fe) increase during the dust incursion dust, but marine particles (Na), most likely from the Adriatic Sea, and anthropogenic particles were also entrained during dust transit over the Balkans (Evangeliou et al., 2021). The entrainment of anthropogenic pollution and marine aerosols as well as the crustal material originating from the Aralkum might have been favored by the low boundary layer previously observed, an aspect which has been connected with the exacerbation of the toxicological properties of dust aerosols (Pandolfi et al., 2014). However, it cannot be excluded that the presence of salt particles and heavy metals in connection with the dust incursion is due to their presence in the dust source region, which, contrarily to Saharan dust, is not a “true desert” but a dried sea where hazardous substances have consistently accumulated for many decades (Groll et al., 2013). Conversely, the increase in crustal materials clearly indicates a typical composition of the mineral dust, which is mostly characterized by quartz, calcite, and dolomite in the source region (Groll et al., 2019), whereas typical dust aerosols from the Sahara are mostly made by illite, kaolinite, and quartz (Formenti et al., 2014).
This work presents a detailed investigation of a mineral dust event that reached northern Italy at the end of March 2020. The peculiarity of this event is mainly associated with its origin, which can be traced back to the desert region surrounding the Caspian Sea in central Asia. Its origin was confirmed by the concurrent analysis of the synoptic configuration, CAMS reanalysis data, and the calculation of back trajectories for the study period. In particular, while it is well known that southern Europe is often subjected to mineral dust incursions from the Sahara Desert, the transport of mineral dust originating in the Caspian area frequently impacts eastern Asia rather than western Europe.
The storm originated in the Aralkum Desert, which is a favorable area for such conditions since the shrinking of the lake over the last half a century. However, the peculiar meteorological situation during the second half of March, characterized by the presence of an anomalously high Z850 geopotential in a region ranging from Siberia to the Atlantic Ocean, contributed to creating a narrow corridor of flow between the Aralkum Desert and northern Italy at lower levels (the first 1.5–2 km of the atmosphere) for some consecutive days, along which and during which time the dust was transported.
Data collected from three optical particle counters (OPCs), located in two different cities, Bologna and Trieste, and at one high-altitude site, i.e., the WMO-GAW Mt. Cimone station, all in northern Italy, were used to study the event at high time resolution. The use of OPCs allowed for the accurate characterization of the size distribution of this anomalous dust as well as an understanding of its features over time.
The results demonstrated that the transport of mineral dust mainly affected the coarse fraction concentration at all three sites, particularly those with a mean diameter higher than 0.7 µm. In fact, the coarse fraction was affected by the event to the point that the PM10 concentration in Bologna was up to 2 to 3 times the WHO limit during a period in which anthropogenic emissions were strongly reduced by the lockdown imposed in Italy to combat the spread of the SARS-CoV-2 virus. In contrast, the fine fraction appeared to be negligibly affected by the central Asian mineral dust outburst, with its concentration being similar to that observed before and after the event.
Overall, these results demonstrate that a concurrent analysis of multiple meteorological information and atmospheric composition data is needed to deepen our understanding of the various physicochemical processes connected with aerosols and their interactions. These results can be extremely important for their potential climatological implications owing to the potential increases in the frequency of dust storms resulting from the combined effects of increasing temperatures, increasing drought, and soil erosion. In particular, the fact that the prevailing midlatitude westerly winds are weakening and migrating polewards as a result of anthropogenic warming, as suggested by recent works (Abell et al., 2021), might lead to changes in dust production and transport regions and to a potential increase in such dust transport events from eastern sources.
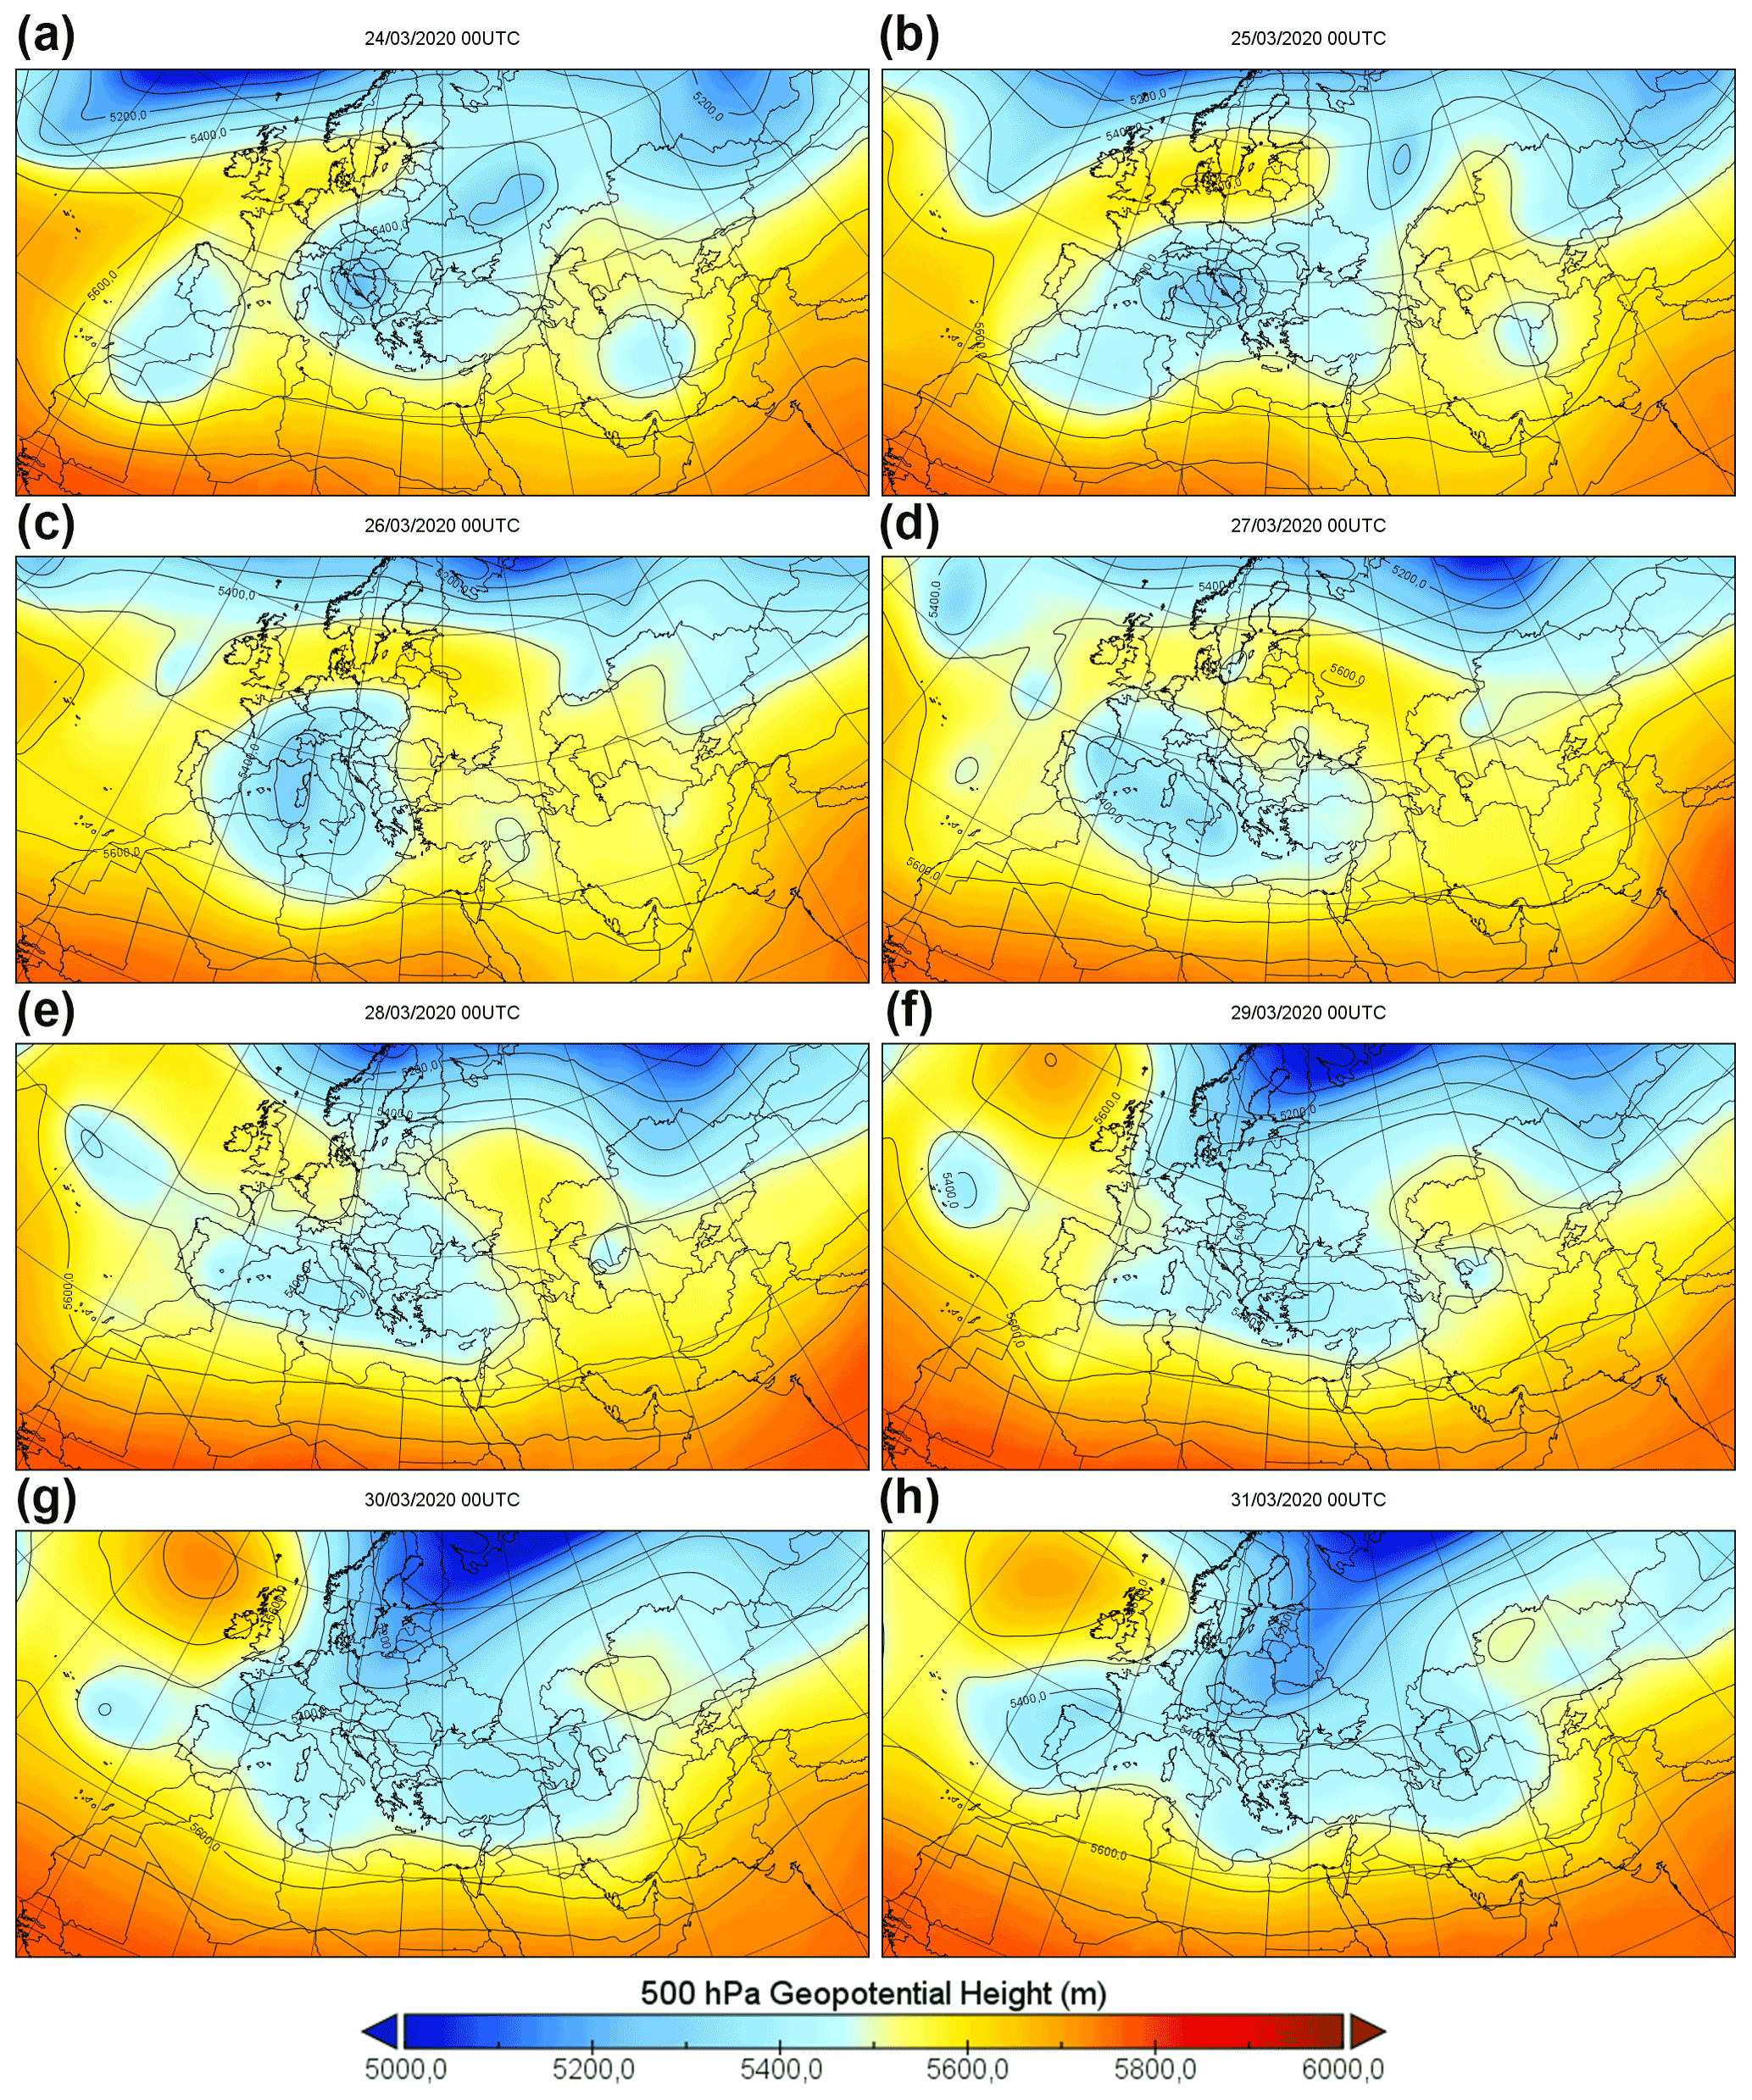
Figure A1Maps of the geopotential at 500 hPa (colors and isolines, in m2 s−2) relative to each day in the period from 24 to 31 March at 00:00 UTC (a–h). The maps were created with Panoply starting from ERA5 reanalysis. Panels (a) to (h) refer to the respective days from 24 to 31 March 2020.
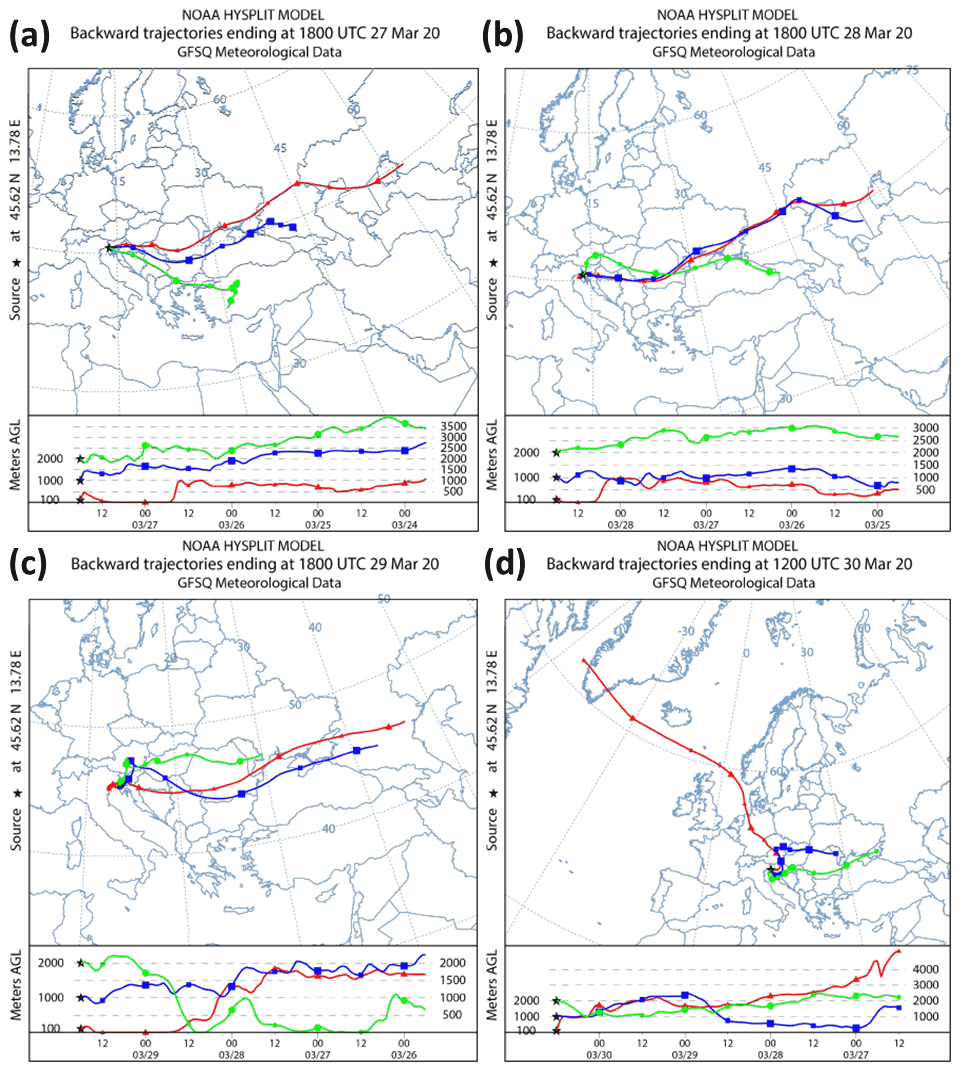
Figure A2Back trajectories (96 h backwards) ending at Trieste on (a) 27 March at 18:00 UTC, (b) 28 March at 12:00 UTC, (c) 29 March at 18:00 UTC, and (d) 30 March at 12:00 UTC.
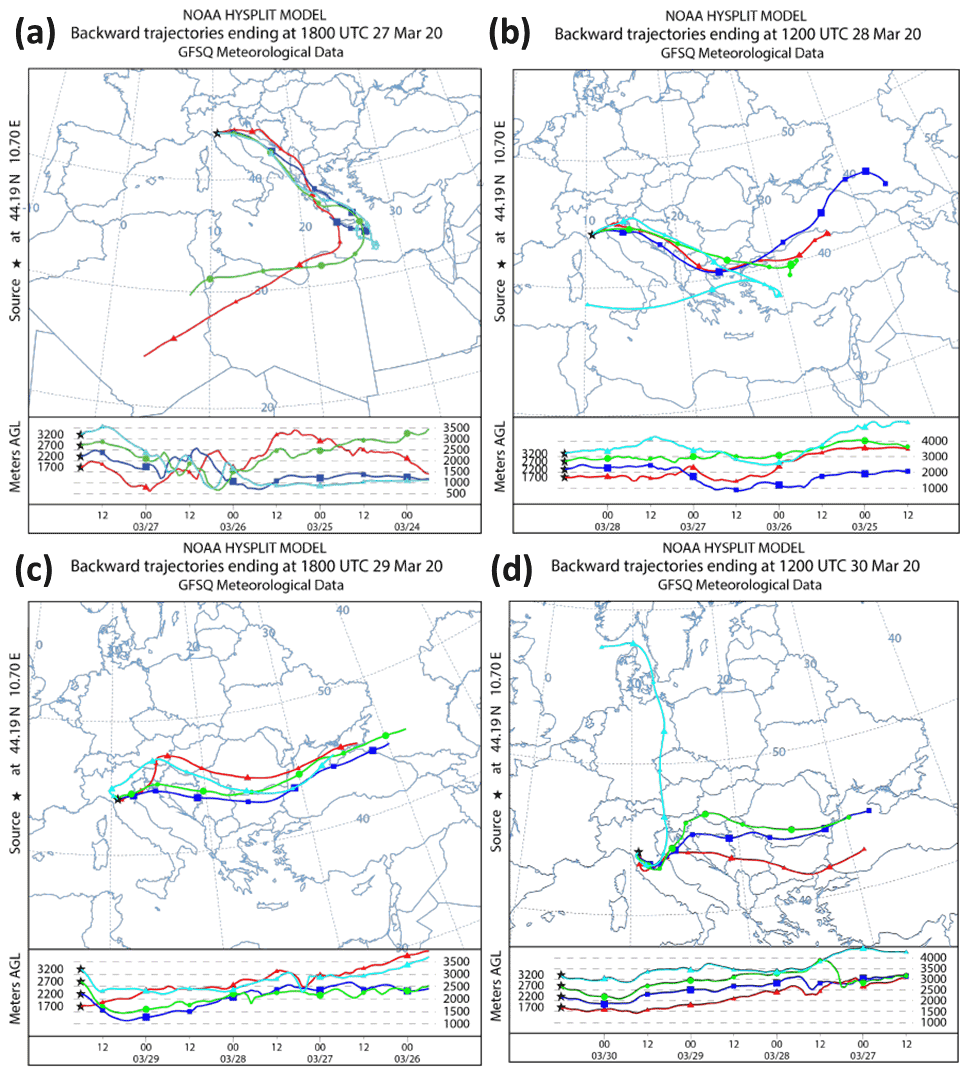
Figure A3Back trajectories (96 h backwards) ending at Mt. Cimone on (a) 27 March at 18:00 UTC, (b) 28 March at 12:00 UTC, (c) 29 March at 18:00 UTC, and (d) 30 March at 12:00 UTC.
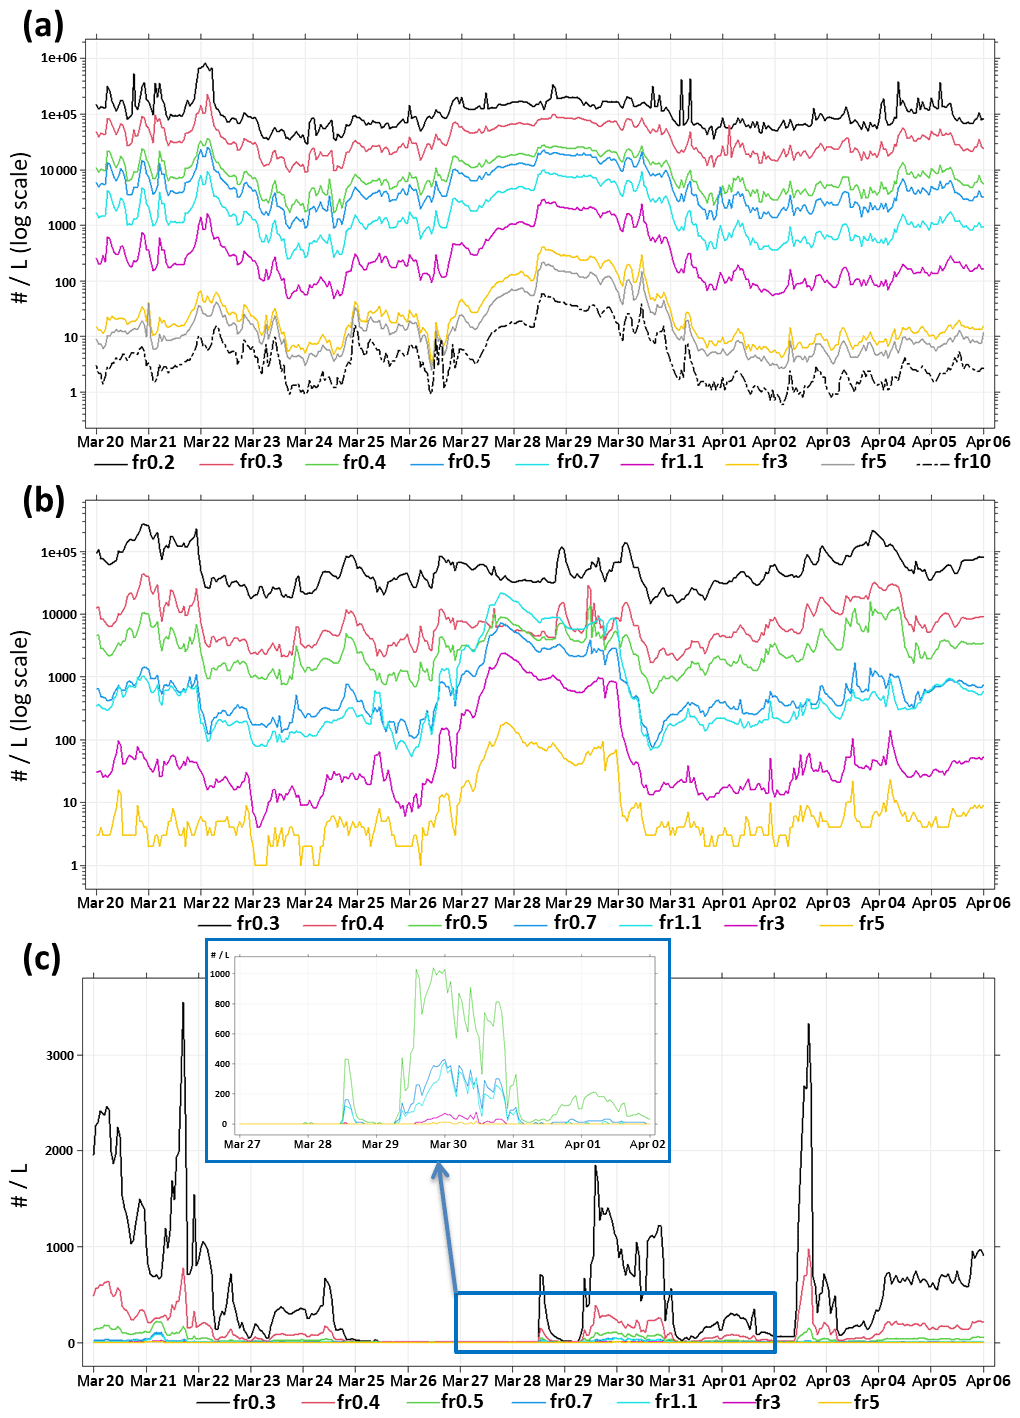
Figure A4Temporal trends in all fractions for the three OPCs: (a) LOAC (Bologna), (b) FAI (Trieste), and (c) Mt. Cimone (the blue rectangle shows a zoomed in view of the coarser fractions). For BO and TS, values are reported on a logarithmic scale. Values are in counts per cubic decimeter (no. L−1).
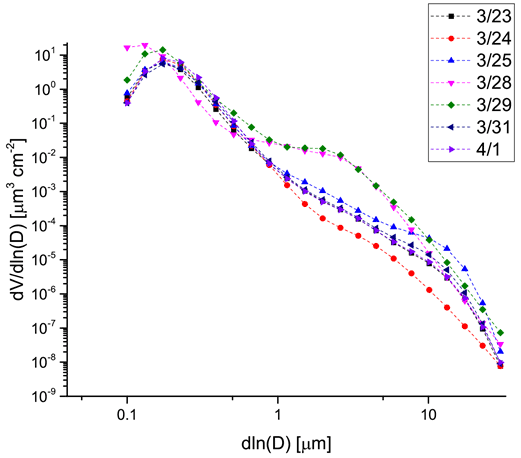
Figure A5Volumetric size distributions retrieved by the inversion algorithm on days prior to (23, 24, and 25 March), during (28 and 29 March), and after (31 March and 1 April) the arrival of the Caspian dust at the Venice AERONET site. (Please note that dates are displayed using a month/day format in this figure.)
The OPC observations and HYSPLIT back trajectories used for this investigation are available upon request from the corresponding author (laura.tositti@unibo.it). Synoptic maps are available from the wetterzentrale web archive: https://www.wetterzentrale.de/ (Müller and Floors, 2022). CAMS data are freely available from the Copernicus website at https://ads.atmosphere.copernicus.eu/ (ECMWF, 2022a) or https://atmosphere.copernicus.eu/ (ECMWF, 2022b). NASA AERONET observations are available at https://aeronet.gsfc.nasa.gov/ (NASA and PHOTONS, 2022). The lidar ceilometer images from ALICEnet are available upon request from the ALICEnet project office: alicenet@isac.cnr.it. Aerosol chemical speciation data are available from an open data portal: https://dati.arpae.it/ (ARPAE, 2022).
LT and EB designed the study. CC led the synoptic analysis. PM led calculation and analysis of HYSPLIT back trajectories. AZ, EB, and AB developed the analysis methodology and led the analysis of observational data with contributions from all co-authors. AM provided and analyzed data for the Mt. Cimone station. SDS and FP contributed to the discussion of the results. LT, EB, and AZ wrote the paper with contributions from all co-authors.
The contact author has declared that neither they nor their co-authors have any competing interests.
Publisher's note: Copernicus Publications remains neutral with regard to jurisdictional claims in published maps and institutional affiliations.
We gratefully acknowledge Marco Bellini and Fulvio Stel from the Regional Agency for Environmental Protection of Friuli Venezia Giulia Region (ARPA FVG) for providing data from the Trieste Via Pitacco and Via Del Ponticello stations. Open data of PM chemical speciation at the Bologna Gobetti sampling site were provided by the Emilia-Romagna Environmental Protection Agency (ARPAE). The authors gratefully acknowledge the NOAA Air Resources Laboratory (ARL) for the provision of the HYSPLIT transport and dispersion model and/or READY website used in this publication (https://www.ready.noaa.gov, last access: 30 November 2021). We wish to thank the NASA-GSFC AERONET team as well as the PI, Giuseppe Zibordi, and his staff for establishing and maintaining the Venice AAOT site used in this investigation. We also thank the ALICEnet (http://www.alice-net.eu) consortium for operating and maintaining the ALC network and for providing the Milan ALC data used in this publication.
This paper is published with the contribution of the Department of Excellence program financed by the Ministry of Education, University and Research (MIUR, L. 232 del 01/12/2016). This research has been supported by the CARISBO Foundation, Bologna, Italy, and the European Union Horizon 2020 Research and Innovation program (ACTRIS-2, grant no. 654109).
This paper was edited by Nikos Hatzianastassiou and reviewed by four anonymous referees.
Abell, J. T., Winckler, G., Anderson, R. F., and Herbert, T. D.: Poleward and weakened westerlies during Pliocene warmth, Nature, 589, 70–75, https://doi.org/10.1038/s41586-020-03062-1, 2021.
Adebiyi, A. A. and Kok, J. F.: Climate models miss most of the coarse dust in the atmosphere, Sci. Adv., 6, 15, https://doi.org/10.1126/sciadv.aaz9507, 2020.
Agenzia regionale per la prevenzione, l'ambiente e l'energia dell'Emilia-Romagna (ARPAE): ARPAE, Sistema nazionale di prevenzione dell'ambiente (SNPA), https://dati.arpae.it/, last access: 25 March 2022.
Bangert, M., Nenes, A., Vogel, B., Vogel, H., Barahona, D., Karydis, V. A., Kumar, P., Kottmeier, C., and Blahak, U.: Saharan dust event impacts on cloud formation and radiation over Western Europe, Atmos. Chem. Phys., 12, 4045–4063, https://doi.org/10.5194/acp-12-4045-2012, 2012.
Barkan, J. and Alpert, P.: Synoptic analysis of a rare event of Saharan dust reaching the Arctic region, Weather, 65, 208–211, https://doi.org/10.1002/wea.503, 2010.
Barnaba, F., Bolignano, A., Di Liberto, L., Morelli, M., Lucarelli, F., Nava, S., Perrino, C., Canepari, S., Basart, S., Costabile, F., Dionisi, D., Ciampichetti, S., Sozzi, R., and Gobbi, G. P.: Desert dust contribution to PM10 loads in Italy: Methods and recommendations addressing the relevant European Commission Guidelines in support to the Air Quality Directive 2008/50, Atmos. Environ., 161, 288–305, https://doi.org/10.1016/j.atmosenv.2017.04.038, 2017.
Battison, G. A., Degetto, S., Gerbasi, R., Sbrignadello, G., and Tositti, L.: Fallout distribution in Padua and Northeast Italy after the chernobyl nuclear reactor accident, J. Environ. Radioact., 8, 183–191, https://doi.org/10.1016/0265-931X(88)90025-2, 1988.
Behzod, G., Su-Chin, C., and Dilmurod, G.: Changes in water volume of the Aral Sea after 1960, Appl. Water Sci., 2, 285–291, https://doi.org/10.1007/s13201-012-0048-z, 2012.
Belosi, F., Conte, M., Gianelle, V., Santachiara, G., and Contini, D.: On the concentration of SARS-CoV-2 in outdoor air and the interaction with pre-existing atmospheric particles, Environ. Res., 193, 110603, https://doi.org/10.1016/j.envres.2020.110603, 2021.
Boselli, A., Sannino, A., D'Emilio, M., Wang, X., and Amoruso, S.: Aerosol Characterization during the Summer 2017 Huge Fire Event on Mount Vesuvius (Italy) by Remote Sensing and In Situ Observations, Remote Sens., 13, 2001, https://doi.org/10.3390/RS13102001, 2021.
Brattich, E., Riccio, A., Tositti, L., Cristofanelli, P., and Bonasoni, P.: An outstanding Saharan dust event at Mt. Cimone (2165 m a.s.l., Italy) in March 2004, Atmos. Environ., 113, 223–235, https://doi.org/10.1016/j.atmosenv.2015.05.017, 2015a.
Brattich, E., Hernández-Ceballos, M. A., Cinelli, G., and Tositti, L.: Analysis of 210Pb peak values at Mt. Cimone (1998–2011), Atmos. Environ., 112, 136–147, https://doi.org/10.1016/j.atmosenv.2015.04.020, 2015b.
Brattich, E., Serrano Castillo, E., Giulietti, F., Renard, J.-B., Tripathi, S. N., Ghosh, K., Berthet, G., Vignelles, D., and Tositti, L.: Measurements of aerosols and charged particles on the BEXUS18 stratospheric balloon, Ann. Geophys., 37, 389–403, https://doi.org/10.5194/angeo-37-389-2019, 2019.
Brattich, E., Orza, J. A. G., Cristofanelli, P., Bonasoni, P., Marinoni, A., and Tositti, L.: Advection pathways at the Mt. Cimone WMO-GAW station: Seasonality, trends, and influence on atmospheric composition, Atmos. Environ., 234, 117513, https://doi.org/10.1016/j.atmosenv.2020.117513, 2020a.
Brattich, E., Bracci, A., Zappi, A., Morozzi, P., Sabatino, S. Di, Porcù, F., Di Nicola, F., and Tositti, L.: How to get the best from low-cost particulate matter sensors: Guidelines and practical recommendations, Sensors, 20, 1–33, https://doi.org/10.3390/s20113073, 2020b.
Breckle, S.-W. and Wucherer, W.: The Aralkum, a Man-Made Desert on the Desiccated Floor of the Aral Sea (Central Asia), edited by: Dimeyeva, L. A. and Ogar, N. P., Springer, ISBN 978-3-642-21117-1, 2012.
Brunetti, M. and Kutiel, H.: The relevance of the North-Sea Caspian Pattern (NCP) in explaining temperature variability in Europe and the Mediterranean, Nat. Hazards Earth Syst. Sci., 11, 2881–2888, https://doi.org/10.5194/nhess-11-2881-2011, 2011.
Bulot, F. M. J., Johnston, S. J., Basford, P. J., Easton, N. H. C., Apetroaie-Cristea, M., Foster, G. L., Morris, A. K. R., Cox, S. J., and Loxham, M.: Long-term field comparison of multiple low-cost particulate matter sensors in an outdoor urban environment, Sci. Rep., 9, 7497, https://doi.org/10.1038/s41598-019-43716-3, 2019.
Calidonna, C. R., Avolio, E., Gullì, D., Ammoscato, I., De Pino, M., Donateo, A., and Feudo, T. Lo: Five years of dust episodes at the Southern Italy GAW regional coastal mediterranean observatory: Multisensors and modeling analysis, Atmosphere, 11, 456, https://doi.org/10.3390/ATMOS11050456, 2020.
CAMS: CAMS documentation Webpage, https://confluence.ecmwf.int/display/CKB/CAMS+Regional:+European+air+quality+analysis+and+forecast+data+documentation (last access: 10 May 2021), 2015.
Carslaw, D. C. and Beevers, S. D.: Characterising and understanding emission sources using bivariate polar plots and k-means clustering, Environ. Model. Softw., 40, 325–329, https://doi.org/10.1016/j.envsoft.2012.09.005, 2013.
Carslaw, D. C. and Ropkins, K.: Openair – An r package for air quality data analysis, Environ. Model. Softw., 27–28, 52–61, https://doi.org/10.1016/j.envsoft.2011.09.008, 2012.
Chauhan, A. and Singh, R. P.: Decline in PM2.5 concentrations over major cities around the world associated with COVID-19, Environ. Res., 187, 109634, https://doi.org/10.1016/j.envres.2020.109634, 2020.
Crilley, L. R., Shaw, M., Pound, R., Kramer, L. J., Price, R., Young, S., Lewis, A. C., and Pope, F. D.: Evaluation of a low-cost optical particle counter (Alphasense OPC-N2) for ambient air monitoring, Atmos. Meas. Tech., 11, 709–720, https://doi.org/10.5194/amt-11-709-2018, 2018.
Denjean, C., Cassola, F., Mazzino, A., Triquet, S., Chevaillier, S., Grand, N., Bourrianne, T., Momboisse, G., Sellegri, K., Schwarzenbock, A., Freney, E., Mallet, M., and Formenti, P.: Size distribution and optical properties of mineral dust aerosols transported in the western Mediterranean, Atmos. Chem. Phys., 16, 1081–1104, https://doi.org/10.5194/acp-16-1081-2016, 2016.
Diémoz, H., Barnaba, F., Magri, T., Pession, G., Dionisi, D., Pittavino, S., Tombolato, I. K. F., Campanelli, M., Della Ceca, L. S., Hervo, M., Di Liberto, L., Ferrero, L., and Gobbi, G. P.: Transport of Po Valley aerosol pollution to the northwestern Alps – Part 1: Phenomenology, Atmos. Chem. Phys., 19, 3065–3095, https://doi.org/10.5194/acp-19-3065-2019, 2019.
Dimitriou, K. and Kassomenos, P.: Indicators reflecting local and transboundary sources of PM2.5 and PMCOARSE in Rome – impacts in air quality, Atmos. Environ., 96, 154–162, https://doi.org/10.1016/j.atmosenv.2014.07.029, 2014.
Dinoi, A., Donateo, A., Conte, M., Conte, M., and Belosi, F.: Comparison of atmospheric particle concentration measurements using different optical detectors: Potentiality and limits for air quality applications, Meas. J. Int. Meas. Confed., 106, 274–282, https://doi.org/10.1016/j.measurement.2016.02.019, 2017.
Dionisi, D., Barnaba, F., Diémoz, H., Di Liberto, L., and Gobbi, G. P.: A multiwavelength numerical model in support of quantitative retrievals of aerosol properties from automated lidar ceilometers and test applications for AOT and PM10 estimation, Atmos. Meas. Tech., 11, 6013–6042, https://doi.org/10.5194/amt-11-6013-2018, 2018.
Domínguez-Rodríguez, A., Báez-Ferrer, N., Abreu-González, P., Rodríguez, S., Díaz, R., Avanzas, P., and Hernández-Vaquero, D.: Impact of Desert Dust Events on the Cardiovascular Disease: A Systematic Review and Meta-Analysis, J. Clin. Med., 10, 727, https://doi.org/10.3390/jcm10040727, 2021.
Donzelli, G., Cioni, L., Cancellieri, M., Morales, A. L., and Suárez-Varela, M. M. M.: The Effect of the Covid-19 Lockdown on Air Quality in Three Italian Medium-Sized Cities, Atmos., 11, 1118, https://doi.org/10.3390/ATMOS11101118, 2020.
Duchi, R., Cristofanelli, P., Landi, T. C., Arduini, J., Bonafe, U., Bourcier, L., Busetto, M., Calzolari, F., Marinoni, A., Putero, D., and Bonasoni, P.: Long-term (2002–2012) investigation of Saharan dust transport events at Mt. Cimone GAW global station, Italy (2165 m a.s.l.), Elementa, 2016, 000085, https://doi.org/10.12952/journal.elementa.000085, 2016.
European Centre for Medium-Range Weather Forecasts (ECMWF): Copernicus Atmosphere Monitoring Service (CAMS), ECMWF, https://ads.atmosphere.copernicus.eu/, last access: 25 March 2022a.
European Centre for Medium-Range Weather Forecasts (ECMWF): Copernicus Atmosphere Monitoring Service (CAMS), ECMWF, https://atmosphere.copernicus.eu/, last access: 25 March 2022b.
European Parliament: Directive 2008/50/EC of the European Parliament and of the Council of 21 May 2008 on Ambient Air Quality and Cleaner Air for Europe, European Commission, Brussels, Belgium, http://eur-lex.europa.eu/legal-content/EN/TXT/PDF/?uri=CELEX:32008L0050&from=EN (last access: 30 November 2021), 2008.
Evangeliou, N., Platt, S. M., Eckhardt, S., Lund Myhre, C., Laj, P., Alados-Arboledas, L., Backman, J., Brem, B. T., Fiebig, M., Flentje, H., Marinoni, A., Pandolfi, M., Yus-Dìez, J., Prats, N., Putaud, J. P., Sellegri, K., Sorribas, M., Eleftheriadis, K., Vratolis, S., Wiedensohler, A., and Stohl, A.: Changes in black carbon emissions over Europe due to COVID-19 lockdowns, Atmos. Chem. Phys., 21, 2675–2692, https://doi.org/10.5194/acp-21-2675-2021, 2021.
Ferrero, L., Gregorič, A., Močnik, G., Rigler, M., Cogliati, S., Barnaba, F., Di Liberto, L., Gobbi, G. P., Losi, N., and Bolzacchini, E.: The impact of cloudiness and cloud type on the atmospheric heating rate of black and brown carbon in the Po Valley, Atmos. Chem. Phys., 21, 4869–4897, https://doi.org/10.5194/acp-21-4869-2021, 2021.
Fleming, Z. L., Monks, P. S., and Manning, A. J.: Review: Untangling the influence of air-mass history in interpreting observed atmospheric composition, Atmos. Res., 104–105, 1–39, https://doi.org/10.1016/j.atmosres.2011.09.009, 2012.
Formenti, P., Caquineau, S., Desboeufs, K., Klaver, A., Chevaillier, S., Journet, E., and Rajot, J. L.: Mapping the physico-chemical properties of mineral dust in western Africa: mineralogical composition, Atmos. Chem. Phys., 14, 10663–10686, https://doi.org/10.5194/acp-14-10663-2014, 2014.
Fubini, B. and Fenoglio, I.: Toxic potential of mineral dusts, Elements, 3, 407–414, https://doi.org/10.2113/GSELEMENTS.3.6.407, 2007.
García-Pando, C. P., Stanton, M. C., Diggle, P. J., Trzaska, S., Miller, R. L., Perlwitz, J. P., Baldasano, J. M., Cuevas, E., Ceccato, P., Yaka, P., and Thomson, M. C.: Soil dust aerosols and wind as predictors of seasonal meningitis incidence in niger, Environ. Health Perspect., 122, 679–686, https://doi.org/10.1289/ehp.1306640, 2014.
Gholamzade Ledari, D., Hamidi, M., and Shao, Y.: Evaluation of the 13 April 2011 frontal dust storm in west Asia, Aeolian Res., 44, 100592, https://doi.org/10.1016/j.aeolia.2020.100592, 2020.
Gobbi, G. P., Barnaba, F., Di Liberto, L., Bolignano, A., Lucarelli, F., Nava, S., Perrino, C., Pietrodangelo, A., Basart, S., Costabile, F., Dionisi, D., Rizza, U., Canepari, S., Sozzi, R., Morelli, M., Manigrasso, M., Drewnick, F., Struckmeier, C., Poenitz, K., and Wille, H.: An inclusive view of Saharan dust advections to Italy and the Central Mediterranean, Atmos. Environ., 201, 242–256, https://doi.org/10.1016/j.atmosenv.2019.01.002, 2019.
Grange, S. K.: Technical note: saqgetr R package (Version 0.1), R developper organization, CRAN, https://drive.google.com/file/d/1IgDODHqBHewCTKLdAAxRyR7ml8ht6Ods/view (last access: 30 November 2021), 2019.
Groll, M., Opp, C., and Aslanov, I.: Spatial and temporal distribution of the dust deposition in Central Asia – results from a long term monitoring program, Aeolian Res., 9, 49–62, https://doi.org/10.1016/J.AEOLIA.2012.08.002, 2013.
Groll, M., Opp, C., Issanova, G., Vereshagina, N., and Semenov, O.: Physical and Chemical Characterization of Dust Deposited in the Turan Lowland (Central Asia), E3S Web Conf., 99, 03005, https://doi.org/10.1051/E3SCONF/20199903005, 2019.
Hamidianpour, M., Jahanshahi, S. M. A., Kaskaoutis, D. G., Rashki, A., and Nastos, P. G.: Climatology of the Sistan Levar wind: Atmospheric dynamics driving its onset, duration and withdrawal, Atmos. Res., 260, 105711, https://doi.org/10.1016/J.ATMOSRES.2021.105711, 2021.
Intergovernmental Panel on Climate Change: Climate Change 2013 – The Physical Science Basis: Working Group I Contribution to the Fifth Assessment Report of the Intergovernmental Panel on Climate Change, Cambridge University Press, Cambridge, https://doi.org/10.1017/CBO9781107415324, 2014.
Jorba, O., Pérez, C., Rocadenbosch, F., and Baldasano, J. M.: Cluster analysis of 4-day back trajectories arriving in the Barcelona area, Spain, from 1997 to 2002, J. Appl. Meteorol., 43, 887–901, https://doi.org/10.1175/1520-0450(2004)043<0887:CAODBT>2.0.CO;2, 2004.
Kaskaoutis, D. G., Houssos, E. E., Rashki, A., Francois, P., Legrand, M., Goto, D., Bartzokas, A., Kambezidis, H. D., and Takemura, T.: The Caspian Sea–Hindu Kush Index (CasHKI): A regulatory factor for dust activity over southwest Asia, Glob. Planet. Change, 137, 10–23, https://doi.org/10.1016/J.GLOPLACHA.2015.12.011, 2016.
Kaskaoutis, D. G., Houssos, E. E., Minvielle, F., Rashki, A., Chiapello, I., Dumka, U. C., and Legrand, M.: Long-term variability and trends in the Caspian Sea – Hindu Kush Index: Influence on atmospheric circulation patterns, temperature and rainfall over the Middle East and Southwest Asia, Glob. Planet. Change, 169, 16–33, https://doi.org/10.1016/j.gloplacha.2018.07.004, 2018.
Kaskaoutis, D. G., Dumka, U. C., Rashki, A., Psiloglou, B. E., Gavriil, A., Mofidi, A., Petrinoli, K., Karagiannis, D., and Kambezidis, H. D.: Analysis of intense dust storms over the eastern Mediterranean in March 2018: Impact on radiative forcing and Athens air quality, Atmos. Environ., 209, 23–39, https://doi.org/10.1016/J.ATMOSENV.2019.04.025, 2019.
Keil, D. E., Buck, B., Goossens, D., Teng, Y., Pollard, J., McLaurin, B., Gerads, R., and DeWitt, J.: Health effects from exposure to atmospheric mineral dust near Las Vegas, NV, USA, Toxicol. Reports, 3, 785–795, https://doi.org/10.1016/j.toxrep.2016.09.009, 2016.
Kim, S., Park, S., and Lee, J.: Evaluation of performance of inexpensive laser based PM2.5 sensor monitors for typical indoor and outdoor hotspots of South Korea, Appl. Sci., 9, 1947, https://doi.org/10.3390/app9091947, 2019.
Knippertz, P. and Stuut, J. B. W.: Mineral dust: A key player in the earth system, Springer, ISBN 978-94-017-8978-3, 2014.
Kurniawati, S., Santoso, M., Lestiani, D. D., Atmodjo, D. P. D., Sari, D. K., and Kusmartini, I.: Identification of Potential Source Location of Sulfur at Urban Area Bandung using Conditional Probability Function (CPF), IOP Conf. Ser. Earth Environ. Sci., 303, 012042, https://doi.org/10.1088/1755-1315/303/1/012042, 2019.
Kutiel, H. and Benaroch, Y.: North Sea-Caspian Pattern (NCP) – an upper level atmospheric teleconnection affecting the Eastern Mediterranean: Identification and definition, Theor. Appl. Climatol., 71, 17–28, https://doi.org/10.1007/S704-002-8205-X, 2002.
Labban, A. H., Mashat, A. W. S., and Awad, A. M.: The variability of the Siberian high ridge over the Middle East, Int. J. Climatol., 41, 104–130, https://doi.org/10.1002/JOC.6611, 2021.
Li, Y., Song, Y., Kaskaoutis, D. G., Chen, X., Mamadjanov, Y., and Tan, L.: Atmospheric dust dynamics in southern Central Asia: Implications for buildup of Tajikistan loess sediments, Atmos. Res., 229, 74–85, https://doi.org/10.1016/J.ATMOSRES.2019.06.013, 2019.
Li, Y., Song, Y., Kaskaoutis, D. G., Zan, J., Orozbaev, R., Tan, L., and Chen, X.: Aeolian dust dynamics in the Fergana Valley, Central Asia, since ∼ 30 ka inferred from loess deposits, Geosci. Front., 12, 101180, https://doi.org/10.1016/J.GSF.2021.101180, 2021.
Li, Z., Guo, J., Ding, A., Liao, H., Liu, J., Sun, Y., Wang, T., Xue, H., Zhang, H., and Zhu, B.: Aerosol and boundary-layer interactions and impact on air quality, Natl. Sci. Rev., 4, 810–833, https://doi.org/10.1093/nsr/nwx117, 2017.
Loodin, N.: Aral Sea: an environmental disaster in twentieth century in Central Asia, Model. Earth Syst. Environ., 6, 2495–2503, https://doi.org/10.1007/s40808-020-00837-3, 2020.
Mahovic, N. S., Prieto, J., Jericevic, A., Gasparac, G., and Smiljanic, I.: EUMETSAT Webpage, https://www.eumetsat.int/aralkum-desert-dust-pollutes-air-south-east-europe (last access: 26 April 2021), 2020.
Mallios, S. A., Drakaki, E., and Amiridis, V.: Effects of dust particle sphericity and orientation on their gravitational settling in the earth's atmosphere, J. Aerosol Sci., 150, 105634, https://doi.org/10.1016/J.JAEROSCI.2020.105634, 2020.
Malpede, M. and Percoco, M.: Lockdown measures and air quality: evidence from Italian provinces, Lett. Spat. Resour. Sci., 14, 101–110, https://doi.org/10.1007/S12076-021-00267-4, 2021.
Manney, G. L., Livesey, N. J., Santee, M. L., Froidevaux, L., Lambert, A., Lawrence, Z. D., Millán, L. F., Neu, J. L., Read, W. G., Schwartz, M. J., and Fuller, R. A.: Record-Low Arctic Stratospheric Ozone in 2020: MLS Observations of Chemical Processes and Comparisons With Previous Extreme Winters, Geophys. Res. Lett., 47, e2020GL089063, https://doi.org/10.1029/2020GL089063, 2020.
Marécal, V., Peuch, V.-H., Andersson, C., Andersson, S., Arteta, J., Beekmann, M., Benedictow, A., Bergström, R., Bessagnet, B., Cansado, A., Chéroux, F., Colette, A., Coman, A., Curier, R. L., Denier van der Gon, H. A. C., Drouin, A., Elbern, H., Emili, E., Engelen, R. J., Eskes, H. J., Foret, G., Friese, E., Gauss, M., Giannaros, C., Guth, J., Joly, M., Jaumouillé, E., Josse, B., Kadygrov, N., Kaiser, J. W., Krajsek, K., Kuenen, J., Kumar, U., Liora, N., Lopez, E., Malherbe, L., Martinez, I., Melas, D., Meleux, F., Menut, L., Moinat, P., Morales, T., Parmentier, J., Piacentini, A., Plu, M., Poupkou, A., Queguiner, S., Robertson, L., Rouïl, L., Schaap, M., Segers, A., Sofiev, M., Tarasson, L., Thomas, M., Timmermans, R., Valdebenito, Á., van Velthoven, P., van Versendaal, R., Vira, J., and Ung, A.: A regional air quality forecasting system over Europe: the MACC-II daily ensemble production, Geosci. Model Dev., 8, 2777–2813, https://doi.org/10.5194/gmd-8-2777-2015, 2015.
Marinoni, A., Cristofanelli, P., Calzolari, F., Roccato, F., Bonafè, U., and Bonasoni, P.: Continuous measurements of aerosol physical parameters at the Mt. Cimone GAW Station (2165 m a.s.l., Italy), Sci. Total Environ., 391, 241–251, https://doi.org/10.1016/j.scitotenv.2007.10.004, 2008.
Masic, A., Bibic, D., Pikula, B., Blazevic, A., Huremovic, J., and Zero, S.: Evaluation of optical particulate matter sensors under realistic conditions of strong and mild urban pollution, Atmos. Meas. Tech., 13, 6427–6443, https://doi.org/10.5194/amt-13-6427-2020, 2020.
Mie, G.: Beiträge zur Optik trüber Medien, speziell kolloidaler Metallösungen, Ann. Phys., 330, 377–445, https://doi.org/10.1002/andp.19083300302, 1908.
Müller, G. and Floors, R.: Wetterzentrale, https://www.wetterzentrale.de/, last access: 25 March 2022.
NASA: AERONET Inversion Products, Weather, 1–6, https://aeronet.gsfc.nasa.gov/new_web/Documents/Inversion_products_V2.pdf (last access: 30 November 2021), 2006.
NASA and PHOTONS (PHOtométrie pour le Traitement Opérationnel de Normalisation Satellitaire): AERONET (AErosol RObotic NETwork), NASA, https://aeronet.gsfc.nasa.gov/, last access: 25 March 2022.
National Centers for Environmental Prediction/National Weather Service/NOAA/US Department of Commerce: NCEP GFS 0.25 Degree Global Forecast Grids Historical Archive, National Centers for Environmental Prediction/National Weather Service/NOAA/US Department of Commerce, https://doi.org/10.5065/D65D8PWK, 2015.
O'Neill, N. T., Eck, T. F., Smirnov, A., Holben, B. N., and Thulasiraman, S.: Spectral discrimination of coarse and fine mode optical depth, J. Geophys. Res.-Atmos., 108, 4559, https://doi.org/10.1029/2002JD002975, 2003.
Okin, G. S., Mahowald, N., Chadwick, O. A., and Artaxo, P.: Impact of desert dust on the biogeochemistry of phosphorus in terrestrial ecosystems, Global Biogeochem. Cy., 18, GB2005, https://doi.org/10.1029/2003GB002145, 2004.
Pandolfi, M., Tobias, A., Alastuey, A., Sunyer, J., Schwartz, J., Lorente, J., Pey, J., and Querol, X.: Effect of atmospheric mixing layer depth variations on urban air quality and daily mortality during Saharan dust outbreaks, Sci. Total Environ., 494–495, 283–289, https://doi.org/10.1016/j.scitotenv.2014.07.004, 2014.
Perrino, C., Catrambone, M., Dalla Torre, S., Rantica, E., Sargolini, T., and Canepari, S.: Seasonal variations in the chemical composition of particulate matter: a case study in the Po Valley. Part I: macro-components and mass closure, Environ. Sci. Pollut. Res. Int., 21, 3999–4009, https://doi.org/10.1007/S11356-013-2067-1, 2014.
Prather, K. A., Wang, C. C., and Schooley, R. T.: Reducing transmission of SARS-CoV-2: Masks and testing are necessary to combat asymptomatic spread in aerosols and droplets, Science, 368, 1422–1424, https://doi.org/10.1126/science.abc6197, 2020.
Prospero, J. M., Ginoux, P., Torres, O., Nicholson, S. E., and Gill, T. E.: Environmental characterization of global sources of atmospheric soil dust identified with the Nimbus 7 Total Ozone Mapping Spectrometer (TOMS) absorbing aerosol product, Rev. Geophys., 40, 2-1–2-31, https://doi.org/10.1029/2000RG000095, 2002.
Rashki, A., Kaskaoutis, D. G., and Sepehr, A.: Statistical evaluation of the dust events at selected stations in Southwest Asia: From the Caspian Sea to the Arabian Sea, Catena, 165, 590–603, https://doi.org/10.1016/j.catena.2018.03.011, 2018.
R Core Team: R: A language and environment for statistical computing, R Foundation for Statistical Computing, Vienna, Austria, https://www.R-project.org/ (last access: 4 February 2022), 2021.
Renard, J.-B., Dulac, F., Berthet, G., Lurton, T., Vignelles, D., Jégou, F., Tonnelier, T., Jeannot, M., Couté, B., Akiki, R., Verdier, N., Mallet, M., Gensdarmes, F., Charpentier, P., Mesmin, S., Duverger, V., Dupont, J.-C., Elias, T., Crenn, V., Sciare, J., Zieger, P., Salter, M., Roberts, T., Giacomoni, J., Gobbi, M., Hamonou, E., Olafsson, H., Dagsson-Waldhauserova, P., Camy-Peyret, C., Mazel, C., Décamps, T., Piringer, M., Surcin, J., and Daugeron, D.: LOAC: a small aerosol optical counter/sizer for ground-based and balloon measurements of the size distribution and nature of atmospheric particles – Part 1: Principle of measurements and instrument evaluation, Atmos. Meas. Tech., 9, 1721–1742, https://doi.org/10.5194/amt-9-1721-2016, 2016a.
Renard, J.-B., Dulac, F., Berthet, G., Lurton, T., Vignelles, D., Jégou, F., Tonnelier, T., Jeannot, M., Couté, B., Akiki, R., Verdier, N., Mallet, M., Gensdarmes, F., Charpentier, P., Mesmin, S., Duverger, V., Dupont, J.-C., Elias, T., Crenn, V., Sciare, J., Zieger, P., Salter, M., Roberts, T., Giacomoni, J., Gobbi, M., Hamonou, E., Olafsson, H., Dagsson-Waldhauserova, P., Camy-Peyret, C., Mazel, C., Décamps, T., Piringer, M., Surcin, J., and Daugeron, D.: LOAC: a small aerosol optical counter/sizer for ground-based and balloon measurements of the size distribution and nature of atmospheric particles – Part 2: First results from balloon and unmanned aerial vehicle flights, Atmos. Meas. Tech., 9, 3673–3686, https://doi.org/10.5194/amt-9-3673-2016, 2016b.
Rolph, G., Stein, A., and Stunder, B.: Real-time Environmental Applications and Display sYstem: READY, Environ. Model. Softw., 95, 210–228, https://doi.org/10.1016/j.envsoft.2017.06.025, 2017.
Romano, S. and Perrone, M. R.: Impact of desert dust events on short- and long-wave radiation at the surface over south-eastern Italy, Arab. J. Geosci., 9, 1–11, https://doi.org/10.1007/S12517-015-2204-X, 2016.
Sajani, S. Z., Miglio, R., Bonasoni, P., Cristofanelli, P., Marinoni, A., Sartini, C., Goldoni, C. A., De Girolamo, G., and Lauriola, P.: Saharan dust and daily mortality in Emilia-Romagna (Italy), Occup. Environ. Med., 68, 446–451, https://doi.org/10.1136/oem.2010.058156, 2011.
Sajani, S. Z., Bonasoni, P., Cristofanelli, P., Marinoni, A., and Lauriola, P.: Only coarse particles from the sahara?, Epidemiology, 23, 642–643, https://doi.org/10.1097/EDE.0b013e318258c23f, 2012.
Salvador, P., Molero, F., Fernandez, A. J., Tobías, A., Pandolfi, M., Gómez-Moreno, F. J., Barreiro, M., Pérez, N., Marco, I. M., Revuelta, M. A., Querol, X., and Artíñano, B.: Synergistic effect of the occurrence of African dust outbreaks on atmospheric pollutant levels in the Madrid metropolitan area, Atmos. Res., 226, 208–218, https://doi.org/10.1016/j.atmosres.2019.04.025, 2019.
Schepanski, K.: Transport of mineral dust and its impact on climate, Geosci., 8, 151, https://doi.org/10.3390/geosciences8050151, 2018.
Sharma, A., Huang, H. P., Zavialov, P., and Khan, V.: Impact of Desiccation of Aral Sea on the Regional Climate of Central Asia Using WRF Model, Pure Appl. Geophys., 175, 465–478, https://doi.org/10.1007/s00024-017-1675-y, 2018.
Shen, H., Abuduwaili, J., Samat, A., and Ma, L.: A review on the research of modern aeolian dust in Central Asia, Arab. J. Geosci., 9, 625, https://doi.org/10.1007/s12517-016-2646-9, 2016.
Shi, W., Wang, M., and Guo, W.: Long-term hydrological changes of the Aral Sea observed by satellites, J. Geophys. Res.-Oceans, 119, 3313–3326, https://doi.org/10.1002/2014JC009988, 2014.
Šikoparija, B.: Desert dust has a notable impact on aerobiological measurements in Europe, Aeolian Res., 47, 100636, https://doi.org/10.1016/j.aeolia.2020.100636, 2020.
SNPA: Sistema Nazionale Protezione Ambiente (SNPA) Webpage, https://www.snpambiente.it/2020/03/31/polveri-dal-mar-caspio-allitalia/ (last access: 26 April 2021), 2020.
Soupiona, O., Papayannis, A., Kokkalis, P., Foskinis, R., Sánchez Hernández, G., Ortiz-Amezcua, P., Mylonaki, M., Papanikolaou, C.-A., Papagiannopoulos, N., Samaras, S., Groß, S., Mamouri, R.-E., Alados-Arboledas, L., Amodeo, A., and Psiloglou, B.: EARLINET observations of Saharan dust intrusions over the northern Mediterranean region (2014–2017): properties and impact on radiative forcing, Atmos. Chem. Phys., 20, 15147–15166, https://doi.org/10.5194/acp-20-15147-2020, 2020.
Stafoggia, M., Zauli-Sajani, S., Pey, J., Samoli, E., Alessandrini, E., Basagaña, X., Cernigliaro, A., Chiusolo, M., Demaria, M., Díaz, J., Faustini, A., Katsouyanni, K., Kelessis, A., Linares, C., Marchesi, S., Medina, S., Pandolfi, P., Pérez, N., Querol, X., Randi, G., Ranzi, A., Tobias, A., Forastiere, F., Angelini, P., Berti, G., Bisanti, L., Cadum, E., Catrambone, M., Davoli, M., de Donato, F., Gandini, M., Grosa, M., Ferrari, S., Pelosini, R., Perrino, C., Pietrodangelo, A., Pizzi, L., Poluzzi, V., Priod, G., Rowinski, M., Scarinzi, C., Stivanello, E., Dimakopoulou, K., Elefteriadis, K., Maggos, T., Michalopoulos, N., Pateraki, S., Petrakakis, M., Rodopoulou, S., Sypsa, V., Agis, D., Artiñano, B., Barrera-Gómez, J., de la Rosa, J., Diaz, J., Fernandez, R., Jacquemin, B., Karanasiou, A., Ostro, B., Salvador, P., Sanchez, A. M., Sunyer, J., Bidondo, M., Declercq, C., Le Tertre, A., Lozano, P., Pascal, L., and Pascal, M.: Desert dust outbreaks in Southern Europe: Contribution to daily PM10 concentrations and short-term associations with mortality and hospital admissions, Environ. Health Perspect., 124, 413–419, https://doi.org/10.1289/ehp.1409164, 2016.
Stein, A. F., Draxler, R. R., Rolph, G. D., Stunder, B. J. B., Cohen, M. D., and Ngan, F.: Noaa's hysplit atmospheric transport and dispersion modeling system, B. Am. Meteorol. Soc., 96, 2059–2077, https://doi.org/10.1175/BAMS-D-14-00110.1, 2015.
Tositti, L., Riccio, A., Sandrini, S., Brattich, E., Baldacci, D., Parmeggiani, S., Cristofanelli, P., and Bonasoni, P.: Short-term climatology of PM10 at a high altitude background station in southern Europe, Atmos. Environ., 65, 142–152, https://doi.org/10.1016/j.atmosenv.2012.10.051, 2013.
Tositti, L., Brattich, E., Masiol, M., Baldacci, D., Ceccato, D., Parmeggiani, S., Stracquadanio, M., and Zappoli, S.: Source apportionment of particulate matter in a large city of southeastern Po Valley (Bologna, Italy), Environ. Sci. Pollut. Res., 21, 872–890, 2014.
Washington, R., Todd, M., Middleton, N. J., and Goudie, A. S.: Dust-storm source areas determined by the total ozone monitoring spectrometer and surface observations, Ann. Assoc. Am. Geogr., 93, 297–313, https://doi.org/10.1111/1467-8306.9302003, 2003.
WHO: Air Quality Guidelines for Europe, Air Qual. Guidel., WHO, ISBN 9289013583, 2006.
Zhang, X. X., Claiborn, C., Lei, J. Q., Vaughan, J., Wu, S. X., Li, S. Y., Liu, L. Y., Wang, Z. F., Wang, Y. D., Huang, S. Y., and Zhou, J.: Aeolian dust in Central Asia: Spatial distribution and temporal variability, Atmos. Environ., 238, 117734, https://doi.org/10.1016/j.atmosenv.2020.117734, 2020.