the Creative Commons Attribution 4.0 License.
the Creative Commons Attribution 4.0 License.
 | 28 Mar 2022
Five-satellite-sensor study of the rapid decline of wildfire smoke in the stratosphere
Bengt G. Martinsson
Johan Friberg
Oscar S. Sandvik
Moa K. Sporre
Smoke from western North American wildfires reached the stratosphere in large amounts in August 2017. Limb-oriented satellite-based sensors are commonly used for studies of wildfire aerosol injected into the stratosphere (OMPS-LP (Ozone Mapping and Profiler Suite Limb Profiler) and SAGE III/ISS (Stratospheric Aerosol and Gas Experiment III on the International Space Station)). We find that these methods are inadequate for studies of the first 1–2 months after such a strong fire event due to event termination (“saturation”). The nadir-viewing lidar CALIOP (Cloud-Aerosol LIdar with Orthogonal Polarization) is less affected due to shorter path in the smoke; furthermore, it provides a means to develop a method to correct for strong attenuation of the signal. After the initial phase, the aerosol optical depth (AOD) from OMPS-LP and CALIOP show very good agreement above the 380 K isentrope, whereas OMPS-LP tends to produce higher AOD than CALIOP in the lowermost stratosphere (LMS), probably due to reduced sensitivity at altitudes below 17 km. Time series from CALIOP of attenuation-corrected stratospheric AOD of wildfire smoke show an exponential decline during the first month after the fire, which coincides with highly significant changes in the wildfire aerosol optical properties. The AOD decline is verified by the evolution of the smoke layer composition, comparing the aerosol scattering ratio (CALIOP) to the water vapor concentration from MLS (Microwave Limb Sounder). Initially the stratospheric wildfire smoke AOD is comparable with the most important volcanic eruptions during the last 25 years. Wildfire aerosol declines much faster, 80 %–90 % of the AOD is removed with a half-life of approximately 10 d. We hypothesize that this dramatic decline is caused by photolytic loss. This process is rarely observed in the atmosphere. However, in the stratosphere this process can be studied with practically no influence from wet deposition, in contrast to the troposphere where this is the main removal path of submicron aerosol particles. Despite the loss, the aerosol particles from wildfire smoke in the stratosphere are relevant for the climate.
- Article
(18630 KB) - Full-text XML
- BibTeX
- EndNote


Background stratospheric aerosol is composed of sulfuric acid, water, carbonaceous components, and minor extraterrestrial and tropospheric components (Murphy et al., 2007; Kremser et al., 2016; Martinsson et al., 2019). Volcanism is a strong source of the stratospheric sulfurous, carbonaceous and ash aerosol (Martinsson et al., 2009; Andersson et al., 2013; Friberg et al., 2014). Large eruptions, like that of Mt. Pinatubo in 1991, affect the stratosphere for several years, causing global cooling of several tenths of a kelvin (Kremser et al., 2016). These eruptions are scarce, i.e., only a few per century (Ammann et al., 2003; Stothers, 2007). Moderate eruptions are more frequent contributors to the stratospheric aerosol (Vernier et al., 2011; Andersson et al., 2015; Friberg et al., 2018), forming the persistently variable stratospheric background aerosol (Solomon et al., 2011).
Stratospheric aerosol is also influenced by pyrocumulonimbus clouds (pyroCb) that form during extreme weather conditions in connection with intense wildfires (Fromm et al., 2010). The ongoing climate change is projected to increase the frequency of large wildfires (Kasischke and Turetsky, 2006; Dennison et al., 2014). Interestingly, the two largest events have, in terms of stratospheric impact, occurred during the last few years: North America during 2017 (Peterson et al., 2018) and Australia during 2019–2020 (Kablick et al., 2020). Here we investigate the great pyroCbs formed in southern British Columbia, Canada, and northern Washington State, USA, on 12–13 August 2017 (Fromm et al., 2021). Figure 1a shows an example of the strong impact on the stratospheric aerosol of the 2019 Raikoke volcanic eruption, which was one of the strongest eruptions after Mt. Pinatubo in 1991. In comparison, Fig. 1b demonstrates the formidable early impact of wildfire aerosol. The stratospheric impact of that fire has been described in terms of light-backscatter reaching unprecedentedly high values for a non-volcanic aerosol layer (Khaykin et al., 2018), light extinction about 20 times higher than after the Pinatubo volcanic eruption in 1991 (Ansmann et al., 2018), and mass of smoke comparable to that of a moderate-sized volcanic eruption (Peterson et al., 2018). The pyroCbs lifted smoke from the fire to the extratropical tropopause region, where absorption of radiation by black carbon (BC) in the smoke induced additional lift to 23 km altitude in 2 months (Yu et al., 2019; Lestrelin et al., 2021).
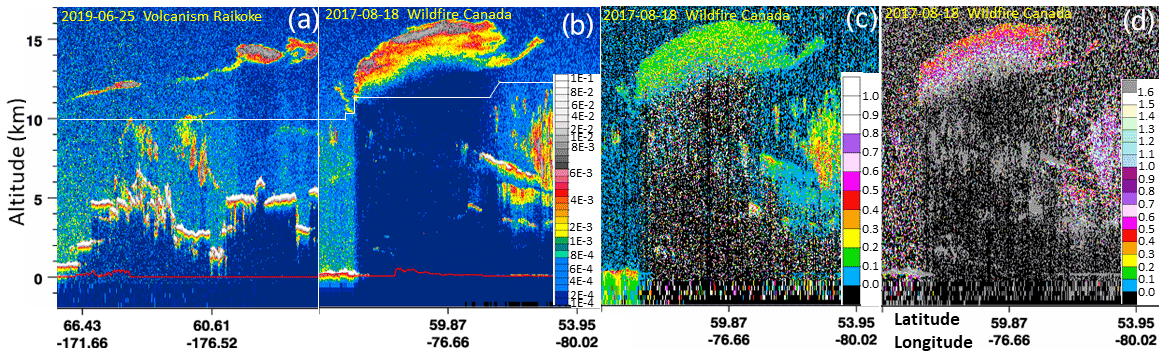
Figure 1CALIOP curtains of total attenuated backscatter () at 532 nm from (a) volcanic aerosol layers in the stratosphere 3 d after the 2019 Raikoke eruption and (b) a stratospheric smoke layer from the 12 August 2017, North American wildfire, where “aE-b” in the scale refers to . (c) Volume depolarization ratio at 532 nm and (d) attenuated color ratio (1064 to 532 nm) for the curtain in (b). The white lines in (a) and (b) show the position of the tropopause.
Smoke particles from wildfires contain a dominating fraction of organic matter by mass (Garofalo et al., 2019). Organic aerosol is susceptible to photochemical loss (Jimenez et al., 2009), and laboratory studies have demonstrated that this phenomenon could be an important sink of secondary organic aerosol mass (Molina et al., 2004; Sareen et al., 2013). The residence time of stratospheric air spans months to years depending on its path in the Brewer–Dobson circulation (Engel et al., 2009; Bönisch et al., 2009). Due to very low probability of clouds, fine aerosol particles have considerably longer residence times in the stratosphere than in the troposphere, which further emphasizes the importance of investigating photochemical loss in the stratosphere (Martinsson et al., 2019).
The aim of this study is to further understand the stratospheric aerosol sources and their climate impact. We develop a methodology to correct for attenuation in dense smoke layers from wildfires to properly deal with intense smoke injections into the stratosphere, with two main questions: (1) does photochemical loss of wildfire smoke occur in the stratosphere, and (2) how does the aerosol optical depth (AOD) of smoke from the wildfire studied here compare with volcanic aerosol?
The first decade of the 21st century was characterized by slower temperature evolution than anticipated from CMIP5 models (Fyfe et al., 2016). The discrepancy was attributed to inter-decadal Pacific oscillation (Medhaug et al., 2017), variations in solar forcing (Myhre et al., 2013), and aerosol in the stratosphere from moderate volcanic eruptions (Santer et al., 2014). Should wildfire smoke in the stratosphere be added to this list of phenomena that require more attention in climate models?
Our investigation deals with the evolution of the wildfire AOD, as well as aerosol optical properties obtained from the lidar CALIOP aboard the CALIPSO (Cloud-Aerosol Lidar and Infrared Pathfinder Satellite Observation) satellite, OMPS-LP/Suomi, and SAGE III/ISS in comparison with volcanic injections to the stratosphere. Additionally, the water vapor concentrations of individual smoke layers are investigated by the Microwave Limb Sounder (MLS), the spatial evolution of smoke layers is investigated using OMPS-NM (Ozone Mapping and Profiler Suite Nadir Mapper), and the AODs and extinction coefficients obtained from CALIOP are compared with that of OMPS-LP and SAGE III/ISS.
This study of the dense stratospheric smoke layers from pyrocumulonimbus formed over western North America on 12–13 August 2017 is based on five satellite sensors. For four of them, OMPS-LP, SAGE III/ISS, MLS, and OMPS-NM, high-level products (level 2) are used. The CALIOP data evaluation is based on a level-1 product. A method to correct for attenuation of the CALIOP laser beam in the smoke layers is presented. For these reasons, CALIOP requires more space in this section compared to the other methods.
2.1 CALIOP
The evaluation of the CALIOP instrument carried by the CALIPSO satellite is based on version 4-10 level-1B data. CALIOP measures backscattering of laser light at two wavelengths, 532 and 1064 nm. For the shorter wavelength, scattered laser light is detected in parallel and perpendicular polarizations relative to the outgoing beam. These almost nadir-viewing aerosol and cloud measurements result in high-resolution vertical profiles. For the altitude ranges <8.2, 8.2–20.2, 20.2–30.1, and 30.1–40 km, the vertical resolutions are 30, 60, 180, and 300 m, respectively. CALIPSO orbits between 82∘ S and 82∘ N, completing 14–15 orbits per day (Winker et al., 2007, 2010).
2.1.1 AOD
Stratospheric AOD was obtained by integrating the backscattering intensity corrected for attenuation (described below) from the tropopause to 35 km altitude. Figure 1b illustrates how attenuation of the laser signal strongly reduced the signal below the dense smoke layer between 11 to 16 km altitude. We use the tropopause height according to MERRA-2 supplied with the version 4.10 CALIOP data, which are a mixture of a dynamic and a thermal tropopause. The AOD was averaged in the 20–80∘ N latitude range, where all nighttime swaths available from CALIOP were included. The data were averaged over all longitudes in 1∘ latitude bands, and these latitude bands were averaged for the 20–80∘ N latitude range using area weighting.
For dense layers, the lidar ratios estimated for the individual smoke layers were applied (explained below). Apart from the first few days, the lidar ratio shows no temporal evolution; it is found to have a geometrical mean of 48.9 sr with double-sided 95 % confidence interval of 47.6–50.3 sr (Fig. 2a), which is close to the typical background lidar ratio of 50 sr (Jäger and Deshler, 2003). For layers that were not dense, the lidar ratio was held at this typical background level. The volume depolarization ratio (δv) contains information that can be used to classify aerosol layers. When δv is less than 0.05, the data are considered background, and the lidar ratio is set to 50 sr (Vernier et al., 2009).
Ice clouds were removed in the lowest 3 km of the stratosphere by identifying them in stratospheric layers where the backscattering was high (attenuated backscattering larger than 0.0025 ). This limitation is introduced to avoid statistically induced detection of ice clouds from weak signals. Data in these layers were classified as probable ice clouds if their δv values exceed 0.20, which classifies all the smoke layers in Fig. 2c as aerosol since the volume depolarization ratio is always smaller or equal to that of particles for a depolarizing aerosol. The data within each swath were then clustered depending on their location. Noise in the data led to some lone pixels within layers. These were reclassified depending on the surrounding pixels, making sure that no single pixel marked as aerosol occurred within the ice-cloud layers. Layers of ice clouds were then expanded upwards and horizontally to capture faint edges of the clouds (Friberg et al., 2018). Aerosol with δv values in the range 0.05 to 0.2 were considered to be smoke and δv<0.05 as background aerosol. In the present work the latter discrimination had little effect, because smoke was found to have the same lidar ratio as typical background aerosol. The classification was carried out on data at 8 km resolution along each swath with their highest vertical resolution (30, 60, or 180 m, depending on altitude), after which the tropospheric data were removed.
Possible polar stratospheric cloud (PSC) signals north of 45∘ N were excluded by classifying pixels with temperature below 195 K as possible PSC occasions. Underlying pixels were also excluded, to prevent bias from attenuation of the lidar signals or from settling ice crystals (Friberg et al., 2018).
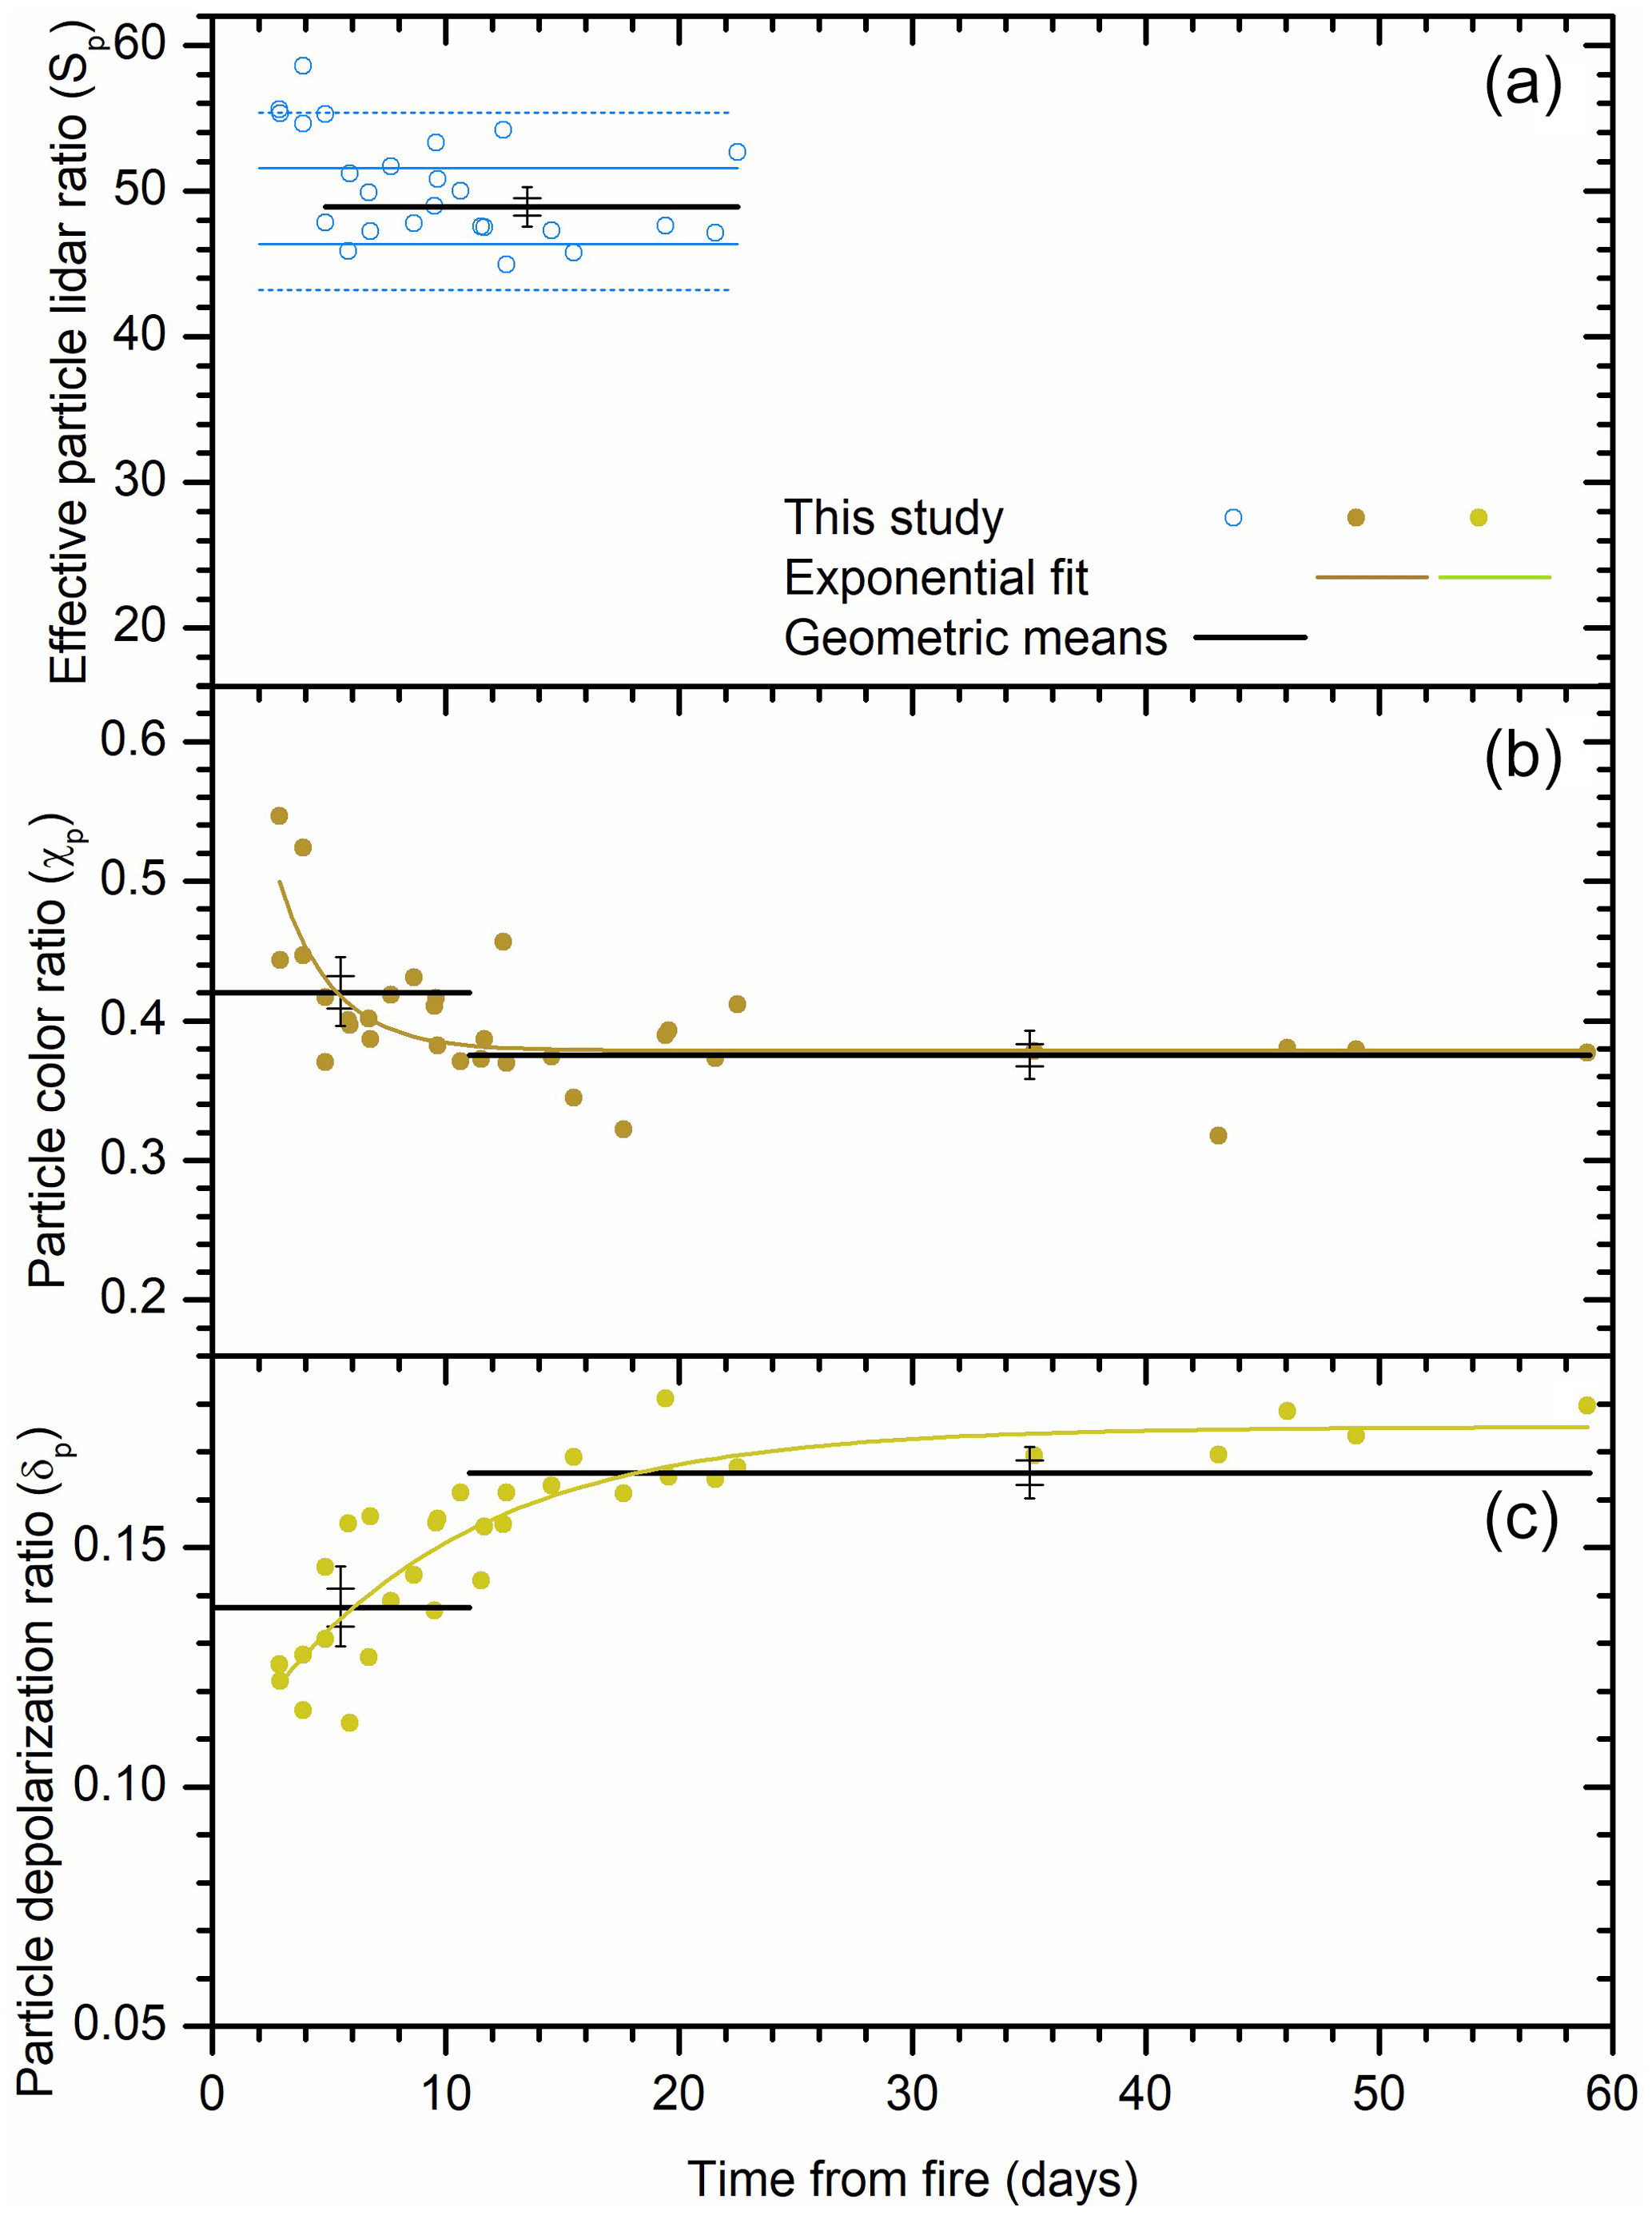
Figure 2Particle optical properties during the first 60 d after the fire. Black error bars show standard error and the double-sided 95 % probability range of the geometric means. (a) Particle lidar ratios for 532 nm, where data points with fitting error exceeding 25 % are discarded. The black line shows the geometric mean after day 4, and the full and dotted blue lines show the standard deviation and the double-sided 95 % probability range of the distribution. (b) Particle color ratio (1064 nm divided by 532 nm wavelength backscattering) with exponential fit (R2=0.48, ); (c) particle depolarization ratio with exponential fit (R2=0.76, ). The color and depolarization ratios were divided into two equal groups by number of observations to illustrate the highly significant changes with time of the optical properties, where the long and short error bars are the standard error and the double-sided 95 % probability range of the geometric means.
2.1.2 Attenuation correction and radiative properties of individual smoke layers
The evolution of the lidar, color, and depolarization ratios were investigated using 32 separate smoke layer measurements over the period 3–59 d after the fire. CALIOP has a statistical disadvantage compared with lidars at the ground (Baars et al., 2019) because of small solid angle due to long distance to the stratosphere (∼700 km) and short measurement time. Optical properties of old and faint individual smoke layers therefore could not be quantified with high precision using CALIOP. The faint layers, though, still affect the AOD determinations described above, where AOD elevation after the fire remains for approximately 1 year. Out of the 32 smoke layers studied, 29 were nighttime measurements, whereas the remaining 3 were defined as daytime measurements. These last ones increased the number of early observations (day 3–5) and were taken when the disturbance from solar radiation is small, i.e., shortly before the night.
During the first weeks after the fire, the smoke layers could be very dense with layer AODs exceeding 1, causing strong attenuation of the CALIOP signals with two-way transmissions down to below 0.01. Such high AOD values were also observed for this fire by the Deep Space Climate Observatory/Earth Polychromatic Imaging Camera (DSCOVR-EPIC) mapper and the AErosol RObotic NETwork (AERONET) (Torres et al., 2020). For the 532 nm wavelength, the particle lidar ratio was estimated by aiming the scattering ratio (R; total-to-molecular backscattering ratio) below a smoke layer to a target value. The target value was obtained from the background scattering ratio beside each smoke layer investigated, which on average is R=1.08, with standard deviation of ±0.05. To reduce influence from noise, the CALIOP data were averaged along the swath. The averaging range varied between the smoke layers, due to its extension along the swath, the homogeneity of the layer, and avoidance of sublayer features.
The particle lidar ratio of an individual smoke layer was iterated until reaching the target value (R=1.08) described above from the combined effect of all altitude pixels. Pixels at altitudes outside the smoke layer were set to the background lidar ratio of 50 sr (Jäger and Deshler, 2003). The altitude resolution provided in the CALIOP data was used, where each altitude pixel (j) is corrected for attenuation. The calculation starts at the highest altitude (40 km) and continues downwards in two rounds. In the first round the star-marked quantities of Eqs. (1)–(3) were computed, correcting for attenuation from overlaying pixels. Before moving to the next altitude, we account for self-attenuation from the pixel itself (equations to the right, without a star):
where β′ is the attenuated backscattering, and T2 is the two-way transmissions from both particles and molecules. The two-way particle transmission is obtained by first computing the AOD:
where Δzj is the height of the altitude pixel, βm,j is backscattering from air molecules, and Sp is the lidar ratio of the aerosol particles. The molecular lidar ratio, for computation of the molecular extinction, was set to 8.70477 sr (Prata et al., 2017). The two-way transmission of altitude pixel j due to the particles present is obtained from
These calculations in Eqs. (1)–(3) are carried out until the background layer between altitudes a and b below the smoke layer reaches the target scattering ratio of 1.08 (Fig. 3a):
CALIOP measurements are affected by multiple scattering (Wandinger et al., 2010), causing overestimation of the backscattering described by the multiple scattering factor (η). This factor is not known; previous estimates for fine aerosol are in the range 0.085–0.95 for layers thicker than 500 m (Prata et al., 2017). In Eq. (2) the backscattering inflated by multiple scattering (β) is multiplied by a lidar ratio. The latter is obtained by iterating Eqs. (1)–(3) until reaching the target scattering ratio, that of the surrounding air, below the cloud. Since the backscattering is inflated by multiple scattering, the lidar ratio obtained will become the product of the actual lidar ratio and the multiple scattering factor, i.e., the effective lidar ratio. Thus, while overestimating the backscattering and underestimating the lidar ratio to equal multiplicative degree, the method applied here corrects the AOD for multiple scattering.

Figure 3Illustration of the attenuation correction methodology and its effect. (a) The attenuated and corrected scattering ratios as a function of altitude. Example of a methodology for one smoke layer, where the scattering ratio between 7.5–10 km altitude, below the smoke layer at 10.5–14 km, is targeted to a value of 1.08 (explained in the Sect. 2.1.2) by iteratively fitting the lidar ratio for 532 nm wavelength. (b) The attenuated layer AOD (AODatt) related to the layer AOD corrected for attenuation. The 1:1 relation is shown by the full line.
Error estimates of the effective lidar ratio were obtained by varying the target scattering ratio from its average value (R=1.08) mentioned above to its ±0.05 standard deviation range. The fitting uncertainty in these estimates is strongly dependent on the light extinction in the smoke layer. Dense layers result in very small uncertainties in the effective lidar ratio because of the strong impact on R from a slight change in the extinction. Layers with lower extinction progressively increase the uncertainties of the estimate. When the error estimate of the effective lidar ratio fit exceeds 25 %, the result is excluded from the data analysis, which terminates estimates of lidar ratios from day 22 after the fire.
The color ratio, the ratio between the backscattering at 1064 to 532 nm wavelength, is affected by a difference in attenuation of the two wavelengths. This is clearly visible for dense smoke layers in the CALIOP browse images by a gradual increase in the color ratio through the layer because of the weaker attenuation for 1064 nm wavelength than for 532 nm (Fig. 1d). Therefore, estimations of the attenuation were undertaken also for the long wavelength. The molecular backscattering is assumed to be of that at 532 nm ( dependence of Rayleigh scattering). Weak molecular scattering at 1064 nm prohibits lidar ratio estimation at that wavelength by CALIOP. Instead, the lidar ratio was assumed to be 60 sr, inducing uncertainties in the color ratio. The volume color ratio is obtained from
To limit the influence from attenuation in the color ratio computations, the estimates were based on the upper part of a smoke layer. Starting from the top of the smoke layer, the computations were truncated when the two-way transmission of the 532 nm wavelength fell below 0.7. Varying the 1064 nm wavelength lidar ratio in the wide range of 60±20 sr, the uncertainty in the color ratio becomes less than ±5 % with this constraint applied. From the color ratio, we define the particle color ratio:
where we made use of the wavelength dependence of Rayleigh scattering for molecular scattering, and the scattering ratio for the 532 nm wavelength was obtained from Eq. (4).
We also investigated the depolarization of the scattered laser beam at 532 nm by first forming the volume depolarization ratio:
where symbol ⊥ indicates scattered light polarized perpendicularly to the incident beam. Having access to the volume depolarization and an estimate of the molecular depolarization ratio δm≈0.003656 (Prata et al., 2017; Hostetler et al., 2006) the particle depolarization ratio is obtained from
where R is obtained from Eq. (4).
2.2 Extinction coefficients and AOD from OMPS-LP
The aerosol data from OMPS-LP (Chen et al., 2018; Jaross et al., 2014; Loughman et al., 2018) have lately been used extensively in the literature on volcanic and wildfire impact on the stratospheric aerosol. Several data products are available; here we use the recently released level-2 product: Suomi-NPP OMPS LP L2 AER Daily Product, version 2.0 (Taha, 2020). The polar-orbiting Suomi satellite completes between 14 and 15 orbits per day. OMPS-LP is a limb-scattering method that collects data looking backwards along the satellite orbit and along two other directions separated by 4.25∘ from the orbit, giving a cross-track separation of approximately 250 km at the tangent point. Measurements are undertaken in the wavelength and altitude ranges of 290–1000 nm and 10–80 km, respectively. The vertical resolution of OMPS-LP is 1.5–2 km (Rault and Loughman, 2013). The measurements are evaluated by the Gauss–Seidel limb scattering (GSLS) radiative transfer model. By improving calculations of the multiple scattering source function, the total radiance error has become 1 %–3 % (Loughman et al., 2015). The aerosol product used here comprises six wavelengths (510, 500, 675, 745, 869, and 997 nm). The group responsible for the OMPS-LP version 2.0 data (Taha, 2020) recommends caution when using data from altitudes below 17 km altitude due to loss of sensitivity. This problem can be reduced by use of the 745 nm and longer wavelengths. Here we will make use of two of these wavelengths: 745 nm because of the reduced problem with sensitivity and 510 nm because it is the wavelength closest to that of CALIOP (532 nm).
The OMPS-LP aerosol extinction coefficients are provided on a grid with a vertical resolution of 1 km. To study the smoke from the August 2017 fire, we compute the average AOD over all longitudes in the latitude interval 20–80∘ N for three layers: the lowermost stratosphere (LMS, tropopause to 380 K isentrope), lower Brewer–Dobson branch (380–470 K) and the upper Brewer–Dobson branch (470 K to 35 km altitude). The OMPS-LP version 2 data set uses a cloud detection algorithm (Chen et al., 2016) and comes in two forms: one without filtering out signals from clouds and the other where signals affected by clouds and polar stratospheric clouds are removed. In Fig. 4 we show both these varieties for the 745 nm wavelength, and, with and without flags regarding data quality including profile retrieval errors (named RetrievalFlags in the OMPS-LP files), high root-mean squares (ResidualFlags), and further errors from the South Atlantic anomaly, disturbances from the Moon, solar eclipses, planets, and satellite maneuvers (SwathLevelQualityFlags). In the two upper layers (Fig. 4a and b), the differences are usually small between the varieties except for some spikes, whereas the LMS data (Fig. 4c) show large stochastic variability as well as periods of clear differences between the varieties. Since these data are taken well below 17 km altitude, sensitivity issues can be expected (Taha, 2020); see above. For days 130–190 (during December 2017 to February 2018), several spikes appear in the two higher layers that are probably caused by polar stratospheric clouds. The data set filtered for clouds and flagged stands out by comparably small peaks, whereas the differences between the varieties usually are small elsewhere. We therefore select the cloud-filtered and flagged data for further analysis in the following sections.
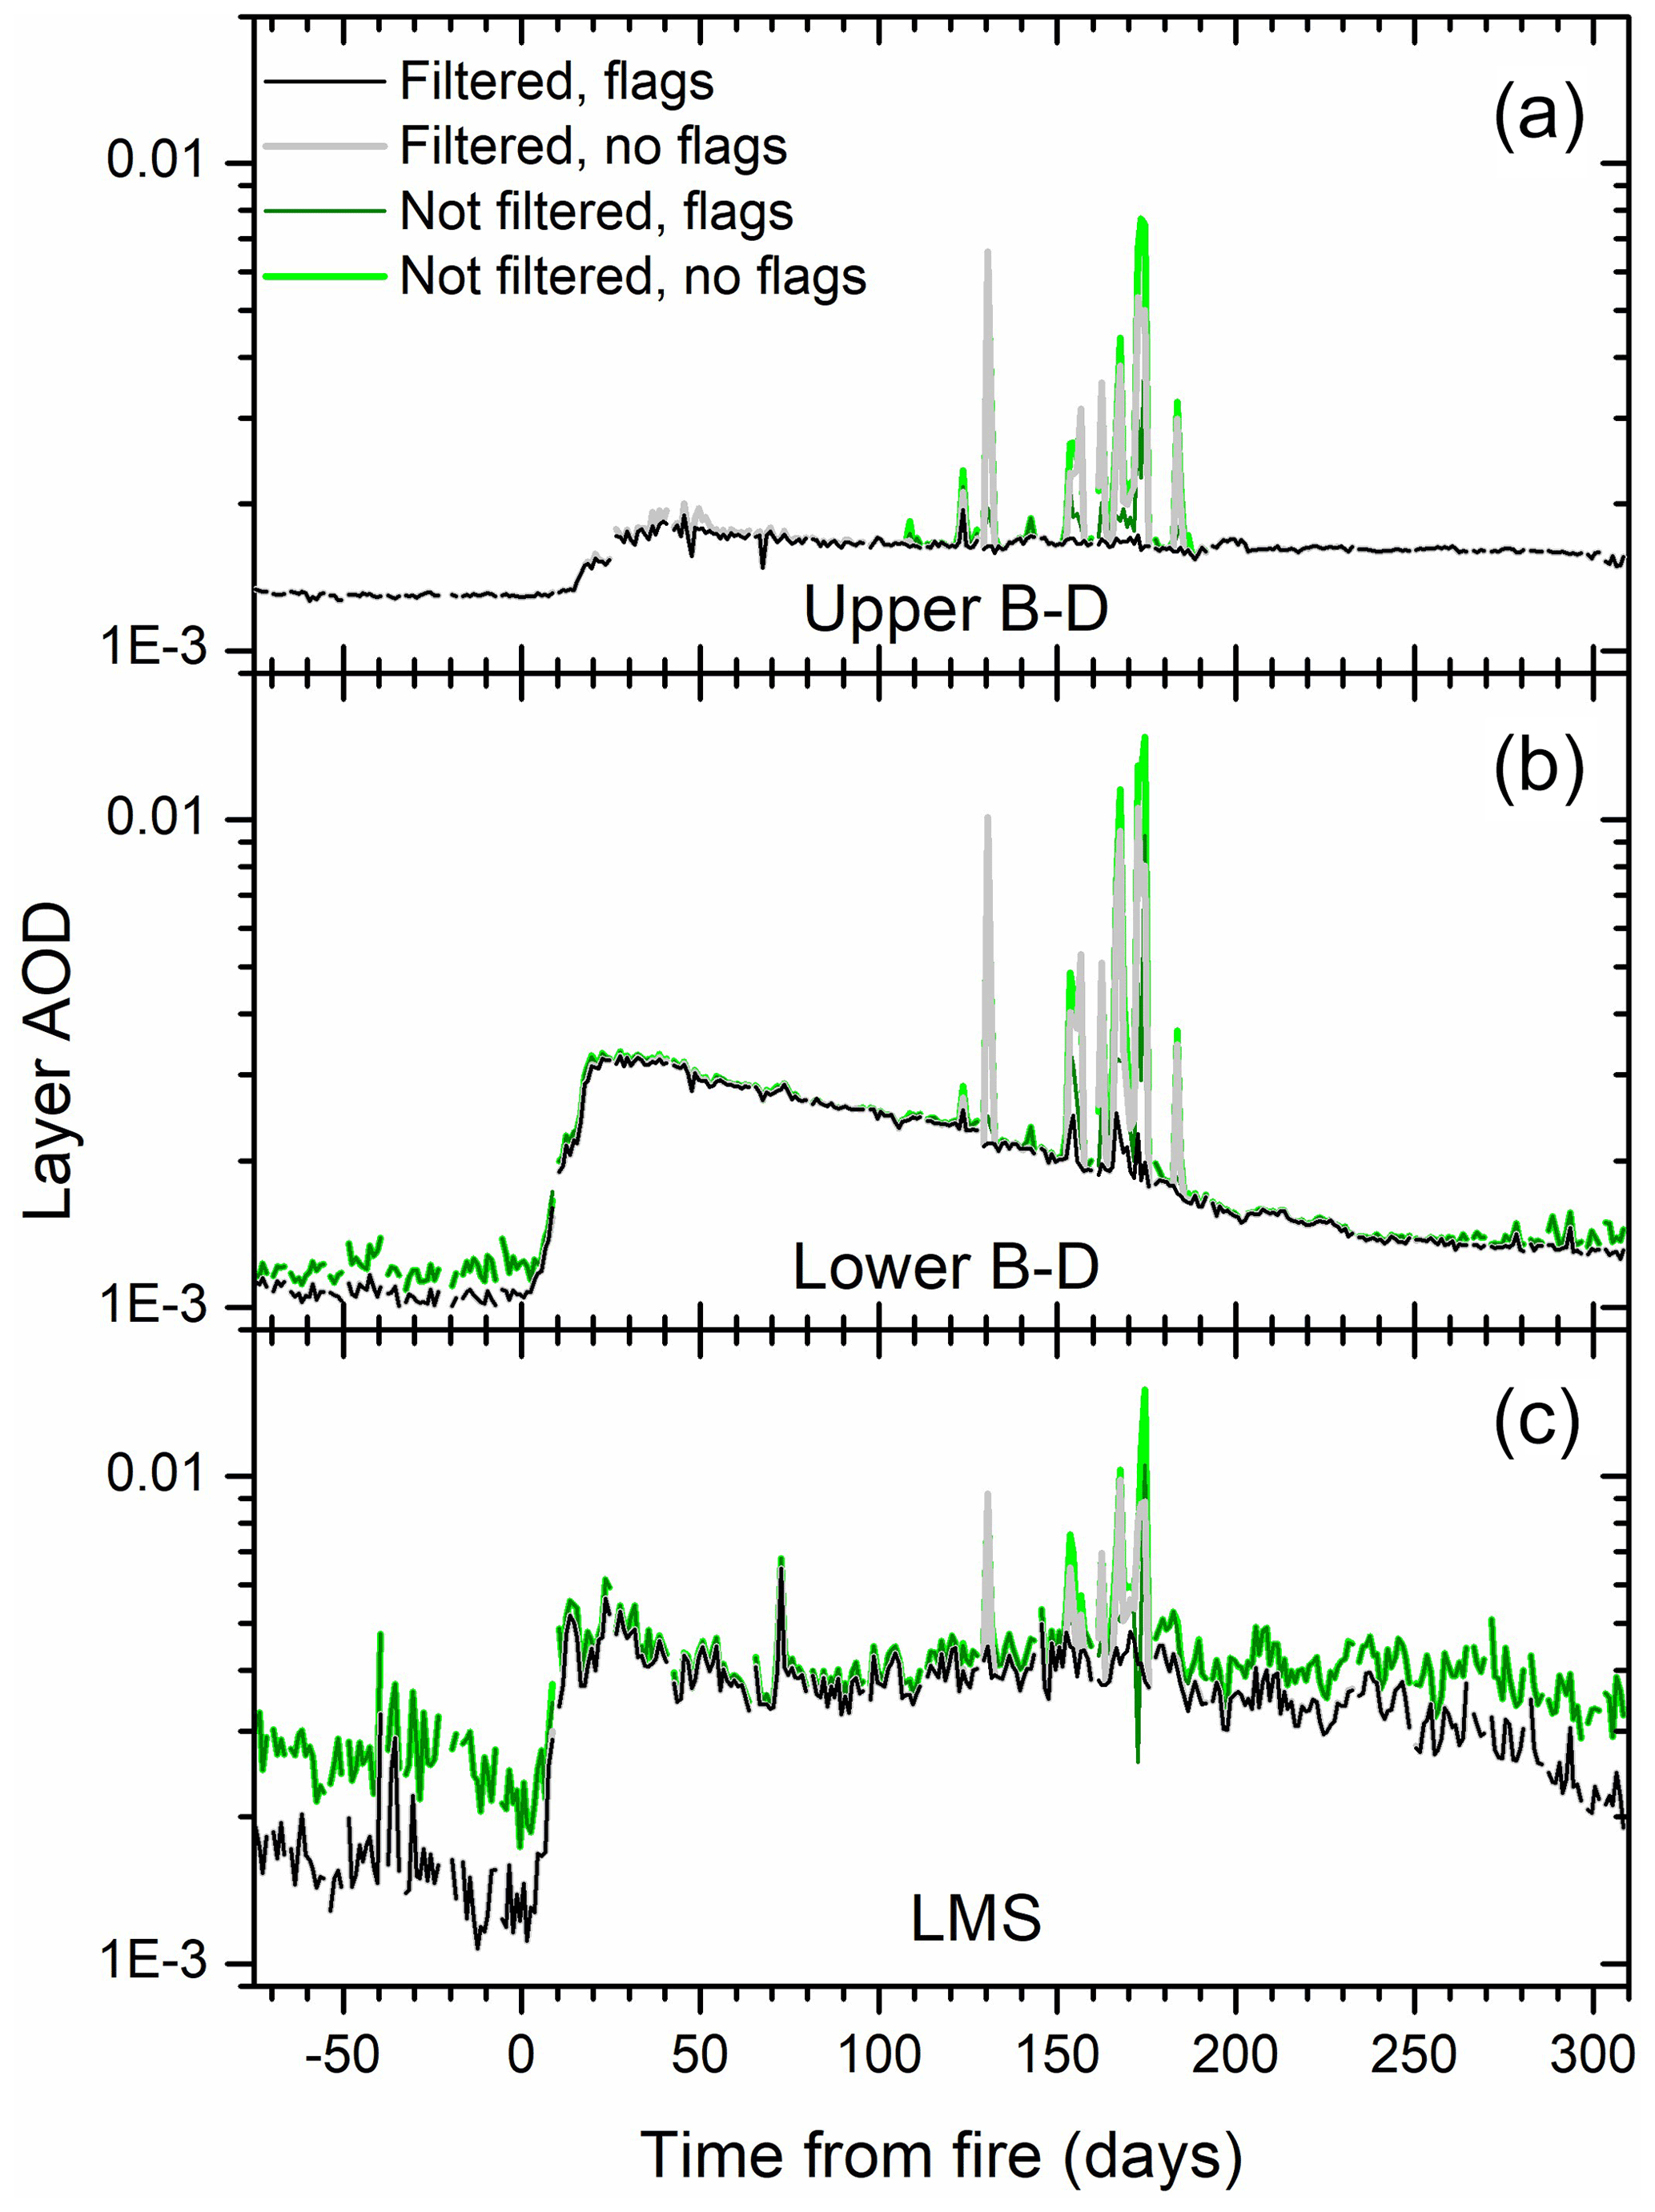
Figure 4OMPS-LP layer AODs averaged over 20 to 80∘ N for the 745 nm wavelength using data filtered and not filtered from clouds and polar stratospheric clouds, as well as with and without data flagged for data quality. Layer AOD for (a) the upper Brewer–Dobson branch (470 K isentrope – 35 km), (b) the lower Brewer–Dobson branch (380–470 K), and (c) the LMS (tropopause – 380 K) are shown.
2.3 Extinction coefficients from SAGE III/ISS
SAGE III/ISS is a limb-viewing instrument based on solar occultation. Here we make use of level-2 aerosol extinction coefficients (SAGE III/ISS User's Guide, 2018), version 5.10, supplied with a vertical resolution of 0.5 km. The upper limit of the slant path optical depth is about 8, translating to a vertical optical depth of approximately 0.02 (SAGE III/ISS User's Guide, 2018). The orbiting of ISS differs markedly from the polar-orbiting satellites CALIPSO (CALIOP) and Suomi (OMPS-LP). This causes sporadic coverage by ISS of the latitudes of interest here, resulting in the fact that no average AODs over the 20–80∘ N latitude range could be formed with adequate time resolution. However, daily maximum extinction coefficients from SAGE III/ISS could, when available, be included in a comparison with CALIOP and OMPS-LP.
2.4 Water vapor measurements from MLS
Water vapor concentrations (mixing ratio) in individual smoke layers were obtained from the MLS instrument aboard the Aura satellite (Waters et al., 2006) in 12 vertical steps per decade of pressure (version 5.0-1.0a, level 2). In nighttime measurements from days 6–59 after the fire, the smoke layers studied by CALIOP were also investigated with MLS in almost simultaneous measurements, with both instruments being on satellites that are members of the A-train (L'Ecuyer and Jiang, 2010). Data in the 10–316 hPa atmospheric pressure range were used, with vertical resolution 1.3–3.2 km (Lambert et al., 2020; Livesey et al., 2020). Limited vertical resolution induces problems to obtain well-defined observation of H2O concentration of smoke layers close to the strong H2O concentration gradient across the tropopause. H2O from MLS for this fire has previously been reported by Pumphrey et al. (2021). Close to the tropopause, but in the stratosphere, no H2O peak from a smoke layer can be detected. As the distance to the tropopause increases, an H2O peak from the smoke layer becomes discernible. Further up from the tropopause, when the peak H2O concentration is well above the extratropical tropopause at atmospheric pressure of less than 110 hPa, a deep minimum appears between the tropopause gradient and the peak from the smoke layer. All H2O peaks were fitted with a Gaussian distribution operating on logarithmic pressure and H2O concentration to obtain estimates of the peak concentration and the corresponding atmospheric pressure. To investigate a time dependence in the smoke layer composition, the peak H2O concentration () was compared with the attenuation-corrected aerosol scattering ratio (R) from CALIOP, the optical equivalent of the mixing ratio, where the latter was obtained by forming the geometrical mean over 900 m around the peak scattering ratio. The ratio of the two quantities () was formed, and its dependence on time from the fire was studied. Out of the 13 smoke layers available with peak water vapor concentrations above the altitude of 110 hPa atmospheric pressure, 1 was flagged as low quality in the MLS data set, leaving 12 observations for the study of the evolution.
2.5 UV aerosol index from OMPS-NM
The ultraviolet (UV) aerosol index of OMPS-NM based on measurements at two wavelengths, 340 and 378.5 nm, is the official NASA aerosol index product according to OMPS-NM (NMMIEAI-L2 V2.1.1) release notes (Torres, 2019). For strongly UV-absorbing aerosols, like black carbon from wildfires, the UV aerosol index strongly increases with altitude (Herman et al., 1997). UV aerosol index can be used to quantify AOD when layer altitude is available (Torres et al., 2020). However, here the OMPS-NM UV aerosol index was used to map the geographical evolution of the smoke layers, that according to CALIOP measurements were distributed in both the troposphere and the stratosphere.
Here we use an approach based on five satellite sensors to study the influence on the stratosphere of the great North American fire in August 2017. We start by briefly describing results from the method to correct CALIOP data for attenuation of the backscattered laser light. Then follows a comparison of AODs obtained from OMPS-LP and CALIOP. Absorption aerosol index from OMPS-NM is used to describe the dispersion of the wildfire aerosol in the stratosphere. To explain differences in AOD between OMPS-LP and CALIOP, a comparison of extinction coefficients follows, where results from SAGE III/ISS also are included in the comparison. The evolution of the optical properties of the wildfire aerosol is then described, before the North American wildfire aerosol is compared with volcanic influence on the stratospheric AOD. Finally, the fifth data set, water vapor from the MLS, is introduced in Sect. 4, where the evolution of the wildfire aerosol in the stratosphere is analyzed.
3.1 Correction for attenuation
The smoke layers were usually 1–3 km thick and could extend several degrees in longitude and latitude. Measurements with the CALIOP lidar provide, in addition to short, nadir-viewing measurement path in dense layers, the advantage that the signal is retrieved as a function of position along the laser path with high resolution, which can be used to correct for attenuation of the signal. Figure 3a shows the attenuated scattering ratio (R′; the measured backscattering divided by the calculated molecular backscattering) from an example smoke layer measured on 16 August 2017. The scattering ratio should be close to 1 in air layers with low aerosol concentration, whereas values below 1 are caused by attenuation from particles. As can be seen in Fig. 3a, the attenuated scattering ratio first increases (starting from above the layer). Then the signal decreases and reaches well below unity from 11 km altitude and downwards, i.e., well below the scattering ratio of particle-free air. By techniques described in Sect. 2.1.2, we correct for attenuation and fit the lidar ratio (the ratio of extinction to backscattering) (Fig. 2a) to obtain an estimate of the backscattering without attenuation, as illustrated by the scattering ratio (R) in Fig. 3a.
The evolution of wildfire aerosol from day 3 to 59 after the North American pyroCbs on 12 August 2017 is first investigated by comparing 32 smoke layers from individual CALIOP swaths. The influence from attenuation is shown in Fig. 3b. Clear deviation from the 1:1 line appears already at layer-attenuated (uncorrected) AODs (AODatt) of 0.12 and 50 % reduction of the signal appears at layer AODatt of approximately 0.25. Reduction by more than 50 % appears until day 10 after the fire, whereas those measurements close to the 1:1 line were taken after day 30. The AOD, i.e., the AOD corrected for attenuation, exceeds the AODatt by more than a factor of 5 in the densest layers of this study (Fig. 3b).
3.2 Comparison of CALIOP and OMPS-LP
To study the evolution of the stratospheric AOD, we form a three-dimensional box in the stratosphere extending over all longitudes in the 20–80∘ N latitude range. In this box, we use all daily profiles,14–15 CALIOP and 42–45 OMPS-LP, to form the average AOD. We apply the method to correct CALIOP data for attenuation, as described in the Sect. 2.1.2. AODs are computed for three layers: the LMS, the lower Brewer–Dobson branch, and the upper Brewer–Dobson branch, as shown in Fig. 5.
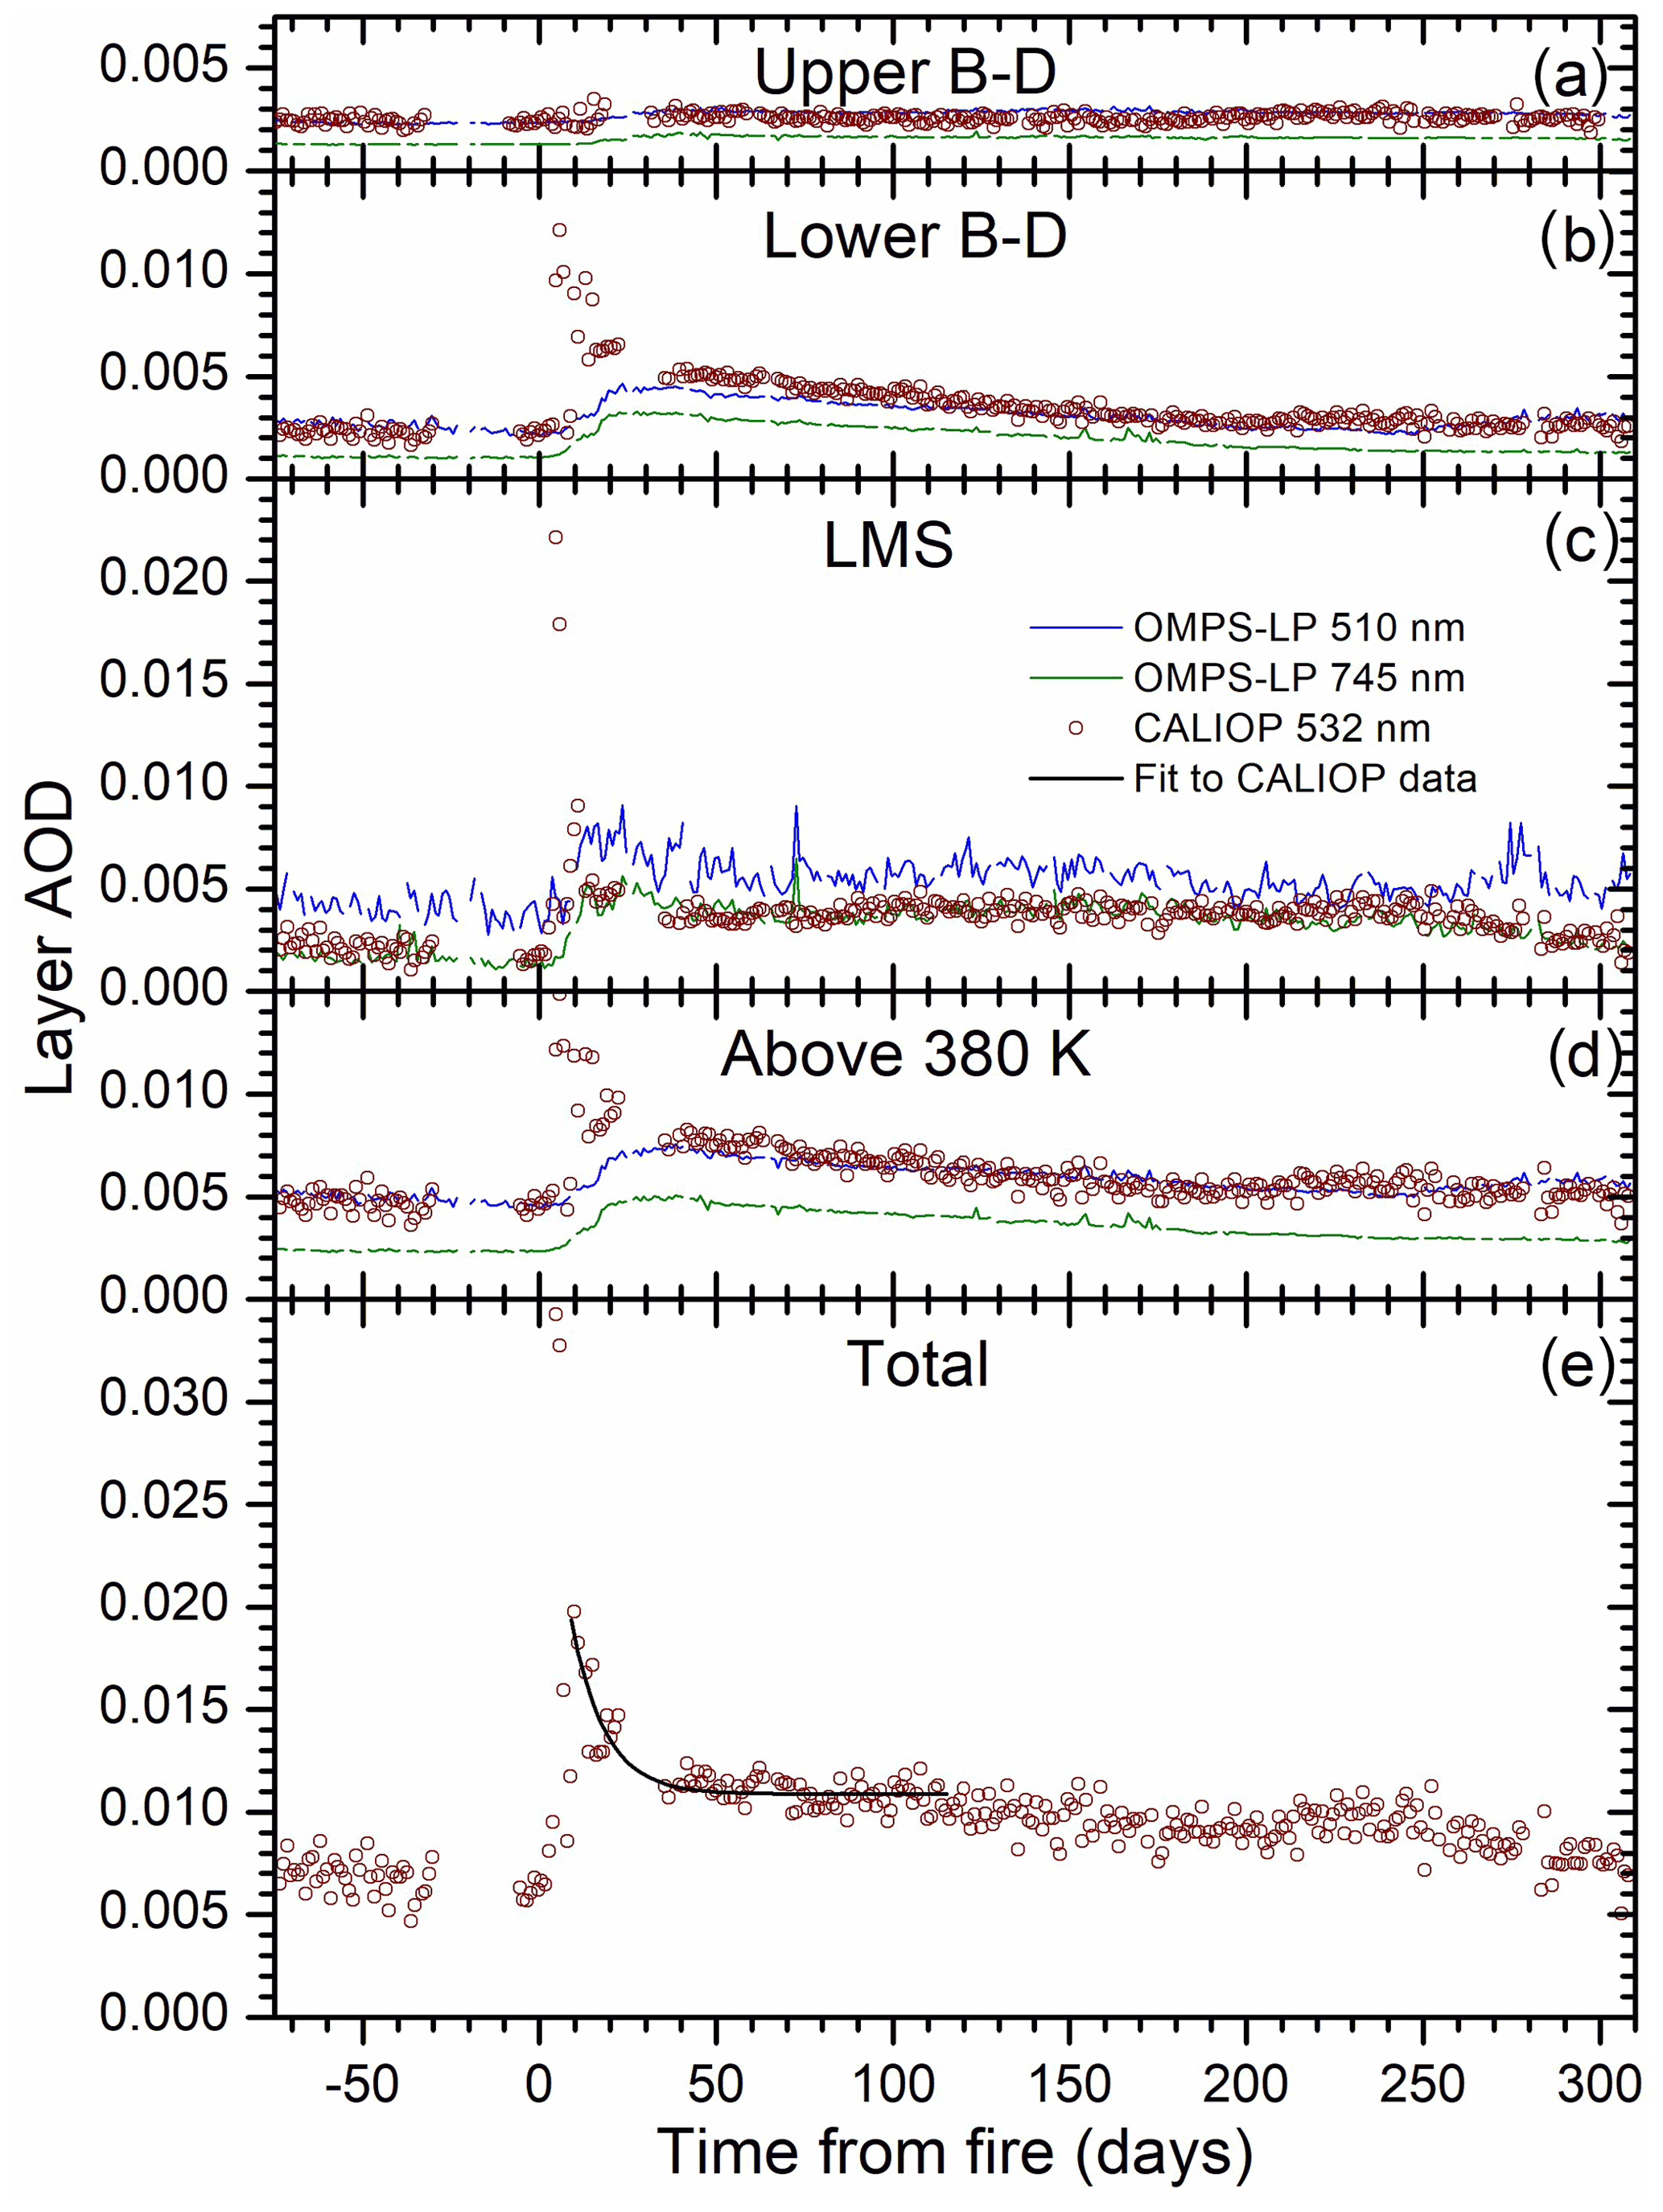
Figure 5AOD evolution of the stratospheric AOD (daily average) from 75 d before to 310 d after the 2017 western North American fires. Comparisons of AOD from CALIOP (532 nm) with OMPS-LP (510 and 745 nm) with cloud filtering and flags activated for (a) the upper Brewer–Dobson branch (470 K isentrope – 35 km), (b) the lower Brewer–Dobson branch (380–470 K), (c) the LMS (tropopause – 380 K), and (d) from 380 K to 35 km (sum of layers in a, b, and e) the stratosphere of CALIOP from the tropopause to 35 km (sum of layers in a, b, and c). The full black line is an exponential fit (R2=0.79, ) to the AOD over days 10–115 after the fire. The total stratospheric AOD half-life of the fit is 6.5±0.9 d.
When comparing AODs, the measurement wavelengths should be as close as possible, due to the wavelength dependence of scattering. CALIOP AODs are shown for the 532 nm wavelength, and the OMPS-LP data are shown for the close wavelength of 510 nm. In addition, the 745 nm AODs from OMPS-LP are shown. The response to the 2017 North American fire is weak in the upper Brewer–Dobson branch (Fig. 5a), whereas the two lower layers (Fig. 5b–c) show a clear increase in the AOD. Comparing the two methods, they agree well in the upper Brewer–Dobson branch. In the lower Brewer–Dobson branch we see good agreement between the two methods, except for the first 1–2 months after the fire where much higher AODs are recorded by CALIOP (Fig. 5b). The latter is also true for the LMS, whereas the general agreement between the two methods is poor (Fig. 5c). The OMPS-LP documentation advises against using data from below approximately 17 km altitude, approximately the upper limit of the LMS, due to loss of sensitivity (Taha, 2020). We therefore do not perform any further comparisons in the LMS. The stratosphere above the LMS (above the 380 K isentrope) shows good agreement between the two methods, except for the first 1–2 months after the fire (Fig. 5d).
3.3 Early evolution of the smoke layers
The daily AOD averages from CALIOP show large variability during the first days after the fire, because the lidar measures narrow curtains through the atmosphere (Fig. 5e). The variability remains until the smoke layers become sufficiently dispersed, allowing several daily measurements of the smoke layers. The nadir-viewing OMPS-NM provides UV-absorbing aerosol index, where strong signal for strongly UV-light-absorbing aerosol is obtained in the upper troposphere and the stratosphere. Figure 6 shows the geographic evolution of the smoke layers from 14 to 22 August 2017 together with the orbits followed by the CALIOP measurements. Up to 16 August the smoke is found in a rather confined area. From 17 August the smoke layers are stretched in an eastward direction, and after that the smoke spreads rapidly to the east. The dispersion gradually increases the number of daily CALIOP observations of the smoke. This can also be seen in Fig. 5e, where the variability in the daily AOD data becomes successively smaller. From day 10 (22 August), we see a clear pattern of decline of the AOD.

Figure 6Daily OMPS-NM UV-absorbing aerosol index 14–22 August 2017 over all longitudes and latitudes 20–80∘ N. This index is sensitive to UV-absorbing aerosol particles in the upper troposphere and the stratosphere, where signals from tropospheric aerosol declines faster than from stratospheric due to short residence time. The yellow lines indicate nighttime swaths of the CALIPSO satellite, and the faint lines show CALIPSO daytime swaths.
Figure 5e shows the total stratospheric AOD according to CALIOP from the tropopause to 35 km altitude. We see a strong decline of the stratospheric AOD in the first 1.5 months after the fire, and a fitted exponential function has a half-life of 6.5±0.9 d. Such a decline cannot be found in the OMPS-LP AODs, which instead are increasing during the first month.
To further investigate this clear difference between the two methods, individual smoke layers are investigated with respect to extinction coefficients. Figure 7a–d show the extinction coefficient of dense smoke layers from 4 d in August and September 2017. From CALIOP, we show the attenuated extinction coefficients as well as the profiles corrected for attenuation. Together with the CALIOP data, the OMPS-LP data closest by are shown. It is obvious that OMPS-LP shows a very much smaller reaction to the smoke layers than CALIOP. However, we cannot be sure that the two instruments viewed the same air masses in these four examples, because the two instruments do not belong to the same satellite constellation. To remove that obstacle, the daily maximum stratospheric extinction coefficient from OMPS-LP was extracted and compared with 32 selected profile peak extinction coefficients from CALIOP. SAGE III/ISS was also included in the comparison from day 19 after the fire. Unfortunately, the orbiting of ISS did not permit measurements of the fire studied here before that day. The very strong signals from CALIOP are not reflected in the OMPS-LP or SAGE III/ISS measurements, see Fig. 7e. In part, this can be explained by a difference in vertical resolution, but as shown in Fig. 7a–d, these high extinction coefficients extend to broad vertical ranges that should allow for the detection of strong signals also by OMPS-LP and SAGE III/ISS.
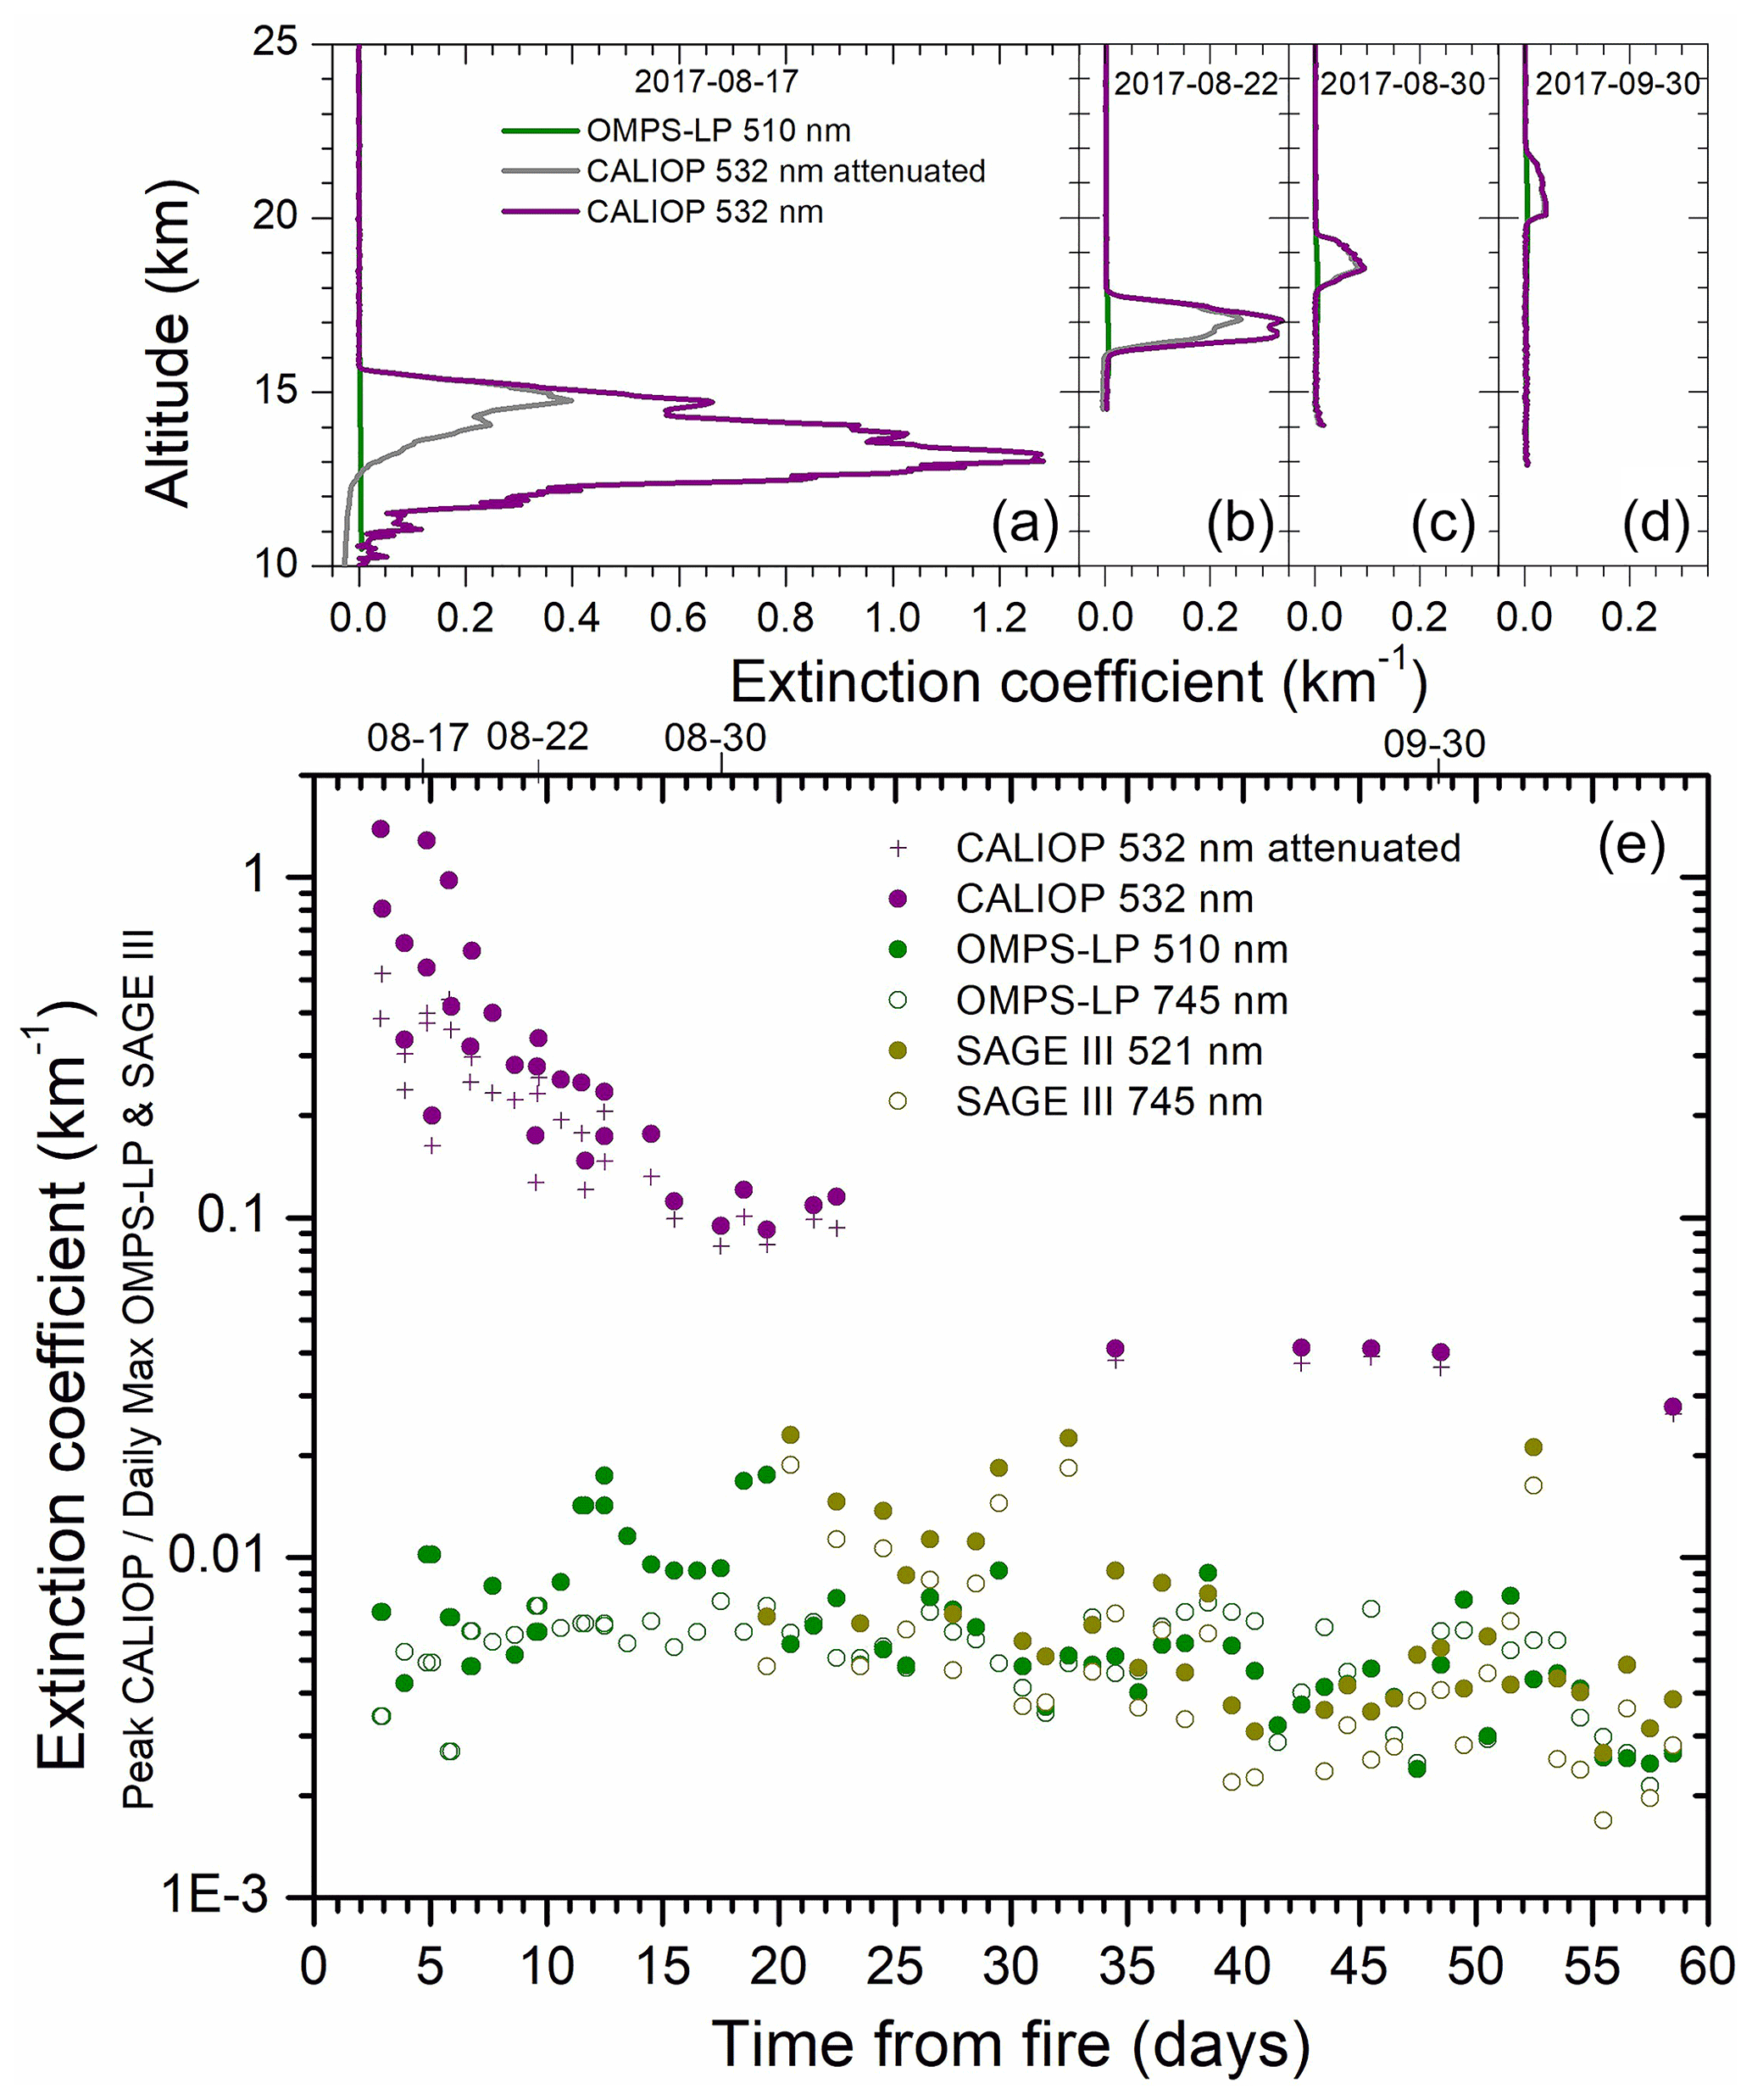
Figure 7Extinction coefficients according to CALIOP, OMPS-LP, and SAGE III/ISS in the 20–80∘ N latitude range during the first 60 d following the North American fire. (a–d) Selected profiles (attenuated and corrected for attenuation) from CALIOP compared with closest profiles according to OMPS-LP. (e) Peak extinction coefficient from selected CALIOP profiles compared with daily maximum extinction coefficients from OMPS-LP and SAGE III/ISS. Note that SAGE III/ISS data are missing the first 19 d because of irregular coverage of the latitude range of interest.
There is one principal difference between CALIOP on the one hand and OMPS-LP and SAGE III/ISS on the other hand: whereas the former is nadir-viewing (vertical), the last two methods operate in limb orientation (horizontal). This is important, because the horizontal extension of smoke layers is much larger, e.g., the smoke layer in Fig. 1b has a vertical extension of approximately 2 km, whereas the horizontal extension is approximately 700 km. The vertical, two-way transmission to the CALIOP sensor through this layer is approximately 0.01, which we correct for. The horizontal path through this layer is 350 times longer, implying that the one-way limb transmission becomes 10−350 for the same wavelength. Even if the horizontal extension would be just one-tenth the transmission is still as low as 10−35. Obviously, the radiation used for detection in OMPS-LP and SAGE III/ISS is rapidly eliminated in such smoke layers. Therefore, these two methods are inadequate for studies of dense aerosol layers. The upper limit in terms of vertical AOD is estimated to be 0.02 (SAGE III/ISS Users Guide, 2018), corresponding to the extinction coefficient of 0.02 km−1 for a 1 km thick layer. This problem is also acknowledged for OMPS-LP (Chen et al., 2018; DeLand, 2019) and has been pointed out for other limb-oriented satellite-based instruments (Fromm et al., 2014). Failure to properly handle this methodological shortcoming could seriously affect attempts to verify results by modeling (Lurton et al., 2018). Despite the clear limitation of OMPS-LP and SAGE III/ISS in this respect, the large body of information on wildfires is based on these methods, e.g., Bourassa et al. (2019), Das et al. (2021), Khaykin et al. (2020), Kloss et al. (2019), Torres et al. (2020), and Yu et al. (2019). By comparing with CALIOP, we here show that the limb-oriented techniques miss the dramatic events during the first 1–2 months after the fire. The rapid decline of the wildfire smoke will be further analyzed below.
3.4 Aerosol optical properties
To further investigate the unusual evolution of the AOD, we turn to the optical properties of the wildfire aerosol. The particle color and depolarization ratios are shown in Fig. 2b and c. The former is the ratio of backscattering at 1064 nm wavelength to that at 532 nm, where a smaller color ratio indicates smaller particles, and the latter is the ratio of perpendicularly polarized to total scattering at 532 nm, where a low ratio indicates particle shape close to spherical. To test the significance in the evolution, the data were temporally divided into two equal halves by number of data points, and geometric averages were formed (black lines in Fig. 2). The particle color ratio shows a highly significant decrease comparing the first to the last half of the data points, whereas the particle depolarization ratio increases with high significance. The change in the optical properties takes place up to 15–30 d after the fire. This coincides with the decline of the AOD, thus connecting a change of the aerosol properties to the AOD decline.
3.5 Stratospheric AOD variability caused by volcanism and wildfires
The stratospheric AOD varies considerably over time mainly due to influence from explosive volcanic eruptions as demonstrated in Fig. 8, showing the period 2008–2018. In this time span, nine volcanic eruptions clearly, but to varying degree, affected the stratospheric AOD. We also identify two cases of influence from wildfires: the Victoria fire (Australia, 2009) and the fire studied here (western North America in 2017). The residence time in the stratosphere varies from several years for tropical injections into the upper layer representing the upper branch in the Brewer–Dobson circulation (BD) (Fig. 8a), on the order of a year in the shallow branch of the BD circulation (Fig. 8b), to months in the LMS (Fig. 8c) (Friberg et al., 2018). The sum of the three layers is shown in Fig. 8d. The volcanic eruptions in these 11 years mainly affected the two lower stratospheric layers, only the Kelut eruption (2014) clearly reached the deep BD branch. Fire aerosol contains black carbon, which absorbs radiation, heats surrounding air, and induces lifting, as observed after the fire studied here (Khaykin et al., 2018; Yu et al., 2019). After both fires, we see weak AOD elevation in the deep BD branch (Fig. 8a), but for the fire studied here, the two lower layers dominate the AOD, like most of the volcanic eruptions in the 11-year period.
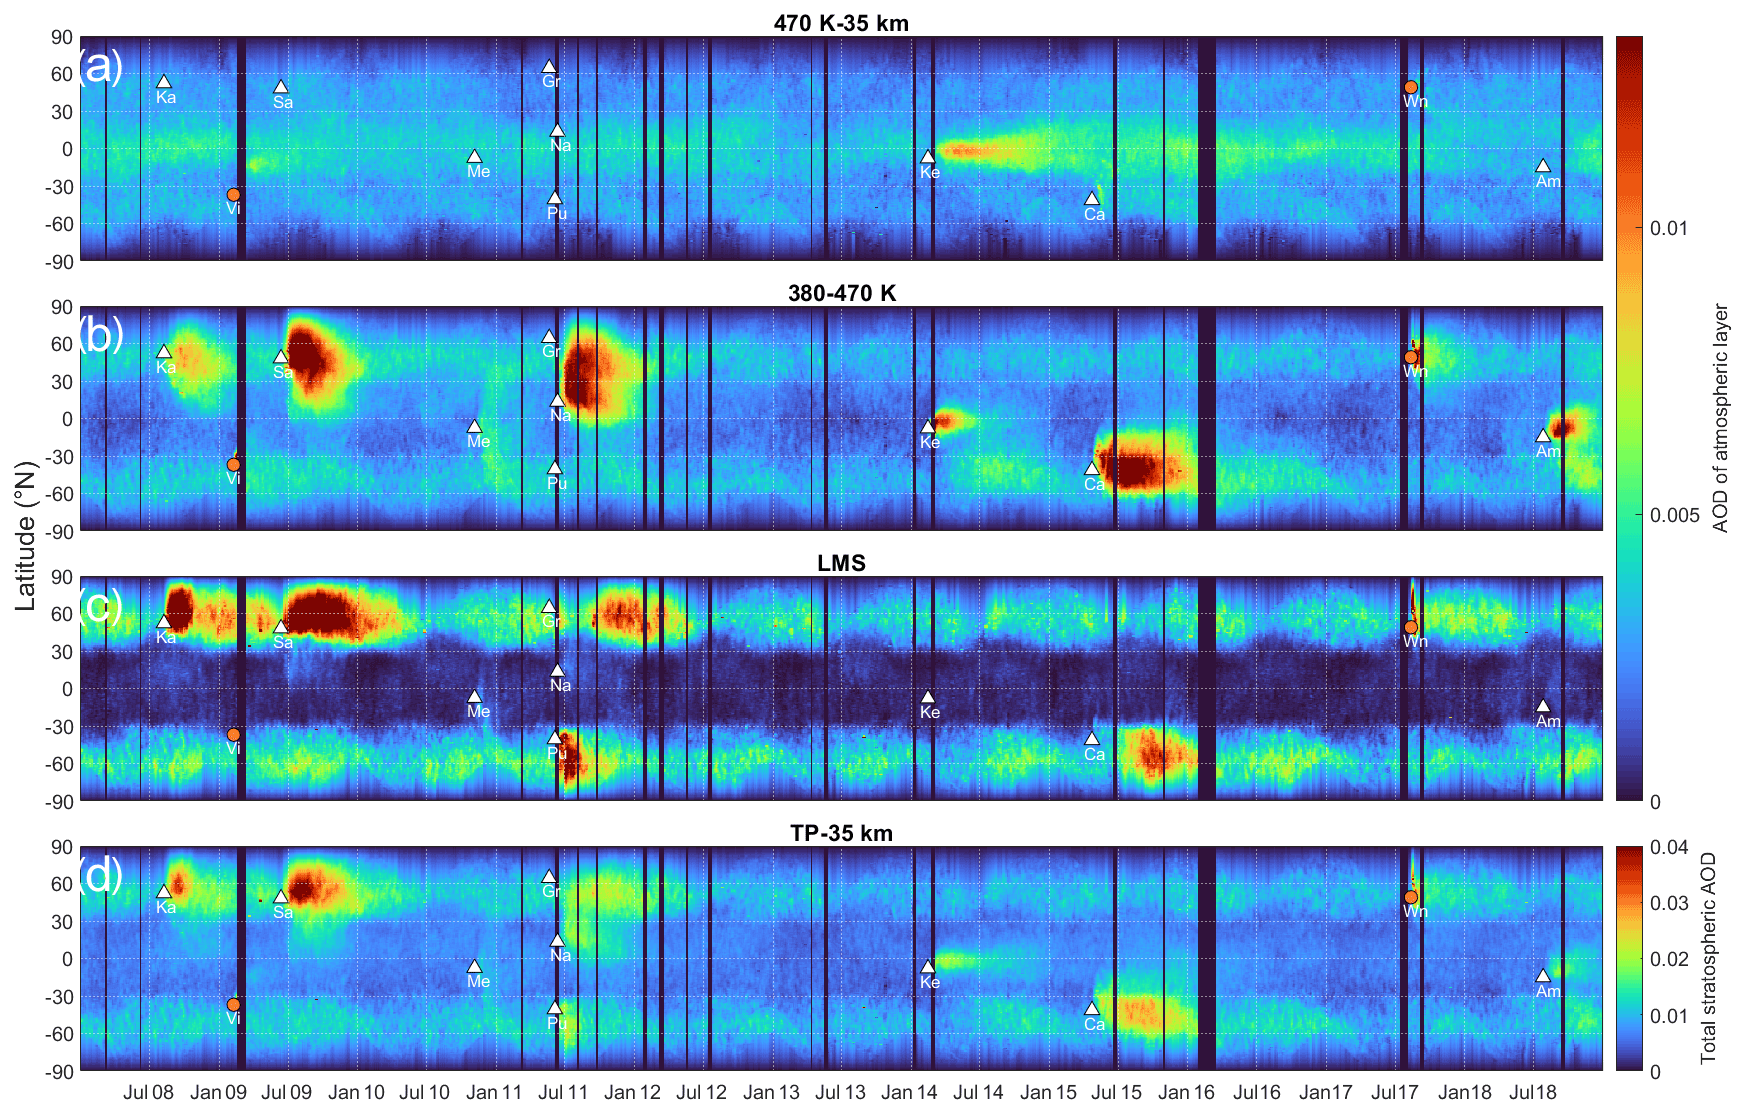
Figure 8Zonally and 8 d moving-average aerosol optical depth (AOD) of the stratosphere. (a–c) AOD in three layers obtained from CALIOP data (level 1B): (a) 470 K potential temperature to 35 km (deep Brewer–Dobson branch), (b) 380–470 K (shallow Brewer–Dobson branch), and (c) the tropopause to 380 K (LMS). (d) The total AOD from the tropopause to 35 km altitude. Volcanic eruptions are marked by white triangles – Kasatochi (Ka), Sarychev (Sa), Merapi (Me), Grimsvötn (Gr), Puyehue-Cordón Caulle (Pu), Nabro (Na), Kelut (Ke), Calbuco (Ca), and Ambae (Am) – and wildfires are marked by orange circles – Victoria fire (Vi) and western North American fires (Wn) at time and latitude of eruption/fire. The AODs are corrected for attenuation.
Comparing the evolution of the AOD of the North American wildfire with the evolution of the aerosol from two of the most important volcanic eruptions during the last 25 years (Fig. 9), we find that the maximum stratospheric AOD after the fire is similar to that after the 2011 Nabro and 2009 Sarychev eruptions. During the first couple of months after volcanic events, the AOD grows due to formation of condensable sulfuric acid from the emitted volcanic gas sulfur dioxide. In contrast, the wildfire aerosol displays a rapid decline during the first few weeks, before the AOD stabilizes (Fig. 9). This is followed by a period of rather stable AOD of more than 6 months, before the AOD evolution turns to a slower decline towards background conditions, with similar seasonality as the aerosol from the volcanic eruptions discussed (Fig. 9). This latter decline is mainly caused by springtime transport out from the stratosphere at mid and high latitudes (Bönisch et al., 2009; Martinsson et al., 2017).
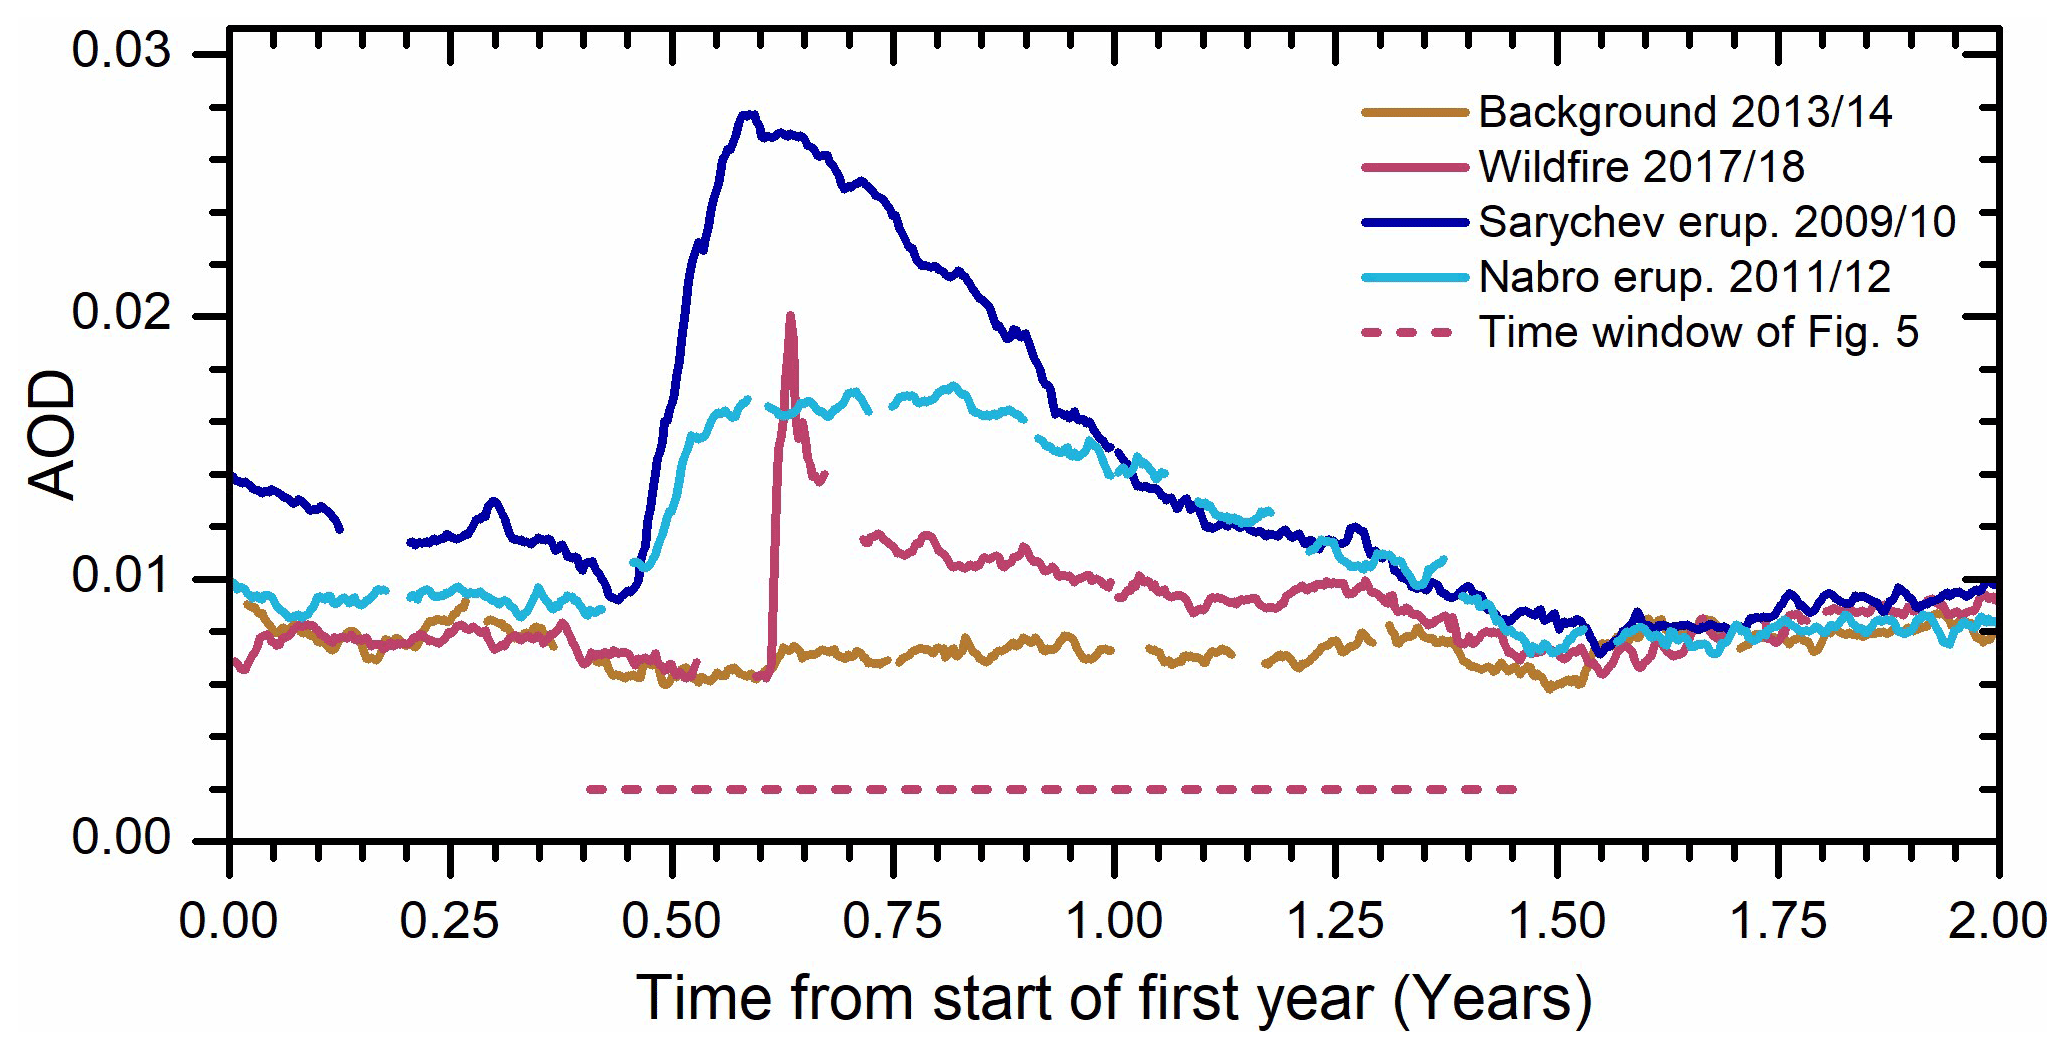
Figure 9Evolution of the AOD in the 20–80∘ N interval (8 d moving average) over 2 years; close to background conditions in the latitude interval studied (2013–2014), the year and the following year of the 12 August 2017 fire (2017–2018), and the same for two volcanic eruptions, the 12 June 2009 Sarychev (2009–2010) and 12 June 2011 Nabro (2011–2012) eruptions.
The smoke aerosol is distributed in both the LMS and in the lower BD branch like aerosol from several volcanic eruptions (Fig. 8). The rapid decline of the smoke aerosol during the first month after the fire thus cannot be explained by transport out of the stratosphere. Measurements with Raman lidars at three wavelengths indicate that the smoke from this North American fire contain an accumulation mode but no coarse mode (Haarig et al., 2018; Hu et al., 2019). To leave the extratropical stratosphere, particles must pass through the LMS. The influence from sedimentation on submicron-diameter particles is small at that level of the stratosphere; for example, for 0.6 µm diameter sulfuric acid/water particles, the sedimentation velocity is 0.15 km per month, which is slow compared to the large-scale transport down to the troposphere from the LMS (Martinsson et al., 2005). Moreover, the change in the particle depolarization ratio (Fig. 2c) indicates a change in the aerosol particle properties, and the particle color ratio decrease after the fire (Fig. 2b) is the expected outcome for reduced particle sizes. Based on these arguments, we turn our attention to loss of material from the aerosol particles to the gas phase to explain the rapid decrease in AOD seen in Fig. 5e.
Smoke layers contain water vapor that could induce hygroscopic growth or shrinkage. Water vapor profiles for individual smoke layers from days 6–60 after the fire were obtained from the MLS. Measurements close to the tropopause (Fig. 10a) are affected by a steep gradient in H2O concentration. The profiles well above the gradient peaking at atmospheric pressure of less than 110 hPa are shown in Fig. 10b. For the latter category, the peak H2O concentration is in the range 7–14 ppmv, implying a maximum H2O vapor pressure of 0.16 Pa. For typical conditions in the extratropics, such a vapor pressure corresponds to a relative humidity of a few percent or less (Murphy and Koop, 2005).

Figure 10Water vapor in the smoke layer. Microwave Limb Sounder (MLS) measurements of water vapor concentrations (ppmv) vs. atmospheric pressure for smoke layers (a) close to the tropopause and (b) well above the tropopause (atmospheric pressure <110 hPa at the H2O peak) for individual smoke layers available days 6–60 after the fire. (c) The peak scattering ratio (R) according to CALIOP divided by the peak water vapor concentration () from MLS. The full line is an exponential fit (R2=0.88, ) to smoke layers peaking in water vapor concentration at a pressure less than 110 hPa. The half-life of the fit is 9.7±3.2 d.
To further investigate the smoke layers, the temporal evolution of the composition is studied by forming the ratio of the mixing ratios of two components: aerosol backscattering and H2O at the peak of respective vertical distribution. As pointed out above, the strong H2O gradient around the tropopause affects the MLS measurements. But for the smoke layers higher up, peaking pressures below 110 hPa, we find a rapid decrease in the aerosol scattering ratio compared with the H2O concentration (Fig. 10c). Fitting an exponential function (), the half-life becomes 9.7±3.2 d, which is somewhat longer than that computed from the AOD (half-life of 6.5±0.9 d). The rapid AOD decline (Fig. 5e) is thus verified by relative concentrations of aerosol and H2O under well-controlled humidity conditions, where the low relative humidity rules out hygroscopic growth and influence from clouds as the explanation of the AOD decline.
The near-field wildfire aerosol contains, besides black carbon (Bond et al., 2013; Ditas et al., 2018), approximately 90 % organic material (Garofalo et al., 2019). After emission, secondary organic aerosol (SOA) is formed by oxidation of gas-phase compounds (Shrivastava et al., 2017). Knowledge of processes controlling formation and removal in the atmosphere is limited (Hodzic et al., 2016). Global aerosol models usually remove SOA mainly by wet (90 %) and, to a smaller extent, dry deposition (Tsigaridis et al., 2014). In contrast to the species dominating the stratospheric aerosol and its precursor compounds during background conditions and volcanic influence (sulfuric acid and sulfur dioxide), organic species are not the ultimate thermodynamically stable compounds (Hallquist et al., 2009). Organic aerosol is an intermediate state on routes, with little known rates, from emitted compositions to the highly oxidized gaseous products CO and CO2 (Jimenez et al., 2009). Modeling and numerous laboratory studies find evidence for photolytic removal rates of organic aerosol similar to that of wet deposition in the troposphere (Hodzic et al., 2016; Zawadowics et al., 2020). Recently, photolytic removal of particulate SOA was included in the Whole Atmosphere Community Climate Model (WACCM6) (Gettelman et al., 2019). Hodzic et al. (2015) estimate the photolytic loss over a 10 d period to 50 % for most organic species at mid-tropospheric conditions.
These high rates are disputed by Yu et al. (2019), claiming a lifetime of 150 d (half-life 104 d) of organic aerosol from the fire studied here, whereas Das et al. (2021) explain a similar half-life of the same fire by large-scale circulation and particle sedimentation using OMPS-LP and modeling. The experimental data used here cannot differentiate these two explanations, although the slow part of the smoke decline is similar in seasonality to that of volcanic aerosol (Fig. 9) where photochemical loss is less important. The modeling study by Yu et al. (2019) was based on mimicking the extinction according to SAGE III/ISS at 1020 nm wavelength at 18 km altitude. For three reasons, their study misses the strong decline of the AOD during the first month: firstly because the orbiting of ISS prohibits studies of the wildfire smoke on the first 19 d after the fire, secondly because the time required to transport the wildfire aerosol to 18 km altitude is approximately 1 month (Yu et al., 2019), and thirdly because of problems with event termination (saturation); see Fig. 7e. We therefore conclude that Yu et al. (2019) could not observe the main decline of the aerosol taking place during the first 1–2 months after the fire; see Sect. 3.3 for further details.
Submicron aerosol particles have much longer residence time in the stratosphere than in the troposphere due to sparsity of clouds, thus inhibiting the sink that traditionally is considered the most important in the troposphere, i.e., wet deposition. This provides unique possibilities to study photolytic loss without competition from other aerosol sinks. Interpreting the body of evidence on the strong and rapid decline of the stratospheric AOD during the first month after the fire, we find that photolytic loss of organic aerosol is a highly likely explanation. The rate of photolytic loss is likely better described by the evolution of than by the AOD, because the latter could, to some degree, be affected by transport across the tropopause. Our strong experimental evidence leads us to the hypothesis that the rapid decline of the wildfire aerosol in the stratosphere with a half-life of 10 d is caused by photochemical loss of organic material. This should be further investigated by modeling, but that is outside the scope of the present study.
To further put the strong early decline of wildfire aerosol into context, we compare the AOD during background conditions (years 2013 and 2014) with the year of the fire. When the contribution of the exponential term is very small for the wildfire aerosol (after seven half-lives), the background is approximately of the wildfire AOD (Fig. 9). Taking the background into account, the excess stratospheric aerosol due to the wildfire declines by 83 % from the value on day 10 after the fire. The process starts before day 10, indicating that almost all the organic aerosol constituting approximately 90 % of the near-field wildfire aerosol mass (Garofalo et al., 2019) could be lost by photolysis. Residual wildfire aerosol particles, likely stripped off by a large fraction of its original organic content, remain in the stratosphere up to approximately 1 year (Fig. 9).
Finally, we investigate the stratospheric aerosol load from the wildfire by comparing it with the more studied volcanic impact (Table 1). The AOD growth, the average AOD over 1 year from the fire/eruption subtracted by the average background AOD (2013–2014), is approximately and of that of two of the most important volcanic eruptions for the stratospheric aerosol in the last 25 years (Sarychev 2009, Nabro 2011). The average excess aerosol during the year following the fire corresponds to a radiative forcing of −0.06 W m−2 in the region 20–80∘ N, using standard conversion as an approximation (Solomon et al., 2011).
Table 1Maximum and yearly average stratospheric AOD during background conditions as well as during 1 year after the fire and after the two volcanic eruptions in Fig. 9.
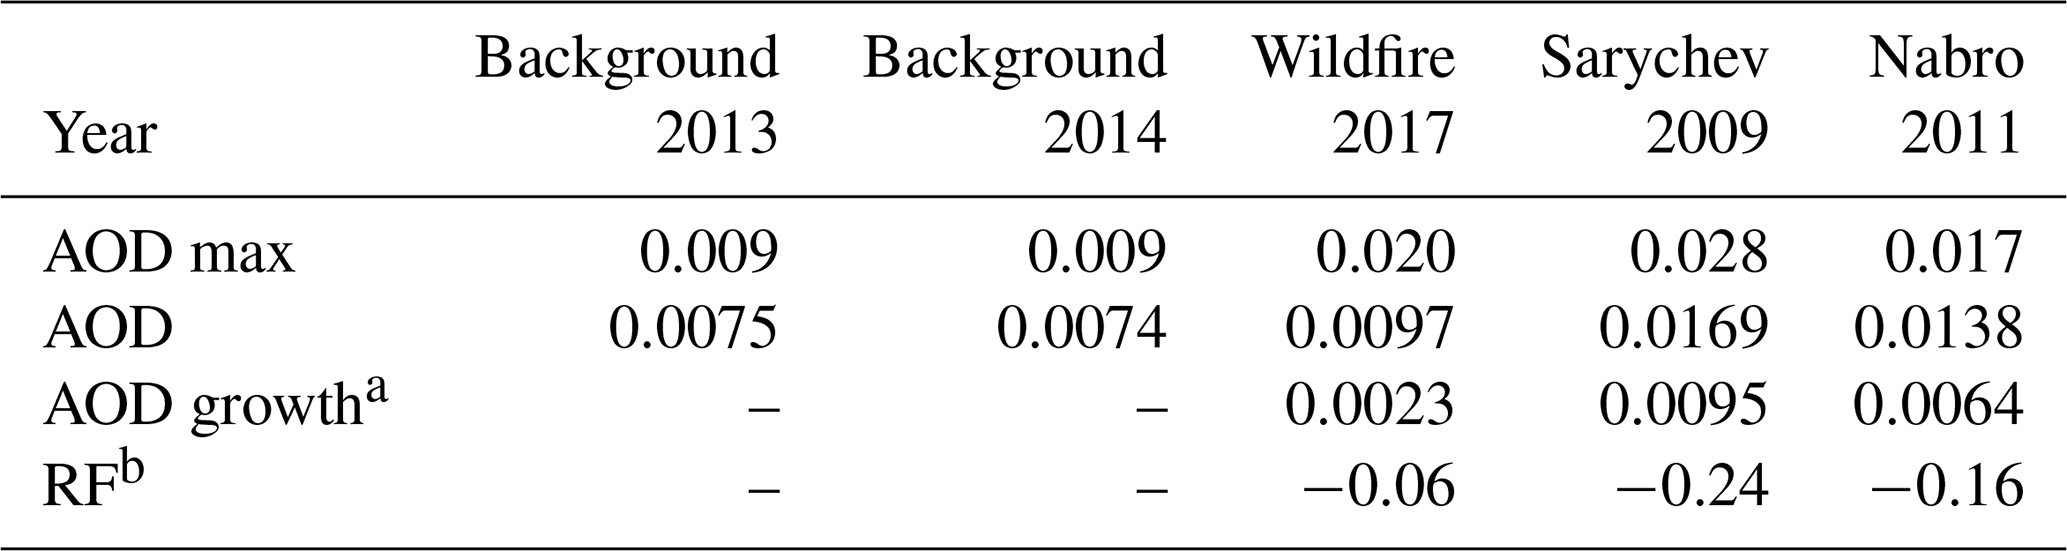
a Growth of AOD due to influence from wildfire or volcanism obtained by subtracting the average of 2013 and 2014 AOD. b Radiative forcing (W m−2) of the background-subtracted AOD.
In this study we investigate massive injections of smoke into the stratosphere from the August 2017 North American wildfires using five satellite sensors. A methodology was developed to correct CALIOP data for attenuation of the laser signal. The CALIOP AOD and extinction coefficients were compared with OMPS-LP and SAGE III/ISS. From 1–2 months after the fire, we find that OMPS-LP and CALIOP AOD agree very well at altitudes above the 380 K isentrope, where the former demonstrates high sensitivity with small statistical fluctuations. The methods differ dramatically during the first 1–2 months after the fire when the smoke layers are dense, because the long optical path through the smoke of the limb-oriented instruments OMPS-LP and SAGE III/ISS cause event termination (saturation). This is clearly demonstrated by the low daily maximum extinction coefficients of the two instruments, being orders of magnitude lower than the peak extinction coefficients of CALIOP. The nadir viewing CALIOP experiences a much shorter optical path, because the vertical extension of smoke layers is usually orders of magnitude shorter than that for limb orientation. We find that CALIOP is an indispensable tool for studies of dense smoke layers entering the stratosphere after intense wildfires, providing signal along the laser path that can be used to correct for attenuation. Once the smoke layers are sufficiently thin, the limb technique OMPS-LP provides sensitive measurements of the AOD that can be used together with CALIOP.
The AOD from the wildfire declines exponentially with a half-life of 6.5 d. This decline is further studied by the evolution of the ratio of the aerosol and water vapor mixing ratios of the smoke layers, resulting in a massive decline of 80 %–90 % of the wildfire aerosol with a half-life of approximately 10 d. We find transport out of the stratosphere, sedimentation, influence from clouds, or hygroscopic growth or shrinkage to be highly unlikely explanations for the rapid decline of wildfire aerosol in the stratosphere. Based on strong experimental evidence, we hypothesize that photochemical loss of organic aerosol causes the rapid decline, which would mean that almost the entire organic fraction of the wildfire aerosol would be lost in the exponential decline. The half-life according to this study agrees well with results from laboratory studies and global modeling. Our unique result could be obtained because of the long residence time of aerosol particles in the stratosphere, whereas tropospheric studies of photochemical loss are extremely difficult, because it is masked by SOA formation and short residence time due to wet deposition. The residual aerosol leaves the stratosphere within a year in the Brewer–Dobson circulation. Despite the initial loss, the long-term effects of wildfire smoke on the stratospheric AOD and radiative forcing are considerable. The ongoing climate change is projected to increase the frequency of wildfires, prompting the need for inclusion of wildfire impact on the stratospheric aerosol load in the climate models.
CALIOP V4.10 lidar data (https://search.earthdata.nasa.gov/search?fp=CALIPSO, Hostetler et al., 2006) are publicly available. The OMPS-NM UV aerosol index was obtained from the publicly available site: https://worldview.earthdata.nasa.gov/ (Torres, 2019). OMPS-LP stratospheric aerosol optical depths were obtained from https://disc.gsfc.nasa.gov/datasets/OMPS_NPP_LP_L2_AER_DAILY_2/summary (Taha, 2020). MLS water vapor concentrations were obtained from https://disc.gsfc.nasa.gov/datasets?page=1&keywords=ML2H2O_005 (Lambert er al., 2020). SAGE III/ISS aerosol data were obtained from https://asdc.larc.nasa.gov/project/SAGE%20III-ISS/g3bssp_51 (SAGE III/ISS User's Guide, 2018).
BGM designed the study, designed the methodology, undertook part of the data analysis, and wrote most of the paper. JF contributed to the design of the study, designed a methodology, did part of the data analysis, and wrote parts of the text. OSS contributed to the data analysis, and MKS contributed to the design of the methodology. In addition, all authors participated in discussions and commented on the manuscript.
The contact author has declared that neither they nor their co-authors have any competing interests.
Publisher's note: Copernicus Publications remains neutral with regard to jurisdictional claims in published maps and institutional affiliations.
Aerosol products from the CALIOP sensor and SAGE III/ISS were produced by NASA Langley Research Center. The official NASA aerosol index from the OMPS Nadir Mapper, the aerosol scattering from OMPS Limb Profiler and water vapor profiles from MLS are supplied by Goddard Earth Sciences Data and Information Services Center.
This research has been supported by the Svenska Forskningsrådet Formas (grant nos. 2018-00973, Swedish National Space Agency 130/15 and 104/17, and Crafoord Foundation 20190690).
This paper was edited by Bryan N. Duncan and reviewed by Hugh C. Pumphrey and one anonymous referee.
Ammann, C. M., Meehl, G. A., Washington, W. M., and Zender, C. S.: A monthly and latitudinally varying volcanic forcing dataset in simulations of 20th century climate, Geophys. Res. Lett., 30, 1567–1661, https://doi.org/10.1029/2003GL016875, 2003.
Andersson, S. M., Martinsson, B. G., Friberg, J., Brenninkmeijer, C. A. M., Rauthe-Schöch, A., Hermann, M., van Velthoven, P. F. J., and Zahn, A.: Composition and evolution of volcanic aerosol from eruptions of Kasatochi, Sarychev and Eyjafjallajökull in 2008–2010 based on CARIBIC observations, Atmos. Chem. Phys., 13, 1781–1796, https://doi.org/10.5194/acp-13-1781-2013, 2013.
Andersson, S. M., Martinsson, B. G., Vernier, J. P., Friberg, J., Brenninkmeijer, C. A. M., Hermann, M., Van Velthoven, P. F. J., and Zahn, A.: Significant radiative impact of volcanic aerosol in the lowermost stratosphere, Nat. Commun., 6, 7692, https://doi.org/10.1038/ncomms8692, 2015.
Ansmann, A., Baars, H., Chudnovsky, A., Mattis, I., Veselovskii, I., Haarig, M., Seifert, P., Engelmann, R., and Wandinger, U.: Extreme levels of Canadian wildfire smoke in the stratosphere over central Europe on 21–22 August 2017, Atmos. Chem. Phys., 18, 11831–11845, https://doi.org/10.5194/acp-18-11831-2018, 2018.
Baars, H., Ansmann, A., Ohneiser, K., Haarig, M., Engelmann, R., Althausen, D., Hanssen, I., Gausa, M., Pietruczuk, A., Szkop, A., Stachlewska, I. S., Wang, D., Reichardt, J., Skupin, A., Mattis, I., Trickl, T., Vogelmann, H., Navas-Guzmán, F., Haefele, A., Acheson, K., Ruth, A. A., Tatarov, B., Müller, D., Hu, Q., Podvin, T., Goloub, P., Veselovskii, I., Pietras, C., Haeffelin, M., Fréville, P., Sicard, M., Comerón, A., Fernández García, A. J., Molero Menéndez, F., Córdoba-Jabonero, C., Guerrero-Rascado, J. L., Alados-Arboledas, L., Bortoli, D., Costa, M. J., Dionisi, D., Liberti, G. L., Wang, X., Sannino, A., Papagiannopoulos, N., Boselli, A., Mona, L., D'Amico, G., Romano, S., Perrone, M. R., Belegante, L., Nicolae, D., Grigorov, I., Gialitaki, A., Amiridis, V., Soupiona, O., Papayannis, A., Mamouri, R.-E., Nisantzi, A., Heese, B., Hofer, J., Schechner, Y. Y., Wandinger, U., and Pappalardo, G.: The unprecedented 2017–2018 stratospheric smoke event: decay phase and aerosol properties observed with the EARLINET, Atmos. Chem. Phys., 19, 15183–15198, https://doi.org/10.5194/acp-19-15183-2019, 2019.
Bond, T. C., Doherty, S. J., Fahey, D., Forster, P., Berntsen, T., DeAngelo, B., Flanner, M., Ghan, S., Kärcher, B., and Koch, D.: Bounding the role of black carbon in the climate system: A scientific assessment, J. Geophys. Res.-Atmos., 118, 5380–5552, https://doi.org/10.1002/jgrd.50171, 2013.
Bönisch, H., Engel, A., Curtius, J., Birner, Th., and Hoor, P.: Quantifying transport into the lowermost stratosphere using simultaneous in-situ measurements of SF6 and CO2, Atmos. Chem. Phys., 9, 5905–5919, https://doi.org/10.5194/acp-9-5905-2009, 2009.
Bourssa, A. E., Rieger, L. A., Zawada, D. J., Khaykin, S., Thomason, L. W., and Degenstein, D. A.: Satellite Limb Observations of Unprecedented Forest Fire Aerosol in the Stratosphere, J Geophys. Res., 124, 9510–9519, https://doi.org/10.1029/2019JD030607, 2019.
Chen, Z., DeLand, M., and Bhartia, P. K.: A new algorithm for detecting cloud height using OMPS/LP measurements, Atmos. Meas. Tech., 9, 1239–1246, https://doi.org/10.5194/amt-9-1239-2016, 2016.
Chen, Z., Bhartia, P. K., Loughman, R., Colarco, P., and DeLand, M.: Improvement of stratospheric aerosol extinction retrieval from OMPS/LP using a new aerosol model, Atmos. Meas. Tech., 11, 6495–6509, https://doi.org/10.5194/amt-11-6495-2018, 2018.
Das, S., Colarco, P. R., Oman, L. D., Taha, G., and Torres, O.: The long-term transport and radiative impacts of the 2017 British Columbia pyrocumulonimbus smoke aerosols in the stratosphere, Atmos. Chem. Phys., 21, 12069–12090, https://doi.org/10.5194/acp-21-12069-2021, 2021.
DeLand, M.: Readme document for the Soumi-NPP OPMS LP L2 AER675 Daily product, Goddard Earth Sciences Data and Information Services Center (GES DISC), http://disc.gsfc.nasa.gov (last access: October 2021), 2019.
Dennison, P. E., Brewer, S. C., Amold, J. D., and Moritz, M. A.: Large wildfire trends in the western United States, 1984–2011, Geophys. Res. Lett., 41, 2928–2933, https://doi.org/10.1002/2014GL059576, 2014.
Ditas, J., Ma, N., Zhang, Y., Assmann, D., Neumaier, M., Riede, H., Karu, E., Williams, J., Scharffe, D., Wang, Q., Saturno, J., Schwarz, J. P., Katich, J. M., McMeeking, G. R., Zahn, A., Hermann, M., Brenninkmeijer, C. A. M., Andreae, M. O., Pöschl, U., Su, H., and Cheng, Y.: Strong impact of wildfires on the abundance and aging of black carbon in the lowermost stratosphere, P. Natl. Acad. Sci. USA, 115, E11595–E11603, https://doi.org/10.1073/pnas.1806868115, 2018.
Engel, A., Mobius, T., Bonisch, H., Schmidt, U., Heinz, R., Levin, I., Atlas, E., Aoki, S., Nakazawa, T., Sugawara, S., Moore, F., Hurst, D., Elkins, J., Schauffler, S., Andrews, A., and Boering, K.: Age of stratospheric air unchanged within uncertainties over the past 30 years, Nat. Geosci., 2, 28–31, https://doi.org/10.1038/NGEO388, 2009.
Friberg, J., Martinsson, B. G., Andersson, S. M., Brenninkmeijer, C. A. M., Hermann, M., Van Velthoven, P. F. J., and Zahn, A.: Sources of increase in lowermost stratospheric sulphurous and carbonaceous aerosol background concentrations during 1999–2008 derived from CARIBIC flights, Tellus B, 66, 23428, https://doi.org/10.3402/tellusb.v66.23428, 2014.
Friberg, J., Martinsson, B. G., Andersson, S. M., and Sandvik, O. S.: Volcanic impact on the climate – the stratospheric aerosol load in the period 2006–2015, Atmos. Chem. Phys., 18, 11149–11169, https://doi.org/10.5194/acp-18-11149-2018, 2018.
Fromm, M., Lindsey, D. T., Servranckx, R., Yue, G., Trickl, T., Sica, R., Doucet, P., and Godin-Beekmann, S.: The untold story of pyrocumulonimbus, B. Am. Meteorol. Soc., 91, 1193–1209, 2010.
Fromm, M., Kablick III, G., Nedoluha, G., Carboni, E., Grainger, R., Campbell, J., and Lewis, L.: Correcting the record of volcanic stratospheric aerosol impact: Nabro and Sarychev Peak, J. Geophys. Res.-Atmos., 119, 1–22, https://doi.org/10.1002/2014JD021507, 2014.
Fromm, M., Kablick III, G. P., Peterson, D. A., Kahn, R. A., Flower, V. J. B., and Seftor, C. J.: Quantifying the source term and uniqueness of the August 12, 2017 Pacific Northwest pyroCb event, J. Geophys. Res., 126, e2021JD034928, https://doi.org/10.1029/2021JD034928, 2021.
Fyfe, J. C., Meehl, G. A., England, M. H., Mann, M. E., Santer, B. D., Flato, G. M., Hawkins, E., Gillett, N. P., Xie, S. P., Kosaka, Y., and Swart, N. C.: Making sense of the early-2000s warming slowdown, Nat. Clim. Change, 6, 224–228, 2016.
Garofalo, L. A., Levin, E. J. T., Campos, T., Kreidenweis, S. N., and Farmer, D. K.: Emission and evolution of submicron organic aerosol in smoke from wild fires in the western United States, ACS Space Chem., 3, 1237–1247, 2019.
Gettelman, A., Mills, M. J., Kinnison, D. E., Garcia, R. R., Smith, A. K., Marsh, D. R., Tilmes, S., Vitt, F., Bardeen, C. G., McInerny, J., Liu, H.-L., Solomon, S. C., Polvani, L. M. Emmons, L. K., Lamarque, J.-F., Richter, J. H., Glanville, A. S., Bacmeister, J. T., Phillips, A. S., Neale, R. B., Simpson, I. R., DuVivier, A. K., Hodzic, A., and Randel, W. J.: The Whole Atmosphere Community Climate Model Version 6 (WACCM6), J. Geophys. Res., 124, 12380–12403, https://doi.org/10.1029/2019JD030943, 2019.
Haarig, M., Ansmann, A., Baars, H., Jimenez, C., Veselovskii, I., Engelmann, R., and Althausen, D.: Depolarization and lidar ratios at 355, 532, and 1064 nm and microphysical properties of aged tropospheric and stratospheric Canadian wildfire smoke, Atmos. Chem. Phys., 18, 11847–11861, https://doi.org/10.5194/acp-18-11847-2018, 2018.
Hallquist, M., Wenger, J. C., Baltensperger, U., Rudich, Y., Simpson, D., Claeys, M., Dommen, J., Donahue, N. M., George, C., Goldstein, A. H., Hamilton, J. F., Herrmann, H., Hoffmann, T., Iinuma, Y., Jang, M., Jenkin, M. E., Jimenez, J. L., Kiendler-Scharr, A., Maenhaut, W., McFiggans, G., Mentel, Th. F., Monod, A., Prévôt, A. S. H., Seinfeld, J. H., Surratt, J. D., Szmigielski, R., and Wildt, J.: The formation, properties and impact of secondary organic aerosol: current and emerging issues, Atmos. Chem. Phys., 9, 5155–5236, https://doi.org/10.5194/acp-9-5155-2009, 2009.
Herman, J. R., Bhartia, P., Torres, O., Hsu, C., Seftor, C., and Celarier, E.: Global distribution of UV-absorbing aerosols from Nimbus 7/TOMS data, J. Geophys. Res., 102, 16911–16922, 1997.
Hodzic, A., Madronich, S., Kasibhatla, P. S., Tyndall, G., Aumont, B., Jimenez, J. L., Lee-Taylor, J., and Orlando, J.: Organic photolysis reactions in tropospheric aerosols: effect on secondary organic aerosol formation and lifetime, Atmos. Chem. Phys., 15, 9253–9269, https://doi.org/10.5194/acp-15-9253-2015, 2015.
Hodzic, A., Kasibhatla, P. S., Jo, D. S., Cappa, C. D., Jimenez, J. L., Madronich, S., and Park, R. J.: Rethinking the global secondary organic aerosol (SOA) budget: stronger production, faster removal, shorter lifetime, Atmos. Chem. Phys., 16, 7917–7941, https://doi.org/10.5194/acp-16-7917-2016, 2016.
Hostetler, C. A., Liu, Z., Reagan, J., Vaughan, M., Winker, D., Osborn, M., Hunt, W. H., Powell, K. A., and Trepte, C.: CALIOP algorithm theoretical basis document part 1: Calibration and level 1 data products, https://www-calipso.larc.nasa.gov/resources/pdfs/PC-SCI-201v1.0.pdf (last access: February 2021), 2006.
Hu, Q., Goloub, P., Veselovskii, I., Bravo-Aranda, J.-A., Popovici, I. E., Podvin, T., Haeffelin, M., Lopatin, A., Dubovik, O., Pietras, C., Huang, X., Torres, B., and Chen, C.: Long-range-transported Canadian smoke plumes in the lower stratosphere over northern France, Atmos. Chem. Phys., 19, 1173–1193, https://doi.org/10.5194/acp-19-1173-2019, 2019.
Jäger, H. and Deshler, T.: Erratum: Lidar backscatter to extinction, mass and area conversions based on balloonborne aerosol measurements, Geophys. Res. Lett., 22, 1729–1732, https://doi.org/10.1029/2003GL017189, 2003.
Jaross, G., Bhartia, P. K., Chen, G., Kowitt, M., Haken, M., Chen, Z., Xu, P., Warner, J., and Kelly, T.: OMPS Limb Profiler instrument performance assessment, J. Geophys. Res.-Atmos., 119, 4399–4412, https://doi.org/10.1002/2013JD020482, 2014.
Jimenez, J. L., Canagaratna, M. R., Donahue, N. M., Prevot, A. S. H., Zhang, Q., Kroll, J. H., DeCarlo, P. F., Allan, J. D., Coe, H., Ng, N. L., Aiken, A. C., Docherty, K. S., Ulbrich, I. M., Grieshop, A. P., Robinson, A. L., Duplissy, J., Smith, J. D., Wilson, K. R., Lanz, V. A., Hueglin, C., Sun, Y. L., Tian, J., Laaksonen, A., Raatikainen, T., Rautiainen, J., Vaattovaara, P., Ehn, M., Kulmala, M., Tomlinson, J. M., Collins, D. R., Cubison, M. J., Dunlea, E. J., Huffman, J. A., Onasch, T. B., Alfarra, M. R., Williams, P. I., Bower, K., Kondo, Y., Schneider, J., Drewnick, F., Borrmann, S., Weimer, S., Demerjian, K., Salcedo, D., Cottrell, L., Griffin, R., Takami, A., Miyoshi, T., Hatakeyama, S., Shimono, A., Sun, J. Y., Zhang, Y. M., Dzepina, K., Kimmel, J. R., Sueper, D., Jayne, J. T., Herndon, S. C., Trimborn, A. M., Williams, L. R., Wood, E. C., Middlebrook, A. M., Kolb, C. E., Baltensperger, U., and Worsnop, D. R.: Evolution of organic aerosol in the atmosphere, Science, 326, 1525–1529, 2009.
Kablick III, G. P., Allen, D. R., Fromm, M. D., and Nedoluha, G. E.: Australian pyroCb smoke Generates synoptic-scale stratospheric anticyclones, Geophys. Res. Lett., 47, 1–9, https://doi.org/10.1029/2020GL088101, 2020.
Kasischke, E. S. and Turetsky, M. R.: Recent changes in the fire regime across the North American boreal region – Spatial and temporal patterns of burning across Canada and Alaska, Geophys. Res. Lett., 33, L09703, https://doi.org/10.1029/2006GL025677, 2006.
Khaykin, S., Legras, B., Bucci, S., Sellitto, P., Isaksen, L., Tencé, F., Bekki, S., Bourassa, A., Rieger, L., Zawada, D., Jumelet, J., and Godin-Beekmann, S.: The 2019/20 Australian wildfires generated a persistent smoke-charged vortex rising up to 35 km altitude, Commun. Earth Environ., 1, 1–22, https://doi.org/10.1038/s43247-020-00022-5, 2020.
Khaykin, S. M., Godin-Beekmann, S., Hauchecorne, A., Pelon, J., Ravetta, F., and Keckhut, P.: Stratospheric smoke with unprecedentedly high backscatter observed by lidars above southern France, Geophys. Res. Lett., 45, 1639–1646, https://doi.org/10.1002/2017GL076763, 2018.
Kloss, C., Berthet, G., Sellitto, P., Ploeger, F., Bucci, S., Khaykin, S., Jégou, F., Taha, G., Thomason, L. W., Barret, B., Le Flochmoen, E., von Hobe, M., Bossolasco, A., Bègue, N., and Legras, B.: Transport of the 2017 Canadian wildfire plume to the tropics via the Asian monsoon circulation, Atmos. Chem. Phys., 19, 13547–13567, https://doi.org/10.5194/acp-19-13547-2019, 2019.
Kremser, S., Thomason, L. W., von Hobe, M., Hermann, M., Deshler, T., Timmreck, C., Toohey, M., Stenke, A., Schwarz, J. P., Weigel, R., Fueglistaler, S., Prata, F. J., Vernier, J. P., Schlager, H., Barnes, J. E., Antuña-Marrero, J. C., Fairlie, D., Palm, M., Mahieu, E., Notholt, J., Rex, M., Bingen, C., Vanhellemont, F., Bourassa, A., Plane, J. M. C., Klocke, D., Carn, S. A., Clarisse, L., Trickl, T., Neely, R., James, A. D., Rieger, L., Wilson, J. C., and Meland, B.: Stratospheric aerosol – Observations, processes, and impact on climate, Rev. Geophys., 54, 278–335, https://doi.org/10.1002/2015RG000511, 2016.
Lambert, A., Read, W., and Livesey, N.: MLS/Aura Level 2 Water Vapor (H2O) Mixing Ratio V005, Greenbelt, MD, USA, Goddard Earth Sciences Data and Information Services Center (GES DISC), https://doi.org/10.5067/Aura/MLS/DATA2508, 2020.
L'Ecuyr, T. S. and Jiang, J. H.: Touring the atmosphere aboard the A-Train, Phys. Today, 63, 36–41, https://doi.org/10.1063/1.3463626, 2010.
Lestrelin, H., Legras, B., Podglajen, A., and Salihoglu, M.: Smoke-charged vortices in the stratosphere generated by wildfires and their behaviour in both hemispheres: comparing Australia 2020 to Canada 2017, Atmos. Chem. Phys., 21, 7113–7134, https://doi.org/10.5194/acp-21-7113-2021, 2021.
Livesey, N. J., Read, W. G., Wagner, P. A., Froidevaux, L., Santee, M. L., Schwartz, M. J., Lambert, A., Manney, G. L., Valle, L. F. M., Pumphrey, H. C., Fuller, R. A., Jarnot, R. F., Knosp, B. W., and Lay, R. R.: EOS MLS Version 5.0x Level 2 and 3 data quality and description document, Tech. rep., Jet Propulsion Laboratory D734 105336 Rev. A, https://mls.jpl.nasa.gov/publications (last access: May 2021), 2020.
Loughman, R., Flittner, D., Nyaku, E., and Bhartia, P. K.: Gauss–Seidel limb scattering (GSLS) radiative transfer model development in support of the Ozone Mapping and Profiler Suite (OMPS) limb profiler mission, Atmos. Chem. Phys., 15, 3007–3020, https://doi.org/10.5194/acp-15-3007-2015, 2015.
Loughman, R., Bhartia, P. K., Chen, Z., Xu, P., Nyaku, E., and Taha, G.: The Ozone Mapping and Profiler Suite (OMPS) Limb Profiler (LP) Version 1 aerosol extinction retrieval algorithm: theoretical basis, Atmos. Meas. Tech., 11, 2633–2651, https://doi.org/10.5194/amt-11-2633-2018, 2018.
Lurton, T., Jégou, F., Berthet, G., Renard, J.-B., Clarisse, L., Schmidt, A., Brogniez, C., and Roberts, T. J.: Model simulations of the chemical and aerosol microphysical evolution of the Sarychev Peak 2009 eruption cloud compared to in situ and satellite observations, Atmos. Chem. Phys., 18, 3223–3247, https://doi.org/10.5194/acp-18-3223-2018, 2018.
Martinsson, B. G., Nguyen, H. N., Brenninkmeijer, C. A. M., Zahn, A., Heintzenberg, J., Hermann, M., and van Velthoven, P. F. J.: Characteristics and origin of lowermost stratospheric aerosol at northern midlatitudes under volcanically quiescent conditions based on CARIBIC observations, J. Geophys. Res., 110, D12201, https://doi.org/10.1029/2004JD005644, 2005.
Martinsson, B. G., Brenninkmeijer, C. A. M., Carn, S. A., Hermann, M., Heue, K. P., van Velthoven, P. F. J., and Zahn, A.: Influence of the 2008 Kasatochi volcanic eruption on sulfurous and carbonaceous aerosol constituents in the lower stratosphere, Geophys. Res. Lett., 36, L12813, https://doi.org/10.1029/2009GL038735, 2009.
Martinsson, B. G., Friberg, J., Sandvik, O. S., Hermann, M., van Velthoven, P. F. J., and Zahn, A.: Particulate sulfur in the upper troposphere and lowermost stratosphere – sources and climate forcing, Atmos. Chem. Phys., 17, 10937–10953, https://doi.org/10.5194/acp-17-10937-2017, 2017.
Martinsson, B. G., Friberg, J., Sandvik, O. S., Hermann, M., van Velthoven, P. F. J., and Zahn, A.: Formation and composition of the UTLS aerosol, Npj Climate and Atmospheric Science, 2, 1–6, https://doi.org/10.1038/s41612-019-0097-1, 2019.
Medhaug, I., Stolpe, M. B., Fischer, E. M., and Knutti, R.: Reconciling controversies about the “global warming hiatus”, Nature, 545, 41–47, 2017.
Molina, M. J., Ivanov, A. V., Trakhtenberg, S., and Molina, L. T.: Atmospheric evolution of organic aerosol, Geophys. Res. Lett., 31, L22104, https://doi.org/10.1029/2004GL020910, 2004.
Murphy, D. M. and Koop, T.: Review of the vapour pressures of ice and supercooled water for atmospheric applications, Q. J. Roy. Meteor. Soc., 131, 1539–1565, https://doi.org/10.1256/qj.04.94, 2005.
Murphy, D. M., Cziczo, D. J., Hudson, P. K., and Thomson, D. S.: Carbonaceous material in aerosol particles in the lower stratosphere and tropopause region, J. Geophys. Res., 112, D04203, https://doi.org/10.1029/2006JD007297, 2007.
Myhre, G., Shindell, D., Bréon, F.-M., Collins, W., Fuglestvedt, J., Huang, J., Koch, D., Lamarque, J.-F., Lee, D., Mendoza, B., Nakajima, T., Robock, A., Stephens, G., Takemura, T., and Zhang, H.: Anthropogenic and Natural Radiative Forcing, in: Climate Change 2013: The Physical Science Basis. Contribution of Working Group I to the Fifth Assessment Report of the Intergovernmental Panel on Climate Change, edited by: Stocker, T. F., Qin, D., Plattner, G.-K., Tignor, M., Allen, S. K., Boschung, J., Nauels, A., Xia, Y., Bex, V., and Midgley, P. M., Cambridge University Press, Cambridge, United Kingdom and New York, NY, USA, 2013.
Peterson, D. A., Campbell, J. R., Hyer, E. J., Fromm, M. D., Kablick, G. P., Cossuth, J. H., and DeLand, M. T.: Wildfire-driven thunderstorms cause a volcano-like stratospheric injection of smoke, Npj Climate and Atmospheric Science, 1, 30, https://doi.org/10.1038/s41612-018-0039-3, 2018.
Prata, A. T., Young, S. A., Siems, S. T., and Manton, M. J.: Lidar ratios of stratospheric volcanic ash and sulfate aerosols retrieved from CALIOP measurements, Atmos. Chem. Phys., 17, 8599–8618, https://doi.org/10.5194/acp-17-8599-2017, 2017.
Pumphrey, H. C., Schwartz, M. J., Santee, M. L., Kablick III, G. P., Fromm, M. D., and Livesey, N. J.: Microwave Limb Sounder (MLS) observations of biomass burning products in the stratosphere from Canadian forest fires in August 2017, Atmos. Chem. Phys., 21, 16645–16659, https://doi.org/10.5194/acp-21-16645-2021, 2021.
Rault, D. F. and Loughman, R. P.: The OMPS Limb Profiler Environmental Data Record Algorithm Theoretical Basis Document and Expected Performance, IEEE T. Geosci. Remote, 51, 2505–2527, 2013.
SAGE III/ISS Users Guide: Stratospheric Aerosol and Gas Experiment on the International Space Station (SAGE III/ISS), Data Products User's Guide, Version 2.0, Atmospheric Science Data Center, http://eosweb.larc.nasa.gov (last access: 10 November 2021), 2018.
Santer, B. D., Bonfils, C., Painter, J. F., Zelinka, M. D., Mears, C., Solomon, S., Schmidt, G. A., Fyfe, J. C., Cole, J. N. S., Nazarenko, L., Taylor, K. E., and Wentz, F. J.: Volcanic contribution to decadal changes in tropospheric temperature, Nat. Geosci., 7, 185–189, 2014.
Sareen, N., Moussa, S. G., and McNeill, V. F.: Photochemical aging of light-absorbing secondary organic aerosol material, J. Phys. Chem. A, 117, 2987–2996, 2013.
Shrivastava, M., Cappa, C. D., Fan, J., Goldstein, A. H., Guenther, A. B., Jimenez, J. L., Kuang, C., Laskin, A., Martin, S. T., Ng, N. L., Petaja, T., Pierce, J. R., Rasch, P. J., Roldin, P., Seinfeld, J. H., Shilling, J., Smith, J. N., Thornton, J. A., Volkamer, R., Wang, J., Worsnop, D. R., Zaveri, R. A., Zelenyuk, A., and Zhang, Q.: Recent advances in understanding secondary organic aerosol: Implications for global climate forcing, Rev. Geophys., 55, 509–559, 2017.
Solomon, S., Daniel, J. S., Neely, R. R., Vernier, J.-P., Dutton, E. G., and Thomason, L. W.: The persistently variable “background” stratospheric aerosol layer and global climate change, Science, 333, 866–870, 2011.
Stothers, R. B.: Three centuries of observation of stratospheric transparency, Climatic Change, 83, 515–521, https://doi.org/10.1007/s10584-007-9238-3, 2007.
Taha, G.: OMPS-NPP L2 LP Aerosol Extinction Vertical Profile swath daily 3slit V2, Greenbelt, MD, USA, Goddard Earth Sciences Data and Information Services Center (GES DISC), https://doi.org/10.5067/CX2B9NW6FI27, 2020.
Torres, O.: OMPS-NPP L2 NM Aerosol Index swath orbital V2.1.1, Greenbelt, MD, USA, Goddard Earth Sciences Data and Information Services Center (GES DISC), https://doi.org/10.5067/40L92G8144IV, 2019.
Torres, O., Bhartia, P. K., Taha, G., Jethva, H., Das, S., Colarco, P., Krotkov, N., Omar, A., and Ahn, C.: Stratospheric Injection of Massive Smoke Plume From Canadian Boreal Fires in 2017 as Seen by DSCOVR-EPIC, CALIOP, and OMPS-LP Observations, J. Geophys. Res., 125, e2020JD032579, https://doi.org/10.1029/2020JD032579, 2020.
Tsigaridis, K., Daskalakis, N., Kanakidou, M., Adams, P. J., Artaxo, P., Bahadur, R., Balkanski, Y., Bauer, S. E., Bellouin, N., Benedetti, A., Bergman, T., Berntsen, T. K., Beukes, J. P., Bian, H., Carslaw, K. S., Chin, M., Curci, G., Diehl, T., Easter, R. C., Ghan, S. J., Gong, S. L., Hodzic, A., Hoyle, C. R., Iversen, T., Jathar, S., Jimenez, J. L., Kaiser, J. W., Kirkevåg, A., Koch, D., Kokkola, H., Lee, Y. H., Lin, G., Liu, X., Luo, G., Ma, X., Mann, G. W., Mihalopoulos, N., Morcrette, J.-J., Müller, J.-F., Myhre, G., Myriokefalitakis, S., Ng, N. L., O'Donnell, D., Penner, J. E., Pozzoli, L., Pringle, K. J., Russell, L. M., Schulz, M., Sciare, J., Seland, Ø., Shindell, D. T., Sillman, S., Skeie, R. B., Spracklen, D., Stavrakou, T., Steenrod, S. D., Takemura, T., Tiitta, P., Tilmes, S., Tost, H., van Noije, T., van Zyl, P. G., von Salzen, K., Yu, F., Wang, Z., Wang, Z., Zaveri, R. A., Zhang, H., Zhang, K., Zhang, Q., and Zhang, X.: The AeroCom evaluation and intercomparison of organic aerosol in global models, Atmos. Chem. Phys., 14, 10845–10895, https://doi.org/10.5194/acp-14-10845-2014, 2014.
Vernier, J.-P., Pommereau, J.-P., Garnier, A., Pelon, J., Larsen, N., Nielsen, J., Christensen, T., Cairo, F., Thomason, L. W., Leblanc, T., and McDermid, I. S.: Tropical stratospheric aerosol layer from CALIPSO lidar observations, J. Geophys. Res., 114, D00H10, https://doi.org/10.1029/2009JD011946, 2009.
Vernier, J.-P., Thomason, L. W., Pommereau, J. P., Bourassa, A., Pelon, J., Garnier, A., Hauchecorne, A., Blanot, L., Trepte, C., Degenstein, D., and Vargas, F.: Major influence of tropical volcanic eruptions on the stratospheric aerosol layer during the last decade, Geophys. Res. Lett., 38, 1–8, https://doi.org/10.1029/2011GL047563, 2011.
Wandinger, U., Tesche, M., Seifert, P., Ansmann, A., Muller, D., and Althausen, D.: Size matters: Influence of multiple scattering on CALIPSO light-extinction profiling in dessert dust, Geophys. Res. Lett., 37, L10801, https://doi.org/10.1029/2010GL042815, 2010.
Waters, J. W., Froidevaux, L., Harwood, R., Jarnot, R., Pickett, H., Read, W., Siegel, P., Cofield, R., Filipiak, M., Flower, D., Holden, J., Lau, G., Livesey, N., Manney, G., Pumphrey, H., Santee, M., Wu, D., Cuddy, D., Lay, R., Loo, M., Perun, V., Schwartz, M., Stek, P., Thurstans, R., Boyles, M., Chandra, S., Chavez, M., Chen, G.-S., Chudasama, B., Dodge, R., Fuller, R., Girard, M., Jiang, J., Jiang, Y., Knosp, B., LaBelle, R., Lam, J., Lee, K., Miller, D., Oswald, J., Patel, N., Pukala, D., Quintero, O., Scaff, D., Snyder, W., Tope, M., Wagner, P., and Walch, M.: The earth observing system microwave limb sounder (EOS MLS) on the Aura satellite, IEEE T. Geosci. Remote, 44, 1106–1121, 2006.
Winker, D. M., Hunt, W. H., and McGill, M. J.: Initial performance assessment of CALIOP, Geophys. Res. Lett., 34, 1–5, https://doi.org/10.1029/2007GL030135, 2007.
Winker, D. M., Pelon, J., Coakley, J. A., Ackerman, S. A., Charlson, R. J., Colarco, P. R., Flamant, P., Fu, Q., Hoff, R. M., Kittaka, C., Kubar, T. L., Le Treut, H., McCormick, M. P., Mégie, G., Poole, L., Powell, K., Trepte, K., Vaughan, M. A., and Wielicki, B. A.: The CALIPSO mission – A global 3D view of aerosols and clouds, B. Am. Meteorol. Soc., 91, 1211–1229, https://doi.org/10.1175/2010BAMS3009.1, 2010.
Yu, P., Toon, O. B., Bardeen, C. G., Zhu, Y., Rosenlof, K. H., Portmann, R. W., Thornberry, T. D., Gao, R. S., Davis, S. M., Wolf, E. T., de Gouw, J., Peterson, D. A., Fromm, M. D., and Robock, A.: Black carbon lofts wildfire smoke high into the stratosphere to form a persistent plume, Science, 365, 587–590, 2019.
Zawadowics, M. A., Lee, B. H., Shrivastava, M., Zelenyuk, A., Zaveri, R. A., Flynn, C., Thornton, J. A., and Shilling, J. E.: Photolysis Controls Atmospheric Budgets of Biogenic Secondary Organic Aerosol, Environ. Sci. Technol., 54, 3861–3870, 2020.