the Creative Commons Attribution 4.0 License.
the Creative Commons Attribution 4.0 License.
 | 28 Mar 2022
Pollen observations at four EARLINET stations during the ACTRIS-COVID-19 campaign
Holger Baars
Iwona S. Stachlewska
Ina Mattis
Mika Komppula
Lidar observations were analysed to characterize atmospheric pollen at four EARLINET (European Aerosol Research Lidar Network) stations (Hohenpeißenberg, Germany; Kuopio, Finland; Leipzig, Germany; and Warsaw, Poland) during the ACTRIS (Aerosol, Clouds and Trace Gases Research Infrastructure) COVID-19 campaign in May 2020. The reanalysis (fully quality-assured) lidar data products, after the centralized and automatic data processing with the Single Calculus Chain (SCC), were used in this study, focusing on particle backscatter coefficients at 355 and 532 nm and particle linear depolarization ratios (PDRs) at 532 nm. A novel method for the characterization of the pure pollen depolarization ratio was presented, based on the non-linear least square regression fitting using lidar-derived backscatter-related Ångström exponents (BAEs) and PDRs. Under the assumption that the BAE between 355 and 532 nm should be zero (±0.5) for pure pollen, the pollen depolarization ratios were estimated: for Kuopio and Warsaw stations, the pollen depolarization ratios at 532 nm were of 0.24 (0.19–0.28) during the birch-dominant pollen periods, whereas for Hohenpeißenberg and Leipzig stations, the pollen depolarization ratios of 0.21 (0.15–0.27) and 0.20 (0.15–0.25) were observed for periods of mixture of birch and grass pollen. The method was also applied for the aerosol classification, using two case examples from the campaign periods; the different pollen types (or pollen mixtures) were identified at Warsaw station, and dust and pollen were classified at Hohenpeißenberg station.
- Article
(3994 KB) - Full-text XML
-
Supplement
(1544 KB) - BibTeX
- EndNote


Pollen is recognized as one of the major agents of allergy-related diseases, such as asthma, rhinitis, and atopic eczema (Bousquet et al., 2008). Gilles et al. (2020) state that pollen exposure weakens the immunity against some respirator viruses, e.g. corona virus, by diminishing the antiviral interferon response. As one important type of biogenic particles, pollen has various climatic and environmental impacts (IPCC, 2013). They can affect the solar radiation reaching Earth, thus causing a cooling effect, whereas their interactions with long-wave radiation warm the atmosphere. In addition, they can influence the cloud optical properties and cloud lifetime by acting as cloud condensation nuclei (Griffiths et al., 2012; Pope, 2010; Steiner et al., 2015) and ice-nucleating particles (von Blohn et al., 2005; Diehl et al., 2001, 2002), thereby influencing climate. In favourable conditions, pollen can be lifted into upper layers of the atmosphere and travel thousands of kilometres from source areas (Rousseau et al., 2008; Skjøth et al., 2007; Szczepanek et al., 2017).
In 2021, there were more than 1000 active pollen-monitoring stations in the world (https://oteros.shinyapps.io/pollen_map, last access: 1 October 2021; Buters et al., 2018). The majority of stations operate devices based on the Hirst principle (Hirst, 1952), e.g. Burkard pollen sample, using manual microscopy. Automatic pollen measuring devices are also available, having the potential for workload reduction and online pollen monitoring. These techniques are based on, for example, image recognition, such as pollen monitor BAA500 (Oteros et al., 2015); fluorescence spectra, such as the Wideband Integrated Bioaerosol Sensor (WIBS) (Gabey et al., 2010; Savage et al., 2017) and Plair Rapid-E (Šauliene et al., 2019); digital holography, such as Swisens Poleno (Sauvageat et al., 2020); or light scattering, such as pollen monitor KH-3000-01 (Miki and Kawashima, 2021). Nonetheless, those pollen detections are usually on the ground and/or at roof level.
An increasing interest has arisen to investigate the vertical distribution of pollen in the atmosphere. Studies show that lidar measurements can detect the presence of pollen in the atmosphere, with a strong diurnal cycle on the pollen backscattering, and that the non-spherical pollen grains can generate strong depolarization of laser light (Bohlmann et al., 2019, 2021; Noh et al., 2013a, b; Sassen, 2008; Sicard et al., 2016). Therefore, it is possible to observe pollen in the atmosphere using the depolarization ratio in the absence of other depolarizing non-spherical particles (e.g. dust). We have estimated the depolarization ratio at 532 nm of atmospheric birch and pine pollen as 0.24±0.01 and 0.36±0.01 under certain assumptions using a recently developed algorithm based on multi-wavelength Raman polarization lidar measurements (Shang et al., 2020). Using laser-induced fluorescence (LIF) lidars, Saito et al. (2018) and Richardson et al. (2019) were able to detect the fluorescence spectrum of pollen in the atmosphere. Veselovskii et al. (2021) demonstrated that the presence of pollen in aerosol mixtures leads to an enhancement of the fluorescence backscattering which is beneficial to distinguish pollen from dust particles. Aerosol classification schemes are available for both spaceborne lidar observations (Groß et al., 2015; Kim et al., 2018) and ground-based lidar networks (Baars et al., 2017; Nicolae et al., 2018). However, pollen (or biogenic aerosols in general) is not included and is likely misclassified as dusty mixtures.
An intensive observation campaign, the ACTRIS-COVID-19 campaign, was organized in May 2020, within the ACTRIS (Aerosol, Clouds and Trace Gases Research Infrastructure, https://www.actris.eu, last access: 1 October 2021) initiative for studying the changes in the atmosphere during the COVID-19 lockdown and early relaxation period in Europe. Pollen presence was also identified by the continuous lidar measurements at several stations, as spring is the typical pollen season. This study was conducted at four European lidar stations (Hohenpeißenberg, Germany; Kuopio, Finland; Leipzig, Germany; and Warsaw, Poland) for the pollen property retrieval. They were selected based on the availability of lidar products and the possible pollen presence from measurements or models for dust-free periods during the campaign. A novel simple method for the characterization of the pure pollen is proposed, based on the non-linear least square regression fitting, using lidar-measured vertical profiles of particle backscatter coefficients at 355 and 532 nm and particle linear depolarization ratios at 532 nm. It was applied to evaluate the pollen depolarization ratio at these stations. For two case examples in the campaign period, it was also used for the aerosol classifications.
The paper is structured as follows. In Sect. 2, we introduce the campaign, stations, instrumentation, and proposed algorithm. In Sect. 3, the results of the pollen characterization and the aerosol classification are presented and discussed. The conclusions are given in Sect. 4.
2.1 Stations and campaign
The ACTRIS-COVID-19 NRT (near-real-time) lidar measurement campaign was performed between 1 to 31 May 2020, involving 21 stations of the European Aerosol Research Lidar Network (EARLINET, https://www.earlinet.org, last access: 1 October 2021). A map with the participating EARLINET stations can be found on the EARLINET website (https://www.earlinet.org/index.php?id=covid-19, last access: 1 October 2021). This intensive observation campaign was focused on the lidar observations of aerosols during the relaxation period after the lockdown periods.
Table 1Information of EARLINET lidar stations involved in this study.
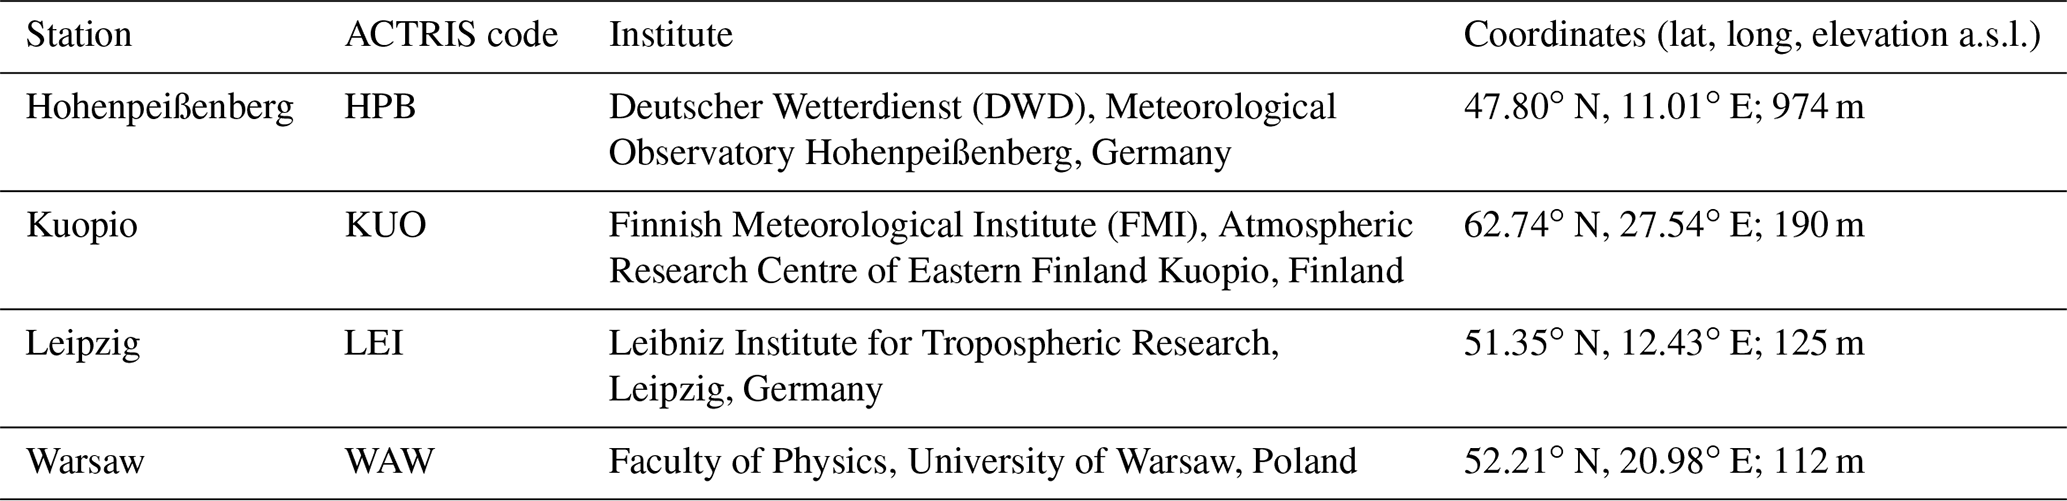
Based on the availability of the vertical profiles of backscatter coefficients at 355 and 532 nm and particle linear depolarization ratios at 532 nm for dust-free pollen periods during the campaign, four lidar stations (Hohenpeißenberg, Germany; Kuopio, Finland; Leipzig, Germany; and Warsaw, Poland; Table 1) were selected for the pollen investigation. These stations belong to the Raman and polarization lidar network PollyNET (Baars et al., 2016; http://polly.tropos.de, last access: 1 October 2021).
Hohenpeißenberg station (HPB) is situated on top of an isolated mountain in the foothills of the Alps at Hohenpeißenberg in Germany. The observatory is a major Global Atmospheric Watch global station. This rural site is surrounded by spruce forests (Picea abies) mixed with some common beeches (Fagus sylvatica), maple (Acer platanoides), and ash (Fraxinus) trees. About a third of the area is pasture land. Kuopio station (KUO) is located ∼18 km from the city centre of Kuopio, in Eastern Finland. This is a rural site mainly surrounded by forest. Dominant tree species include silver birch (Betula pendula), Norway spruce (Picea abies), and Scots pine (Pinus sylvestris). Leipzig station (LEI) is located in the lowlands of eastern Germany. The surrounding is dominated by agricultural areas and some forest together with wetlands. Typical trees are birch, lime, beech, oak, maple, and pine among others. Main agricultural plants are all kinds of corn, maize, rape, and grass. The city of Leipzig itself has a lot of parks and a high biodiversity. Many kinds of trees and other plants can be found. The pollution level is medium to low, as Leipzig is usually well circulated by the dominant wind systems as no hills or mountains are around. Besides the times of intensive agricultural activity (early spring or late autumn) or periods of Saharan dust arrival, no depolarizing aerosol is observed in Leipzig, leading to a background particle depolarization ratio of ∼0.01. Warsaw station (WAW) is located in the city centre of the capital of Poland; however, in the nearby vicinity there are several green parks. In May, typically observed pollen species are pine (Pinus), birch (Betula), and blue grass (Poa). The fungi spores represent very high contribution in vegetation season.
Birch pollen is recognized as one of the most important allergenic sources (D'Amato et al., 2007), which has a diameter around 20–30 µm and near-spherical shape with three pores on the edge. Beech, maple, and ash pollen is quite similar to birch pollen in terms of shape and size. Pine and spruce pollen grains, belonging to the Pinaceae family, are significantly larger, with the diameter on the longest axis of ∼65–80 µm or ∼90–110 µm, respectively (Nilsson et al., 1977). They possess two air bladders which assist those pollen grains to be dispersed by wind despite their large size. The Poaceae family, known as grasses, comprises over 12 000 species classified into 771 grass genera (Soreng et al., 2015). Grass pollen grains are spheroidal to sub-oblate in shape with a single circular pore, whereas the size range is highly variable (García-Mozo, 2017; Joly et al., 2007; Salgado-Labouriau and Rinaldi, 2009). Microphotographs of pollen grains can be found at PalDat – a palynological database (https://www.paldat.org, last access: 1 October 2021; Halbritter and Heigl, 2020).
2.2 Lidars and data processing
These four PollyNET stations are all equipped with ground-based multi-wavelength Raman polarization lidars PollyXT (Baars et al., 2016; Engelmann et al., 2016). Full details on the setup and principle of PollyXT can be found in Engelmann et al. (2016). Measurement capabilities of the lidars are somewhat different, but they all have emission wavelengths at both 355 and 532 nm and depolarization channels at 532 nm. The lidar near-real-time quick-looks are publicly accessible at the PollyNET website (http://polly.tropos.de, last access: 1 October 2021).
Lidar data were processed in a centralized way using the Single Calculus Chain (SCC) tool, with specific configurations and settings, and they were made publicly available. The SCC is a tool for the automatic analysis of aerosol lidar measurements developed within EARLINET (D'Amico et al., 2015, 2016; Mattis et al., 2016). The aerosol optical products after the reanalysis were used (two types of data were issued for the campaign: near-real-time data and reanalysis data; https://www.earlinet.org/index.php?id=covid-19-guidelines, last access: 9 March 2022), which are available on the THREDDS server (https://login.earlinet.org:8443/thredds/catalog/covid19re/catalog.html, last access: 1 October 2021). Out of all available data products, this study focused on particle backscatter coefficients (BSCs) at 355 and 532 nm and particle linear depolarization ratios (PDRs) at 532 nm. The processing vertical resolution is ∼60 m, and the integration time is of 2 h or less (depending on the cloud-free time available).
2.3 Ancillary data
In order to make sure that there is no dust contamination in the pollen properties retrieval, only dust-free periods were considered in this study, which were identified using prediction by NMMB/BSC-Dust (Non-hydrostatic Multiscale Model/Barcelona Supercomputing Center; Pérez et al., 2011; https://ess.bsc.es/bsc-dust-daily-forecast, last access: 1 October 2021). NMMB/BSC-Dust is an online multi-scale atmospheric dust model designed to accurately describe the dust cycle in the atmosphere, and is intended to provide short- to medium-range dust forecasts for both regional and global domains. It provides vertical profiles of dust concentration every 6 h, with a horizontal resolution of 0.3∘ × 0.3∘. HYSPLIT (HYbrid Single-Particle Lagrangian Integrated Trajectory, https://ready.arl.noaa.gov/HYSPLIT.php, last access: 1 October 2021) backward trajectories were analysed to study the air mass origins.
Pollen types and concentrations were determined by the model forecasting and/or in situ measurements at the ground level when available. The SILAM (System for Integrated modeLling of Atmospheric coMposition) dispersion model (Sofiev et al., 2015a; https://silam.fmi.fi, last access: 1 October 2021) provides the forecasts of pollen distribution over Europe, with 10 km and 1 h as spatial and time resolutions, respectively. Vertical profiles of pollen concentrations are available for 10 height levels (with layer midpoint height from 12.5 to 7725 m from the surface), including six pollen types (alder, birch, grass, mugwort, olive, and ragweed pollen; Siljamo et al., 2013; Sofiev, 2017; Sofiev et al., 2013, 2015b). A Hirst-type Burkard pollen sampler was placed ∼4 m above ground level (a.g.l.) at Kuopio station during the campaign to enable identification of pollen types and concentration microscopically with a 2 h time resolution (more detailed descriptions can be found in Bohlmann et al., 2019 and reference therein). In Germany, the pollen monitoring is available online at six locations (including the Leipzig station), using the fully automatic pollen monitor BAA500 (Hund GmbH; https://www.hund.de/en/service/pollen-monitor, last access: 1 October 2021) that combines advanced computer-aided microscopy, camera, and image-recognition technology to determine and pollen grain count with a 3 h time resolution.

Figure 1(a) Synthetic vertical profile of the total particle backscatter coefficient (βtotal) at 532 nm; the shares of depolarizing (βd) and non-depolarizing (βnd) particles are given by dark brown and light brown areas. Synthetic profiles of (b) the particle linear depolarization ratio (PDR, δtotal) at 532 nm and (c) the backscatter-related Ångström exponent (BAE, Åtotal) between 355 and 532 nm, under two groups of initial values (case 1 in blue and case 2 in green) of the depolarization ratio (δ) and the BAE of depolarizing (d) and non-depolarizing (nd) particles (δd, δnd, Åd, Ånd; values given in the legend). (d) Scatter plot of δtotal and Åtotal for two synthetic cases. The dashed fitting line of each case is determined by Eq. (7) with parameters (a1 and a2) given. The boundary points (dark brown squares and light brown triangles) are defined by the initial values (shown in the legend in b–c). Open circles present each bin.
2.4 PDR vs. BAE theory
Previous lidar-derived pollen studies show tendencies towards smaller Ångström exponents with increasing depolarization ratios (Bohlmann et al., 2019, 2021; Shang et al., 2020), indicating the increasing impact of larger and non-spherical pollen particles. Here, we investigate, mathematically, the relationship of the backscatter-related Ångström exponent (BAE, denoted as Å) and the particle linear depolarization ratio (PDR, denoted as δ). Note that the BAE depends on the particle size, shape, and complex refractive index (e.g. Miffre et al., 2020; Mishchenko et al., 2002) and thus demonstrates higher sensitivity to the changes in aerosol mixture composition. Two aerosol populations, depolarizing (d) and non-depolarizing (nd) aerosols, are considered. The total particle backscatter coefficient (βtotal) is the sum of the backscatter coefficients of depolarizing (βd) and non-depolarizing (βnd) aerosols.
The BAE describes the wavelength dependence on the backscatter coefficients between two wavelengths λ1 and λ2 (Ångström, 1964):
with the index x for aerosol type, which can be d (for depolarizing particle, e.g. pollen), nd (for non-depolarizing particle, e.g. background), or total (for total particles). The wavelength pair (λ1,λ2) was selected as (355, 532) in this study. For simplicity of the later calculation, we introduce the parameter η:
From now on, the wavelength pair (λ1,λ2) for η and Å expressions is omitted in the following derivations.
Shang et al. (2020) demonstrated the power-law relationship between the BAE of total particles (Åtotal) and the pollen backscatter contribution (the ratio of the pollen backscatter coefficient and the total particle backscatter coefficient) (see Eqs. 4–5 in Shang et al., 2020). Similarly, the backscatter contribution of depolarizing or non-depolarizing aerosols can be expressed as:
The particle linear depolarization ratio of the total particles (δtotal), containing depolarizing and non-depolarizing aerosols, can be calculated using the backscatter coefficients and the depolarization ratios of each type as
We divide both numerator and denominator by the total particle backscatter coefficient, i.e. (βd+βnd), and replace the expressions in Eq. (3). Simple conversion yields
and after further rearrangements, we obtain
This equation can be expressed in a simplified way as
with two coefficients (a1, a2) defined from four characteristic parameters (ηnd, ηd, δnd, δd) as
The relationship between lidar-derived BAE and PDR of total particles is fixed for the mixture of two aerosol types. It can be mathematically derived if the characteristic values of these two aerosol types (Åd, δd and Ånd, δnd) are known. Synthetic examples are given in Fig. 1 where the backscatter coefficient profiles of depolarizing (βd), non-depolarizing (βnd), and total particles (βtotal) were simulated. Under different initial characteristic values (case 1 or case 2) of depolarizing and non-depolarizing particles, the PDR and BAE profile of total particles are different (e.g. Fig. 1b–c in blue or green). The relationships between simulated Åtotal and δtotal under each assumption are shown in Fig. 1d: the bottom-right (top-left) boundary point of the fitting line is determined by Å and δ of the depolarizing (non-depolarizing) particles, shown as dark brown squares (light brown triangles), whereas the curve shape of fitting lines is determined by Eq. (7), i.e. different values of a1 and a2 defined by Eq. (8). Note that the two boundary points of each fitting line are independent, as they are determined separately by the characteristic values (Åx and δx) of each aerosol type. Such a relationship is valid under two constraints: (i) only two aerosol populations present in the mixture, (ii) both Å and δ of the two aerosol types should be different. These two aerosol types can be dust and non-dust aerosols or pollen and non-depolarizing background aerosols. The method application for synthetic examples of three aerosol types in the mixture is present and discussed in the Supplement. For two (or more) types of depolarizing aerosols and one non-depolarizing aerosol mixture, the estimated δd values represent a combination of two (or more) depolarizing aerosols, with a value between the characteristic (pure) depolarization ratios of each type. However, the authors recommend using the method under the constraints mentioned above.
Table 2The selected pollen periods for four stations.

Source of possible dominant pollen types: a SILAM model, b Burkard pollen sampler, c pollen monitor BAA500. Profile and bin numbers, layer heights, and lidar-derived optical values of selected layers for each station (mean values ± standard derivation of layer-mean values of all profiles) are given (PDR – particle linear depolarization ratio, BAE – backscatter-related Ångström exponent).
3.1 Selected pollen periods
The pollen periods were selected for each station in May 2020 (Table 2), with the following criteria: (1) dust-free as indicated by the NMMB/BSC-Dust model (see Supplement) and (2) relatively high pollen concentrations (from the SILAM model forecasting and/or in situ measurements when available). Since the closest layer to the ground is assumed to contain the highest pollen concentration and share, the lowest layers were considered the pollen layers in this study. In addition, the retrieved BSC at 532 and 355 nm should be larger than 0.05 and 0.1 Mm−1 sr−1, respectively. These threshold values were adapted from the ones used in Baars et al. (2017), in which the quasi-BSC at 1064 nm below 0.01 or 0.2 Mm−1 sr−1 was classified as “clean atmosphere” or “non-typed particles/low concentration”, respectively.
In Kuopio station, there was frequent rain in the first two-thirds of May, and almost no pollen was measured by the Burkard sampler. Birch pollen was observed from 23 to 31 May, with the highest concentration of ∼4000 m−3 on 26 May. 23–26 May were selected as the pollen period, when there was clear sky. During the period, quite nice diurnal cycles (see Sect. 3.3.1) were found from lidar observations with enhanced backscatter signals and volume depolarization ratios in the planetary boundary layer.
In Warsaw station, two periods were selected in this study (see Sect. 3.3.2): period no. 1, birch pollen period from 26 to 29 May, and period no. 2, birch pollen mixture period on 31 May. High birch concentrations (with a median hourly value of 4800 m−3 at the lowest level) were indicated from the SILAM model for both periods, with almost 0 concentration of the other five pollen types. In Sect. 3.2, only period no. 1 is considered, whereas period no. 2 will be discussed in Sect. 3.3.2.
In Hohenpeißenberg station, high birch concentrations were found on 9 and 10 May with the highest value at the lowest level of ∼180 m−3; however, there was dust present (from NMMB/BSC-Dust) on these days. In order to avoid the dust mixture impact on the pollen property retrieval, 2 dust-free days (7 and 8 May, see Sect. 3.3.3) were selected as the pollen period, where nice diurnal cycles of enhanced backscatter signals and volume depolarization ratios in the planetary boundary layer can be found. SILAM model forecasts suggest the presence of birch and a small amount of grass pollen, with the highest concentration of ∼60 m−3 at the lowest level.
In Leipzig station, the number of available optical profiles was limited due to the frequent rain. From the SILAM model, there were few occasions with the presence of pollen in May. Pollen period was selected as 4 d (26, 27, 30, 31), when there was mainly birch and grass pollen; only four lidar-derived optical profiles of a full set were available in the period. The highest value of SILAM hourly pollen concentrations is about 100 m−3. The pollen monitor BAA500 shows mean values of the daily pollen concentration of 13 and 26 m−3 for birch and grass pollen during the period.
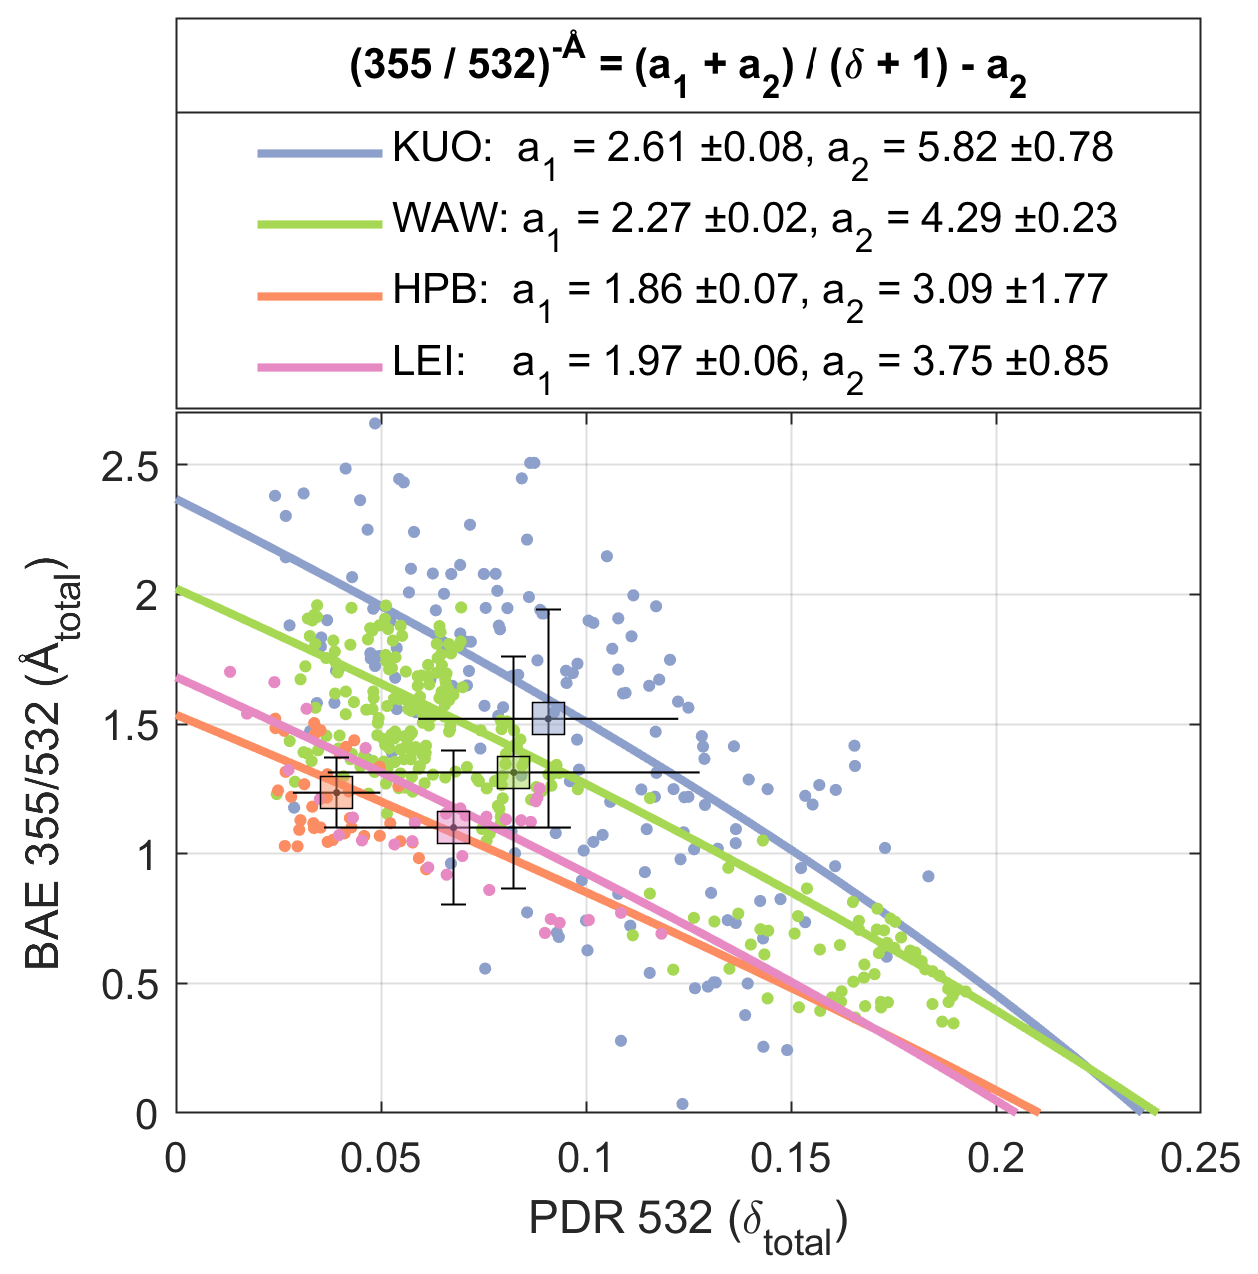
Figure 2Relationships of the particle linear depolarization ratio (PDR, δ) at 532 nm and the backscatter-related Ångström exponent (BAE, Å) between 355 and 532 nm. All bins inside pollen layers are shown by dots for each station with different colours. Averaged layer-mean values are given by the square, with the variabilities shown by bars. Fitting regression lines (Eqs. 7 and 9) are drawn with parameter values given in the legend.
3.2 Characteristic values
Due to the small number of profiles, values of all bins inside predefined pollen layers were used (see Table 2). The bottoms of the pollen layers are limited due to the overlap of the lidar instrument (the lowest reliable heights after the quality control tests are about 900, 500, 700, or 600 m a.g.l. for KUO, WAW, HPB, or LEI, respectively), whereas the tops are defined as the lowest observed layers based on the gradient method applied on both BSCs and PDRs. The mean values of PDR and BAE in Table 2 are the averages of the layer-mean values (in the selected layers) of all selected profiles per each station. Averaged layer-mean values of PDRs in pollen layers of four stations are slightly enhanced (from about 0.04 to 0.09) than the background conditions, suggesting the presence of non-spherical particles in the atmosphere.
Table 3Characteristic values of background (bg) and pollen particles for pollen periods of four stations, derived from the regression fitting lines in Fig. 2. δ: depolarization ratio at 532 nm. Å: backscatter-related Ångström exponent between 355 and 532 nm. “A” denotes the assumption.

We assumed that inside the pollen layers there are only two aerosol types: pollen and non-depolarizing background aerosol (bg). Based on the method presented in Sect. 2.4, we applied a simplified equation (similar to Eq. 7) here:
where x is the bin value of measured PDR at 532 nm inside the pollen layer, i.e. δtotal (532), and y is the bin value defined from BAE calculated by the measured BSCs at 355 and 532 nm inside the pollen layer, i.e. .
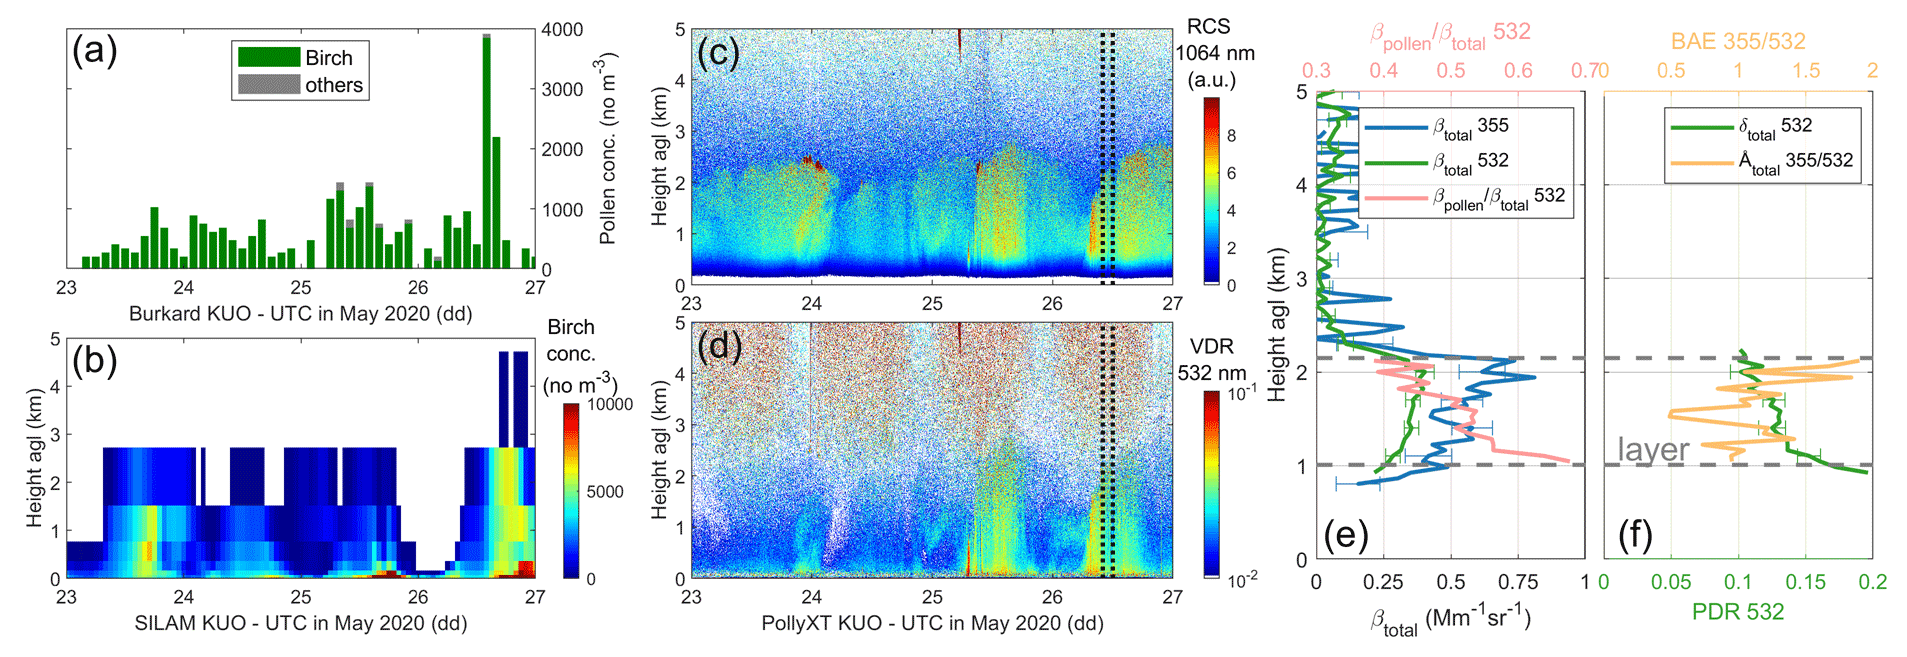
Figure 3Overview of the pollen period and a case example at Kuopio station. (a) Pollen concentrations from the Burkard sampler at the roof level. (b) Birch pollen concentrations from the SILAM model. Time–height cross section of (c) range-corrected signal (RCS) at 1064 nm and (d) volume depolarization ratio (VDR) at 532 nm of PollyXT. Vertical profiles of (e) particle backscatter coefficients and the pollen backscatter contribution, (f) backscatter-related Ångström exponent (BAE) and the particle linear depolarization ratio (PDR) of the selected time period (black dotted box in c, d). The selected pollen layer is shown between grey dashed lines in (e) and (f).
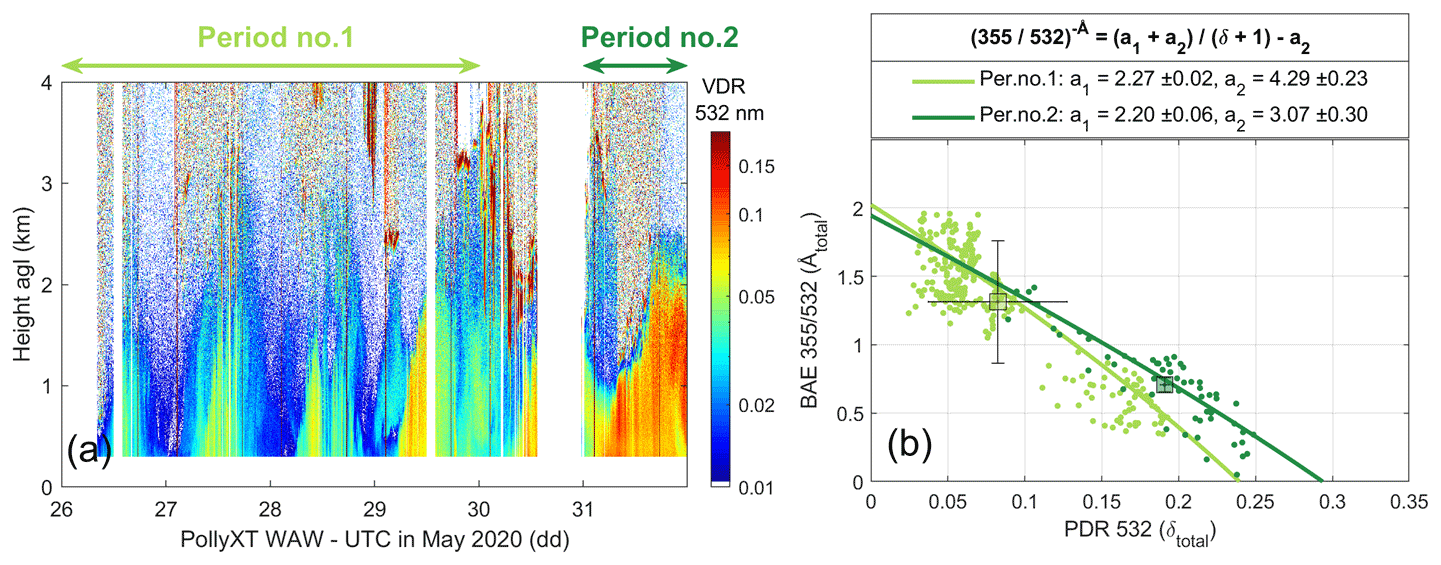
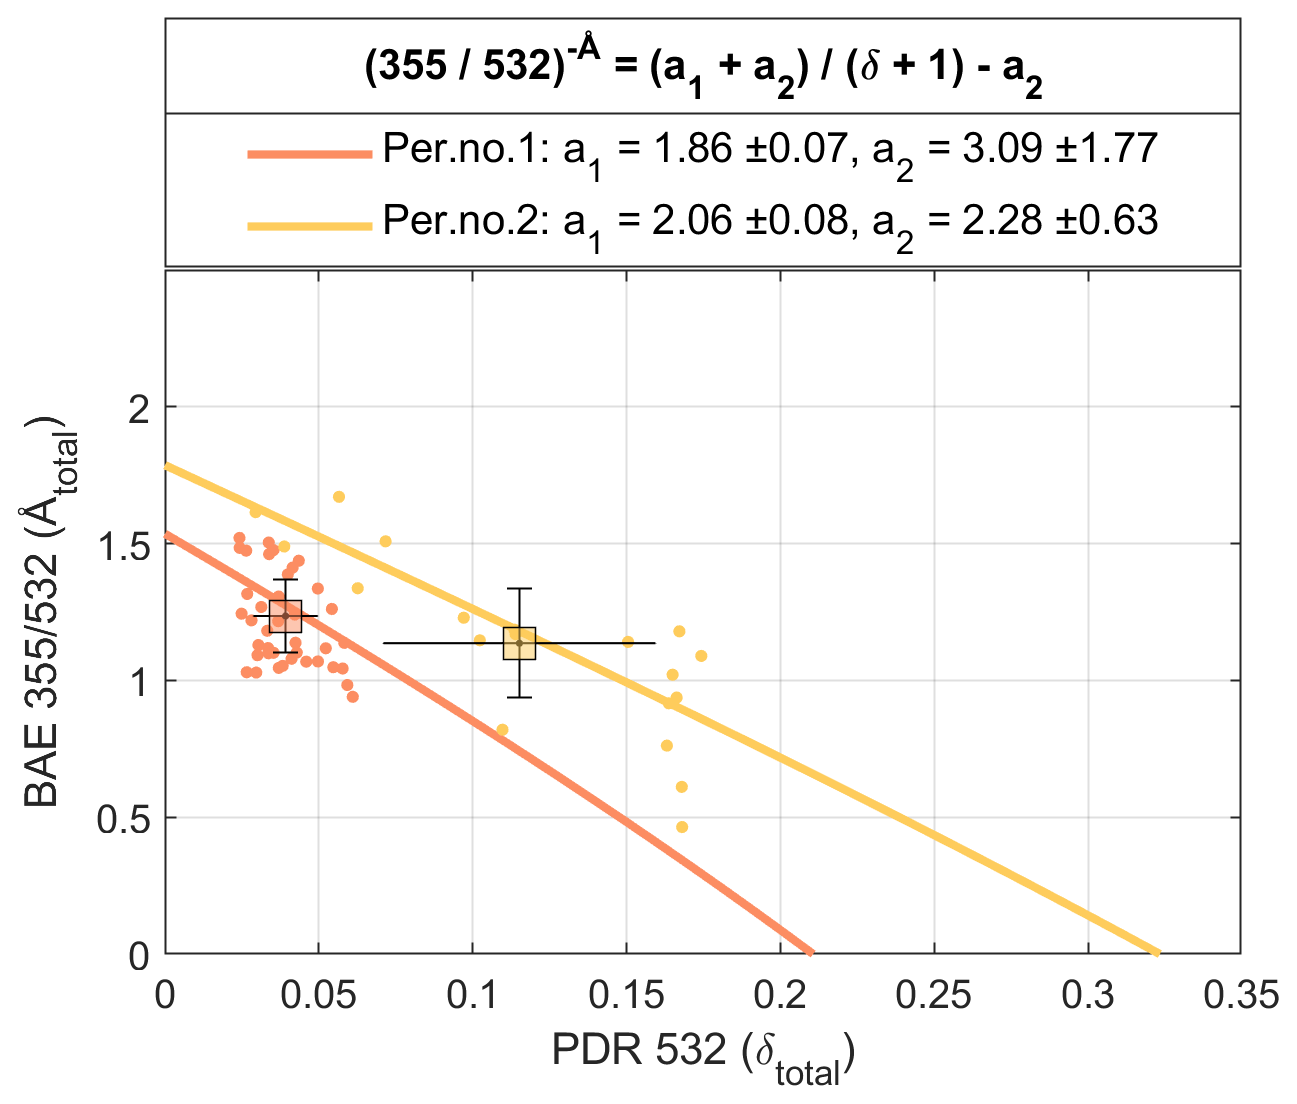
Figure 4(a) Time–height cross section of volume depolarization ratio (VDR) at 532 nm from PollyXT at Warsaw station on 26–31 May 2020. The two selected periods are indicated on the top. (b) Similar to Fig. 2 but for two periods at Warsaw station.
Table 4Comparison of characteristic values of background and pollen/dust particles, for selected periods of Warsaw and Hohenpeißenberg stations. δ: depolarization ratio at 532 nm. Å: backscatter-related Ångström exponent between 355 and 532 nm. The index d is used for the depolarizing particles (i.e. pollen or dust).
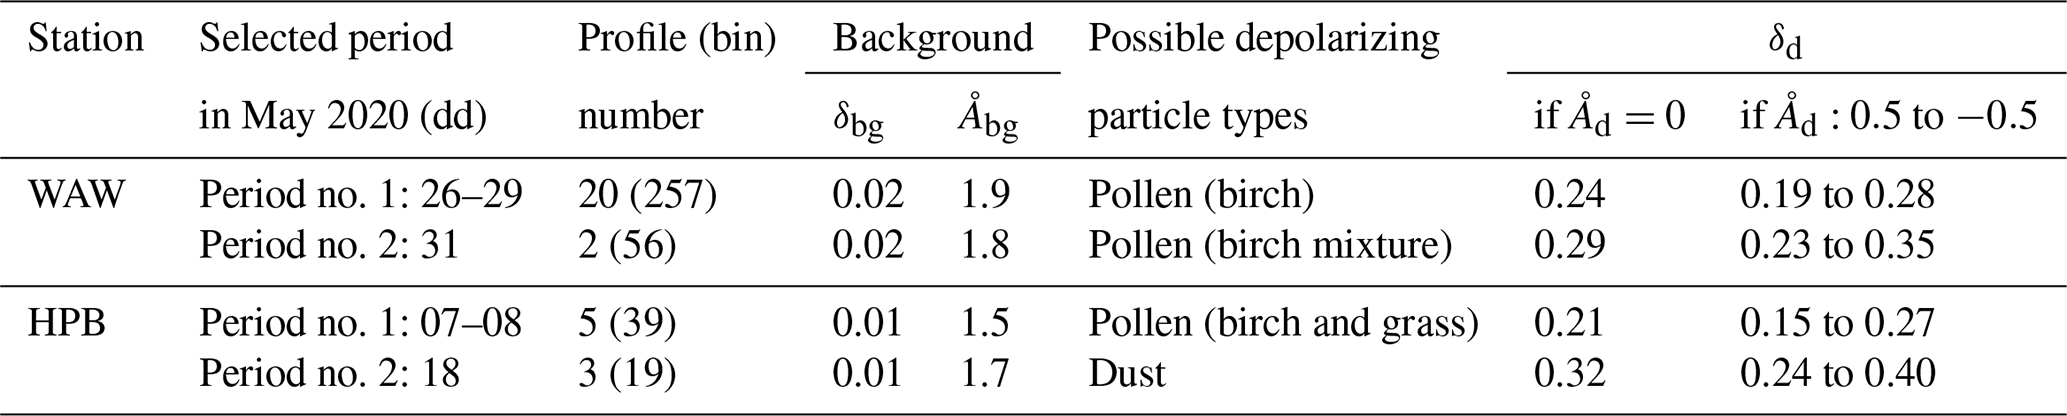
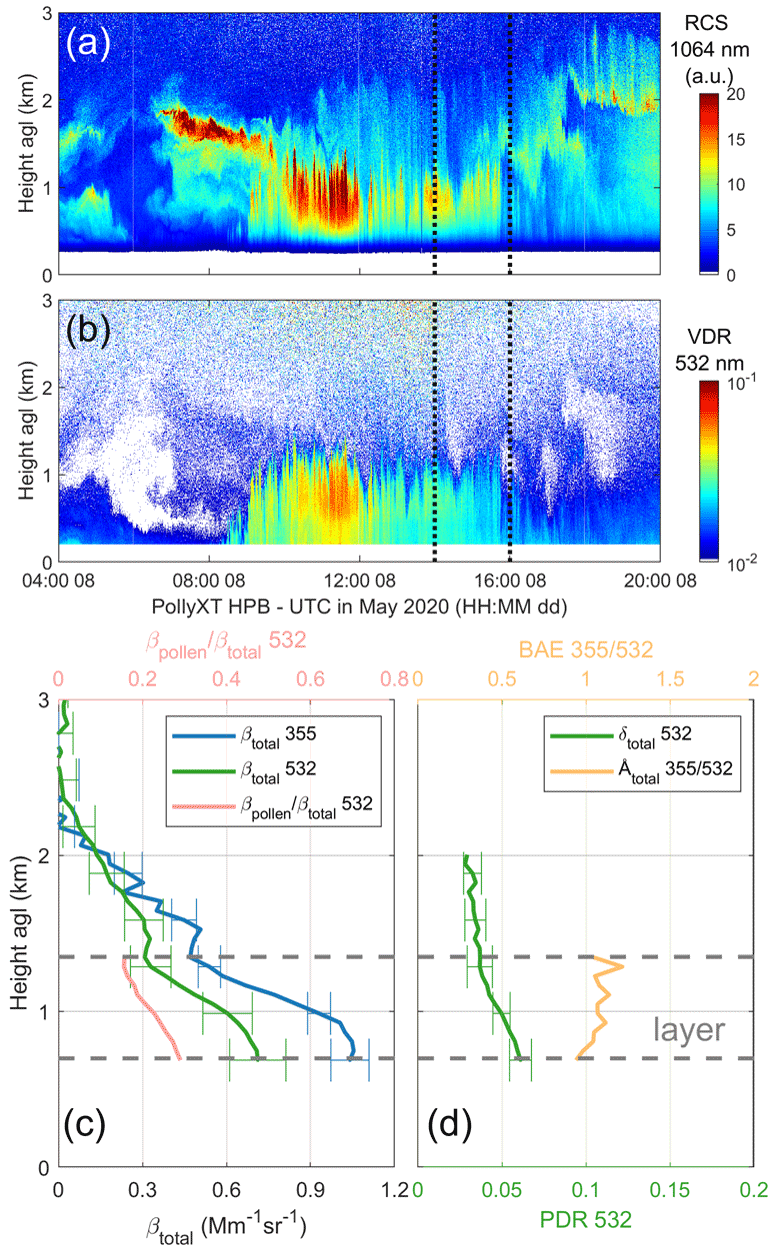
Figure 5Case example in period no. 1 of Hohenpeißenberg station. Time–height cross section of (a) range-corrected signal (RCS) at 1064 nm and (b) volume depolarization ratio (VDR) at 532 nm from PollyXT. Vertical profiles of (c) particle backscatter coefficients and the pollen backscatter contribution; (d) backscatter-related Ångström exponent (BAE) and the particle linear depolarization ratio (PDR) of the selected time period (black dotted box in a, b). Selected layer is shown between grey dashed lines in (c) and (d).

The non-linear least square regression fitting, based on the Jacobian matrix, was applied using Eq. (9) to the dataset for each station to evaluate the coefficients (a1, a2), with values given in Fig. 2 with their standard deviations. The values of the coefficients (a1, a2) are different for stations, as they are defined (Eq. 8) from characteristic values of two aerosol types, i.e. pollen (Åpollen, δpollen) and non-depolarizing background aerosol (Åbg, δbg). Under ideal conditions (i.e. two aerosol populations present in the mixture, with different mixing ratio at different height or time), the unique solution can be found for the coefficients (a1, a2) with a high accuracy. But many solutions on the four characteristic values can result in the same coefficient couple (a1, a2), by reason of two equations with four unknowns. Regarding the fitting Eq. (9), the value couple of Åx and δx of one pure particle type (pollen or bg) should be located on the fitting curve theoretically (or under ideal conditions). Thus, with the knowledge of one parameter, the other can be evaluated. In reality, the depolarization ratio of the background particles (δbg) can be reasonably estimated or assumed, whereas the BAE of pure pollen (Åpollen) can be assumed to be 0, as pollen grains are quite large particles (e.g. birch pollen has a diameter around 20–30 µm). Hence, the other two characteristic parameters (Åbg, δpollen) can be calculated and vice versa. Final estimations of characteristic parameters for all stations are given in Table 3. There are no values of the Ångström exponent for pure pollen in the literature; for large particles such as dust, Mamouri and Ansmann (2014) reported extinction-related Ångström exponents between 440 and 675 nm, with values of −0.2 for coarse dust and 0.25 for total dust. If the true value of Åpollen is assumed between −0.5 and 0.5, the possible ranges of δpollen for each station can be given; refer to Table 3.
For Kuopio and Warsaw stations, the depolarization ratios at 532 nm of pure pollen (birch dominant) were found to be 0.24, which is in agreement with the birch depolarization ratio of 0.24 reported in Shang et al. (2020) for lidar observations in Kuopio in 2016. The pollen depolarization ratios at Hohenpeißenberg and Leipzig stations have relatively smaller values, probably due to the mixture of birch and grass pollen, as indicated by SILAM model. Grass pollen, depending on the genera, can be more spherical in shape compared to birch pollen; thus, smaller depolarization ratio is expected. These measurements were not affected by extreme meteorological events and represent values for pollen under ambient atmospheric condition in the spring season (similar conclusions in Bohlmann et al., 2019). Note that different characteristic values of pollen could be observed under extreme humid or extreme dry conditions: (i) pollen grains can fold up and change shape while dehydrating, e.g. commercially available pollen for laboratory measurements, and (ii) pollen grains can swell by taking up water especially after reaching a relative humidity over 89 % (see Fig. 2 in Griffiths et al., 2012).
3.3 Case examples
The present method (Sect. 2.4) was used to evaluate the characteristic values of the pure particle type, e.g. to estimate the pure pollen depolarization ratios, and a case example for Kuopio station is presented here (Sect. 3.3.1). It can also be applied for the aerosol classification. Two case examples from the campaign periods are presented (Sects. 3.3.2 and 3.3.3).
3.3.1 Kuopio – birch pollen
An overview of the selected pollen period at Kuopio station is given in Fig. 3. Bi-hourly concentrations from the Burkard sampler (Fig. 3a) at the roof level (∼4 m a.g.l.) show birch pollen presence during the period, with other pollen types only accounted for ∼2 %. The time–height plot of birch pollen concentrations from the SILAM forecast is given in Fig. 3b, showing that birch pollen can reach up to ∼3 km a.g.l., with higher concentrations near ground. PollyXT lidar observations of the range-corrected signal (RCS) at 1064 nm and the volume depolarization ratio (VDR) at 532 nm are presented in Fig. 3c–d. A high aerosol load was observed within the first 3 km considering the strong backscatter signals. Enhanced VDRs were correlated with higher birch concentrations, with diurnal cycles. A case example of lidar-derived optical profiles (time-averaged at 10:00–12:00 UTC on 26 May) is shown in Fig. 3e–f. The pollen backscatter contribution (the ratio of the pollen backscatter coefficient and the total particle backscatter coefficient) at 532 nm was calculated based on the pollen depolarization ratio at 532 nm of 0.24 derived in Sect. 3.2. The layer-mean value of the pollen backscatter contribution for the selected case is ∼51 %. A clear tendency towards higher pollen contribution with increasing depolarization ratios and decreasing BAEs can be found, indicating the increasing impact of pollen in the aerosol mixture. The assumption on the depolarization ratio of the background particles (δbg) can affect the pollen backscatter coefficient retrieval. An underestimate of the δbg will result in an overestimate of the pollen backscatter coefficient. For the given case example, if δbg were assumed to be 0.01 instead of 0.03, a ∼6 % higher pollen backscatter contribution (with a layer-mean value of 56 % instead of 51 %) would be obtained.
3.3.2 Warsaw – different pollen types
The time–height plot of VDRs at 532 nm from PollyXT at Warsaw station for 26–31 May 2020 is presented in Fig. 4a. Nice diurnal cycles of enhanced VDRs are visible, which are likely due to pollen presence in the atmosphere. The NMMB/BSC-Dust model suggests that no dust is present below 7 km during the period. The SILAM model, including six pollen types, forecasts that mainly birch pollen is present for the whole period. However, stronger VDR on 31 May was observed compared to previous days. Two periods were defined (Table 4) for the comparison, separated by 30 May when low clouds and/or rain occurred. For period no. 2, i.e. 31 May, only two profiles are available due to the low cloud. The non-linear least square regression fitting was applied to the dataset using Eq. (9) for two periods, separately, with results given in Fig. 4b and Table 4. The general depolarization ratio of the background particles (δbg) at Warsaw station can be assumed as 0.02, the BAE values of the background particles were thus derived as quite close values (1.9 or 1.8 for each period). Nevertheless, under the assumption of Åpollen=0, the pollen depolarization ratio for period no. 2 was estimated as a higher value (0.29) than the one for period no. 1 (0.24). The δpollen value of period no. 1 is in good agreement with the one of Kuopio station, for birch pollen. A higher δpollen value for period no. 2 suggests the additional presence of more non-spherical particles, e.g. pine pollen (Shang et al., 2020), which is not included in the SILAM model.
3.3.3 Hohenpeißenberg – pollen and dust
Two periods were defined (Table 4) for the comparison study of pollen and dust particles observed in Hohenpeißenberg station. In period no. 1, only lowest layers were considered pollen layers. A case example is given in Fig. 5; pollen presence can be seen between 08:00 and 16:00 UTC close to the ground with enhanced backscatter signal and VDR. In period no. 2, a lofted aerosol layer with high VDRs, located at ∼2 km at midnight and descending to ∼1.5 km in the morning, was selected as the dust layer (Fig. 6). The dust forecast at both Garmisch-Partenkirchen (47.47∘ N, 11.07∘ E) and Munich (48.15∘ N, 11.57∘ E) stations (closest to Hohenpeißenberg station) of the NMMB/BSC-Dust model shows the dust layer at similar height (see the Supplement). The air mass sources, investigated by the backward trajectory analysis (HYSPLIT model), also shows that some of the particles were transported from the Sahara region.
The non-linear least square regression fitting was applied to the dataset using Eq. (9) for two periods, with results given in Fig. 7 and Table 4. Even though the profile numbers are quite limited for both periods, the method was applied successfully using all bins inside the selected layers. The depolarization ratio of the background particles (δbg) at Hohenpeißenberg station can be assumed as 0.01; the BAE values of the background particles were derived as 1.5 and 1.7 for the two periods. Such a difference may be due to the possible change on the background aerosol nature, as these two periods were separated by 10 d. If we assumed that BAEs of both pollen and dust are equal to 0, the δd of pollen and dust were estimated as 0.21 and 0.32, respectively. Case examples of lidar-derived optical profiles are shown in Figs. 5c–d and 6c–d. The layer-mean backscatter contribution of pollen (dust) for the selected case in period no. 1 (no. 2) was estimated as ∼22 % (53 %), based on the evaluated pure depolarization ratios of 0.21 (0.32) and Åd of 0. If δbg were assumed to be 0.03 instead of 0.01, the layer-mean backscatter contribution of pollen (dust) for the selected case would be estimated as ∼11 % (49 %). Using the presented method, the dust and pollen can clearly be classified for this case study (e.g. Fig. 7). However, if the certain pollen type (e.g. pine pollen with 0.36 as δpollen as reported in Shang et al. (2020)) has a similar characteristic value as dust, the separation could be more challenging; thus, additional information (e.g. the fluorescence as stated in Veselovskii et al. 2021) would be needed.
During the ACTRIS-COVID-19 campaign in May 2020, continuous lidar measurements were performed at EARLINET stations, with data (including optical property profiles) publicly available after centralized and automatic data processing with SCC. Four EARLINET and PollyNET lidar stations (Hohenpeißenberg, Germany; Kuopio, Finland; Leipzig, Germany; and Warsaw, Poland) were selected for the pollen property retrieval during dust-free pollen periods, whereby we focused on vertical profiles of particle backscatter coefficients at 355 and 532 nm and particle linear depolarization ratios at 532 nm.
A novel method, based on the non-linear least square regression fitting using lidar-derived backscatter-related Ångström exponent (BAE) and the particle linear depolarization ratio (PDR), was used for the characterization of the pure pollen depolarization ratio. This easy-to-apply algorithm can estimate two coefficients to determine the relationship between PDR and BAE. Such a relationship is valid under two constraints: (i) only two aerosol populations, depolarizing (e.g. pollen or dust) and non-depolarizing (e.g. non-depolarizing background) aerosols, can be assumed in the aerosol mixture, and (ii) both the depolarization ratio and the BAE of the two aerosol types should be different. Mathematically (or under ideal conditions), the PDR and BAE of a mixture of depolarizing and non-depolarizing aerosols, with whichever mixing rate, should follow the derived relationship. Hence, with the knowledge of one parameter (PDR or BAE), the other can be evaluated. The characteristic values of the pure aerosol type can be evaluated in this way if one parameter is known or can be reasonably assumed.
Under the assumption that the BAE between 355 and 532 nm should be zero for pure pollen, the pollen depolarization ratios were estimated: for Kuopio and Warsaw stations, the pollen depolarization ratios at 532 nm were found to be 0.24 during the birch-dominant pollen periods, whereas for Hohenpeißenberg and Leipzig stations, the pollen depolarization ratios were found to be 0.21 and 0.20 during the pollen period when there was a mixture of birch and grass pollen. However, the uncertainty in the assumed BAE of pure pollen will introduce non-negligible bias. If the true value of pollen BAE were between −0.5 and 0.5, relative uncertainties on estimated pollen depolarization ratios would be found between 14 %–30 %. Thus, measuring the Ångström exponent of pure pollen, e.g. in laboratory experiments (in atmospheric conditions), would be beneficial and would certainly improve the determination of pure pollen depolarization ratios. The present method was also applied for the aerosol classification, using two case examples from the campaign periods. The different pollen types (or pollen mixtures) were identified at Warsaw station, and dust and pollen were classified at Hohenpeißenberg station.
This study shows that automatically retrieved lidar data profiles (using SCC) are suitable for pollen characterizations. The method was demonstrated for sites at which we have seldom or no (e.g. Warsaw and Kuopio) long-range-transported dust. Additional information, e.g. dust-free period from dust models or fluorescence information to identify dust and pollen (Veselovskii et al., 2021), is needed to exclude dust impact in the areas where dust is present. The proposed methodology demonstrated a first step towards automated pollen detection in lidar networks.
ACTRIS aerosol remote sensing COVID-19 campaign data of May 2020: https://doi.org/10.21336/gen.xmbc-tj86 (ACTRIS ARES Data Centre, 2020). Optical products used in this article are available: https://doi.org/10.23728/fmi-b2share.959be96f095640578eb5a7dc335c8b46 (Shang et al., 2021).
The supplement related to this article is available online at: https://doi.org/10.5194/acp-22-3931-2022-supplement.
XS analysed the data, developed the algorithm, and wrote the article. HB, ISS, IM, and MK are the principal investigators (PIs) of the LEI, WAW, HPB, and KUO stations, respectively. All authors ensured the high-quality operation of the respective lidars. All authors reviewed and commented on the article.
The contact author has declared that neither they nor their co-authors have any competing interests.
Publisher’s note: Copernicus Publications remains neutral with regard to jurisdictional claims in published maps and institutional affiliations.
This article is part of the special issue “Quantifying the impacts of stay-at-home policies on atmospheric composition and properties of aerosol and clouds over the European regions using ACTRIS related observations (ACP/AMT inter-journal SI)”. It is not associated with a conference.
The authors acknowledge the data and/or images from the NMMB/BSC-Dust model, operated by the Barcelona Supercomputing Center (http://www.bsc.es/ess/bsc-dust-daily-forecast, last access: 1 October 2021). The authors gratefully acknowledge NOAA Air Resources Laboratory (ARL) for the provision of the HYSPLIT transport and dispersion model and/or READY website (https://www.ready.noaa.gov, last access: 1 October 2021) used in this publication. The authors acknowledge the Biodiversity Unit of the University of Turku and the core personnel Annika Saarto and Sanna Pätsi for the analysis of the pollen samples at Kuopio station. The authors acknowledge the pollen data of the pollen monitor BAA500 (Hund GmbH; https://www.hund.de/en/service/pollen-monitor, last access: 1 October 2021). The authors acknowledge the SILAM team, especially Mikhail Sofiev and Rostislav Kouznetsov, for the provision of the SILAM model. The authors thank Simo Heikkinen for his help with the regression fitting algorithm. Warsaw lidar station measurements and data evaluation are performed in a team effort; during May 2020 the core personnel involved were Iwona S. Stachlewska, Dominika Szczepanik, Rafal Fortuna, Lucja Janicka, and Wojciech Kumala. The team at Leipzig station appreciates the contributions of all the individuals that have been involved in supporting, enabling, and maintaining Polly measurements and the pollen observations. The research leading to the SCC results is supported by the European Commission under the Horizon 2020 – Research and Innovation Framework Programme, H2020-INFRADEV-2019-2 (grant no. 871115).
This research has been supported by the Academy of Finland (projects nos. 310312 and 329216). EARLINET stations were supported by ACTRIS; ACTRIS has received funding from the European Union's Horizon 2020 research and innovation programme (grant nos. 654109 (ACTRIS-2), 759530 (ACTRIS-PPP), 871115 (ACTRIS-IMP), and 824068 (ENVRI-FAIR)). The SCC development has been funded by the ACTRIS research infrastructure project by the European Union's Horizon 2020 research and innovation programme (grant no. 654109) and previously (grant no. 262254) in the Seventh Framework Programme (FP7/2007–2013). Warsaw station (UW) was supported by of the European Space Agency, POLIMOS-4000119961/16/NL/FF/mg.
This paper was edited by Matthias Tesche and reviewed by two anonymous referees.
Ångström, A.: The parameters of atmospheric turbidity, Tellus A, 16, 64–75, https://doi.org/10.3402/tellusa.v16i1.8885, 1964.
ACTRIS ARES Data Centre: ACTRIS aerosol remote sensing COVID-19 campaign data of May 2020, Consiglio Nazionale delle Ricerche – CNR [data set], https://doi.org/10.21336/gen.xmbc-tj86, 2020.
Baars, H., Kanitz, T., Engelmann, R., Althausen, D., Heese, B., Komppula, M., Preißler, J., Tesche, M., Ansmann, A., Wandinger, U., Lim, J.-H., Ahn, J. Y., Stachlewska, I. S., Amiridis, V., Marinou, E., Seifert, P., Hofer, J., Skupin, A., Schneider, F., Bohlmann, S., Foth, A., Bley, S., Pfüller, A., Giannakaki, E., Lihavainen, H., Viisanen, Y., Hooda, R. K., Pereira, S. N., Bortoli, D., Wagner, F., Mattis, I., Janicka, L., Markowicz, K. M., Achtert, P., Artaxo, P., Pauliquevis, T., Souza, R. A. F., Sharma, V. P., van Zyl, P. G., Beukes, J. P., Sun, J., Rohwer, E. G., Deng, R., Mamouri, R.-E., and Zamorano, F.: An overview of the first decade of PollyNET: an emerging network of automated Raman-polarization lidars for continuous aerosol profiling, Atmos. Chem. Phys., 16, 5111–5137, https://doi.org/10.5194/acp-16-5111-2016, 2016.
Baars, H., Seifert, P., Engelmann, R., and Wandinger, U.: Target categorization of aerosol and clouds by continuous multiwavelength-polarization lidar measurements, Atmos. Meas. Tech., 10, 3175–3201, https://doi.org/10.5194/amt-10-3175-2017, 2017.
Bohlmann, S., Shang, X., Giannakaki, E., Filioglou, M., Saarto, A., Romakkaniemi, S., and Komppula, M.: Detection and characterization of birch pollen in the atmosphere using a multiwavelength Raman polarization lidar and Hirst-type pollen sampler in Finland, Atmos. Chem. Phys., 19, 14559–14569, https://doi.org/10.5194/acp-19-14559-2019, 2019.
Bohlmann, S., Shang, X., Vakkari, V., Giannakaki, E., Leskinen, A., Lehtinen, K. E. J., Pätsi, S., and Komppula, M.: Lidar depolarization ratio of atmospheric pollen at multiple wavelengths, Atmos. Chem. Phys., 21, 7083–7097, https://doi.org/10.5194/acp-21-7083-2021, 2021.
Bousquet, J., Khaltaev, N., Cruz, A. A., Denburg, J., Fokkens, W. J., Togias, A., Zuberbier, T., Baena-Cagnani, C. E., Canonica, G. W., Van Weel, C., Agache, I., Aït-Khaled, N., Bachert, C., Blaiss, M. S., Bonini, S., Boulet, L.-P., Bousquet, P.-J., Camargos, P., Carlsen, K.-H., Chen, Y., Custovic, A., Dahl, R., Demoly, P., Douagui, H., Durham, S. R., Van Wijk, R. G., Kalayci, O., Kaliner, M. A., Kim, Y.-Y., Kowalski, M. L., Kuna, P., Le, L. T. T., Lemiere, C., Li, J., Lockey, R. F., Mavale-Manuel, S., Meltzer, E. O., Mohammad, Y., Mullol, J., Naclerio, R., O'Hehir, R. E., Ohta, K., Ouedraogo, S., Palkonen, S., Papadopoulos, N., Passalacqua, G., Pawankar, R., Popov, T. A., Rabe, K. F., Rosado-Pinto, J., Scadding, G. K., Simons, F. E. R., Toskala, E., Valovirta, E., Van Cauwenberge, P., Wang, D.-Y., Wickman, M., Yawn, B. P., Yorgancioglu, A., Yusuf, O. M., Zar, H., Annesi-Maesano, I., Bateman, E. D., Kheder, A. Ben, Boakye, D. A., Bouchard, J., Burney, P., Busse, W. W., Chan-Yeung, M., Chavannes, N. H., Chuchalin, A., Dolen, W. K., Emuzyte, R., Grouse, L., Humbert, M., Jackson, C., Johnston, S. L., Keith, P. K., Kemp, J. P., Klossek, J.-M., Larenas-Linnemann, D., Lipworth, B., Malo, J.-L., Marshall, G. D., Naspitz, C., Nekam, K., Niggemann, B., Nizankowska-Mogilnicka, E., Okamoto, Y., Orru, M. P., Potter, P., Price, D., Stoloff, S. W., Vandenplas, O., Viegi, G., and Williams, D.: Allergic Rhinitis and its Impact on Asthma (ARIA) 2008, Allergy, 63, 8–160, https://doi.org/10.1111/j.1398-9995.2007.01620.x, 2008.
Buters, J. T. M., Antunes, C., Galveias, A., Bergmann, K. C., Thibaudon, M., Galán, C., Schmidt-Weber, C., and Oteros, J.: Pollen and spore monitoring in the world, Clin. Transl. Allergy, 8, 9, https://doi.org/10.1186/s13601-018-0197-8, 2018.
D'Amato, G., Cecchi, L., Bonini, S., Nunes, C., Annesi-Maesano, I., Behrendt, H., Liccardi, G., Popov, T., and van Cauwenberge, P.: Allergenic pollen and pollen allergy in Europe, Allergy, 62, 976—990, https://doi.org/10.1111/j.1398-9995.2007.01393.x, 2007.
D'Amico, G., Amodeo, A., Baars, H., Binietoglou, I., Freudenthaler, V., Mattis, I., Wandinger, U., and Pappalardo, G.: EARLINET Single Calculus Chain – overview on methodology and strategy, Atmos. Meas. Tech., 8, 4891–4916, https://doi.org/10.5194/amt-8-4891-2015, 2015.
D'Amico, G., Amodeo, A., Mattis, I., Freudenthaler, V., and Pappalardo, G.: EARLINET Single Calculus Chain – technical – Part 1: Pre-processing of raw lidar data, Atmos. Meas. Tech., 9, 491–507, https://doi.org/10.5194/amt-9-491-2016, 2016.
Diehl, K., Quick, C., Matthias-Maser, S., Mitra, S. K., and Jaenicke, R.: The ice nucleating ability of pollen Part I: Laboratory studies in deposition and condensation freezing modes, Atmos. Res., 58, 75–87, https://doi.org/10.1016/S0169-8095(01)00091-6, 2001.
Diehl, K., Matthias-Maser, S., Jaenicke, R., and Mitra, S. K.: The ice nucleating ability of pollen: Part II. Laboratory studies in immersion and contact freezing modes, Atmos. Res., 61, 125–133, https://doi.org/10.1016/S0169-8095(01)00132-6, 2002.
Engelmann, R., Kanitz, T., Baars, H., Heese, B., Althausen, D., Skupin, A., Wandinger, U., Komppula, M., Stachlewska, I. S., Amiridis, V., Marinou, E., Mattis, I., Linné, H., and Ansmann, A.: The automated multiwavelength Raman polarization and water-vapor lidar PollyXT: the neXT generation, Atmos. Meas. Tech., 9, 1767–1784, https://doi.org/10.5194/amt-9-1767-2016, 2016.
Gabey, A. M., Gallagher, M. W., Whitehead, J., Dorsey, J. R., Kaye, P. H., and Stanley, W. R.: Measurements and comparison of primary biological aerosol above and below a tropical forest canopy using a dual channel fluorescence spectrometer, Atmos. Chem. Phys., 10, 4453–4466, https://doi.org/10.5194/acp-10-4453-2010, 2010.
García-Mozo, H.: Poaceae pollen as the leading aeroallergen worldwide: A review, Allergy, 72, 1849–1858, https://doi.org/10.1111/ALL.13210, 2017.
Gilles, S., Blume, C., Wimmer, M., Damialis, A., Meulenbroek, L., Gökkaya, M., Bergougnan, C., Eisenbart, S., Sundell, N., Lindh, M., Andersson, L. M., Dahl, Å., Chaker, A., Kolek, F., Wagner, S., Neumann, A. U., Akdis, C. A., Garssen, J., Westin, J., van't Land, B., Davies, D. E., and Traidl-Hoffmann, C.: Pollen exposure weakens innate defense against respiratory viruses, Allergy, 75, 576–587, https://doi.org/10.1111/all.14047, 2020.
Griffiths, P. T., Borlace, J.-S., Gallimore, P. J., Kalberer, M., Herzog, M., and Pope, F. D.: Hygroscopic growth and cloud activation of pollen: a laboratory and modelling study, Atmos. Sci. Lett., 13, 289–295, https://doi.org/10.1002/asl.397, 2012.
Groß, S., Freudenthaler, V., Wirth, M., and Weinzierl, B.: Towards an aerosol classification scheme for future EarthCARE lidar observations and implications for research needs, Atmos. Sci. Lett., 16, 77–82, https://doi.org/10.1002/ASL2.524, 2015.
Halbritter, H. and Heigl, H.: PalDat – A palynological database, https://www.paldat.org/ (last access: 1 October 2021), 2020.
Hirst, J. M.: An automatic volumetric spore trap, Ann. Appl. Biol., 39, 257–265, https://doi.org/10.1111/j.1744-7348.1952.tb00904.x, 1952.
IPCC: Climate Change 2013: The Physical Science Basis, in: Contribution of Working Group I to the Fifth Assessment Report of the Intergovernmental Panel on Climate Change, edited by: Stocker, T. F., Qin, D., Plattner, G.-K., Tignor, M., Allen, S. K., Boschung, J., Nauels, A., Xia, Y., Bex, V., and Midgley, P. M., Cambridge University Press, Cambridge, United Kingdom and New York, NY, USA, https://doi.org/10.1017/CBO9781107415324, 2013.
Joly, C., Barillé, L., Barreau, M., Mancheron, A., and Visset, L.: Grain and annulus diameter as criteria for distinguishing pollen grains of cereals from wild grasses, Rev. Palaeobot. Palynol., 146, 221–233, https://doi.org/10.1016/J.REVPALBO.2007.04.003, 2007.
Kim, M.-H., Omar, A. H., Tackett, J. L., Vaughan, M. A., Winker, D. M., Trepte, C. R., Hu, Y., Liu, Z., Poole, L. R., Pitts, M. C., Kar, J., and Magill, B. E.: The CALIPSO version 4 automated aerosol classification and lidar ratio selection algorithm, Atmos. Meas. Tech., 11, 6107–6135, https://doi.org/10.5194/amt-11-6107-2018, 2018.
Mamouri, R. E. and Ansmann, A.: Fine and coarse dust separation with polarization lidar, Atmos. Meas. Tech., 7, 3717–3735, https://doi.org/10.5194/amt-7-3717-2014, 2014.
Mattis, I., D'Amico, G., Baars, H., Amodeo, A., Madonna, F., and Iarlori, M.: EARLINET Single Calculus Chain – technical – Part 2: Calculation of optical products, Atmos. Meas. Tech., 9, 3009–3029, https://doi.org/10.5194/amt-9-3009-2016, 2016.
Miffre, A., Cholleton, D., and Rairoux, P.: On the use of light polarization to investigate the size, shape, and refractive index dependence of backscattering Ångström exponents, Opt. Lett., 45, 1084–1087, https://doi.org/10.1364/OL.385107, 2020.
Miki, K. and Kawashima, S.: Estimation of pollen counts from light scattering intensity when sampling multiple pollen taxa – establishment of an automated multi-taxa pollen counting estimation system (AME system), Atmos. Meas. Tech., 14, 685–693, https://doi.org/10.5194/amt-14-685-2021, 2021.
Mishchenko, M. I., Travis, L. D., and Lacis, A. A.: Scattering, absorption, and emission of light by small particles, Cambridge University Press, Cambridge, UK, ISBN: 9780521782524, 2002.
Nicolae, D., Vasilescu, J., Talianu, C., Binietoglou, I., Nicolae, V., Andrei, S., and Antonescu, B.: A neural network aerosol-typing algorithm based on lidar data, Atmos. Chem. Phys., 18, 14511–14537, https://doi.org/10.5194/acp-18-14511-2018, 2018.
Nilsson, S. T., Siwert T., Praglowski, J., and Nilsson, L.: Atlas of airborne pollen grains and spores in northern Europe, Natur o. kultur, https://agris.fao.org/agris-search/search.do?recordID=SE7801026 (last access: 17 June 2020), 1977.
Noh, Y. M., Müller, D., Lee, H., and Choi, T. J.: Influence of biogenic pollen on optical properties of atmospheric aerosols observed by lidar over Gwangju, South Korea, Atmos. Environ., 69, 139–147, https://doi.org/10.1016/j.atmosenv.2012.12.018, 2013a.
Noh, Y. M., Lee, H., Mueller, D., Lee, K., Shin, D., Shin, S., Choi, T. J., Choi, Y. J., and Kim, K. R.: Investigation of the diurnal pattern of the vertical distribution of pollen in the lower troposphere using LIDAR, Atmos. Chem. Phys., 13, 7619–7629, https://doi.org/10.5194/acp-13-7619-2013, 2013b.
Oteros, J., Pusch, G., Weichenmeier, I., Heimann, U., Möller, R., Röseler, S., Traidl-Hoffmann, C., Schmidt-Weber, C., and Buters, J. T. M.: Automatic and Online Pollen Monitoring, Int. Arch. Allergy Imm., 167, 158–166, https://doi.org/10.1159/000436968, 2015.
Pérez, C., Haustein, K., Janjic, Z., Jorba, O., Huneeus, N., Baldasano, J. M., Black, T., Basart, S., Nickovic, S., Miller, R. L., Perlwitz, J. P., Schulz, M., and Thomson, M.: Atmospheric dust modeling from meso to global scales with the online NMMB/BSC-Dust model – Part 1: Model description, annual simulations and evaluation, Atmos. Chem. Phys., 11, 13001–13027, https://doi.org/10.5194/acp-11-13001-2011, 2011.
Pope, F. D.: Pollen grains are efficient cloud condensation nuclei, Environ. Res. Lett., 5, 44015, https://doi.org/10.1088/1748-9326/5/4/044015, 2010.
Richardson, S. C., Mytilinaios, M., Foskinis, R., Kyrou, C., Papayannis, A., Pyrri, I., Giannoutsou, E., and Adamakis, I. D. S.: Bioaerosol detection over Athens, Greece using the laser induced fluorescence technique, Sci. Total Environ., 696, 133906, https://doi.org/10.1016/j.scitotenv.2019.133906, 2019.
Rousseau, D.-D., Schevin, P., Ferrier, J., Jolly, D., Andreasen, T., Ascanius, S. E., Hendriksen, S.-E., and Poulsen, U.: Long-distance pollen transport from North America to Greenland in spring, J. Geophys. Res.-Biogeo., 113, G02013, https://doi.org/10.1029/2007JG000456, 2008.
Saito, Y., Ichihara, K., Morishita, K., Uchiyama, K., Kobayashi, F., and Tomida, T.: Remote Detection of the Fluorescence Spectrum of Natural Pollens Floating in the Atmosphere Using a Laser-Induced-Fluorescence Spectrum (LIFS) Lidar, Remote Sens., 10, 1533, https://doi.org/10.3390/rs10101533, 2018.
Salgado-Labouriau, M. L. and Rinaldi, M.: Palynology of gramineae of the venezuelan mountains, Grana, 29, 119–128, https://doi.org/10.1080/00173139009427742, 2009.
Sassen, K.: Boreal tree pollen sensed by polarization lidar: Depolarizing biogenic chaff, Geophys. Res. Lett., 35, L18810, https://doi.org/10.1029/2008GL035085, 2008.
Šaulienė, I., Šukienė, L., Daunys, G., Valiulis, G., Vaitkevičius, L., Matavulj, P., Brdar, S., Panic, M., Sikoparija, B., Clot, B., Crouzy, B., and Sofiev, M.: Automatic pollen recognition with the Rapid-E particle counter: the first-level procedure, experience and next steps, Atmos. Meas. Tech., 12, 3435–3452, https://doi.org/10.5194/amt-12-3435-2019, 2019.
Sauvageat, E., Zeder, Y., Auderset, K., Calpini, B., Clot, B., Crouzy, B., Konzelmann, T., Lieberherr, G., Tummon, F., and Vasilatou, K.: Real-time pollen monitoring using digital holography, Atmos. Meas. Tech., 13, 1539–1550, https://doi.org/10.5194/amt-13-1539-2020, 2020.
Savage, N. J., Krentz, C. E., Könemann, T., Han, T. T., Mainelis, G., Pöhlker, C., and Huffman, J. A.: Systematic characterization and fluorescence threshold strategies for the wideband integrated bioaerosol sensor (WIBS) using size-resolved biological and interfering particles, Atmos. Meas. Tech., 10, 4279–4302, https://doi.org/10.5194/amt-10-4279-2017, 2017.
Shang, X., Giannakaki, E., Bohlmann, S., Filioglou, M., Saarto, A., Ruuskanen, A., Leskinen, A., Romakkaniemi, S., and Komppula, M.: Optical characterization of pure pollen types using a multi-wavelength Raman polarization lidar, Atmos. Chem. Phys., 20, 15323–15339, https://doi.org/10.5194/acp-20-15323-2020, 2020.
Shang, X., Baars, H., Stachlewska, I. S., Mattis, I., and Komppula, M.: Pollen observations at four EARLINET stations during the ACTRIS-COVID-19 campaign, Finnish Meteorological Institute [data set], https://doi.org/10.23728/fmi-b2share.959be96f095640578eb5a7dc335c8b46, 2021.
Sicard, M., Izquierdo, R., Alarcón, M., Belmonte, J., Comerón, A., and Baldasano, J. M.: Near-surface and columnar measurements with a micro pulse lidar of atmospheric pollen in Barcelona, Spain, Atmos. Chem. Phys., 16, 6805–6821, https://doi.org/10.5194/acp-16-6805-2016, 2016.
Siljamo, P., Sofiev, M., Filatova, E., Grewling, Ł., Jäger, S., Khoreva, E., Linkosalo, T., Ortega Jimenez, S., Ranta, H., Rantio-Lehtimäki, A., Svetlov, A., Veriankaite, L., Yakovleva, E., and Kukkonen, J.: A numerical model of birch pollen emission and dispersion in the atmosphere. Model evaluation and sensitivity analysis, Int. J. Biometeorol., 57, 125–136, https://doi.org/10.1007/S00484-012-0539-5, 2013.
Skjøth, C. A., Sommer, J., Stach, A., Smith, M., and Brandt, J.: The long-range transport of birch (Betula) pollen from Poland and Germany causes significant pre-season concentrations in Denmark, Clin. Exp. Allergy, 37, 1204–1212, https://doi.org/10.1111/j.1365-2222.2007.02771.x, 2007.
Sofiev, M.: On impact of transport conditions on variability of the seasonal pollen index, Aerobiologia (Bologna), 33, 167–179, https://doi.org/10.1007/s10453-016-9459-x, 2017.
Sofiev, M., Siljamo, P., Ranta, H., Linkosalo, T., Jaeger, S., Rasmussen, A., Rantio-Lehtimaki, A., Severova, E., and Kukkonen, J.: A numerical model of birch pollen emission and dispersion in the atmosphere. Description of the emission module, Int. J. Biometeorol., 57, 45–58, https://doi.org/10.1007/s00484-012-0532-z, 2013.
Sofiev, M., Vira, J., Kouznetsov, R., Prank, M., Soares, J., and Genikhovich, E.: Construction of the SILAM Eulerian atmospheric dispersion model based on the advection algorithm of Michael Galperin, Geosci. Model Dev., 8, 3497–3522, https://doi.org/10.5194/gmd-8-3497-2015, 2015a.
Sofiev, M., Berger, U., Prank, M., Vira, J., Arteta, J., Belmonte, J., Bergmann, K.-C., Chéroux, F., Elbern, H., Friese, E., Galan, C., Gehrig, R., Khvorostyanov, D., Kranenburg, R., Kumar, U., Marécal, V., Meleux, F., Menut, L., Pessi, A.-M., Robertson, L., Ritenberga, O., Rodinkova, V., Saarto, A., Segers, A., Severova, E., Sauliene, I., Siljamo, P., Steensen, B. M., Teinemaa, E., Thibaudon, M., and Peuch, V.-H.: MACC regional multi-model ensemble simulations of birch pollen dispersion in Europe, Atmos. Chem. Phys., 15, 8115–8130, https://doi.org/10.5194/acp-15-8115-2015, 2015b.
Soreng, R. J., Peterson, P. M., Romaschenko, K., Davidse, G., Zuloaga, F. O., Judziewicz, E. J., Filgueiras, T. S., Davis, J. I., and Morrone, O.: A worldwide phylogenetic classification of the Poaceae (Gramineae), J. Syst. Evol., 53, 117–137, https://doi.org/10.1111/JSE.12150, 2015.
Steiner, A. L., Brooks, S. D., Deng, C., Thornton, D. C. O., Pendleton, M. W., and Bryant, V.: Pollen as atmospheric cloud condensation nuclei, Geophys. Res. Lett., 42, 3596–3602, https://doi.org/10.1002/2015GL064060, 2015.
Szczepanek, K., Myszkowska, D., Worobiec, E., Piotrowicz, K., Ziemianin, M., and Bielec-Bąkakowska, Z.: The long-range transport of Pinaceae pollen: an example in Kraków (southern Poland), Aerobiologia, 33, 109–125, https://doi.org/10.1007/s10453-016-9454-2, 2017.
Veselovskii, I., Hu, Q., Goloub, P., Podvin, T., Choël, M., Visez, N., and Korenskiy, M.: Mie–Raman–fluorescence lidar observations of aerosols during pollen season in the north of France, Atmos. Meas. Tech., 14, 4773–4786, https://doi.org/10.5194/amt-14-4773-2021, 2021.
von Blohn, N., Mitra, S. K., Diehl, K., and Borrmann, S.: The ice nucleating ability of pollen: Part III: New laboratory studies in immersion and contact freezing modes including more pollen types, Atmos. Res., 78, 182–189, https://doi.org/10.1016/j.atmosres.2005.03.008, 2005.