the Creative Commons Attribution 4.0 License.
the Creative Commons Attribution 4.0 License.
 | 22 Mar 2022
What caused a record high PM10 episode in northern Europe in October 2020?
Wenche Aas
Sabine Eckhardt
Nikolaos Evangeliou
Paul Hamer
Mona Johnsrud
Arve Kylling
Stephen M. Platt
Kerstin Stebel
Hilde Uggerud
Karl Espen Yttri
In early October 2020, northern Europe experienced an episode with poor air quality due to high concentrations of particulate matter (PM). At several sites in Norway, recorded weekly values exceeded historical maximum PM10 concentrations from the past 4 to 10 years. Daily mean PM10 values at Norwegian sites were up to 97 µg m−3 and had a median value of 59 µg m−3. We analysed this severe pollution episode caused by long-range atmospheric transport based on surface and remote sensing observations and transport model simulations to understand its causes. Samples from three sites in mainland Norway and the Arctic remote station Zeppelin (Svalbard) showed strong contributions from mineral dust to PM10 (23 %–36 % as a minimum and 31 %–45 % as a maximum) and biomass burning (8 %–16 % to 19 %–21 %). Atmospheric transport simulations indicate that Central Asia was the main source region for mineral dust observed in this episode. The biomass burning fraction can be attributed to forest fires in Ukraine and southern Russia, but we cannot exclude other sources contributing, like fires elsewhere, because the model underestimates observed concentrations. The combined use of remote sensing, surface measurements, and transport modelling proved effective in describing the episode and distinguishing its causes.
- Article
(10353 KB) - Full-text XML
-
Supplement
(65827 KB) - BibTeX
- EndNote


In early October 2020, atmospheric concentrations of PM10 and PM2.5, i.e. particulate matter (PM) with an equivalent aerodynamic diameter of ≤10 and ≤2.5 µm, were elevated at many stations in northern Europe (Fig. 1), exceeding international and national air quality guidelines (AQGs) (WHO, 2006). On 2 and/or 3 October, daily mean EU-limit values for PM10 of 50 µg m−3 were exceeded at 45 of the European Environment Agency's (EEA) air quality urban and regional background sites (Fig. 1). In Norway, daily averaged PM10 values exceeded previous maximum values recorded at several sites. Visibility was strongly reduced, and questions concerning the source of these pollutants and possible influence on health arose (e.g. Aftenposten, 2020).
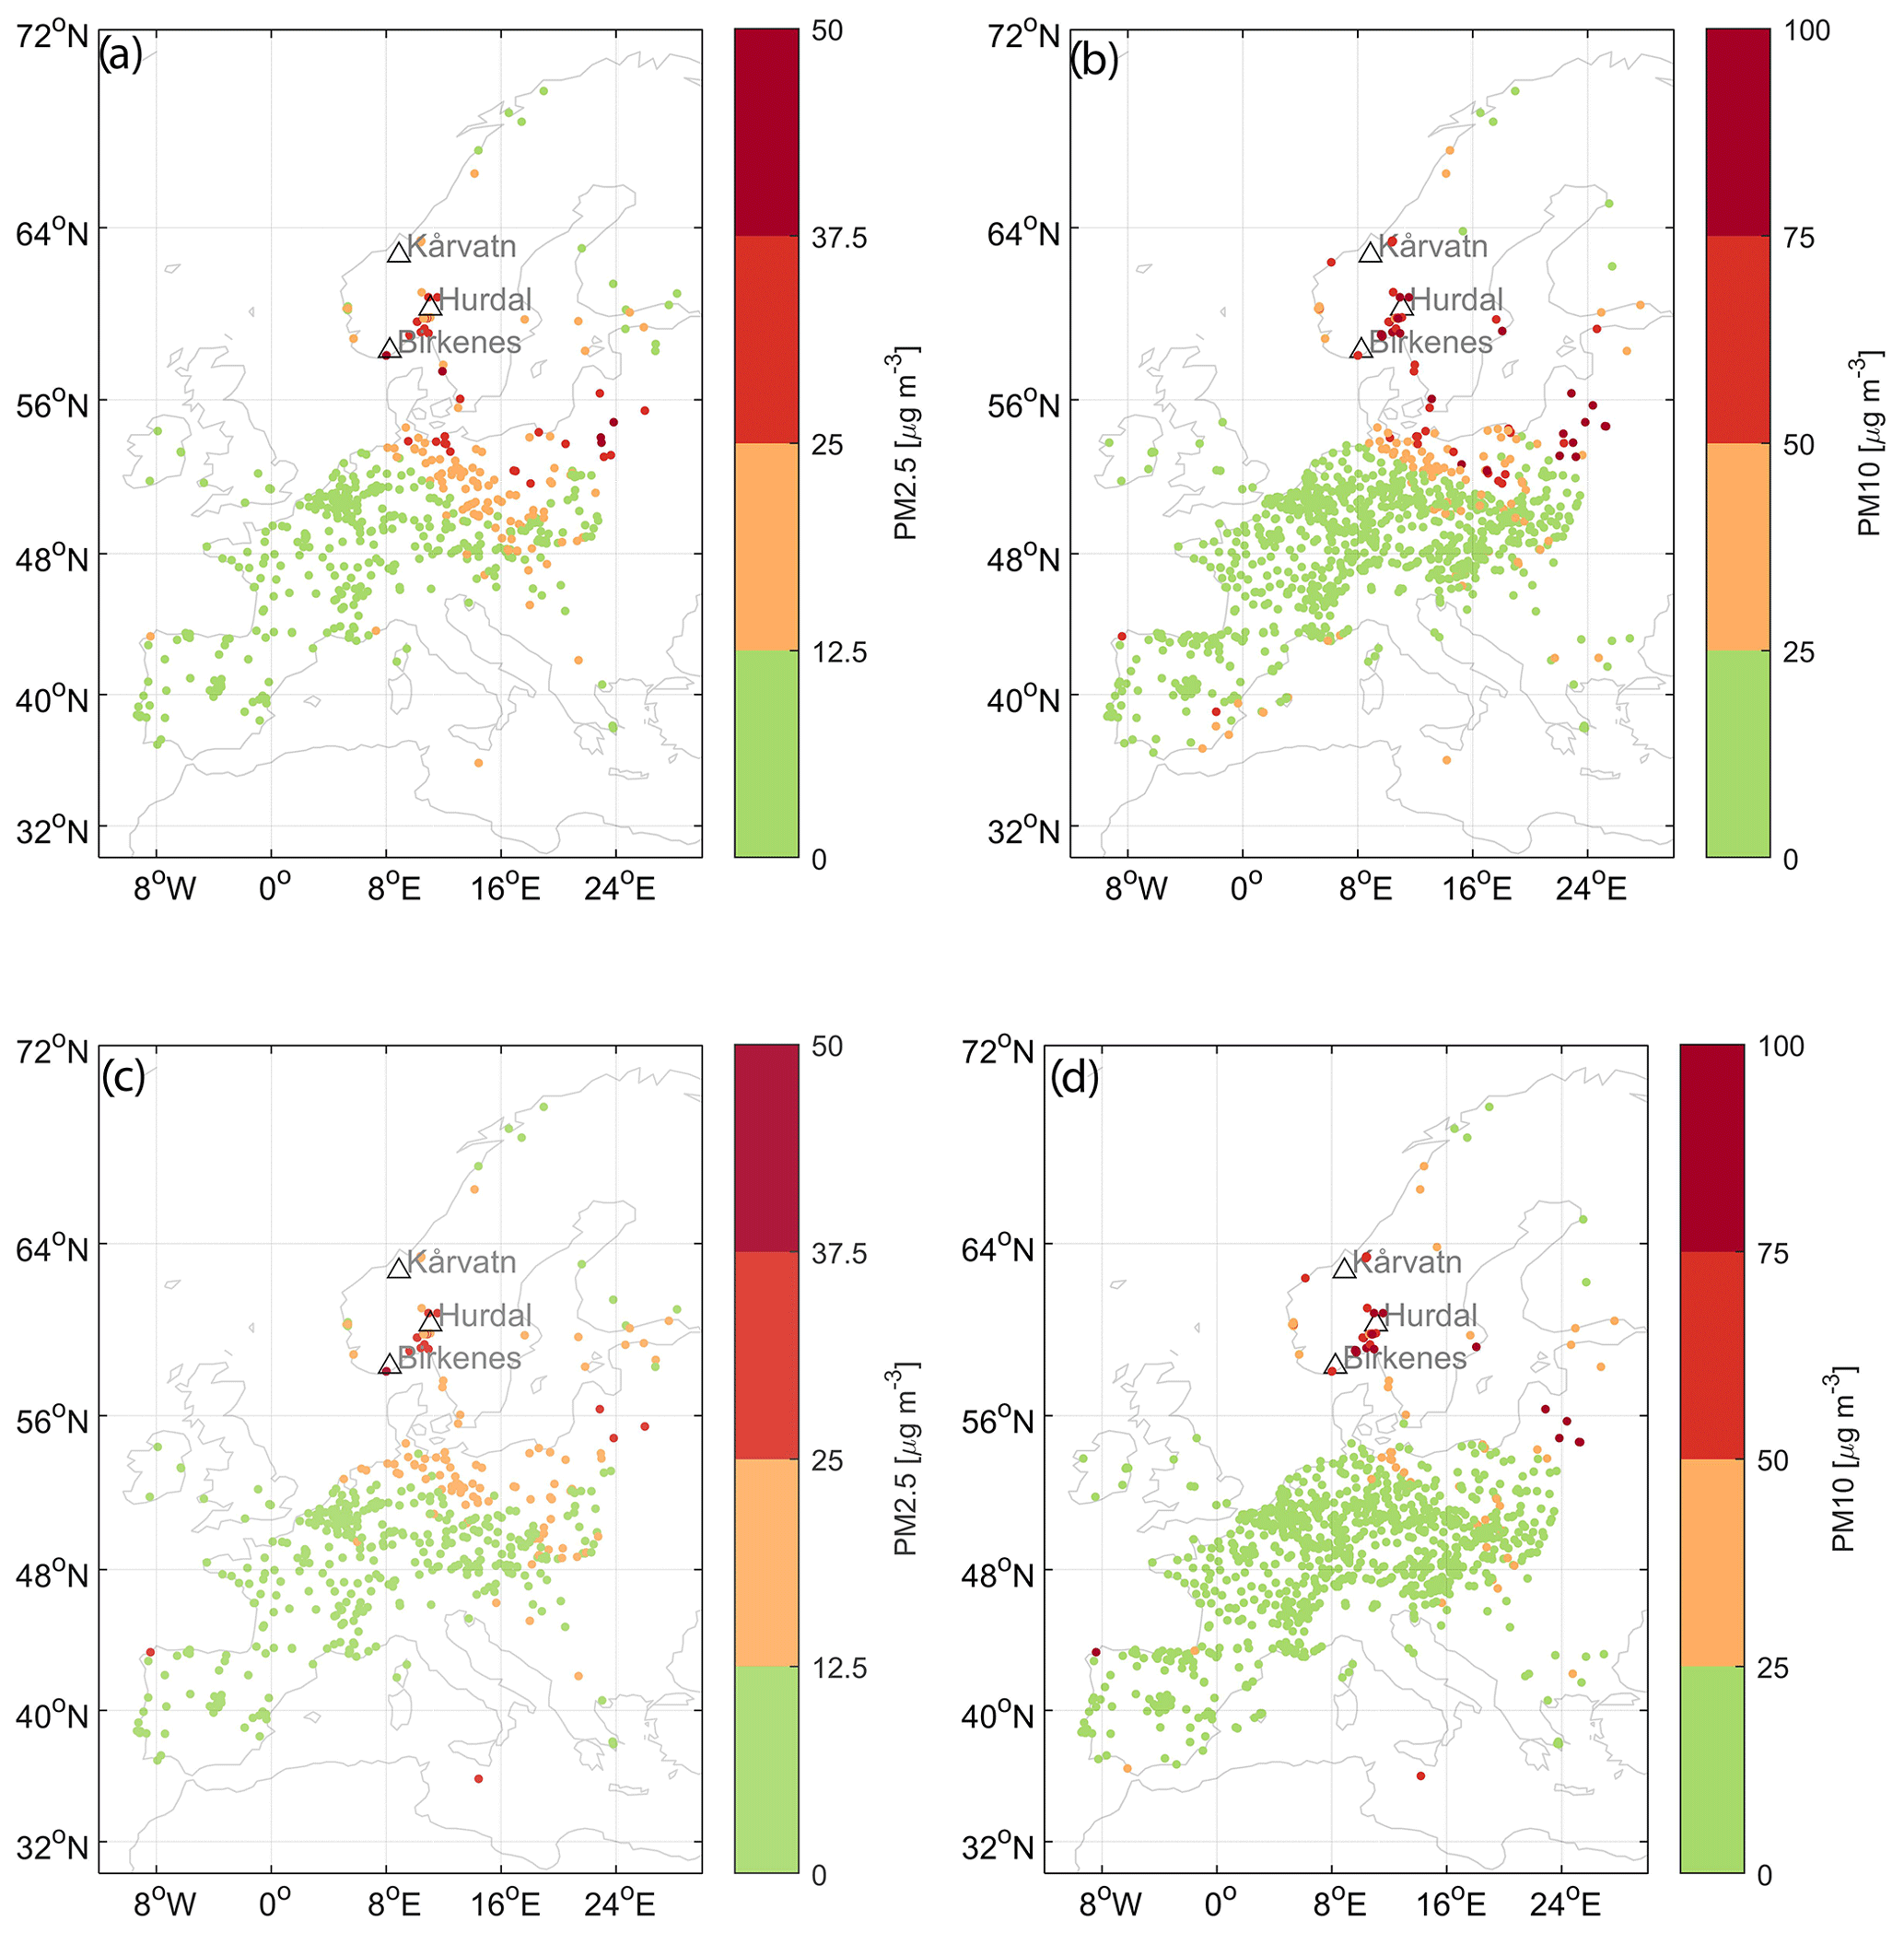
Figure 1Mean PM2.5 (a, c) and PM10 (b, d) values (EEA, 2020) on 2 (a, b) and 3 (c, d) October 2020 (24 h mean) at all EEA air quality background sites (includes urban as well as rural, but sites close to roads are excluded). Triangles indicate three Norwegian rural background sites with extensive PM speciation (Sect. 2.1.1). For comparison, the WHO air quality guidelines for maximum daily averaged PM10 and PM2.5 are 50 and 25 µg m−3, respectively, and the EU-limit value for PM10 is 50 µg m−3.
PM levels are usually increased in winter and spring compared to summer in urban areas in northern Europe, which is largely explained by increased emissions from residential wood burning and resuspension of road dust generated by use of studded tires, contributing to the fine and the coarse fraction of PM10, respectively (Kukkonen et al., 2020; Laupsa et al., 2009; Yttri et al., 2009, 2005). However, in this case the widespread exceedance of PM10 values, not only in Norway, pointed to long-range transport (LRT) of PM. Violation of limit values caused by LRT of PM in Norway rarely occurs. Historically, high levels of LRT of PM have been associated with secondary inorganic aerosol species, SO, NO, and NH, formed by atmospheric oxidation of European SO2, NH3, and NOx emissions (e.g. Tarrasón et al., 2019; Yttri et al., 2021). A fast-track analysis showed that the source of the increased concentrations could have been biomass burning in eastern Europe. However, the fact that concentrations of coarse-fraction PM10 were also enhanced suggested that sources such as dust, ash, and sea salt aerosol could also be important. Out of these, mineral dust (from agricultural or natural sources) is the most likely aerosol based on the region with enhanced PM levels (Fig. 1).
Events of LRT of mineral dust to Scandinavia are rare. Mineral dust outbreaks from the Sahara can reach the surface in Scandinavia (e.g. Ansmann et al., 2003), although the dust plumes likely reside at higher altitudes. An aerosol transport event with combined contributions from biomass burning from the Iberian Peninsula and dust emissions from North Africa, affecting several regions in Europe, was described by Akritidis et al. (2020). Also, transport events of mineral dust from Kazakhstan have been shown to affect Scandinavia (e.g. Hongisto and Sofiev, 2004). Besides affecting surface concentrations of PM and air quality, airborne dust can strongly influence the radiation budget of the atmosphere, both directly and indirectly (e.g. Kylling et al., 2018; Myhre et al., 2013).
LRT events of aerosol particles from biomass burning have been frequently observed in Scandinavia (e.g. Yttri et al., 2007b; Saarikoski et al., 2007), including the European Arctic (Stohl et al., 2007), and can be related to wildfires and agricultural waste burning in the Baltic countries, western Russia, Belarus, and Ukraine. Fires release various particulate and gaseous substances such as organic and black carbon (OC and BC), CO2, CH4, and polycyclic aromatic hydrocarbons (PAHs) (Hao et al., 2016; Hao and Ward, 1993; Shi et al., 2015), some of which have an adverse effect on human health, such as benzo(a)pyrene, a group 1 carcinogen (IARC, 2021).
To quantify biomass burning contributions to PM we analyse filter samples for carbonaceous aerosol as well as levoglucosan (a biomass burning tracer). LRT modelling of the biomass burning aerosol in this study is based on BC, which is formed by the incomplete combustion of, for example, fossil fuels, biofuels, and biomass (Bond et al., 2013). BC not only affects human health (Lelieveld et al., 2015), but also climate (Myhre et al., 2013).
Here, we show how LRT of mineral dust from Central Asia and biomass burning aerosol, mainly from Ukraine, caused elevated PM levels in Norway. Our results are based on a combination of in situ observations, satellite images, and model simulations of long-range atmospheric transport.
2.1 Surface observations
2.1.1 Sites and instrumentation
There are 48 (urban categorized) sites in Norwegian cities and towns measuring both PM10 and PM2.5 mass concentration as part of their air quality programme (Hak, 2015). Rural background stations include the Birkenes Observatory (58∘23′ N, 8∘15′ E; 219 m above sea level, a.s.l.), Hurdal (60∘22 N, 11∘4′ E; 300 m a.s.l.), and Kårvatn (62∘47′ N, 8∘53′ E; 210 m a.s.l.). These are all EMEP (European Monitoring and Evaluation Programme) sites located in southern Norway (Fig. 1). The Birkenes Observatory is situated close to the Skagerrak coast (∼20 km), whereas Hurdal and Kårvatn are further inland. Forests dominate the land use at all three sites, with the remainder being meadows, low-intensity agricultural areas, and freshwater lakes. All three sites are thus considered rural background sites for air quality measurements. The Zeppelin Observatory (78∘54′ N 11∘52′ E; 472 m a.s.l.) is located on the Zeppelin Mountain 2 km south of the Ny-Ålesund settlement at the west coast of Svalbard (Norway) and is considered an Arctic remote/global background site. PM mass concentration (PM10 and PM2.5), organic and elemental carbon () (in PM10 and PM2.5), organic tracers (levoglucosan, mannosan, galactosan, arabitol, mannitol, glucose, trehalose, 2-methylerythritol, and 2-methylthreitol) (in PM10), and crustal elements (Al, Fe, Mn, and Ti) (in PM10) were obtained from low-volume samplers (flow rate of 38 L min−1) with a sampling time of 1 week at the rural background sites. Prefired (850 ∘C; 3 h) quartz fibre filters (Whatman QM-A; 47 mm in diameter) were conditioned (20±1 ∘C; 50±5 % RH (relative humidity); 48 h) before and after exposure. Filters were stored at 4 ∘C after weighing and before analysis and at −18 ∘C prior to organic tracer analysis. Please find further details on the analysis methods in Appendix A.
At the Zeppelin Observatory, , organic tracers, and crustal elements were obtained from a high-volume sampler with a PM10 inlet (flow rate of 667 L min−1) and with a sampling time of 1 week. Quartz fibre filters (Pallflex Tissuquartz 2500QAT-UP; 150 mm in diameter) were prefired (850 ∘C; 3 h) but not conditioned, and they were stored at −18 ∘C.
Major inorganic anions (SO, NO, Cl−) and cations (Ca2+, Mg2+, K+, Na+, NH) were collected using a NILU stacked filter unit (SFU) collecting aerosol particles on a Teflon filter (2 µm pore, 47 mm Zefluor Teflon, Gelman Sciences) with a sampling time of 24 h. The SFU does not have a pre-impactor but has a downward-facing inlet that effectively reduces the sampling efficiency for aerosol particles with an equivalent aerodynamic diameter larger than 10 µm.
PM10 mass concentration was measured using a TEOM 1400a (Tapered Element Oscillating Monitor) (Patashnick and Rupprecht, 1991) instrument operating at a 1 min time resolution at the Birkenes Observatory. The aggregated weekly mean PM10 concentration obtained by the TEOM instrument is proven equivalent to the weekly time resolved, filter-based PM10 measurements at Birkenes, which is determined according to the reference method EN 12341 (CEN, 2014).
Absorption coefficients (BAbs) were measured using a seven-wavelength (λ= 370, 470, 520, 590, 660, 880, and 950 nm) Aethalometer (AE33, Magee Scientific) operating downstream of a PM10 inlet and calculated according to Drinovec et al. (2015) at the Birkenes and Zeppelin observatories. BAbs was converted to equivalent black carbon (eBC) using co-located EC measurements.
2.1.2 Mineral dust mass estimation
We assumed observed levels of Al, Fe, Mn, and Ti to be associated with mineral dust exclusively and that Al was present as Al2O3, Fe as Fe2O3, Mn as MnO, and Ti as TiO2 (Alastuey et al., 2016). Not all mineral dust elements were measured, such as Si, nor is the mineralogy of the mineral dust collected on the filter samples known; thus, SiO2 was estimated based on an empirical factor (Eq. 1) (Alastuey et al., 2016). We also made assumptions regarding the speciation of CO, assuming 70 % was present as CaCO3, 20 % as MgCO3, and 10 % as K2CO3. The exact CO speciation is, however, of minor importance, as the CO fraction increases the lower mineral dust estimate (Eq. 2) by only 6.3 % (assuming all is MgCO3) to 10 % (assuming all is K2CO3), using data for Zeppelin as an example. Ca2+ and Mg2+, assumed to be associated with CO, were not considered part of the water-soluble fraction determined by ion chromatography (see Appendix A for a description of the ion chromatography method). Excess Ca2+, Mg2+, and K+ (i.e. not part of sea salt aerosol or K2CO3) were assumed to be present as oxides (CaO, MgO, and K2O), which together with the carbonates and metal oxides provided the upper mineral dust estimate (Eq. 3). We consider this an approximation, as chemical reactions likely take place during atmospheric transport. Both NO and SO were enhanced during the episode and could indicate the presence of, for example, Mg(NO3)2 and MgSO4 formed from reactions between MgCO3 and acids such as HNO3 or H2SO4 (Laskin et al., 2005). Accounting for such reactions would increase the upper mineral dust estimate (Eq. 3) by 12 %–21 %. However, it is not apparent that nitrates and sulfates formed this way should be apportioned to the mineral dust fraction. Finally, ion equivalent calculations suggest that all SO and NO were associated with NH; thus, we do not include these potential reactions in the upper estimate of mineral dust.
CO can also be part of wildfire emissions and is a dominant species of ash produced at around 500 ∘C, with CaCO3 being the most abundant species followed by MgCO3 and K2CO3 (Bodí et al., 2014). Hence, it is questionable whether CO should be apportioned as mineral dust or biomass burning when such emissions are mixed in the atmosphere. At temperatures >580 ∘C, carbonates dissociate to oxides (Bodí et al., 2014), which are partially soluble in water; thus, as for CO, it is not clear if CaO, MgO, and K2O should be part of mineral dust or biomass burning particles. Consequently, any attempt to reconstruct the mineral dust mass concentration should be considered semi-quantitative. We thus calculate a lower (Eq. 2) and an upper (Eq. 3) estimate of the mineral dust mass concentration including no or all CO and oxides, respectively. With CO and oxides apportioned to mineral dust (Eq. 3), an upper estimate of BB (Eq. 8) would not be possible and vice versa.
2.1.3 Biomass burning mass estimation
Levoglucosan is formed from the thermal degradation of cellulose and is a proven tracer of biomass burning (BB) emissions (Locker, 1988; Simoneit et al., 1999) as demonstrated in numerous papers (e.g. Zdráhal et al., 2002; Puxbaum et al., 2007; Szidat et al., 2009; Yttri et al., 2019). Emission ratios of levoglucosan from wildfires are likely to vary widely, reflecting combustion conditions and vegetation, as well as source region. Here we apply emission ratios for total carbon and organic carbon (Yttri et al., 2014) to calculate OCBB and ECBB, which are derived from ambient sampling of wildfires emissions in eastern Europe, including Ukraine (Saarikoski et al., 2007). Calculated concentrations of OCBB and ECBB should be considered semi-quantitative given the uncertainty of the emission ratios and the potential atmospheric degradation of levoglucosan.
Although BB aerosol from wildfires is dominated by carbonaceous aerosol, carbonates and oxides can result from wildfires, as well as being a part of mineral dust. Hence, we calculated a lower estimate of the biomass burning aerosol accounting for the carbonaceous fraction () (Eqs. 4–7) and an upper estimate accounting for carbonates and oxides, in addition to the carbonaceous fraction (Eq. 8). For Eqs. (4), (5), and (10), notations in parentheses are emissions ratios.
where BBmass is the mass concentration (µg m−3) of the biomass burning aerosol.
For aerosol particles dominated by biomass burning, a factor of 2.2–2.6 to convert OCBB (µg C m−3) to OMBB (organic matter; µg m−3) is recommended, whereas 1.9–2.2 is suggested for aged aerosol particles (Turpin and Lim, 2001). Here we used a factor of 2.2 both for OCBB and OC, as OC at rural background and remote sites largely is long-range transported and thus aged. Similarly, a factor of 1.1 was used for both ECBB and EC (Kiss et al., 2002).
We estimated levels of primary biological aerosol particles (PBAPs), biogenic secondary organic aerosol (BSOA), and fossil fuel sources (FF), as these are complementary to BB and yield a better constraint on the biomass burning source. For PBAPs, we used observed levels of arabitol, mannitol, glucose, and trehalose (ΣPBAP−Tracers) (Table 1); an OC-to-ΣPBAP−Tracers ratio of 14.6±2.1 derived from Yttri et al. (2021); and an OM:OC conversion factor of 1.75 (Yttri et al., 2011) to calculate OMPBAP (unit: µg m−3). OMBSOA was estimated based on observed levels of 2-methyltetrols ( 2-methylerythritol and 2-methylthreitol) (Table 2), an OC-to-ΣBSOA−tracers ratio of 165±18 derived from Yttri et al. (2021), and an OM:OC conversion factor of 2.2 (Turpin and Lim, 2001). Yttri et al. (2021) found that 2-methyltetrols traced local BSOA, which was 30 % of total identified BSOA constituents in PM10; hence total OMBSOA was adjusted accordingly. EC from fossil fuel sources (ECFF) was calculated according to Eq. (9):
where ECBB is obtained from Eq. (6).
Table 1Mean concentrations of PM and associated species observed during the episode compared to the long-term weekly mean (±SD) for September–November (2010/11–2019) for Birkenes, Hurdal, Kårvatn, and Zeppelin, except crustal elements at Birkenes (2014–2019) and Zeppelin (2018–2019), as well as and organic tracers at Zeppelin (2017–2019).
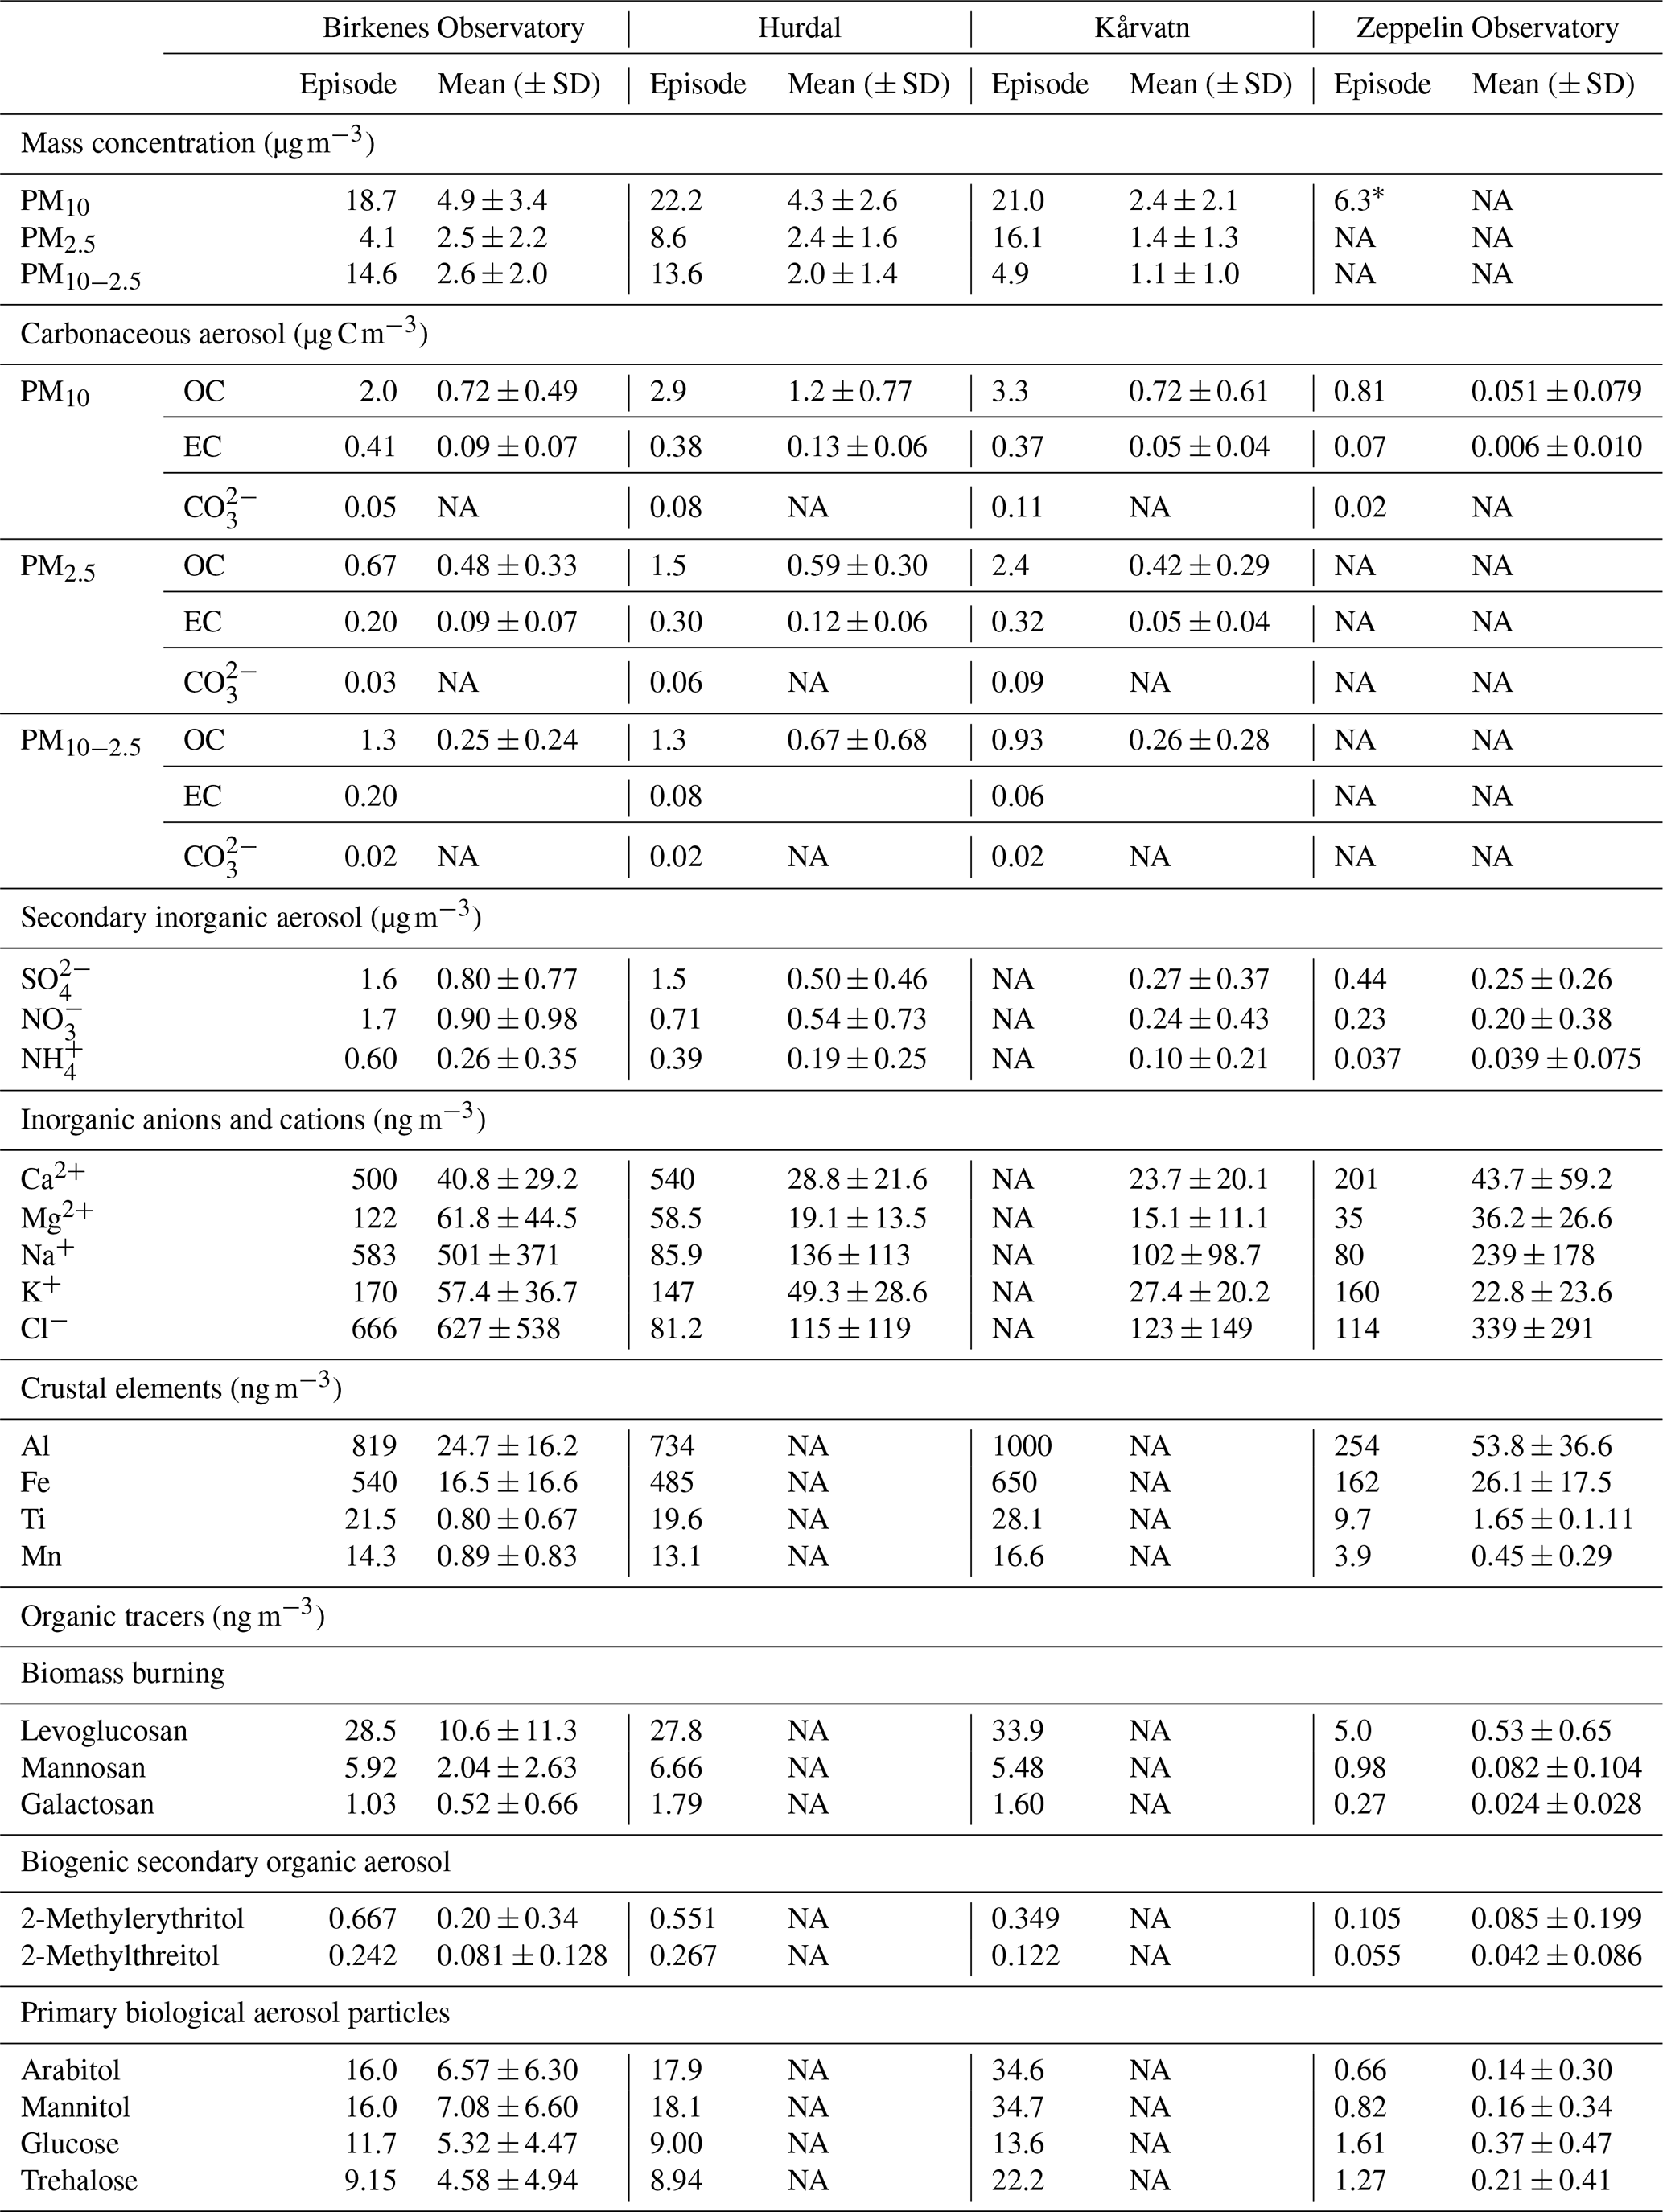
* Based on reconstructed mass. NA: not available.
OC from fossil fuel sources (OCFF) was calculated according to Eq. (10):
where the ratio (2.0±0.25) derived from Yttri et al. (2021) includes both primary and secondary OC. An OM:OC conversion factor of 1.2 was applied for OCFF and 1.1 for ECFF. As for BBmass we used the index “mass” in PBAPmass, BSOAmass, and FFmass to impress that the unit is µg m−3.
2.1.4 Source apportionment of the absorption coefficient into eBCBB and eBCFF
We used positive matrix factorization with a multilinear engine (PMF-ME2) (Canonaco et al., 2013) and SoFi Pro software (Canonaco et al., 2021) to apportion eBCBB and eBCFF based on observations of the absorption coefficient. PMF yields factor profiles (here the wavelength-dependent absorption; see Yttri et al., 2021) and time series of the emission sources. Two-factor solutions from repeat bootstrapped PMF runs were mapped via Ångström exponents (AAEs, calculated from the factor profiles) using factor 1 = lowest AAE and factor 2 = highest AAE. An averaged two-factor solution for each site was then determined, with AAE factor 1/factor 2 of 0.94/2.01 at Birkenes and 0.8/1.7 at Zeppelin. Noting that traffic emissions may be partly biofuel derived and that residential coal combustion may be partly responsible for the high AAE factor, we identify factor 1 as fossil/liquid fuel eBC and factor 2 as biomass burning/solid fuel eBC consistent with literature AAEs for these sources (Sandradewi et al., 2008; Zotter et al., 2017).
2.2 Satellite observations
The Ocean and Land Colour Instrument (OLCI) on board the Sentinel-3 satellites (Donlon et al., 2012) measures the solar radiation reflected by the Earth's surface and atmosphere in 21 spectral bands from the visible to the near infrared. Over land and within 300 km of charted land, the ground spatial resolution is 300 m. The primary objective of OLCI products “is to screen the ocean and land surface to harvest information related to biology. OLCI also provides information on the atmosphere and contributes to climate study (Sentinel-3 OLCI, 2021)”. We use OLCI measurements to visualize the aerosol when passing over central Norway and Sweden and to investigate the effect of the aerosol on the measured OLCI radiances by comparison to radiative transfer simulations.
Furthermore, we use observations from the Cloud-Aerosol Lidar with Orthogonal Polarization (CALIOP) on board the Cloud-Aerosol Lidar and Infrared Pathfinder Satellite Observations (CALIPSO) platform. CALIPSO was launched April 2006 (Winker et al., 2009). CALIOP is a two-wavelength (1064 and 532 nm), polarization-sensitive (at 532 nm) elastic backscatter lidar, which provides global daytime and night-time profiles of aerosol backscatter, extinction (with an extinction-to-backscatter a priori), and linear particle depolarization with altitude resolution between 30 and 300 m, below 8.3 km, and between 30.1 and 40.0 km, respectively. CALIOP has a small horizontal footprint of 335 m and a revisit time of ∼16 d. Here, we utilize the level 2 data products (version 4.21) of the aerosol extinction at 532 nm to evaluate the representation of the dust and BC (from BB) plume in our atmospheric transport simulations. It is given at a spatial resolution of 60 m vertically and 5 km horizontally. The V4 level 2 cloud–aerosol discrimination (CAD) algorithm distinguishes between following tropospheric aerosol subtypes: clean marine, polluted continental/smoke, clean continental, polluted dust, elevated smoke, and dusty marine (Kim et al., 2018). The data were downloaded from the ICARE Data and Services Center (http://www.icare.univ-lille1.fr/, last access: 19 January 2021).
2.3 Radiative transfer model
To understand the processes influencing the OLCI radiances, radiative transfer simulations were made using the DISORT model (Stamnes et al., 1988; Buras et al., 2011) within the libRadtran framework (Emde et al., 2016). The subarctic summer atmosphere (Anderson et al., 1986) was adopted as the ambient atmosphere. Visible Infrared Imaging Radiometer Suite (VIIRS) measurements indicate cloud top height between about 2–4 km and cloud optical depth between 50–100 (https://worldview.earthdata.nasa.gov/, last access: 11 June 2021). Hence, for the cloudy simulations, a cloud layer of optical depth 70 was included between 2 and 3 km. For simulations over water, the Cox and Munk (1954a, b) ocean bidirectional reflectance distribution function (BRDF) was adopted. Aerosols were included using a profile based on FLEXPART simulation results over Norway (Sect. 3.1). The aerosol optical properties were prepared for input to libRadtran with the MOPSMAP tool (Gasteiger and Wiegner, 2018).
2.4 Atmospheric transport models and emission data sets
With the Lagrangian FLEXible PARTicle dispersion model FLEXPART version 10.4 (Pisso et al., 2019) we model mineral dust in forward mode and BC in both forward and backward mode. FLEXPART calculates trajectories of particles to describe transport and diffusion of tracers in the atmosphere. Particles are assumed to be spherical and influenced by gravitational settling, dry deposition, and in-cloud and below-cloud scavenging (Grythe et al., 2017). The model is widely applied for LRT modelling of fire emissions (Evangeliou et al., 2016; 2019) and dust sources (e.g. Sodemann et al., 2015).
Emissions from BB were adopted from the Copernicus Atmosphere Monitoring Services (CAMS) Global Fire Assimilation System (GFAS). CAMS GFAS assimilates fire radiative power (FRP) observations from satellite-based sensors converting the energy released during fire combustion into gases and aerosol daily fluxes (Di Giuseppe et al., 2016; Kaiser et al., 2012). Data are available globally on a regular grid with horizontal resolution of 0.1∘ from 2003 to present. FRP observations assimilated in GFAS are the NASA Terra MODIS and Aqua MODIS active fire products (https://modis-fire.umd.edu/, last access: 11 June 2021; Kaufman et al., 2003). FRP measures the heat power emitted by fires, as a result of the combustion process, and is directly related to the total biomass combusted (Wooster et al., 2005). Using land-use-dependent conversion factors, GFAS converts FRP into emission estimates of 44 smoke constituents, such as CO, CO2, CH4, and black carbon and organic matter components of the aerosol (Kaiser et al., 2012). Here, we used emissions of BC that were subsequently ingested into FLEXPART, which simulated it forward to track atmospheric LRT. The simulations were driven by operational meteorological analysis data from the European Centre for Medium-range Weather Forecast (ECMWF) of 1∘ spatial resolution and 3-hourly temporal resolution. The spatial resolution of the output was set to 0.5∘ and the temporal resolution to daily. The simulations accounted for wet and dry deposition, assuming a particle density of 1500 kg m−3, a logarithmic size distribution with an aerodynamic mean diameter of 0.25 µm, and a standard deviation of 0.3 (Hu et al., 2018; Long et al., 2013).
Besides forward simulations of BC, we also performed backward simulations based on 3-hourly releases from the rural background and remote stations to obtain the emission sensitivity and distinguish sources contributing to BC concentrations at these locations. We thereby assumed the same properties for BC as in the forward simulation. Emission sensitivity in the bottom 500 m was linked to fields of BC emissions from biomass burning based on GFAS and BC emissions from fossil fuels retrieved from the Evaluating the Climate and Air Quality Impacts of Short-Lived Pollutants (ECLIPSE) emission data set (Stohl et al., 2015; Klimont et al., 2017) on 0.5∘ resolution.
Emissions of mineral dust are calculated with the FLEXDUST module (Groot Zwaaftink et al., 2016). This module describes dust mobilization and emission as a function of (threshold) friction velocity following the approach introduced by Marticorena and Bergametti (1995). Modelled threshold friction velocity is influenced by soil moisture (Fécan et al., 1999), and sediment regions were identified based on large-scale topography (Ginoux et al., 2001). Emissions are calculated at 0.25∘ resolution and 3-hourly interval. The forward simulations include 10 size bins for dust smaller than 20 µm (diameter). For comparison to measurements based on PM10, we will here only consider the size bins with dust up to 10 µm. Based on FLEXDUST emissions, we run two forward simulations of atmospheric transport of dust with FLEXPART. The main simulation included global dust emissions, while the additional simulation included only dust from the Central Asian desert region, here defined as a square region extending from 42 to 82∘ E and 35 to 50∘ N. We chose this setup rather than backwards simulations (like we did for BC) because backwards simulations for mineral dust would have required separate simulations for each size bin and station, and this approach was thus more efficient. FLEXPART and FLEXDUST simulations of mineral dust were driven with the same meteorological forcing data as for biomass burning FLEXPART simulations.
For comparison, we also include estimates from an operational air quality forecast system. The CAMS regional ensemble forecast (Marécal et al., 2015) is composed of nine air quality models run over a European domain (30∘ W to 75∘ E and 25 to 75∘ N). Forecasts are produced daily and run for 96 h. The ensemble is taken as the median of the nine models, which has higher skill than any of individual nine models. The dust product is the median of the prognostic simulations of mineral dust from each model. Mineral dust is represented in each model by differing size bins and physics, so the dust concentration represents PM of all sizes associated with mineral dust, which may include size bins up to PM20. While each model uses its own schemes to represent the dust emissions, they all use the dust from the CAMS global model to represent initial and boundary conditions (Collin, 2021). The CAMS global model is run using IFS (Rémy et al., 2019), which simulates dust emissions, uses three size bins (0.03–0.55, 0.55–0.9, and 0.9–20 µm), and performs assimilation of satellite aerosol optical depth to update aerosol concentrations. The CAMS model data were downloaded from the Copernicus Atmospheric Data Store (https://ads.atmosphere.copernicus.eu/, last access: 18 March 2021).
Although the episode was initially mostly detected based on strong impacts on air quality at the surface, the aerosols were not only present near the surface. We will first use satellite observations to assess the vertical extent and origin of the plumes. Figure 2 presents an RGB (red, green, blue) composite of OLCI observations for 2 October 2020. First, the image clearly shows the presence of aerosols above the cloud layer over Norway/Sweden. Aerosols were thus present, in considerable amounts, at an altitude of at least 2–3 km. We will further use the OLCI measurements in combination with radiative transfer simulations to determine the absorption and scattering properties of the aerosol. Four points are marked in Fig. 2, indicating cloud only (Cloud), aerosol over cloud (Aerosol A), aerosol over water (Aerosol B), and water without visible cloud and aerosol (Water). For these four cases OLCI top-of-the-atmosphere radiance spectra were averaged over 9×9 km2. The spatially averaged spectra and their standard deviations are shown as solid lines in Fig. 3.
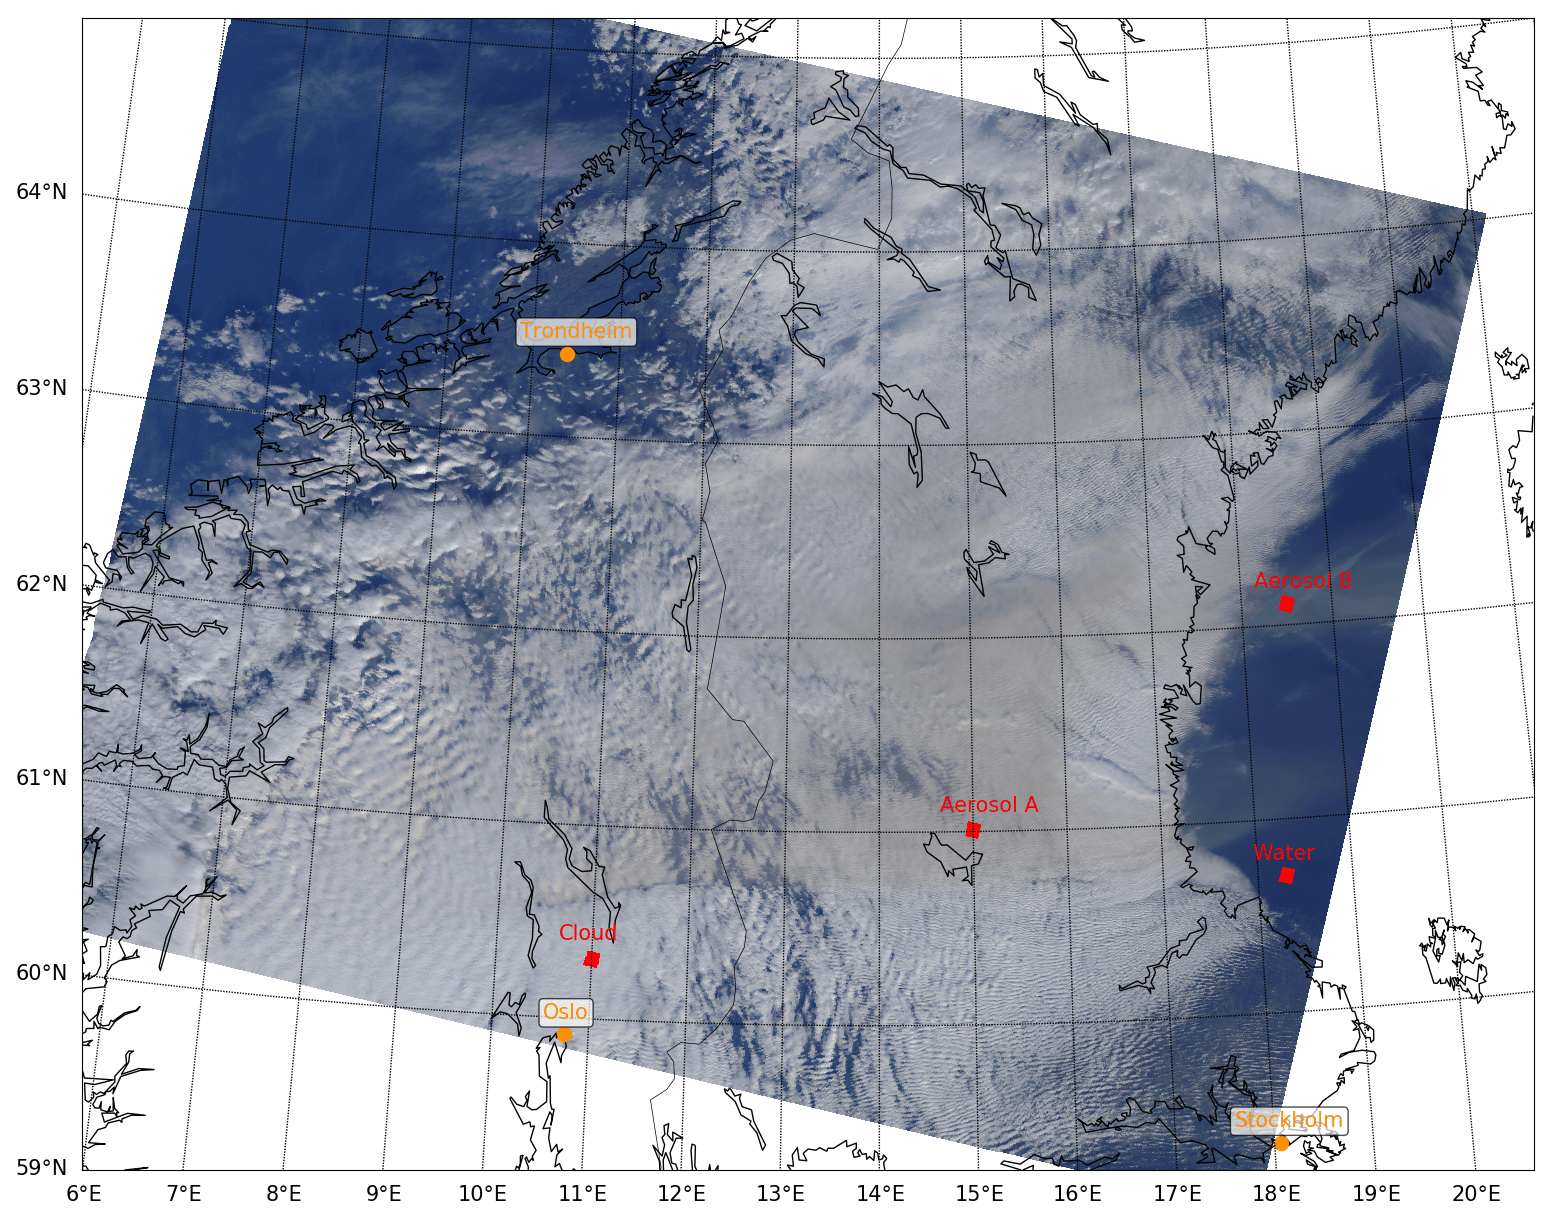
Figure 2RGB from OLCI bands 3, 6, and 8 centred at 442.5, 560, and 665 nm. Data from 2 October 2020, 09:33 UTC.
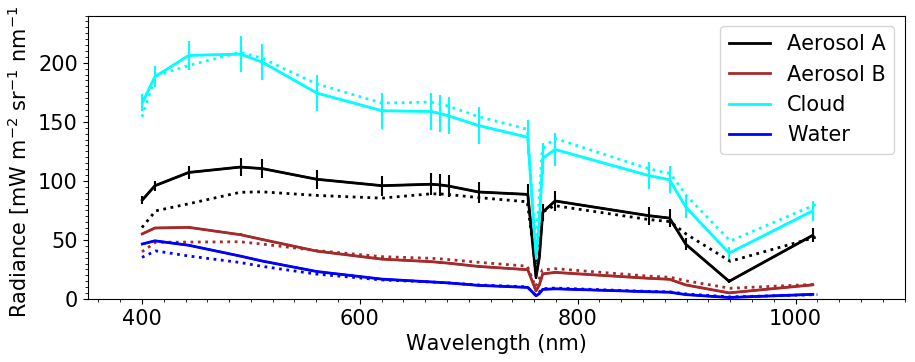
Figure 3The OLCI radiances (solid lines) at the four locations marked in Fig. 2. The error bars are standard deviation of the OLCI radiances within the square markers in Fig. 2. Note that for Aerosol B and Water the error bars are small and thus not shown. The dotted lines are radiative transfer model simulations of the OLCI measurements. See Sect. 2.3 for further details.
The aerosol reduces the radiance by about a factor of 2 when above the cloud layer due to increased absorption by the aerosol compared to the non-absorbing cloud (compare Aerosol A and Cloud in Fig. 3), while above water the aerosol increases the radiance due to increased backscattering (compare Aerosol B and Water in Fig. 3).
To elucidate the aerosol type(s) that may reproduce the OLCI radiances, radiative transfer simulations were made. These simulations required aerosol optical depth, single scattering albedo (SSA), and phase function as input. Aerosol optical depth is available from several sensors for the episode (see for example https://worldview.earthdata.nasa.gov/, last access: 11 June 2021). However, information about aerosol type and absorption and scattering properties is generally not available. Thus, simulations were made with a combination of highly scattering (resembling mineral dust) and highly absorbing aerosols (soot). The microphysical properties of the aerosol were taken from Hess et al. (2018) and the optical properties calculated by the MOPSMAP tool (Gasteiger and Wiegner, 2018). The scattering aerosols have a SSA of 0.98 at 400 nm, and it decreases to about 0.93 at 1000 nm. The absorbing aerosols have a SSA of 0.28 at 400 nm, and it decreases to about 0.1 at 1000 nm. No single aerosol type was able to reproduce the measurements; rather, various combinations of the highly scattering and highly absorbing aerosols were needed to match the measurements. The amounts of scattering and absorbing aerosols were determined by scaling the scattering and absorption aerosol optical depths to get a best match between the OLCI radiances and the simulations, solid, and dotted lines in Fig. 3 respectively. For the water case (blue lines in Fig. 3), a highly scattering optical depth (OD) of 0.45 and highly absorbing OD of 0.2, both at 550 nm, were used. For Aerosol B (clearly visible aerosol over water, red lines in Fig. 3), highly scattering OD =2.5 and highly absorbing OD =0.7, while for Aerosol A (aerosol over cloud, black lines in Fig. 3) highly scattering OD =2.1 and highly absorbing OD =0.7. Thus, the reproduction of the satellite measurements indicates that the aerosol had an absorbing component.
The episode was clearly visible from a satellite perspective, and the impact on the near-surface air quality was considerable. The 24 h mean PM10 concentrations on 2 and 3 October ranged from 8 to 97 µg m−3 at Norwegian urban sites, with a median value of 59 µg m−3. The episode thereby caused violation of the 24 h PM10 EU limit of 50 µg m−3 at 39 out of 48 Norwegian sites on 2 and/or 3 October, corresponding to 70 exceedance days in total. In comparison to years 2018 and 2019, for a selection of 30 sites with measurements in those years, this means that the number of exceedance days during the episode corresponded to 18 % of the average total exceedance days for 2018 and 2019. The number of exceedance days is used to determine whether measures to improve air quality need to be taken, and it does not distinguish whether the cause of poor air quality is due to LRT or local pollution.
During this episode, it appears that local sources were of minor importance, since 24 h mean concentrations observed at the rural background site Birkenes, of 66 and 61 µg m−3, were in the same range as the urban sites. Weekly mean concentrations at the three rural background sites ranged from 18.6–22.2 µg m−3 for PM10 and from 4.1–16.1 µg m−3 for PM2.5, with new maximum values for September–November 2010/11–2019 for all but PM2.5 at Birkenes (Fig. 4; Table 1). Reconstructed PM10 mass concentration at Zeppelin amounted to 6.3 µg m−3. A prevailing coarse fraction (PM10−2.5) of PM10 was seen at Birkenes (78 % of PM10) and Hurdal (61 %), whereas it was minor at Kårvatn (23 %). The spatial variability is not easily explained but was seen at Norwegian urban sites during the episode as well (27 %–78 % in PM Table 1). A pronounced and even dominating coarse fraction can occur when sources such as sea salt aerosol and mineral dust are prominent.
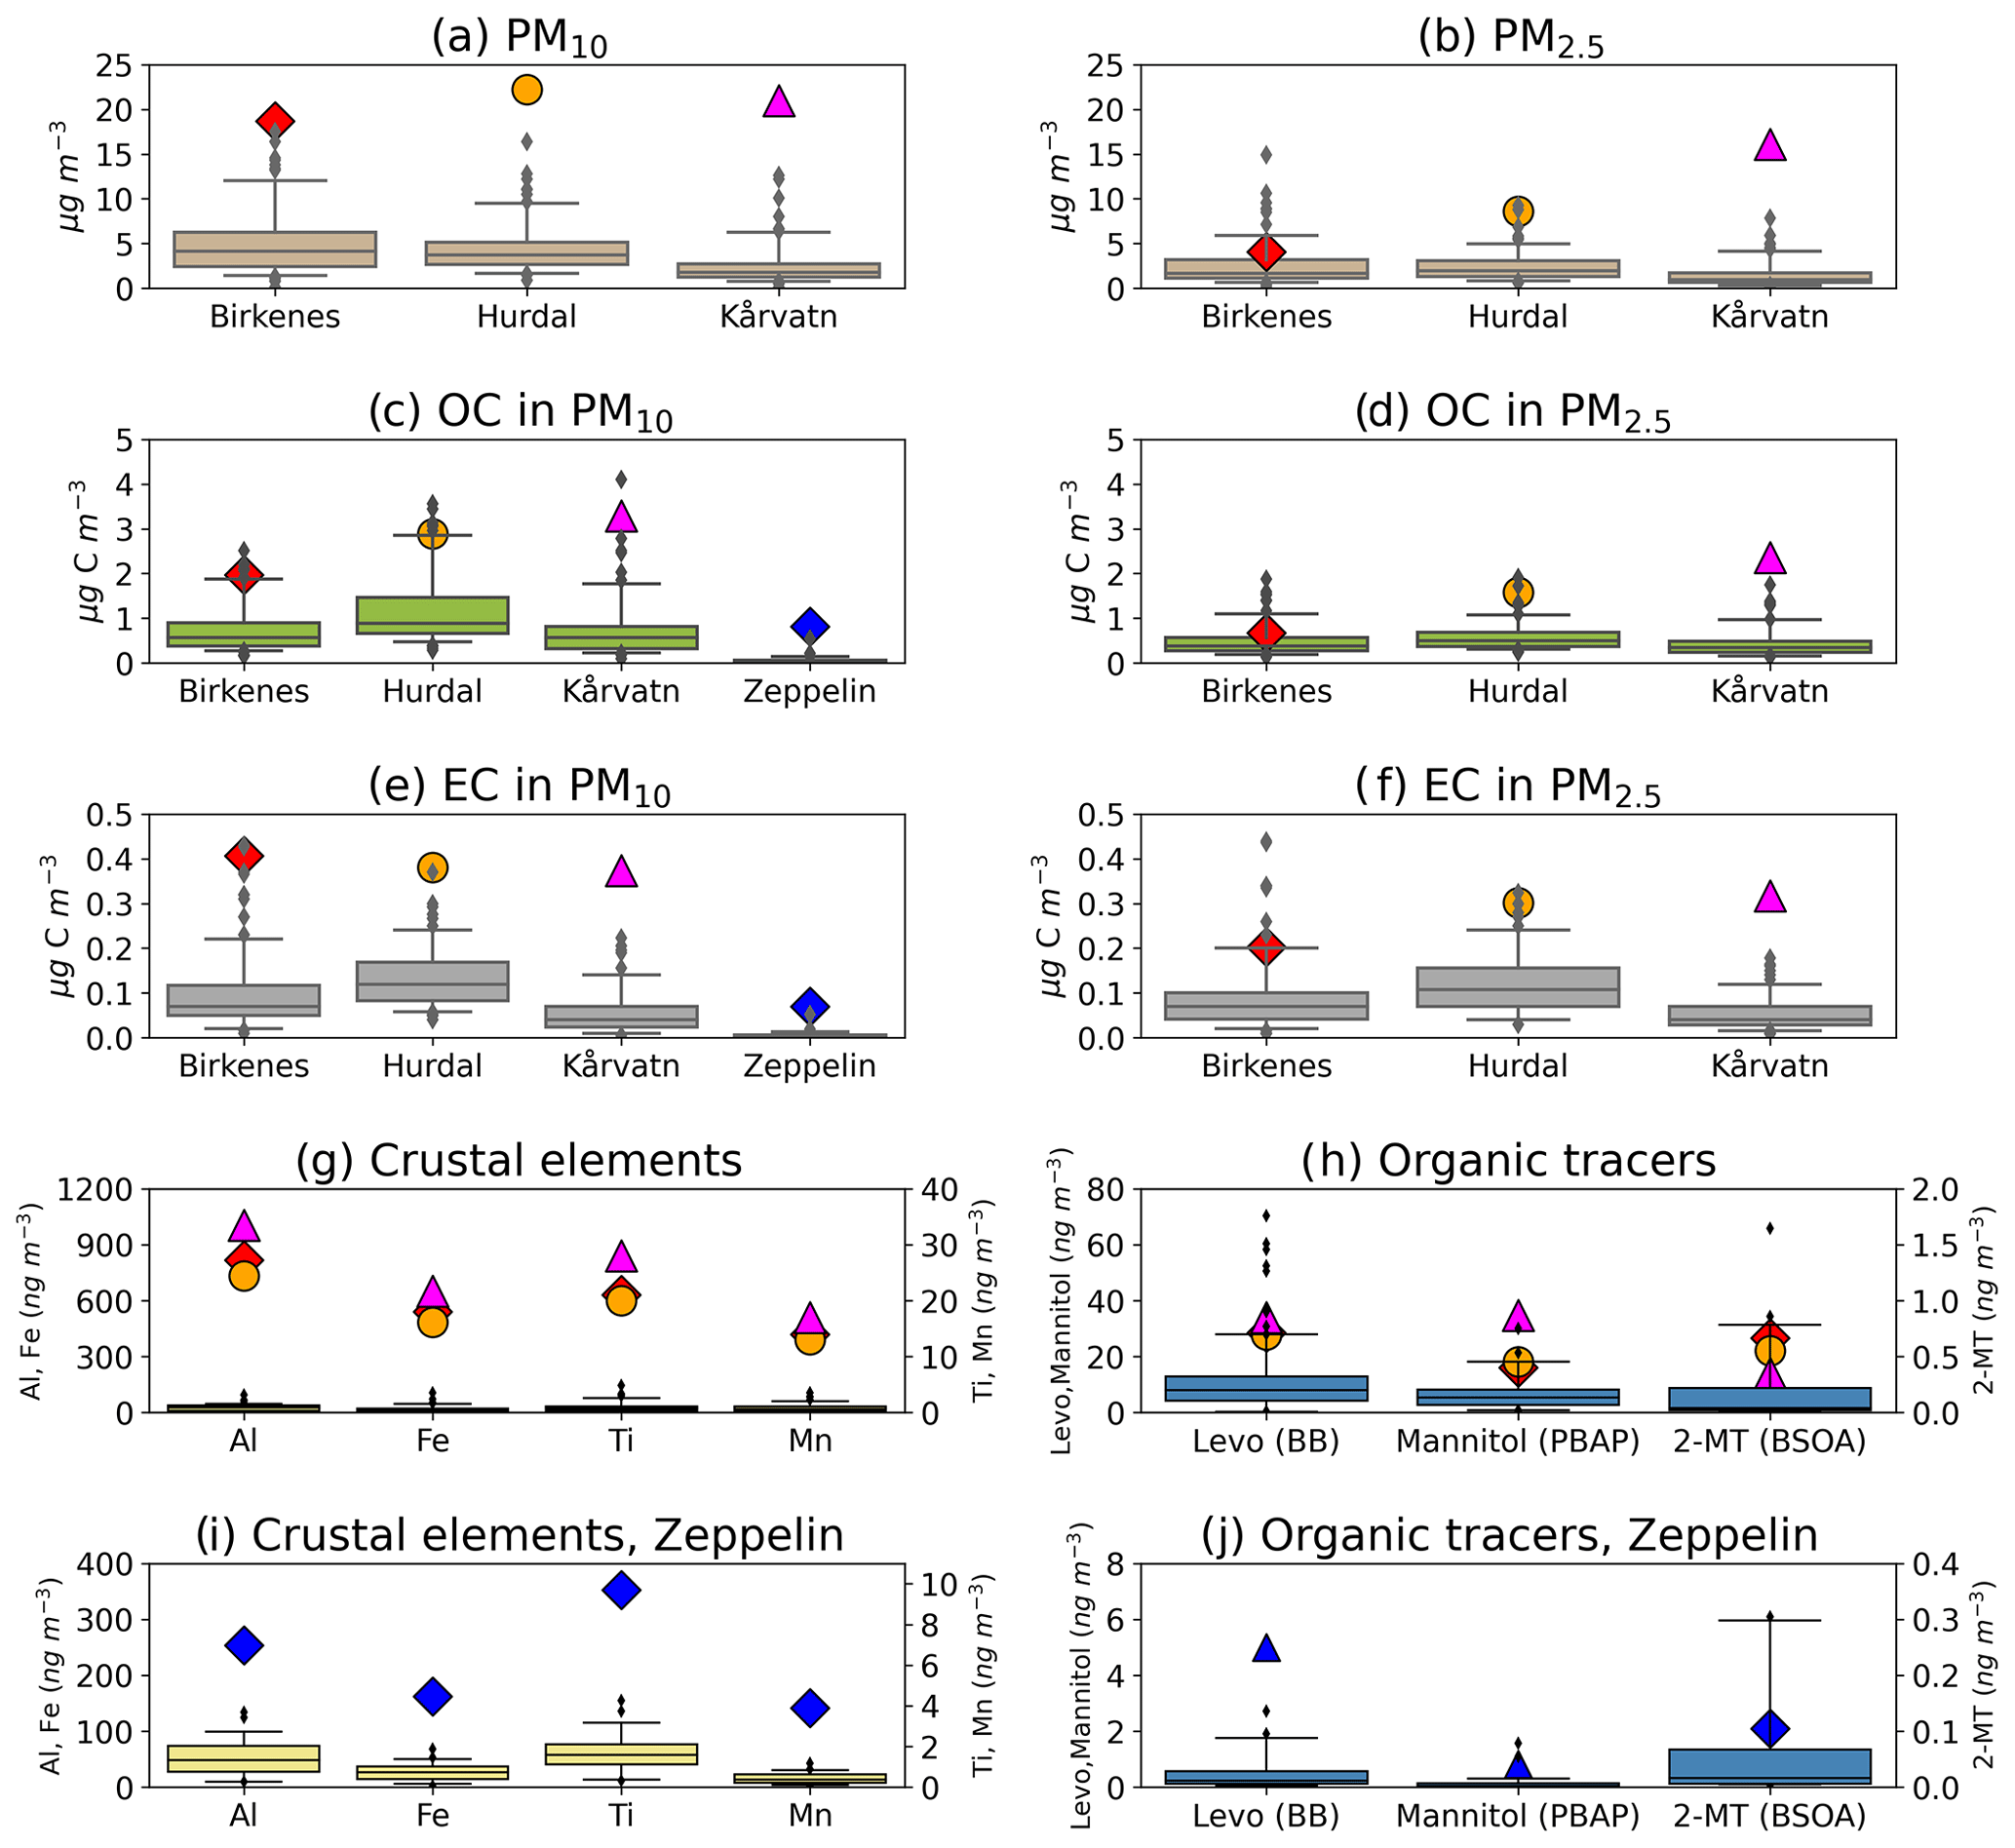
Figure 4Panels show concentrations observed in the October 2020 episode (red diamonds: Birkenes; orange circles: Hurdal; purple triangles: Kårvatn; blue diamonds: Zeppelin) along with box plots (5th, 25th, 50th, 75th, and 95th percentiles and outliers) at the rural background sites Birkenes, Hurdal, and Kårvatn as well as the remote site Zeppelin of weekly data in the period September–November for (a) PM10 mass concentration (2010–2019); (b) PM2.5 mass concentration (2010–2019); (c) organic carbon (OC) in PM10 (2010–2019 for Birkenes, 2011–2019 for Hurdal and Kårvatn, and 2017–2019 for Zeppelin); (d) OC in PM2.5 (similar to panel c but for Zeppelin with no measurements); (e) elemental carbon (EC) in PM10 (similar to panel c); (f) EC in PM2.5 (similar to panel d); (g) crustal elements in PM10 (2014–2019); (h) levoglucosan (2010–2019), mannitol, and 2-methylerythritol in PM10 (2016–2018); (i) crustal elements in PM10 at Zeppelin (2018–2019); and (j) levoglucosan, mannitol, and 2-methylerythritol in PM10 at Zeppelin (2017–2019). In panels (g) and (h) the box plots are for Birkenes only.
We thus see indications of influences from mineral dust and BB aerosols, which can be confirmed by chemical speciation of PM, available at the three rural background sites and the Zeppelin Observatory (Fig. 4; Table 1). For a selection of species, we also show long-term measurements for comparison. With the chemical analysis performed (Table 1), with assumptions made regarding mineral dust composition (lower estimate) (Sect. 2.1.2), and with OC and EC conversion factors (Sect. 2.1.3), we were able to explain 92 % (Birkenes), 74 % (Hurdal), and 75 % (Kårvatn) of the PM10 mass at the rural sites. Note that secondary inorganic aerosol constituents and inorganic anions and cations were not available for the Kårvatn site. The range of mass closure obtained for the sites is comparable to previous studies (e.g. Putaud et al., 2010; Yttri et al., 2021; Aas et al., 2021) but should be considered a conservative estimate, using the lower estimate of the mineral dust fraction.
3.1 Mineral dust
Mineral dust elements (Al, Fe, Mn, and Ti) were all highly elevated during the episode. At Birkenes, the Al and Fe levels were over 30 times higher than the long-term seasonal mean (2014–2019), whereas the corresponding factors for Ti and Mn were respectively 27 and 16 (Table 1; Fig. 4). Maximum-ever concentrations were observed for all mineral dust elements at Birkenes by a fair margin, suggesting that an event of this magnitude is rare. Note that long-term time series of mineral dust are available only for Birkenes. Kårvatn experienced the highest concentration for all the mineral dust elements during the episode, followed by Birkenes and Hurdal, although with a minor difference. The relative composition of the mineral dust elements was indistinguishable between the three rural background sites and the Zeppelin Observatory. Al was most abundant at all sites, and concentrations of other elements relative to Al are similar at all sites: . This similar relative composition points at a common origin of the observed mineral dust. The Al:Fe ratio points to Eurasian mineral dust sources (Crocchianti et al., 2021), which is supported by our FLEXPART/FLEXDUST model simulations and CAMS regional mineral dust product, discussed below. Observed elements at Zeppelin were of similar composition, yet observed masses were 2.4–3.7 times lower than the mean at the rural background sites, which is not surprising given the larger distance to the source region.
We find a lower estimate of the mineral dust concentration at the rural background sites ranging from 5.6–7.6 µg m−3 (Eq. 2) and an upper estimate ranging from 7.2–8.6 µg m−3 (Eq. 3), whereas 1.9–2.6 µg m−3 was attributed to mineral dust at the remote site. Only CO was included in the upper estimate for Kårvatn, as data needed to calculate the oxides were missing. The oxides increased the upper estimate at Birkenes and Hurdal by 14 %. If we assume a similar increase at Kårvatn, the upper estimate increases from 8.6 to 9.8 µg m−3. The lower estimate provides a 25 %–36 % mass contribution to PM10 at the rural background sites, whereas the upper estimate ranges from 32 %–47 %. Similarly, at Zeppelin, we found that 31 %–41 % of PM10 was mineral dust. Note, though, that we do not have measurements of PM10 concentrations at Zeppelin. We therefore assumed that our PM reconstruction from different constituents (Sect. 2.1.2 and 2.1.3) explains as much of the total PM10 as it did for the background sites Birkenes and Hurdal, which is on average 83 %.
Simulations with FLEXPART, based on dust emissions from FLEXDUST, help us to further demonstrate and understand the LRT of mineral dust during this episode. Figure 5 shows the modelled surface concentrations on 27 September 2020, during the storm in Central Asia that caused the large mineral dust emissions, and on 2 October 2020. These time steps were chosen based on the availability of CALIOP overpasses that captured the dust (or BC) plume, which will be discussed later. In addition, we provide a video of modelled dust surface concentrations between 25 September and 8 October 2020 in the Supplement. FLEXPART results show a distinct dust plume transporting dust from the regions east of the Caspian Sea towards north-west Europe. The dust plume partly overlaps with a wildfire plume starting in Ukraine, as is illustrated by the black lines in the right-hand-side figures. The contour lines of 500 hPa geopotential height illustrate how transport of mineral dust originating from Central Asia is forced on a front between a high-pressure region over Russia and low pressure in Europe. We see enhanced mineral dust concentrations over North Africa and a plume of dust transported over eastern Europe. Dust originating from North Africa is partly mixed into the dust plume from Central Asia yet contributes little to the increased surface concentrations of mineral dust observed in Norway during this episode, as will be further discussed below. Natural dust sources in Central Asia include the Karakum and Aralkum deserts in Turkmenistan and Kazakhstan. These deserts are part of what is sometimes referred to as the dust belt, extending from the west coast of Africa to China (Prospero et al., 2002). There is a variety of deserts in Central Asia with different characteristics. Most of these dust sources are active between March and October (Shen et al., 2016; Indoitu et al., 2012). According to our FLEXDUST simulations, a dust storm occurred in Central Asia in the end of September. From 25 September 2020 total dust emissions in this region started increasing, reaching maximum values on 27 September 2020, and slowly decreasing again until the 3 October 2020. Dust emissions were up to 2 g m−2 h−1, and total emissions from this region amounted to 5.1 Tg in 8 d.
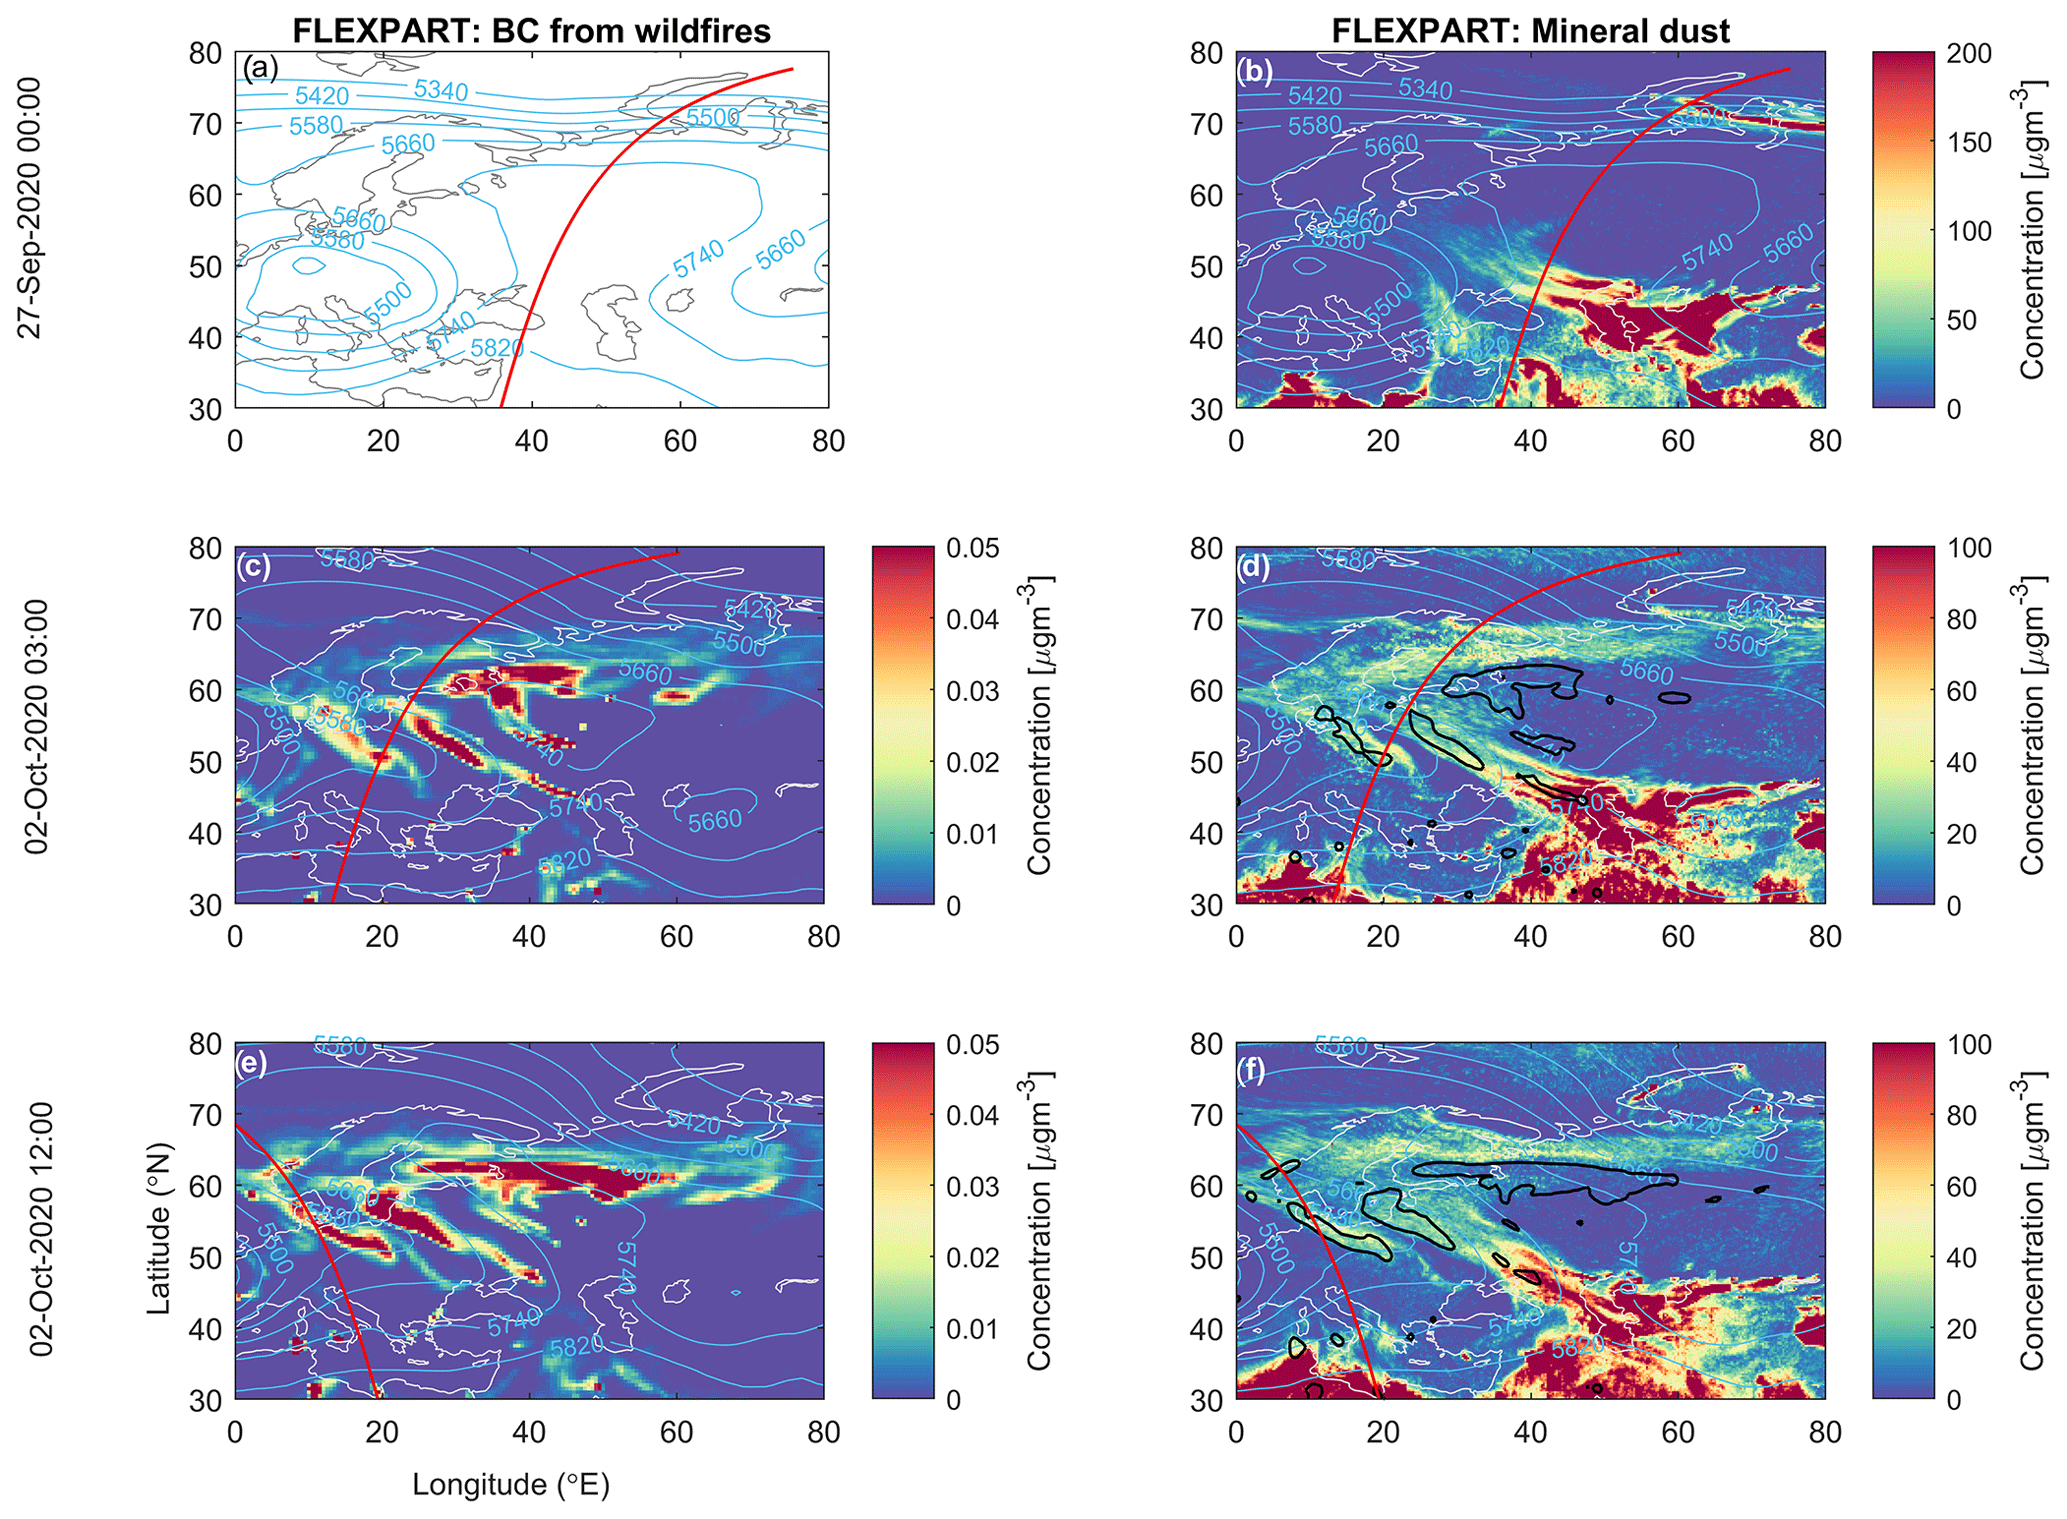
Figure 5Modelled surface concentrations of BC from biomass burning (a, c, e) and mineral dust (b, d, f) on 27 September and 2 October 2020 (midnight and noon). Blue contours: ECMWF 500 hPa geopotential height (m). In the right column black contour lines indicate the regions of the modelled wildfire plume (BC >0.03 µg m−3) as shown in panels (a), (c), and (e). BC simulations started only after 27 September 2020 because no relevant emissions were observed for the episode in Norway. The red lines indicate the location of CALIOP overpasses shown in Fig. 6.
Figure 6 shows the curtain of aerosol extinction profiles at 532 nm (colour coded; the overpass is plotted in Fig. 5) with FLEXPART mineral dust and BC concentration contour lines overlaid. The top panel shows CALIOP aerosol extinction from 26 September 2020, time of first record 23:48:09, between 36 and 45∘ E, with dominating aerosol subtype (not shown here) dust and polluted dust, at the surface around 40.5 and 43∘ E, elsewhere and at elevated levels. The FLEXPART simulation captured both the elevated concentrations near the surface and the vertical spread of the dust plume at the time of emissions and near the source region of the dust (white contours). The dust plumes reached Norway on 2 October 2020. Figure 6 shows CALIOP aerosol extinction from that day, at around midnight (middle panel, 13.5–29∘ E) and around noon (lower panel, 0–9∘ E). The modelled dust plumes partly coincide with the satellite images. The night-time CALIOP curtain shows an area with enhanced aerosol loading extending to above 5 km of polluted continental/dust west of 16∘ E and a lower region with dust/polluted dust east of 20∘ E. Also note that the lack of absorbing aerosols around 20∘ E in the satellite images is locally due to obstructions by clouds. Twelve hours later the CALIOP overpasses the lowermost tip of Norway, showing mineral dust reaches over 4 km height (around 5∘ E). A video of dust RGB (red, green, blue) composite images, which are based on infrared channel data from the Spinning Enhanced Visible and Infrared Imager (SEVIRI), is provided in the Supplement (EUMETSAT Image Gallery, 2022).
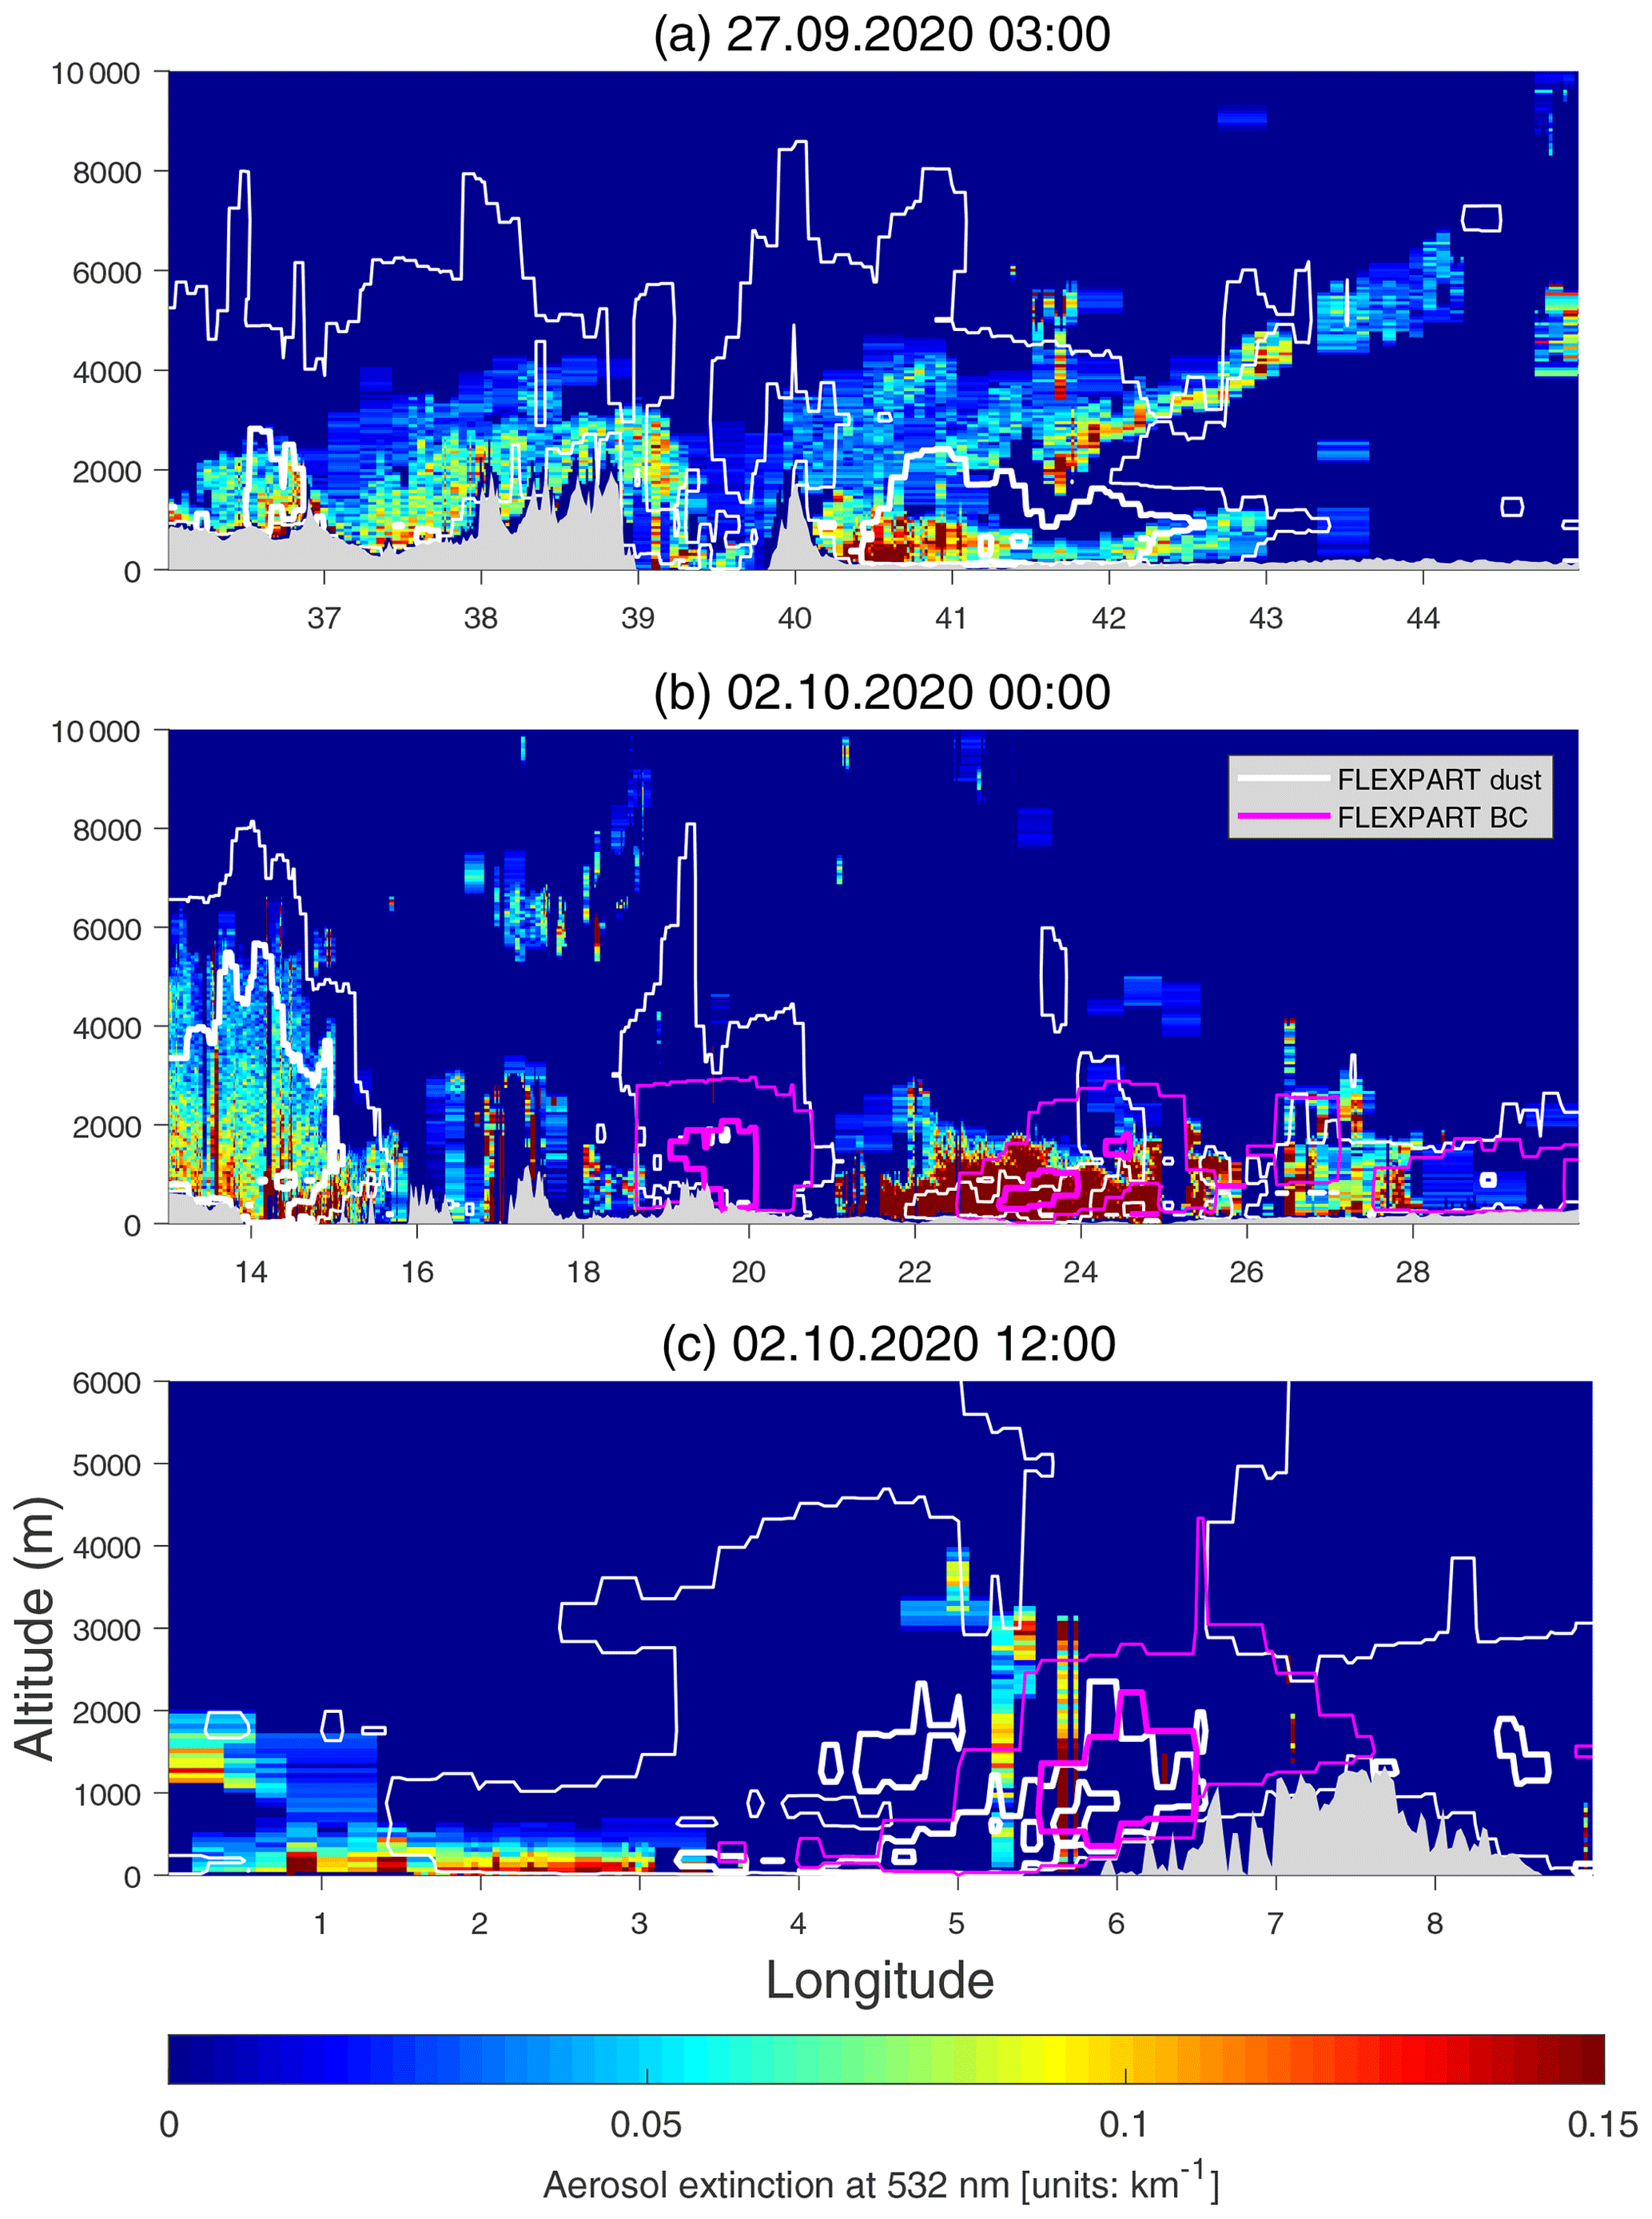
Figure 6Aerosol extinction at 532 nm [units: km−1] during three overpasses (see Fig. 5 for location) is shown as colour plot (a: CALIOP overpass from 26 September 2020, time of first record 23:48; b: 2 October 2020, time of first record 01:18; and c: 2 October 2020, time of first record 11:55). The titles of panels (a)–(c) indicate the FLEXPART 3-hourly time step corresponding to the overpass. White contours show FLEXPART mineral dust concentrations (thick and thin lines; a: 40 and 6 µg m−3; b: 50 and 10 µg m−3; c: 15 and 3 µg m−3). Magenta contours show FLEXPART BC concentrations (thick and thin lines; a: none; b: 50 and 5 ng m−3; c: 40 and 10 ng m−3).
In Fig. 7 we compare time series of the FLEXPART modelled surface concentrations of mineral dust to the observed PM10 concentrations at Birkenes. (Time series of PM10 are not available at the other stations included in the model results.) We further show surface concentrations from the CAMS regional model product over Europe, which includes the three stations in Norway but not the remote station in the Arctic. Both FLEXPART and CAMS regional show increased surface concentrations of mineral dust at all three stations between 28 and 30 September 2020 and between 1 and 4 October 2020. While the first peak is not seen clearly in the observation, the second peak is visible in both models for all stations. The timing of the second peak value appears similar, yet continuation of the event is different. Moreover, the estimated values of surface concentrations are larger in FLEXPART than in CAMS regional. This is even more obvious for the weekly averages shown in the bottom panel of Fig. 7, where FLEXPART modelled concentration are a factor of 1.7 to 3.4 higher than CAMS. The lower estimates of mineral dust by CAMS are probably a result of various factors. One issue was apparent when we examined the dust concentrations from each of the nine ensemble members. At Birkenes all models and at Kårvatn all except for one of the models underestimated the dust concentration. We also found that the European Air Pollution Dispersion model (EURAD, Memmesheimer et al., 2004) and MOdèle de Chimie Atmosphérique à Grande Echelle model (MOCAGE, Martet et al., 2009) tended to greatly underestimate the dust concentrations (values ranging from 0.1–3.1 µg m−3), which will contribute to an overall lowering of the median. For the MOCAGE model, this has been linked to the deposition of desert dust being too high and an incorrect treatment of the boundary conditions from the CAMS global model in a previous MOCAGE model cycle, and both issues have been subsequently corrected (Mathieu Joly, personal communication, 2021). Furthermore, likely causes of differences between the models are for instance included dust sources, emission, and scavenging parameterizations. The dust plume from Central Asia did not reach Zeppelin until 4 October, and peak surface concentrations are lower than for the rural stations, complying with the observations. Comparison to average dust concentrations based on 8–10 d sample measurements (Fig. 7, bottom) indicates a nice agreement between the model and observations, although modelled dust concentrations are overestimated at Zeppelin. From an additional simulation that only included mineral dust emissions from Central Asia, we find that desert regions in Central Asia are major contributors to the dust episode, accounting for 88 % of surface dust concentrations at the three rural background sites. The modelled relative contribution of mineral dust from Central Asia is similar at all sites, pointing at common sources. This agrees with the observed relative composition of the mineral dust elements between the three sites being indistinguishable. At Zeppelin, the model finds a relatively larger contribution from other, most likely local, sources. No indication of this was seen in the observations, suggesting that local mineral dust emissions were overestimated by the model.
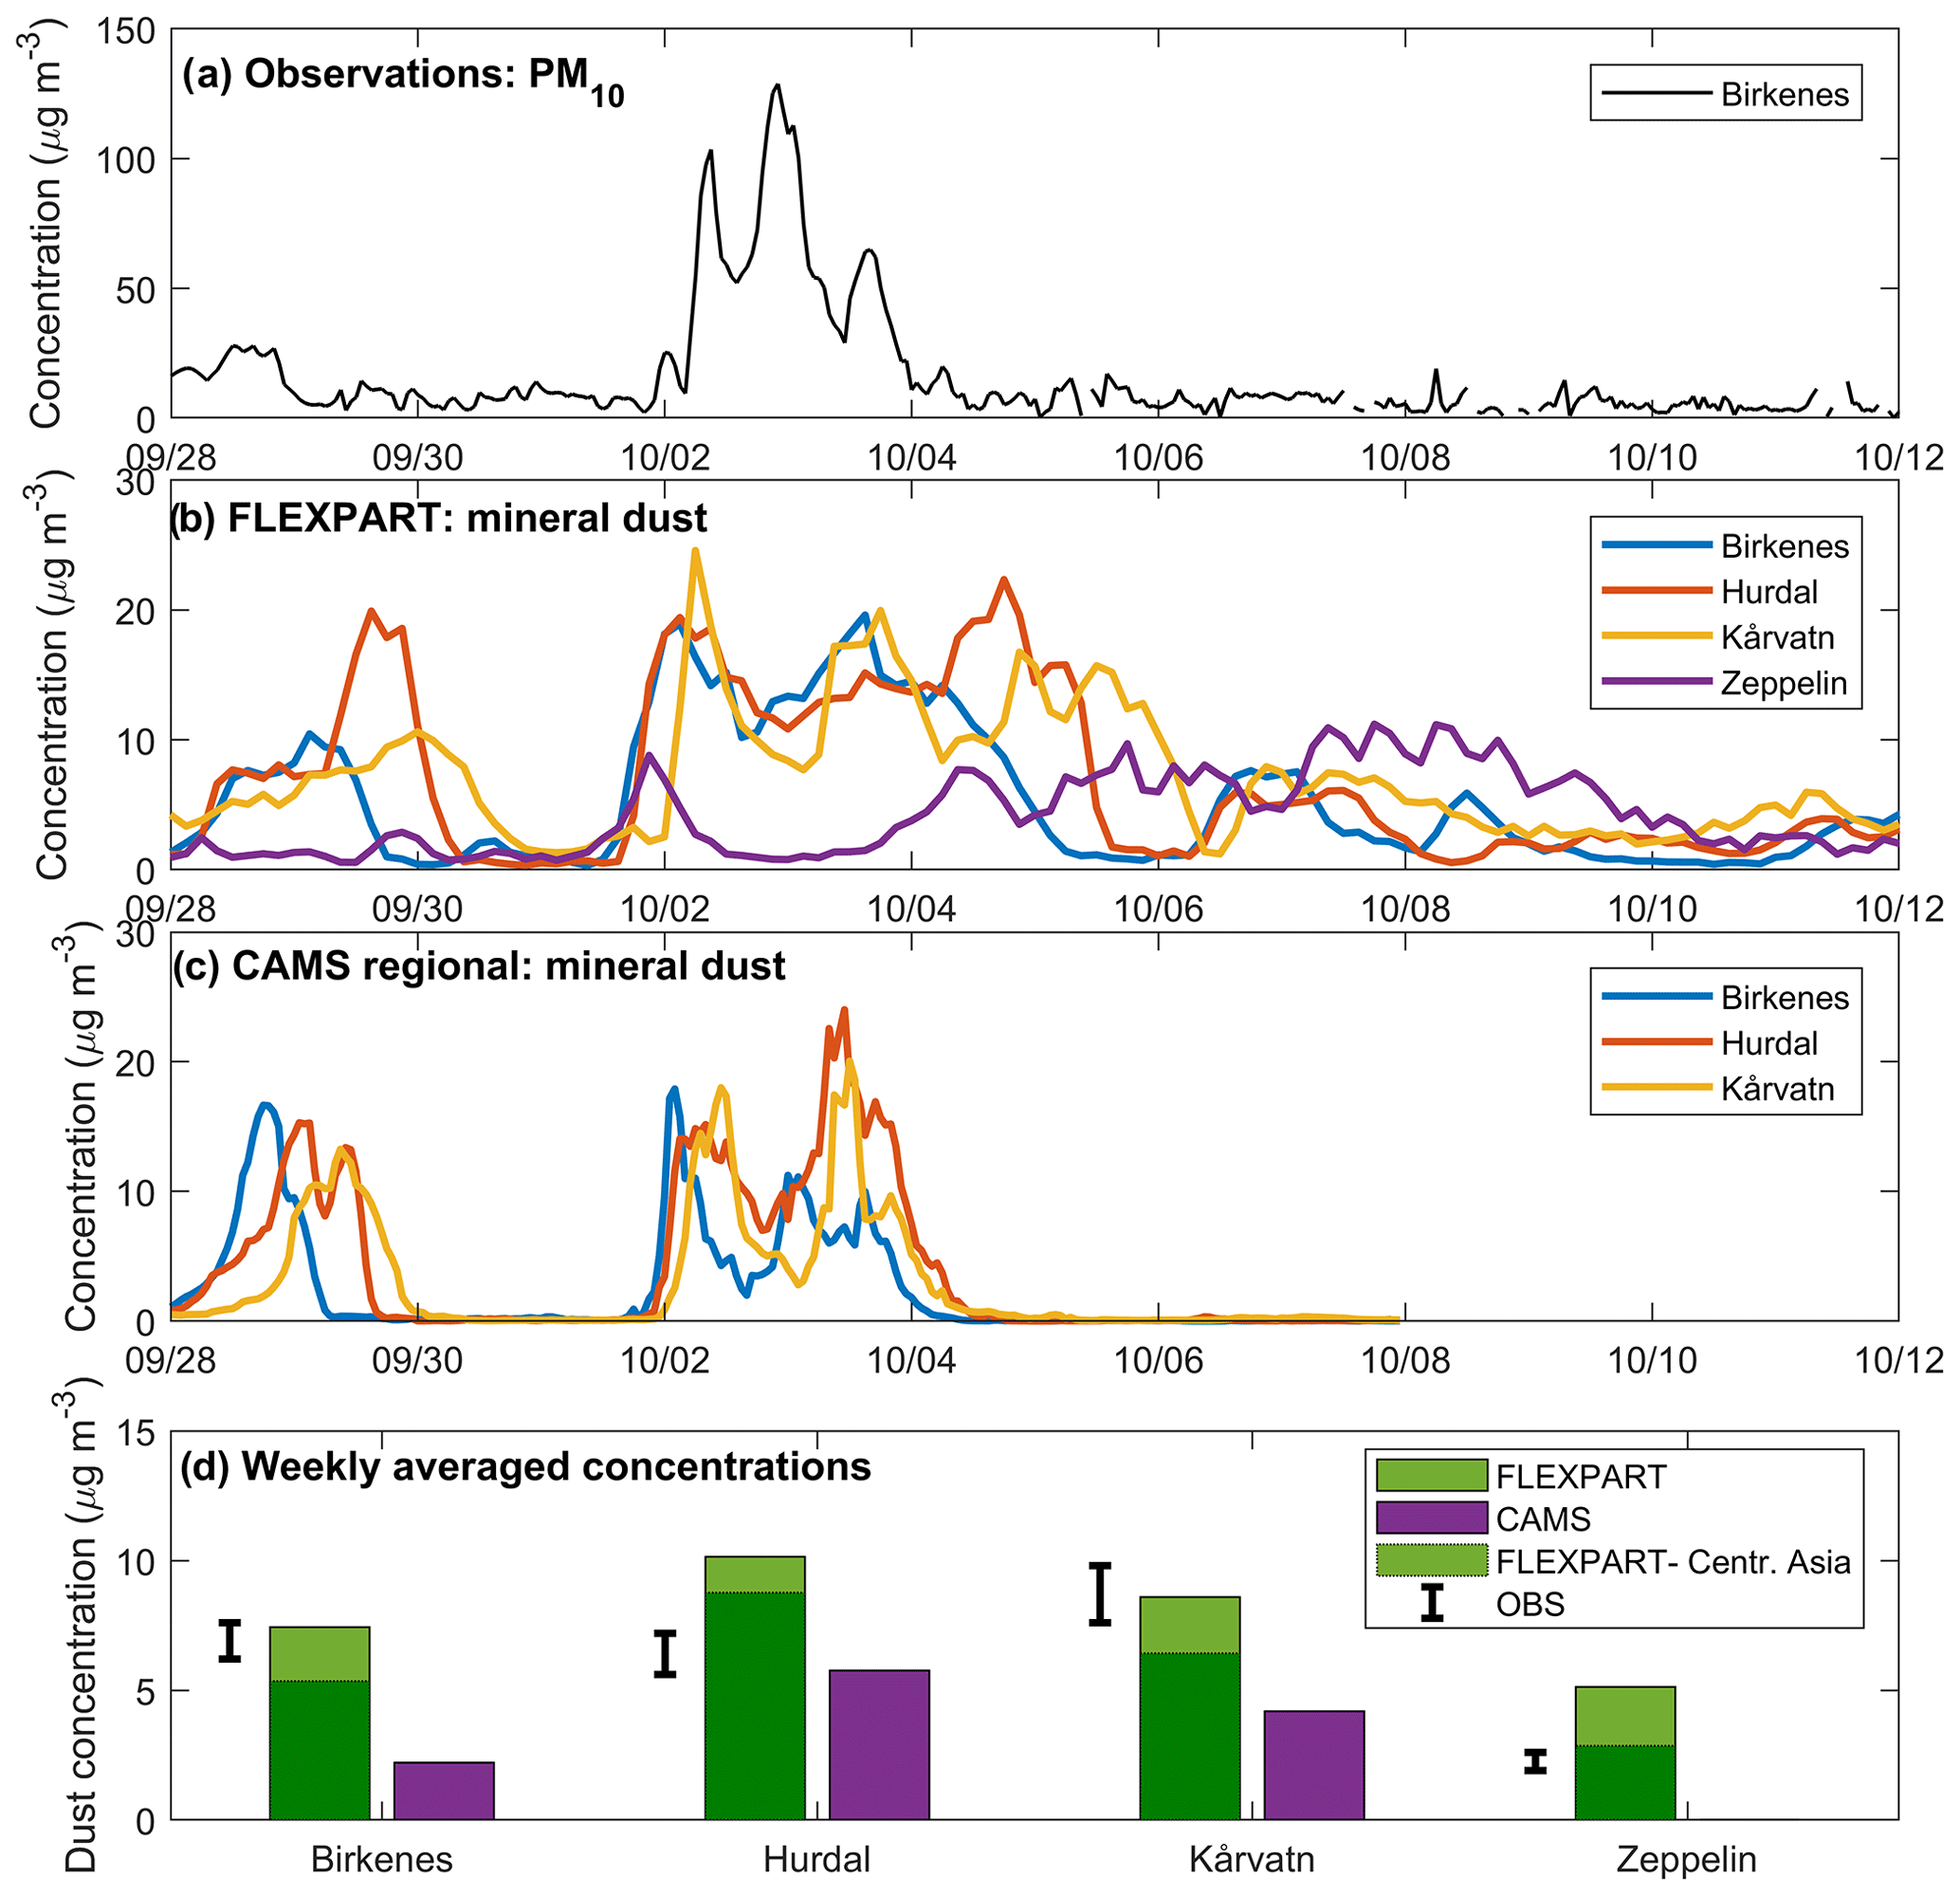
Figure 7PM10 concentrations observed at Birkenes (a). Mineral dust surface concentrations as simulated with FLEXPART (b) and CAMS regional (c) at three stations in Norway and the remote station (outside CAMS domain). (d) Mean concentrations from simulations compared to observations from weekly samples for Birkenes (30 September–7 October 2020), Hurdal and Kårvatn (28 September–5 October 2020), and Zeppelin (2–12 October 2020). For FLEXPART estimates in panel (d), light green colours indicate dust from global sources and dark green colours indicate the contribution of dust from Central Asia only.
3.2 Biomass burning
We calculated that carbonaceous aerosol, which generally is the major fraction of biomass burning aerosol, made a 26 %–36 % contribution to PM10, 34 %–44 % to PM2.5, and 21 %–43 % to PM10−2.5 (Table 1) when converting OC and EC to account for other elements than just carbon. Adding CO increased the contribution only to a minor extent (1 %–4 %). The carbonaceous aerosol made a similar contribution to reconstructed PM10 at Zeppelin (29 %) as for the rural background sites, as did CO (1 %).
BB aerosol mainly consist of EC and OC. Observed EC levels at the rural background sites were either a record high or top six, considering both the annual (not shown) and the September–November 2010/11–2019 time series (Table 1). OC (in PM10) levels were also highly elevated, i.e. within the 95th–99th percentile. The OC level was noticeably higher at Kårvatn and Hurdal compared to Birkenes, whereas EC (in PM10) was highest at Birkenes, although by a short margin (Fig. 2). The OC and EC levels observed at Zeppelin were the highest reported since regular measurements started in 2017 but still 3 times lower compared to the major wildfire episode influencing the site in April/May 2006 (Stohl et al., 2007).
The split between the fine and coarse fraction of PM10 varied substantially between EC and OC at the rural background sites and between sites. EC results from incomplete combustion of biomass and fossil fuel and is almost exclusively associated with fine aerosol particles. Hence, one would expect rather high EC values for the fine fraction of PM10. The 50:50 % split between the fine and coarse fraction of PM10 seen at Birkenes therefore is a rare finding, whereas the 79:21 % and 84:16 % splits for the two other rural background sites are closer to the long-term mean (97:3 %). OC was even more skewed towards the coarse fraction than EC, with a fine–coarse split ranging from 34:66 % at Birkenes to 72:28 % at Kårvatn. The reason for such an atypically high coarse fraction could be due to condensation, agglomeration, and heterogenic chemical reactions influencing the size distribution of carbonaceous aerosol, as well as, for OC, contribution of PBAP. Another possibility is that pyroconvection entrains large, partly combusted particles from the ground to such high altitudes that they can be subject to LRT. Further, Dusek et al. (2017) and Yttri et al. (2021) pointed to charring of coarse-fraction PBAP during thermal-optical analysis (TOA), forming pyrolytic carbon that is erroneously interpreted as coarse EC. In fact, the episode coincided with the time of the year when PBAPs peak (early fall) (Yttri et al., 2007a, 2021), and the PBAP tracer levels were highly elevated but still comparable to levels previously seen at this time of the year (Fig. 4, Table 1).
A lower estimate of 12 %–16 % (Eq. 7) was calculated for BBmass to PM10 at the rural background sites, whereas the upper estimate ranged from 17 %–21 %. The lower estimate apportioned only 7.6±1.8 % of PM10 to BBmass at Zeppelin, which likely experienced a more pronounced degradation of levoglucosan due to its remote location. The upper estimate of 17 % is in line with that observed at the rural background sites.
Estimates of the major carbonaceous aerosol (OC and EC) sources (BB, BSOA, FF, and PBAP) can be derived from the source-specific organic tracers listed in Table 1 (see Sect. 2.1.3 for details). Here we estimated the PBAPmass, BSOAmass, and FFmass contribution to PM10 for a better constraint and understanding of the BB source, finding that their joint contribution made an equally large contribution to PM10 as the lower estimate of BB at both the rural background sites (13 %–17 %) and at the remote site (6.4 %), underlining the importance of the BB source. Combined, the contribution of BBmass (lower estimate), PBAPmass, BSOAmass, and FFmass ought to match the observed level of the carbonaceous aerosol (here, sum of OM and EC ×1.1). For the rural background sites this matched quite well (99±21 %), whereas it only amounted to 48 % at the remote Arctic site. The most likely explanation of this discrepancy is failure to account for degradation of organic tracers, and particularly levoglucosan. There are indications that 2-methyltetrols have short atmospheric lifetimes as well (Yttri et al., 2021), whereas the low levels of PBAP tracers at Zeppelin likely reflect the scarce vegetation of the Arctic biome. Further, the ER ratios used for PBAP and BSOA (Sect. 2.1.4) are derived from measurements in the boreo-nemoral biome, thus their suitability in the Arctic biome is a matter of discussion. Consequently, the apportionment of BBmass, PBAPmass, BSOAmass, and FFmass is associated with greater uncertainty than for the rural background sites.
High-time-resolution measurements of eBC at Birkenes were attributed to a biomass burning fraction (eBCBB) and a fossil fuel combustion fraction (eBCFF), apportioning 43 % to eBCBB and 57 % to eBCFF for the episode in question (midnight 1–2 October to midnight 3–4 October 2020). Extending the period to match that of the weekly sample (30 September–7 October 2020) reduced the eBCBB fraction to 35 %, whereas the eBCFF fraction increased to 65 %. The split is thus comparable to the levoglucosan approach, which apportioned equally large shares to ECBB and ECFF for 30 September–7 October, but note that the range (50±20 %) of the levoglucosan approach is very wide. eBCBB (R2=0.82) correlated higher with the high-time-resolution measurements of PM10 at Birkenes than eBCFF (R2=0.67), suggesting that biomass burning emissions were more important for the evolution of PM than fossil fuel sources. eBCFF explained 60 % of eBC at Zeppelin and eBCBB 40 %, considering both the episode (2–7 October 2020) and the longer period covered by the filter sample (2–12 October 2020). As for Birkenes, this corresponds with the levoglucosan estimate for EC, which apportions an equally large fraction to ECFF and ECBB.
Time series of eBC at Birkenes and Zeppelin are shown in Figs. 8 and 9, they indicate that eBC values from both biomass burning and fossil fuel were of similar magnitude, and both reached peak values on 3 October 2020 at Birkenes and on 5 October 2020 at Zeppelin. Also, modelled black carbon from biomass burning peaks on 3 October 2020 at Birkenes, yet simulated values are underestimated by roughly a factor 10 compared to observations. BC concentrations at the other background stations are of similar magnitude, while there is a delay in peak concentration at Kårvatn compared to the other stations. The high correlation (R2=0.92) between eBC and the major OM fraction at Zeppelin (Fig. 9), obtained from the collocated aerosol chemical speciation monitor time-of-flight (ACSM-ToF) instrument, points to combustion sources as the origin of OM. The correlation was more pronounced for eBCFF (R2=0.83) than for eBCBB (R2=0.66). The episode of enhanced BC from fossil fuel combustion is not reproduced in our model results for the rural background stations and is strongly underestimated at Zeppelin. Explanations can be found in the use of monthly mean fossil fuel BC emissions that could average out effects of short-term emissions.
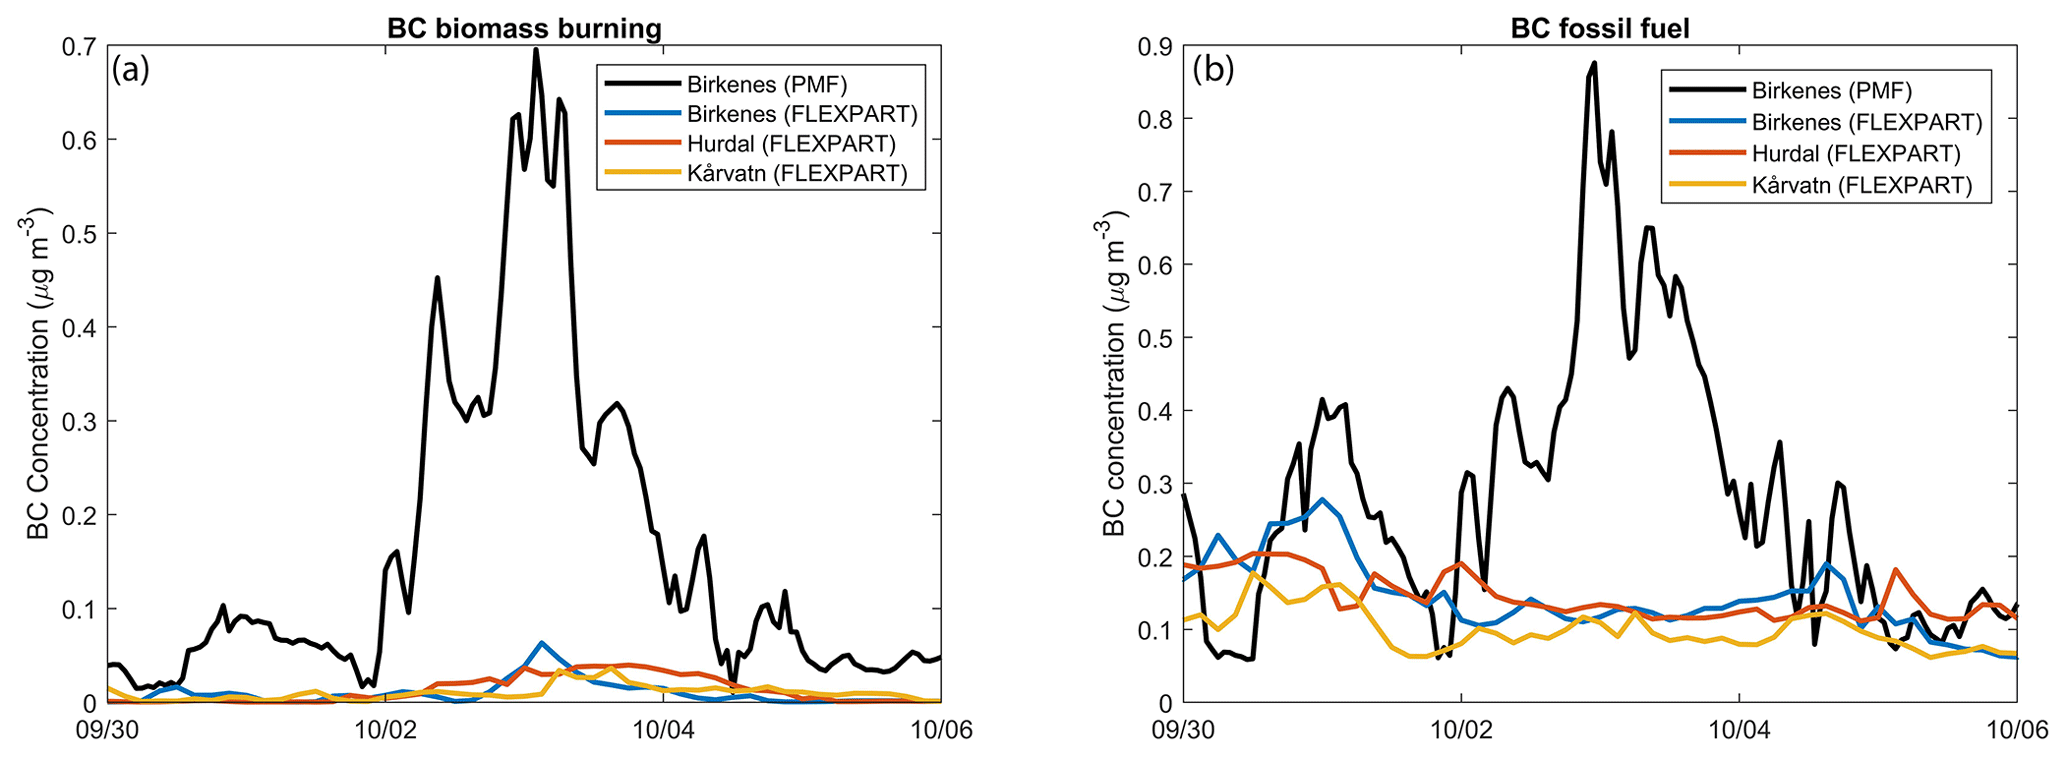
Figure 8eBCBB (a) and eBCFF (b) concentrations retrieved with PMF from observations at Birkenes (black) and simulated with FLEXPART at Birkenes, Hurdal, and Kårvatn.
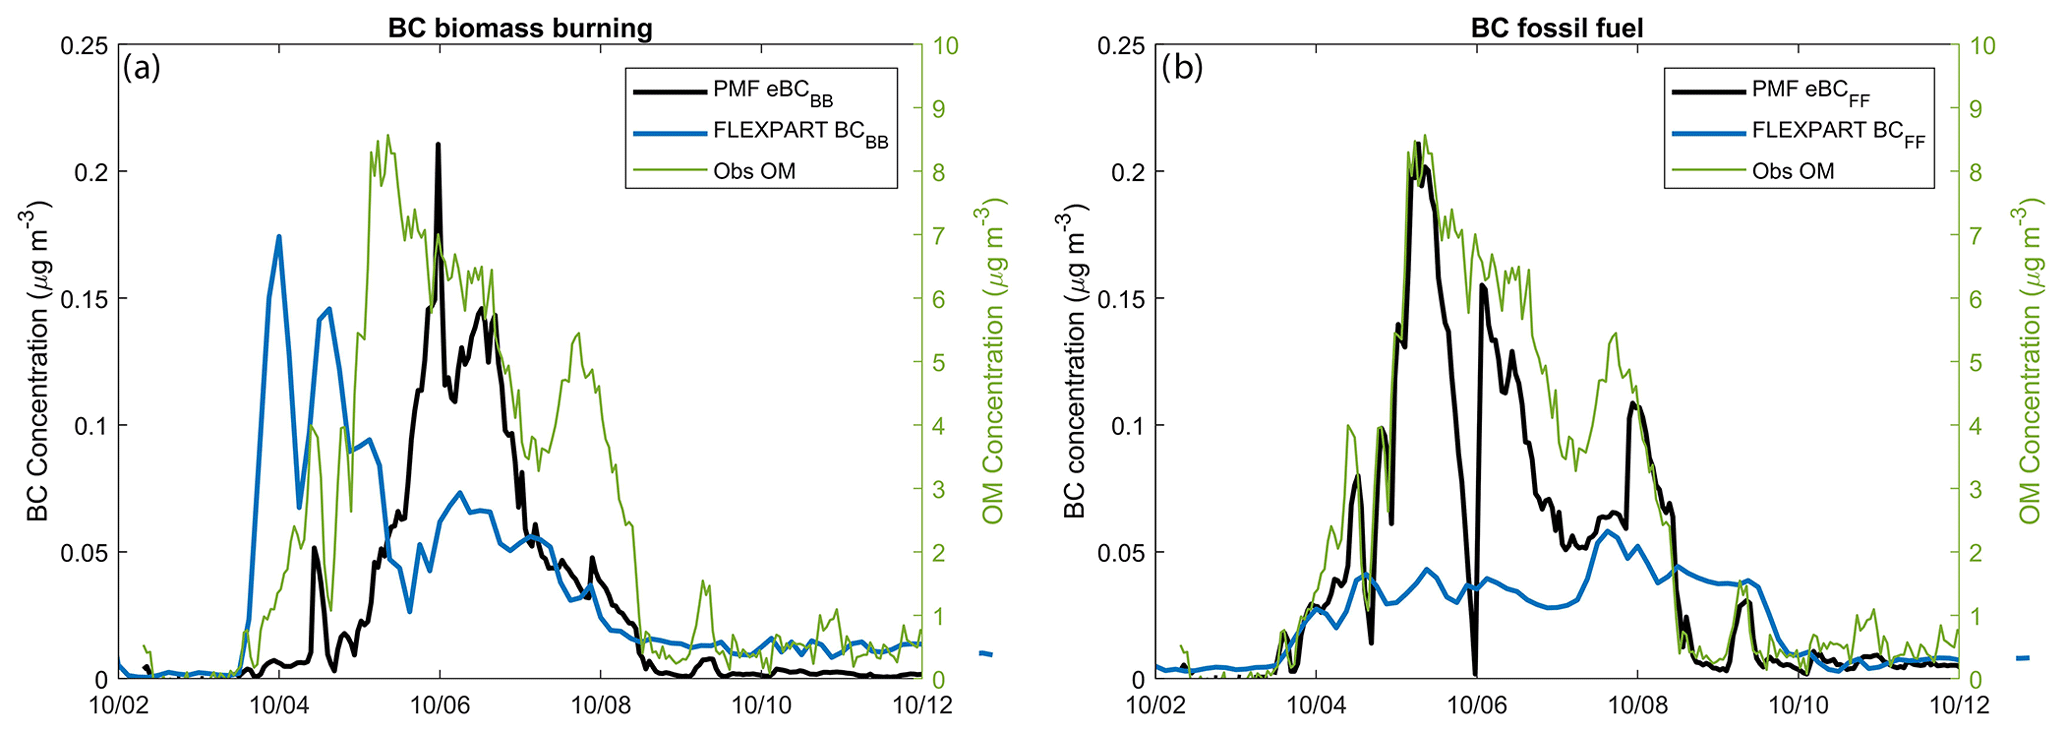
Figure 9eBCBB (a) and eBCFF (b) concentrations retrieved with PMF from observations (black) and simulated with FLEXPART (blue) and observed OM concentrations (green) at Zeppelin.
We further investigate the LRT of BC from biomass burning based on maps and cross sections coinciding with CALIOP observations, like for mineral dust (Figs. 5 and 6). In addition, we provide an animation of modelled BC from biomass burning surface concentrations between 27 September and 8 October 2020 in the Supplement. Although BC from biomass burning is strongly underestimated at Birkenes, the model results do show elevated BC concentrations over southern Norway on 2 October 2020. In the CALIOP profiles, modelled BC plumes (magenta contour lines) coincide with regions of very strong aerosol extinction, though being mainly categorized as dust/polluted (22–28∘ E). While not explicitly shown here, we would like to note that also the TROPOspheric Monitoring Instrument (TROPOMI) on board the Copernicus Sentinel-5 Precursor satellite detects enhanced aerosol index values and increased CO total column over the Baltic countries on 1–2 October, which confirms the presence of UV-absorbing aerosols, including biomass burning aerosols, in this region. In the region at approximately 20∘ E on 2 October 2020 at 00:00 a clear BC signal is modelled yet absent in the CALIOP profile due to clouds.
We use backward modelling to characterize the source regions for the observed air pollution. The source–receptor relationship (SRR) for BC at Birkenes during this episode is shown in Fig. 10 (top panel). The SRR indicates how sensitive the concentrations at the receptor are to emissions in different source regions. As for the dust plume, LRT is strongly influenced by a low- and high-pressure system (Fig. 5). The strong winds from the east confine the SRR mostly to a region extending between Birkenes and Central Asia. Wildfires contributing to the BC concentrations at Birkenes are thus mostly restricted to this region, and the largest contributions are seen in Ukraine and southern Russia, although some contributions from fires in North America and northern Russia are seen as well. Due to the combination of a strong underestimation of modelled BC from biomass burning and good representation of dust concentrations at our stations, we expect that the BC emissions are a larger cause of error than the actual atmospheric transport modelling. It is thus likely that we are missing some sources contributing to the plume (Fig. 10, top panel) or that locations are correct, yet total emissions are underestimated. Fossil fuel emissions are more widespread, and mostly emissions in southern Sweden and from the Baltic States down to Ukraine contribute to the BC concentrations at Birkenes (Fig. 10, bottom) in this event. Similar results were seen at the stations Kårvatn and Hurdal (not shown). At Zeppelin, there was an enhanced influence of fossil fuel emissions in northern Europe on BC levels.
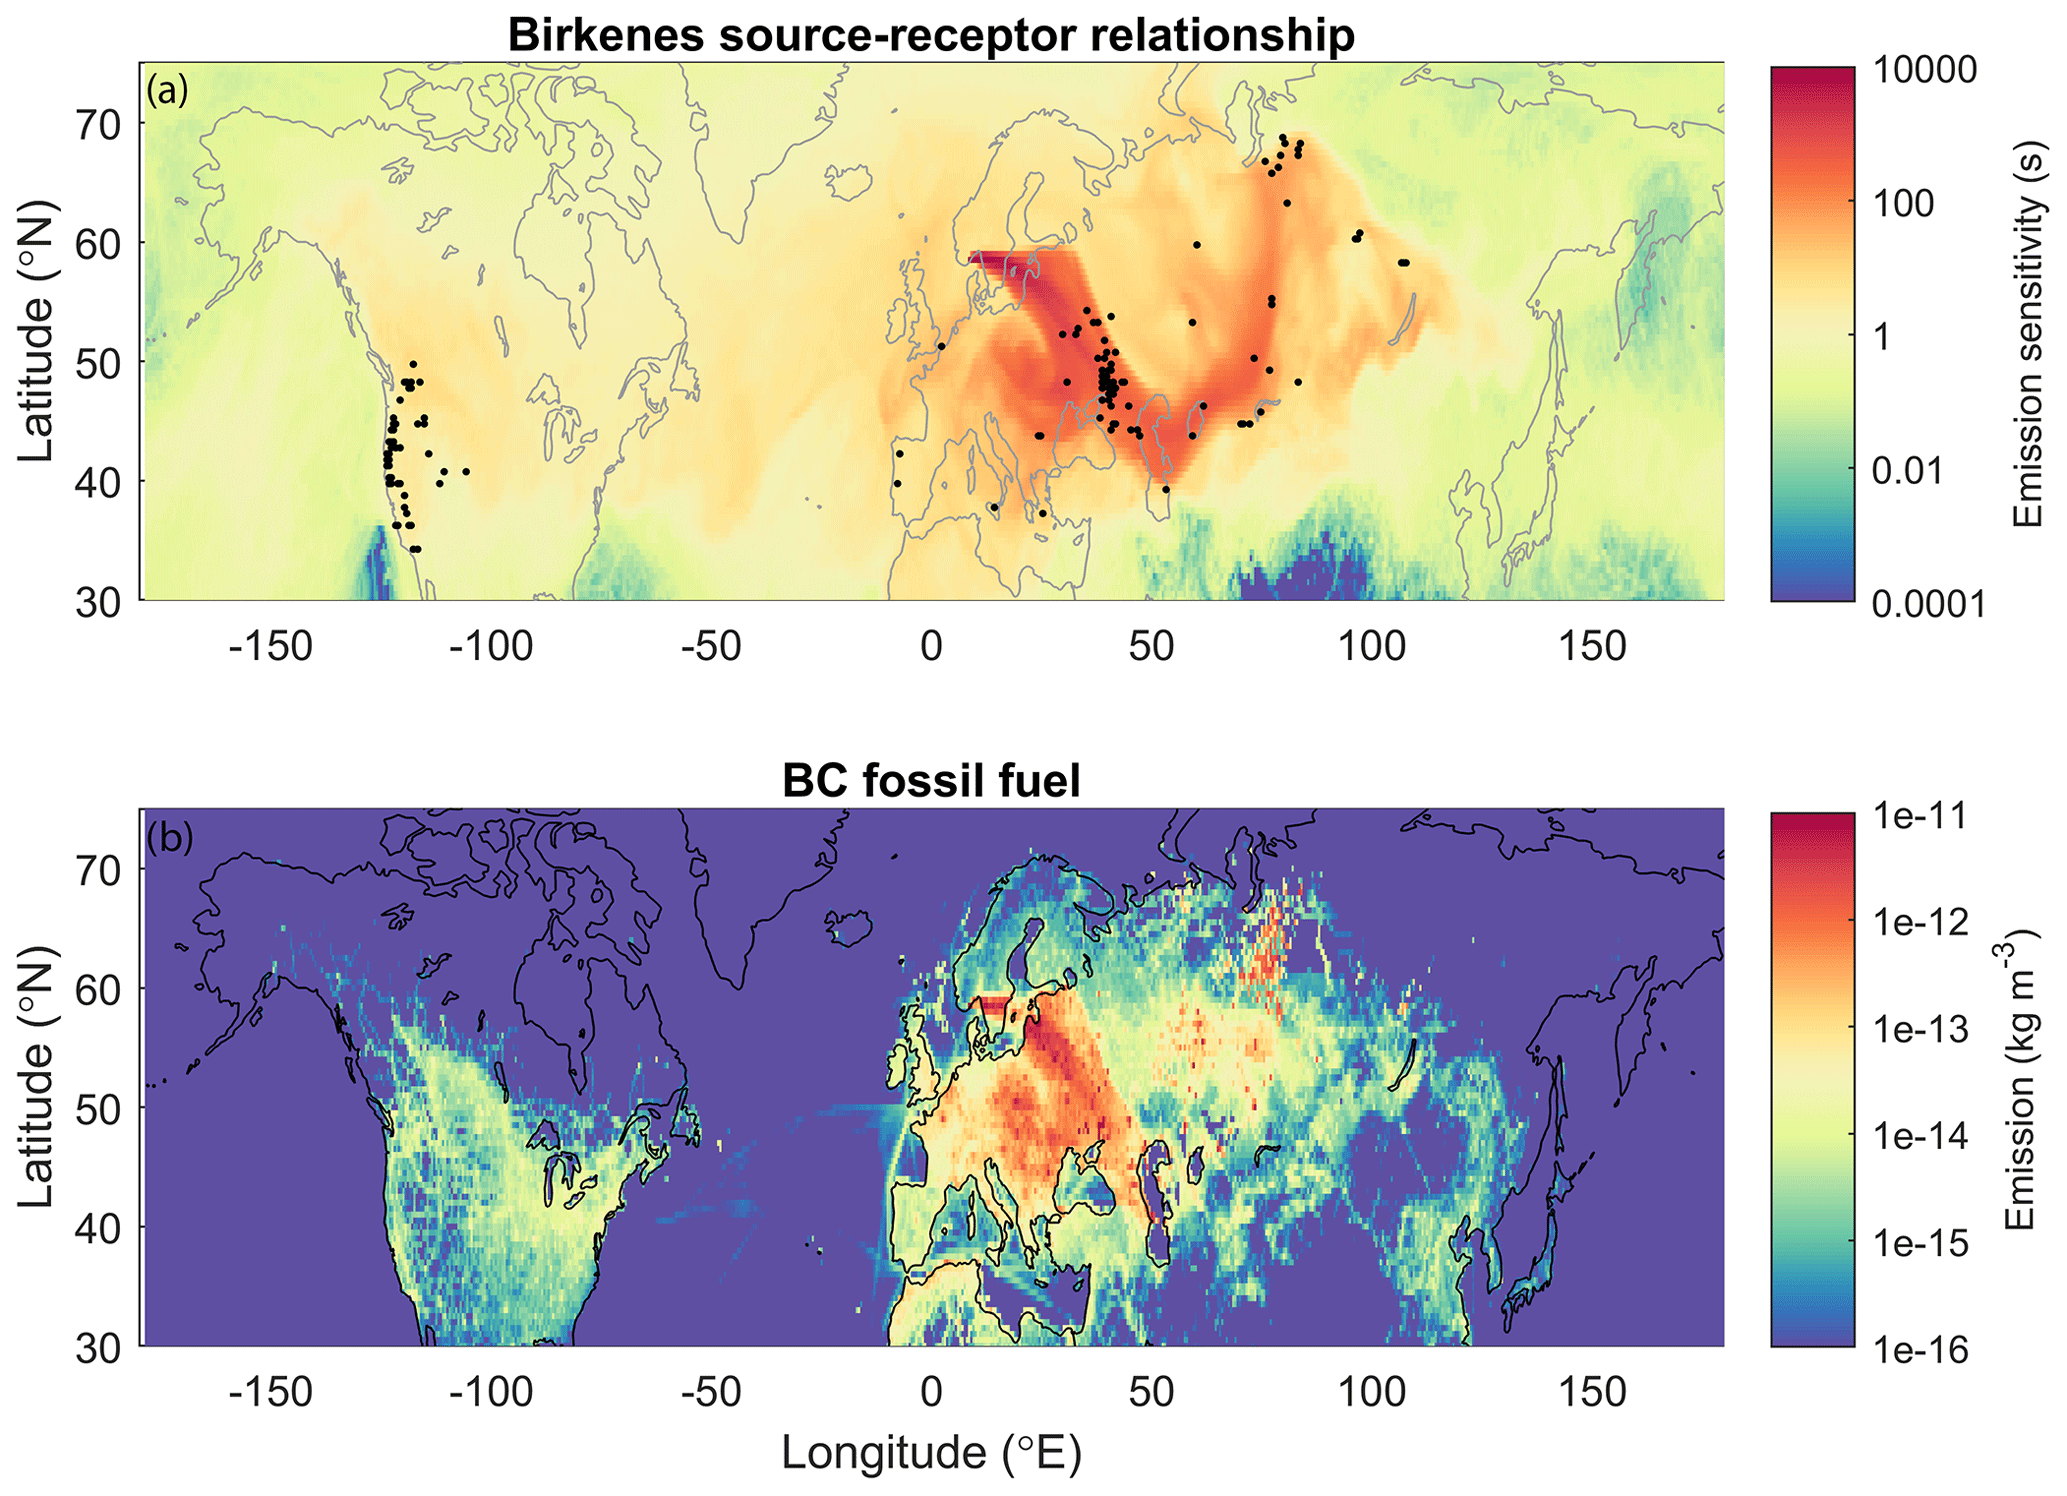
Figure 10BC source–receptor relationship at Birkenes (2 October 2020 at 00:00 to 4 October 2020 at 00:00) modelled with FLEXPART in backwards mode (a) and BC fossil fuel emissions (b). Markers in the top panel indicate locations with BC emissions from biomass burning that contribute >0.1 ng m−3 to BC concentrations at Birkenes. Only emissions that contribute to the modelled concentrations at Birkenes are included in the lower panel. The source–receptor relationship includes air masses up to 100 m above ground level.
An exceptional episode of elevated PM10 concentrations at several measurement sites, with levels exceeding those on any other occasion in the last 10 years, was observed on 2 and 3 October 2020 in Norway and elsewhere in northern Europe. We have analysed this episode based on surface observations, satellite observations, and atmospheric transport modelling.
LRT of PM was recorded with satellite observations, showing aerosols above the cloud layer. Radiative transport simulations with concentration profiles of different aerosol types were performed to gain an understanding of the processes influencing radiances observed by the OLCI (Sentinel-3). These indicated that there was a contribution from both absorbing and scattering particles for this episode. The rather larger contribution of coarse fraction relative to the fine fraction of PM10, however, pointed more in the direction of mineral dust. Chemical analysis of surface samples was thus necessary to determine the sources. In our surface observations, a clear influence of biomass burning was revealed (12 %–21 %), as well as mineral dust (25 %–47 %).
Surface concentrations of crustal elements Al, Fe, Ti, and Mn all strongly exceeded previous maximum recordings. At Birkenes, crustal element levels were 16 to 30 times higher than long-term mean values. Contributions of mineral dust were estimated to be 25 %–36 % of PM10 as a minimum and 31 %–47 % as a maximum. The ratios between crustal element levels were similar at all stations and pointed to a common dust source. Based on atmospheric transport simulations, we concluded that Central Asia, including the Karakum desert, was the main source of mineral dust observed in Norway during this episode, contributing roughly 88 % to surface dust concentrations.
Coincidentally, biomass burning emissions in the same transport pathway as the mineral dust plume caused simultaneous peaks in PM10. Contributions of biomass burning to PM10 were estimated to be 12 %–16 % up to 17 %–21 % at the rural background stations and 8 %–17 % at the remote site. Fires in Ukraine were a source of LRT to the background stations, as shown with backwards transport modelling. The model results, however, underestimated the retrieved BC levels at Birkenes and Zeppelin based on surface eBC observations. It could thus be that emissions in this region were underestimated or that additional sources were relevant. A qualitative comparison between CALIOP observations and FLEXPART model output, although limited due to cloud coverage, suggested that the model does capture the location of the BC plume.
Our analysis reveals how unrelated emission sources can combine during long-range transport to cause extreme adverse air quality events in Norway. Considering the 24 h PM10 EU limit of 50 µg m−3, a total of 70 exceedance days at 39 stations were observed in this single event. It thereby corresponds to 18 % of the annual mean number of exceedance days in Norway. This shows the large impact LRT episodes may have on air quality regulations. The combined use of remote sensing, high-quality measurements and transport modelling proved effective in describing the episode and distinguishing its causes.
Further research is needed to assess whether there are reasons to assume that this kind of episodes may occur more frequently in future. Emissions from wildfires and mineral dust sources are sensitive to changes in climate, land use, and human activities, and different temporal and spatial scales should be considered. Also, changes in atmospheric transport patterns could affect the occurrence of LRT episodes in Europe. Future studies should thus include earth system model simulations to give us a better understanding of the occurrence of such episodes in the future, although especially the complexity due to human component will make it difficult to draw conclusions.
was obtained by thermal-optical analysis (TOA), using the Lab OC-EC aerosol analyser (Sunset Laboratory Inc) and according to the EUSAAR-2 protocol (Cavalli et al., 2010). The sample content of CO-carbon was determined as for OC and EC but after subjecting a punch of the filter sample to thermal-oxidative pre-treatment (Jankowski et al., 2008; Evangeliou et al., 2016). The samples' OC and EC content were corrected with respect to the CO-carbon.
Organic tracers (levoglucosan, mannosan, galactosan, arabitol, mannitol, glucose, trehalose, 2-methylerythritol, and 2-methylthreitol) were analysed using Waters Acquity ultra-performance liquid chromatography (UPLC) in combination with Waters Premier XE high-resolution time-of-flight mass spectrometry (HR-ToF-MS) operated in the negative electrospray ionization (ESI) mode. The analytical methodology is based on that of Dye and Yttri (2005) but deviates by choice of column (two 2.1 mm × 150 mm HSS T3, 1.8 µm, Waters Inc.). All species were identified by retention time and mass spectra of authentic standards, and isotope-labelled standards of levoglucosan, galactosan, mannitol, arabitol, trehalose, and glucose were used as recovery standard (see Yttri et al., 2021).
Al, Fe, Mn, and Ti were analysed by ICP-MS (inductively coupled plasma mass spectrometry) (Agilent 7700x). Prior to analysis, aerosol filter samples were extracted (diluted supra pure HNO3), digested (75 min; max temp of 250 ∘C for 15 min) using an ultraCLAVE microwave system (Milestone, Italy), and diluted to 10 mL (ion exchanged H2O). External calibration was applied and calibration standards made of HNO3 (supra pure) (10 % ) to adapt to the sample matrix. Indium was used as recovery standard and applied to all samples, standards, blank filters, and reference materials.
Prior to ion chromatography analysis, filter samples were soaked in Milli-Q water (10 mL) and subjected to ultrasonic agitation (30 min). Extracts were analysed with respect to Ca2+, K+, Mg2+, Na+, and NH on a Dionex Integrion ion chromatograph, using a Dionex cation exchange CS16 column (3 mm × 250 mm), and a conductivity detector. Samples were eluted using methane sulfonic acid (34 mM) at a flow rate of 0.5 mL min−1. Cl−, NO, and SO were analysed on a Dionex Integrion ion chromatograph, using a Dionex anion exchange AS9-SC column (4 mm × 250 mm) and a conductivity detector. Samples were eluted using carbonate (K2CO3, 2.0 mM; HCO, 0.75 mM) at a flow rate of 2 mL min−1.
All in situ data are reported to the EMEP monitoring programme (Tørseth et al., 2012, https://doi.org/10.5194/acp-12-5447-2012) and are available from the database infrastructure EBAS (http://ebas.nilu.no/, last access: 11 June 2021) hosted at NILU. PM measurements are available from EEA (2020; https://discomap.eea.europa.eu/map/fme/AirQualityExport.htm, last access: 24 January 2022). FLEXPART simulation results are available from the authors upon request.
The videos show an animation of dust RGB (red, green, blue) composite images, which are based on infrared channel data from the Spinning Enhanced Visible and Infrared Imager (SEVIRI). Images, with 15 min temporal resolution, were downloaded from EUMETSAT (https://eumetview.eumetsat.int/mapviewer/?product=EO:EUM:DAT:MSG:DUST, last access: 17 January 2022; EUMETSAT Image Gallery, 2022). The regions with bright pink colours visualize the dust transport over several days (30 September–3 October). Furthermore, the supplement includes two animations of FLEXPART modelled surface concentrations of mineral dust and BC from biomass burning from 25 September until 7 October 2020, like also partly presented in Fig. 5. The supplement related to this article is available online at: https://doi.org/10.5194/acp-22-3789-2022-supplement.
KEY, WA, and MJ provided analysis and interpretation of surface observations. SMP provided eBC PMF analysis. HU provided (historical) elemental data. AK prepared analysis of the OLCI data and radiative transfer modelling. KS and SE prepared visualization and interpretation of CALIOP data. PH contributed to retrieval and interpretation of CAMS regional dust product. NE, SE, and CDGZ performed FLEXDUST and FLEXPART simulations and prepared analysis and visualization of model results. CDGZ and KEY wrote the original draft of the paper. All authors contributed with critical review, commentary, and editing of the manuscript.
The contact author has declared that neither they nor their co-authors have any competing interests.
The paper contains modified Copernicus Atmosphere Monitoring Service Information 2020; neither the European Commission nor ECMWF is responsible for any use that may be made of the information it contains.
Publisher’s note: Copernicus Publications remains neutral with regard to jurisdictional claims in published maps and institutional affiliations.
We thank NASA and CNES engineers and scientists for making CALIOP data available. The lidar data were downloaded from the ICARE Data and Service Center. We thank ESA for making OLCI data available through the Copernicus programme. Furthermore, we would like to acknowledge EUMETSAT for making dust RGBs available for download. The research leading to these results has benefited from Aerosols, Clouds, and Trace gases Research InfraStructure (ACTRIS), funding from the European Union Seventh Framework Programme (FP7/2007–2013) under ACTRIS-2 and the grant agreement no. 262254, and the COST Action CA16109, Chemical On-Line cOmpoSition and Source Apportionment of fine aerosoL (COLOSSAL).
The in situ data used are part of the Norwegian national monitoring programme (Aas et al., 2021) funded by the Norwegian Environment Agency (grant no. 21087006), except the tracer analysis at Zeppelin, which is funded by the Ministry of Climate and Environment, and the tracer analysis at Birkenes, which is funded by NILU.
This paper was edited by Frank Dentener and reviewed by two anonymous referees.
Aas, W., Eckhardt, S., Fiebig, M., Platt, S. M., Solberg, S., Yttri, K. E., and Zwaaftink Groot, C.: Monitoring of long-range transported air pollutants in Norway, annual report 2020, Miljødirektoratet rapport, NILU, Kjeller, Norway, M-2072/2021 NILU OR 13/2021, 2021.
Aftenposten: Mystisk røyk i Midt-Norge kan komme fra Øst-Europa, in: Aftenposten, https://www.aftenposten.no/norge/i/JJ1PyP/mystisk-roeyk-i-midt-norge-kan-komme-fra-oest-europa, last access: 3 October 2020.
Akritidis, D., Katragkou, E., Georgoulias, A. K., Zanis, P., Kartsios, S., Flemming, J., Inness, A., Douros, J., and Eskes, H.: A complex aerosol transport event over Europe during the 2017 Storm Ophelia in CAMS forecast systems: analysis and evaluation, Atmos. Chem. Phys., 20, 13557–13578, https://doi.org/10.5194/acp-20-13557-2020, 2020.
Alastuey, A., Querol, X., Aas, W., Lucarelli, F., Pérez, N., Moreno, T., Cavalli, F., Areskoug, H., Balan, V., Catrambone, M., Ceburnis, D., Cerro, J. C., Conil, S., Gevorgyan, L., Hueglin, C., Imre, K., Jaffrezo, J.-L., Leeson, S. R., Mihalopoulos, N., Mitosinkova, M., O'Dowd, C. D., Pey, J., Putaud, J.-P., Riffault, V., Ripoll, A., Sciare, J., Sellegri, K., Spindler, G., and Yttri, K. E.: Geochemistry of PM10 over Europe during the EMEP intensive measurement periods in summer 2012 and winter 2013, Atmos. Chem. Phys., 16, 6107–6129, https://doi.org/10.5194/acp-16-6107-2016, 2016.
Anderson, G., Clough, S., Kneizys, F., Chetwynd, J., and Shettle, E.: AFGL atmospheric constituent profiles (0–120 km), Tech. Rep. AFGL-TR-86-0110, Air Force Geophys. Lab., Hanscom Air Force Base, Bedford, Mass., 1986
Ansmann, A., Bösenberg, J., Chaikovsky, A., Comerón, A., Eckhardt, S., Eixmann, R., Freudenthaler, V., Ginoux, P., Komguem, L., Linné, H., Márquez, M. Á. L., Matthias, V., Mattis, I., Mitev, V., Müller, D., Music, S., Nickovic, S., Pelon, J., Sauvage, L., Sobolewsky, P., Srivastava, M. K., Stohl, A., Torres, O., Vaughan, G., Wandinger, U., and Wiegner, M.: Long-range transport of Saharan dust to northern Europe: The 11–16 October 2001 outbreak observed with EARLINET, J. Geophys. Res., 108, 4783, https://doi.org/10.1029/2003JD003757, 2003.
Bodí, M. B., Martin, D. A., Balfour, V. N., Santín, C., Doerr, S. H., Pereira, P., Cerdà, A., and Mataix-Solera, J.: Wildland fire ash: Production, composition and eco-hydro-geomorphic effects, Earth Sci. Rev., 130, 103–127, https://doi.org/10.1016/j.earscirev.2013.12.007, 2014.
Bond, T. C., Doherty, S. J., Fahey, D. W., Forster, P. M., Berntsen, T., DeAngelo, B. J., Flanner, M. G., Ghan, S., Kärcher, B., Koch, D., Kinne, S., Kondo, Y., Quinn, P. K., Sarofim, M. C., Schultz, M. G., Schulz, M., Venkataraman, C., Zhang, H., Zhang, S., Bellouin, N., Guttikunda, S. K., Hopke, P. K., Jacobson, M. Z., Kaiser, J. W., Klimont, Z., Lohmann, U., Schwarz, J. P., Shindell, D., Storelvmo, T., Warren, S. G., and Zender, C. S.: Bounding the role of black carbon in the climate system: A scientific assessment, J. Geophys. Res.-Atmos., 118, 5380–5552, https://doi.org/10.1002/jgrd.50171, 2013.
Buras, R., Dowling, T., and Emde, C.: New secondary-scattering correction in DISORT with increased efficiency for forward scattering, J. Quant. Spectrosc. Ra.,, 112, 2028–2034, 2011.
Canonaco, F., Crippa, M., Slowik, J. G., Baltensperger, U., and Prévôt, A. S. H.: SoFi, an IGOR-based interface for the efficient use of the generalized multilinear engine (ME-2) for the source apportionment: ME-2 application to aerosol mass spectrometer data, Atmos. Meas. Tech., 6, 3649–3661, https://doi.org/10.5194/amt-6-3649-2013, 2013.
Canonaco, F., Tobler, A., Chen, G., Sosedova, Y., Slowik, J. G., Bozzetti, C., Daellenbach, K. R., El Haddad, I., Crippa, M., Huang, R.-J., Furger, M., Baltensperger, U., and Prévôt, A. S. H.: A new method for long-term source apportionment with time-dependent factor profiles and uncertainty assessment using SoFi Pro: application to 1 year of organic aerosol data, Atmos. Meas. Tech., 14, 923–943, https://doi.org/10.5194/amt-14-923-2021, 2021.
Cavalli, F., Viana, M., Yttri, K. E., Genberg, J., and Putaud, J.-P.: Toward a standardised thermal-optical protocol for measuring atmospheric organic and elemental carbon: the EUSAAR protocol, Atmos. Meas. Tech., 3, 79–89, https://doi.org/10.5194/amt-3-79-2010, 2010.
CEN: Ambient air – Standard gravimetric measurement method for the determination of the PM10 or PM2,5 mass concentration of suspended particulate matter, European Committee for Standardization, Brussels, CSN EN 12341:12014, 2014.
Collin, G.: Regional Production, Updated documentation covering all Regional operational systems and the ENSEMBLE, METEO-FRANCE, CAMS50_2018SC2012_D2012.2010.2012-U2013_Models_documentation_202101_v202101, 2021.
Cox, C. and Munk, W.: Statistics of the sea surface derived from sun glitter, J. Mar. Res., 13, 198–227, 1954a.
Cox, C. and Munk, W.: Measurement of the roughness of the sea surface from photographs of the sun's glitter, J. Opt. Soc. Am., 44, 838–850, 1954b.
Crocchianti, S., Moroni, B., Waldhauserová, P. D., Becagli, S., Severi, M., Traversi, R., and Cappelletti, D.: Potential Source Contribution Function Analysis of High Latitude Dust Sources over the Arctic: Preliminary Results and Prospects, Atmosphere, 12, 347, https://doi.org/10.3390/atmos12030347, 2021.
Di Giuseppe, F., Remy, S., Pappenberger, F., and Wetterhall, F.: Improving CAMS biomass burning estimations by means of the Global ECMWF Fire Forecast system (GEFF), ECMWF, Technical Memorandum No. 790, 18 pp., available at: https://www.ecmwf.int/sites/default/files/elibrary/2016/ 16906-improving-gfas-and-cams-biomass-burning-estimations-means-global-ecmwf-fire-forecast-system.pdf (last access: 11 June 2021), 2016.
Donlon, C., Berruti, B., Buongiorno, A., Ferreira, M. H., Féménias, P., Frerick, J., Goryl, P., Klein, U., Laur, H., Mavrocordatos, C., Nieke, J., Rebhan, H., Seitz, B., Stroede, J., and Sciarra, R.: The Global Monitoring for Environment and Security (GMES) Sentinel-3 mission, Remote Sens. Environ., 120, 37–57, https://doi.org/10.1016/j.rse.2011.07.024, 2012.
Drinovec, L., Močnik, G., Zotter, P., Prévôt, A. S. H., Ruckstuhl, C., Coz, E., Rupakheti, M., Sciare, J., Müller, T., Wiedensohler, A., and Hansen, A. D. A.: The “dual-spot” Aethalometer: an improved measurement of aerosol black carbon with real-time loading compensation, Atmos. Meas. Tech., 8, 1965–1979, https://doi.org/10.5194/amt-8-1965-2015, 2015.
Dusek, U., Hitzenberger, R., Kasper-Giebl, A., Kistler, M., Meijer, H. A. J., Szidat, S., Wacker, L., Holzinger, R., and Röckmann, T.: Sources and formation mechanisms of carbonaceous aerosol at a regional background site in the Netherlands: insights from a year-long radiocarbon study, Atmos. Chem. Phys., 17, 3233–3251, https://doi.org/10.5194/acp-17-3233-2017, 2017.
Dye, C. and Yttri, K.: Determination of monosaccharide anhydrides in atmospheric aerosols by use of high-performance liquid chromatography combined with high-resolution mass spectrometry, Anal. Chem., 77, 1853–1858, https://doi.org/10.1021/ac049461j, 2005.
EEA (European Environment Agency): Download of air quality data, EEA [data set], https://discomap.eea.europa.eu/map/fme/AirQualityExport.htm (last access: 24 January 2022), 2020.
Emde, C., Buras-Schnell, R., Kylling, A., Mayer, B., Gasteiger, J., Hamann, U., Kylling, J., Richter, B., Pause, C., Dowling, T., and Bugliaro, L.: The libRadtran software package for radiative transfer calculations (version 2.0.1), Geosci. Model Dev., 9, 1647–1672, https://doi.org/10.5194/gmd-9-1647-2016, 2016.
EUMETSAT Image Gallery: Dust plume animations, EUMETSAT, https://eumetview.eumetsat.int/mapviewer/?product=EO:EUM:DAT:MSG:DUST, last access: 17 January 2022.
Evangeliou, N., Balkanski, Y., Hao, W. M., Petkov, A., Silverstein, R. P., Corley, R., Nordgren, B. L., Urbanski, S. P., Eckhardt, S., Stohl, A., Tunved, P., Crepinsek, S., Jefferson, A., Sharma, S., Nøjgaard, J. K., and Skov, H.: Wildfires in northern Eurasia affect the budget of black carbon in the Arctic – a 12-year retrospective synopsis (2002–2013), Atmos. Chem. Phys., 16, 7587–7604, https://doi.org/10.5194/acp-16-7587-2016, 2016.
Evangeliou, N., Kylling, A., Eckhardt, S., Myroniuk, V., Stebel, K., Paugam, R., Zibtsev, S., and Stohl, A.: Open fires in Greenland in summer 2017: transport, deposition and radiative effects of BC, OC and BrC emissions, Atmos. Chem. Phys., 19, 1393–1411, https://doi.org/10.5194/acp-19-1393-2019, 2019.
Fécan, F., Marticorena, B., and Bergametti, G.: Parametrization of the increase of the aeolian erosion threshold wind friction velocity due to soil moisture for arid and semi-arid areas, Ann. Geophys., 17, 149–157, https://doi.org/10.1007/s00585-999-0149-7, 1999.
Gasteiger, J. and Wiegner, M.: MOPSMAP v1.0: a versatile tool for the modeling of aerosol optical properties, Geosci. Model Dev., 11, 2739–2762, https://doi.org/10.5194/gmd-11-2739-2018, 2018.
Ginoux, P., Chin, M., Tegen, I., Prospero, J. M., Holben, B., Dubovik, O., and Lin, S. J.: Sources and distributions of dust aerosols simulated with the GOCART model, J. Geophys. Res., 106, 20255–20273, https://doi.org/10.1029/2000jd000053, 2001.
Groot Zwaaftink, C. D., Grythe, H., Skov, H., and Stohl, A.: Substantial contribution of northern high-latitude sources to mineral dust in the Arctic, J. Geophys. Res.-Atmos., 121, 13678–13697, https://doi.org/10.1002/2016JD025482, 2016.
Grythe, H., Kristiansen, N. I., Groot Zwaaftink, C. D., Eckhardt, S., Ström, J., Tunved, P., Krejci, R., and Stohl, A.: A new aerosol wet removal scheme for the Lagrangian particle model FLEXPART v10, Geosci. Model Dev., 10, 1447–1466, https://doi.org/10.5194/gmd-10-1447-2017, 2017.
Hak, C.: Norway's air quality monitoring network. Assessment of station siting according to regulations in EU's air quality directive, NILU, Norwegian Environment Agency Report M-358/2015, 2015.
Hao, W. M. and Ward, D. E.: Methane production from global biomass burning, J. Geophys. Res., 98, 20657–20661, 1993.
Hao, W. M., Petkov, A., Nordgren, B. L., Corley, R. E., Silverstein, R. P., Urbanski, S. P., Evangeliou, N., Balkanski, Y., and Kinder, B. L.: Daily black carbon emissions from fires in northern Eurasia for 2002–2015, Geosci. Model Dev., 9, 4461–4474, https://doi.org/10.5194/gmd-9-4461-2016, 2016.
Hess, M., Koepke, P., and Schult, I.: Optical Properties of Aerosols and Clouds: The Software Package OPAC, B. Am. Meteorol. Soc., 79, 831–844, 1998.
Hongisto, M. and Sofiev, M.: Long-range transport of dust to the Baltic Sea region, Int. J. Environ. Pollut., 22, 72–86, 2004.
Hu, Y., Fernandez-Anez, N., Smith, T., and Rein, G.: Review of emissions from smouldering peat fires and their contribution to regional haze episodes, Int. J. Wildland Fire, 27, 293–312, 2018.
IARC: List of Classifications, Agents classified by the IARC Monographs, Volumes 1–129, https://monographs.iarc.who.int/list-of-classifications, last access: 14 April 2021.
Indoitu, R., Orlovsky, L., and Orlovsky, N.: Dust storms in Central Asia: spatial and temporal variations, J. Arid Environ., 85, 62–70, 2012.
Jankowski, N., Schmidl, C., Marr, I. L., Bauer, H., and Puxbaum, H.: Comparison of methods for the quantification of carbonate carbon in atmospheric PM10 aerosol samples, Atmos. Environ., 42, 8055–8064, https://doi.org/10.1016/j.atmosenv.2008.06.012, 2008.
Kaiser, J. W., Heil, A., Andreae, M. O., Benedetti, A., Chubarova, N., Jones, L., Morcrette, J.-J., Razinger, M., Schultz, M. G., Suttie, M., and van der Werf, G. R.: Biomass burning emissions estimated with a global fire assimilation system based on observed fire radiative power, Biogeosciences, 9, 527–554, https://doi.org/10.5194/bg-9-527-2012, 2012.
Kaufman, Y., Ichoku, C., Giglio, L., Korontzi, S., Chu, D., Hao, W., Li, R.-R., and Justice, C.: Fire and smoke observed from the Earth Observing System MODIS instrument–products, validation, and operational use, Int. J. Remote Sens., 24, 1765–1781, 2003.
Kim, M.-H., Omar, A. H., Tackett, J. L., Vaughan, M. A., Winker, D. M., Trepte, C. R., Hu, Y., Liu, Z., Poole, L. R., Pitts, M. C., Kar, J., and Magill, B. E.: The CALIPSO version 4 automated aerosol classification and lidar ratio selection algorithm, Atmos. Meas. Tech., 11, 6107–6135, https://doi.org/10.5194/amt-11-6107-2018, 2018.
Kiss, G., Varga, B., Galambos, I., and Ganszky, I.: Characterization of water-soluble organic matter isolated from atmospheric fine aerosol, J. Geophys. Res., 107, 8339, https://doi.org/10.1029/2001JD000603, 2002.
Klimont, Z., Kupiainen, K., Heyes, C., Purohit, P., Cofala, J., Rafaj, P., Borken-Kleefeld, J., and Schöpp, W.: Global anthropogenic emissions of particulate matter including black carbon, Atmos. Chem. Phys., 17, 8681–8723, https://doi.org/10.5194/acp-17-8681-2017, 2017.
Kukkonen, J., López-Aparicio, S., Segersson, D., Geels, C., Kangas, L., Kauhaniemi, M., Maragkidou, A., Jensen, A., Assmuth, T., Karppinen, A., Sofiev, M., Hellén, H., Riikonen, K., Nikmo, J., Kousa, A., Niemi, J. V., Karvosenoja, N., Santos, G. S., Sundvor, I., Im, U., Christensen, J. H., Nielsen, O.-K., Plejdrup, M. S., Nøjgaard, J. K., Omstedt, G., Andersson, C., Forsberg, B., and Brandt, J.: The influence of residential wood combustion on the concentrations of PM2.5 in four Nordic cities, Atmos. Chem. Phys., 20, 4333–4365, https://doi.org/10.5194/acp-20-4333-2020, 2020.
Kylling, A., Groot Zwaaftink, C. D., and Stohl, A.: Mineral Dust Instantaneous Radiative Forcing in the Arctic, Geophys. Res. Lett., 45, 4290-4298, https://doi.org/10.1029/2018GL077346, 2018.
Laskin, A., Wietsma, T. W., Krueger, B. J., and Grassian, V. H.: Heterogeneous chemistry of individual mineral dust particles with nitric acid: A combined CCSEM/EDX, ESEM, and ICP-MS study, J. Geophys. Res., 110, https://doi.org/10.1029/2004JD005206, 2005.
Laupsa, H., Denby, B., Larssen, S., and Schaug, J.: Source apportionment of particulate matter (PM2.5) in an urban area using dispersion, receptor and inverse modelling, Atmos. Environ., 43, 4733–4744, https://doi.org/10.1016/j.atmosenv.2008.07.010, 2009.
Lelieveld, J., Evans, J. S., Fnais, M., Giannadaki, D., and Pozzer, A.: The contribution of outdoor air pollution sources to premature mortality on a global scale, Nature, 525, 367–371, 2015.
Locker, H. B.: The use of levoglucosan to assess the environmental impact of residential wood-burning on air quality, PhD thesis, Dartmouth Coll., Hanover, NH, USA, 1988.
Long, C. M., Nascarella, M. A., and Valberg, P. A.: Carbon black vs. black carbon and other airborne materials containing elemental carbon: Physical and chemical distinctions, Environ. Pollut., 181, 271–286, https://doi.org/10.1016/j.envpol.2013.06.009, 2013.
Marécal, V., Peuch, V.-H., Andersson, C., Andersson, S., Arteta, J., Beekmann, M., Benedictow, A., Bergström, R., Bessagnet, B., Cansado, A., Chéroux, F., Colette, A., Coman, A., Curier, R. L., Denier van der Gon, H. A. C., Drouin, A., Elbern, H., Emili, E., Engelen, R. J., Eskes, H. J., Foret, G., Friese, E., Gauss, M., Giannaros, C., Guth, J., Joly, M., Jaumouillé, E., Josse, B., Kadygrov, N., Kaiser, J. W., Krajsek, K., Kuenen, J., Kumar, U., Liora, N., Lopez, E., Malherbe, L., Martinez, I., Melas, D., Meleux, F., Menut, L., Moinat, P., Morales, T., Parmentier, J., Piacentini, A., Plu, M., Poupkou, A., Queguiner, S., Robertson, L., Rouïl, L., Schaap, M., Segers, A., Sofiev, M., Tarasson, L., Thomas, M., Timmermans, R., Valdebenito, Á., van Velthoven, P., van Versendaal, R., Vira, J., and Ung, A.: A regional air quality forecasting system over Europe: the MACC-II daily ensemble production, Geosci. Model Dev., 8, 2777–2813, https://doi.org/10.5194/gmd-8-2777-2015, 2015.
Martet, M., Peuch, V.-H., Laurent, B., Marticorena, B., and Bergametti, G.: Evaluation of long-range transport and deposition of desert dust with the CTM MOCAGE, Tellus B, 61, 449–463, https://doi.org/10.1111/j.1600-0889.2008.00413.x, 2009.
Marticorena, B. and Bergametti, G.: Modeling the atmospheric dust cycle: 1. Design of a soil-derived dust emission scheme, J. Geophys. Res., 100, 16415–16430, https://doi.org/10.1029/95JD00690, 1995.
Memmesheimer, M., Friese, E., Ebel, A., Jakobs, H. J., Feldmann, H., Kessler, C., and Piekorz, G.: Long-term simulations of particulate matter in Europe on different scales using sequential nesting of a regional model, Int. J. Environ. Pollut., 22, 108–132, 2004.
Myhre, G., D. Shindell, F.-M. Bréon, W. Collins, J. Fuglestvedt, J. Huang, D. Koch, J.-F. Lamarque, D. Lee, B. Mendoza, T. Nakajima, Robock, A., Stephens, G., Takemura, T., and Zhang, H.: Anthropogenic and Natural Radiative Forcing, Contribution of Working Group I to the Fifth Assessment Report of the Intergovernmental Panel on Climate Change, in: Climate Change 2013: The Physical Science Basis, edited by: Stocker, T. F., Cambridge University Press, Cambridge, United Kingdom and New York, NY, USA, 2013.
Patashnick, H. and Rupprecht, E. G.: Continuous PM-10 Measurements Using the Tapered Element Oscillating Microbalance, J. Air Waste Ma., 41, 1079–1083, https://doi.org/10.1080/10473289.1991.10466903, 1991.
Pisso, I., Sollum, E., Grythe, H., Kristiansen, N. I., Cassiani, M., Eckhardt, S., Arnold, D., Morton, D., Thompson, R. L., Groot Zwaaftink, C. D., Evangeliou, N., Sodemann, H., Haimberger, L., Henne, S., Brunner, D., Burkhart, J. F., Fouilloux, A., Brioude, J., Philipp, A., Seibert, P., and Stohl, A.: The Lagrangian particle dispersion model FLEXPART version 10.4, Geosci. Model Dev., 12, 4955–4997, https://doi.org/10.5194/gmd-12-4955-2019, 2019.
Prospero, J. M., Ginoux, P., Torres, O., Nicholson, S. E., and Gill, T. E.: ENVIRONMENTAL CHARACTERIZATION OF GLOBAL SOURCES OF ATMOSPHERIC SOIL DUST IDENTIFIED WITH THE NIMBUS 7 TOTAL OZONE MAPPING SPECTROMETER (TOMS) ABSORBING AEROSOL PRODUCT, Rev. Geophys., 40, 1002, https://doi.org/10.1029/2000RG000095, 2002.
Putaud, J.-P., Van Dingenen, R., Alastuey, A., Bauer, H., Birmili, W., Cyrys, J., Flentje, H., Fuzzi, S., Gehrig, R., Hansson, H. C., Harrison, R. M., Herrmann, H., Hitzenberger, R., Hüglin, C., Jones, A. M., Kasper-Giebl, A., Kiss, G., Kousa, A., Kuhlbusch, T. A. J., Löschau, G., Maenhaut, W., Molnar, A., Moreno, T., Pekkanen, J., Perrino, C., Pitz, M., Puxbaum, H., Querol, X., Rodriguez, S., Salma, I., Schwarz, J., Smolik, J., Schneider, J., Spindler, G., ten Brink, H., Tursic, J., Viana, M., Wiedensohler, A., and Raes, F.: A European aerosol phenomenology – 3: Physical and chemical characteristics of particulate matter from 60 rural, urban, and kerbside sites across Europe, Atmos. Environ., 44, 1308–1320, 2010.
Puxbaum, H., Caseiro, A., Sánchez-Ochoa, A., Kasper-Giebl, A., Claeys, M., Gelencsér, A., Legrand, M., Preunkert, S., and Pio, C.: Levoglucosan levels at background sites in Europe for assessing the impact of biomass combustion on the European aerosol background, J. Geophys. Res., 112, D23S05, https://doi.org/10.1029/2006JD008114, 2007.
Rémy, S., Kipling, Z., Flemming, J., Boucher, O., Nabat, P., Michou, M., Bozzo, A., Ades, M., Huijnen, V., Benedetti, A., Engelen, R., Peuch, V.-H., and Morcrette, J.-J.: Description and evaluation of the tropospheric aerosol scheme in the European Centre for Medium-Range Weather Forecasts (ECMWF) Integrated Forecasting System (IFS-AER, cycle 45R1), Geosci. Model Dev., 12, 4627–4659, https://doi.org/10.5194/gmd-12-4627-2019, 2019.
Saarikoski, S., Sillanpää, M., Sofiev, M., Timonen, H., Saarnio, K., Teinilä, K., Karppinen, A., Kukkonen, J., and Hillamo, R.: Chemical composition of aerosols during a major biomass burning episode over northern Europe in spring 2006: Experimental and modelling assessments, Atmos. Environ., 41, 3577–3589, https://doi.org/10.1016/j.atmosenv.2006.12.053, 2007.
Sandradewi, J., Prévôt, A. S., Szidat, S., Perron, N., Alfarra, M. R., Lanz, V. A., Weingartner, E., and Baltensperger, U.: Using aerosol light absorption measurements for the quantitative determination of wood burning and traffic emission contributions to particulate matter, Environ. Sci. Technol., 42, 3316–3323, 2008.
Sentinel-3 OLCI Overview, https://sentinel.esa.int/web/sentinel/user-guides/sentinel-3-olci/overview, last access: 14 April 2021.
Shen, H., Abuduwaili, J., Samat, A., and Ma, L.: A review on the research of modern aeolian dust in Central Asia, Arab. J. Geosci., 9, 625, https://doi.org/10.1007/s12517-016-2646-9, 2016.
Shi, Y., Matsunaga, T., Saito, M., Yamaguchi, Y., and Chen, X.: Comparison of global inventories of CO2 emissions from biomass burning during 2002–2011 derived from multiple satellite products, Environ. Pollut., 206, 479–487, 2015.
Simoneit, B. R. T., Schauer, J. J., Nolte, C. G., Oros, D. R., Elias, V. O., Fraser, M. P., Rogge, W. F., and Cass, G. R.: Levoglucosan, a tracer for cellulose in biomass burning and atmospheric particles, Atmos. Environ., 33, 173–182, https://doi.org/10.1016/S1352-2310(98)00145-9, 1999.
Sodemann, H., Lai, T. M., Marenco, F., Ryder, C. L., Flamant, C., Knippertz, P., Rosenberg, P., Bart, M., and McQuaid, J. B.: Lagrangian dust model simulations for a case of moist convective dust emission and transport in the western Sahara region during Fennec/LADUNEX, J. Geophys. Res., 120, 6117–6144, https://doi.org/10.1002/2015JD023283, 2015.
Stamnes, K., Tsay, S.-C., Wiscombe, W., and Jayaweera, K.: Numerically stable algorithm for discrete-ordinate-method radiative transfer in multiple scattering and emitting layered media, Appl. Optics, 27, 2502–2509, 1988.
Stohl, A., Berg, T., Burkhart, J. F., Fjǽraa, A. M., Forster, C., Herber, A., Hov, Ø., Lunder, C., McMillan, W. W., Oltmans, S., Shiobara, M., Simpson, D., Solberg, S., Stebel, K., Ström, J., Tørseth, K., Treffeisen, R., Virkkunen, K., and Yttri, K. E.: Arctic smoke – record high air pollution levels in the European Arctic due to agricultural fires in Eastern Europe in spring 2006, Atmos. Chem. Phys., 7, 511–534, https://doi.org/10.5194/acp-7-511-2007, 2007.
Stohl, A., Aamaas, B., Amann, M., Baker, L. H., Bellouin, N., Berntsen, T. K., Boucher, O., Cherian, R., Collins, W., Daskalakis, N., Dusinska, M., Eckhardt, S., Fuglestvedt, J. S., Harju, M., Heyes, C., Hodnebrog, Ø., Hao, J., Im, U., Kanakidou, M., Klimont, Z., Kupiainen, K., Law, K. S., Lund, M. T., Maas, R., MacIntosh, C. R., Myhre, G., Myriokefalitakis, S., Olivié, D., Quaas, J., Quennehen, B., Raut, J.-C., Rumbold, S. T., Samset, B. H., Schulz, M., Seland, Ø., Shine, K. P., Skeie, R. B., Wang, S., Yttri, K. E., and Zhu, T.: Evaluating the climate and air quality impacts of short-lived pollutants, Atmos. Chem. Phys., 15, 10529–10566, https://doi.org/10.5194/acp-15-10529-2015, 2015.
Szidat, S., Ruff, M., Perron, N., Wacker, L., Synal, H.-A., Hallquist, M., Shannigrahi, A. S., Yttri, K. E., Dye, C., and Simpson, D.: Fossil and non-fossil sources of organic carbon (OC) and elemental carbon (EC) in Göteborg, Sweden, Atmos. Chem. Phys., 9, 1521–1535, https://doi.org/10.5194/acp-9-1521-2009, 2009.
Tarrasón, L. H., Paul, D., Guerreiro, C., de Brito Beirao, M. F., and Rouil, L.: Interim Annual Assessment Report for 2018, European air quality in 2018, Copernicus Atmosphere Monitoring Service, ECMWF Copernicus Report, 66 pp., https://policy.atmosphere.copernicus.eu/reports/CAMS71_IAR_2018_Final_201908.pdf (last access: 11 June 2021), 2019.
Tørseth, K., Aas, W., Breivik, K., Fjæraa, A. M., Fiebig, M., Hjellbrekke, A. G., Lund Myhre, C., Solberg, S., and Yttri, K. E.: Introduction to the European Monitoring and Evaluation Programme (EMEP) and observed atmospheric composition change during 1972–2009, Atmos. Chem. Phys., 12, 5447–5481, https://doi.org/10.5194/acp-12-5447-2012, 2012 (data available at: http://ebas.nilu.no/, last access: 11 June 2021).
Turpin, B. J. and Lim, H.-J.: Species contributions to PM2.5 mass concentrations: Revisiting common assumptions for estimating organic mass, Aerosol Sci. Tech., 35, 602–610, 2001.
Winker, D. M., Vaughan, M. A., Omar, A., Hu, Y., Powell, K. A., Liu, Z., Hunt, W. H., and Young, S. A.: Overview of the CALIPSO mission and CALIOP data processing algorithms, J. Atmos. Ocean. Tech., 26, 2310–2323, https://doi.org/10.1175/2009JTECHA1281.1, 2009.
World Health Organization (WHO): WHO Air quality guidelines for particulate matter, ozone, nitrogen dioxide and sulfur dioxide. Global update 2005, WHO/SDE/PHE/OEH/06.02, 22 pp., https://apps.who.int/iris/bitstream/handle/10665/69477/WHO_SDE_PHE_OEH_06.02_eng.pdf?sequence=1 (last access: 11 June 2021), 2005.
Wooster, M. J., Roberts, G., Perry, G. L. W., and Kaufman, Y. J.: Retrieval of biomass combustion rates and totals from fire radiative power observations: FRP derivation and calibration relationships between biomass consumption and fire radiative energy release, J. Geophys. Res., 110, D24311, https://doi.org/10.1029/2005JD006318, 2005.
Yttri, K. E., Dye, C., Slørdal, L. H., and Braathen, O.-A.: Quantification of monosaccharide anhydrides by liquid chromatography combined with mass spectrometry: application to aerosol samples from an urban and a suburban site influenced by small-scale wood burning, J. Air Waste Ma., 55, 1169–1177, 2005.
Yttri, K. E., Dye, C., and Kiss, G.: Ambient aerosol concentrations of sugars and sugar-alcohols at four different sites in Norway, Atmos. Chem. Phys., 7, 4267–4279, https://doi.org/10.5194/acp-7-4267-2007, 2007a.
Yttri, K. E., Aas, W., Bjerke, A., Cape, J. N., Cavalli, F., Ceburnis, D., Dye, C., Emblico, L., Facchini, M. C., Forster, C., Hanssen, J. E., Hansson, H. C., Jennings, S. G., Maenhaut, W., Putaud, J. P., and Tørseth, K.: Elemental and organic carbon in PM10: a one year measurement campaign within the European Monitoring and Evaluation Programme EMEP, Atmos. Chem. Phys., 7, 5711–5725, https://doi.org/10.5194/acp-7-5711-2007, 2007b.
Yttri, K. E., Dye, C., Braathen, O.-A., Simpson, D., and Steinnes, E.: Carbonaceous aerosols in Norwegian urban areas, Atmos. Chem. Phys., 9, 2007–2020, https://doi.org/10.5194/acp-9-2007-2009, 2009.
Yttri, K. E., Lund Myhre, C., Eckhardt, S., Fiebig, M., Dye, C., Hirdman, D., Ström, J., Klimont, Z., and Stohl, A.: Quantifying black carbon from biomass burning by means of levoglucosan – a one-year time series at the Arctic observatory Zeppelin, Atmos. Chem. Phys., 14, 6427–6442, https://doi.org/10.5194/acp-14-6427-2014, 2014.
Yttri, K. E., Simpson, D., Bergström, R., Kiss, G., Szidat, S., Ceburnis, D., Eckhardt, S., Hueglin, C., Nøjgaard, J. K., Perrino, C., Pisso, I., Prevot, A. S. H., Putaud, J.-P., Spindler, G., Vana, M., Zhang, Y.-L., and Aas, W.: The EMEP Intensive Measurement Period campaign, 2008–2009: characterizing carbonaceous aerosol at nine rural sites in Europe, Atmos. Chem. Phys., 19, 4211–4233, https://doi.org/10.5194/acp-19-4211-2019, 2019.
Yttri, K. E., Canonaco, F., Eckhardt, S., Evangeliou, N., Fiebig, M., Gundersen, H., Hjellbrekke, A.-G., Lund Myhre, C., Platt, S. M., Prévôt, A. S. H., Simpson, D., Solberg, S., Surratt, J., Tørseth, K., Uggerud, H., Vadset, M., Wan, X., and Aas, W.: Trends, composition, and sources of carbonaceous aerosol at the Birkenes Observatory, northern Europe, 2001–2018, Atmos. Chem. Phys., 21, 7149–7170, https://doi.org/10.5194/acp-21-7149-2021, 2021.
Zdráhal, Z., Oliveira, J., Vermeylen, R., Claeys, M., and Maenhaut, W.: Improved method for quantifying levoglucosan and related monosaccharide anhydrides in atmospheric aerosols and application to samples from urban and tropical locations, Environ. Sci. Technol., 36, 747–753, 2002.
Zotter, P., Herich, H., Gysel, M., El-Haddad, I., Zhang, Y., Močnik, G., Hüglin, C., Baltensperger, U., Szidat, S., and Prévôt, A. S. H.: Evaluation of the absorption Ångström exponents for traffic and wood burning in the Aethalometer-based source apportionment using radiocarbon measurements of ambient aerosol, Atmos. Chem. Phys., 17, 4229–4249, https://doi.org/10.5194/acp-17-4229-2017, 2017.