the Creative Commons Attribution 4.0 License.
the Creative Commons Attribution 4.0 License.
 | 17 Mar 2022
Meteorology impact on PM2.5 change over a receptor region in the regional transport of air pollutants: observational study of recent emission reductions in central China
Xiaoyun Sun
Tianliang Zhao
Yongqing Bai
Shaofei Kong
Huang Zheng
Weiyang Hu
Xiaodan Ma
Jie Xiong
As an important issue in atmospheric environment, the contributions of anthropogenic emissions and meteorological conditions to air pollution have been little assessed over receptor regions in regional transport of air pollutants. In the present study of 5-year observations and modeling, we targeted the Twain-Hu Basin (THB), a large region of heavy PM2.5 pollution in central China, to assess the effects of meteorology on PM2.5 change over a receptor region in the regional transport of air pollutants. Based on observations of environment and meteorology over 2015–2019, the Kolmogorov–Zurbenko (KZ) filter was performed to decompose the PM2.5 variations into multiple timescale components over the THB, where the short-term, seasonal and long-term components accounted for, respectively, 47.5 %, 41.4 % and 3.7 % of daily PM2.5 changes. The short-term and seasonal components dominated the day-to-day PM2.5 variations with long-term component determining the change trend of PM2.5 concentrations over recent years. As the emission- and meteorology-related long-term PM2.5 components over the THB were identified, the meteorological contribution to the declining PM2.5 trend presented a distinct spatial pattern over the THB with northern positive rates up to 61.92 % and southern negative rates down to −24.93 %. The opposite effects of meteorology on PM2.5 pollution could accelerate and offset the effects of emission reductions in the northern and southern THB, which is attributed to the upwind diffusion and downward accumulation of air pollutants over receptor regions in regional PM2.5 transport. It is noteworthy that the increasing conversion efficiencies of SO2 and NO2 to sulfate and nitrate for secondary PM2.5 could have offset the effect of PM2.5 emission reduction on air pollution in the THB during recent years, revealing the enhancing contribution of gaseous precursor emissions to PM2.5 concentrations under control of anthropogenic emissions of PM2.5 and the gaseous precursors over receptor regions in the regional transport of air pollutants. Our results highlight the effects of emission mitigation and meteorological changes on the source–receptor relationship of the regional transport of air pollutants with the implication of long-range transport of air pollutants for regional and global environment changes.
- Article
(2435 KB) - Full-text XML
-
Supplement
(1301 KB) - BibTeX
- EndNote


Haze pollution with high levels of PM2.5 (fine particulate matters with aerodynamic diameters equal to or less than 2.5 µm) has been a serious problem in the atmospheric environment (Peng et al., 2016; Wang et al., 2016) with adverse influences on air quality and human health (Cao et al., 2012; Crouse et al., 2012). In recent years, large areas in central and eastern China (CEC) have experienced haze pollution with unprecedentedly high PM2.5 levels in the regions covering the North China Plain (NCP), Yangtze River Delta (YRD), Pearl River Delta (PRD) and Sichuan Basin (SB) (Zhang et al., 2012; C. Q. Lin et al., 2018; Guo et al., 2017). In order to improve air quality by reducing air pollutant emissions, the Chinese government has implemented an action plan for controlling anthropogenic emissions since September 2013 (http://www.gov.cn/xinwen/2018-02/01/content_5262720.htm, last access: 17 January 2022). Surface PM2.5 concentrations have exhibited 30 %–40 % decreases in CEC over recent years (Xue et al., 2019; Zhang et al., 2019). However, the changes of air pollution are generally co-determined by air pollutant emissions and meteorological conditions. The contributions of changes in meteorology and anthropogenic emissions to the improvement of air quality need to be comprehensively investigated.
PM2.5 includes primary particles emitted directly from various sources and secondary particles generated by homogeneous and heterogeneous chemical reactions of gaseous precursor in the atmosphere, depending on the emissions of the primary PM2.5 and its gaseous precursors (Y. Lin et al., 2018; Du et al., 2020). In addition to the emissions of air pollutants, meteorological conditions can alter the local accumulation, regional transport, chemical conversion and wet and dry depositions of air pollutants (Lu et al., 2017; Li et al., 2018). Severe haze pollution always occurs in the wintertime under stagnant meteorological conditions with weak near-surface winds, strong temperature inversion and high relative humidity in the atmospheric boundary layer, which are favorable for the accumulation of air pollutants to form air pollution (Li et al., 2018; Miao et al., 2015; Tang et al., 2016). Meteorological conditions are closely governed by synoptic circulation by modulating the atmospheric physical and chemical processes, including regional transport of air pollutants (Miao et al., 2017; Ning et al., 2019). By regulating synoptic circulation patterns, the climate changes of East Asian monsoons greatly influence the seasonal and interannual variations of aerosol concentrations for air pollution over China (Zhu et al., 2012; Jeong and Park, 2017).
Assessments of contributions of anthropogenic emissions and meteorological changes to air quality improvement are an important issue in environmental changes (Pearce et al., 2011; Zhang et al., 2018; Chen et al., 2019). Chemical transport models have been widely used to quantify meteorology's effect on PM2.5 variations by using a linear additive relationship between sensitivity and base simulations (Mueller and Mallard, 2011; X. Li et al., 2015; Zhang et al., 2020). The contribution of meteorological changes to PM2.5 decreases was estimated at the averages of 10 %–20 % with interannual fluctuations of about 5 % in CEC from 2015 to 2019 through a model-based environmental meteorology index (Gong et al., 2021). The accuracy of modeling assessments can be influenced by the uncertainties in emission inventories and the incomplete chemical and physical mechanisms in air pollution simulation (Li et al., 2011). Based on the statistical analysis of the long-term observational data, it was quantified that the emission controls could explain more of the variances in PM2.5 than meteorology (Gui et al., 2019), and 12 % of the observed PM2.5 decrease was attributed to meteorological drivers in China since 2013 (Zhai et al., 2019). However, modeling and observational studies have mostly assessed the contribution of emissions and meteorology to regional PM2.5 variations in the emission source regions with high anthropogenic emissions of air pollutants, and there have been few assessments of multi-scale changes of atmospheric environment over receptor regions in the regional transport of air pollutants.
The Twain-Hu Basin (THB), featuring the lowlands (mainly less than 200 m a.s.l.) of two central Chinese provinces, Hubei and Hunan (Fig. 1), is surrounded by the high air pollution regions of NCP, YRD, PRD and SB. As such, it is a key receptor region in the regional transport of air pollutants from the upstream region driven by East Asian monsoonal winds over CEC (Shen et al., 2020). Heavy air pollution in the THB with a unique “non-stagnation” atmospheric boundary layer is aggravated by the regional PM2.5 transport over CEC (Zhong et al., 2019; Yu et al., 2020). In combination with the heavy pollution region of NCP through distinct transport channels, the regional transport from northern China to central China contributed 70.5 % PM2.5 concentrations to a wintertime heavy pollution episode in the THB (Hu et al., 2021). Thus, the contributions of air pollutant emissions and meteorological conditions to air quality change over this region in central China need to be specifically assessed with the long-term observations over recent years.

Figure 1Topographical height (color contours, m a.s.l.) over the THB (outlined with black dashed line) with the locations of 14 sites (red dots) and the surrounding regions in central China.
In this study, we investigated the multi-scale changes of PM2.5 concentrations over the THB, a key receptor region of regional PM2.5 transport in China, from 2015 to 2019 by establishing a statistic model with a Kolmogorov–Zurbenko (KZ) filter. We then evaluated the contributions of anthropogenic emissions and meteorological changes to the declining trends in PM2.5 concentrations over this receptor region in regional PM2.5 transport over CEC during the past 5 years of emission controls. The analysis of THB's multi-scale air quality changes can improve the understanding of the effects of emission mitigation and meteorological changes on environmental change with regional transport of air pollutants.
2.1 Data
In order to analyze air quality changes in the THB, the observational data of hourly NO2, SO2 and PM2.5 concentrations from 2015 to 2019 were collected from the national air quality monitoring network (http://www.mee.gov.cn/, last access: 17 January 2022). The air quality observation data are under quality control, based on China's national standard of air quality observation.
The data of meteorological observations in the THB were sourced from the weather monitoring network of China Meteorological Administration (http://data.cma.cn/, last access: 17 January 2022), including air temperature (T), relative humidity (RH), sea level pressure (SLP), wind speed (WS) and precipitation (Pre), with temporal resolutions of 3 h.
2.2 KZ filter
To better understand the multiple timescale variations of PM2.5 and the relations to air pollutant emissions and meteorological drivers, a KZ filter (Rao and Zurbenko, 1994; Seo et al., 2018) is used to separate the daily data into multi-scale components, based on an iterative moving average that removes high-frequency variations in the data with applications in the study of air pollutants, especially O3 and PM2.5 variations (Chen et al., 2019; Ma et al., 2016; Seo et al., 2014; Zheng et al., 2020).
The KZ filter KZm,p with a length of moving average window m and number of iterations p can remove the high-frequency component of periods smaller than the effective filter width N (). The KZ filter is applicable to the time series with missing data owing to the iterative moving average process, which provides high accuracy when compared with the wavelet transform method (Eskridge et al., 1997). By comparing different sets of moving average m and number of iterations p, it was found that the decomposed time series using the KZ15,5 filter exhibited no white noise (short-term component), and the trend of the long-term component derived with the KZ365,3 filter corresponded approximately to the interannual trend of the original data (Rao and Zurbenko, 1994; Eskridge et al., 1997). Based on the spectral decompositions of the daily observational data and three components, the power spectra of daily observational data in periods of less than 33 d and longer than 632 d (1.7 years) have been well reproduced by short-term and long-term components, and the seasonal component well represents the seasonal variations, i.e., periods between 33 d and 1.7 years (Seo et al., 2018). Thus we applied KZ15,5 and KZ365,3 filters to remove the variations with periods shorter than 33 d and 1.7 years in this study.
A meteorological or environmental variable X(t) observed in time series t can be decomposed into the short-term component XST(t) and the baseline component XBL(t) presenting as
The baseline component XBL(t) is obtained by applying the KZ(15,5) filter to X(t), removing the short-term component XST(t) with the temporal period shorter than 33 d from the observed data, expressed as
The baseline component XBL(t) also can be separated into the daily climatic averages over the study period, occupying most of the seasonality in XBL(t) and the residual ε(t):
To obtain the long-term component XLT(t) by removing the variations with the temporal period shorter than 1.7 years, the KZ365,3 filter is applied to ε(t) expressed as follows:
with the short-term component
and the seasonal component
The KZ filter was used to separate the daily surface PM2.5, NO2 and SO2 concentrations into short-term, seasonal and long-term components in this study. The short-term component presents a synoptic-scale variation of meteorological influences, which could control local accumulation and regional transport of air pollutants (Seo et al., 2017), partly associated with short-term fluctuations in air pollutant emissions (Russell et al., 2010). The seasonal and long-term components are attributable to the variations in air pollutant emissions related to human activities as well as the seasonal and interannual changes in meteorological conditions (Kim et al., 2018).
2.3 Multiple linear regression of air pollutant changes with meteorological variables
By altering the local accumulation, regional transport, chemical conversion and wet and dry depositions of air pollutants, the meteorological factors such as wind, RH, T, air pressure and Pre could exert significant impacts on PM2.5 changes (Sun et al., 2013; Li et al., 2018; Z. Y. Chen et al., 2020). Therefore, with the multiple factors of the baseline components of 10 m WS, 2 m RH, 2 m T, SLP and Pre calculated by Eq. (2), a multiple linear regression equation was stepwise established for the baseline component of PM2.5 as follows:
where ) is the baseline component of the meteorological variable i with , respectively, for WSBL(t), RHBL(t), TBL(t), SLPBL(t), PreBL(t). We fit the regression coefficient ai for each meteorological variable and the intercept a0. The residual between PM2.5BL and regressed with the multiple linear Eq. (7) is given as
contains not only the variability of PM2.5 related to long-term changes in air pollutant emissions but also the minor seasonal change of PM2.5 attributable to unconsidered meteorological influences in the multiple linear regression. By removing the minor seasonal change from with the KZ365,3 filter, the emissions-related long-term component ) can be isolated as follows:
Here the long-term component of surface PM2.5 concentrations can be further separated into the emission- and meteorology-related long-term components with Eqs. (9) and (4) (Seo et al., 2018). Similarly, the multiple timescale variations in SO2 and NO2 with long-term variations related to changes in air pollutant emissions and meteorological drivers are decomposed by the KZ filter with multiple linear regression. Seo et al. (2018) described the details of this method.
3.1 Verification of PM2.5 decompositions in multi-scale variations
The daily PM2.5 concentrations observed at 14 sites over the THB (Fig. 1) were decomposed into short-term, seasonal and long-term components with Eqs. (4), (5) and (6) of the KZ filter. To verify the decomposition results, the spatial distribution of the total contributions of the short-term, seasonal and long-term PM2.5 components to the total variances of observed daily changes in PM2.5 concentrations over 2015–2019 are shown in Fig. 2a. The larger the total variance, the more independent the three components are of each other (Chen et al., 2019). The sum of the long-term, seasonal and short-term components contributed 91.4 %–94.4 % of the total variance, with regional averages of 92.7 % (Fig. 2), reflecting a satisfactory verification of the KZ filtering results.
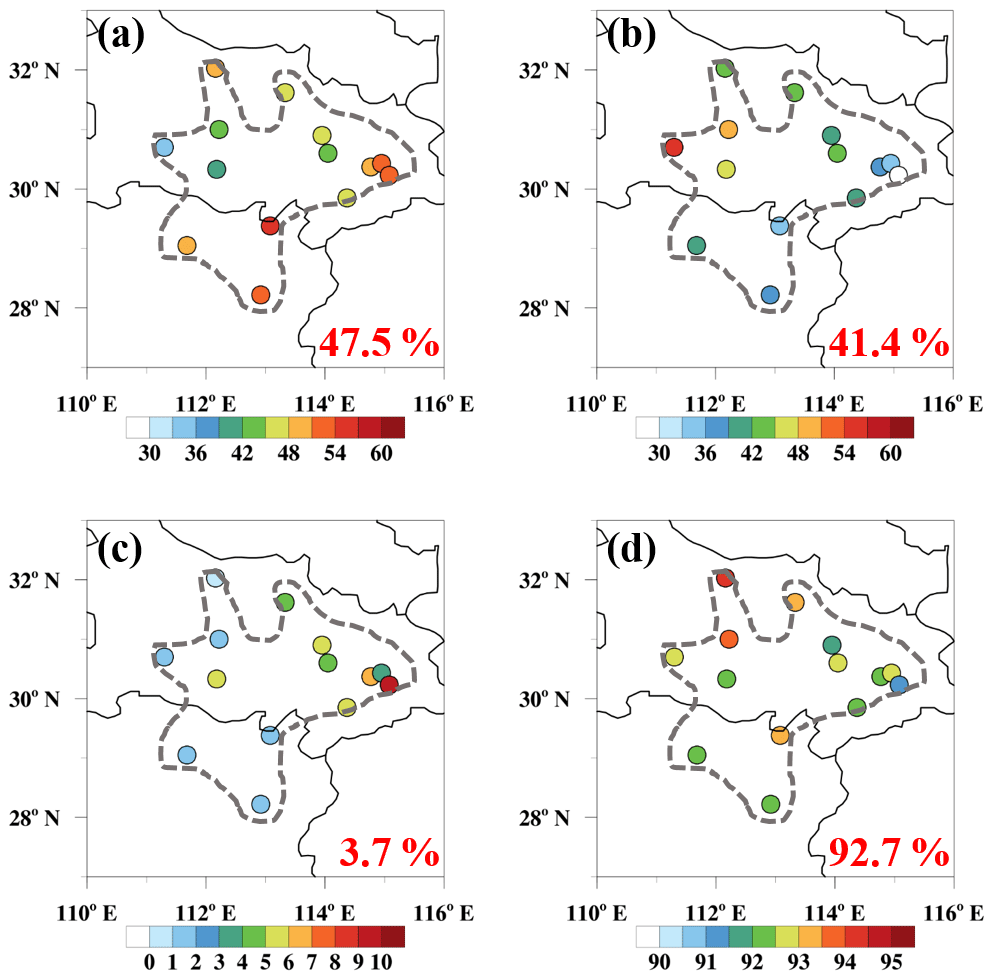
Figure 2Spatial distributions of the (a) short-term, (b) seasonal and (c) long-term components, and (d) total contribution to the total variances of daily PM2.5 changes observed at 14 sites in the THB with regional averages of 47.5 %, 41.4 %, 3.7 % and 92.7 %, respectively.
Based on the PM2.5 decomposition results of the KZ filter, the short-term, seasonal and long-term components, respectively, accounted for 34.8 %–53.8 %, 29.2 %–56.3 % and 0.2 %–9.8 % of the total variances of daily PM2.5 changes in the THB over recent years (Fig. 2b, c and d), reflecting the different patterns of multiple timescale variations of PM2.5 over this region in central China with diverse effects of emissions and meteorology. The regional contributions of the averaged short-term, seasonal and long-term components were, respectively, with 47.5 %, 41.4 % and 3.7 % of the daily PM2.5 changes over the THB (Fig. 2), and thus it could be reasonably verified that the daily variation in atmospheric pollutant was generally dominated by the short-term and seasonal components, with the long-term component determining the change trend (Ma et al., 2016; Yin et al., 2019a).
The short-term, seasonal and long-term PM2.5 components were averaged for 14 sites of the THB to characterize the temporal variations of three components in the THB for 2015–2019 (Fig. 3). The correlation coefficients of 0.05, 0.01 and 0.04 among the decomposed short-term, seasonal and long-term components were near zero, indicating the orthogonal decomposition of multiple timescale components (Eskridge et al., 1997). According to the decomposed long-term, seasonal and short-term components demonstrated in Fig. 3, the notable peaks of decomposed seasonal and short-term components were highly consistent with the peaks of PM2.5 concentrations in the original observed data, which further proved the reasonable decomposition of the multi-scale components of PM2.5 change over 2015–2019.
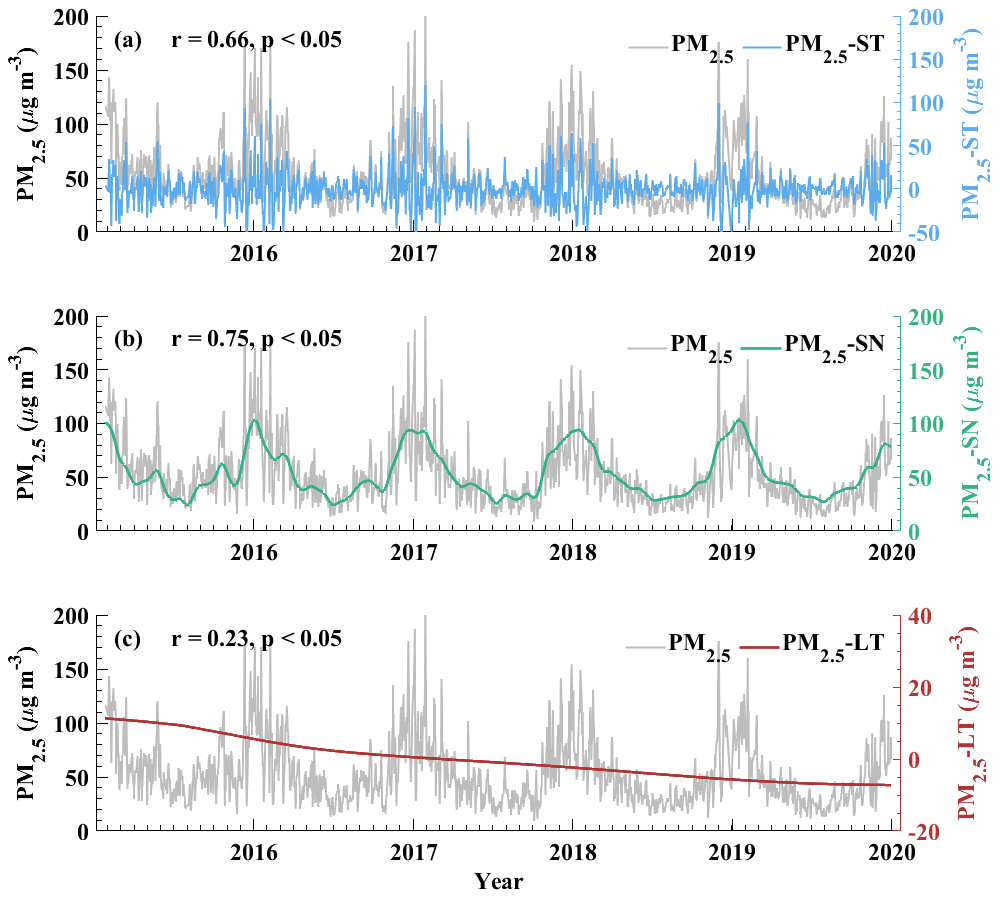
Figure 3The relations of regional averages of (a) short-term (PM2.5-ST), (b) seasonal (PM2.5-SN) and (c) long-term (PM2.5-LT) components with the observed daily PM2.5 concentrations (PM2.5) over the THB from 2015 to 2019.
The observed daily PM2.5 exhibited a distinct daily variation, with an overlapping of high-frequency variations, which could be caused by mesoscale and synoptic-scale meteorological processes (Ma et al., 2016). The short-term component of PM2.5 fluctuated frequently with a significantly positive correlation to the daily change of PM2.5 (r=0.68, p<0.05), indicating the important role of the short-term component with the temporal period <33 d in the day-to-day variations of PM2.5 concentrations in the THB (Fig. 3a).
The notable peaks of PM2.5 seasonal component that emerged in winters were highly consistent with the peaks of observed daily PM2.5 concentrations (Fig. 3b). A close linkage with the significant correlation coefficient of 0.75 (p<0.05) was found between the changes of PM2.5 seasonal component and daily PM2.5 concentrations, which could reflect a significant modulation of the PM2.5 seasonal oscillations in the day-to-day variations of PM2.5, driven by the seasonal shift of East Asian summer and winter monsoons, as well as the seasonal change of anthropogenic emissions (Zhu et al., 2012; Jeong and Park, 2017). The change of the long-term component of PM2.5 exhibited a steadily declining trend over 2015–2019 (Fig. 3c), which was consistent with the interannual trend of observed PM2.5 concentrations under the sustained impact of emission controls (Zhang et al., 2019; Xu et al., 2020). The correlation coefficient (r=0.24, p<0.05) of the long-term PM2.5 component with the observed daily PM2.5 change was much smaller than those of the short-term and seasonal PM2.5 components, implying less influence of emission reduction on the daily PM2.5 change and air pollution frequency, although the declining trend in PM2.5 was determined by anthropogenic emission reduction.
In previous studies, chemical transport models and statistical methods were both used to assess the changes in air pollution attributable to emissions and meteorology (Xiao et al., 2021). Significant declines in emissions-related PM2.5 concentrations occurred in central China (Wang et al., 2019; L. Chen et al., 2020), and the meteorology offset the impact of emission reduction in typical years of unfavorable meteorological conditions (Xu et al., 2020; Gong et al., 2021). The regional averaged emission- and meteorology-related long-term components and the long-term component over the THB are displayed in Fig. S1a in the Supplement, and suggest the steadily declining trend of PM2.5 and the dominant impact of emission reduction on long-term PM2.5 changes, which is consistent with previous studies using multiple linear regression models for central China (Fig. S1b). The meteorology-related long-term component has a positive value in certain periods, implying the significant modulating effect of meteorology on PM2.5 decline in the THB.
3.2 Multiple linear regressions of PM2.5, SO2 and NO2 with meteorological drivers
Since the short-term variations in meteorological variables were excluded, the correlations between baseline components of PM2.5 and meteorological variables were only related to their seasonal and long-term components, affected by the regional climate of East Asian monsoons rather than synoptic-scale meteorological processes. Based on our understanding of chemical and physical processes of diffusive transport, chemical transformation, emissions and depositions of PM2.5 in the atmosphere, the dominant meteorological factors for changing PM2.5 concentrations over china are wind speed, relative humidity, air temperature, atmospheric pressure and precipitation (Z. Y. Chen et al., 2020). We examined the significant correlations between baseline components of air pollutant concentrations and selected a set of meteorological factors, including air temperature, wind speed, precipitation, relative humidity and air pressure (Tables S1–S3 in the Supplement). The meteorological parameters selected in this study are consistent with previous studies (Z. Y. Chen et al., 2020).
Generally, the baseline components of air pollutants were negatively correlated with the baseline components of wind speed (WSBL) and positively correlated with the baseline components of sea level pressure (SLPBL; Tables S1–S3), which could be attributed to the ventilation effect of wind and the stagnant conditions of meteorology in high-pressure systems, restraining the horizontal and vertical dispersions of air pollutants (Hsu and Cheng, 2016; Wang et al., 2016; Miao et al., 2017). Although wind speed exerts a negative influence of on PM2.5 concentrations over the emission source region, increasing wind speed might cause the accumulation of PM2.5 concentrations over the downwind region of emission sources (Z. Y. Chen et al., 2020), which led to the inconsistent influence of WSBL in the region of central China (Tables S1–S3). Under high surface air temperature conditions, there are strong thermal activities such as turbulence, making an accelerated dispersion of air pollutants (Y. Yang et al., 2016). The negative influence of RHBL and TBL on PM2.5BL, SO2BL and NO2BL mainly reflected the effect of the seasonal cycle in East Asian winter and summer monsoons, whereas the influence of precipitation on air pollutants was more straightforward than other meteorological parameters, negatively influencing surface pollutant concentrations through the precipitation washout of air pollutants (Tables S1–S3).
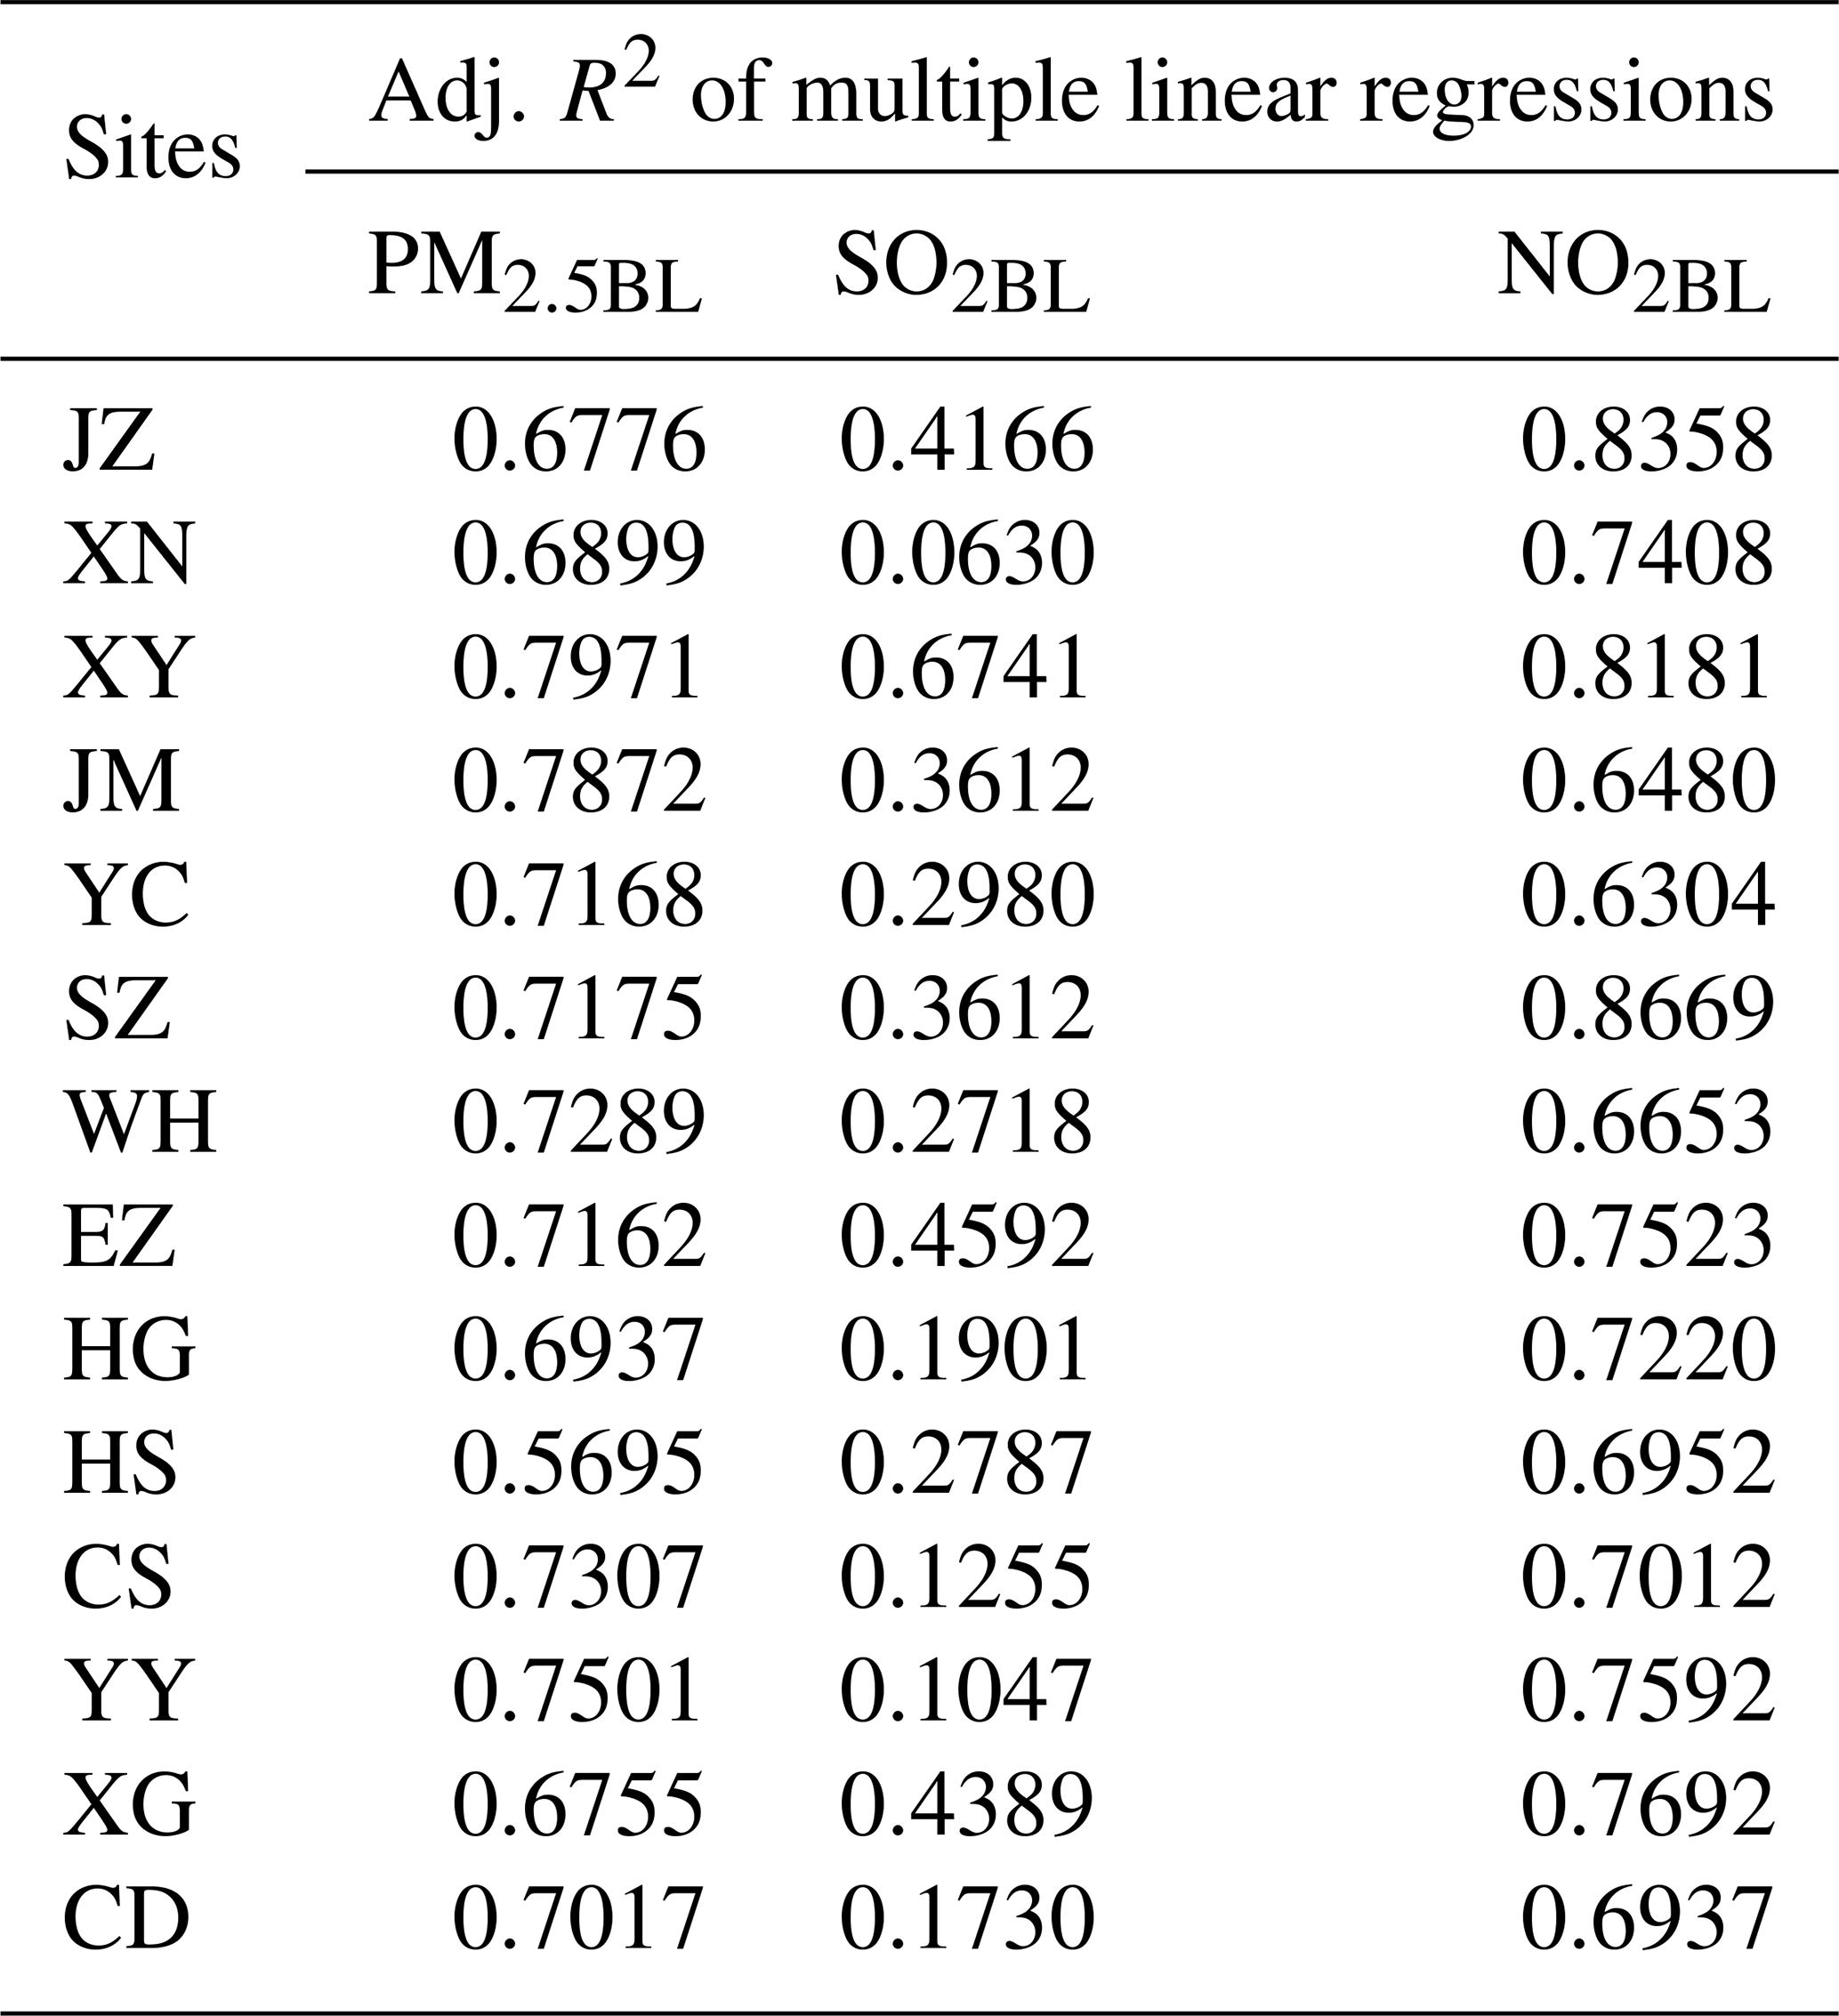
To isolate emissions-related long-term components from long-term components of PM2.5, NO2 and SO2, the stepwise multiple linear regressions of PM2.5BL, SO2BL and NO2BL, respectively, with the baseline components of the meteorological parameters (TBL, WSBL, RHBL, SLPBL and PreBL) were conducted with Eq. (7) for 14 sites, by adding and deleting meteorological variables based on their independent statistical significance to obtain the best model fit (Draper, 1998). We evaluated PM2.5BL, SO2BL and NO2BL fitted by multiple linear regression models with KZ decomposition (Table 1). The multiple linear regressions explained PM2.5BL, SO2BL and NO2BL with the adjusted determination coefficients (Adj. R2) of 0.5695–0.8093, 0.0630–0.4592 and 0.6304–0.8669, passing the confidence level of 99 % in all the THB sites, confirming the reasonable construction of the multiple linear regressions. The Adj. R2 of multiple linear regression for SO2BL were lower than those of PM2.5BL and NO2BL, which might be attributed to the larger impact of SO2 emission controls on the seasonal and long-term SO2 variations. In general, the variations of meteorological drivers can well reproduce the meteorology-related seasonal and long-term variations of PM2.5, SO2 and NO2 in the THB (Table 1).
Table 1Adjusted determination coefficients (Adj. R2) between the baseline components decomposed by the KZ filter and fitted with multiple linear regressions, respectively, for PM2.5BL, SO2BL and NO2BL in 14 sites over the THB. All Adj. R2 passing the confidence level of 99 %.
3.3 Interannual variations in air pollutants observed over the THB
PM2.5 consists of chemical components generated in the complex physical and chemical processes (S. Li et al., 2015). Primary particles are emitted directly from anthropogenic (e.g., industry, power plants and vehicles) and natural (e.g., outdoor biomass burning and dust storms) sources. Secondary particles (e.g., sulfate and nitrate) are converted in the chemical reactions of the precursor gases (e.g., SO2 and NOx), which are mainly produced by human activities (S. Li et al., 2015; H. Yang et al., 2016). Therefore, in addition to the reductions in primary particulate emissions, control of the secondary aerosol precursor emissions is of great importance in mitigating air pollution.
The interannual variations of the ratios in annual mean PM2.5, SO2 and NO2 concentrations relative to the annual averages in 2015 over the THB are displayed in Fig. 4. The declines of PM2.5 and SO2 in 2019 averaged over the THB were −26 % and −68 % relative to 2015, while the decrease ratio in NO2 was only −8 % over this region. The observed SO2 concentrations had a steeper decrease than PM2.5 and NO2, possibly because the dominant source sectors (i.e., power and industry) of SO2 significantly reduced their emissions (Zheng et al., 2018). The power sector was the major contributor to emission reduction but only accounted for one-third of NOx emissions and the contribution of transportation to NOx emissions was estimated to have increased over recent years (Zheng et al., 2018). The interannual variations in emissions for China were calculated from MEIC (Zheng et al., 2018), the annual total emissions of SO2 and NOx and the PM in the THB region reported by the National Bureau of Statistic of China (http://www.stats.gov.cn/tjsj/ndsj/, last access: 17 January 2022), presenting a more rapid decline of SO2 emissions in the THB than the changes of PM2.5 and NOx emissions (Fig. S2 in the Supplement). The declining trend of anthropogenic emissions estimated from emission inventories can support the explanation of the changes in air pollutant concentrations.
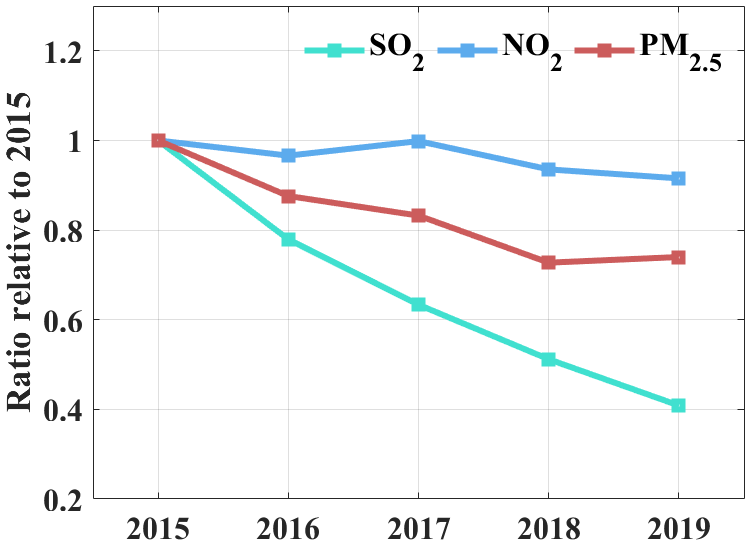
Figure 4Interannual variations in the ratios of observed annual mean concentrations of SO2, NO2 and PM2.5 relative to those in 2015 averaged over the THB.
Figure 5 shows the spatial distributions of 5-year averaged concentrations, the linear trends and the change rates in interannual variations of PM2.5, SO2 and NO2 observed in the THB over 2015–2019. The change rates (% yr−1) were calculated with the linear trends by dividing with temporal-mean concentrations of air pollutants at the observation sites for the analysis period in Fig. 5. The 5-year averaged PM2.5 concentrations over the THB exceeded the Chinese National secondary air quality standard of 35 µg m−3 for annual mean PM2.5 concentrations (Fig. 5a), while SO2 and NO2 concentrations reached the secondary standards of 60 and 40 µg m−3 in annual mean SO2 and NO2 concentrations at most sites over the THB (Fig. 5d and g). Specifically, the 5-year averaged NO2 concentrations exceeded 40 µg m−3 in WH (Wuhan), a megacity in central China, which might be attributable to the large amounts of traffic transportation. From 2015 to 2019, both PM2.5 and SO2 decreased at all sites over the THB (Fig. 5b and e), whereas NO2 trends changed from mostly negative to positive in some sites (Fig. 5h), possibly due to the spatial disparity of NOx emissions in traffic sectors (Zheng et al., 2018). The comparison among the change rates of PM2.5, SO2 and NO2 in the THB presented the largest decreases of SO2 with −40 %–−20 % yr−1 over the 5 years (Fig. 5c, f and i), reflecting the effective control of SO2 emissions in terms of primary gaseous pollutants.
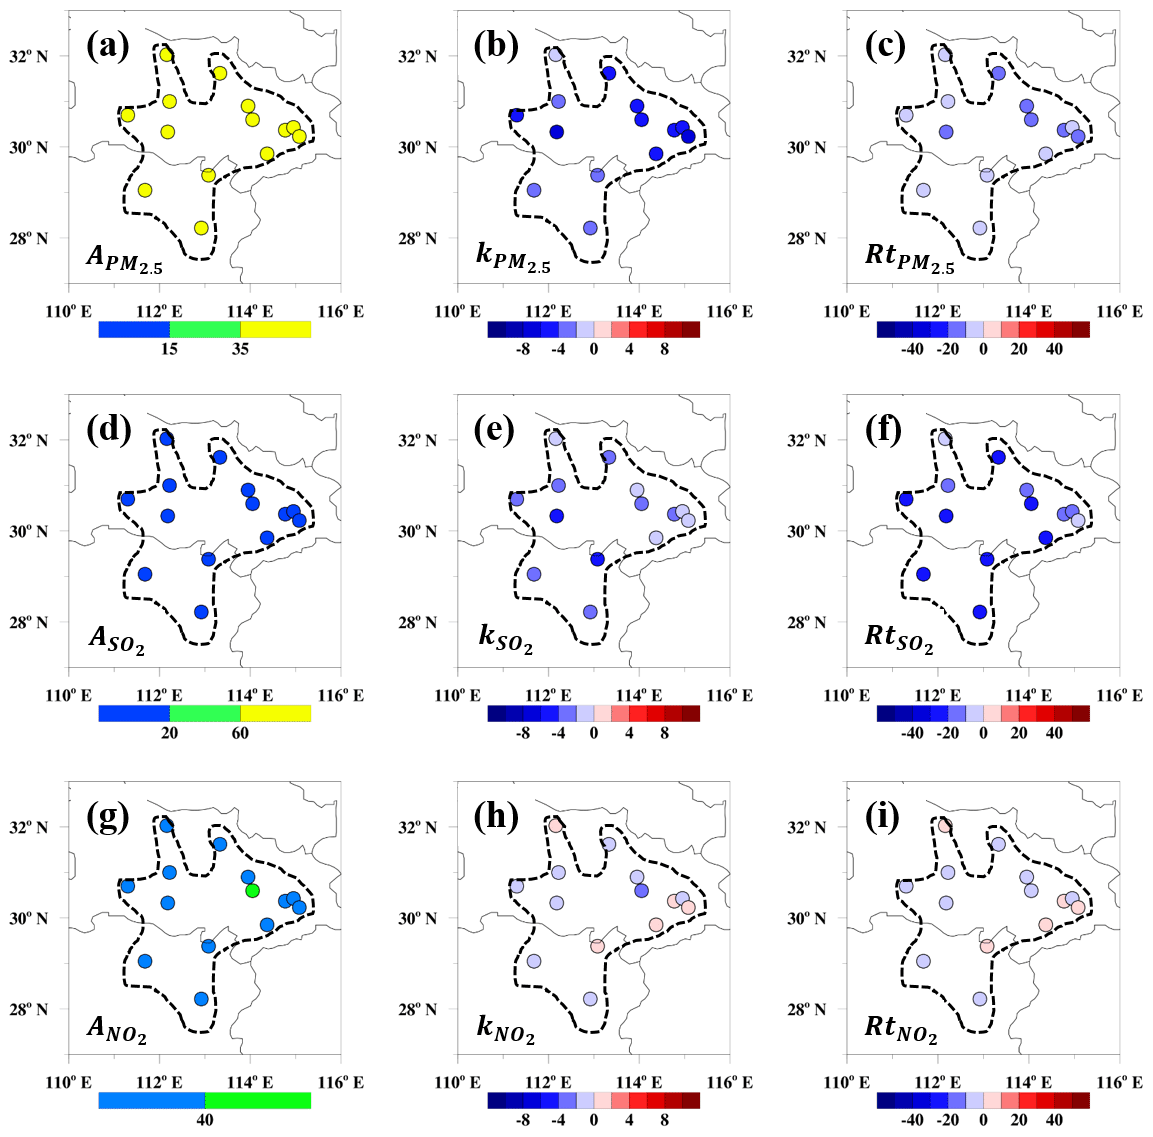
Figure 5Spatial distributions of (a, d, g) 5-year averages of (a) PM2.5, (d) SO2 and (g) NO2 concentrations (A, unit: µg m−3), (b, e, h) the linear trends in interannual variations of (b) PM2.5, (e) SO2 and (h) NO2 (k, unit: µg m−3 yr−1), as well as (c, f, i) the change rates (Rt , unit: % yr−1) of (c) PM2.5, (f) SO2 and (i) NO2 in the THB over 2015–2019.
There were obvious decreases in regional mean PM2.5, SO2 and NO2 concentrations over the THB (Fig. 4), while the declining degree of PM2.5 and SO2 varied from site to site over the THB and the change trends in NO2 were weak negative and even positive in certain sites (Fig. 5c, f and i). These interannual changes of air pollutants in the THB over recent years were investigated using the emission- and meteorology-related long-term components of the air pollutants in the next sections.
3.4 Effects of NO2 and SO2 emission reductions on PM2.5 change trends
The declining trend of PM2.5 in China could be partly attributed to the reduced NOx and SO2 concentrations for producing secondary aerosols (Zhang et al., 2018). The reduction rates of anthropogenic emissions markedly accelerated after 2013, decreasing by 59 % for SO2, 21 % for NOx and 33 % for PM2.5 during 2013–2017 over China (Zheng et al., 2018). In order to assess the effect of changing precursor pollutant emissions on PM2.5 reductions, we compared the linear trends of emissions-related long-term components of PM2.5, NO2 and SO2 decomposed based on Eq. (9) over the THB for 2015–2019 (Fig. 6). The distinct declining trends of emissions-related long-term PM2.5 and SO2 components, as well as the variable trends of emissions-related long-term NO2 components were distributed basically consistently with the positive and negative trends in the interannual variations of air pollutant concentrations in the THB (middle column of Fig. 5; Fig. 6), demonstrating that the local emissions of air pollutants could spatially dominate the long-term variations of air pollutants in central China, especially the increasing trends in NO2 at some THB sites.
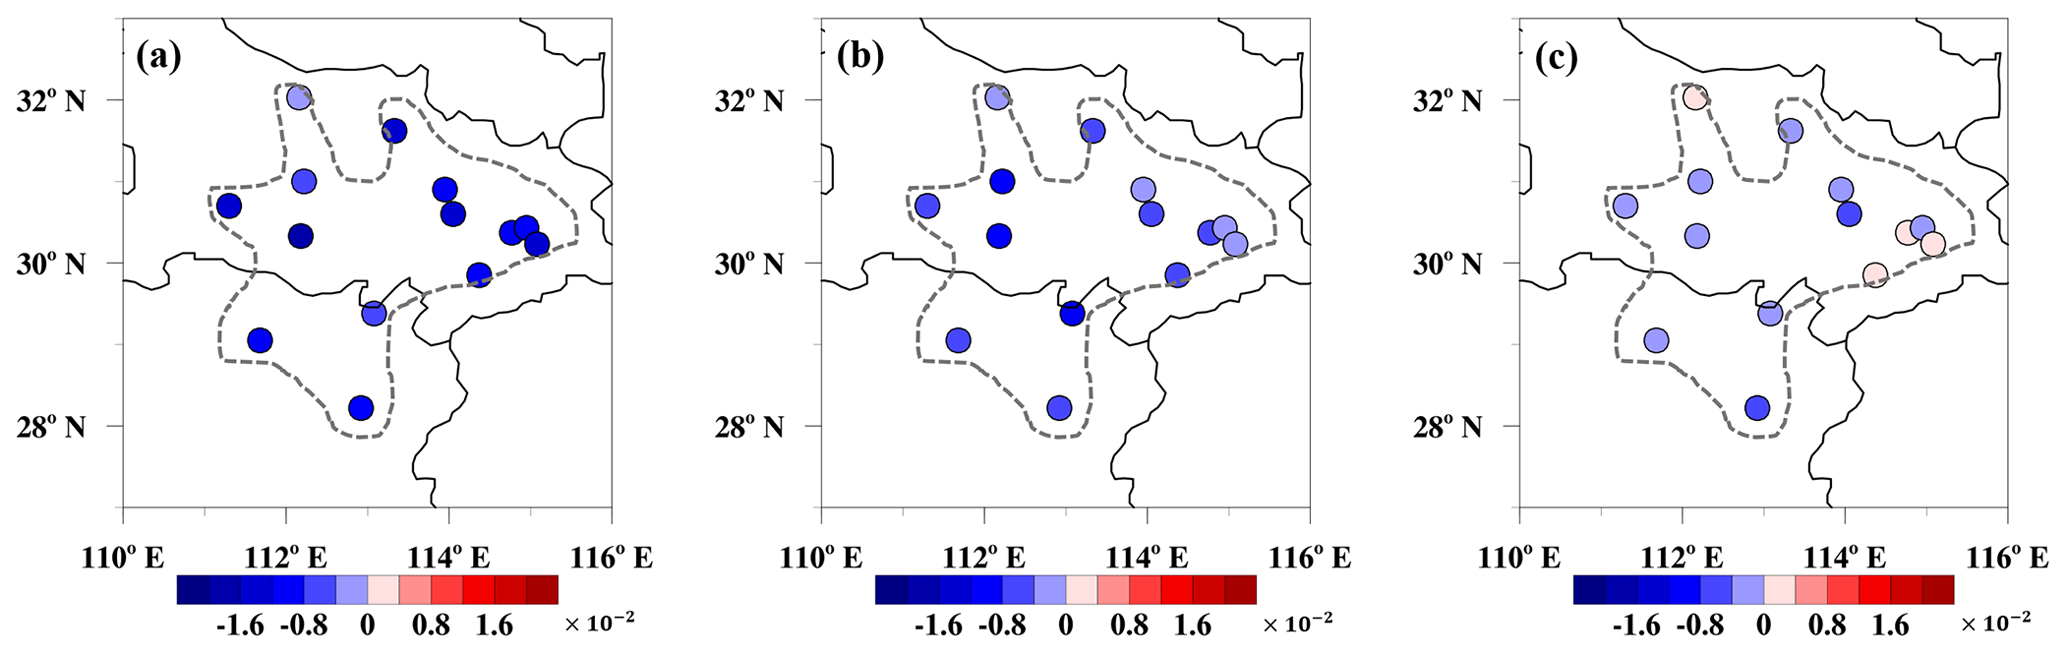
Figure 6Spatial distributions of the linear trends in emissions-related long-term components of (a) PM2.5, (b) SO2 and (c) NO2 (unit: µg m−3 d−1) over 2015–2019 in the THB.
PM2.5 concentrations are changed by emissions of both primary PM2.5 and its gaseous precursors. As major gaseous precursors, SO2 and NO2 can be oxidized to convert nitrate and sulfate for secondary PM2.5 (S. Li et al., 2015). To investigate the effects of emission reductions on the interannual variations of PM2.5, NO2 and SO2 over recent years, the ratios of change trends in long-term (kLT) and emissions-related long-term (kemiss) components of PM2.5, SO2 and NO2, in the THB over 2015–2019 were demonstrated in Fig. 7, where the long-term and emissions-related long-term components of PM2.5, SO2 and NO2 were calculated with Eqs. (4) and (9). The trend ratios indicated the more obvious downward trend of emissions-related long-term variations than the long-term trend of air pollutant concentrations, which might be attributed to the offsetting effect of meteorological conditions on emission reduction in the air quality change, whereas the long-term trend of air pollutant concentrations was more significant than the emissions-related long-term trend as , reflecting the synchronous impacts of anthropogenic emissions and meteorology on the long-term trend in air pollutant change. In addition, the trend ratios and of the gaseous precursors of PM2.5, SO2 and NO2, could reflect the high and weak efficiencies of SO2 and NO2, converting to sulfate and nitrate in the production of secondary PM2.5 during air pollutant emission reduction. The notable differences in Fig. 7 were spatially distributed with the trend ratios and in PM2.5, SO2 and NO2 concentrations under the same meteorological conditions, indicating the different influences of emissions on the long-term variations of PM2.5, SO2 and NO2 in the THB during recent years. The reduction in PM2.5 emissions was a primary cause of the long-term declines in PM2.5 concentrations in the THB, even though the meteorological changes might offset the effects of emission reduction on air quality improvement over the southern THB (Figs. 6 and 7). It is noteworthy that the trend ratios of PM2.5 were accompanied with of SO2 and NO2 at the downwind southern THB sites with both negative kLT and kemiss (Fig. 7, Table S4 in the Supplement), which could imply the increasing conversion efficiency of SO2 and NO2 to sulfate and nitrate for secondary PM2.5 during the reductions of air pollutant emissions over recent years. In the upwind northern THB sites, the of PM2.5 were accompanied with of SO2 and NO2 with an obvious facilitating effect of meteorology on the PM2.5 decline (Fig. 7, Table S4), revealing the underlying effect of regional transport of air pollutants on the spatial distribution of conversion efficiency of gaseous precursor to secondary PM2.5.
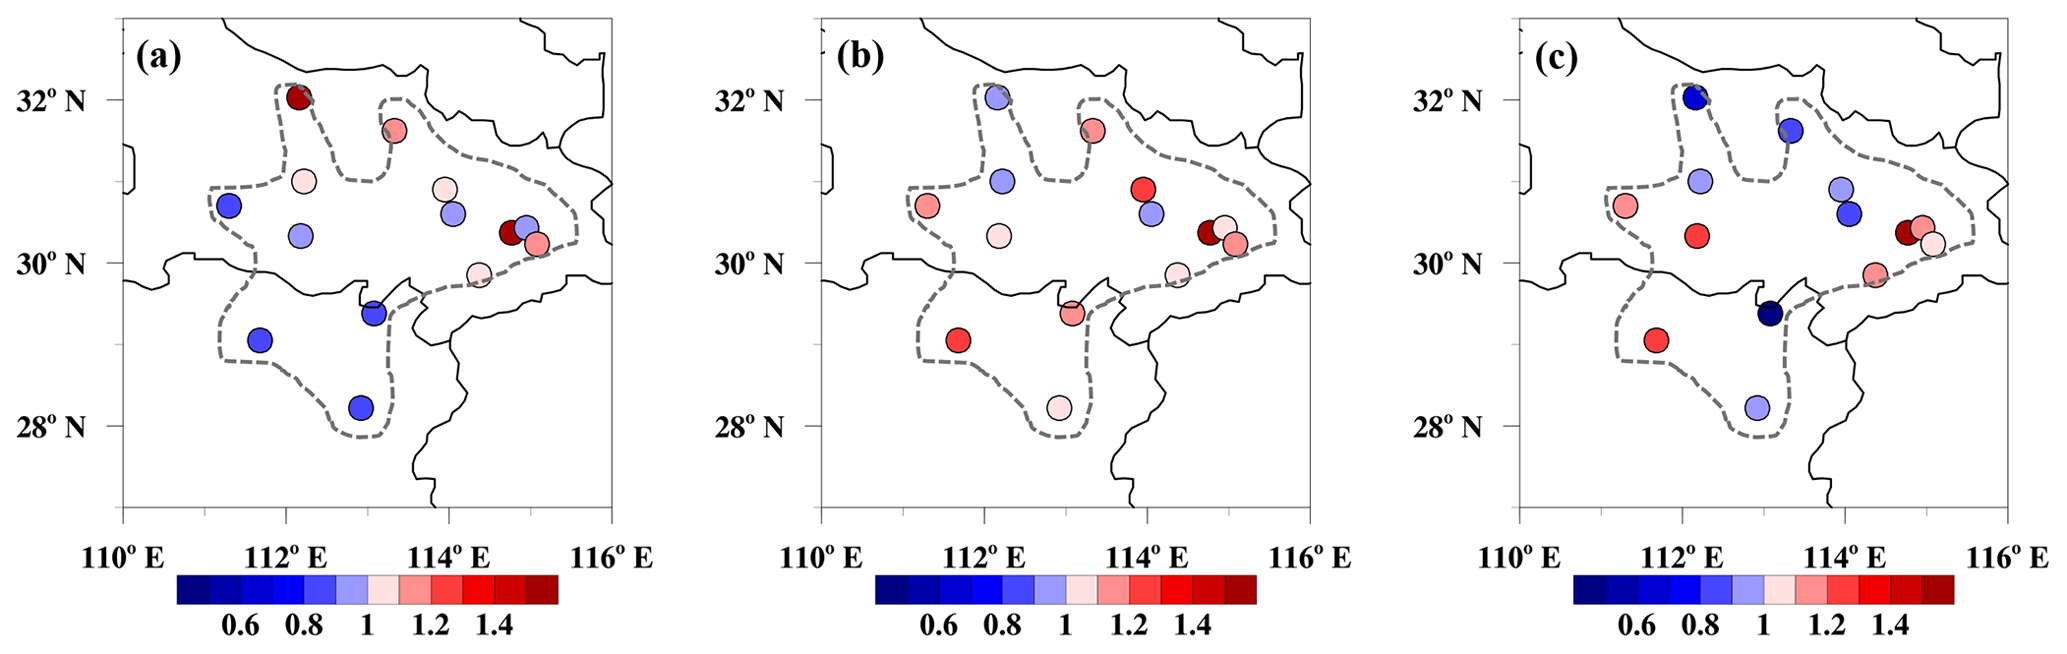
Figure 7Spatial distributions of the ratios of linear trends in long-term components (kLT) and emissions-related long-term components (kemiss) of (a) PM2.5, (b) SO2 and (c) NO2 at 14 sites in the THB over 2015–2019.
In order to further assess the effect of gaseous precursor emissions on PM2.5 declines during recent 5-year air pollution mitigation, we selected seven and nine sites in the THB with decreasing trends of emissions-related long-term SO2 and NO2 components below −0.5 and 0.0 µg m−3 100 d−1, respectively, (Table S4) to compare the trend ratios of PM2.5, NO2 and SO2 for 2015–2019 (Fig. 8). The significantly negative linear correlations between the changes in of gaseous precursors (SO2, NO2) and PM2.5 could present the connection of of NO2 and SO2 with of PM2.5, which confirms the fact that the high conversion efficiency of SO2 and NO2 to sulfate and nitrate could have have offset the role of PM2.5 emission reduction in controlling PM2.5 pollution. The decreasing emissions of gaseous precursors drove faster oxidation of NO2 and SO2 to nitrate and sulfate components of PM2.5 in the source regions of air pollution in China (Zhai et al., 2021; Huang et al., 2021). This study identified the enhancing contribution of gaseous precursors to PM2.5 concentrations with reduced anthropogenic emissions of air pollutants over receptor regions in regional PM2.5 transport.
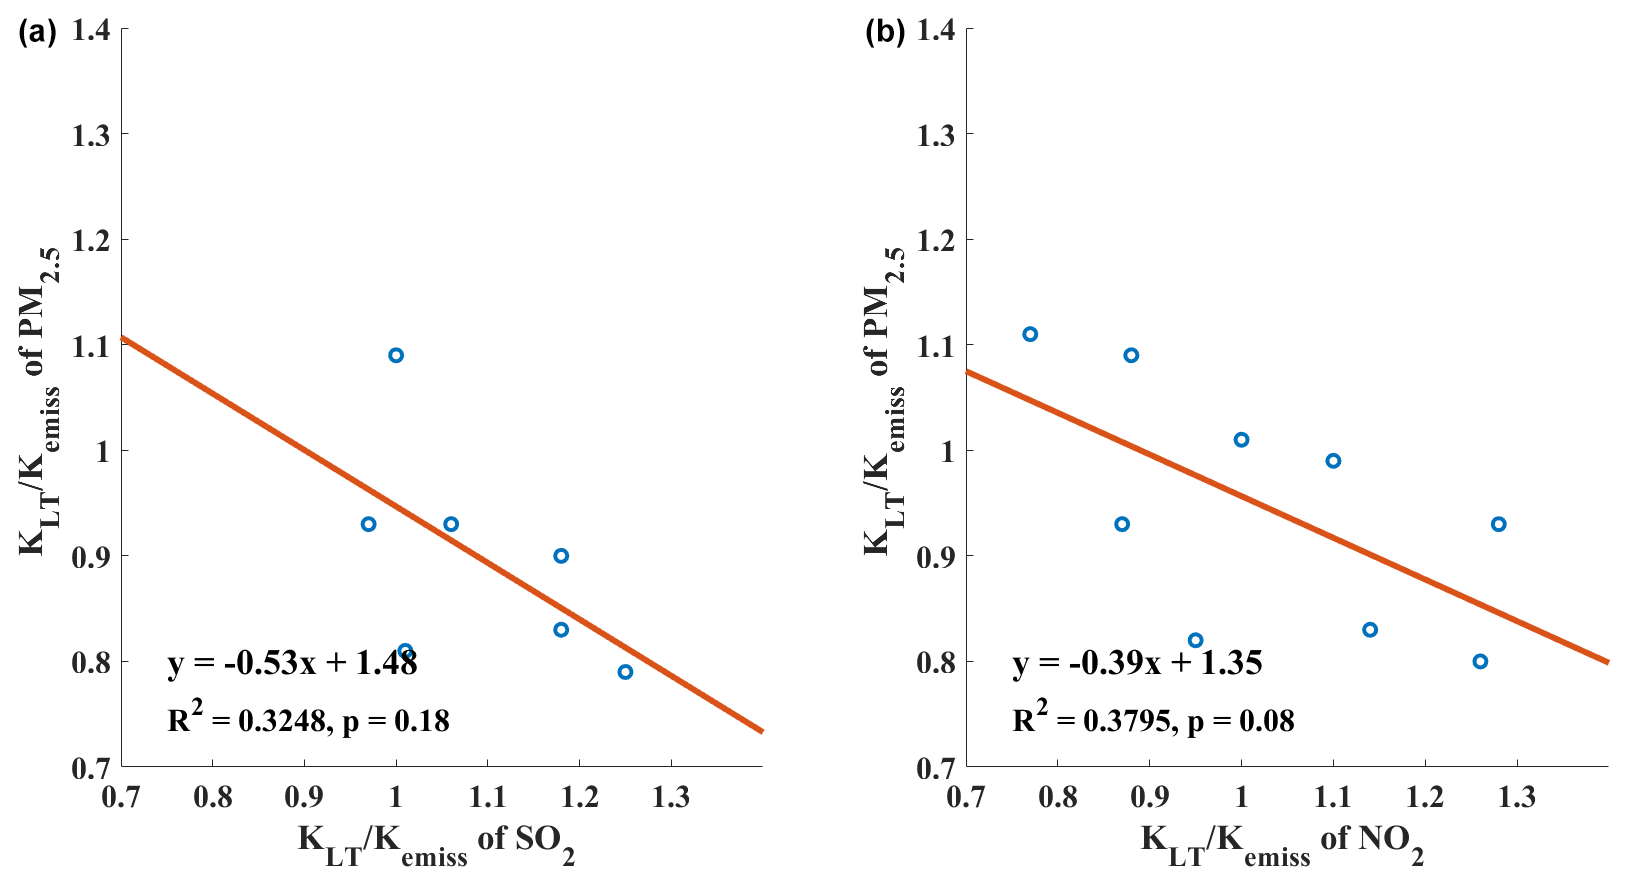
Figure 8Scatter plots of the ratios between kLT and kemiss of (a) SO2, (b) NO2 and PM2.5 in the THB from 2015 to 2019 with red lines for the linear fitting equations.
There are a few sources of uncertainty in the discussion of chemical transformation, for example in the separation of emission- and meteorology-related long-term components and in the selection of observational sites. Our results point to a better understanding of the offsetting effect of SO2 and NO2 oxidized to secondary particles in PM2.5 mitigation during the emission reduction in the THB. The long-term changes in PM2.5 are also caused by the emission variations of primary components like black and organic carbon, in addition to the chemical transformation of gaseous precursors. The difference in the emission of different primary pollutants may also lead to modifications in of PM2.5. However, due to the current lack of long-term observations of PM2.5 components in the THB, the influence of emission variations of primary components on long-term changes in PM2.5 concentrations is not assessed in our study. Further work with long-term observational data of PM2.5 components like black and organic carbon could be conducted to quantify the influence of emissions of primary components and chemical transformation of gaseous precursors on PM2.5 changes.
3.5 Meteorological contribution to PM2.5 change trends
As the air pollutant change trend is assumed to generally consist of emission- and meteorology-related changes (Seo et al., 2018; Yin et al., 2019b), the meteorological contribution rate Conmet to the long-term PM2.5 change trend is calculated with the following equation:
Here, Conmet (in %) is estimated with the linear trends kLT of the long-term component PM2.5LT(t) and kemiss of the emissions-related long-term component . PM2.5LT(t) and are, respectively, calculated with Eqs. (4) and (9).
To quantitatively assess the meteorological contribution to the declining PM2.5 trends, the linear trends kLT and kemiss with the meteorological contribution rate Conmet in Eq. (10) were presented in Table S5 in the Supplement for 14 sites over the THB during 2015–2019. All the trends kLT and kemiss, respectively, in PM2.5LT(t) and were negative over the THB (Table S5), indicating the significant effect of emission reductions on declining PM2.5 trends for improving regional air quality in central China. By comparing the declining PM2.5 trends kemiss and kLT from site to site (Table S5), the positive and negative contributions of meteorological variations to PM2.5 change trends over recent years were determined with the positive and negative differences between kemiss and kLT with the distinct meteorological influences on the change of the THB regional environment.
The spatial distribution of meteorological contribution rates Conmet regarding the long-term declining PM2.5 trend presented a unique pattern of northern positive and southern negative values over the THB (Fig. 9), with high positive contributions in the northern sites XY (61.92 %) and EZ (37.31 %), and as low negative contributions in the southern sites CD (−24.93 %) and CS (−23.03 %). It is worth mentioning that the contribution rates of meteorological variations show great spatial disparities at a small scale, i.e., EZ, HG and HS, which seems not be induced by the variation in synoptic weather or meteorological conditions. The underlying surface conditions dominate the near-surface meteorological conditions in the atmospheric boundary layer at a small scale (Wang et al., 2017). The topography and land use of HG, HS, EZ and the surrounding regions vary distinctly with the underlying surface conditions of plains, lakes and hilly areas. The underlying surface of observational sites with different near-surface meteorology effectively influences the local accumulation, chemical transformation, and dry and wet depositions of air pollutants (Bai et al., 2022). Therefore, the heterogeneity of meteorological contributions to PM2.5 at such a small spatial scale might be attributed to the local meteorological conditions in the atmospheric boundary layer, which are largely affected by the underlying surface changes.
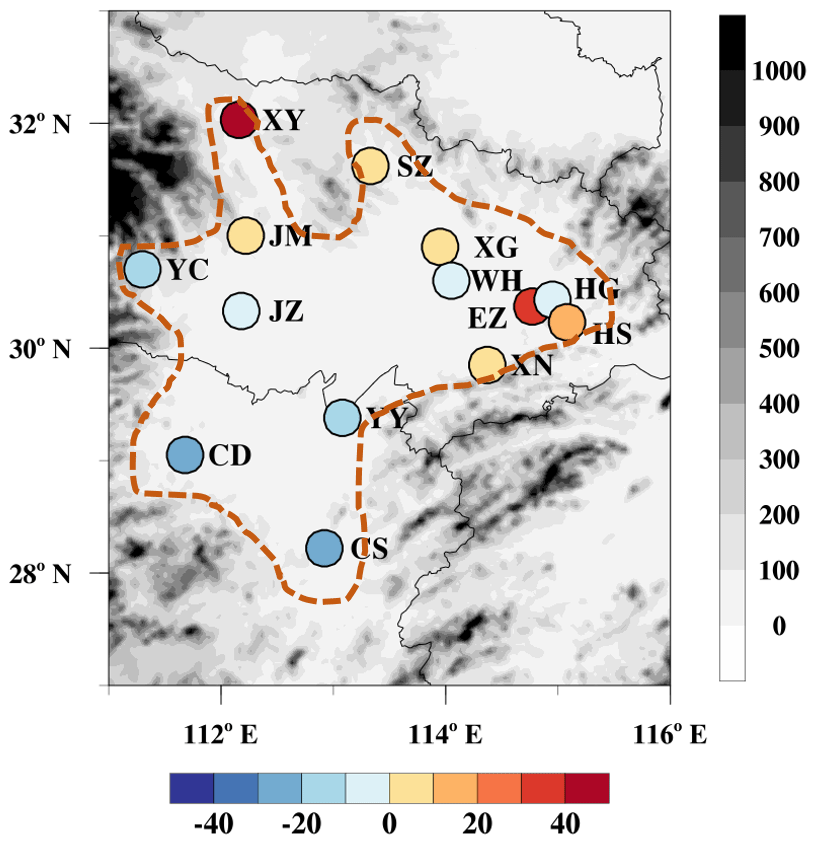
Figure 9Spatial distribution of contribution rates (colored dots, unit: %) of meteorological variations regarding PM2.5 reductions with topographical height (color contours, m a.s.l.) in the THB (outlined with orange dashed line) and surrounding regions from 2015 to 2019.
Compared with the statistical studies using synthetic data of meteorological influence on regional PM2.5 changes in central China and the meteorological contribution from −45.5 % to 29.0 % over recent years (Gong et al., 2021; L. Chen et al., 2020), the PM2.5 pollution over the THB was affected contrarily by meteorological drivers with the northern positive and southern negative contributions from 2015 to 2019 (Fig. 9). The meteorological change could accelerate and offset the effects of emission reductions on declining PM2.5 trends in the northern and southern THB, which might be attributed to the regional transport of air pollutants conducive to the upwind diffusion and downward accumulation of air pollutants, respectively, over the northern and southern THB under the declining wind of East Asian monsoons over recent years (Hu et al., 2020; Zhong et al., 2019).
3.6 Meteorological contribution to PM2.5 changes validated with WRF-Chem modeling
The above observational study investigated the meteorological influence on the changes in PM2.5 concentrations in the THB using the KZ filter, concluding on the large impact of meteorology on the PM2.5 changes over 2015–2019. To validate this conclusion of analyses with the KZ filter, we designed three sets of modeling experiments CTRL, SENS-MET and SENS-EMI (Table S6 in the Supplement) for December of 2015–2019, respectively, driven with the changing meteorology and anthropogenic emissions over 2015–2019, fixed meteorological conditions and anthropogenic emissions of 2015 with atmospheric chemical model WRF-Chem (Weather Research and Forecasting model with Chemistry). Air pollutant emission inventories, modeling configuration, experiment design and modeling verification are described in the Supplement. The modeling verification of experiments CTRL indicated that PM2.5 and meteorology were reasonably reproduced by the WRF-Chem simulation (Figs. S4–S5, Table S7 in the Supplement), and the three designed sets of modeling experiments CTRL, SENS-MET and SENS-EMI can be used in the further analyses of emission and meteorological impact on PM2.5 change over 2015–2019 to confirm the results of the KZ filter.
We derived the impact of meteorology by comparing the simulated PM2.5 concentrations in three sets of experiments CTRL, SENS-MET and SENS-EMI (Table S6). The relative contribution of meteorology to the interannual changes of PM2.5 concentrations was calculated with a linear additive relationship of contributions of meteorology and emission in the following equations:
kCTRL,kMET and kEMI represent the trends in interannual changes of PM2.5 concentrations simulated by the experiments CTRL, SENS-MET and SENS-EMI, respectively. ConMET and ConEMI are the contributions of meteorology and emission, and RConMET is the contribution rate (%) of meteorology to interannual changes of PM2.5 concentrations (Zhang et al., 2020).
Based on WRF-Chem modeling experiments, we assessed the impact of meteorological changes on interannual PM2.5 variations from 2015 to 2019 with Eqs. (11)–(13). The relative contribution of meteorology to interannual PM2.5 variations displayed a regional pattern of northern positive and southern negative values over the THB (Fig. 10), confirming the impact of meteorological changes by accelerating and offsetting the effects of emission reductions on declining PM2.5 trends in the northern and southern THB, respectively. The general spatial distribution of meteorological contribution rates regarding declining PM2.5 trends from the WRF-Chem simulation was consistent with the results using the KZ filter (Figs. 9 and 10), validating these results and confirming that meteorological drivers exerted a contrary impact between the northern positive and southern negative contributions to long-term changes of PM2.5 concentrations in the THB.
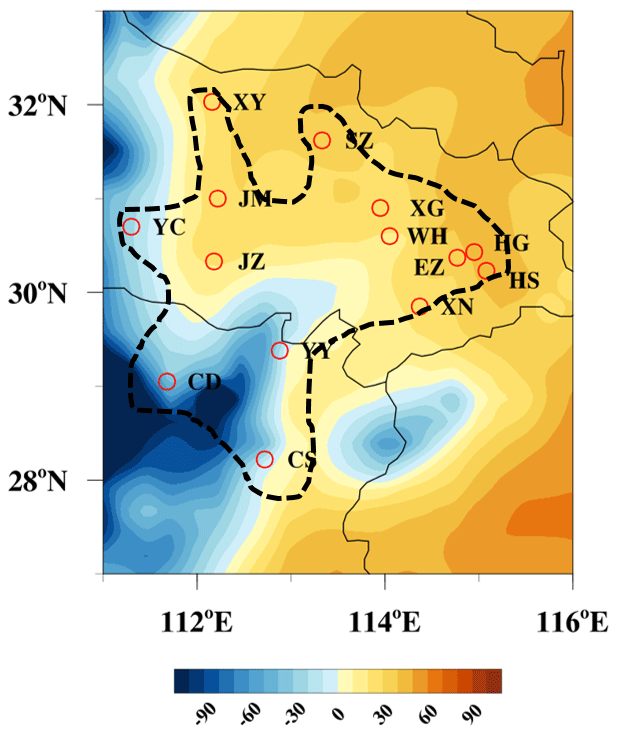
Figure 10Spatial distribution of contribution rates of meteorological variations regarding PM2.5 reductions based on WRF-Chem modeling experiments (contour, unit: %) in the THB outlined with black dashed line and surrounding regions for December of 2015–2019.
The meteorological effect on multi-scale changes of the atmospheric environment has been rarely assessed for the receptor region in the regional transport of air pollutants. In this study of observations and modeling, we targeted the THB, a large region of heavy PM2.5 pollution in central China, to assess the effects of meteorology on PM2.5 changes over a receptor region in the regional transport of air pollutants during recent years. The study results provide insights into the effects of emission mitigation and meteorological changes on the source–receptor relationship of the long-range transport of air pollutants for regional and global environment changes.
This study decomposed the observed PM2.5 concentrations into multiple timescale components with a modified KZ filter to better understand the PM2.5 variations, with the short-term, seasonal and long-term components accounting for, respectively, 47.5 %, 41.4 % and 3.7 % of observed PM2.5 changes. The short-term and seasonal PM2.5 components dominated the daily PM2.5 changes and long-term component determined the trend of PM2.5 change over recent years. The long-term components of PM2.5, SO2 and NO2 were further isolated into emission- and meteorology-related long-term components with multiple linear regressions in order to determine the contributions of emission and meteorology to PM2.5 decline in the THB over 2015–2019. The reduction in anthropogenic emissions was the primary cause of the long-term decline in PM2.5 concentrations, and the meteorological changes moderated the PM2.5 variations in the THB. As the receptor region of regional PM2.5 transport, the impact of diverse meteorological conditions on long-term trend of PM2.5 changes displayed a unique regional pattern of northern positive rates up to 61.92 % and southern negative rates down to −24.93 %. The change of meteorological conditions could accelerate and offset the effects of the emission reductions on declining PM2.5 trends in the northern and southern THB, which can be attributed to the upwind diffusing and downward accumulating roles of regional transport pathways in air pollutants in the THB. In terms of gaseous precursor emissions, the increasing conversion efficiency of SO2 and NO2 to sulfate and nitrate for secondary PM2.5 could have offset the role of emission reduction in controlling air pollution, and the contribution of gaseous precursors to secondary PM2.5 was enhanced with the reducing anthropogenic emissions of air pollutants over this receptor region.
This study revealed the impact of anthropogenic emissions and meteorological conditions on PM2.5 decline over a receptor region in the regional transport of air pollutants in central China. The effect of regional transport on PM2.5 pollution over receptor regions is found to differ from that over source regions with high anthropogenic emissions. We considered the uncertainties induced by statistical methods as systematic biases and explained the offsetting effect of enhancing oxidation of gaseous precursors to secondary particles on PM2.5 decline during stringent emission controls. The changes in data coverage and meteorological parameter selection largely influence the quantitative estimation of the contributions of meteorology and emissions. Further work should be undertaken regarding climate analysis of the long-term data of fine meteorological and environmental observations and more comprehensive modeling of chemical and physical processes in the atmosphere to generalize the assessment of the effects of emission mitigation and meteorological changes on the source–receptor relationship of the regional transport of air pollutants.
Data used in this paper can be provided upon request from Xiaoyun Sun (sunxy6362@126.com) or Tianliang Zhao (tlzhao@nuist.edu.cn).
The supplement related to this article is available online at: https://doi.org/10.5194/acp-22-3579-2022-supplement.
TZ and XS conceived the study. YB provided the observation data and analysis. XS designed the graphics and wrote the manuscript with help from TZ, YB and SK. HZ, WH, XM and JX were involved in the scientific discussion. All authors commented on the paper.
The contact author has declared that neither they nor their co-authors have any competing interests.
Publisher’s note: Copernicus Publications remains neutral with regard to jurisdictional claims in published maps and institutional affiliations.
This research was financially funded by grants from National Natural Science Foundation of China (grant nos. 41830965, 42075186 and 91744209) and the National Key R & D Program Pilot Projects of China (grant no. 2016YFC0203304).
This research has been supported by the National Natural Science Foundation of China (grant nos. 41830965, 42075186 and 91744209) and the National Key Research and Development Program of China (grant no. 2016YFC0203304).
This paper was edited by Leiming Zhang and reviewed by three anonymous referees.
Bai, Y., Zhao, T., Hu, W., Zhou, Y., Xiong, J., Wang, Y., Liu, L., Shen, L., Kong, S., Meng, K., and Zheng, H.: Meteorological mechanism of regional PM2.5 transport building a receptor region for heavy air pollution over Central China, Sci. Total Environ., 808, 151951, https://doi.org/10.1016/j.scitotenv.2021.151951, 2022.
Cao, J. J., Wang, Q. Y., Chow, J. C., Watson, J. G., Tie, X. X., Shen, Z. X., Wang, P., and An, Z. S.: Impacts of aerosol compositions on visibility impairment in Xi'an, China, Atmos. Environ., 59, 559–566, 2012.
Chen, L., Zhu, J., Liao, H., Yang, Y., and Yue, X.: Meteorological influences on PM2.5 and O3 trends and associated health burden since China's clean air actions, Sci. Total Environ., 744, 140837, https://doi.org/10.1016/j.scitotenv.2020.140837, 2020.
Chen, Z., Chen, D., Kwan, M.-P., Chen, B., Gao, B., Zhuang, Y., Li, R., and Xu, B.: The control of anthropogenic emissions contributed to 80 % of the decrease in PM2.5 concentrations in Beijing from 2013 to 2017, Atmos. Chem. Phys., 19, 13519–13533, https://doi.org/10.5194/acp-19-13519-2019, 2019.
Chen, Z. Y., Chen, D. L., Zhao, C. F., Kwan, M.-P., Cai, J., Zhuang, Y., Zhao, B., Wang, X. Y., Chen, B., and Yang, J.: Influence of meteorological conditions on PM2.5 concentrations across China: A review of methodology and mechanism, Environ. Int., 139, 105558, https://doi.org/10.1016/j.envint.2020.105558, 2020.
Crouse, D. L., Peters, P. A., van Donkelaar, A., Goldberg, M. S., Villeneuve, P. J., Brion, O., Khan, S., Atari, D. O., Jerrett, M., and Pope III, C. A.: Risk of nonaccidental and cardiovascular mortality in relation to long-term exposure to low concentrations of fine particulate matter: a Canadian national-level cohort study, Environ. Health Persp., 120, 708–714, 2012.
Draper, N. R.: Applied regression analysis, Technometrics, 9, 182–183, 1998.
Du, X., Shi, G., Zhao, T., Yang, F., Zheng, X., Zhang, Y., and Tan, Q.: Contribution of secondary particles to wintertime PM2.5 during 2015–2018 in a major urban area of the Sichuan Basin, Southwest China, Earth and Space Science, 7, e2020EA001194, https://doi.org/10.1029/2020EA001194, 2020.
Eskridge, R. E., Ku, J. Y., Rao, S. T., Porter, P. S., and Zurbenko, I. G.: Separating different scales of motion in time series of meteorological variables, B. Am. Meteorol. Soc., 78, 1473–1484, 1997.
Gong, S., Liu, H., Zhang, B., He, J., Zhang, H., Wang, Y., Wang, S., Zhang, L., and Wang, J.: Assessment of meteorology vs. control measures in the China fine particular matter trend from 2013 to 2019 by an environmental meteorology index, Atmos. Chem. Phys., 21, 2999–3013, https://doi.org/10.5194/acp-21-2999-2021, 2021.
Gui, K., Che, H. Z., Wang, Y. Q., Wang, H., Zhang, L., Zhao, H. J., Zheng, Y., Sun, T. Z., and Zhang, X. Y.: Satellite-derived PM2.5 concentration trends over Eastern China from 1998 to 2016: Relationships to emissions and meteorological parameters, Environ. Pollut., 247, 1125–1133, 2019.
Guo, H., Cheng, T. H., Gu, X. F., Wang, Y., Chen, H., Bao, F. W., Shi, S. Y., Xu, B. R., Wang, W. N., Zuo, X., Zhang, X. C., and Meng, C.: Assessment of PM2.5 concentrations and exposure throughout China using ground observations, Sci. Total Environ., 601–602, 1024–1030, https://doi.org/10.1016/j.scitotenv.2017.05.263, 2017.
Hsu, C.-H. and Cheng, F.-Y.: Classification of weather patterns to study the influence of meteorological characteristics on PM2.5 concentrations in Yunlin County, Taiwan, Atmos. Environ., 144, 397–408, 2016.
Hu, W. Y., Zhao, T. L., Bai, Y. Q., Shen, L. J., Sun, X. Y., and Gu, Y.: Contribution of regional PM2.5 transport to air pollution enhanced by sub-basin topography: A modeling case over central China, Atmosphere, 11, 1258, https://doi.org/10.3390/atmos11111258, 2020.
Hu, W. Y., Zhao, T. L., Bai, Y. Q., Kong, S. F., Xiong, J., Sun, X. Y., Yang, Q. J., Gu, Y., and Lu, H. C.: Importance of regional PM2.5 transport and precipitation washout in heavy air pollution in the Twain-Hu Basin over Central China: Observational analysis and WRF-Chem simulation, Sci. Total Environ., 758, 143710, https://doi.org/10.1016/j.scitotenv.2020.143710, 2021.
Huang, X., Ding, A., Gao, J., Zheng, B., Zhou, D., Qi, X., Tang, R., Wang, J., Ren, C., and Nie, W.: Enhanced secondary pollution offset reduction of primary emissions during COVID-19 lockdown in China, Natl. Sci. Rev., 8, nwaa137, https://doi.org/10.1093/nsr/nwaa137, 2021.
Jeong, J. I. and Park, R. J.: Winter monsoon variability and its impact on aerosol concentrations in East Asia, Environ. Pollut., 221, 285–292, https://doi.org/10.1016/j.envpol.2016.11.075, 2017.
Kim, Y. M., Seo, J. H., Kim, J. Y., Lee, J. Y., Kim, H. J., and Kim, B. M.: Characterization of PM2.5 and identification of transported secondary and biomass burning contribution in Seoul, Korea, Environ. Sci. Pollut. R., 25, 4330–4343, 2018.
Li, G., Zavala, M., Lei, W., Tsimpidi, A. P., Karydis, V. A., Pandis, S. N., Canagaratna, M. R., and Molina, L. T.: Simulations of organic aerosol concentrations in Mexico City using the WRF-CHEM model during the MCMA-2006/MILAGRO campaign, Atmos. Chem. Phys., 11, 3789–3809, https://doi.org/10.5194/acp-11-3789-2011, 2011.
Li, K., Liao, H., Cai, W. J., and Yang, Y.: Attribution of anthropogenic influence on atmospheric patterns conducive to recent most severe haze over eastern China, Geophys. Res. Lett., 45, 2072–2081, 2018.
Li, S., Ren, A. L., Guo, B., Du, Z., Zhang, S., Tian, M., and Wang, S. S.: Influence of Meteorological Factors and VOCs on PM2.5 during Severe Air Pollution Period in Shijiazhuang in Winter, 2015, 2nd International Conference on Machinery, Materials Engineering, Chemical Engineering and Biotechnology, Chongqing, China, 28–29 November 2015, 588–592, https://doi.org/10.2991/mmeceb-15.2016.116, 2015.
Li, X., Zhang, Q., Zhang, Y., Zheng, B., Wang, K., Chen, Y., Wallington, T. J., Han, W. J., Shen, W., and Zhang, X. Y.: Source contributions of urban PM2.5 in the Beijing – Tianjin – Hebei region: Changes between 2006 and 2013 and relative impacts of emissions and meteorology, Atmos. Environ., 123, 229–239, 2015.
Lin, C. Q., Liu, G. H., Lau, A. K. H., Li, Y., Li, C. C., Fung, J. C. H., and Lao, X. Q.: High-resolution satellite remote sensing of provincial PM2.5 trends in China from 2001 to 2015, Atmos. Environ., 180, 110–116, 2018.
Lin, Y., Zou, J., Yang, W., and Li, C.-Q.: A review of recent advances in research on PM2.5 in China, Int. J. Env. Res. Pub. He., 15, 438, https://doi.org/10.3390/ijerph15030438, 2018.
Lu, M. M., Tang, X., Wang, Z. F., Gbaguidi, A., Liang, S. W., Hu, K., Wu, L., Wu, H. J., Huang, Z., and Shen, L. J.: Source tagging modeling study of heavy haze episodes under complex regional transport processes over Wuhan megacity, Central China, Environ. Pollut., 231, 612–621, 2017.
Ma, Z., Xu, J., Quan, W., Zhang, Z., Lin, W., and Xu, X.: Significant increase of surface ozone at a rural site, north of eastern China, Atmos. Chem. Phys., 16, 3969–3977, https://doi.org/10.5194/acp-16-3969-2016, 2016.
Miao, Y. C., Hu, X. M., Liu, S. H., Qian, T. T., Xue, M., Zheng, Y. J., and Wang, S.: Seasonal variation of local atmospheric circulations and boundary layer structure in the Beijing-Tianjin-Hebei region and implications for air quality, J. Adv. Model. Earth Sy., 7, 1602–1626, 2015.
Miao, Y., Guo, J., Liu, S., Liu, H., Li, Z., Zhang, W., and Zhai, P.: Classification of summertime synoptic patterns in Beijing and their associations with boundary layer structure affecting aerosol pollution, Atmos. Chem. Phys., 17, 3097–3110, https://doi.org/10.5194/acp-17-3097-2017, 2017.
Mueller, S. F. and Mallard, J. W.: Contributions of natural emissions to ozone and PM2.5 as simulated by the community multiscale air quality (CMAQ) model, Environ. Sci. Technol., 45, 4817–4823, 2011.
Ning, G. C., Yim, S. H. L., Wang, S. G., Duan, B. L., Nie, C. Q., Yang, X., Wang, J. Y., and Shang, K. Z.: Synergistic effects of synoptic weather patterns and topography on air quality: a case of the Sichuan Basin of China, Clim. Dynam., 53, 6729–6744, 2019.
Pearce, J. L., Beringer, J., Nicholls, N., Hyndman, R. J., and Tapper, N. J.: Quantifying the influence of local meteorology on air quality using generalized additive models, Atmos. Environ., 45, 1328–1336, 2011.
Peng, J., Chen, S., Lü, H. L., Liu, Y. X., and Wu, J. S.: Spatiotemporal patterns of remotely sensed PM2.5 concentration in China from 1999 to 2011, Remote Sens. Environ., 174, 109–121, 2016.
Rao, S. T. and Zurbenko, I. G.: Detecting and tracking changes in ozone air quality, Air & Waste, 44, 1089–1092, 1994.
Russell, A. R., Valin, L. C., Bucsela, E. J., Wenig, M. O., and Cohen, R. C.: Space-based constraints on spatial and temporal patterns of NOx emissions in California, 2005–2008, Environ. Sci. Technol., 44, 3608–3615, 2010.
Seo, J., Youn, D., Kim, J. Y., and Lee, H.: Extensive spatiotemporal analyses of surface ozone and related meteorological variables in South Korea for the period 1999–2010, Atmos. Chem. Phys., 14, 6395–6415, https://doi.org/10.5194/acp-14-6395-2014, 2014.
Seo, J., Kim, J. Y., Youn, D., Lee, J. Y., Kim, H., Lim, Y. B., Kim, Y., and Jin, H. C.: On the multiday haze in the Asian continental outflow: the important role of synoptic conditions combined with regional and local sources, Atmos. Chem. Phys., 17, 9311–9332, https://doi.org/10.5194/acp-17-9311-2017, 2017.
Seo, J., Park, D.-S. R., Kim, J. Y., Youn, D., Lim, Y. B., and Kim, Y.: Effects of meteorology and emissions on urban air quality: a quantitative statistical approach to long-term records (1999–2016) in Seoul, South Korea, Atmos. Chem. Phys., 18, 16121–16137, https://doi.org/10.5194/acp-18-16121-2018, 2018.
Shen, L. J., Wang, H. L., Zhao, T. L., Liu, J., Bai, Y. Q., Kong, S. F., and Shu, Z. Z.: Characterizing regional aerosol pollution in central China based on 19 years of MODIS data: Spatiotemporal variation and aerosol type discrimination, Environ. Pollut., 263, 114556, https://doi.org/10.1016/j.envpol.2020.114556, 2020.
Sun, Y., Song, T., Tang, G. Q., and Wang, Y. S.: The vertical distribution of PM2.5 and boundary-layer structure during summer haze in Beijing, Atmos. Environ., 74, 413–421, 2013.
Tang, G., Zhang, J., Zhu, X., Song, T., Münkel, C., Hu, B., Schäfer, K., Liu, Z., Zhang, J., Wang, L., Xin, J., Suppan, P., and Wang, Y.: Mixing layer height and its implications for air pollution over Beijing, China, Atmos. Chem. Phys., 16, 2459–2475, https://doi.org/10.5194/acp-16-2459-2016, 2016.
Wang, P., Guo, H., Hu, J., Kota, S. H., Ying, Q., and Zhang, H.: Responses of PM2.5 and O3 concentrations to changes of meteorology and emissions in China, Sci. Total Environ., 662, 297–306, https://doi.org/10.1016/j.scitotenv.2019.01.227, 2019.
Wang, X. Y., Wang, K. C., and Su, L. Y.: Contribution of atmospheric diffusion conditions to the recent improvement in air quality in China, Sci. Rep., 6, 1–11, 2016.
Wang, Y., Di Sabatino, S., Martilli, A., Li, Y., Wong, M. S., Gutiérrez, E., and Chan, P. W.: Impact of land surface heterogeneity on urban heat island circulation and sea-land breeze circulation in Hong Kong, J. Geophys. Res.-Atmos., 122, 4332–4352, https://doi.org/10.1002/2017jd026702, 2017.
Xiao, Q., Zheng, Y., Geng, G., Chen, C., Huang, X., Che, H., Zhang, X., He, K., and Zhang, Q.: Separating emission and meteorological contributions to long-term PM2.5 trends over eastern China during 2000–2018, Atmos. Chem. Phys., 21, 9475–9496, https://doi.org/10.5194/acp-21-9475-2021, 2021.
Xu, Y., Xue, W., Lei, Y., Huang, Q., Zhao, Y., Cheng, S., Ren, Z., and Wang, J.: Spatiotemporal variation in the impact of meteorological conditions on PM2.5 pollution in China from 2000 to 2017, Atmos. Environ., 223, 117215, https://doi.org/10.1016/j.atmosenv.2019.117215, 2020.
Xue, T., Liu, J., Zhang, Q., Geng, G. N., Zheng, Y. X., Tong, D., Liu, Z., Guan, D. B., Bo, Y., and Zhu, T.: Rapid improvement of PM2.5 pollution and associated health benefits in China during 2013–2017, Science China Earth Sciences, 62, 1847–1856, 2019.
Yang, H., Chen, J., Wen, J., Tian, H., and Liu, X.: Composition and sources of PM2.5 around the heating periods of 2013 and 2014 in Beijing: Implications for efficient mitigation measures, Atmos. Environ., 124, 378–386, https://doi.org/10.1016/j.atmosenv.2015.05.015, 2016.
Yang, Y., Liao, H., and Lou, S.: Increase in winter haze over eastern China in recent decades: Roles of variations in meteorological parameters and anthropogenic emissions, J. Geophys. Res.-Atmos., 121, 13050–13065, https://doi.org/10.1002/2016jd025136, 2016.
Yin, C. Q., Deng, X. J., Zou, Y., Solmon, F., Li, F., and Deng, T.: Trend analysis of surface ozone at suburban Guangzhou, China, Sci. Total Environ., 695, 133880, https://doi.org/10.1016/j.scitotenv.2019.133880, 2019a.
Yin, C. Q., Deng, X. J., Zou, Y., Solmon, F., Li, F., and Deng, T.: Trend analysis of surface ozone at suburban Guangzhou, China, Sci. Total Environ., 695, 133880, https://doi.org/10.1016/j.scitotenv.2019.133880, 2019b.
Yu, C., Zhao, T., Bai, Y., Zhang, L., Kong, S., Yu, X., He, J., Cui, C., Yang, J., You, Y., Ma, G., Wu, M., and Chang, J.: Heavy air pollution with a unique “non-stagnant” atmospheric boundary layer in the Yangtze River middle basin aggravated by regional transport of PM2.5 over China, Atmos. Chem. Phys., 20, 7217–7230, https://doi.org/10.5194/acp-20-7217-2020, 2020.
Zhai, S., Jacob, D. J., Wang, X., Shen, L., Li, K., Zhang, Y., Gui, K., Zhao, T., and Liao, H.: Fine particulate matter (PM2.5) trends in China, 2013–2018: separating contributions from anthropogenic emissions and meteorology, Atmos. Chem. Phys., 19, 11031–11041, https://doi.org/10.5194/acp-19-11031-2019, 2019.
Zhai, S., Jacob, D. J., Wang, X., Liu, Z., Wen, T., Shah, V., Li, K., Moch, J. M., Bates, K. H., and Song, S.: Control of particulate nitrate air pollution in China, Nat. Geosci., 14, 389–395, 2021.
Zhang, W. J., Wang, H., Zhang, X. Y., Peng, Y., Zhong, J. T., Wang, Y. Q., and Zhao, Y. F.: Evaluating the contributions of changed meteorological conditions and emission to substantial reductions of PM2.5 concentration from winter 2016 to 2017 in Central and Eastern China, Sci. Total Environ., 716, 136892, https://doi.org/10.1016/j.scitotenv.2020.136892, 2020.
Zhang, X. Y., Wang, Y. Q., Niu, T., Zhang, X. C., Gong, S. L., Zhang, Y. M., and Sun, J. Y.: Atmospheric aerosol compositions in China: spatial/temporal variability, chemical signature, regional haze distribution and comparisons with global aerosols, Atmos. Chem. Phys., 12, 779–799, https://doi.org/10.5194/acp-12-779-2012, 2012.
Zhang, X. Y., Xu, X. D., Ding, Y. H., Liu, Y. J., Zhang, H. D., Wang, Y. Q., and Zhong, J. T.: The impact of meteorological changes from 2013 to 2017 on PM2.5 mass reduction in key regions in China, Science China Earth Sciences, 62, 1885–1902, 2019.
Zhang, Z., Ma, Z., and Kim, S.: Significant decrease of PM2.5 in Beijing based on long-term records and Kolmogorov-Zurbenko filter approach, Aerosol Air Qual. Res., 18, 711–718, 2018.
Zheng, B., Tong, D., Li, M., Liu, F., Hong, C., Geng, G., Li, H., Li, X., Peng, L., Qi, J., Yan, L., Zhang, Y., Zhao, H., Zheng, Y., He, K., and Zhang, Q.: Trends in China's anthropogenic emissions since 2010 as the consequence of clean air actions, Atmos. Chem. Phys., 18, 14095–14111, https://doi.org/10.5194/acp-18-14095-2018, 2018
Zheng, H., Kong, S. F., Zheng, M. M., Yan, Y. Y., Yao, L. Q., Zheng, S. R., Yan, Q., Wu, J., Cheng, Y., and Chen, N.: A 5.5 year observations of black carbon aerosol at a megacity in Central China: Levels, sources, and variation trends, Atmos. Environ., 232, 117581, https://doi.org/10.1016/j.atmosenv.2020.117581, 2020.
Zhong, J., Zhang, X., Wang, Y., Wang, J., Shen, X., Zhang, H., Wang, T., Xie, Z., Liu, C., Zhang, H., Zhao, T., Sun, J., Fan, S., Gao, Z., Li, Y., and Wang, L.: The two-way feedback mechanism between unfavorable meteorological conditions and cumulative aerosol pollution in various haze regions of China, Atmos. Chem. Phys., 19, 3287–3306, https://doi.org/10.5194/acp-19-3287-2019, 2019.
Zhu, J. L., Liao, H., and Li, J. P.: Increases in aerosol concentrations over eastern China due to the decadal-scale weakening of the East Asian summer monsoon, Geophys. Res. Lett., 39, L09809, https://doi.org/10.1029/2012GL051428, 2012.