the Creative Commons Attribution 4.0 License.
the Creative Commons Attribution 4.0 License.
 | 17 Mar 2022
Quantification of the dust optical depth across spatiotemporal scales with the MIDAS global dataset (2003–2017)
Emmanouil Proestakis
Vassilis Amiridis
Stelios Kazadzis
Enza Di Tomaso
Eleni Marinou
Nikos Hatzianastassiou
Jasper F. Kok
Carlos Pérez García-Pando
Quantifying the dust optical depth (DOD) and its uncertainty across spatiotemporal scales is key to understanding and constraining the dust cycle and its interactions with the Earth System. This study quantifies the DOD along with its monthly and year-to-year variability between 2003 and 2017 at global and regional levels based on the MIDAS (ModIs Dust AeroSol) dataset, which combines Moderate Resolution Imaging Spectroradiometer (MODIS)-Aqua retrievals and Modern-Era Retrospective Analysis for Research and Applications, version 2 (MERRA-2), reanalysis products. We also describe the annual and seasonal geographical distributions of DOD across the main dust source regions and transport pathways. MIDAS provides columnar mid-visible (550 nm) DOD at fine spatial resolution (), expanding the current observational capabilities for monitoring the highly variable spatiotemporal features of the dust burden. We obtain a global DOD of 0.032±0.003 – approximately a quarter (23.4 %±2.4 %) of the global aerosol optical depth (AOD) – with about 1 order of magnitude more DOD in the Northern Hemisphere (0.056±0.004; 31.8 %±2.7 %) than in the Southern Hemisphere (0.008±0.001; 8.2 %±1.1 %) and about 3.5 times more DOD over land (0.070±0.005) than over ocean (0.019±0.002). The Northern Hemisphere monthly DOD is highly correlated with the corresponding monthly AOD (R2=0.94) and contributes 20 % to 48 % of it, both indicating a dominant dust contribution. In contrast, the contribution of dust to the monthly AOD does not exceed 17 % in the Southern Hemisphere, although the uncertainty in this region is larger. Among the major dust sources of the planet, the maximum DODs (∼1.2) are recorded in the Bodélé Depression of the northern Lake Chad Basin, whereas moderate-to-high intensities are encountered in the Western Sahara (boreal summer), along the eastern parts of the Middle East (boreal summer) and in the Taklamakan Desert (spring). Over oceans, major long-range dust transport is observed primarily along the tropical Atlantic (intensified during boreal summer) and secondarily in the North Pacific (intensified during boreal spring). Our calculated global and regional averages and associated uncertainties are consistent with some but not all recent observation-based studies. Our work provides a simple yet flexible method to estimate consistent uncertainties across spatiotemporal scales, which will enhance the use of the MIDAS dataset in a variety of future studies.
- Article
(22818 KB) - Full-text XML
-
Supplement
(3270 KB) - BibTeX
- EndNote


Mineral dust particles are emitted throughout the year across the arid and semi-arid regions of the planet, when winds exceed a threshold velocity mainly determined by soil texture, soil moisture and surface roughness. While dust aerosols have mainly a natural origin, the contribution of anthropogenic land use is estimated to be between 10 % and 25 % (Tegen et al., 2004; Stanelle et al., 2014; Ginoux et al., 2012). Dust is mobilized by microscale- to synoptic-scale phenomena, from dust devils developed under strong surface heating (Koch and Renno, 2005) to haboobs formed by intense cold-pool downdrafts related to deep moist convection (Knippertz et al., 2007) to synoptic patterns associated with intensified pressure gradients (Klose et al., 2010) and low-level jets (LLJs; Fiedler et al., 2013). Meteorology also plays a key role in the dust transport over maritime areas taking place mainly across the tropical Atlantic Ocean (Prospero and Mayol-Bracero, 2013; Yu et al., 2015), the northern Pacific Ocean (Husar et al., 2001), the Mediterranean (Flaounas et al., 2015; Gkikas et al., 2015), the Arabian Sea (Ramaswamy et al., 2017) and the southern Atlantic Ocean (Gassó and Stein, 2007). Dust perturbs the radiation budget through direct (Sokolik and Toon, 1996), semi-direct (Huang et al., 2006) and indirect (Haywood and Bucher, 2000) processes, leading to impacts upon weather (Pérez et al., 2006; Gkikas et al., 2018, 2019) and climate (Lambert et al., 2013; Nabat et al., 2015). Upon deposition, nutrient-rich dust particles can increase the productivity of oceanic waters (Jickells et al., 2005) and terrestrial ecosystems (Okin et al., 2004) and perturb the carbon cycle (Jickells et al., 2014). Dust has been associated with epidemics of meningococcal meningitis in the African Sahel (Pérez García-Pando et al., 2014a, b) and with air quality degradation in urban areas (Kanakidou et al., 2011) causing respiratory (Kanatani et al., 2010) and cardiovascular (Du et al., 2016) disease when the population is exposed to high dust concentrations (Querol et al., 2019). Other socio-economic sectors can be regionally affected by dust storms (Middleton, 2017), including transportation (Weinzierl et al., 2012), agriculture (Stefanski and Sivakumar, 2009) and solar energy production (Kosmopoulos et al., 2018).
Satellite measurements and numerical simulations have repeatedly shown the remarkable contrast in dust load between the two hemispheres. The substantially higher dust load in the Northern Hemisphere is associated with the wider deserts extending across the so-called dust belt (Prospero et al., 2002; Ginoux et al., 2012), in contrast to the smaller sources in Australia, South Africa and South America. At a global scale, most of the entrained dust loads in the atmosphere originate from tropical and sub-tropical arid regions; yet, it is estimated that up to 5 % of the global dust budget consists of particles emitted from high-latitude sources (Bullard and Austin, 2011; Bullard et al., 2016). Given the key role of dust aerosols in the Earth system, it is imperative to monitor and understand the global dust cycle along with its multi-scale spatiotemporal variability over long time periods and fine spatial resolution. This task can be fulfilled to a certain degree using contemporary satellite instruments providing accurate retrievals and global coverage over extended time periods. With this approach, one of the key challenges is to discriminate dust from other aerosols. Several studies have combined AOD and aerosol index (AI) (e.g., Middleton and Goudie, 2001; Prospero et al., 2002) or AOD, single scattering albedo (SSA), and Ångström exponent (AE) (Ginoux et al., 2012) to identify the most active dust sources worldwide. Other studies have focused on the dust load and its variability in specific regions such as the Atlantic Ocean and the Arabian Sea (Peyridieu et al., 2013), the Sistan Basin (Rashki et al., 2015), the Mediterranean (Gkikas et al., 2016), Europe and North Africa (Marinou et al., 2017), and east Asia (Proestakis et al., 2018), among others. Liu et al. (2008) described the three-dimensional structure of dust aerosols at a global scale based on Cloud-Aerosol Lidar with Orthogonal Polarization (CALIOP) vertically resolved retrievals acquired during the first operational year of the Cloud-Aerosol Lidar and Infrared Pathfinder Satellite Observation (CALIPSO) satellite mission. A more advanced approach has been introduced by Amiridis et al. (2013) and Marinou et al. (2017), who applied a more realistic lidar ratio for the Saharan dust and a series of quality filters on the CALIOP vertical profiles, in order to provide information about the vertical structure of dust layers at a global scale and coarse resolution in the LIVAS dataset (Amiridis et al., 2015). Ridley et al. (2016) quantified the global average DOD and its uncertainty for the period 2004–2008 based on AOD retrievals from passive spaceborne sensors (Moderate Resolution Imaging Spectroradiometer, MODIS; Multi-angle Imaging SpectroRadiometer, MISR), ground-based (Aerosol Robotic Network, AERONET) and shipborne (Maritime Aerosol Network, MAN) measurements from sun-photometers, and numerical simulations. Voss and Evan (2020) provided a long-term DOD climatology over the tropics and mid-latitudes at a coarse spatial resolution () based on MODIS and Advanced Very-High-Resolution Radiometer (AVHRR) observations, where DOD was estimated based on AOD, SSA and AE over land following Ginoux et al. (2012) and AOD, fine and coarse AOD (AERONET) and MERRA-2 winds over ocean. Based on vertically resolved CALIOP retrievals and columnar MODIS optical properties, Song et al. (2021) provided a long-term 4D global dust optical depth dataset, excluding the polar regions, over the period 2007–2019. In their approach, they took advantage of spaceborne observations that can be used for the discrimination/identification of dust aerosols characterized by their aspherical shape, coarse size and absorption.
Our study provides a global and regional quantification and description of the DOD based on the new ModIs Dust AeroSol (MIDAS) dataset (Gkikas et al., 2021). The powerful and innovative elements of the MIDAS DOD dataset are the (i) daily availability and fine spatial resolution (), (ii) full global coverage including the sources and downwind areas (both over land and sea), (iii) 15-year temporal range (2003–2017) using the most updated MODIS data collection, and (iv) grid-cell-level uncertainty quantification. In this contribution, we first describe the annual and seasonal geographical distribution of DOD across the main dust source regions and transport pathways (Sect. 4.1). We then quantify the average DOD and its monthly and year-to-year variability at global, hemispherical and regional levels, along with its fractional contribution to the AOD (Sect. 4.2). We summarize the main findings in Sect. 5.
Our study is based on the MIDAS global fine-resolution dataset described in detail in Gkikas et al. (2021). We analyze the DOD at 550 nm and at spatial resolution between 2003 and 2017. The MIDAS DOD results from the combination of the quality-filtered MODIS aerosol optical depth (AOD, Collection 6.1, Level 2; Levy et al., 2013) and the MERRA-2 (Modern-Era Retrospective Analysis for Research and Applications, version 2; Gelaro et al., 2017) fraction of AOD that is due to dust (MERRA-2 dust fraction, MDF). In Gkikas et al. (2021), the MDF was evaluated against the dust fraction obtained from quality-assured dust and non-dust CALIOP (Cloud-Aerosol Lidar with Orthogonal Polarization; Winker et al., 2009) profiles, available from the LIVAS database (Amiridis et al., 2015; Marinou et al., 2017; Proestakis et al., 2018). The MDF compares well with the LIVAS dust fraction over the dust-abundant areas extending across the NH dust belt, with maximum underestimations of 10 % in Asian deserts. The agreement is more limited in North America and the Southern Hemisphere (Figs. 1 and 2 in Gkikas et al., 2021). Overall, the MIDAS DOD is well correlated with AERONET dust-dominant retrievals (R=0.89 at a global scale), and the absolute biases are mainly below 0.12 at stations near sources (Figs. 3 and 4 in Gkikas et al., 2021). The MIDAS DOD dataset was further verified against the LIVAS DOD and compared with MERRA-2 DODs (Fig. 5 in Gkikas et al., 2021). Among the three datasets, there is good agreement on the monthly variability of the global and hemispherical DODs as well as on their long-term averages (Fig. 6 and Table 1 in Gkikas et al., 2021). Moreover, the annual and seasonal DOD patterns are broadly similar in the three datasets throughout the period 2007–2015. Nevertheless, regional differences are found due to the different techniques (passive and active remote sensing, numerical simulations) applied for the DOD derivation.
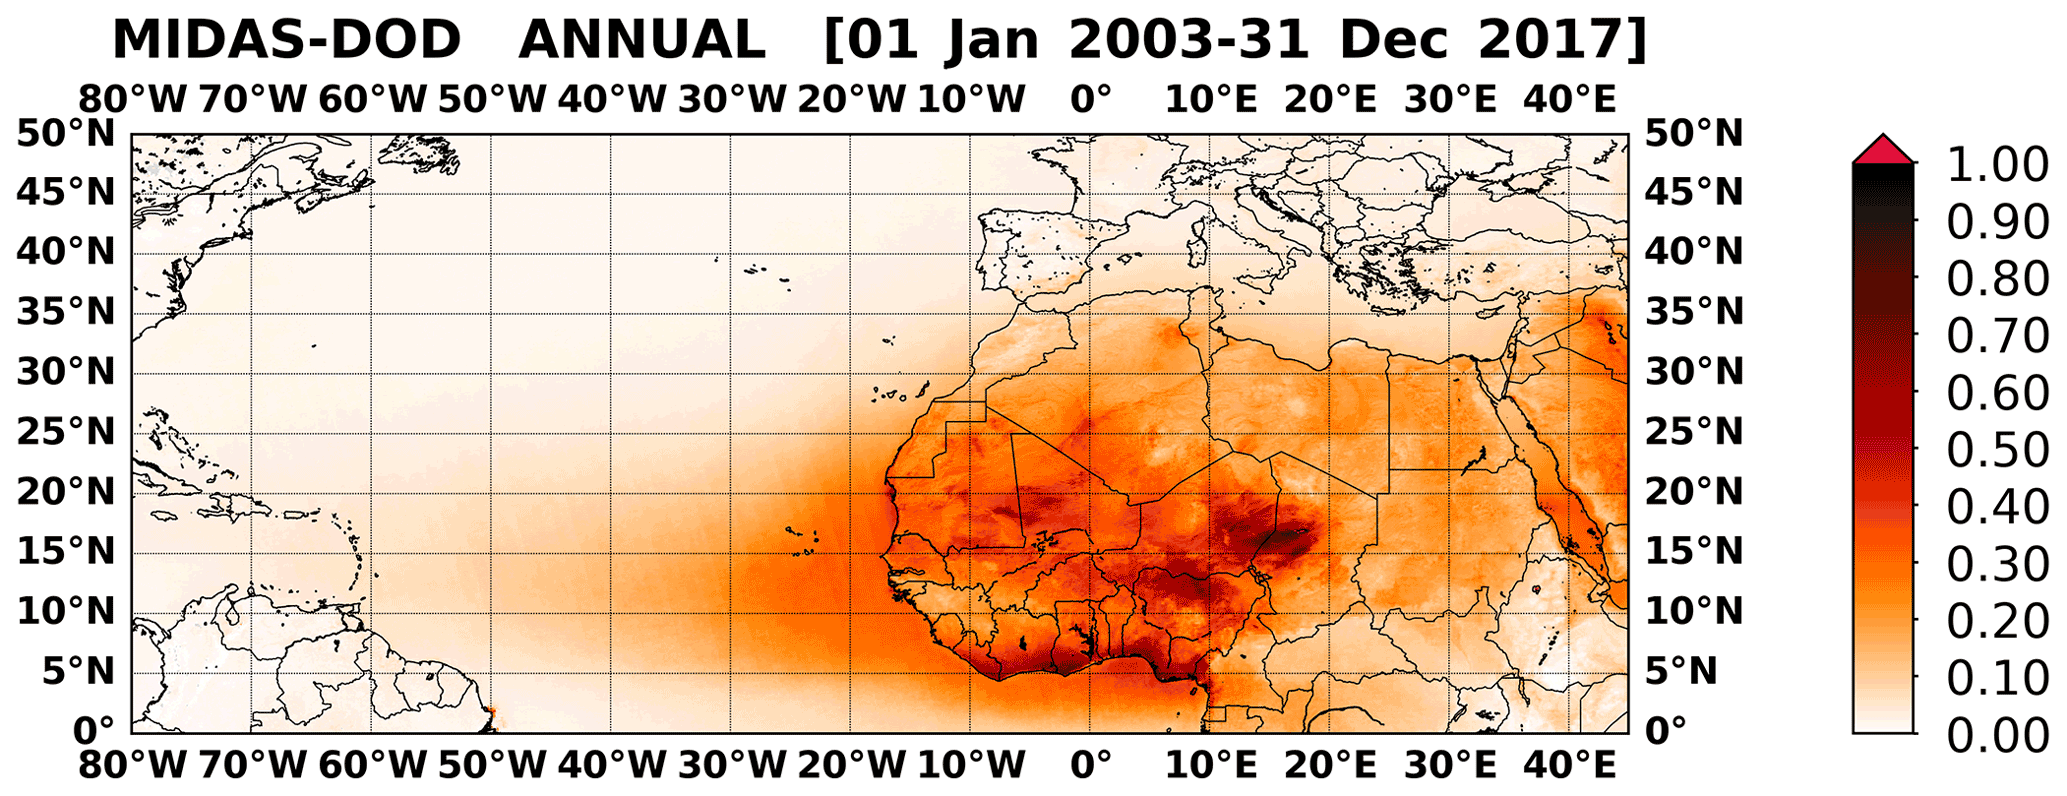
Figure 1Geographical distribution of the MIDAS annual DOD at 550 nm, representative for the period 1 January 2003–31 December 2017, over North Africa, the tropical Atlantic Ocean and the broader Mediterranean Basin.

Figure 2As in Fig. 1 but for the broader area of the Middle East.
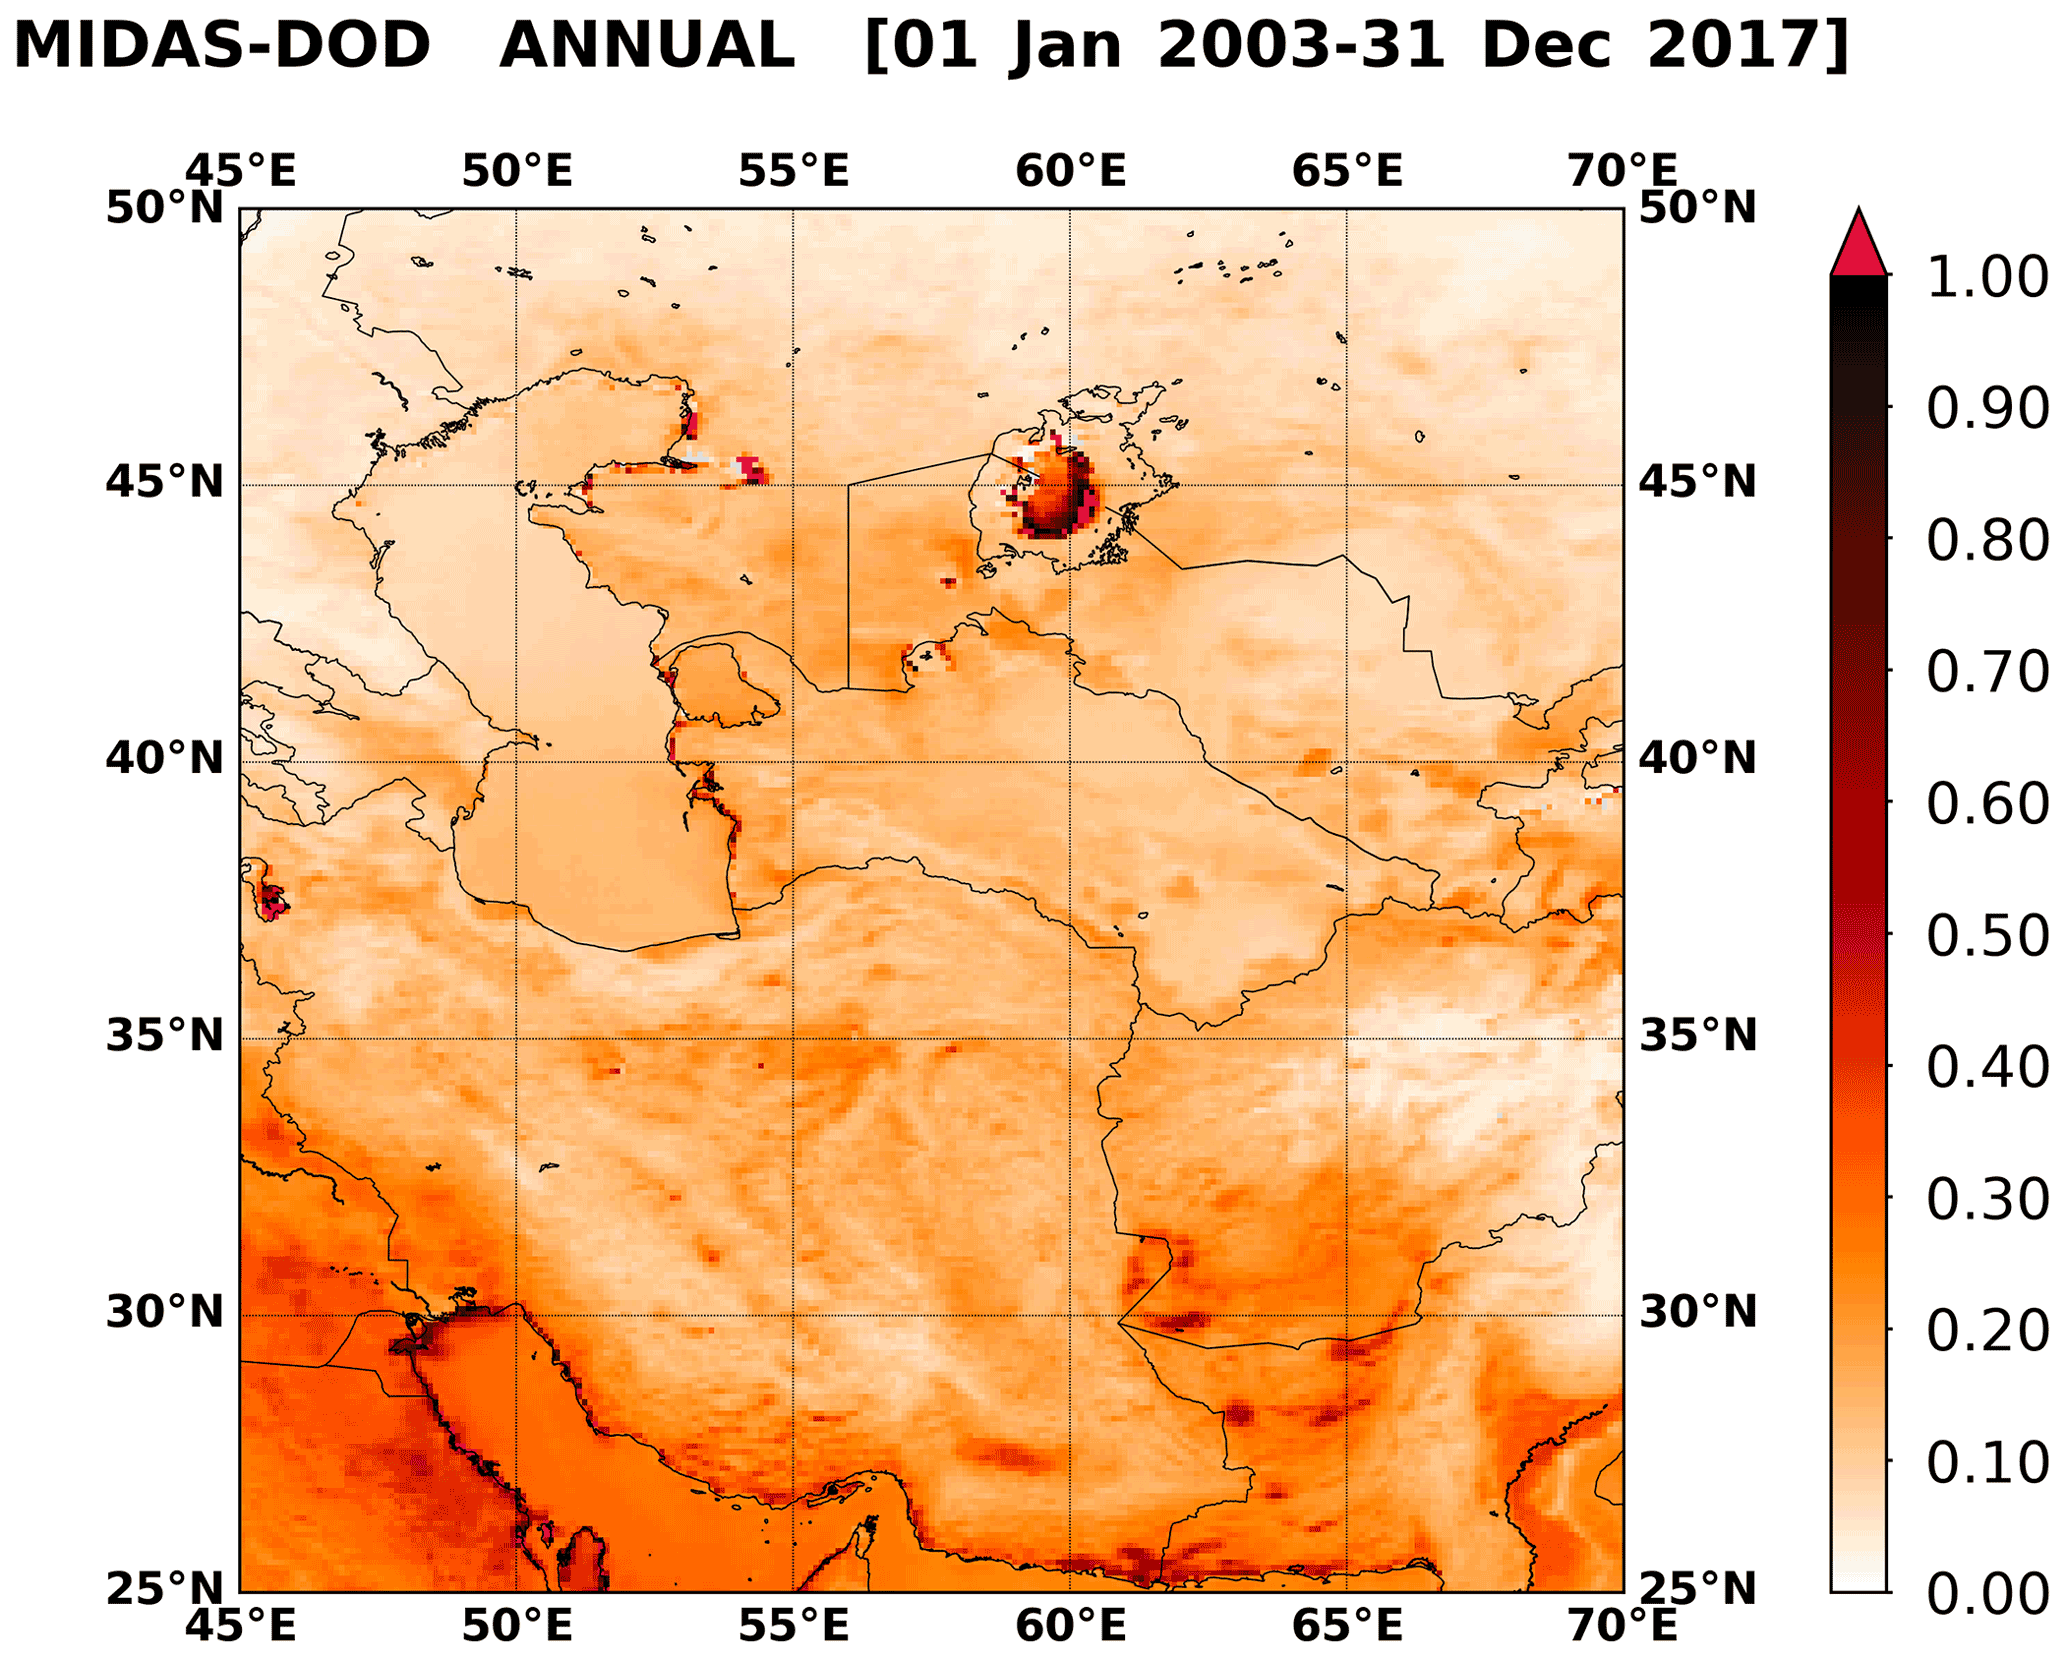
Figure 3As in Fig. 1 but for central and southwestern Asia.
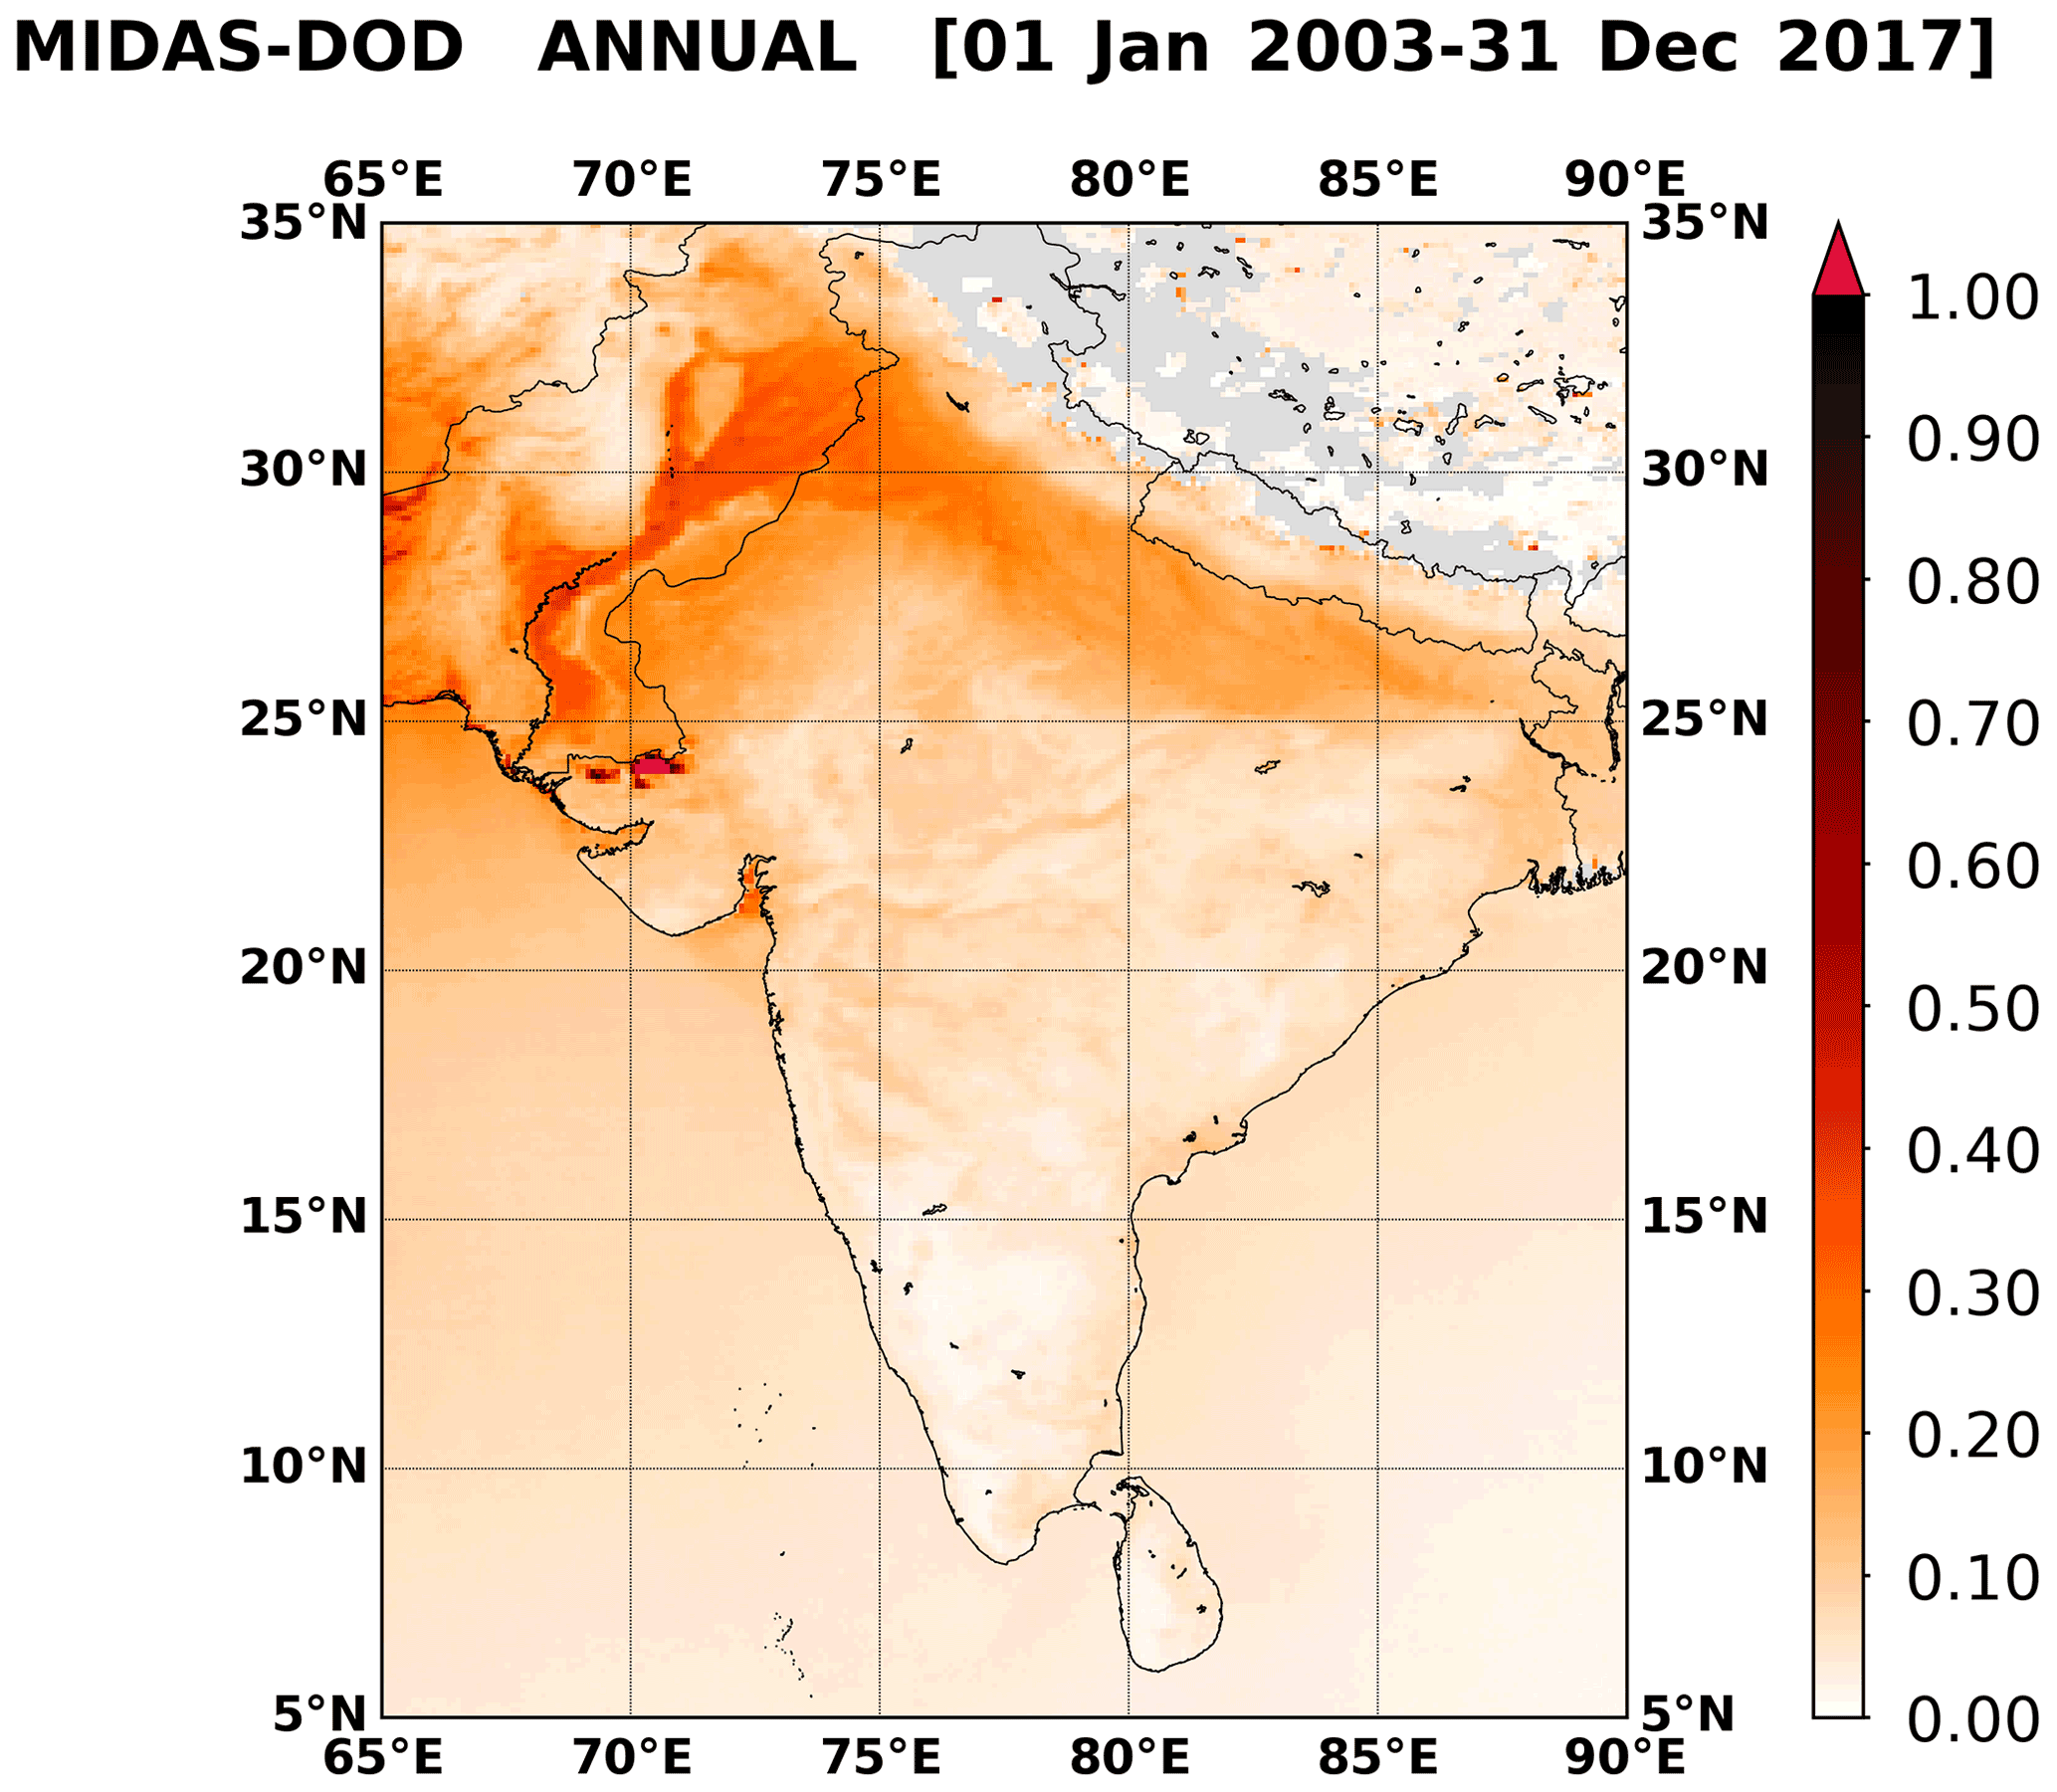
Figure 4As in Fig. 1 but for the Indian subcontinent.
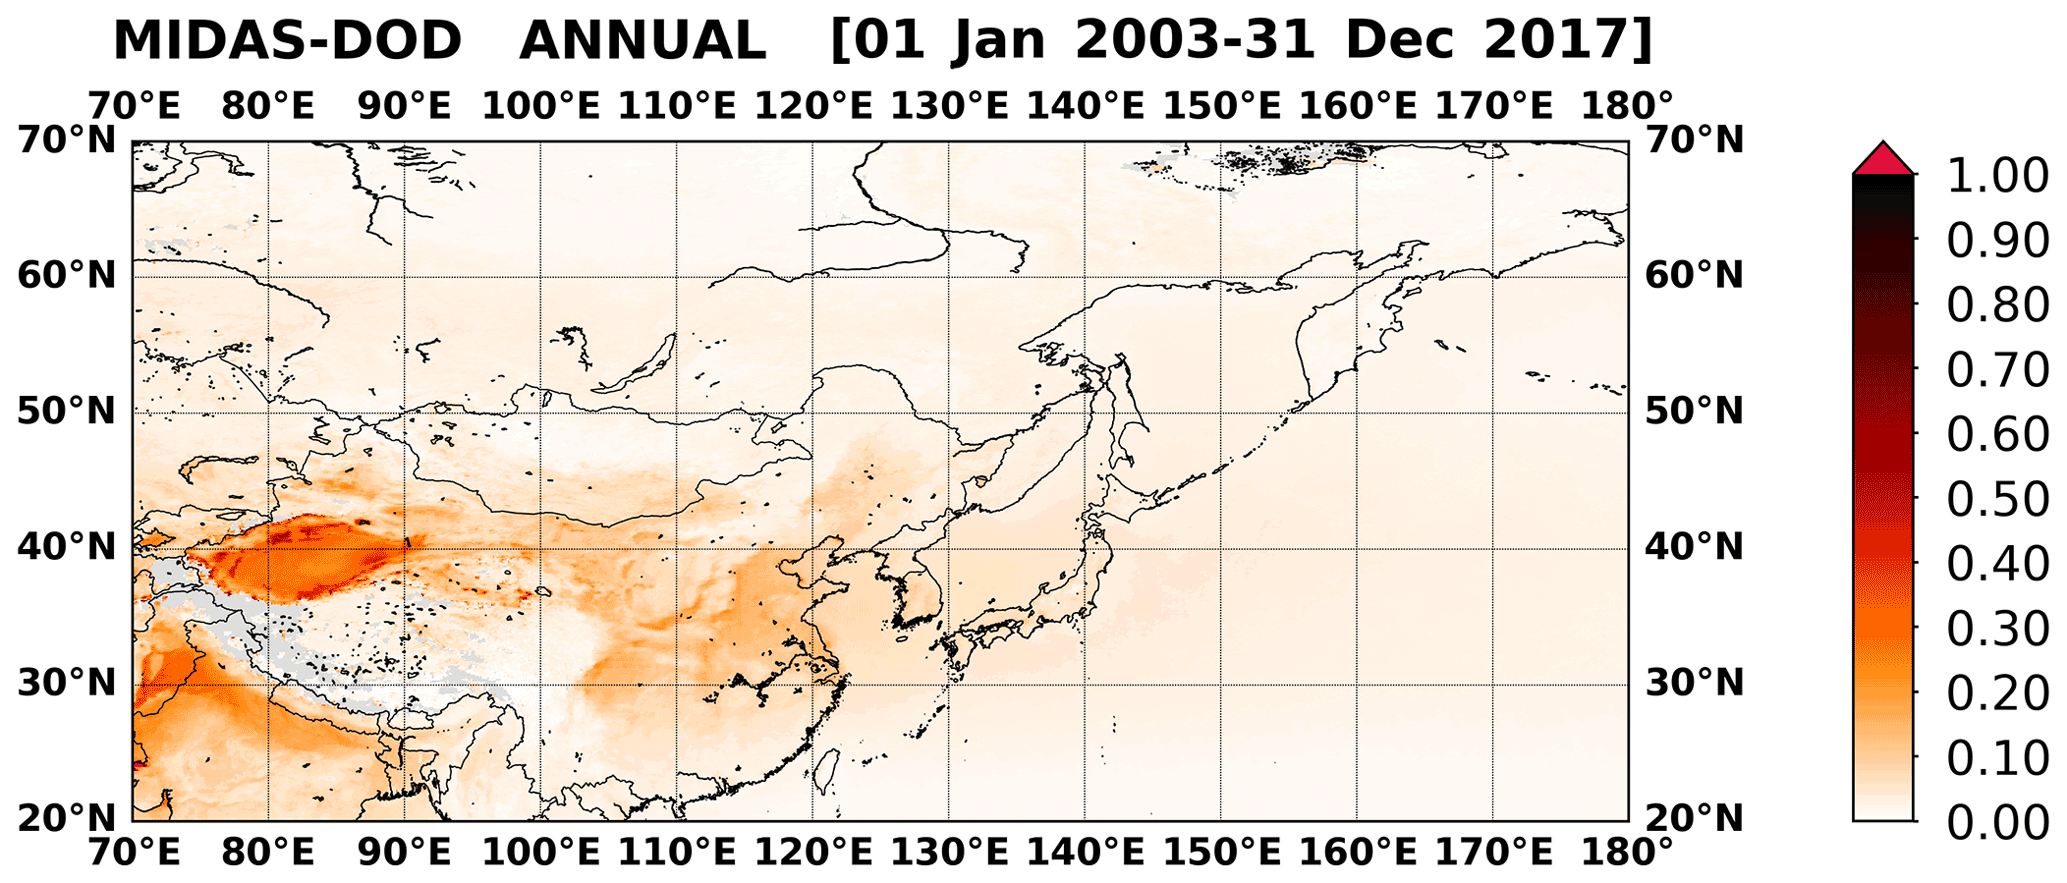
Figure 5As in Fig. 1 but for East Asia and the North Pacific Ocean.
In Sect. 4.2 we provide DOD estimates that are averaged in space (regionally and globally) and in time (over months, seasons and years) along with their respective uncertainties. Averaging is performed according to the upper branch of Fig. 5 in Levy et al. (2009); i.e., spatial averaging is performed after grid cell temporal averaging for any of the timescales considered. The uncertainties of the DOD averages at the different spatiotemporal scales are based on the propagation of the daily grid cell uncertainties provided within the MIDAS dataset and presented in Gkikas et al. (2021). In short, the daily grid cell uncertainties combine the uncertainties of the MODIS AOD and the MERRA-2 MDF with respect to AERONET and LIVAS, respectively. The former is based on linear equations expressing the uncertainty with respect to AERONET AOD over ocean (Levy et al., 2013) and land (Levy et al., 2010; Sayer et al., 2013) with updated coefficients for C061 data depending on vegetated and arid surface types (see Eqs. 4 to 7 in Gkikas et al., 2021). The latter is based on a quartic (fourth degree) polynomial equation expressing the uncertainty with respect to the LIVAS dust fraction (see Eq. 8 in Gkikas et al., 2021).
In order to estimate the uncertainties of the spatiotemporal averages we first assume that each of the daily grid cell uncertainties are composed of (1) a fraction that is completely random in time and space, (2) a fraction that is systematic (correlated) in time and random in space, and (3) a fraction that is systematic (correlated) in space and random in time. Our framework also assumes that the fraction of the daily grid cell uncertainty that is correlated both in space and time, for instance an instrument bias, is very small and therefore neglected. Under this framework, the propagation of uncertainty fraction (1) is negligible across the spatiotemporal scales considered, the propagation of uncertainty fraction (2) depends upon the size of the domain considered but is negligible at a global scale and across most of the regional domains considered in this study, and the propagation of fraction (3) accounts for most of the total average uncertainty. Since we cannot know fractions (1), (2), and (3) and (1) and (2) are negligible or small, we assume that (3) represents 100 % of the uncertainty – i.e., the grid cell uncertainty is systematic (correlated) in space and random in time – to provide an upper limit on the uncertainty. In addition, we also take into account the sampling uncertainty when temporally averaging over each grid cell using the standard error; i.e., we take the standard deviation divided by the square root of the number of measurements.
In practice, when averaging the daily values for every grid cell i over months, seasons or years, the uncertainty is obtained by adding in quadrature the daily uncertainties and dividing by the number of available daily measurements Ni:
In addition, we add in quadrature and the standard error SEi to obtain the total uncertainty of the temporal average σi for every grid cell:
where SDi is the standard deviation of the daily values in grid cell i. The standard error measures how far the sample could be from the true population mean.
Finally, when spatially averaging globally or regionally, under the assumption that the errors are correlated across space, the overall uncertainty is calculated by averaging σi across the Nj grid cells in spatial domain j weighted by the grid cell area fraction with respect to the total area (i.e., grid cell/total area =wi) with available retrievals:
Our analysis is divided in two main parts. In the first one (Sect. 4.1) we assess the annual and seasonal climatological DOD maps for nine distinct regions. In the second one (Sect. 4.2), emphasis is given on the quantification of DOD averages along with their monthly and interannual variability of the fractional contribution to the AOD, from a global to hemispherical level as well as for specific regional domains.
4.1 Annual and seasonal geographical distributions of DOD
4.1.1 North Africa, tropical Atlantic Ocean and Mediterranean
According to the long-term average map (Fig. 1), the maximum DODs (up to 1.2) are recorded in the Bodélé depression, which is considered the most active individual dust source of the planet (Washington et al., 2003; Koren et al., 2006; Ginoux et al., 2012). Over the area, the prevailing strong winds are intensified further between the Tibesti mountains and the Ennedi plateau (Washington et al., 2009), forming a low-level jet (Washington and Todd, 2005). This dominant wind pattern, affected by the local topography (Washington et al., 2009), acts as the driving force mobilizing mineral particles from arid and erodible soils of the region (Tegen et al., 2006). Under these favorable conditions, dust aerosols are easily uplifted and accumulated in the atmosphere, thus causing the very high DODs (>0.5) observed in the broader area (Chad, Niger). Throughout the year, the high DOD levels are quite persistent, exhibiting, however, a seasonal variation with more intense loads recorded during DJF (Fig. S1i) and MAM (Fig. S1ii) following the annual cycle of source activation (Washington et al., 2009). The second hotspot in North Africa is situated between the northern parts of Nigeria and the southern parts of Niger with annual DODs reaching up to 0.7 (Fig. 1) while on a seasonal basis varying from 0.4 (SON; Fig. S1iv) to 0.8 (JJA; Fig. S1iii). MIDAS DODs match well with those presented by Rajot et al. (2008), who relied on ground-based sun-photometric measurements of AOD obtained at the Banizoumbou AERONET site. Very high DODs are also evident along the coasts of the Gulf of Guinea, which may be unrealistic considering that dust aerosols are mainly transported there and are mixed with anthropogenic and biomass burning (Knippertz et al., 2015). Along this area of high DODs, MERRA-2 also overestimates the dust fraction compared to LIVAS (Gkikas et al., 2021), thus resulting in higher intensities according to the applied methodology (Sect. 2). Moreover, the temporal availability of DODs in the region is very limited (<10 %; Fig. 8c in Gkikas et al., 2021); the DOD uncertainty is large; and AOD outliers, either realistic or cloud contaminated, can yield exceptional high DODs in this complex environment where aerosol and clouds are spatially correlated (Andrew Sayer, personal communication, 2020). This abrupt reduction of DOD levels, from inland to the nearby maritime environment, reveals an artifact of the MIDAS dataset mainly introduced by the raw MODIS AOD retrievals, which are obtained by retrieval algorithms built on different assumptions/considerations depending on the underlying surface type.
Across the Sahara Desert, there is a distinct longitudinal contrast with more intense dust loads in western North Africa than in eastern North Africa (Fig. 1). In the former sector, the DODs range mainly from 0.3 to 0.6, while over the eastern parts of the Sahara the corresponding limits are bounded between 0.1 and 0.3 without revealing significant intra-annual variation. During MAM (Fig. S1ii), along the southern Sahel, the activation of dust sources results in DODs which locally can exceed 0.8, while during boreal summer (Fig. S1iii) a vast area of the Western Sahara is under the impact of heavy dust loadings (DOD >0.5). According to Ginoux et al. (2012), in the former region, dust is mainly produced by agricultural activities (cultivation, overgrazing) disturbing soils in which alluvial sediments have been accumulated. Northwards, dust has natural origin, and the accumulation of mineral particles is favored by the development of the Saharan heat low (SHL) affecting also the prevailing airflow (harmattan winds) as well as the West African monsoon (WAM) (Schepanski et al., 2017). Under these meteorological conditions, several dynamic processes, from microscale to mesoscale, are taking place, triggering dust emission (Knippertz and Todd, 2012) from highly active sources (Schepanski et al., 2007).
Under the impact of the trade winds, Saharan dust can travel across the tropical Atlantic Ocean, reaching the Caribbean Sea, the southern United States and northeastern South America (Prospero, 1999; Prospero et al., 2014). The signal of this long-range transport is evident on the annual climatological pattern (Fig. 1) with DODs up to 0.6 (off the Western Saharan coasts) fading down to 0.1 at the maximum distance. Within the course of the year, the Saharan dust plume varies in terms of intensity, range and latitudinal position, as it is depicted in Fig. S1. During boreal summer (Fig. S1iii), the corridor of the transatlantic dust transport is bounded between 10 and 20∘ N latitudes, whereas both the intensity (DODs up to 0.6) and the range are maximized. During boreal winter (Fig. S1i), the dust zone migrates southwards (between the Equator and 10∘ N), while maximum (up to 0.6) and considerable (0.1–0.2) DODs are observed over the Gulf of Guinea and mid-Atlantic (45∘ W), respectively. Between the transition seasons (Fig. S1ii, iv), dust loads are stronger in MAM (∼0.45), mainly residing within 5 and 20∘ N latitudes, in contrast to SON (∼0.3) when they are shifted northwards (10 and 25∘ N). According to the existing literature, several factors modulate the westwards propagation of dust plumes, originating in the Western Sahara and the Bodélé Depression, over the tropical Atlantic. For instance, the south–north displacement of the Saharan plumes is driven by the location of the Intertropical Convergence Zone (ITCZ) and the disturbances of the African easterly jet (Knippertz and Todd, 2012; Doherty et al., 2012). Teleconnection patterns, such as the El Niño–Southern Oscillation (ENSO; Prospero and Lamb, 2003), the North Atlantic Oscillation (NAO; Ginoux et al., 2004) and the North African Dipole Index (NAFDI; Rodríguez et al., 2015), have been also studied in order to interpret the decadal variations of dust concentrations over the Atlantic. Likewise, the vegetation coverage across the Sahel and the wind speeds, determined by the prevailing atmospheric circulation, over the Sahara play a key role on the amount of the emitted dust particles.
Due to the vicinity of the largest deserts of the planet, the Mediterranean is affected by dust outbreaks throughout the year (Gkikas et al., 2013, 2016; Marinou et al., 2017). Mineral particles originating primarily from north African and secondarily from Middle Eastern deserts are transported towards the Mediterranean mainly under the prevalence of cyclonic systems (Gkikas et al., 2015). The intensity of dust loads decreases for increasing latitudes, forming a distinct south–north gradient with DODs up to 0.20 between the gulfs of Gabes (Tunisia) and Sidra (Libya), according to the annual pattern (Fig. 1). Among seasons (Fig. S1), DODs vary on the locations where the maximum levels are recorded as well as on their magnitude, attributed to the position of the prevailing synoptic systems (Gkikas et al., 2015). The central and eastern Mediterranean sectors are affected by dust loads mainly in spring (DODs up to 0.3; Fig. S1ii) and winter (DODs up to 0.12; Fig. S1i). In summer (Fig. S1iii), dust activity is more pronounced in the western parts with optical depths up to 0.18 (Alboran Sea), while thanks to the fine-resolution product, hotspots of similar DODs can be identified in the southern parts (Andalucia) of Spain. In SON (Fig. S1iv), dust loads are found in the central Mediterranean with DODs lower than 0.12 off the Tunisian and Libyan coasts.
4.1.2 Middle East
In the Middle East, there is a zone of moderate-to-high DODs (locally up to 0.8) extending from the historical region of Mesopotamia to the southern parts of Saudi Arabia, where one of the largest sand deserts of the world (Rub' al Khali) (Hamidi et al., 2013) is situated (Fig. 2). Based on Ginoux et al. (2012), the origin of mineral particles between Tigris and Euphrates as well as across the Rub' al Khali Desert is mainly natural, while in the intermediate part (Ad-Dahna Desert) dust accumulation is attributed to the mixing of anthropogenic and hydrological sources. Slightly higher maximum DODs (up to 0.7; Fig. 2) are recorded in Oman and particularly between Dhofar and Al Wusta, in contrast to previous studies (Pease et al., 1998) which have identified the Sharqiya Sands (formerly known as the Wahiba Sands) area as a major dust source or the coastal areas of Yemen (Ginoux et al., 2012). On a seasonal basis, the intensity of mineral loads exhibits a strong variability with minimum DODs (up to 0.4) during DJF (Fig. S2i) and SON (Fig. S2iv) and maximum (up to 1) during the dry period of the year (Fig. S2ii, iii), being in agreement with the results presented in Yu et al. (2013). More specifically, across the Arabian Peninsula, the increase in DOD levels is getting evident in boreal spring, and it is further intensified during summer months. Dust storms emanating in Iraq and the eastern parts of Saudi Arabia favor dust transport towards the Persian Gulf (Gianakopoulou and Toumi, 2012) and account for the considerably high DOD levels (>0.6) found there. Due to convergence of the northern–northwesterly Shamal winds (Yu et al., 2016) and the airflow from the subtropical anticyclone, in JJA, mineral particles are traveling at even longer distances towards the northern Arabian Sea (Ramaswamy et al., 2017), as indicated by the intense dust loads (DODs up to 0.5; Fig. S2iii) contributing about half of the AOD (Jin et al., 2018). Likewise, during boreal summer, short-range dust transport takes place off the coasts of Oman and Yemen (Gulf of Aden). Among seas in the vicinity of the Arabian Peninsula, the most intense dust loads are observed in the Red Sea, forming a clear latitudinal gradient on annual (Fig. 2) and summer (Fig. S2iii) geographical DOD patterns, as it has been noted also in Brindley et al. (2015) and Banks et al. (2017). Due to its location, the southern sector of the Red Sea receives dust aerosols either originating from the Republic of the Sudan or from the Arabian Peninsula, depending on the zonal airflow (Banks et al., 2017). Dusty air masses traveling westwards are uplifted when they are crossing the mountain range in the southwestern Arabian Peninsula, and for this reason dust loads over the southern basin are suspended above 2 km (Banks et al., 2017). On the contrary, low-elevated dust layers are recorded when winds blow from west, triggering dust emission from the Tokar Gap (Sudanese coasts), and subsequently dust outflows into the southern Red Sea (Banks et al., 2017).
4.1.3 Central and southwest Asia
Northwards and eastwards of the Caspian Sea, various deserts are situated in the central segments of the Asian continent. Most of Turkmenistan is occupied by the Karakum Desert, while the Kyzylkum Desert is located in Uzbekistan. Other arid regions stretch between the Caspian and Aral seas (Ustyurt Plateau), in the eastern and southern flanks of the Aral Sea and in the lowlands of western Kazakhstan and southeastern Russia (Ryn Desert) (Elguindi et al., 2016). Based on our seasonal spatial patterns (Fig. S3), the major dust activity is recorded in the Ustyurt Plateau (Li and Sokolik, 2018) and in the large lagoon embayment of Garabogazköl (Shen et al., 2016), a gulf of Turkmenistan dried into a salt-covered playa (Gill, 1996), with minimum (in DJF and SON) and maximum (in MAM and JJA) DODs equal to ∼0.2 and ∼0.4, respectively. In the rest of areas, the corresponding upper limits can reach up to 0.8–0.9, during boreal summer, in localized spots (Chimboy Lake, Sarygamysh Lake) across the Karakum and Kyzylkum deserts. In the same season, moderate dust loadings (DOD up to 0.25) are encountered in the southern Caspian Sea (Elguindi et al., 2016) as the result of transported mineral particles mainly coming from the sandy deserts of Turkmenistan (Xi and Sokolik, 2015), under the impact of eastern/southeastern winds (Shen et al., 2016). Since the 1960s, the anthropogenic intervention (agricultural activities, over-irrigation) caused the retreat of the Aral Sea and the formation of the Aralkum Desert (Saiko and Zonn, 2000; Micklin, 2007), from which large amounts of aeolian dust are emitted and travel distances of hundreds of kilometers (Indoitu et al., 2015). According to the annual climatological map (Fig. 3), extremely high DODs (>1) are found in the southeastern parts of the Aralkum Desert (Fig. 3) which are also persistent among the seasons (Fig. S3). Nevertheless, these are not trustworthy as it has been thoroughly discussed in Gkikas et al. (2021) (see Sect. 4.3.1).
In the Sistan Basin, extending between Iran, Pakistan and Afghanistan, the long-term average JJA DODs can reach up to 1.1 (Fig. S3iii) in the Margo Desert (Afghanistan), due to the frequent occurrence of dust storms (Middleton, 1986) triggered by the northerly Levar winds blowing from June to September (Alizadeh-Choobari et al., 2014). These maximum DOD levels are substantially higher than the annual mean (0.8; Fig. 3) as well as against the corresponding averages for the other seasons. Thanks to the high-resolution MIDAS DOD, we identify the borders of other active arid regions, surrounded by mountain ranges, such as the Rīgestān (Afghanistan), the Balochistan (Pakistan), the Dasht-e Kavir (Iran), the Dasht-e Lut (Iran) and the Jazmurian drainage basin (Iran). In the aforementioned topographic lows, the magnitude of the dust loads is significantly lower than those observed in the Margo Desert and can be as large as 0.6 (Balochistan) during hot–dry months (Fig. S3iii). The presence of absorbing mineral particles, over the area and in the northernmost part of the Arabian Sea, is also confirmed by the high AI values, especially in June–July, discussed by Rashki et al. (2015), who relied on long-term records obtained by the Ozone Monitoring Instrument (OMI) and Total Ozone Mapping Spectrometer (TOMS) spaceborne sensors.
4.1.4 Indian subcontinent
In the Indian subcontinent, the maximum annual DODs (∼0.5; Fig. 4) are observed along the Indus River basin, in the western side of the Thar Desert, whereas a branch of gradually decreasing DODs, along the Indo-Gangetic Plain towards eastwards directions, is also evident. Ginoux et al. (2012) stated that much of dust activity in the Indus River basin is attributed to the suspension of soil particles originating primarily from agricultural land use and to a lesser extent from the desiccation of ephemeral water bodies. The strong presence of absorbing coarse particles over the area is further supported by the coexistence of considerably high aerosol index (AI) values (Alam et al., 2011). As indicated by the seasonal patterns (Fig. S4), the processes regulating the suspended dust loads are highly variable during the year, causing a remarkable temporal variability of DOD, which is low (<0.3) in DJF and SON, moderate in MAM (<0.5), and maximum in JJA (<0.8). Similar seasonal variability is evident in the Thar Desert, in agreement with the findings of Proestakis et al. (2018) and Dey and Di Girolamo (2010), who used vertically resolved (CALIOP) and multi-angle (MISR) satellite retrievals, respectively. Nevertheless, our climatological DODs are higher with respect to the CALIOP corresponding values and the MISR non-spherical AODs, particularly when dust activity over the area is pronounced. During the pre-monsoon season, westerly to northwesterly winds are blowing over the Thar Desert, mobilizing dust particles which subsequently are advected towards the Indo-Gangetic basin (Dey et al., 2004; Srivastava et al., 2011). According to our results, between the Haryana state and the eastern parts of the plain, DODs fade down from ∼ 0.6–0.7 to ∼ 0.1–0.2, forming a NW–SE gradient (Fig. S4ii, iii). Such high DODs are attributed to the eastwards propagation of intense dust storms having a strong signature on the optical, microphysical and radiative properties derived by AERONET stations operating in the region (Prasad and Singh, 2007; Prasad et al., 2007; Eck et al., 2010).
4.1.5 East Asia and North Pacific Ocean
Northwards of the Tibetan Plateau, the Tarim Basin (northwest China) is situated, in which one of the largest natural dust sources, the Taklamakan Desert, resides. This elevated desert area (average elevation 1.1 km) is surrounded by the Pamir Plateau (average elevation 5.5 km) to its west, by the Kunlun Shan range (average elevation 5.5 km) in its southern flanks and by the Tian Shan range (average elevation 4.8 km) along its northern boundaries, while the ground elevation is low only in its eastern margin (Ge et al., 2014). DODs are maximized in spring (Fig. S5ii), yielding values up to 1 along the foothills of the Tian Shan and Kunlun Shan ranges, attributed to the role of the topography on winds strengthening (Ge et al., 2014). Similar values are recorded in JJA (Fig. S5iii), but the geographical distribution reveals that the highest DODs are less widespread in contrast to spring. Throughout the year, the weaker dust loads are recorded during winter and autumn. Our results are consistent with relevant studies that rely on active and passive satellite retrievals either of pure dust load (Proestakis et al., 2018) or AOD (de Leeuw et al., 2018; Sogacheva et al., 2018).
A common feature in the seasonal DOD patterns is the reduction of dust loads' intensity towards the interior parts of the Taklamakan Desert, as it has been also documented by Ge et al. (2014), who utilized MISR retrievals. The high-resolution of the MIDAS DOD dataset provides in detail the spatial information of these geographical patterns. During spring, similar high DODs to those found over the Taklamakan Desert are recorded in the Qaidam Basin (northeast side of the Tibetan Plateau), surrounded by the Altun, Kunlun and Qilian mountain ranges, attributed to strong downslope winds causing the erosion of soil particles (Rohrmann et al., 2013) and their entrainment into the atmosphere. The intensity of dust loads over the Gobi Desert (north China–south Mongolia) hardly exceeds 0.3 on an annual basis (Fig. 5), while it can reach up to 0.4 during spring (Fig. S5iii). The remarkable deviations in dust abundance between Taklamakan and Gobi during springtime are interpreted by variations in soil characteristics. More specifically, Taklamakan is composed mainly by fine sand particles in contrast to the rocky soils of the Gobi Desert (Sun et al., 2013). Due to these differences in soil textures, dust particles from the former desert region can be emitted even with low wind speeds, while they are uplifted at higher elevations in the troposphere, as it has been shown with MISR stereo observations (Yu et al., 2019) and CALIOP lidar profiles (Proestakis et al., 2018). The injection of Taklamakan dust particles at higher altitudes increases their residence time inducing also their entrainment into the upper-level westerly airflow, around at 4 a.m.s.l., both contributing to the higher potential for long-range transport (Yu et al., 2019), in contrast to Gobi dust, towards continental East Asia and the northern Pacific Ocean. Under the impact of cold fronts propagating eastwards (Eguchi et al., 2009) in spring, air masses carrying mineral particles during the first 2 d of dust transport affect a wide area of China (Yu et al., 2019), from near sources to its eastern parts through the Hexi Corridor and the Loess Plateau (DODs ranging from 0.2 to 0.4; Fig. S5iii). Subsequently, the Asian dust plumes are suspended over the Yellow Sea, the Korean Peninsula and further eastwards, in a latitudinal band bounded between the parallels 30∘ N and 45∘, reaching the west coasts of the United States (Yu et al., 2008). Across this belt, where the trans-Pacific dust transport is taking place, the springtime DODs decrease smoothly from 0.15 to 0.05 (Fig. S5ii). In summer (Fig. S5iii), DODs up to 0.05 are observed between 40 and 60∘ N, indicating a northwards displacement of the Asian dust layers (mainly originating from the Gobi Desert) due to the weakening and northwards shift of the polar jet streams (Yu et al., 2019).
4.1.6 North America
Across North America, major dust activity is detected in the southwestern United States and in northwest Mexico, with annual and seasonal DODs hardly exceeding 0.15, as illustrated in Figs. 6 and S6, respectively. These weak dust load intensities are mainly recorded in the Sonoran and the Mojave deserts, while lower values are found in the Chihuahuan Desert in which isolated spots (e.g., White Sands desert) become visible thanks to the high-resolution of the MIDAS DOD dataset. Low-to-moderate DODs are evident in the Great Plains with local maxima (exceeding 0.2 in spring; Fig. S6ii) in the Great Salt Lake Desert and in the surrounding area as well as in the Baja Californian Desert (Mexico; DODs up to 0.14), residing in the western side of the Gulf of California. Our annual spatial distribution of DOD (Fig. 6) is highly consistent with those of frequency of observation (FoO) of DOD (Ginoux et al., 2012; Baddock et al., 2016) and AI given by Prospero et al. (2002). Moreover, the increase in dust loads' concentration in MAM (Fig. S6ii) has also been documented by Hand et al. (2017) and Tong et al. (2017), both relying on aerosol observations acquired at numerous stations of the Interagency Monitoring of Protected Visual Environments (IMPROVE) network. During springtime, dust emission over the broader area is associated with the transmit of Pacific cold fronts inducing dust-entraining winds as the result of pressure gradient enhancement (Rivera Rivera et al., 2009). The geomorphological soil characteristics are determinant for dust emission with the most prominent natural sources being ephemeral and dry lakes (Baddock et al., 2016), while anthropogenic dust aerosols are mainly emitted in the Great Plains and in the eastern side of the Gulf of California (Ginoux et al., 2012).
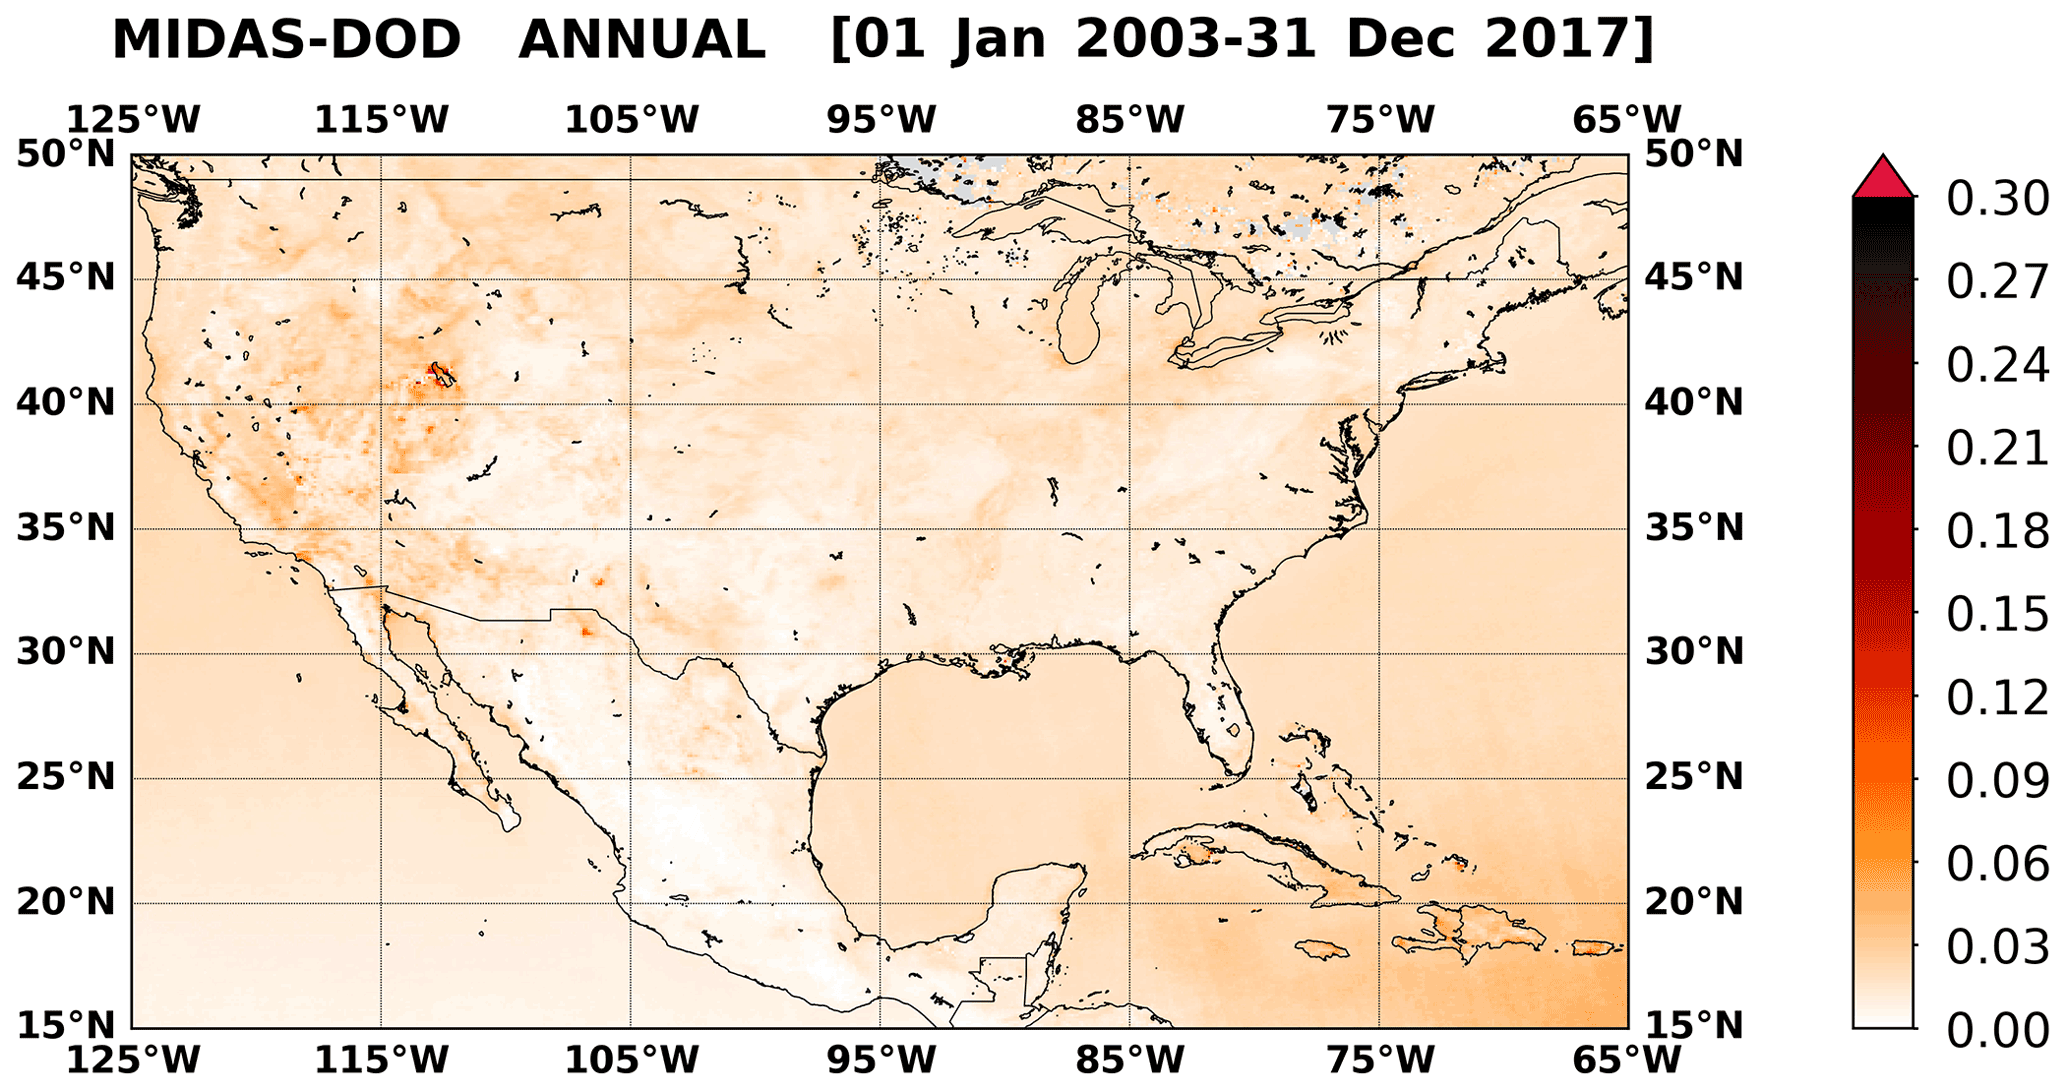
Figure 6As in Fig. 1 but for North America.
4.1.7 Australia
Earlier studies based on unconstrained numerical simulations (Tanaka and Chiba, 2006; Wagener et al., 2008) have shown that among the desert areas of the Southern Hemisphere, the largest contribution of dust particles arises from Australia. However, a more recent assessment (Kok et al., 2021b) in which dust models have been constrained by observations revealed that the emitted dust amounts from South America are slightly higher than those of Australia. Due to the fairly bright landmasses and the predominance of weak aerosol loadings, there is minimal contrast between surface and atmosphere, leading to systematic algorithm uncertainties, which can explain the slightly lower land DODs compared to those recorded in the surrounding oceanic regions (Figs. 7 and S7). Nevertheless, in the sources as well as in areas affected by dust plumes, the atmospheric signal becomes evident. In particular, the highest dust emissions are encountered in the Lake Eyre Basin (LEB; Prospero et al., 2002) composed by ephemeral lakes, alluvial channels, gibber (stone-covered plains), aeolian sand deposits and bedrock (Bullard et al., 2008). Based on the annual climatological pattern (Fig. 7), DODs can locally exceed 0.2 (in the southern parts) but in general vary between 0.06 and 0.12. From a seasonal perspective (Fig. S7), the highest DODs (mainly up to 0.18 in the Warburton River estuary; few exceedances above 0.4 are found in local spots) are recorded during austral summer (DJF; Fig. S7i) and spring (SON; Fig. S7iv). Similar seasonal variation in ground-based sun-photometric observations at nearby sites (Birdsville, Tinga Tingana), with slightly lower AODs, has been reported by Mitchell et al. (2017). Southwards of the LEB, three spots of notable DODs (up to 0.2 in SON; Fig. S7iv) are identified in the lakes Gairdner, Torrens and Frome, while northeastwards (Lake Yamma Yamma) and northwards (Simpson Desert) from the basin the suspended dust loads exhibit optical depths as large as 0.12 during the driest months of the year. Similar maximum DODs are recorded in the Northern Territory and in the western side of the Great Dividing Range (Queensland), and in contrast to Ginoux et al. (2012) these levels appear in DJF instead of SON. In the southwestern coastal parts of the Australian landmass as well as in Riverina (southeast), during austral spring (Fig. S7iv) very low DODs are evidently associated with anthropogenic dust originating from agricultural activities (Ginoux et al., 2012). Finally, during the same season, weak signals (DODs up to 0.05) of dust transport are revealed over the Tasman and Timor seas, attributed to the eastward movement of cyclonic frontal systems causing the entrainment of mineral particles in air masses that can travel long distances (Knight et al., 1995; Alizadeh Choobari et al., 2012).

Figure 7As in Fig. 1 but for Australia.
4.1.8 South Africa
Dust activity in South Africa is mainly related with short-range and short-lived plumes (Vickery et al., 2013) that are suspended at low tropospheric altitudes (below 600 hPa) due to the predominance of anticyclonic circulations inhibiting the vertical extension of dust layers (Piketh et al., 1999). Mineral aerosol loadings are mainly originating from the ephemeral lake basins of the Etosha Pan (Namibia) and Makgadikgadi Pan (Botswana) and the Namib Desert (Bryant et al., 2007; Vickery et al., 2013). In the aforementioned source areas, the maximum annual (Fig. 8) and seasonal (Fig. S8) DODs are equal to 0.1 and 0.16, respectively. Throughout the year, the increase in DODs in Etosha and Makgadikgadi pans is evident primarily in DJF (Fig. S8i) and secondarily in SON (Fig. S8iv). Our results are consistent with those provided by Ginoux et al. (2012) and Bryant et al. (2007) for the former region (including also the Kalahari Desert in which very weak dust loads are recorded), in contrast to the latter one and opposite to the findings of Vickery et al. (2013) for both sources. In these arid areas dust emission is linked with lakes' inundation, characterized by strong intra-annual variability, playing an important role when different time periods are considered. However, the moderate performance of the MERRA-2 dust portion with respect to LIVAS in South Africa as well as in most desert areas of the Southern Hemisphere must be also taken into account (Gkikas et al., 2021). Along the Namibian coastline, the deviations of DOD between the high- and low-dust seasons are small, indicating that dust activity remains relatively constant within the course of the year (Ginoux et al., 2012). Soil particles from salt pans and dry river beds of the Namib Desert are emitted from aeolian processes related to berg winds (katabatic winds) blowing in the escarpment, from the Central Plateau down to the coasts (Eckardt and Kuring, 2005). Dust outflow towards the southern Atlantic Ocean, with a SE–NW orientation; it is shown between 18 and 9∘ S during austral winter (DODs up to 0.08; Fig. S8iii), becoming more evident in SON (Fig. S8iv), in agreement with the geographical distributions provided by Voss and Evan (2020). Such transport is favored by the propagation of barotropic low-level easterly waves formed between continental high-pressure systems and the semi-permanent South Atlantic anticyclone (Tyson et al., 1996). Finally, weak signals of DODs are recorded in the croplands north of Cape Town, with annual and DJF DODs not exceeding 0.1.

Figure 8As in Fig. 1 but for southern Africa.
4.1.9 South America
In South America, the most intense dust loads are encountered in the Patagonia Desert, where the most active dust sources are situated in the river basins of the Rio Negro and Chubut provinces and in its southern end. Among these areas, higher DODs (up to 0.16 in DJF; Fig. S9i) are found along the Rio Negro, attributed to anthropogenic dust originating from overgrazing, irrigation and oil prospecting (McConnell, et al., 2007; Mazzonia and Vazquez, 2009). In southern latitudes, mineral particles originate from glacier washout plains. Under favorable meteorological conditions, aeolian dust from Patagonia travels either towards the southern Atlantic Ocean, contributing to iron concentrations and marine biological productivity in the surface waters (Johnson et al., 2011), or towards the Antarctica peninsula (Gassó et al., 2010), as it has been found in ice core samples (Basile et al., 1997). Both transport pathways are not visible in our climatological patterns (Figs. 9 and S9) since dust outbreaks are not so strong (Foth et al., 2019), while the extended cloud coverage over the region results in large observational gaps of the spaceborne retrievals (Gassó and Torres, 2019). Along the western side of Andes, dust emission arises from natural sources located in the Sechura (Peru), Nazca (Peru) and Atacama (Chile) deserts (Ginoux et al., 2012). In the aforementioned regions, the annual DODs (Fig. 9) can reach up to 0.1, 0.08 and 0.06, respectively, while the intra-annual variability is characterized as weak (Fig. S9). During MAM (Fig. S9ii), DODs up to 0.16 appear in Guyana, Suriname and French Guiana as well as over their offshore areas, while similar intensities are evident in the northern parts of the Amazon rainforest (around the Equator and bounded between 65 and 60∘ W). The presence of coarse mineral particles (Moran-Zuloaga et al., 2018) over these distant areas from deserts is attributed to the long-range dust transport from North Africa across the Atlantic Ocean (Yu et al., 2015), under the impact of the trade winds taking place northwards of the convective precipitation zone formed around the ITCZ. Finally, the latitudinal zone of weak DODs in the western parts of Brazil, fading down abruptly eastwards of ∼ 58∘ W, indicates an artifact of the MIDAS product that becomes more evident in SON (Fig. S9iv). This peculiar pattern is induced by the MERRA-2 dust fraction (results not shown here), which is used for the derivation of MIDAS DOD from the MODIS AOD. An additional deficiency is the relatively large DODs over an area where biomass burning particles, emitted at enormous amounts by extended wildfires, clearly dominate over other aerosol species. Under these conditions, the non-dust AODs are very high as well as their relevant uncertainties (Eqs. 5–7 in Gkikas et al. 2021) while the reliability of the MERRA-2 dust fraction decreases there (see Fig. 2 in Gkikas et al., 2021).

Figure 9As in Fig. 1 but for South America.
4.2 DOD averages and variability at global, hemispherical and regional scales
In this section, we discuss the average AOD and DOD along with their monthly and interannual variability at global, hemispherical and regional scales. The left column of Fig. 10 shows the interannual time series of AOD (black curve) and DOD (red curve) averaged over the whole globe (upper panel; GLB), the Northern Hemisphere (middle panel; NHE) and the Southern Hemisphere (bottom panel; SHE). The right column of Fig. 10 depicts the monthly seasonal cycle of AOD and DOD along with the DOD-to-AOD ratio (blue curve), while the shaded areas correspond to the total uncertainty (see Sect. 3.2 in Gkikas et al., 2021, and Sect. 3 in the current study).
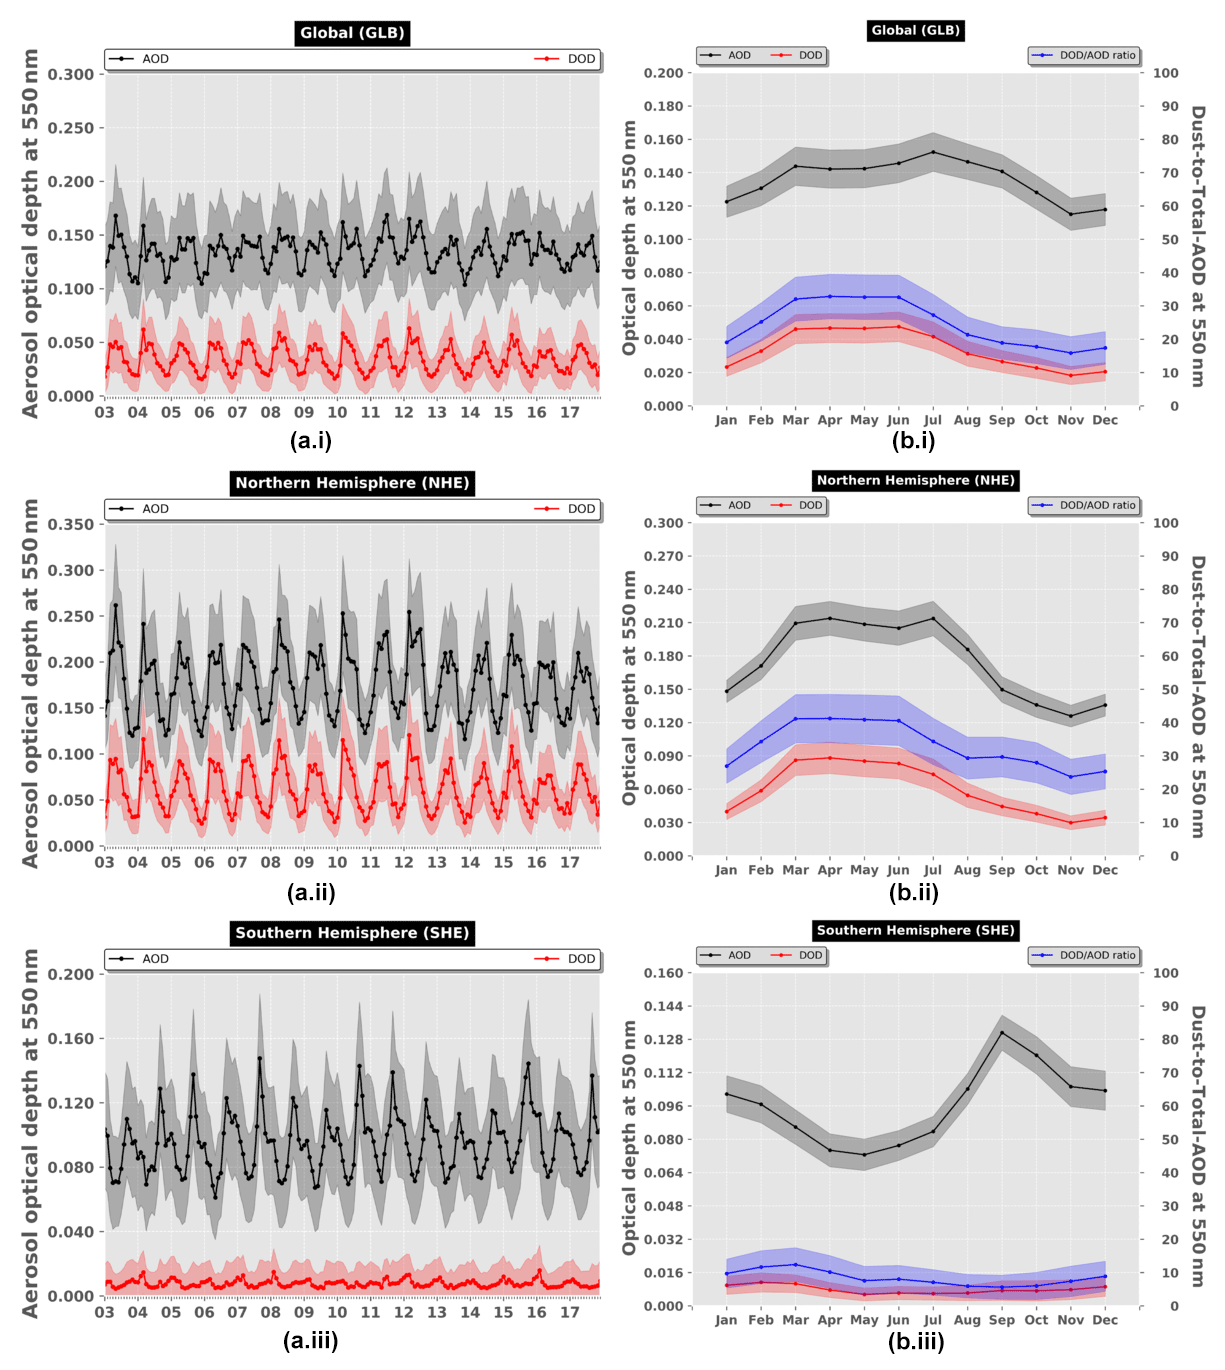
Figure 10Interannual (a) and intra-annual (b) variability, representative for the period 2007–2016, of monthly MODIS AOD550 nm (black curve) and DOD550 nm (red curve) regionally averaged for (i) the whole globe (GLB), (ii) the Northern Hemisphere (NHE) and (iii) the Southern Hemisphere (SHE). The blue curves in the intra-annual plots depict the dust-to-total AOD550 nm ratio (expressed in percentage; right y axis). The shaded areas correspond to the total uncertainty.
The significant role of dust particles in the global aerosol budget becomes evident by visually inspecting the AOD and DOD interannual time series (Fig. 10a.i). The monthly contribution of suspended dust to the total AOD varies from 14 % to 39 %, with minimum values mainly in DJF and maximum values in MAM or JJA, depending on the year. Monthly DODs range from 0.016±0.013 (December 2005) to 0.063±0.028 (March 2012), whereas the long-term global annual average is equal to 0.032±0.003 (Table 1). The global DOD mean, computed here from the fine-resolution data, is almost identical with those obtained by the coarse-spatial-resolution MERRA-2 and MIDAS DODs and slightly higher than those calculated based on LIVAS–CALIOP (0.029) (see Table 1 in Gkikas et al., 2021; it is noted that the three datasets were collocated based on the spatial resolution and the temporal availability of the LIVAS dataset). Likewise, our global average and uncertainty computed over the period 2004–2008 (0.033±0.004) is close to the one obtained in Ridley et al. (2016) (0.030±0.005), despite the different methods applied for the derivation of DOD and its uncertainty. Our global DOD long-term average is very close to the CALIOP-derived value (0.029) and about half of the MODIS-derived one (0.067) reported by Song et al. (2021).
Table 1Annual and seasonal DOD averages, representative for the period 2003–2017, along with the associated uncertainty. The first three rows refer to the whole globe (GLB), the global land (GLB-land) and global ocean (GLB-ocean). In the fourth and fifth line the results for Northern Hemisphere (NHE) and Southern Hemisphere (SHE) DODs are given, whereas in the remaining 17 entries the corresponding results for selected subregions (denoted with colored rectangles in Fig. 7 in Gkikas et al., 2021) are given.
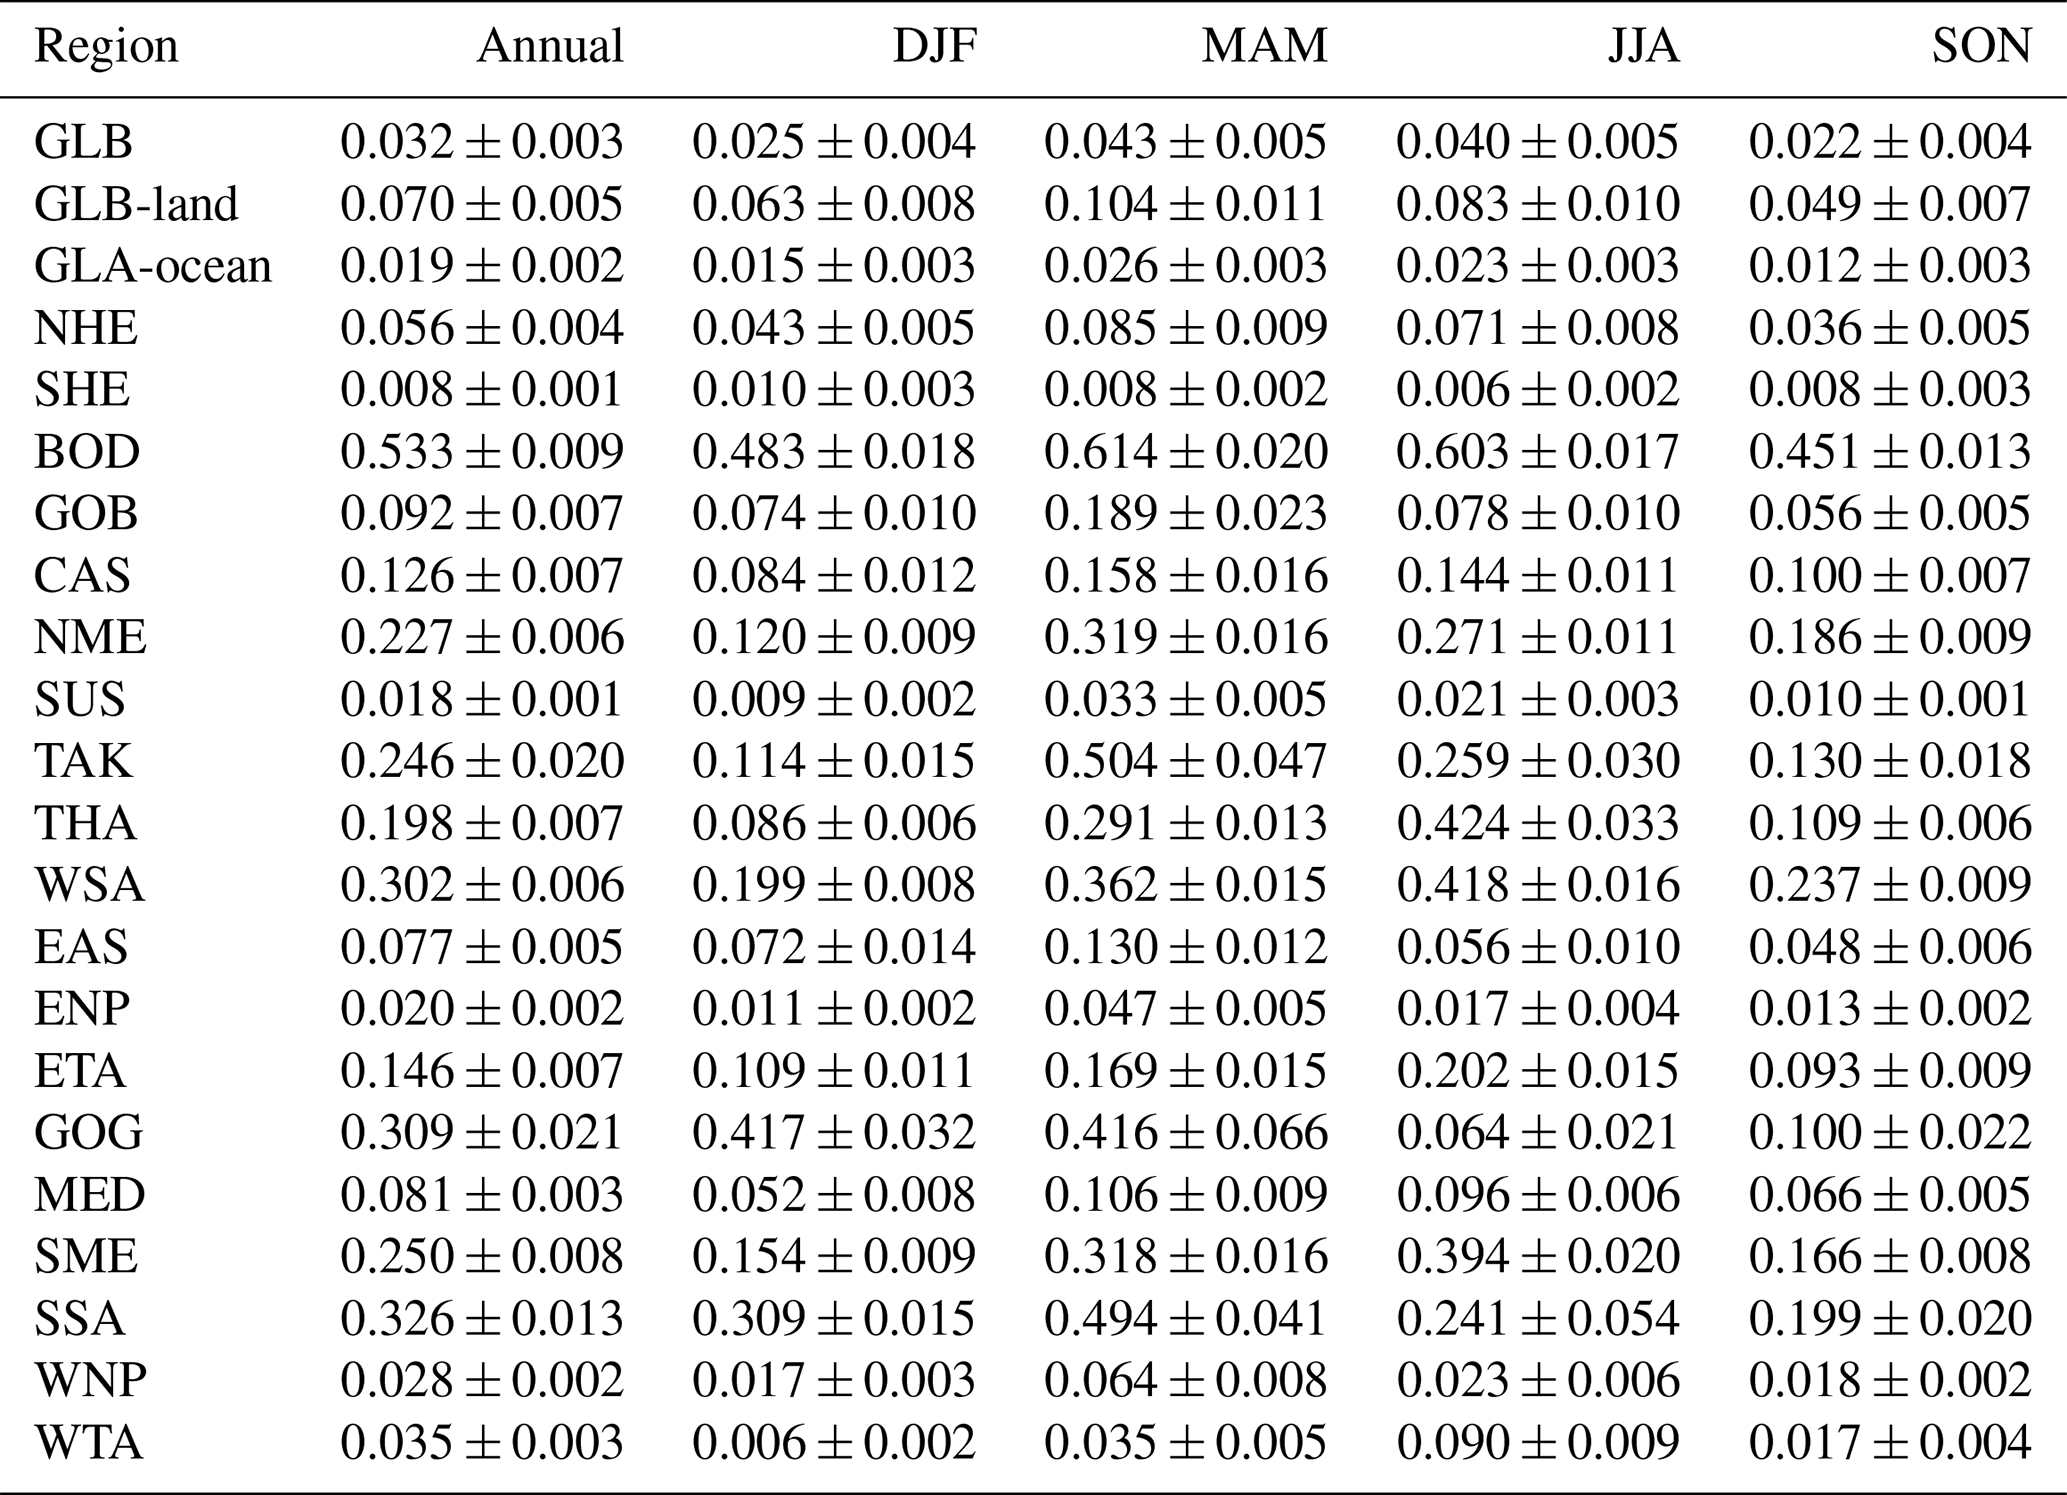
Our continental (0.070±0.005) and oceanic (0.019±0.002) mean DODs (see Table 1) are substantially lower than those obtained in Voss and Evan (2020) (land: 0.1; ocean: 0.03). This difference may be attributed to the different averaging approaches, which can have an important impact on the calculations as it is shown in Levy et al. (2009) (see their Fig. 5). Based on our method, we are giving the same weight at each grid cell (regardless of the amount of available data in that grid cell throughout the study period) when we are calculating the domain (from regional to global) average. Therefore, we are avoiding an overestimation of the spatial average since MIDAS data availability is larger over/nearby deserts (see Fig. 8c in Gkikas et al., 2021) where the higher DODs are observed. To be more specific, when we are calculating the global long-term DOD average based on the second branch (i.e., straight, the standard approach for the calculation of the average value by considering all the available values in space and time) in Levy et al. (2009), we obtain a climatological value equal to 0.047. Such different approaches for the calculation of the long-term DOD averages might interpret the deviations found between this study and Song et al. (2021). Finally, the computed global mean MIDAS DOD is somewhat higher than those simulated by most AeroCom Phase I models (Huneeus et al., 2011), being about 40 % higher than the median (0.023); nevertheless, it must be taken into account that most models consider the diurnal variation of DOD in contrast to the single measurements taken during MODIS overpass.
As expected, the interannual GLB DOD time series is driven by the variability in the NHE DOD (Fig. 10a.ii) since the most widespread and intense dust sources are located in the Northern Hemisphere. This is justified by their high temporal co-variation, while a positive NHE–GLB offset is constantly observed, being lower during boreal winter and autumn (up to 0.035) and maximum during the high dust seasons (0.058). The fraction of monthly NHE AOD attributed to dust particles ranges from 20 % to 48 %, and the R2 value between monthly AOD and DOD is equal to 0.94, both indicating a dominant dust contribution. Over the study period (2003–2017), the NHE DOD yields a climatological mean equal to 0.056±0.004 (Table 1) ranging from 0.024±0.015 (December 2005) to 0.121±0.050 (March 2012). In contrast, marine and biomass burning aerosols, rather than dust, regulate AOD in the Southern Hemisphere (Fig. 10a.iii). SHE DODs are estimated to be low (0.008±0.001), with the maximum value (0.016±0.016) recorded in February 2016. The contribution of dust aerosols to the total aerosol load does not exceed 17 % throughout the study period (Fig. 10a.iii), and on average it is equal to 8.2 %±1.1 %, which is in very good agreement with the findings by Kok et al. (2021b).
A better view of the seasonal cycles of AOD, DOD and the DOD-to-AOD ratio can be obtained by investigating their climatological patterns, representative for the period of interest (2003–2017). On a global scale (Fig. 10b.i), DODs peak between March and June (∼0.045) and then decline until November (0.018) before rising during boreal winter. Despite the monthly shifts between maximum AOD and DOD averages, the seasonal cycles of the total aerosol and dust burdens are similar to a large extent, whereas the contribution of mineral particles to the total extinction ranges from 16 % (November) to 33 % (March–June). The MIDAS global DOD-to-AOD ratio (∼23 %) is close to the values reported by Gelaro et al. (2017) and Kinne et al. (2006), ∼ 22 % and ∼ 26 %, respectively, but higher than most of the model-derived estimations (12 %–28 %) from the AeroCom Phase III (Gliß et al., 2021). These discrepancies, excluding the aerosol parametrizations, may be partly due to the different sampling between single-overpass satellite observations and reanalyses (Gelaro et al., 2017) or models (Kinne et al., 2006) where the diurnal aerosol variability (Schepanski et al., 2009; Yu et al., 2021) is included. In the NHE (Fig. 10b.ii), the mean seasonal trend of DODs remains relatively unchanged when compared with GLB; however, the hemispheric means (0.030–0.088) and the dust fraction (24 %–41 %) are higher. On the contrary, the weak signal of aeolian dust in SHE (Fig. 10b.iii) interprets the very low DODs (0.005–0.011) and their minor impact (6 %–12 %) upon AOD magnitude.
The analysis presented above has also been conducted for each one of the 17 subregions illustrated in Fig. 7 in Gkikas et al. (2021), and the main findings are summarized in this paragraph. Among the regional domains, a persistency of high DODs (>0.3), both at interannual and seasonal scales, is found only in BOD, which yields a long-term average value equal to 0.533±0.009, being almost double that of WSA (0.302±0.006) and TAK (0.246±0.020) as illustrated in Table 1. However, when focus is given to individual months, the maximum DODs over the study period (Fig. 11a.vi) and on their climatological levels are recorded in the Taklamakan Desert and can be as high as 0.868 (April 2007) and 0.600 (April), respectively. Comparable or even higher DODs than those computed in BOD are also evident for specific months in THA (Fig. 11a.vii), GOG (Fig. 11a.xii) and SSA (Fig. 11a.xv) as well as on the monthly time series (THA; Fig. 11b.vii). Mineral particles' contribution to the total AOD (i.e., blue curves in the seasonal cycle plots) is at least 50 % over dust sources or dust-abundant areas in North Africa, the Middle East and Asia, and it is constantly higher than 70 %, reaching up to 95 %, in BOD (Fig. 11b.i), WSA (Fig. 11b.viii) and TAK (Fig. 11b.vi). Over downwind regions, such as EAS (Fig. 11b.ix), GOG (Fig. 11b.xii), MED (Fig. 11b.xiii) and SSA (Fig. 11b.xv), the dust contribution can prevail over the non-dust portion (GOG, MED, SSA) while in EAS it does not exceed 30 %, due to the predominance of anthropogenic aerosols. In the oceanic areas of the tropical Atlantic and North Pacific, where large-scale dust transport is taking place, AOD and DOD co-vary, indicating that the dust activity regulates the temporal variations of aerosols' load, except during summer months in WNP (Fig. 11a.xvi, b.xvi). Regarding the seasonal cycle of DOD, the maximum values are recorded either during boreal spring (GOB, CAS, NME, SUS, TAK, EAS, ENP, GOG, MED, WNP and SSA) or during boreal summer (THA, WSA, ETA, SME and WTA) or are similar between the two high-dust seasons (BOD).
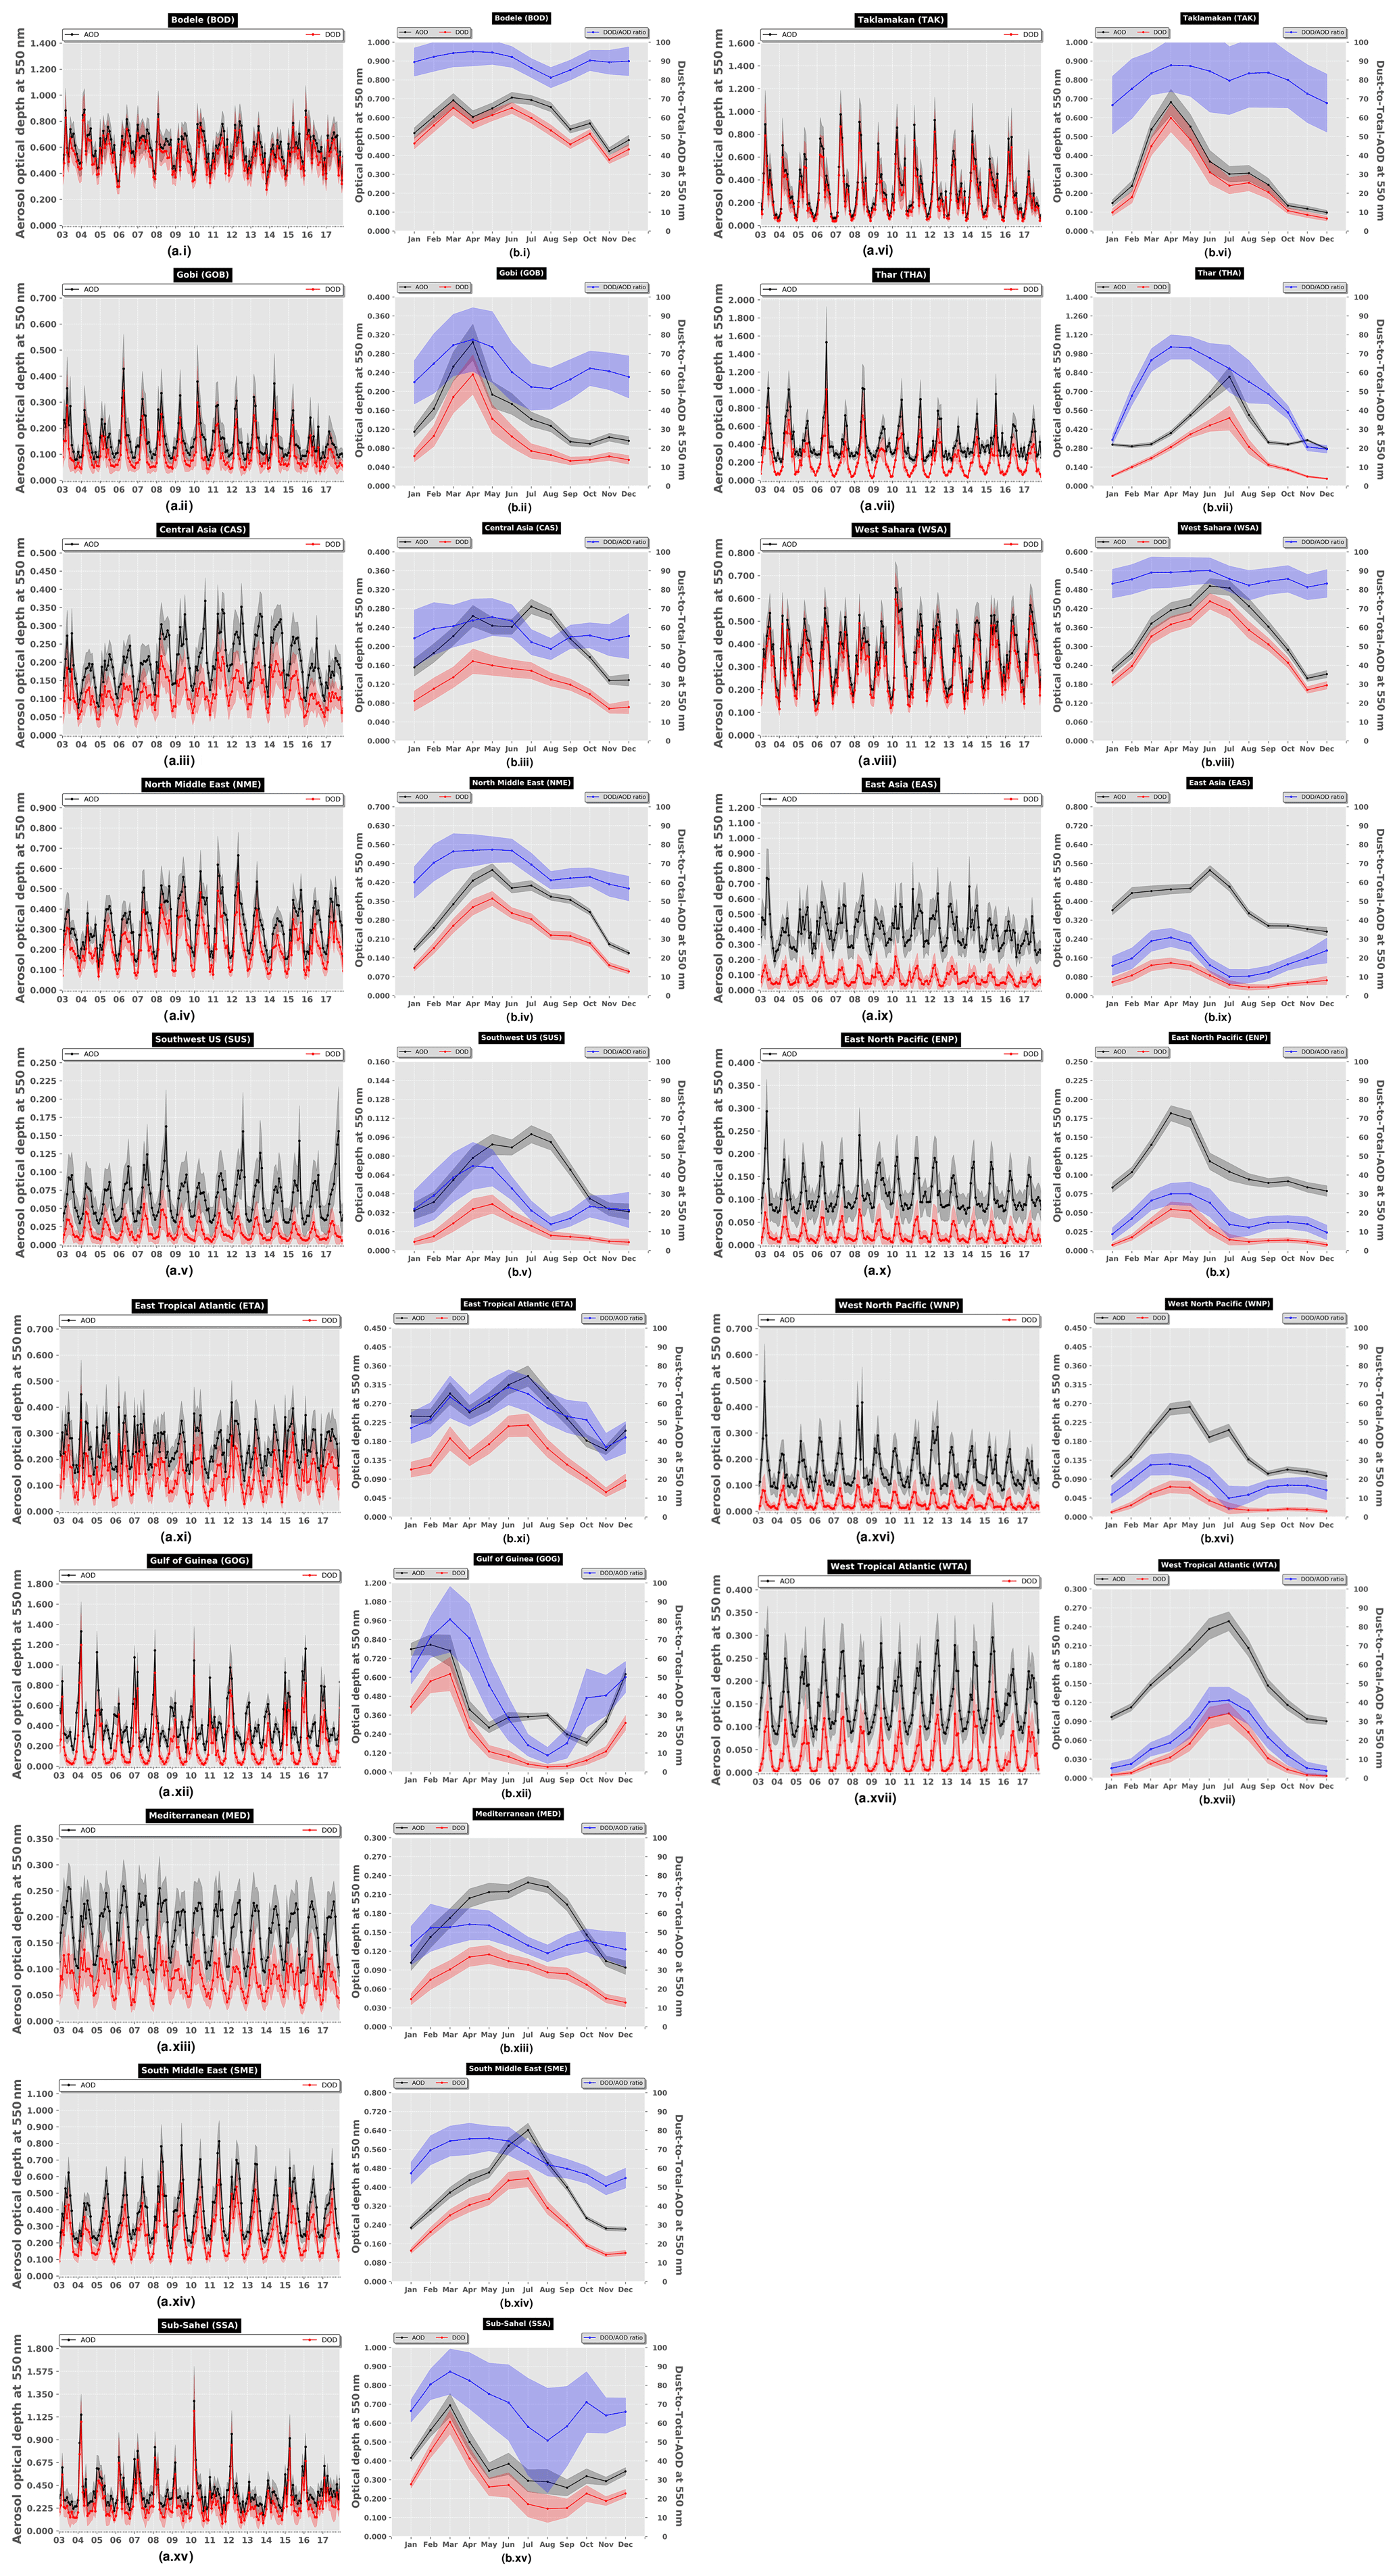
Figure 11Interannual (a) and intra-annual (b) variability, representative for the period 2003–2017, of monthly MODIS AOD550 nm (black curve) and DOD550 nm (red curve) regionally averaged for (i) Bodélé Depression (BOD), (ii) Gobi Desert (GOB), (iii) Central Asia (CAS), (iv) north Middle East (NME), (v) southwest United States (SUS), (vi) Taklamakan Desert (TAK), (vii) Thar Desert (THA), (viii) Western Sahara (WSA), (ix) East Asia (EAS), (x) east North Pacific (ENP), (xi) east tropical Atlantic (ETA), (xii) Gulf of Guinea (GOG), (xiii) Mediterranean (MED), (xiv) south Middle East (SME), (xv) sub-Sahel (SSA), (xvi) west North Pacific (WNP) and (xvii) west tropical Atlantic (WTA). The shaded areas in the inter- and intra-annual plots correspond to the total uncertainty. The blue curves in the intra-annual plots represent the percentage contribution of dust optical depth (DOD) to the aerosol optical depth (AOD).
A final intercomparison of the MIDAS DODs against those derived by Ridley et al. (2016) and Adebiyi et al. (2020), on a seasonal basis over the period 2004–2008, has been performed for 15 regions defined in Kok et al. (2021a) (see their Fig. 2b and Table 2). The obtained results are illustrated in Fig. 12. For the Southern Hemisphere regions (Figs. 12xiii, xiv, xv) as well as for North America (Fig. 12xii), MIDAS DODs are compared versus those from Adebiyi et al. (2020), while for the remaining 11 domains (Fig. 12i–xi) the results from Ridley et al. (2016) have been utilized. As an overview, it is noted that the seasonal cycle among the three databases is commonly reproduced, with a few exceptions (Mali–Niger, Kyzylkum, southern Africa), whereas the DOD uncertainties (represented by the error bars) are comparable. Regarding the magnitudes, MIDAS DODs are mainly somewhat lower than those of Ridley et al. (2016) across the dust belt in contrast to the outflow region of the mid-Atlantic (Fig. 12i). The obtained differences are mainly attributed to the consideration of different models for accounting for the non-dust portion, the different treatment of AODs (bias correction vs. quality filtering), the different versions of MODIS retrievals (C006 vs C061), the consideration of multi-satellite observations instead of relying only on MODIS-Aqua retrievals and to the different spatial scales (coarse vs. fine). In relative terms, the largest deviations are found in the desert areas of the Southern Hemisphere where models struggle to represent adequately the dust sources and the emitted amounts of mineral particles, thus affecting the dust fraction ratio provided by MERRA-2.
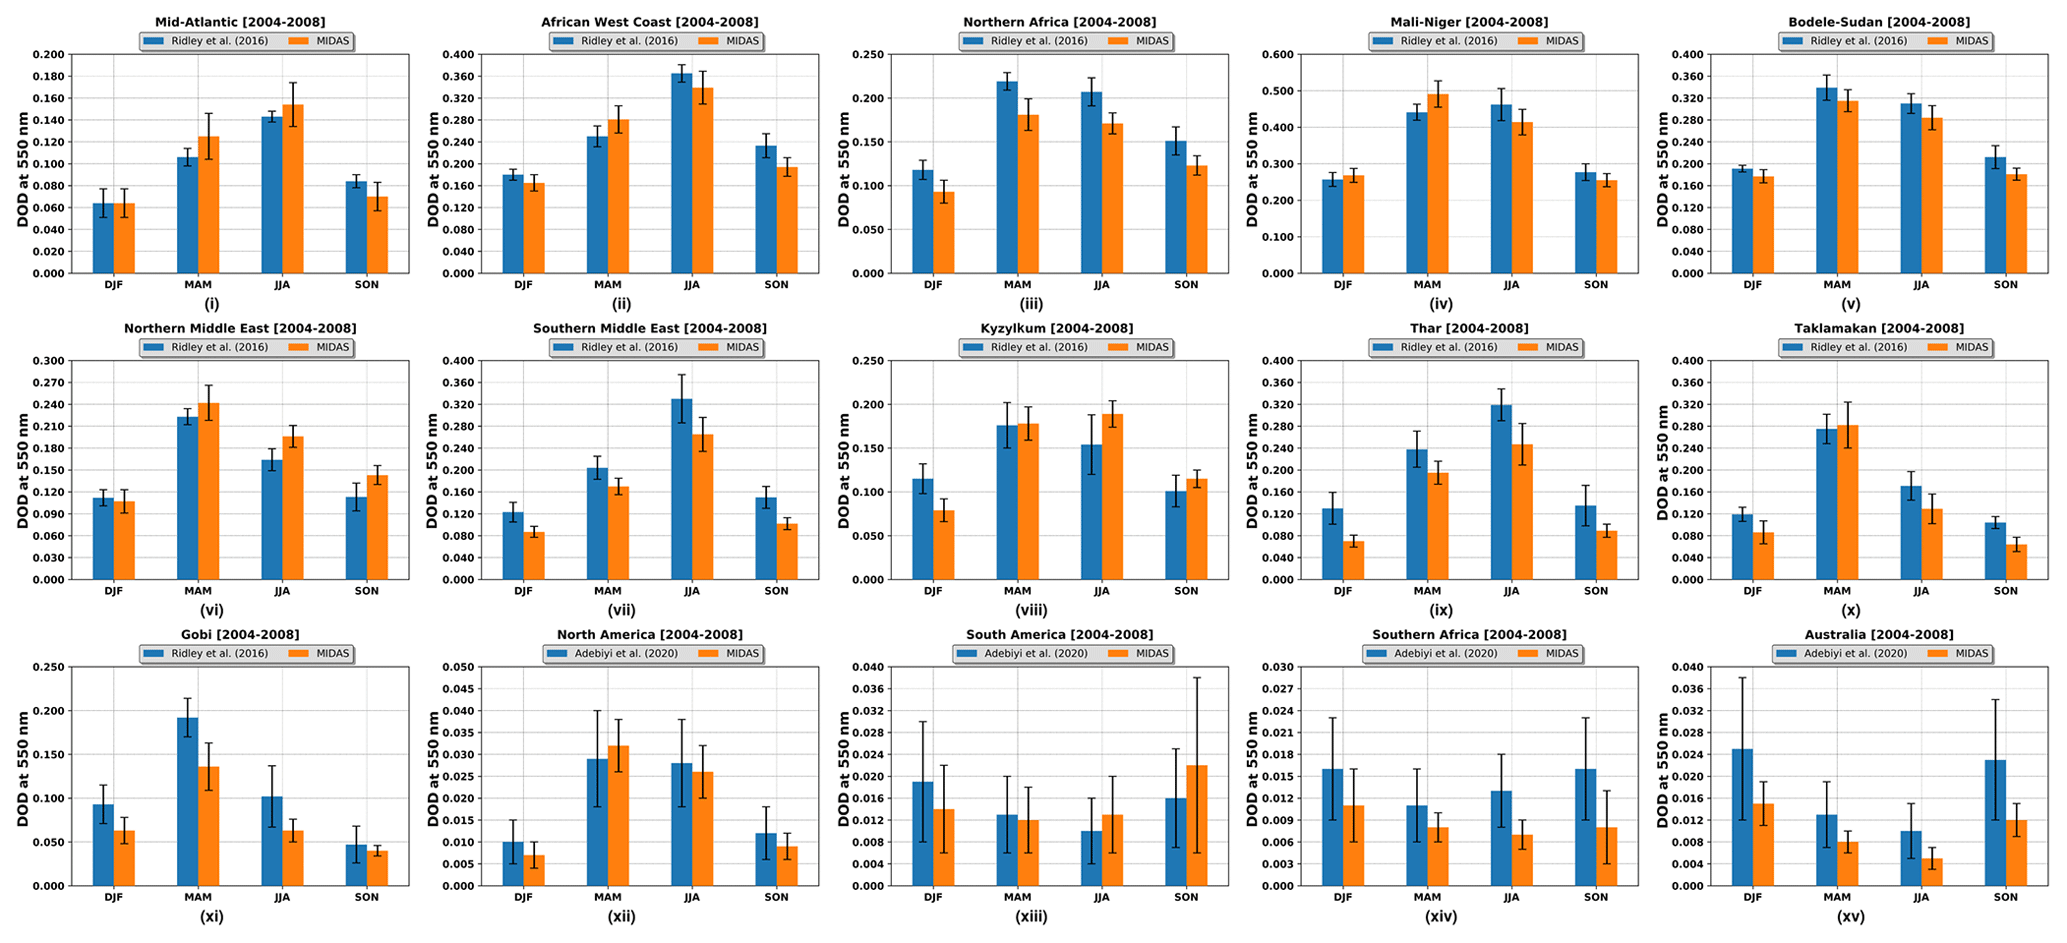
Figure 12Seasonal DODs, representative for the period 2004–2008, based on the MIDAS dataset (orange bars), Ridley et al. (2016) (blue bars) and Adebiyi et al. (2020) (blue bars), for 15 regions (their names are given at the top of each plot) defined in Kok et al. (2021a) (see Table 2). The error bars represent the estimated uncertainties. From (i) to (xi), the blue bars correspond to the Ridley et al. (2016) results, whereas for the remaining regions MIDAS DODs are compared against the corresponding levels obtained by Adebiyi et al. (2020).
The current study presents a scientific exploitation of the MIDAS dataset (Gkikas et al., 2021), which provides columnar mid-visible (550 nm) dust optical depth (DOD) at fine spatial resolution () and over a 15-year period (2003–2017). Taking advantage of the global coverage of the MIDAS DOD product, we analyzed the contribution of dust aerosols to AOD at various spatial and temporal scales. More specifically, we focused on nine regions that account for the majority of the global dust budget, encompassing sources and downwind areas with the main dust transport pathways. Such regions comprise the deserts extending across the dust belt, North America, Australia, South Africa, and South America as well as maritime areas (tropical Atlantic Ocean, Mediterranean, North Pacific Ocean) receiving constantly large amounts of mineral particles from the nearby deserts. As a further step, the interannual and intra-annual time series of DODs along with their contribution to the total aerosol load (AOD) were investigated at global, hemispherical and regional level.
According to our findings, the global long-term DOD average over the study period (2003–2017) is equal to 0.032±0.003, yielding a strong contrast between the contributions from the Northern Hemisphere (0.056±0.004) and Southern Hemisphere (0.008±0.001). Our global estimations are almost identical with those given by Ridley et al. (2016) and the CALIOP-derived estimate of Song et al. (2021), in contrast to the MODIS-based average reported in the latter study. Nevertheless, when the global averages are calculated separately over land (0.070±0.005) and ocean (0.019±0.002), our results differ substantially from those found in Voss and Evan (2020), who reported continental and maritime DODs equal to 0.100 and 0.030, respectively. Such large deviations are attributed to the different applied methodologies and averaging procedures followed. Moreover, we find very good agreement, in terms of DOD magnitude and uncertainty, in the MIDAS seasonal DODs versus those of Ridley et al. (2016) and Adebiyi et al. (2020) for 15 regions defined in Kok et al. (2021a). Considering that the long-term DOD averages can be utilized for constraining global dust in climate models or can be used in several other applications, a detailed analysis is required for enlightening the factors resulting in disagreements among studies. Likewise, our computed global DOD average resides around the middle of the AeroCom (Huneeus et al., 2011) limits, being higher than the median (0.023) and mean (0.028). However, in the model-based calculations the diurnal variability is taken into account in contrast to the satellite-based estimations relying on single-overpass measurements per day.
Regarding the dust contribution to the total aerosol optical depth, the DOD-to-AOD ratio from 32 % in the Northern Hemisphere drops down to 8 % in the Southern Hemisphere, while at a global scale it is about one-quarter (23 %). The contradiction found between the two hemispheres, both for DOD and dust fraction, is interpreted by the most pronounced dust activity recorded in the Bodélé Depression of the northern Lake Chad Basin (DODs up to ∼1.2), across the Sahel (DODs up to 0.8), in western parts of the Sahara Desert (DODs up to 0.6), in the eastern parts of the Arabian Peninsula (DODs up to ∼1), along the Indus River basin (DODs up to 0.8) and in the Taklamakan Desert (DODs up to ∼1). On the contrary, the weaker emission mechanisms triggering dust mobilization over the spatially limited sources of Patagonia, South Africa and interior arid areas of Australia do not favor the accumulation of mineral particles at large amounts (DODs up to 0.4 at local hotspots), even during high-dust seasons. Except for the Bodélé Depression, where the seasonal variability of the intense dust loads is relatively weak, in the other dust sources of the Northern Hemisphere, DODs exhibit a strong seasonal cycle with maximum levels either during boreal spring or summer and minimum in boreal winter.
Over oceans, the main pathways of long-range dust transport are observed along the tropical Atlantic and the northern Pacific, revealing a remarkable variation, within the course of the year, in terms of intensity, latitudinal position and range. Saharan dust plumes, reaching the Caribbean Sea in summer under the impact of the trade winds, are more abundant with respect to Asian dust, arriving at the western coasts of the United States in spring under the impact of midlatitude cyclones. Due to the convergence of the Shamal winds, blowing over the Arabian Peninsula, and the wind flow from the subtropical anticyclone, dust aerosols originating in the Middle East can reach the western Indian coasts in summer, crossing the Arabian Sea. Dust loads in the southern parts of the Red Sea are maximized during boreal summer when Saharan or Middle East dust is transported, depending on the zonal airflow. The intensity of dust burden in the Mediterranean forms a south–north gradient, whereas a seasonal longitudinal shift of the maximum DODs, off the northern African coasts, is evidently attributed to the prevailing synoptic circulation.
Despite the strong capabilities of the MIDAS dataset, we have also identified some limitations, thoroughly discussed here and in Gkikas et al. (2021), attributed either to inherent weaknesses of the raw MODIS AOD retrievals or to deficiencies of MDF, resulting in not-too-realistic patterns in specific regions (e.g., South America, Gulf of Guinea, Aral Sea) of the planet. Thanks to this detailed analysis, potential users are aware of any issue that may rise when utilizing the MIDAS DOD product.
Concerning the DOD uncertainties presented here, in the MIDAS dataset, MODIS AOD retrievals, obtained based on different assumptions in the respective algorithms, and MERRA-2 products are mixed. Therefore, the AOD and MDF errors, with combined DOD uncertainty and spatially and temporally averaged, are more likely heterogeneous and quite difficult to quantify. Actually, the evaluation of spaceborne retrievals and numerical outputs can be much more complex, and further work is definitely needed towards optimizing the confidence margins of total (speciated) optical depth levels. Accurately quantifying satellite-based aerosol uncertainties is still an open issue, and it is among our priorities to minimize the impacts of the aforementioned drawbacks and misrepresentations in the future versions of the MIDAS dataset.
As already mentioned, a variety of research studies can rely on the MIDAS dataset. MIDAS has been already used for the investigation of DOD trends (Logothetis et al., 2021), whereas in a follow-up study the mechanisms contributing to the temporal variations of dust burden will be investigated. Likewise, the MIDAS DOD product has been utilized in radiative transfer studies (Fountoulakis et al., 2021; Masoom et al., 2021) focusing on the impacts on solar energy production. Moreover, taking advantage of the fine spatial resolution of the MIDAS dataset and of its extended temporal availability, the dataset can be used for the identification of dust sources worldwide, similarly to the analysis done in Ginoux et al. (2012). Finally, we have provided a simple yet flexible method (independent from other datasets) to calculate consistent uncertainties across spatiotemporal scales, which will ease the use of the MIDAS dataset in data assimilation applications.
The MIDAS dataset has been developed in the framework of the DUST-GLASS project (grant no. 749461; European Union's Horizon 2020 research and innovation program under the Marie Skłodowska-Curie Actions) and is available at https://doi.org/10.5281/zenodo.4244106 (Gkikas et al., 2020).
The supplement related to this article is available online at: https://doi.org/10.5194/acp-22-3553-2022-supplement.
AG was responsible for the design of the study and the whole analysis, with support from SK and CPGP. EP, VA, EDT, EM, NH and JFK provided feedback on the performed analysis. All authors contributed to editing the paper. AG prepared the replies to the three anonymous reviewers, including feedback from SK, CPGP, JFK and EDT.
At least one of the (co-)authors is a member of the editorial board of Atmospheric Chemistry and Physics. The peer-review process was guided by an independent editor, and the authors also have no other competing interests to declare.
Publisher's note: Copernicus Publications remains neutral with regard to jurisdictional claims in published maps and institutional affiliations.
This article is part of the special issue “Dust aerosol measurements, modeling and multidisciplinary effects (AMT/ACP inter-journal SI)”. It is not associated with a conference.
Antonis Gkikas acknowledges support by the Hellenic Foundation for Research and Innovation (H.F.R.I.) under the 2nd Call for H.F.R.I. Research Projects to support Post-Doctoral Researchers (ATLANTAS, project number 544), as well as support from the European Union's Horizon 2020 research and innovation program under the Marie Skłodowska-Curie Actions (grant no. 749461; DUST-GLASS). Vassilis Amiridis acknowledges support from the European Research Council (grant no. 725698; D-TECT). Eleni Marinou was funded by a DLR VO-R young investigator group and the Deutscher Akademischer Austauschdienst (grant no. 57370121). Jasper F. Kok acknowledges support from National Science Foundation (NSF) grant 1552519. Carlos Pérez García-Pando acknowledges support from the European Research Council (grant no. 773051; FRAGMENT); the AXA Research Fund; and the Spanish Ministry of Science, Innovation and Universities (grant nos. RYC-2015-18690 and CGL2017-88911-R). The authors acknowledge support from the DustClim project as part of ERA4CS, an ERA-NET project initiated by JPI Climate and funded by FORMAS (SE), DLR (DE), BMWFW (AT), IFD (DK), MINECO (ES), and ANR (FR), with cofunding by the European Union (grant no. 690462). PRACE (Partnership for Advanced Computing in Europe) and RES (Red Española de Supercomputación) are acknowledged for awarding access to the MareNostrum Supercomputer in the Barcelona Supercomputing Center. We acknowledge support of this work by the PANhellenic infrastructure for Atmospheric Composition and climatE chAnge (PANACEA) project (grant no. MIS 5021516), which is implemented under the Horizon 2020 Action of Reinforcement of the Research and Innovation Infrastructure, funded by the Operational Programme Competitiveness, Entrepreneurship, and Innovation (NSRF 2014–2020) and cofinanced by Greece and the European Union (under the European Regional Development Fund). NOA members acknowledge support from the Stavros Niarchos Foundation (SNF). The authors acknowledge support by the COST Action InDust (grant no. CA16202), supported by COST (European Cooperation in Science and Technology). The authors would like to thank Andrew Mark Sayer for his valuable and constructive comments. The authors would like also to thank Thanasis Georgiou for developing the ftp server on which the MIDAS dataset is stored.
This research has been supported by the H2020 Marie Skłodowska-Curie Actions (grant no. 749461).
This paper was edited by Armin Sorooshian and reviewed by three anonymous referees.
Adebiyi, A. A., Kok, J. F., Wang, Y., Ito, A., Ridley, D. A., Nabat, P., and Zhao, C.: Dust Constraints from joint Observational-Modelling-experiMental analysis (DustCOMM): comparison with measurements and model simulations, Atmos. Chem. Phys., 20, 829–863, https://doi.org/10.5194/acp-20-829-2020, 2020.
Alam, K., Qureshi, S., and Blaschke, T.: Monitoring spatio-temporal aerosol patterns over Pakistan based on MODIS, TOMS and MISR satellite data and a HYSPLIT model, Atmos. Environ., 45, 4641–4651, 2011.
Alizadeh Choobari, O., Zawar-Reza, P., and Sturman, A.: Atmospheric forcing of the three-dimensional distribution of dust particles over Australia: A case study, J. Geophys. Res., 117, D11206, https://doi.org/10.1029/2012JD017748, 2012.
Alizadeh-Choobari, O., Zawar-Reza, P., Sturman, A.: The “wind of 120 days” and dust storm activity over the Sistan Basin, Atmos. Res., 143, 328–341, 2014.
Amiridis, V., Wandinger, U., Marinou, E., Giannakaki, E., Tsekeri, A., Basart, S., Kazadzis, S., Gkikas, A., Taylor, M., Baldasano, J., and Ansmann, A.: Optimizing CALIPSO Saharan dust retrievals, Atmos. Chem. Phys., 13, 12089–12106, https://doi.org/10.5194/acp-13-12089-2013, 2013.
Amiridis, V., Marinou, E., Tsekeri, A., Wandinger, U., Schwarz, A., Giannakaki, E., Mamouri, R., Kokkalis, P., Binietoglou, I., Solomos, S., Herekakis, T., Kazadzis, S., Gerasopoulos, E., Proestakis, E., Kottas, M., Balis, D., Papayannis, A., Kontoes, C., Kourtidis, K., Papagiannopoulos, N., Mona, L., Pappalardo, G., Le Rille, O., and Ansmann, A.: LIVAS: a 3-D multi-wavelength aerosol/cloud database based on CALIPSO and EARLINET, Atmos. Chem. Phys., 15, 7127–7153, https://doi.org/10.5194/acp-15-7127-2015, 2015.
Baddock, M. C., Ginoux, P., Bullard, J. E., and Gill, T. E.: Do MODIS-defined dust sources have a geomorphological signature?, Geophys. Res. Lett., 43, GL067327, https://doi.org/10.1002/2015GL067327, 2016.
Banks, J. R., Brindley, H. E., Stenchikov, G., and Schepanski, K.: Satellite retrievals of dust aerosol over the Red Sea and the Persian Gulf (2005–2015), Atmos. Chem. Phys., 17, 3987–4003, https://doi.org/10.5194/acp-17-3987-2017, 2017.
Basile, I., Grousset, F. E., Revel, M., Petit, J.-R., Biscaye, P. E., and Barkov, N. I.: Patagonian origin of glacial dust deposited in East Antarctica (Vostok and Dome C) during glacial stages 2, 4 and 6, Earth Planet. Sc. Lett., 146, 573–589, 1997.
Brindley, H., Osipov, S., Bantges, R., Smirnov, A., Banks, J., Levy, R., Jish Prakash, P., and Stenchikov, G.: An assessment of the quality of aerosol retrievals over the Red Sea and evaluation of the climatological cloud-free dust direct radiative effect in the region, J. Geophys. Res.-Atmos., 120, 10862–10878, https://doi.org/10.1002/2015JD023282, 2015.
Bryant, R. G., Bigg, G. R., Mahowald, N. M., Eckardt, F. D., and Ross S. G.: Dust emission response to climate in southern Africa, J. Geophys. Res., 112, D09207, https://doi.org/10.1029/2005JD007025, 2007.
Bullard, J., Baddock, M., McTainsh, G. H., and Leys, J. F.: Subbasin scale dust source geomorphology detected using MODIS, Geophys. Res. Lett., 35, L15404, https://doi.org/10.1029/2008GL033928, 2008.
Bullard, J. E. and Austin, M. J.: Dust generation on a proglacial floodplain, West Greenland, Aeolian Res., 3, 43–54, https://doi.org/10.1016/j.aeolia.2011.01.002, 2011.
Bullard, J. E., Baddock, M., Bradwell, T., Crusius, J., Darlington, E., Gaiero, D., Gassó, S., Gisladottir, G., Hodgkins, R., McCulloch, R., McKenna-Neuman, C., Mockford, T., Stewart, H., and Thorsteinsson, T.: High-latitude dust in the Earth system, Rev. Geophys., 54, 447–485, https://doi.org/10.1002/2016RG000518, 2016.
de Leeuw, G., Sogacheva, L., Rodriguez, E., Kourtidis, K., Georgoulias, A. K., Alexandri, G., Amiridis, V., Proestakis, E., Marinou, E., Xue, Y., and van der A, R.: Two decades of satellite observations of AOD over mainland China using ATSR-2, AATSR and MODIS/Terra: data set evaluation and large-scale patterns, Atmos. Chem. Phys., 18, 1573–1592, https://doi.org/10.5194/acp-18-1573-2018, 2018.
Dey, S. and Di Girolamo, L.: A climatology of aerosol optical and microphysical properties over the Indian subcontinent from 9 years (2000–2008) of Multiangle Imaging Spectroradiometer (MISR) data, J. Geophys. Res.-Atmos., 115, D15204, https://doi.org/10.1029/2009JD013395, 2010.
Dey, S., Tripathi, S. N., Singh, R. P., and Holben, B. N.: Influence of dust storms on the aerosol optical properties over the Indo-Gangetic basin, J. Geophys. Res.-Atmos., 109, 1–10, https://doi.org/10.1029/2004jd004924, 2004.
Doherty, O. M., Riemer, N., and Hameed, S.: Control of Saharan mineral dust transport to Barbados in winter by the Intertropical Convergence Zone over West Africa: Winter dust in Barbados and the ITCZ, J. Geophys. Res.-Atmos., 117, D19117, https://doi.org/10.1029/2012JD017767, 2012.
Du, Y., Xu, X., Chu, M., Guo, Y., and Wang, J.: Air particulate matter and cardiovascular disease: the epidemiological, biomedical and clinical evidence, J. Thorac. Dis., 8, E8, https://doi.org/10.3978/j.issn.2072-1439.2015.11.37, 2016.
Eck, T. F., Holben, B. N., Sinyuk, A., Pinker, R. T., Goloub, P., Chen, H., Chatenet, B., Li, Z., Singh, R. P., and Tripathi, S. N.: Climatological aspects of the optical properties of fine/coarse mode aerosol mixtures, J. Geophys. Res.-Atmos., 115, 19205, https://doi.org/10.1029/2010JD014002, 2010.
Eckardt, F. D. and Kuring, N.: SeaWiFS identifies dust sources in the Namib Desert, Int. J. Remote Sens., 26, 4159–4167, 2005.
Eguchi, K., Uno, I., Yumimoto, K., Takemura, T., Shimizu, A., Sugimoto, N., and Liu, Z.: Trans-pacific dust transport: integrated analysis of NASA/CALIPSO and a global aerosol transport model, Atmos. Chem. Phys., 9, 3137–3145, https://doi.org/10.5194/acp-9-3137-2009, 2009.
Elguindi, N., Solmon, F., and Turuncoglu, U.: Quantifying some of the impacts of dust and other aerosol on the Caspian Sea region using a regional climate model, Clim. Dynam, 46, 41–55, 2016.
Fiedler, S., Schepanski, K., Heinold, B., Knippertz, P., and Tegen, I.: Climatology of nocturnal low-level jets over North Africa and implications for modeling mineral dust emission, J. Geophys. Res.-Atmos., 118, 6100–6121, 2013.
Flaounas, E., Kotroni, V., Lagouvardos, K., Kazadzis, S., Gkikas, A., and Hatzianastassiou, N.: Cyclone contribution to dust transport over the Mediterranean region, Atmos. Sci. Lett., 16, 473–478, https://doi.org/10.1002/asl.584, 2015.
Foth, A., Kanitz, T., Engelmann, R., Baars, H., Radenz, M., Seifert, P., Barja, B., Fromm, M., Kalesse, H., and Ansmann, A.: Vertical aerosol distribution in the southern hemispheric midlatitudes as observed with lidar in Punta Arenas, Chile (53.2∘ S and 70.9∘ W), during ALPACA, Atmos. Chem. Phys., 19, 6217–6233, https://doi.org/10.5194/acp-19-6217-2019, 2019.
Fountoulakis, I., Kosmopoulos, P., Papachristopoulou, K., Raptis, I.-P., Mamouri, R.-E., Nisantzi, A., Gkikas, A., Witthuhn, J., Bley, S., Moustaka, A., Buehl, J., Seifert, P., Hadjimitsis, D. G., Kontoes, C., and Kazadzis, S.: Effects of Aerosols and Clouds on the Levels of Surface Solar Radiation and Solar Energy in Cyprus, Remote Sens., 13, 2319, https://doi.org/10.3390/rs13122319, 2021.
Gassó, S. and Stein, A. F.: Does dust from Patagonia reach the sub-Antarctic Atlantic Ocean?, Geophys. Res. Lett., 34, L01801, https://doi.org/10.1029/2006GL027693, 2007.
Gassó, S. and Torres, O.: Temporal characterization of dust activity in the Central Patagonia desert (years 1964–2017), J. Geophys. Res.-Atmos., 124, 3417–3434, https://doi.org/10.1029/2018JD030209, 2019.
Gassó, S., Stein, A., Marino, F., Castellano, E., Udisti, R., and Ceratto, J.: A combined observational and modeling approach to study modern dust transport from the Patagonia desert to East Antarctica, Atmos. Chem. Phys., 10, 8287–8303, https://doi.org/10.5194/acp-10-8287-2010, 2010.
Ge, J. M., Huang, J. P., Xu, C. P., Qi, Y. L., and Liu, H. Y.: Characteristics of Taklimakan dust emission and distribution: a satellite and reanalysis field perspective, J. Geophys. Res.-Atmos., 119, 11772–11783, https://doi.org/10.1002/2014JD022280, 2014.
Gelaro, R, McCarty, W., Suárez, M. J., Todling, R., Molod, A., Takacs, L., Randles, C. A., Darmenov, A., Bosilovich, M. G., Reichle, R., Wargan, K., Coy, L., Cullather, R., Draper, C., Akella, S., Buchard, V., Conaty, A., da Silva, A. M., Gu, W., Kim, G., Koster, R., Lucchesi, R., Merkova, D., Nielsen, J. E., Partyka, G., Pawson, S., Putman, W., Rienecker, M., Schubert, S. D., Sienkiewicz, M., and Zhao, B.: The Modern-Era Retrospective Analysis for Research and Applications, Version 2 (MERRA-2), J. Climate, 30, 5419–5454, https://doi.org/10.1175/JCLI-D-16-0758.1, 2017.
Giannakopoulou, E. M. and Toumi, R.: The Persian Gulf summertime low-level jet over sloping terrain, Q. J. Roy. Meteor. Soc., 138, 145–157, https://doi.org/10.1002/qj.901, 2011.
Gkikas, A., Proestakis, E., Amiridis, V., Kazadzis, S., Di Tomaso, E., Tsekeri, A., Marinou, E., Hatzianastassiou, N., and García-Pando, C. P.: ModIs Dust AeroSol (MIDAS), Zenodo [data set], https://doi.org/10.5281/zenodo.4244106, 2020.
Gill, T. E.: Eolian sediments generated by anthropogenic disturbance of playas: human impacts on the geomorphic system and geomorphic impacts on the human system, Geomorphology, 17, 207–228, 1996.
Ginoux, P., Prospero, J. M., Torres, O., and Chin, M.: Longterm simulation of global dust distribution with the GOCART model: correlation with North Atlantic Oscillation, Environ. Modell. Softw., 19, 113–128, https://doi.org/10.1016/S1364-8152(03)00114-2, 2004.
Ginoux, P., Prospero, J. M., Gill, T. E., Hsu, N. C., and Zhao, M.: Global-scale attribution of anthropogenic and natural dust sources and their emission rates based on MODIS Deep Blue aerosol products, Rev. Geophys., 50, RG3005, https://doi.org/10.1029/2012RG000388, 2012.
Gkikas, A., Hatzianastassiou, N., Mihalopoulos, N., Katsoulis, V., Kazadzis, S., Pey, J., Querol, X., and Torres, O.: The regime of intense desert dust episodes in the Mediterranean based on contemporary satellite observations and ground measurements, Atmos. Chem. Phys., 13, 12135–12154, https://doi.org/10.5194/acp-13-12135-2013, 2013.
Gkikas, A., Houssos, E. E., Lolis, C. J., Bartzokas, A., Mihalopoulos, N., and Hatzianastassiou, N.: Atmospheric circulation evolution related to desert-dust episodes over the Mediterranean, Q. J. Roy. Meteor. Soc., 141, 1634–1645, https://doi.org/10.1002/qj.2466, 2015.
Gkikas, A., Basart, S., Hatzianastassiou, N., Marinou, E., Amiridis, V., Kazadzis, S., Pey, J., Querol, X., Jorba, O., Gassó, S., and Baldasano, J. M.: Mediterranean intense desert dust outbreaks and their vertical structure based on remote sensing data, Atmos. Chem. Phys., 16, 8609–8642, https://doi.org/10.5194/acp-16-8609-2016, 2016.
Gkikas, A., Obiso, V., Pérez García-Pando, C., Jorba, O., Hatzianastassiou, N., Vendrell, L., Basart, S., Solomos, S., Gassó, S., and Baldasano, J. M.: Direct radiative effects during intense Mediterranean desert dust outbreaks, Atmos. Chem. Phys., 18, 8757–8787, https://doi.org/10.5194/acp-18-8757-2018, 2018.
Gkikas, A., Giannaros, T. M., Kotroni, V., and Lagouvardos, K.: Assessing the radiative impacts of an extreme desert dust outbreak and the potential improvements on short-term weather forecasts: The case of February 2015, Atmos. Res., 226, 152–170, https://doi.org/10.1016/j.atmosres.2019.04.020, 2019.
Gkikas, A., Proestakis, E., Amiridis, V., Kazadzis, S., Di Tomaso, E., Tsekeri, A., Marinou, E., Hatzianastassiou, N., and Pérez García-Pando, C.: ModIs Dust AeroSol (MIDAS): a global fine-resolution dust optical depth data set, Atmos. Meas. Tech., 14, 309–334, https://doi.org/10.5194/amt-14-309-2021, 2021.
Gliß, J., Mortier, A., Schulz, M., Andrews, E., Balkanski, Y., Bauer, S. E., Benedictow, A. M. K., Bian, H., Checa-Garcia, R., Chin, M., Ginoux, P., Griesfeller, J. J., Heckel, A., Kipling, Z., Kirkevåg, A., Kokkola, H., Laj, P., Le Sager, P., Lund, M. T., Lund Myhre, C., Matsui, H., Myhre, G., Neubauer, D., van Noije, T., North, P., Olivié, D. J. L., Rémy, S., Sogacheva, L., Takemura, T., Tsigaridis, K., and Tsyro, S. G.: AeroCom phase III multi-model evaluation of the aerosol life cycle and optical properties using ground- and space-based remote sensing as well as surface in situ observations, Atmos. Chem. Phys., 21, 87–128, https://doi.org/10.5194/acp-21-87-2021, 2021.
Hamidi, M., Kavianpour, M. R., and Shao, Y.: Synoptic analysis of dust storms in the Middle East, Asia-Pac, J. Atmos. Sci., 49, 279–286, 2013.
Hand, J. L., Gill, T. E., and Schichtel, B. A.: Spatial and seasonal variability in fine mineral dust and coarse aerosol mass at re-mote sites across the United States, J. Geophys. Res.-Atmos., 122, 3080–3097, https://doi.org/10.1002/2016jd026290, 2017.
Haywood, J. and Boucher, O.: Estimates of the direct and indirect radiative forcing due to tropospheric aerosols: A review, Rev. Geophys., 38, 513–543, https://doi.org/10.1029/1999RG000078, 2000.
Huang, J., Lin, B., Minnis, P., Wang, T., Wang, X., Hu, Y., Yi, Y., and Ayers, J. K.: Satellite-based assessment of possible dust aerosols semi-direct effect on cloud water path over East Asia, Geophys. Res. Lett., 33, L19802, https://doi.org/10.1029/2006GL026561, 2006.
Huneeus, N., Schulz, M., Balkanski, Y., Griesfeller, J., Prospero, J., Kinne, S., Bauer, S., Boucher, O., Chin, M., Dentener, F., Diehl, T., Easter, R., Fillmore, D., Ghan, S., Ginoux, P., Grini, A., Horowitz, L., Koch, D., Krol, M. C., Landing, W., Liu, X., Mahowald, N., Miller, R., Morcrette, J.-J., Myhre, G., Penner, J., Perlwitz, J., Stier, P., Takemura, T., and Zender, C. S.: Global dust model intercomparison in AeroCom phase I, Atmos. Chem. Phys., 11, 7781–7816, https://doi.org/10.5194/acp-11-7781-2011, 2011.
Husar, R. B., Tratt, D. M., Schichtel, D. M., Falke, S. R., Li, F., Jaffe, D., Gassó, S., Gill, T., Laulainen, N. S., Lu, F., Reheis, M. C., Chun, Y., Westphal, D., Holben, B. N., Gueymard, C., McKendry, I., Kuring, N., Feldman, G. C., McClain, C., Frouin, R. J., Merrill, J., DuBois, D., Vignola, F., Murayama, T., Nickovic, S., Wilson, W. E., Sassen, K., Sugimoto, N., and Malm, W. C.: Asian dust events of April 1998, J. Geophys. Res., 106, 18317–18330, https://doi.org/10.1029/2000JD900788, 2001.
Indoitu, R., Kozhoridze, G., Batyrbaeva, M., Vitkovskaya, I., Orlovsky, N., Blumberg, D., and Orlovsky, L.: Dust emission and environmental changes in the dried bottom of the Aral Sea, Aeolian. Res., 17, 101–115, https://doi.org/10.1016/j.aeolia.2015.02.004, 2015.
Jickells, T., Boyd, P., and Hunter, K.: Biogeochemical impacts of dust on the global carbon cycle, in: Mineral Dust, edited by: Knippertz, P. and Stuut, J.-B. W., Springer, the Netherlands, 359–384, ISBN 978-94-017-8977-6, https://doi.org/10.1007/978-94-017-8978-3, 2014.
Jickells, T. D., An, Z. S., Andersen, K. K., Baker, A. R., Bergametti, G., Brooks, N., Cao, J. J., Boyd, P. W., Duce, R. A., Hunter, K. A., Kawahata, H., Kubilay, N., laRoche, J., Liss, P. S., Mahowald, N., Prospero, J. M., Ridgwell, A. J., Tegen, I., and Torres, R.: Global iron connections between desert dust, ocean biogeochemistry, and climate, Science, 308, 67–71, 2005.
Jin, Q., Wei, J., Pu, B., Yang, Z.-L., and Parajuli, S. P.: High summertime aerosol loadings over the Arabian Sea and their transport pathways, J. Geophys. Res.-Atmos., 123, 10568–10590, https://doi.org/10.1029/2018JD028588, 2018.
Johnson, M. S., Meskhidze, N., Kiliyanpilakkil, V. P., and Gassó, S.: Understanding the transport of Patagonian dust and its influence on marine biological activity in the South Atlantic Ocean, Atmos. Chem. Phys., 11, 2487–2502, https://doi.org/10.5194/acp-11-2487-2011, 2011.
Kanakidou, M., Mihalopoulos, N., Kindap, T., Im, U., Vrekoussis, M., Gerasopoulos, E., Dermitzaki, E., Unal, A., Kocak, M., Markakis, K., Melas, D., Kouvarakis, G., Youssef, A. F., Richter, A., Hatzianastassiou, N., Hilboll, A., Ebojie, F., Wittrock, F., von Savigny, C., Burrows, J. P., Ladstaetter-Weissenmayer, A., and Moubasher, H.: Megacities as hot spots of air pollution in the East Mediterranean, Atmos. Environ., 45, 1223–1235, https://doi.org/10.1016/j.atmosenv.2010.11.048, 2011.
Kanatani, K. T., Ito, I., Al-Delaimy, W. K., Adachi, Y., Mathews, W. C., and Ramsdell, J. W.: Toyama Asian Desert Dust and Asthma Study Group Members. Desert dust exposure is associated with increased risk of asthma hospitalization in children, Am. J. Respir. Crit. Care Med., 182, 1475e1481, https://doi.org/10.1164/rccm.201002-0296OC, 2010.
Kinne, S., Schulz, M., Textor, C., Guibert, S., Balkanski, Y., Bauer, S. E., Berntsen, T., Berglen, T. F., Boucher, O., Chin, M., Collins, W., Dentener, F., Diehl, T., Easter, R., Feichter, J., Fillmore, D., Ghan, S., Ginoux, P., Gong, S., Grini, A., Hendricks, J., Herzog, M., Horowitz, L., Isaksen, I., Iversen, T., Kirkevåg, A., Kloster, S., Koch, D., Kristjansson, J. E., Krol, M., Lauer, A., Lamarque, J. F., Lesins, G., Liu, X., Lohmann, U., Montanaro, V., Myhre, G., Penner, J., Pitari, G., Reddy, S., Seland, O., Stier, P., Takemura, T., and Tie, X.: An AeroCom initial assessment – optical properties in aerosol component modules of global models, Atmos. Chem. Phys., 6, 1815–1834, https://doi.org/10.5194/acp-6-1815-2006, 2006.
Klose, M., Shao, Y., Karremann, M. K., and Fink, A.: Sahel dust zone and synoptic background, Geophys. Res. Lett., 37, L09802, https://doi.org/10.1029/2010GL042816, 2010.
Knight, A. W., McTainsh, G. H., and Simpson, R. W.: Sediment loads in an Australian dust storm – Implications for present and past dust processes, Catena, 24, 195–213, https://doi.org/10.1016/0341-8162(95)00026-O, 1995.
Knippertz, P. and Todd, M. C.: Mineral Dust Aerosols over the Sahara: Meteorological Controls on Emission and Transport and Implications for Modeling, Rev. Geophys., 50, RG1007, https://doi.org/10.1029/2011RG000362, 2012.
Knippertz, P., Deutscher, C., Kandler, K., Müller, T., Schulz, O., and Schütz, L.: Dust mobilization due to density currents in the Atlas region: Observations from the Saharan Mineral Dust Experiment 2006 field campaign, J. Geophys. Res.-Atmos., 112, 1–14, https://doi.org/10.1029/2007JD008774, 2007.
Knippertz, P., Evans, M., Field, P. R., Fink, A. H., Liousse, C., and Marsham, J. H.: The possible role of local air pollution in climate change in West Africa, Nat. Clim. Chang., 5, 815–822, https://doi.org/10.1038/NCLIMATE2727, 2015.
Koch, J. and Renno, N. O.: The role of convective plumes and vortices on the global aerosol budget, Geophys. Res. Lett., 32, L18806, https://doi.org/10.1029/2005GL023420, 2005.
Kok, J. F., Adebiyi, A. A., Albani, S., Balkanski, Y., Checa-Garcia, R., Chin, M., Colarco, P. R., Hamilton, D. S., Huang, Y., Ito, A., Klose, M., Leung, D. M., Li, L., Mahowald, N. M., Miller, R. L., Obiso, V., Pérez García-Pando, C., Rocha-Lima, A., Wan, J. S., and Whicker, C. A.: Improved representation of the global dust cycle using observational constraints on dust properties and abundance, Atmos. Chem. Phys., 21, 8127–8167, https://doi.org/10.5194/acp-21-8127-2021, 2021a.
Kok, J. F., Adebiyi, A. A., Albani, S., Balkanski, Y., Checa-Garcia, R., Chin, M., Colarco, P. R., Hamilton, D. S., Huang, Y., Ito, A., Klose, M., Li, L., Mahowald, N. M., Miller, R. L., Obiso, V., Pérez García-Pando, C., Rocha-Lima, A., and Wan, J. S.: Contribution of the world's main dust source regions to the global cycle of desert dust, Atmos. Chem. Phys., 21, 8169–8193, https://doi.org/10.5194/acp-21-8169-2021, 2021b.
Koren, I., Yoram, J. K., Richard, W., Martin, C. T., Yinon, R., Martins., J. V., and Daniel, R.: The Bodélé depression: a single spot in the Sahara that provides most of the mineral dust to the Amazon forest, Environ. Res. Lett., 1, 014005, https://doi.org/10.1088/1748-9326/1/1/014005, 2006.
Kosmopoulos, P.G., Kazadzis, S., El-Askary, H., Taylor, M., Gkikas, A., Proestakis, E., Kontoes, C., and El-Khayat, M. M.: Earth-Observation-Based Estimation and Forecasting of Particulate Matter Impact on Solar Energy in Egypt, Remote Sens., 10, 1870, https://doi.org/10.3390/rs10121870, 2018.
Lambert, F., Kug, J.-S., Park, R. J., Mahowald, N., Winckler, G., Abe-Ouchi, A., O'ishi, R., Takemura, T., and Lee, J.-H.: The role of mineral-dust aerosols in polar temperature amplification, Nat. Clim. Change, 3, 487–491, https://doi.org/10.1038/nclimate1785, 2013.
Levy, R. C., Leptoukh, G. G., Kahn, R., Zubko, V., Gopalan, A., and Remer, L. A.: A critical look at deriving monthly aerosol optical depth from satellite data, IEEE T. Geosci. Remote, 47, 2942–2956, https://doi.org/10.1109/TGRS.2009.2013842, 2009.
Levy, R. C., Remer, L. A., Kleidman, R. G., Mattoo, S., Ichoku, C., Kahn, R., and Eck, T. F.: Global evaluation of the Collection 5 MODIS dark-target aerosol products over land, Atmos. Chem. Phys., 10, 10399–10420, https://doi.org/10.5194/acp-10-10399-2010, 2010.
Levy, R. C., Mattoo, S., Munchak, L. A., Remer, L. A., Sayer, A. M., Patadia, F., and Hsu, N. C.: The Collection 6 MODIS aerosol products over land and ocean, Atmos. Meas. Tech., 6, 2989–3034, https://doi.org/10.5194/amt-6-2989-2013, 2013.
Li, L. and Sokolik, I.: Analysis of Dust Aerosol Retrievals Using Satellite Data in Central Asia, Atmosphere, 9, 288, https://doi.org/10.3390/atmos9080288, 2018.
Liu, D., Wang, Z., Liu, Z., Winker, D., and Trepte, C.: A height resolved global view of dust aerosols from the first year CALIPSO lidar measurements, J. Geophys. Res.-Atmos., 113, D16214, https://doi.org/10.1029/2007JD009776, 2008.
Logothetis, S.-A., Salamalikis, V., Gkikas, A., Kazadzis, S., Amiridis, V., and Kazantzidis, A.: 15-year variability of desert dust optical depth on global and regional scales, Atmos. Chem. Phys., 21, 16499–16529, https://doi.org/10.5194/acp-21-16499-2021, 2021.
Mahowald, N. M. and Luo, C.: A less dusty future?, Geophys. Res. Lett., 30, 1903, https://doi.org/10.1029/2003GL017880, 2003.
Marinou, E., Amiridis, V., Binietoglou, I., Tsikerdekis, A., Solomos, S., Proestakis, E., Konsta, D., Papagiannopoulos, N., Tsekeri, A., Vlastou, G., Zanis, P., Balis, D., Wandinger, U., and Ansmann, A.: Three-dimensional evolution of Saharan dust transport towards Europe based on a 9-year EARLINET-optimized CALIPSO dataset, Atmos. Chem. Phys., 17, 5893–5919, https://doi.org/10.5194/acp-17-5893-2017, 2017.
Masoom, A., Kosmopoulos, P., Bansal, A., Gkikas, A., Proestakis, E., Kazadzis, S., and Amiridis, V.: Forecasting dust impact on solar energy using remote sensing and modeling techniques, Sol. Energy, 228, 317–332, https://doi.org/10.1016/j.solener.2021.09.033, 2021.
Mazzonia, E. and Vazquez, M.: Desertification in Patagonia, in: Natural hazards and human-exacerbated disasters in Latin America, edited by: Latrubesse, E. M., 13, 351–377, Elsevier, https://doi.org/10.1016/S0928-2025(08)10017-7, 2009.
McConnell, J. R., Aristarain, A. J., Banta, J. R., Edwards, P. R., and Simões, J. C.: 20th-century doubling in dust archived in an Antarctic Peninsula ice core parallels climate change and desertification in South America, P. Natl. Acad. Sci. USA, 104, 5743–5748, 2007.
Micklin, P.: The Aral Sea disaster, Annu. Rev. Earth Planet. Sci., 35, 47–72, 2007.
Middleton, N. J.: Dust storms in the Middle East, J. Arid Environ., 10, 83–96, 1986.
Middleton, H. J.: Desert dust hazards: A global review, Aeolian Res., 24, 53–63, 2017.
Middleton, N. J. and Goudie, A. S.: Saharan dust: sources and trajectories, T. I. Brit. Geogr., 26, 165–181, https://doi.org/10.1111/1475- 5661.00013, 2001.
Middleton, N. J. and Kang, U.: Sand and dust storms: impact mitigation, Sustainability, 9, 1053, https://doi.org/10.3390/su9061053, 2017.
Mitchell, R. M., Forgan, B. W., and Campbell, S. K.: The Climatology of Australian Aerosol, Atmos. Chem. Phys., 17, 5131–5154, https://doi.org/10.5194/acp-17-5131-2017, 2017.
Moran-Zuloaga, D., Ditas, F., Walter, D., Saturno, J., Brito, J., Carbone, S., Chi, X., Hrabě de Angelis, I., Baars, H., Godoi, R. H. M., Heese, B., Holanda, B. A., Lavrič, J. V., Martin, S. T., Ming, J., Pöhlker, M. L., Ruckteschler, N., Su, H., Wang, Y., Wang, Q., Wang, Z., Weber, B., Wolff, S., Artaxo, P., Pöschl, U., Andreae, M. O., and Pöhlker, C.: Long-term study on coarse mode aerosols in the Amazon rain forest with the frequent intrusion of Saharan dust plumes, Atmos. Chem. Phys., 18, 10055–10088, https://doi.org/10.5194/acp-18-10055-2018, 2018.
Nabat, P., Somot, S., Mallet, M., Michou, M., Sevault, F., Driouech, F., Meloni, D., di Sarra, A., Di Biagio, C., Formenti, P., Sicard, M., Léon, J.-F., and Bouin, M.-N.: Dust aerosol radiative effects during summer 2012 simulated with a coupled regional aerosol–atmosphere–ocean model over the Mediterranean, Atmos. Chem. Phys., 15, 3303–3326, https://doi.org/10.5194/acp-15-3303-2015, 2015.
Okin, G. S., Mahowald, N., Chadwick, O. A., and Artaxo, P.: Impact of desert dust on the biogeochemistry of phosphorus in terrestrial ecosystems, Global Biogeochem. Cy., 18, GB2005, https://doi.org/10.1029/2003GB002145, 2004.
Pease, P. P., Tchakerian, V. P., and Tindale, N. W.: Aerosols over the Arabian Sea: geochemistry and source areas for Aeolian desert dust, J. Arid Environ., 39, 477–496, https://doi.org/10.1006/jare.1997.0368, 1998.
Pérez, C., Nickovic, S., Pejanovic, G., Baldasano, J. M., and Özsoy, E.: Interactive dust-radiation modeling: A step to improve weather forecasts, J. Geophys. Res., 111, 1–17, 2006.
Pérez García-Pando, C., Stanton, M. C., Diggle, P. J., Trzaska, S., Miller, R. L., Perlwitz, J. P., Baldasano, J. M., Cuevas, E., Ceccato, P., Yaka, P., and Thomson, M. C.: Soil Dust Aerosols and Wind as Predictors of Seasonal Meningitis Incidence in Niger, Environ. Health Perspect., 122, 679–686, https://doi.org/10.1289/ehp.1306640, 2014a.
Pérez García-Pando, C., Thomson, M. C., Stanton, M., Diggle, P., Hopson, T., Pandya, R., and Miller, R. L.: Meningitis and climate: From science to practice, Earth Perspect., 1, 14, https://doi.org/10.1186/2194-6434-1-14, 2014b.
Peyridieu, S., Chédin, A., Capelle, V., Tsamalis, C., Pierangelo, C., Armante, R., Crevoisier, C., Crépeau, L., Siméon, M., Ducos, F., and Scott, N. A.: Characterisation of dust aerosols in the infrared from IASI and comparison with PARASOL, MODIS, MISR, CALIOP, and AERONET observations, Atmos. Chem. Phys., 13, 6065–6082, https://doi.org/10.5194/acp-13-6065-2013, 2013.
Piketh, S., Annegarn, H., and Tyson, P.: Lower tropospheric aerosol loadings over South Africa: the relative contribution of aeolian dust, industrial emissions, and biomass burning, J. Geophys. Res., 104, 1597–1607, 1999.
Prasad, A. K. and Singh, R. P.: Changes in aerosol parameters during major dust storm events (2001–2005) over the Indo-Gangetic Plains using AERONET and MODIS data, J. Geophys. Res.-Atmos., 112, D09208, https://doi.org/10.1029/2006JD007778, 2007.
Prasad, A. K., Singh, S., Chauhan, S., Srivastava, M. K., Singh, R. P., and Singh, R.: Aerosol radiative forcing over the IndoGangetic plains during major dust storms, Atmos. Environ., 41, 6289–6301, https://doi.org/10.1016/j.atmosenv.2007.03.060, 2007.
Proestakis, E., Amiridis, V., Marinou, E., Georgoulias, A. K., Solomos, S., Kazadzis, S., Chimot, J., Che, H., Alexandri, G., Binietoglou, I., Daskalopoulou, V., Kourtidis, K. A., de Leeuw, G., and van der A, R. J.: Nine-year spatial and temporal evolution of desert dust aerosols over South and East Asia as revealed by CALIOP, Atmos. Chem. Phys., 18, 1337–1362, https://doi.org/10.5194/acp-18-1337-2018, 2018.
Prospero, J. M.: Long-range transport of mineral dust in the global atmosphere: Impact of African dust on the environment of the southeastern United States, P. Natl. Acad. Sci. USA, 96, 3396–3403, 1999.
Prospero, J. M. and Lamb, P. J.: African droughts and dust transport to the Caribbean: climate change implications, Science, 302, 1024–1027, https://doi.org/10.1126/science.1089915, 2003.
Prospero, J. M. and Mayol-Bracero, O. L.: Understanding the Transport and Impact of African Dust on the Caribbean Basin, 1329–1337, https://doi.org/10.1175/BAMS-D-12-00142.1, 2013.
Prospero, J. M., Ginoux, P., Torres, O., Nicholson, S. E., and Gill, T. E.: Environmental characterization of global sources of atmospheric soil dust identified with the Nimbus 7 Total Ozone Mapping Spectrometer (TOMS) absorbing aerosol product, Rev. Geophys., 40, 2-1–2-31, 2002.
Prospero, J. M., Collard, F. X., Molinie, J., and Jeannot, A.: Characterizing the annual cycle of African dust transport to the Caribbean Basin and South America and its impact on the environment and air quality, Global Biogeochem. Cy., 28, 757–773, https://doi.org/10.1002/2013gb004802, 2014.
Querol, X., Tobías, A., Pérez, N., Karanasiou, A., Amato, F., Stafoggia, M., Pérez García-Pando, C., Ginoux, P., Forastiere, F., Gumy, S., Mudu, P., and Alastuey, A.: Monitoring the impact of desert dust outbreaks for air quality for health studies, Environ Int., 130, 104867, https://doi.org/10.1016/j.envint.2019.05.061, 2019.
Ramaswamy, V. P., Muraleedharan, M., and Prakash Babu, C.: Mid-troposphere transport of Middle-East dust over the Arabian Sea and its effect on rainwater composition and sensitive ecosystems over India, Sci. Rep., 7, 13676, https://doi.org/10.1038/s41598-017-13652-1, 2017.
Rajot, J. L., Formenti, P., Alfaro, S., Desboeufs, K., Chevaillier, S., Chatenet, B., Gaudichet, A., Journet, E., Marticorena, B., Triquet, S., Maman, A., Mouget, N., and Zakou, A.: AMMA dust experiment: An overview of measurements performed during the dry season special observation period (SOP0) at the Banizoumbou (Niger) supersite, J. Geophys. Res., 113, D00C14, https://doi.org/10.1029/2008jd009906, 2008.
Rashki, A., Kaskaoutis, D. G., Francois, P., Kosmopoulos, P. G., and Legrand, M.: Dust-storm dynamics over Sistan region, Iran: seasonality, transport characteristics and affected areas, Aeol. Res., 16, 35–48, 2015.
Ridley, D. A., Heald, C. L., Kok, J. F., and Zhao, C.: An observationally constrained estimate of global dust aerosol optical depth, Atmos. Chem. Phys., 16, 15097–15117, https://doi.org/10.5194/acp-16-15097-2016, 2016.
Rivera Rivera, N. I., Gill, T. E., Gebhart, K. A., Hand, J. L., Bleiweiss, M. P., and Fitzgerald, R. M.: Wind modeling of Chihuahuan Desert dust outbreaks, Atmos. Environ., 43, 347–354, https://doi.org/10.1016/j.atmosenv.2008.09.069, 2009.
Rodríguez, S., Cuevas, E., Prospero, J. M., Alastuey, A., Querol, X., López-Solano, J., García, M. I., and Alonso-Pérez, S.: Modulation of Saharan dust export by the North African dipole, Atmos. Chem. Phys., 15, 7471–7486, https://doi.org/10.5194/acp-15-7471-2015, 2015.
Rohrmann, A., Heermance, R., Kapp, P., and Cai, F. L.: Wind as the primary driver of erosion in the Qaidam Basin, China, Earth Planet. Sci. Lett., 374, 1–10, https://doi.org/10.1016/j.epsl.2013.03.011, 2013.
Saiko, T. A. and Zonn, I. S.: Irrigation expansion and dynamics of desertification in the circum-aral region of central Asia, Appl. Geogr., 20, 349–367, 2000.
Sayer, A. M. and Knobelspiesse, K. D.: How should we aggregate data? Methods accounting for the numerical distributions, with an assessment of aerosol optical depth, Atmos. Chem. Phys., 19, 15023–15048, https://doi.org/10.5194/acp-19-15023-2019, 2019.
Sayer, A. M., Hsu, N. C., Bettenhausen, C., and Jeong, M.-J.: Validation and uncertainty estimates for MODIS Collection 6 “Deep Blue” aerosol data, J. Geophys. Res., 118, 7864–7873, https://doi.org/10.1002/jgrd.50600, 2013.
Schepanski, K., Tegen, I., Laurent, B., Heinold, B., and Macke, A.: A new Saharan dust source activation frequency map derived from MSG-SEVIRI IR channels, Geophys. Res. Lett., 34, L18803, https://doi.org/10.1029/2007GL030168, 2007.
Schepanski, K., Tegen, I., Todd, M. C., Heinold, B., Bönisch, G., Laurent, B., and Macke, A.: Meteorological processes forcing Saharan dust emission inferred from MSG-SEVIRI observations of subdaily dust source activation and numerical models, J. Geophys. Res.-Atmos., 114, D10201, https://doi.org/10.1029/2008JD010325, 2009.
Schepanski, K., Heinold, B., and Tegen, I.: Harmattan, Saharan heat low, and West African monsoon circulation: modulations on the Saharan dust outflow towards the North Atlantic, Atmos. Chem. Phys., 17, 10223–10243, https://doi.org/10.5194/acp-17-10223-2017, 2017.
Shen, H., Abuduwaili, J., Samat, A., and Ma, L.: A review on the research of modern aeolian dust in Central Asia, Arab J. Geosci., 9, 625, https://doi.org/10.1007/s12517-016-2646-9, 2016.
Sogacheva, L., de Leeuw, G., Rodriguez, E., Kolmonen, P., Georgoulias, A. K., Alexandri, G., Kourtidis, K., Proestakis, E., Marinou, E., Amiridis, V., Xue, Y., and van der A, R. J.: Spatial and seasonal variations of aerosols over China from two decades of multi-satellite observations – Part 1: ATSR (1995–2011) and MODIS C6.1 (2000–2017), Atmos. Chem. Phys., 18, 11389–11407, https://doi.org/10.5194/acp-18-11389-2018, 2018.
Sokolik, I. N. and Toon, O. B.: Direct radiative forcing by anthropogenic airborne mineral aerosols, Nature, 381, 681–683, https://doi.org/10.1038/381681a0, 1996.
Song, Q., Zhang, Z., Yu, H., Ginoux, P., and Shen, J.: Global dust optical depth climatology derived from CALIOP and MODIS aerosol retrievals on decadal timescales: regional and interannual variability, Atmos. Chem. Phys., 21, 13369–13395, https://doi.org/10.5194/acp-21-13369-2021, 2021.
Srivastava, A. K., Tiwari, S., Devara, P. C. S., Bisht, D. S., Srivastava, M. K., Tripathi, S. N., Goloub, P., and Holben, B. N.: Pre-monsoon aerosol characteristics over the Indo-Gangetic Basin: implications to climatic impact, Ann. Geophys., 29, 789–804, https://doi.org/10.5194/angeo-29-789-2011, 2011.
Stanelle, T., Bey, I., Raddatz, T., Reick, C., and Tegen, I.: Anthropogenically induced changes in twentieth century mineral dust burden and the associated impact on radiative forcing, J. Geophys. Res.-Atmos., 119, 13526–13546, 2014.
Stefanski, R. and Sivakumar, M. V. K.: Impacts of sand and dust storms on agriculture and potential agricultural applications of a SDSWS, IOP Conf. Ser.: Earth Environ. Sci., 7, 012016, https://doi.org/10.1088/1755-1307/7/1/012016, 2009.
Sun, Y., Chen, H., Tada, R., Weiss, D., Lin, M., Toyoda, S., Yan, Y., and Isozaki, Y.: ESR signal intensity and crystallinity of quartz from Gobi and sandy deserts in East Asia and implication for tracing Asian dust provenance, Geochem. Geophy. Geosy., 14, 2615–2627, https://doi.org/10.1002/ggge.20162, 2013.
Tanaka, T. Y. and Chiba, M.: A numerical study of the contributions of dust source regions to the global dust budget, Global Planet Change, 52, 88–104, https://doi.org/10.1016/j.gloplacha.2006.02.002, 2006.
Tegen, I., Werner, M., Harrison, S., and Kohfeld, K.: Relative im- portance of climate and land use in determining present and fu- ture global soil dust emission, Geophys. Res. Lett., 31, L05105, https://doi.org/10.1029/2003GL019216, 2004.
Tegen, I., Heinold, B., Todd, M., Helmert, J., Washington, R., and Dubovik, O.: Modelling soil dust aerosol in the Bodélé depression during the BoDEx campaign, Atmos. Chem. Phys., 6, 4345–4359, https://doi.org/10.5194/acp-6-4345-2006, 2006.
Tong, D. Q., Wang, J. X. L., Gill, T. E., Lei, H., and Wang, B. Y.: Intensified dust storm activity and Valley fever infection in the southwestern United States, Geophys. Res. Lett., 44, 4304–4312, https://doi.org/10.1002/2017gl073524, 2017.
Tyson, P. D., Garstang, M., Swap, R., Kallberg, P., and Edwards, M.: An air transport climatology for subtropical southern Africa, Int. J. Climatol., 16, 265–291, 1996.
Vickery, K. J., Eckardt, F. D., and Bryant, R. G.: A sub-basin scale dust plume source frequency inventory for south-ern Africa, 2005–2008, Geophys. Res. Lett., 40, 5274–5279, https://doi.org/10.1002/grl.50968, 2013.
Voss, K. K. and Evan, A. T.: A new satellite-based global climatology of dust aerosol optical depth, J. Appl. Meteorol. Clim., https://doi.org/10.1175/jamc-d-19-0194.1, 2020.
Wagener, T., Guieu, C., Losno, R., Bonnet, S., and Mahowald, N.: Revisiting atmospheric dust export to the Southern Hemisphere ocean: Biogeochemical implications, Global Biogeochem. Cy., 22, GB2006, https://doi.org/10.1029/2007gb002984, 2008.
Washington, R. and Todd, M. C.: Atmospheric controls on mineral dust emission from the Bodélé depression, Chad: The role of the low level jet, Geophys. Res. Lett., 32, L17701, https://doi.org/10.1029/2005GL023597, 2005.
Washington, R., Todd, M., Middleton, N. J., and Goudie, A. S.: Dust-storm source areas determined by the total ozone monitoring spectrometer and surface observations, Ann. Assoc. Am. Geogr., 93, 297–313, https://doi.org/10.1111/1467-8306.9302003, 2003.
Washington, R., Bouet, C., Cautenet, G., Mackenzie, E., Ashpole, I., Engelstaedter, S., Lizcano, G., Henderson, G. M., Schepanski, K., and Tegen, I.: Dust as a tipping element: the Bodélé Depression, Chad, P. Natl. Acad. Sci. USA, 106, 20564–20571, https://doi.org/10.1073/pnas.0711850106, 2009.
Weinzierl, B., Sauer, D., Minikin, A., Reitebuch, O., Dahlkotter, F., Mayer, B., Emde, C., Tegen, I., Gasteiger, J., Petzold, A., Veira, A., Kueppers, U., and Schumann, U.: On the visibility of airborne volcanic ash and mineral dust from the pilot's perspective in flight, Phys. Chem. Earth, 45–46, 87–102, https://doi.org/10.1016/j.pce.2012.04.003, 2012.
Winker, D. M., Vaughan, M. A., Omar, A., Hu, Y., Powell, K. A., Liu, Z., Hunt, W. H. and Young, S. A.: Overview of the CALIPSO Mission and CALIOP Data Processing Algorithms, J. Atmos. Oceanic Technol., 26, 2310–2323, https://doi.org/10.1175/2009JTECHA1281.1, 2009.
Yu, H., Remer, L. A., Chin, M., Bian, H., Kleidman, R. G., and Diehl, T.: A satellite-based assessment of transpacific transport of pollution aerosol, J. Geophys. Res.-Atmos., 113, D14S12, https://doi.org/10.1029/2007JD009349, 2008.
Yu, H. B., Chin, M., Winker, D. M., Omar, A. H., Liu, Z. Y., Kittaka, C., and Diehl, T.: Global view of aerosol vertical distributions from CALIPSO lidar measurements and GOCART simulations: Regional and seasonal variations, J. Geophys. Res.-Atmos., 115, D00H30, https://doi.org/10.1029/2009jd013364, 2010.
Yu, H. B., Chin, M., Yuan, T. L., Bian, H. S., Remer, L. A., Prospero, J. M., Omar, A., Winker, D., Yang, Y. K., Zhang, Y., Zhang, Z. B., and Zhao, C.: The fertilizing role of African dust in the Amazon rainforest: A first multiyear assessment based on data from Cloud-Aerosol Lidar and Infrared Pathfinder Satellite Observations, Geophys. Res. Lett., 42, 1984–1991, https://doi.org/10.1002/2015gl063040, 2015.
Yu, Y., Notaro, M., Liu, Z., Kalashnikova, O., Alkolibi, F., Fadda, E., and Bakhrjy, F.: Assessing temporal and spatial variations in atmospheric dust over Saudi Arabia through satellite, radiometric, and station data, J. Geophys. Res.-Atmos., 118, 13253– 13264, https://doi.org/10.1002/2013JD020677, 2013.
Yu, Y., Notaro, M., Kalashnikowa, O., and Garay, M.: Climatology of summer Shamal wind in the Middle East, J. Geophys. Res.-Atmos. 121, 289–305, 2016.
Yu, Y., Kalashnikova, O. V., Garay, M. J., and Notaro, M.: Climatology of Asian dust activation and transport potential based on MISR satellite observations and trajectory analysis, Atmos. Chem. Phys., 19, 363–378, https://doi.org/10.5194/acp-19-363-2019, 2019.
Yu, Y., Kalashnikova, O. V., Garay, M. J., Lee, H., Choi, M., Okin, G. S., Yorks, J. E., Campbell, J. R., and Marquis, J.: A global analysis of diurnal variability in dust and dust mixture using CATS observations, Atmos. Chem. Phys., 21, 1427–1447, https://doi.org/10.5194/acp-21-1427-2021, 2021.
Xi, X. and Sokolik, I. N.: Seasonal dynamics of threshold friction velocity and dust emission in Central Asia, J. Geophys. Res.-Atmos., 120, 1536–1564, https://doi.org/10.1002/2014JD022471, 2015.
Zender, C. S., Huisheng, B., and Newman, D.: Mineral Dust Entrainment and Deposition (DEAD) model: Description and 1990s dust climatology, J. Geophys. Res., 108, 4416, https://doi.org/10.1029/2002JD002775, 2003.
- Abstract
- Introduction
- ModIs Dust AeroSol (MIDAS) dataset
- Spatiotemporal averaging and propagation of grid-cell-level uncertainties
- Results
- Summary and conclusions
- Data availability
- Author contributions
- Competing interests
- Disclaimer
- Special issue statement
- Acknowledgements
- Financial support
- Review statement
- References
- Supplement