the Creative Commons Attribution 4.0 License.
the Creative Commons Attribution 4.0 License.
 | 14 Mar 2022
Atmospheric composition in the European Arctic and 30 years of the Zeppelin Observatory, Ny-Ålesund
Stephen M. Platt
Øystein Hov
Torunn Berg
Knut Breivik
Sabine Eckhardt
Konstantinos Eleftheriadis
Nikolaos Evangeliou
Markus Fiebig
Rebecca Fisher
Georg Hansen
Hans-Christen Hansson
Jost Heintzenberg
Ove Hermansen
Dominic Heslin-Rees
Kim Holmén
Stephen Hudson
Roland Kallenborn
Radovan Krejci
Terje Krognes
Steinar Larssen
David Lowry
Cathrine Lund Myhre
Chris Lunder
Euan Nisbet
Pernilla B. Nizzetto
Ki-Tae Park
Christina A. Pedersen
Katrine Aspmo Pfaffhuber
Thomas Röckmann
Norbert Schmidbauer
Sverre Solberg
Andreas Stohl
Johan Ström
Tove Svendby
Peter Tunved
Kjersti Tørnkvist
Carina van der Veen
Stergios Vratolis
Young Jun Yoon
Karl Espen Yttri
Paul Zieger
Wenche Aas
Kjetil Tørseth
The Zeppelin Observatory (78.90∘ N, 11.88∘ E) is located on Zeppelin Mountain at 472 m a.s.l. on Spitsbergen, the largest island of the Svalbard archipelago. Established in 1989, the observatory is part of Ny-Ålesund Research Station and an important atmospheric measurement site, one of only a few in the high Arctic, and a part of several European and global monitoring programmes and research infrastructures, notably the European Monitoring and Evaluation Programme (EMEP); the Arctic Monitoring and Assessment Programme (AMAP); the Global Atmosphere Watch (GAW); the Aerosol, Clouds and Trace Gases Research Infrastructure (ACTRIS); the Advanced Global Atmospheric Gases Experiment (AGAGE) network; and the Integrated Carbon Observation System (ICOS). The observatory is jointly operated by the Norwegian Polar Institute (NPI), Stockholm University, and the Norwegian Institute for Air Research (NILU). Here we detail the establishment of the Zeppelin Observatory including historical measurements of atmospheric composition in the European Arctic leading to its construction. We present a history of the measurements at the observatory and review the current state of the European Arctic atmosphere, including results from trends in greenhouse gases, chlorofluorocarbons (CFCs) and hydrochlorofluorocarbons (HCFCs), other traces gases, persistent organic pollutants (POPs) and heavy metals, aerosols and Arctic haze, and atmospheric transport phenomena, and provide an outline of future research directions.
- Article
(12601 KB) - Full-text XML
- BibTeX
- EndNote


Following early advances in aerosol measurement technology and data, Junge (1972) coined the concept of a “global background aerosol”, recommending its study at background stations as far away from anthropogenic sources as possible. The polar regions were prime areas for the establishment of such sites. Furthermore, a possible feedback mechanism, where decreased ice cover would decrease Earth's albedo, leading to more warming, particularly in the Arctic, an “Arctic albedo effect”, had already been described in the literature (Budyko, 1969; Schneider and Dickinson, 1974), and Hov and Holtet (1987) noted that “Theoretical calculations indicate that the growth in temperature around Svalbard could be 3 to 4 times the global average temperature increase”. A third motivation for atmospheric background measurements in the Arctic followed the 1973 oil crisis, which led to increased oil exploration in the region. Norwegian environmental research was commissioned to establish the status of the pristine Arctic environment before the advent of large-scale commercial exploitation (Joranger and Ottar, 1984).
In Norway, a growing interest in “Arctic haze” (an observed seasonal variability in Arctic aerosol, with maximum levels around December to March) led to the Workshop on Arctic Aerosols (27 to 28 April 1977, at the Norwegian Institute for Air Research – NILU) sponsored jointly by the US Office of Naval Research and co-chaired by NILU's director Brynjulf Ottar and Kenneth A. Rahn of the University of Rhode Island (Ottar and Rahn, 1980). Out of this meeting grew a consortium to establish a pan-Arctic observation programme to determine the sources, transport mechanisms, and effects of aerosols in the Arctic. Meanwhile in Sweden in the same year, the Swedish parliament accepted the proposal for a Swedish monitoring programme (program för övervakning av miljökvalitet, PMK), one part of which was to be long-term monitoring at Ny-Ålesund by Stockholm University of changes in atmospheric composition with an emphasis on aerosols and carbon dioxide in collaboration with NILU in Norway.
Following the 1977 workshop on Arctic aerosol there were three further symposia on Arctic atmospheric chemistry, on 6 to 8 May 1980 (Rahn, 1981a), 7 to 9 May 1984 (Rahn, 1985), and 29 September to 2 October 1987 (Rahn, 1989b). These Arctic air chemistry symposia provided an international framework for Arctic haze research based on long-term ground-based observations, or at least field campaigns with extended measurement programmes, and aircraft measurements. A substantial 5-year Arctic measurement and research programme led by NILU also started in 1981, financed by British Petroleum Ltd (BP), as part of the Norwegian government's policy to allow the search for oil and gas at northerly latitudes (Ottar, 1989). The Arctic air chemistry symposia and the BP programme at NILU also provided the international scientific support and legitimacy for Norwegian government funding to establish a global background observatory.
From the start, establishing a joint Norwegian–Swedish baseline monitoring observatory within the World Meteorological Organization (WMO) framework was under discussion, and measurement campaigns were carried out in the Arctic to determine the ideal location for such an observatory. Heintzenberg (1983) and Heintzenberg et al. (1985) emphasized that regional transport of anthropogenic trace substances from populated regions in the Soviet Union and Europe should be monitored, even if much of the high Arctic lay within Soviet Union territory where atmospheric monitoring activities were impossible for most scientists. Year-round measurements were particularly required to characterize Arctic haze (e.g. “background” vs. “baseline” levels). Specifically, Heintzenberg et al. (1985) recommended the establishment of a permanent station with instrumentation to measure particle number concentration; light scattering; and greenhouse gases, particularly CO2. Accordingly, several research groups promoting the development of high-latitude background stations devised a plan to link up to the baseline monitoring stations at the South Pole, run by the National Oceanic and Atmospheric Administration (NOAA); Cape Grim on the western cape of Tasmania, run by the Commonwealth Scientific and Industrial Research Organisation (CSIRO), Australia; American Samoa, Mauna Loa, and Point Barrow in Alaska (all NOAA sites); and Alert, Canada, run by Environment Canada. The WMO was to have a strong coordinating role. This, in addition to the Arctic haze symposia, Norwegian Environment Agency funding, and Swedish funding via the PMK, led to the establishment of an observatory on Zeppelin Mountain close to Ny-Ålesund (Rahn, 1989a).
The Zeppelin Observatory is now a leading global background measurement site (Tørseth et al., 2012). Google Scholar finds at least 280 publications including the search term “Zeppelin Observatory”, and, for example, greenhouse gas data and/or metadata (CO2, CO, CH4) have been downloaded at least 4439 times from the Integrated Carbon Observation System (ICOS) Carbon Portal (https://www.icos-cp.eu/observations/carbon-portal, last access: 7 February 2022) while station data have been downloaded from or viewed at EBAS (https://ebas.nilu.no, last access: 8 March 2019) at least 2912 and 2326 times, respectively. Here we present historical atmospheric composition measurements in the Arctic, including the measurements used to identify Mt Zeppelin as the ideal location for an atmospheric observatory. We detail the construction of the Zeppelin Observatory, its characteristics with respect to atmospheric transport, and subsequent expansions of measurement activities. We discuss trends in aerosol physical–chemical properties, greenhouse gases, reactive trace gases, atmospheric oxidants, persistent organic pollutants (POPs), reactive trace gases, atmospheric oxidants, persistent organic pollutants, and heavy metals including mercury. Finally, we also include an outline of future research directions and strategic considerations.
2.1 The rediscovery of Arctic haze
As discussed by Garrett and Verzella (2008), the presence of visibility-reducing haze in the Arctic was noted by early explorers in the late nineteenth century and discussed by Nordenskiöld (1883). Schnell (1984b) also suggest early evidence of observations of Arctic haze during Donald Baxter MacMillan's search for the (non-existent) Crocker Land in the Canadian Arctic in 1913 (see Fig. 1 for a timeline of important events in the history of the Zeppelin Observatory). However, according to MacMillan and Ekblaw (1918), MacMillan finally accepted that an apparent landmass he believed to be Crocker Land and was attempting to reach was indeed a mirage or Fata Morgana, described by their local Inuit guide as “mist”, only after 5 arduous days, stating “The day was exceptionally clear, not a cloud or trace of mist … had we not been out on the frozen sea for 150 miles, we would have staked our lives upon its reality. Our judgment then, as now, is that this was a mirage”. Arctic haze was not definitively observed during the expedition, and mist in this case was a term used to refer to a mirage. Nevertheless, the account does provide evidence of a term for Arctic haze in the local Inuit vocabulary of the time.
According to Schnell (1984a), Mitchell (1957) was the first to document haze over the Arctic ice cap in the contemporary scientific literature. Haze was observed by pilots of the “Ptarmigan” weather reconnaissance flights in the 1950s from Alaska to the North Pole, which Mitchell (1957) suggested was composed of non-ice particles <2 µm in diameter. Raatz (1984) reanalysed the Ptarmigan flights from 1948 to 1961, finding a maximum in the number of low-visibility observations in spring. It was further suggested that the haze had an anthropogenic origin (Holmgren et al., 1974; Radke et al., 1976), subsequently identified as Eurasian.
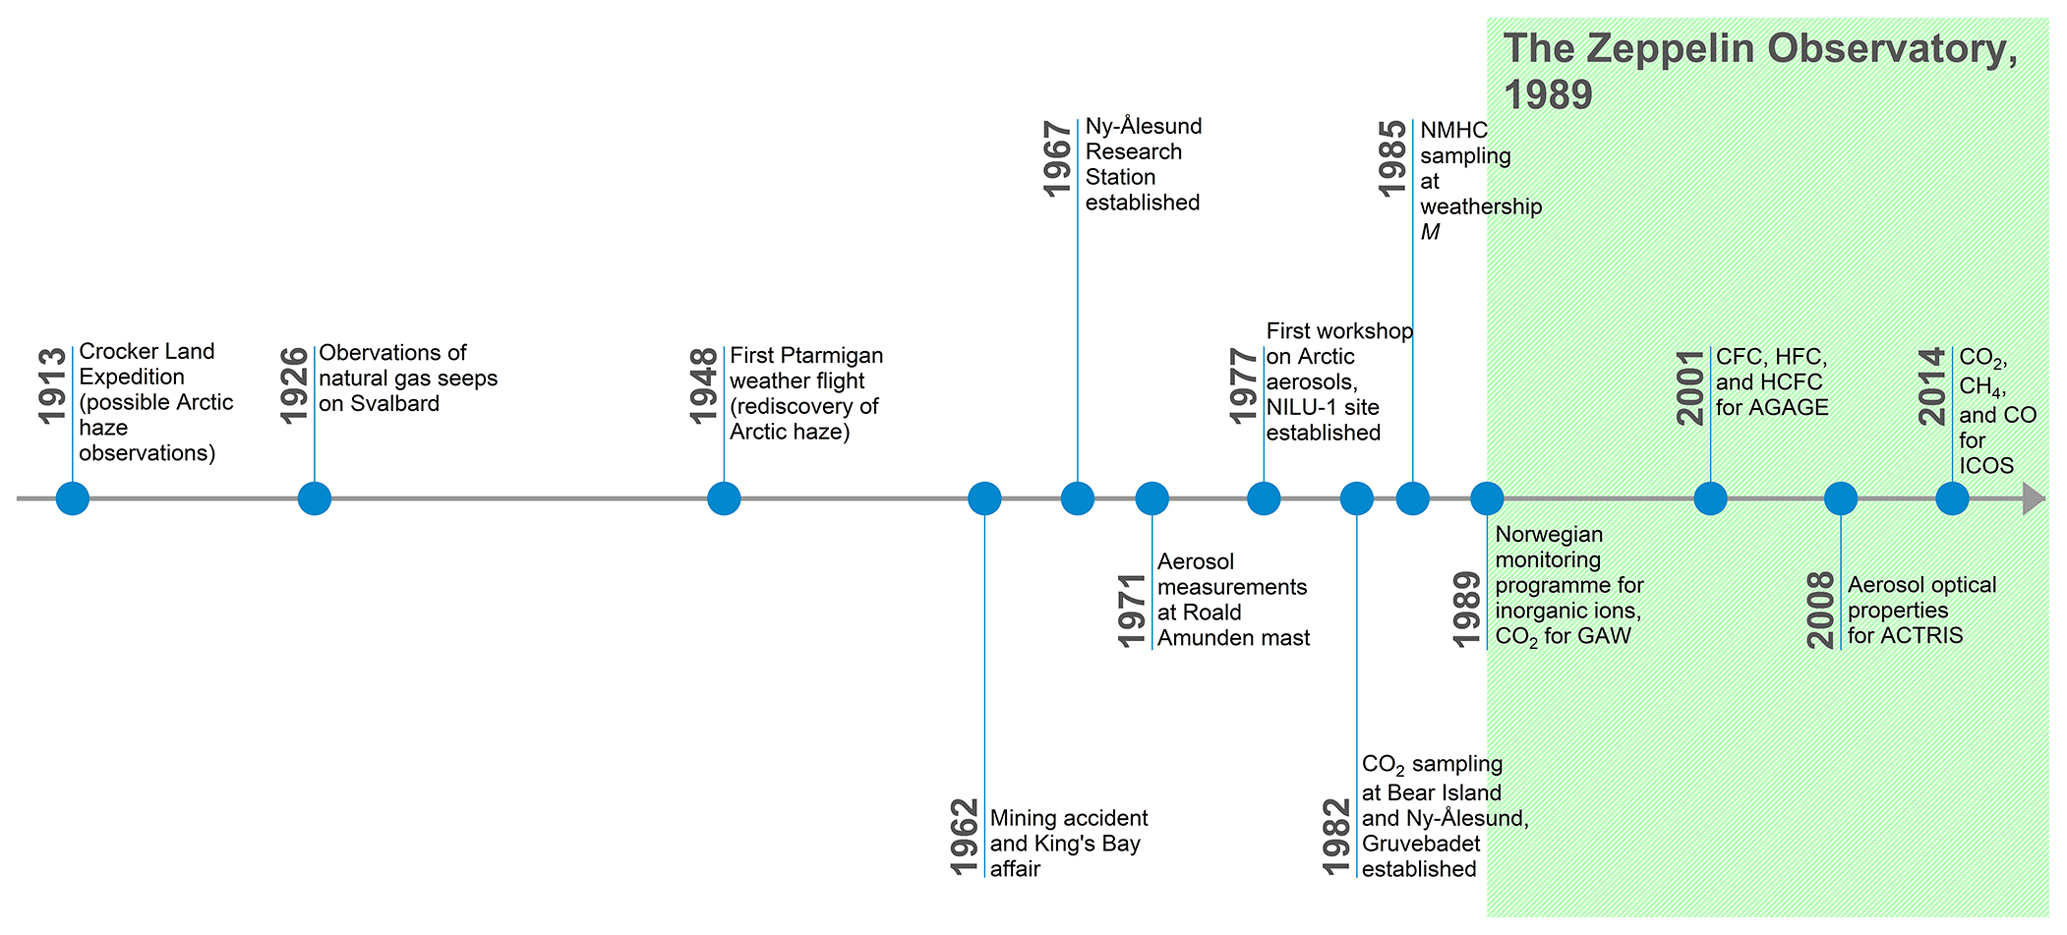
Figure 1Timeline of Arctic measurements leading up to the construction of the Arctic observatory, and selected subsequent milestones, mentioned in the main text.
Measurements of Arctic haze and Arctic aerosols in the European Arctic began in the 1970s when, following a mining accident in Ny-Ålesund in 1962 and the political turmoil unleashed in Norway, the Kings Bay Affair (Hanoa, 1989), a new use was sought for Norwegian infrastructure in the settlement. The European Space Research Organisation (ESRO) established a satellite ground station in Ny-Ålesund in 1967, while the Norwegian Polar Institute (NPI) started year-round activities with overwintering staff from 1968. The establishment of environmental research activities at the former mining settlement enabled researchers at NILU to begin studying the transport of air pollutants into the European Arctic with measurements of total suspended particulate matter (TSP) at Ny-Ålesund in 1973. A high-volume sampler (500 m3 of air per day) was installed on the Roald Amundsen airship mooring mast close to the Kongsfjorden shoreline (Fig. 2) in collaboration with NPI. Samples were taken weekly on filters and analysed at NILU for TSP, as well as for elements including mercury, chromium, and zinc. Similar regional-type stations operated in Tange (Jutland, Denmark), Tveiten (southern Norway), Rena (central Norway), and Skoganvarre (northern Norway). Results showed the episodic transport of air pollutants into the Arctic (Rahn, 1981b, and references therein). Due to the historical and cultural significance of the Amundsen mast, operations were stopped in 1977 by a preservation order.
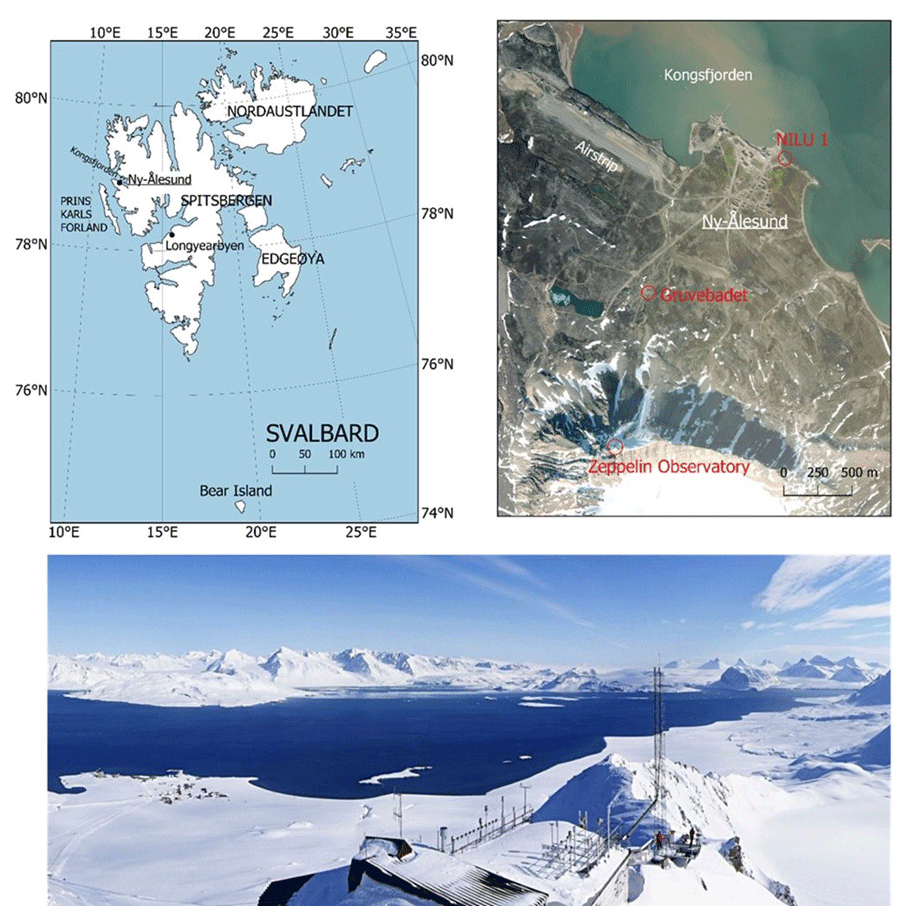
Figure 2Top left: map of the Svalbard archipelago. Top right: satellite image of Ny-Ålesund with the measurement sites at NILU-1, Gruvebadet, and the Zeppelin Observatory in red. Bottom: view of the Zeppelin Observatory looking down over the Ny-Ålesund settlement and Kongsfjorden. Top left, map data: Svalbard Kartdata; scale: 1:1 000 000; credit: Norwegian Polar Institute, https://doi.org/10.21334/npolar.2014.63730e2e (last access: 18 June 2021). Top right, map data: Esri satellite; scale: variable resolution; credit: Esri, Maxar, Earthstar Geographics, USDA FSA, USGS, AeroGRID, IGN, IGP, and the GIS User Community, https://server.arcgisonline.com/ArcGIS/rest/services/World_Imagery/MapServer (last access: 18 June 2021). Top panels produced using the QGIS geographic information system, Open Source Geospatial Foundation project, http://qgis.osgeo.org (last access: 18 June 2021). Bottom, photo credit: Ove Hermansen, NILU.
Aerosol composition measurements by NILU began again on 5 July 1977, with sulfur pollutant measurements at Bear Island and Ny-Ålesund (Fig. 3; Joranger and Ottar, 1984; Larssen and Hanssen, 1980). In Ny-Ålesund a new measurement site (NILU-1) was constructed close to the settlement shoreline with filter samples analysed for sulfate, nitrate, ammonium, chloride, magnesium, calcium, and sodium in addition to lead, cadmium, and zinc until 30 June 1980. Additional aerosol measurements (composition, aerosol size distribution) at the site were performed by Stockholm University in 1979 and 1981 (Heintzenberg, 1980; Heintzenberg et al., 1981).
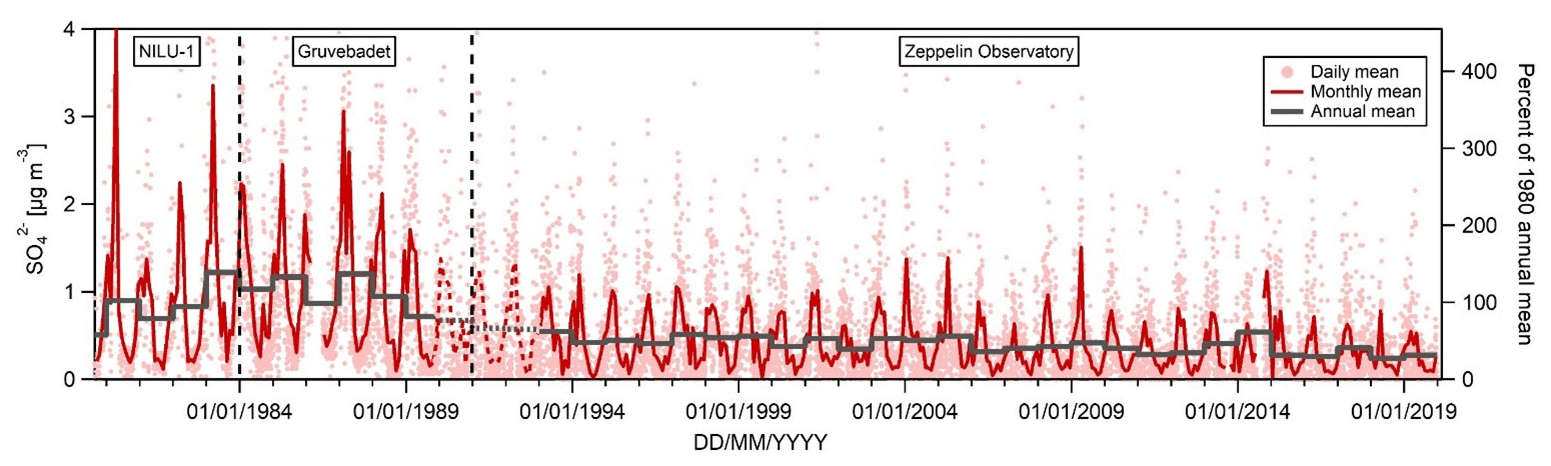
Figure 3Sulfate (SO concentrations at Ny-Ålesund (NILU-1), Gruvebadet, and the Zeppelin Observatory. Sulfate is sea salt corrected except for 1990–1992 where total sulfate was measured, as also indicated by the dashed line. For reference, the right axis shows levels relative to the 1980 annual mean of 0.92 µg m−3. Daily and annual means calculated only where data coverage is ≥75 % of the total day or year, respectively.
2.2 Early greenhouse gas measurements in the European Arctic
The first global background CO2 monitoring programme was organized in 1956 as part of the International Geophysical Year (Fritz, 1959). The remote Arctic, far from large local combustion sources, represents an ideal location for such background measurements. Accordingly, CO2 measurements at Barrow, Alaska, were initiated in 1961, with Kelley (1974) finding mixing ratios ∼2.5 ppm higher than from contemporaneous measurements at Mauna Loa, Hawaii, and with larger annual variability. An early observed mean mixing ratio of 398 ppm at Hornsund, Svalbard, in October to December 1957 is likely erroneous, due to analytical artefacts or contamination from heating oil combustion at Hornsund (Jaworowski, 1989).
Greenhouse gas (GHG) measurements around Svalbard began as part of the PMK-funded quest for a suitable location for a background station in the European Arctic. The two leading candidates for the background site were Bear Island and the site of weather observations including radio soundings, located in the Barents Sea about halfway between the northern Scandinavian coast and Svalbard (74.52∘ N, 19.02∘ E), and the former mining settlement of Ny-Ålesund (78.93∘ N, 11.92∘ E), now converted into a site for research and monitoring following the Kings Bay Affair. Heintzenberg (1983) took daily CO2 grab samples at both locations in August 1981 to September 1982. In addition, an intensive summer campaign at the NILU-1 site in Ny-Ålesund, August to September 1982, included 6-hourly nondispersive infrared (NDIR) CO2 measurements. Results from both sites were similar to previous observations at Barrow and Alert, Canada, with levels showing an annual variation of ∼15 ppm and short-term variations of ∼4 ppm (Peterson et al., 1982; Wong and Pettit, 1981). Regular measurements of CO2 (using infrared absorption spectroscopy measurement techniques) did not begin at Svalbard until the construction of the Zeppelin Observatory in 1989.
Measurements of Arctic CH4 began later than those of CO2. The Arctic CH4 mixing ratio was ∼1600 ppb in August–September 1967 at Point Barrow, Alaska (Cavanagh et al., 1969), while aircraft measurements when descending into Point Barrow showed a mixing ratio of 1721 ppb in April 1986 (Conway and Steele, 1989). Trivett et al. (1989) observed a strong correlation between Arctic haze and the mixing ratios of both CO2 and CH4 at the Alert station, on Ellesmere Island, Canada, in 1986, demonstrating that synoptic variations in greenhouse gas mixing ratios in the Arctic were due to long-range transport of anthropogenic emissions.
No atmospheric CH4 measurements are reported for Svalbard in the literature until measurements began at Zeppelin (in 1994, by NOAA). Interestingly however, a 1920s study of natural water springs on Svalbard noted the presence of gas bubbles in numerous streams and hydrocarbon deposits with natural gas emissions near the surface in Grønfjorden containing 97 % CH4 in 1926 (Orvin, 1944). By the time the Zeppelin Observatory had been constructed in 1989, the hypothesis that decomposing hydrates, which only form in the presence of such CH4 seeps if located on the seafloor where pressure is relatively high, could cause runaway warming effects was already the focus of scientific study (Nisbet, 1989).
2.3 Early trace gas measurements in the European Arctic
When Arctic haze was identified as the result of long-range transport of pollutants into the polar region, it was clear that these transport episodes could also carry numerous other pollutants. Measurements of carbon monoxide (CO), hydrocarbons, and halocarbons at Barrow around 1980 showed highly elevated concentrations in winter compared to in summer (Rasmussen et al., 1983). The first measurements of organic species in the European Arctic were carried out in summer 1982 at four locations – Bear Island, Hopen, Longyearbyen, and Ny-Ålesund – and in spring 1983 at Ny-Ålesund (Hov et al., 1984). Samples were collected in stainless-steel canisters that were subsequently analysed for halocarbons and non-methane hydrocarbons (NMHCs) at the Atomic Energy Research Establishment, Harwell, United Kingdom. The observed fraction of alkanes was higher at Ny-Ålesund than at Barrow, a consequence of the proximity of the petroleum activity in the Soviet Union and the prevailing atmospheric transport from the southeast into Spitsbergen. Elevated levels of alkenes (ethene and propene) in summer were linked to biogenic emissions from the ocean. Even at this early stage, it was concluded that “Ny-Ålesund is a good site to measure air coming off the Soviet Union and Europe. Continued sampling could provide valuable information about questions related to global climate, Arctic haze and the chemical composition of the troposphere” and that there was a “need for continued measurements of organic gases … at a representative Arctic site like Ny-Ålesund” (Ottar et al., 1986).
C2 to C6 NMHCs were sampled at weather ship station M (located at 66∘ N, 3∘ E) and Ny-Ålesund in winter to spring 1985 and in spring 1986 at Ny-Ålesund (Hov et al., 1989), away from the settlement following a snow-scooter ride out to an upwind, unpolluted site. The results showed that the sum of alkanes and alkenes at Ny-Ålesund in spring was close to half the level found just 60 km downwind of London and higher than observed at a rural site in Germany. Given these findings, it was concluded that despite being further north than Barrow, Ny-Ålesund is more influenced by transported pollutants, especially in spring.
NMHCs control ozone (O3) production and rates of sulfate and nitrate formation. NMHC levels at Ny-Ålesund were found to be 1 order of magnitude higher in spring than in summer (Hov et al., 1984), and modelling indicated that some of the spring increase in O3 is due to tropospheric formation from NMHC build-up in winter. High NMHC levels at Ny-Ålesund and other Arctic sites during the 1980s, as well as the growing awareness of the importance of these species for atmospheric oxidizing capacity, tropospheric ozone, and acid deposition, made it clear that a dedicated effort was needed “to sample and analyse such HCs at a representative station network over several years” (Hov et al., 1989). The formation of photooxidants was also a topic of concern at lower latitudes, leading to the establishment of the European experiment on transport/transformation of environmentally relevant trace constituents in the troposphere sub-project on tropospheric ozone research (EUROTRAC-TOR) network in Europe. TOR was an 8-year project under the Eureka environment programme that started in 1987, setting up a network of surface monitoring sites for O3 and precursors (Isaksen, 1988). Most of the sites were also active in the European Monitoring and Evaluation Programme (EMEP).
The Zeppelin Observatory is located on Zeppelin Mountain at 472 m a.s.l. on the Brøgger Peninsula, Svalbard, Norway (Fig. 2), and is in the northern Arctic tundra zone (Bliss, 2000). Surrounding the Brøgger Peninsula are the waters of the 26 km long Kongsfjorden, and the peninsula itself is a mountainous, barren landscape of scree, occasional patches of thin topsoil with little to no vegetation, and plains with snowpacks or glaciers at lower altitudes. The climate at the observatory reflects its high latitude but is moderated by the North Atlantic Current, with substantially higher temperatures than elsewhere at corresponding latitudes. The mountain itself is named after Count Ferdinand von Zeppelin, German officer and designer of airships, who visited the area during an expedition in 1910.
3.1 History and construction of the site
In the 1980s a search began for potential sites for background observations of the atmospheric chemical composition of the European Arctic. The criteria for such a site with respect to background GHG measurements were (1) minimal local emissions, (2) weak surface exchange such that surface measurements represent the total column, and (3) no expected change in land use over a decadal time span. Initial CO2 analyses (Sect. 2.2) indicated that Bear Island was a favourable location. However, there were indications of local sulfate contamination on the island, since the atmospheric sulfate levels did not drop in summer as expected. And, crucially, access would be limited to the summer months. Thus, the Norwegian settlements on Spitsbergen offered prime possibilities, and after short-term experiments at several valley sites in the Ny-Ålesund area, the Norwegian plan to establish a monitoring observatory on Mt Zeppelin close to Ny-Ålesund emerged.
The main disadvantage of a monitoring observatory at Ny-Ålesund was the potential for contamination from the settlement and from Norwegian and Soviet Union coal mining activities and power stations on Svalbard. The experience derived from the atmospheric chemical observations in the late 1970s and 1980s showed that local air pollution from the Ny-Ålesund settlement, including traffic on land, electricity generation, waste disposal, smouldering coal heaps, and traffic at sea and in the harbour, meant that it was necessary to take special precautions to minimize these local impacts. By 1982 NILU had already moved its observations from the harbour in Ny-Ålesund (NILU-1, Fig. 2) to Gruvebadet, 1.5 km outside Ny-Ålesund and close to sea level at the foot of Mt Zeppelin, to minimize local influences. However, it was found that even at Gruvebadet local impacts could be a problem during episodes of wind from some directions or stagnant air over the coastal plateau in Ny-Ålesund, significantly reducing the sampling frequency of true background Arctic air (Hov and Holtet, 1987), and hence a new location was required for such measurements.
The aim of a permanent observatory of atmospheric chemical composition in Ny-Ålesund was to establish the background or baseline concentration levels during seasons with very little long-range transport pollution in the boundary layer. An assessment was therefore made of how to minimize local pollution impacts, however minor. Based on numerous radio soundings of the lower troposphere in Barentsburg (Spitsbergen), it was concluded that surface inversion was common during winter and spring but usually with a depth <300 to 400 m (Hov and Holtet, 1987). An observatory on Mt Zeppelin would thus remain above the surface inversion (Hov and Holtet, 1987). It was further concluded that an observatory on Mt Zeppelin would be in stratus clouds or orographic clouds ∼20 % of the time in summer and less during the rest of the year. This conclusion was based on extensive climatological tabulations of the meteorological observations in Ny-Ålesund from 1971 to 1980 (Hov and Holtet, 1987).
The final decision to build the observatory on Mt Zeppelin was taken in 1987 by the Norwegian Ministry of Environment. In early spring 1988, a Norwegian governmental directorate (SBED – Statens bygge- og eiendomsdirektorat) was given the task to build the observatory, and the actual work on site was carried out in the summer of 1988. Access via a lift was commissioned in 1988, and the installation was carried out during the summer of 1989. The total cost of the observatory and lift was NOK 11.4 million (Norwegian kroner), funded by the Ministry of Environment. NPI is the owner of the observatory while all three partners (NPI, NILU, and Stockholm University – SU) form the consortium responsible for its operation. Funding for scientific equipment and research programmes came from the Royal Norwegian Council for Scientific and Technical Research (NTNF), later merged into the Research Council of Norway (RCN). Later funding from the Swedish Environmental Protection Agency (EPA) in 1994 allowed the construction of a roof over the arrival space for the lift and the entrance to the observatory, a necessity for safety reasons due to snow drift which at times prevented safe access to the observatory. Due to structural problems with the first building (water leaks, poor insulation, and larger snow loads than anticipated) but more importantly the need for more space for instrumentation, the building was replaced in 1999 (inaugurated 2 May 2000) with the successor of SBED, Statsbygg, as the responsible builder again and with funding from the Norwegian Ministry of Environment. Approximately 33 % of the investment for the new building came from the Swedish Wallenberg Foundations.
The previous background measurement site, Gruvebadet (now Gruvebadet Atmosphere Laboratory), remains an active site for environmental studies, including of aerosol chemical physical properties (e.g. Lupi et al., 2016; Stathopoulos et al., 2018). Other atmospheric observing platforms in Ny-Ålesund include the Alfred Wegener Institute–Institut Polaire Français Paul-Émile Victor (AWIPEV) atmospheric observatory (Neuber, 2006), NPI's Sverdrup Station (where NILU operates a number of atmospheric monitoring instruments), the Ny-Ålesund (Japanese) National Institute of Polar Research (NIPR) observatory, and the Amundsen-Nobile Climate Change Tower (Mazzola et al., 2016). Together, these platforms are a key component of the Ny-Ålesund Atmosphere Flagship, a collaborative effort by researchers from the numerous institutions conducting research and monitoring at Ny-Ålesund to improve data sharing and enhance research outputs (Neuber et al., 2011). In recent years, this cooperation has been further intensified through the Svalbard Integrated Arctic Earth Observing System (SIOS; https://sios-svalbard.org/, last access: 8 February 2022) as a Norwegian-led European infrastructure initiative addressing ongoing changes in the Arctic. All the international partners listed above, as well as other international institutions active in Svalbard, are members of this new network.
3.2 Atmospheric transport aspects
In the 1980s much was learned about the meteorological conditions leading to the episodic nature of atmospheric aerosol loadings in the Arctic. If the atmospheric processes are assumed to be nearly adiabatic, possible source areas of Arctic air pollution at the ground level are confined to regions with almost the same temperature as the Arctic itself (Iversen, 1984, 1989a, b). Hence, Svalbard generally offers a pristine Arctic environment for environmental monitoring, where anthropogenic influence is very small. However, the Zeppelin Observatory is located only ∼2 km from the Ny-Ålesund settlement (near sea level), and an important question is whether local emissions can be transported up to the mountain, influencing measurements.
The local wind field, strongly influenced by Kongsfjorden and surrounding topography, is complicated, and thus the winds measured at Ny-Ålesund and at the Zeppelin Observatory can be quite variable (Beine et al., 2001). Katabatic winds coming down from the Kongsvegen glacier, wind channelling in the fjord, and the thermal land–sea breeze circulation are all important (Esau and Repina, 2012). Nevertheless, winds blowing directly from the settlement to the observatory are rare, and the Zeppelin Observatory is mostly isolated from emissions in Ny-Ålesund by the frequent presence of temperature inversions below 500 m altitude (Dekhtyareva et al., 2018). Possible exceptions are only the rather infrequent periods with northerly flows (Beine et al., 2001). Consequently, local emissions from Ny-Ålesund have a much stronger influence on chemical measurements near the sea level than at the Zeppelin Observatory, where local pollution episodes are difficult to detect at all (Dekhtyareva et al., 2018). The clearest (but still relatively small) influence was demonstrated for the emissions of cruise ships visiting Ny-Ålesund (Eckhardt et al., 2013; Dekhtyareva et al., 2018), for which plume rise may be an important mechanism in transporting the exhaust to higher altitudes. A ban on heavy fuel oil use close to the Svalbard coast, however, has reduced ship traffic emissions considerably in Ny-Ålesund since 2015. In summary, the Zeppelin Observatory is representative of the larger-scale conditions in the Svalbard area, and long-range rather than local-scale transport is the dominant mechanism by which pollution reaches the observatory.
With respect to long-range transport of air masses, the location of the Zeppelin Observatory on the western coast of the Svalbard archipelago is important. The West Spitsbergen Current, the northernmost branch of the North Atlantic Current, brings relatively warm ocean waters and keeps the sea largely free of ice even in winter, in contrast to the east side of Svalbard. Air masses arriving at the observatory from the Greenland Sea and the Norwegian Sea are consequently relatively warm, whereas air masses arriving from the Barents Sea and the Arctic Ocean are much colder, particularly in winter. Correspondingly, exposure of the air to open seawater versus sea ice depends strongly on where the air is coming from.
In terms of interpreting the chemical composition of the air at the Zeppelin Observatory, we are mostly interested in where the arriving air had recent contact with the surface, where both natural and anthropogenic emissions primarily occur. Figure 4 shows an ∼5-year climatology of the “footprint emission sensitivity” (based on 50 d backward simulations with the FLEXible PARTicle dispersion model, FLEXPART; Stohl et al., 2005). The FLEXPART footprint is a 2D data field showing the sensitivity of the receptor (here the Zeppelin Observatory) to emissions at the surface (the “source–receptor relationship”) for all grid cells in the domain, accounting for horizontal and vertical transport; chemical reactions; and, where applicable, particle wet and dry deposition; i.e. for a given flux of a component in one grid cell, the quantity reaching the observatory is known and/or modelled.
The simulations were performed for a black carbon tracer, for which dry and wet deposition were accounted for. This reduces the emission sensitivity backwards in time. While the details of the footprint emission sensitivity maps depend on the lifetime of the model tracer used, the maps clearly indicate where air masses arriving at the observatory had recent surface contact. For comparison, very similar results are shown in Fig. 1 of Hirdman et al. (2010) for a passive tracer. Figure 4 (right panel) shows that in summer the emission sensitivity is mostly restricted to ocean areas and does not extend deeply into the continents. Transport modelling thus further supports earlier conclusions by, for example, Iversen (1984) that transport is only from regions of a similar potential temperature, a consequence of the so-called “polar dome” that prevents warmer continental air masses from entering the Arctic lower troposphere (Stohl, 2006). In contrast, during the Arctic haze season (defined here as the period December to March; Fig. 4, left), transport of emissions takes place particularly from northern Europe and Siberia, as illustrated by the elevated emission sensitivities there. Similar findings are documented by potential source contribution function (PSCF) modelling of equivalent black carbon observations (eBC – black carbon calculated from absorption measurements) for the cold and warm periods in Eleftheriadis et al. (2009).
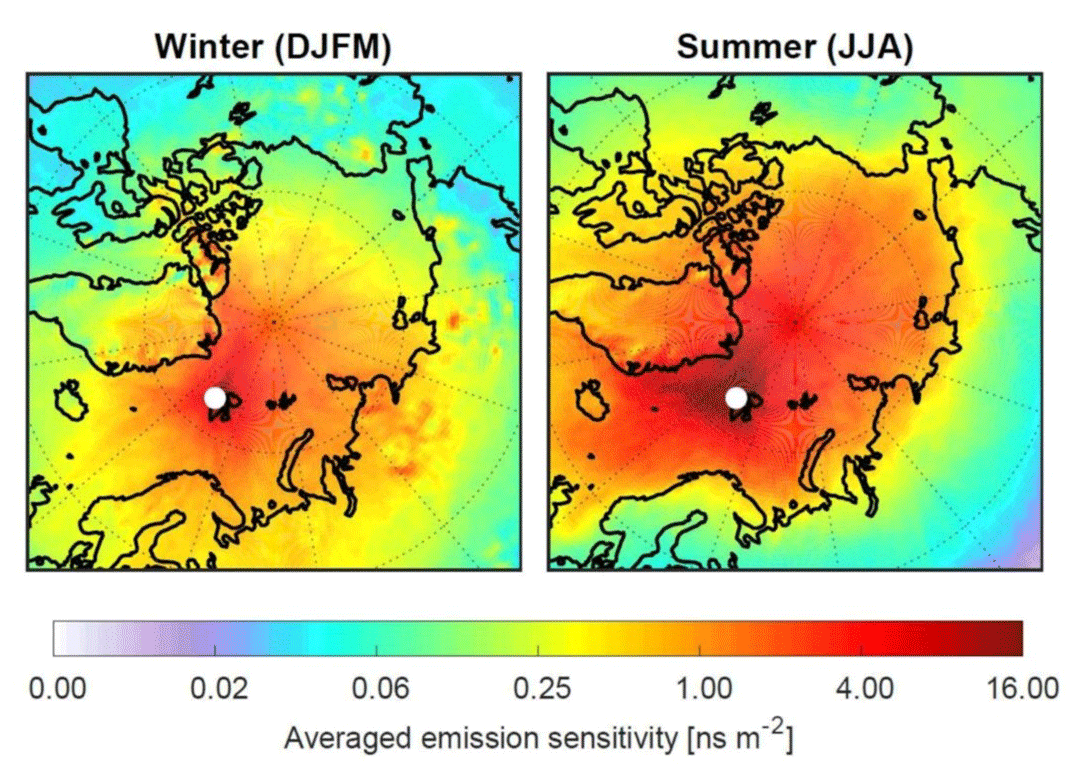
Figure 4Footprint emission sensitivity for a black carbon tracer obtained from FLEXPART 50 d backward calculations based on operational meteorological analyses for the period February 2014 to November 2018. The left panel shows the Arctic haze period (December, January, February, March) and the right panel the summer period (June, July, August). The unit of the footprint is nanoseconds per square metre (ns m−2), demonstrating that a longer residence time of an air mass over the surface leads to higher sensitivity to emissions. The concentration change at the receptor is the product of flux × sensitivity.
For aerosols such as sulfate and black carbon, more efficient scavenging in summer is also an important factor shaping seasonal variations (Tunved et al., 2013). This is likely a result of the transition from ice-phase cloud scavenging to the much more efficient warm cloud scavenging and the appearance of drizzle in the summer boundary layer in the Arctic (Browse et al., 2012). The relative contributions of seasonal variations in transport, scavenging, and changes in emissions are still debated, since models have problems reproducing the observed seasonal cycles of aerosols at the Zeppelin Observatory and at other Arctic stations (Eckhardt et al., 2015). However, the seasonality of atmospheric transport, particularly transport from major source regions in northern Eurasia, certainly plays an important role (Stohl, 2006; Freud et al., 2017). It has also been noted that at the Zeppelin Observatory the transition from Arctic haze conditions to the much cleaner summer conditions can occur very rapidly (within a few days). At the same time there is usually a shift in the aerosol size distribution from a dominant accumulation mode towards smaller Aitken mode particles (particle diameter typically <60 nm; e.g. Tunved et al., 2013), indicating a very different origin of the chemical load observed.
Transport modelling can also be used to investigate the sources of air pollutants measured at the Zeppelin Observatory. As an example, we have used aethalometer measurements of eBC. The instrument and dataset have been described earlier in Eleftheriadis et al. (2009). We have sorted the aethalometer data into the top (90 %) and bottom (10 %) values of the aerosol absorption coefficient and show the footprint emission sensitivities for these deciles in Fig. 5, left and right panels, respectively, both for the Arctic haze period (Fig. 5, top) and for summer (Fig. 5, bottom). We see that in winter the lowest eBC is transported almost exclusively from the North Atlantic sector, where there are few eBC sources and where scavenging in frontal systems is efficient. In contrast, the highest eBC concentrations are transported over the Arctic Ocean (where there is little scavenging in winter) and the high values of emission sensitivities extend deeply into Siberia and eastern Europe; i.e. when the polar front is located north of the main pollutant source regions, the pollution concentrations in the Arctic boundary layer are low. When the polar front is south of important pollution sources, e.g. in northern Russia, the pollution levels in the Arctic boundary layer can be much higher. This confirms earlier suggestions that these are the major source regions of eBC measured at the Zeppelin Observatory (Eleftheriadis et al., 2009; Hirdman et al., 2010).
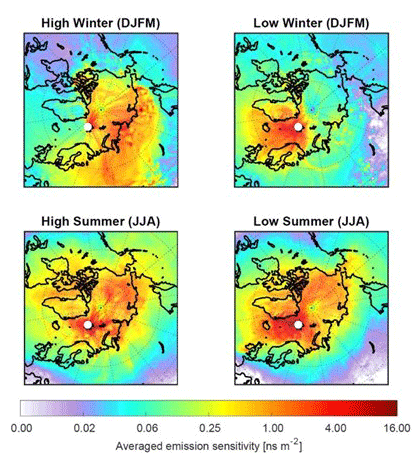
Figure 5FLEXPART footprint emission sensitivities for a black carbon tracer for the 10 % highest (left) and 10 % lowest (right) values of the measured aerosol absorption coefficient (equivalent black carbon), based on data for the years 2014 to 2017.
In summer, the lowest eBC concentrations are again associated with transport from the North Atlantic but also with transport from the Arctic Ocean, where scavenging in stratus clouds is efficient. The transport for the highest eBC concentrations in summer does not occur over the North Atlantic Ocean, and the emission sensitivities again extend into Siberia, albeit much less extensively than in winter. While we chose eBC as an example, similar results are obtained for most other aerosols, e.g. sulfate (Hirdman et al., 2010), and gases, e.g. methane (Pisso et al., 2016). Particularly intensive pollution episodes can be observed at the Zeppelin Observatory when direct transport from the continent occurs during periods of intensive biomass burning there (Stohl, 2006; Eckhardt et al., 2007; Stohl et al., 2007).
The unique location of the Zeppelin Observatory, with strong institutional support for the science and operations, makes the Zeppelin Observatory an ideal platform for measurements of numerous atmospheric constituents both for monitoring and field campaigns and for participation in international measurement programmes, as detailed here.
4.1 Aerosol chemical composition
Measured aerosol chemical constituents at Zeppelin include levels of inorganic ions and inorganic species and of primary biological aerosol particles (PBAPs) and other carbonaceous species including eBC and online measurements of non-refractory species (species such as organic aerosol and ammonium sulfate/nitrate that vaporize rapidly at ∼600 ∘C under vacuum) (Table 1). Heavy metals and mercury, also particulate species, are discussed separately in Sect. 4.6.
Table 1Aerosol composition and inorganic species measurements at the Zeppelin Observatory, listed chronologically by measurement starting year. See table footnotes for full lists of abbreviations.
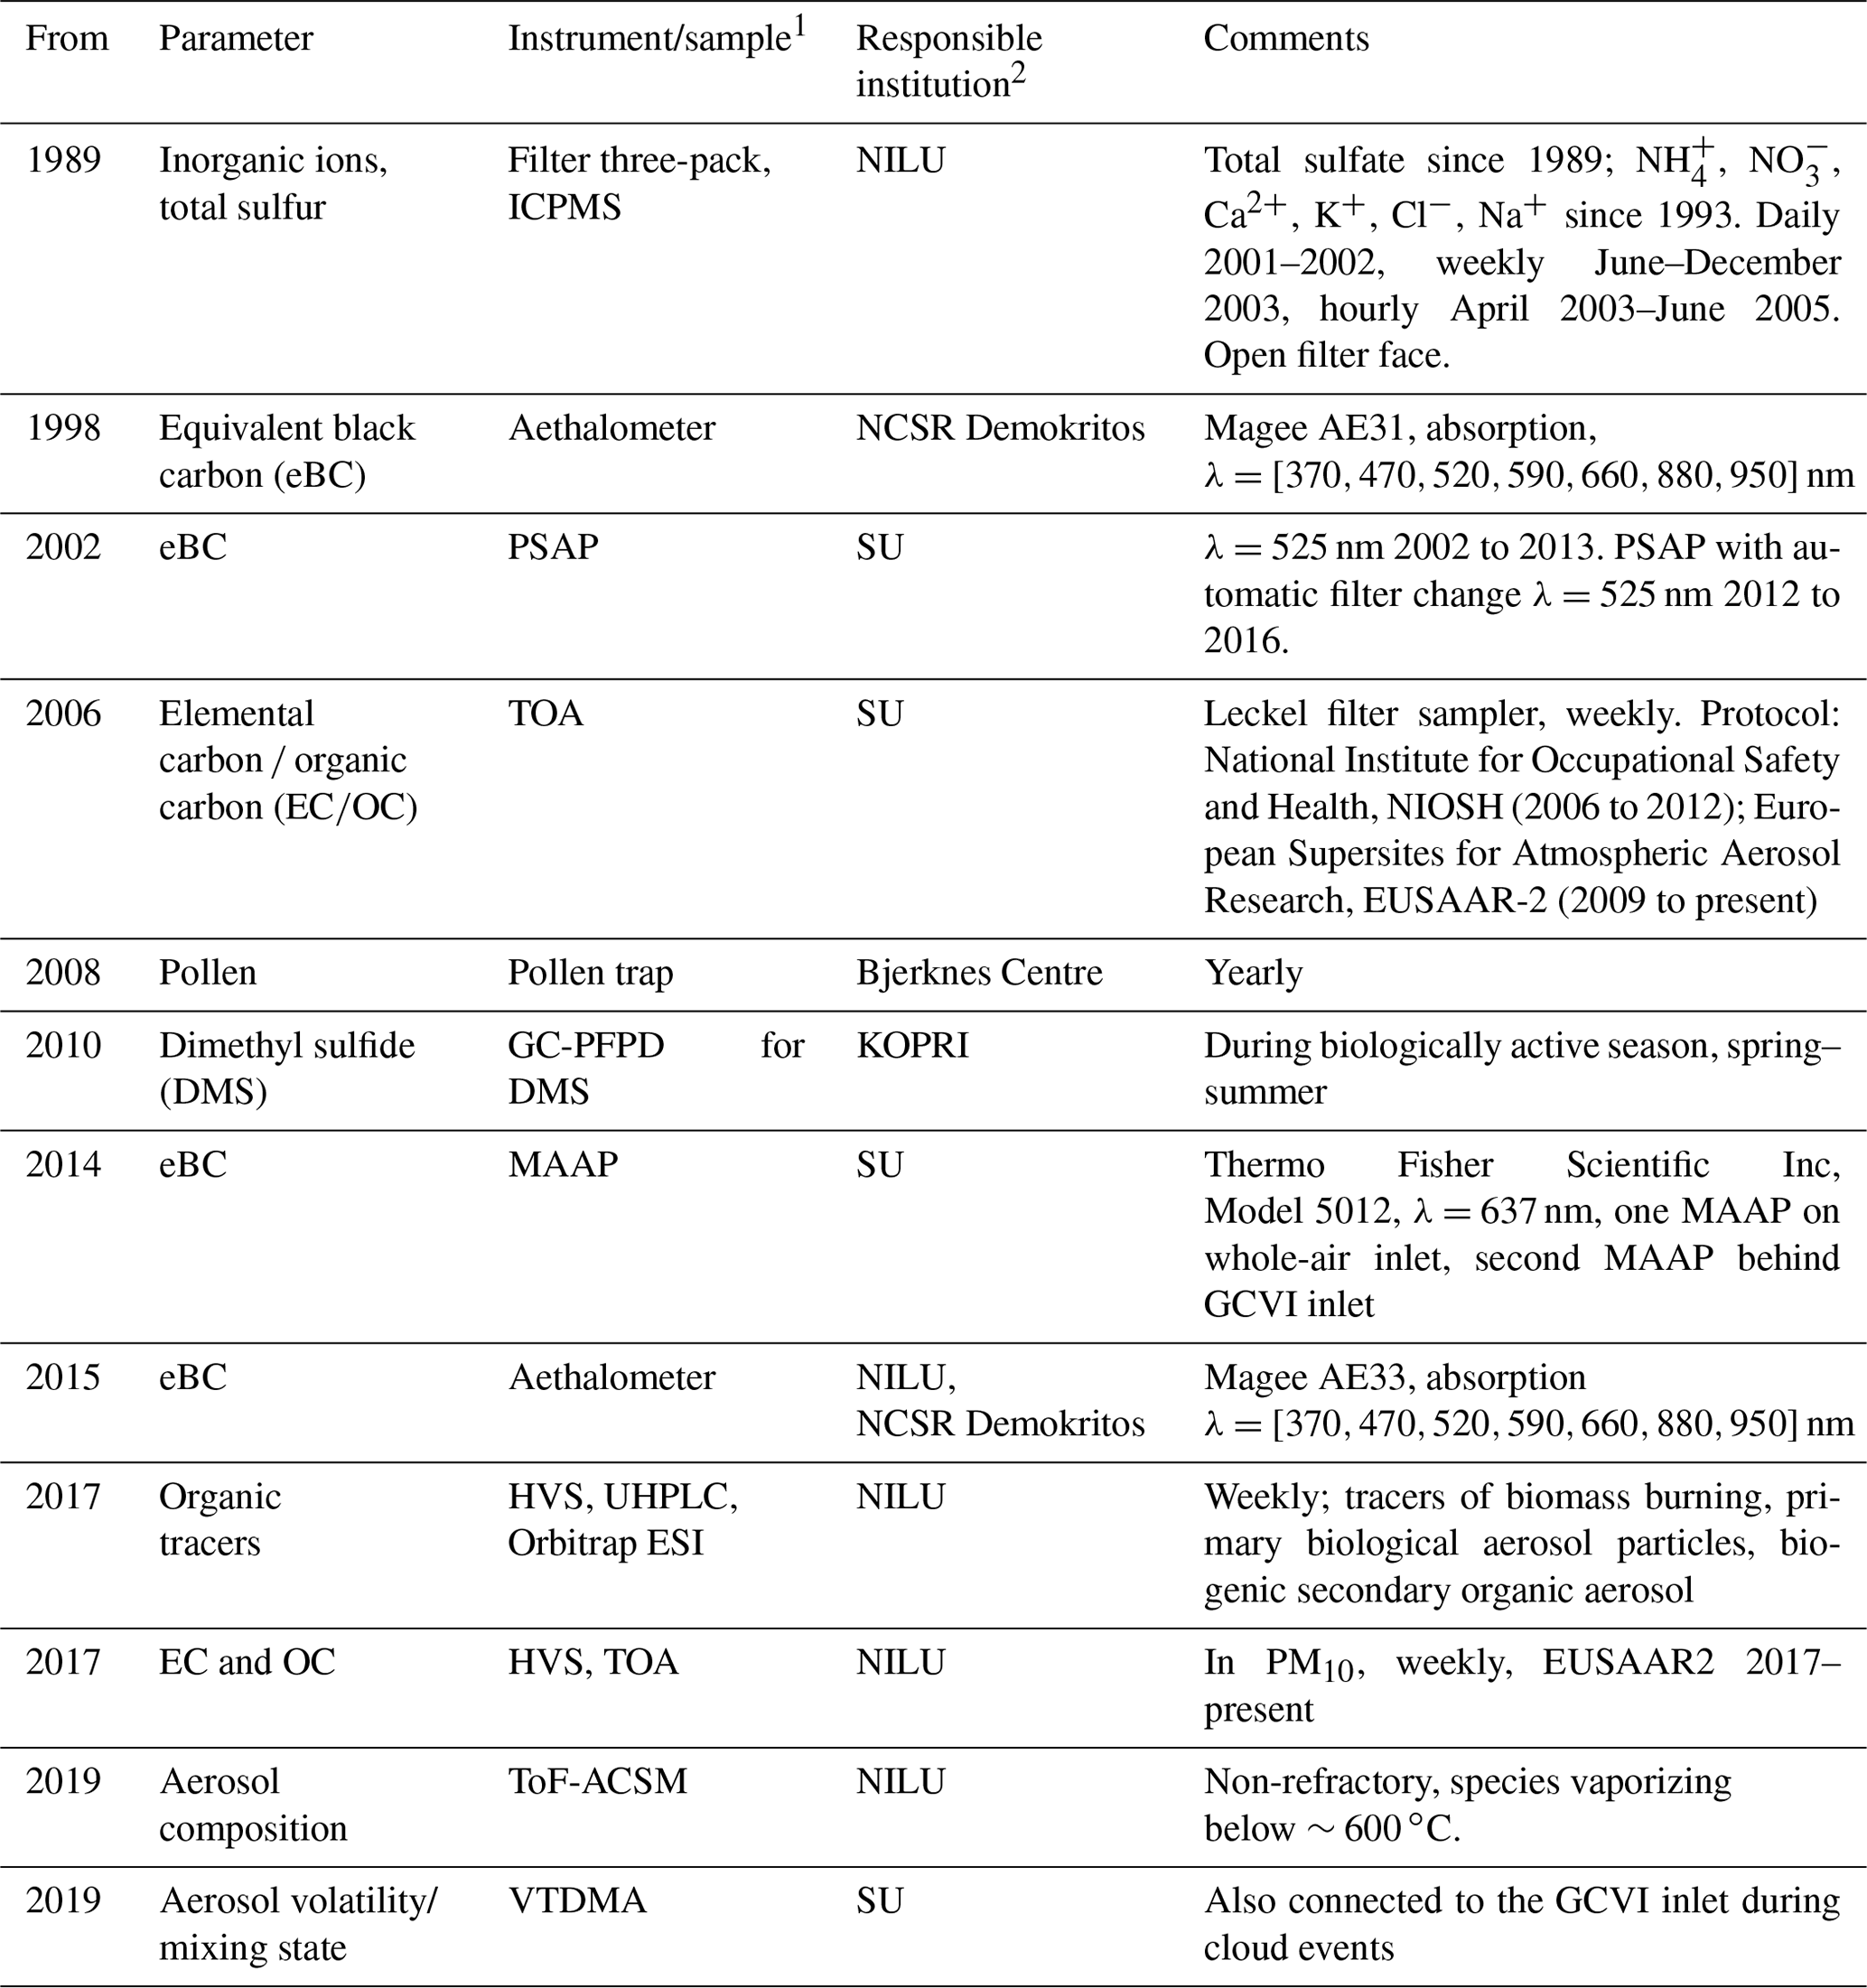
1 ICPMS: inductively coupled plasma mass spectrometry; HVS: high-volume sampler; TOA: thermal optical analysis; GC-PFPD: gas chromatography equipped with a pulsed flame photometric detector; PSAP: particle soot absorption photometer; MAAP: multi-angle absorption photometer; UHPLC: ultra-high-performance liquid chromatography; ESI: electrospray ionization in negative mode; ToF-ACSM: time-of-flight aerosol chemical speciation monitor; VTDMA: volatility tandem differential mobility analyser. 2 NILU – Norwegian Institute for Air Research; NCSR Demokritos – Institute of Nuclear and Particle Physics; NTNU – Norwegian University of Science and Technology; SU – Stockholm University; KOPRI – Korea Polar Research Institute.
The main inorganic anions (SO, NO, Cl−) and cations (NH, Ca2+, Mg2+, K+, Na+) in air are sampled daily using a three-stage filter pack for both gaseous and particulate-bound components (noting that species such as ammonium nitrate partition between particle and gas phases). The first stage is an aerosol filter (Zefluor Teflon 2 µm pore, 47 mm diameter, Gelman Sciences) and is followed by an alkaline potassium hydroxide (KOH) impregnated cellulose filter (Whatman 40) for HNO3, SO2, HNO2, HCl, and other volatile acidic substances. The filter pack method is biased in separating gaseous nitrogen compounds from aerosols, and therefore the sum (i.e. NO + HNO3 and NH3 + NH in micrograms of nitrogen (N)) is reported. The filter pack has no fixed size cut-off, but the effective size cut-off is ∼10 µm, except for episodes with high sea salt, mineral dust, or bioaerosol content, when larger particles have been observed.
After samples are collected, they are shipped to NILU's laboratory for analysis. The filters are put into test tubes with extraction solvents. The aerosol filters are extracted in Milli-Q water using ultra-sonic treatment to obtain complete extraction. Alkaline filters are extracted in a 0.3 % hydrogen peroxide solution to oxidize any remaining sulfite to sulfate. The acid-impregnated filters are extracted in 0.01 M of HNO3. The ions are analysed using ion chromatography, whereas NH3 collected on the acidic filter is determined as NH using an AutoAnalyzer.
Trends in inorganic ions are evaluated according to the Mann–Kendall test and Sen's slope (Mann, 1945; Kendall, 1948; Sen, 1968). Measurements of inorganic ions and total sulfur were an initial focus of atmospheric composition measurements in the Arctic and on Svalbard (Sect. 2.1). They are therefore some of the first measurements recorded at the observatory, and even when excluding prior measurements at Gruvebadet and Ny-Ålesund, the 30-year time series from the Zeppelin Observatory are among the longest in the world. The data are reported to the Norwegian national monitoring programme, e.g. Aas et al. (2019), and to EMEP (Tørseth et al., 2012).
Collection of aerosol filter samples for subsequent analysis of elemental carbon and organic carbon (EC and OC) in aerosol via a whole-air inlet, with an effective cut-off of ∼40 µm (Karlsson et al., 2020), began by SU in 2006 (Hansen et al., 2014). Samples are collected at weekly intervals onto pre-heated (800 ∘C for 30 min) quartz filters (Munktell & Filtrak GmbH, diameter 47 mm, grade T293) using a low-volume aerosol filter sampler (38 L min−1, Leckel sequential sampler SEQ 47/50, Sven Leckel Ingenieurbüro GmbH, Germany). was quantified initially according to a thermal optical analysis (TOA) protocol similar to that of NIOSH (transit time 800 s, sometimes 780 s in early cases, same temperature ramps as NIOSH) and later from 2009 (3 years of overlap) according to the EUSAAR2 temperature programme (Cavalli et al., 2010).
In parallel to the EC sampling via the whole-air inlet, sample collection for analysis of EC and OC and organic tracers in PM10 began in 2017 using a high-volume sampler with a PM10 inlet operated at a flow rate of 40 m3 h−1 and a filter face velocity of 72.2 cm s−1. Aerosol particles are collected on pre-fired quartz fibre filters (Pallflex Tissuquartz 2500QAT-UP, 150 mm in diameter) for 1 week and according to the quartz fibre filter behind quartz fibre filter (QBQ) set-up for an estimate of the positive sampling artefact of OC (Turpin et al., 1994; McDow and Huntzicker, 1990). The filters are shipped to NILU for thermal optical analysis (TOA), using the Sunset Lab EC and OC aerosol analyser operated according to the EUSAAR-2 temperature programme (Cavalli et al., 2010) and using transmission for charring correction. The instrument's performance is regularly intercompared as part of the joint EMEP–Aerosol, Clouds and Trace Gases Research Infrastructure (ACTRIS) quality assurance and quality control effort. The data in PM10 are reported as part of the Norwegian national monitoring programme (Aas et al., 2020).
From the same PM10 filters, tracers for biomass burning (BB, monosaccharide anhydrides), biogenic secondary organic aerosol (BSOA) precursors (2-methyltetrols), and primary PBAPs (sugars and sugar alcohols) are quantified using ultra-high-performance liquid chromatography (UHPLC) connected to an Orbitrap mass spectrometer (Q Exactive Plus) operated in the negative electrospray ionization (ESI−) mode (Dye and Yttri, 2005; Yttri et al., 2021). Separation is performed using two columns (2 mm × 2.1 mm × 150 mm HSS T3, 1.8 µm, Waters Corporation). Species are identified based on retention time and mass spectra of authentic standards. Isotope-labelled standards are used as the internal recovery standard. The limit of detection ranges from 1–10 pg m−3. A high-resolution time-of-flight aerosol chemical speciation monitor (HR-ToF-ACSM, Aerodyne), measuring non-refractory organic aerosol, sulfate, nitrate, ammonium, and chloride, has been in operation at the Zeppelin Observatory since 2016.
There are several ongoing parallel aerosol absorption and eBC measurements being made at the Zeppelin Observatory. SU operated a custom-built particle soot absorption photometer (PSAP) from 2002 to 2015, which was accompanied by a multi-angle absorption photometer (MAAP) in 2014. NCSR Demokritos has operated a seven-wavelength aerosol absorption photometer (Magee Scientific, AE31 aethalometer) at Zeppelin since the 1990s (Eleftheriadis et al., 2009), and since 2015, NILU and NCSR Demokritos have jointly operated a newer-model seven-wavelength aerosol absorption photometer (Magee Scientific, AE33 aethalometer) with automatic “dual-spot” compensation for the filter loading effect.
4.2 Aerosol physical properties
Aerosol physical properties have been measured at the Zeppelin Observatory from the start in 1989, providing one of the longest time series of aerosol optical and physical properties from the polar regions. All in situ instrumentation samples from a whole-air inlet (combined aerosol and cloud particles). The inlet system follows the Global Atmosphere Watch (GAW) guidelines for aerosol sampling (WMO, 2016) and was constructed following the guidelines of ACTRIS and the World Calibration Centre for Aerosol Physics (WCCAP) at the Leibniz Institute for Tropospheric Research, Germany (https://www.gaw-wdca.org/, last access: 8 February 2022). The inlet is slightly heated to prevent freezing. All aerosol properties are sampled in conditions of low relative humidity (RH) due to the strong temperature gradient between ambient and indoor temperature, and no active drying is needed. Note, however, that Arctic ambient light scattering coefficients are generally larger than for elsewhere due to the hygroscopicity of aerosol particles and successive water uptake at elevated RH. The so-called “light scattering enhancement” is much more pronounced in the Arctic compared to in more continental sites (Zieger et al., 2010, 2013).
The first aerosol physical observations started with continuous nephelometer measurements of aerosol light scattering. The total particle number concentration is measured by condensation particle counters (CPCs; TSI Inc, models 3025 and 3010). The size distribution of sub-micron particles has been recorded by using a custom-built closed-loop differential mobility particle sizer (DMPS) system since 2000 (see e.g. Tunved et al., 2013). The system has been continuously improved and now measures the particle size distribution from around a 5 to >800 nm mobility diameter with a synchronized twin DMPS system. DMPS 2a (Fig. 6) measures at 5 to 57 nm with a short differential mobility analyser (DMA), and DMPS 2b (Fig. 6) measures at 20–809 nm with a long DMA. Both DMPSs use a CPC (TSI Inc, USA, Model 3010) behind the DMA and a CPC (TSI Inc, USA, Model 3010) for measuring the total aerosol particle concentration. Coarse-mode aerosol has been continuously recorded since spring 2018 with an optical particle size spectrometer (OPSS; Fidas 200 E, Palas GmbH), which is situated on the measurement platform of the Zeppelin Observatory. At the same time, measurement programmes have been added from other institutions, notably in South Korea and Japan (Table 2).
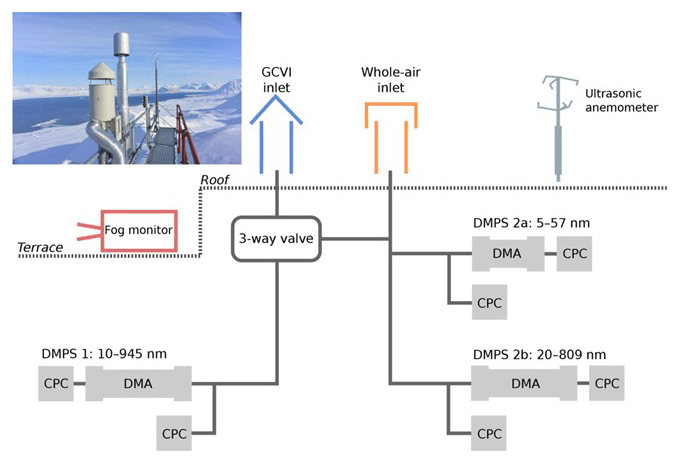
Figure 6Schematic illustration of the experimental set-up at the Zeppelin Observatory. The diagram shows how the whole-air inlet (orange) and the ground-based counterflow virtual impactor (GCVI) inlet (blue) are connected to the differential mobility analysers (DMAs) and condensation particle counters (CPCs). The three-way valve switches the sample flow to the instruments on the left-hand side from the GCVI inlet to the whole-air inlet when there is no cloud to be sampled. Cloud sampling is activated if the visibility drops below 1 km (measured by a visibility sensor (not pictured) next to the GCVI inlet). Auxiliary measurements from a fog monitor and an ultrasonic anemometer are included in the data analysis. Figure from Karlsson et al. (2021).
Table 2Aerosol physical property measurements at the Zeppelin Observatory and measurement owner (institute), listed chronologically by measurement starting year. See table footnotes for full lists of abbreviations.
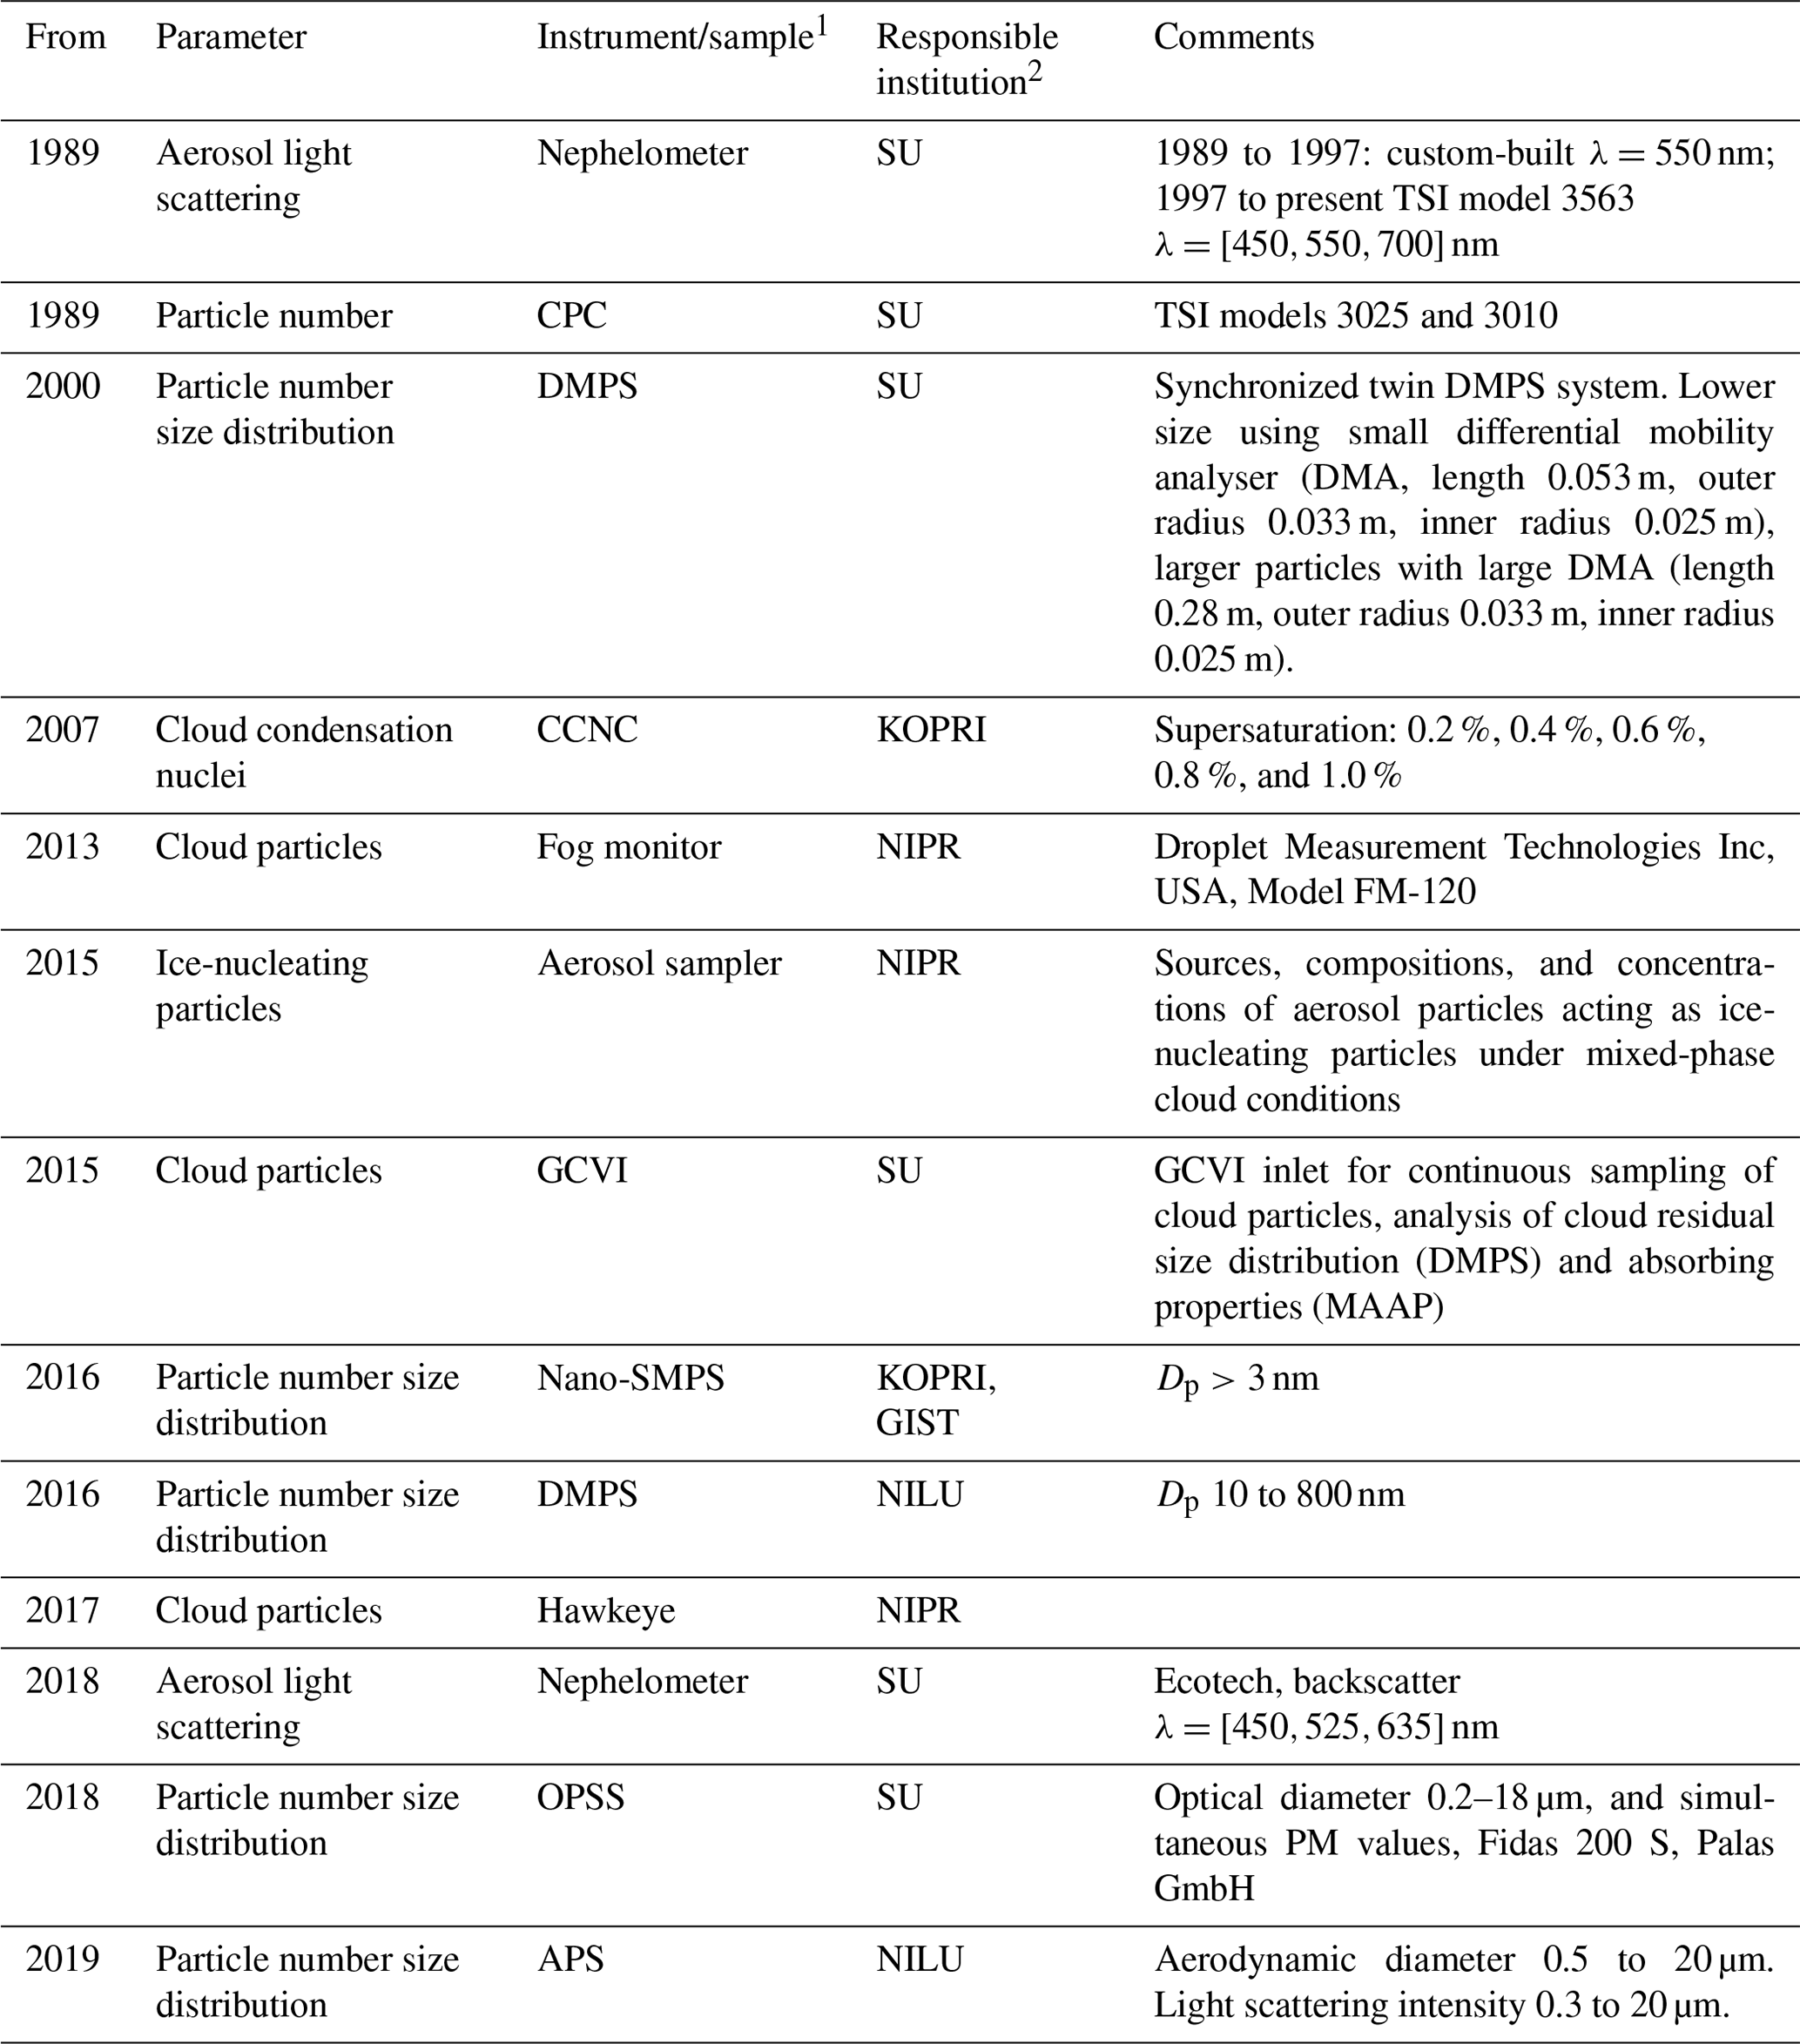
1 CPC: condensation particle counter; DMPS: differential mobility particle sizer; CCNC: cloud condensation nuclei counter; SMPS: scanning mobility particle sizer; GCVI: ground-based counterflow virtual impactor; OPSS: optical particle size spectrometer; APS: aerodynamic particle sizer. 2 SU – Stockholm University; NILU – Norwegian Institute for Air Research; KOPRI – Korea Polar Research Institute; NIPR – National Institute of Polar Research (Japan); GIST – Gwangju Institute of Science and Technology (Korea).
To further investigate links between aerosol composition, physical properties, and the Arctic climate, a major effort in long-term observation of the interaction between the aerosol and clouds began at the Zeppelin Observatory in 2015. As the observatory is often embedded in low-level clouds, it is a unique site in the Arctic. General observations of the total aerosol are complemented by a similar instrumental set-up of “cloud residuals”, i.e. those particles which have been involved in cloud formation such as cloud condensation nuclei (CCN) or ice-nucleating particles (INPs). The cloud droplets or ice crystals are sampled through a special inlet, the ground-based counterflow virtual impactor (GCVI) inlet, separating them from other non-activated, interstitial particles in the cloud. The cloud droplets or crystals are then dried, and the cloud residuals are measured by the set of aerosol instruments connected to the GCVI (Fig. 6). Further technical description and analysis of the first 2 years of observations can be found in Karlsson et al. (2021). With the current set-up, including cloud condensation nuclei counters (CCNCs), cloud residual properties, and cloud and precipitation microphysical properties, the Zeppelin Observatory is now (to the best of our knowledge) the first global aerosol observatory with continuous in situ observations of atmospheric aerosol, cloud residuals, clouds, and precipitation (e.g. Koike et al., 2019).
4.3 Atmospheric trace gases of high relevance to global climate change
The atmospheric trace gases of high relevance to global climate change/precursors with mixed biogenic/anthropogenic sources to the atmosphere currently measured at the Zeppelin Observatory are CO2, CH4, CO, nitrous oxide (N2O), reactive volatile organic compounds (VOCs) (e.g. ethane, propane; see also Sect. 4.4), and chloro- or bromomethane. Purely anthropogenic gases include chlorofluorocarbons (CFCs), hydrochlorofluorocarbons (HCFCs), hydrofluorocarbons (HFCs), and halons. Additional information on CO2 and CH4 is also provided by measurements of isotopic composition. These compounds have variously been adopted as part of national monitoring programmes, and the analysis techniques deployed have often allowed for measurements of other compounds not part of the monitoring programmes.
Stockholm University began CO2 measurements in 1989 as part of the GAW programme using infrared measurements. For 2001 to 2012 CH4 was measured using a gas chromatography with flame ionization detector (GC-FID) system with an inlet 2 m above the observatory roof with a precision of ±3 ppb at an hourly resolution, determined via calibrations to working standards calibrated to NOAA reference standards. Through the same inlet, CO was measured at 20 min intervals with a mercuric oxide detector (gas chromatography with mercuric oxide reaction tube – GC-HgO) calibrated to NOAA standards. Since April 2012, CH4, CO2, and CO at Zeppelin have been measured using a cavity ring-down spectroscope (CRDS, Picarro G2401) at a 1 min resolution with a sample inlet 15 m above the observatory roof. The CRDS is measured daily against target gases and calibrated every 3 weeks against working standards, which are calibrated to NOAA reference standards. For both measurement regimes, sampling was performed through a Nafion drier to minimize any water correction error in the instruments.
As part of the harmonization of historic concentration measurements within the INGOS project (INGOS, 2016), the full time series from August 2001 to 2013 was reprocessed and archived in the ICOS Carbon Portal (Colomb et al., 2018). All original data were reprocessed with improved software, recalculating all measurements from the previous 12 years. This new software facilitates quality assurance and control and detection of measurement errors. For example, although the Zeppelin Observatory is located far from local sources, there are nevertheless occasional large baseline excursions in the mixing ratios due to long-range transport (Stohl et al., 2013, 2007). Hence, at least 75 % of calculated back trajectories within ±12 h of the sampling day must be from a clean sector (i.e. not from Europe, North America, or Russia) before the data are considered background mixing ratios (Myhre et al., 2020). The old data were also analysed against new reference standards using new improved instrumentation. All other working standards are linked to these through comparative measurements. Hence, calibration factors for the first 12-year period were also recalculated during the reprocessing.
The Zeppelin Observatory is now recognized as an ICOS class-1 site for observations of carbonaceous greenhouse gases; i.e. the Zeppelin Observatory fulfils all the core criteria outlined by ICOS required for contribution to a harmonized high-quality global dataset to quantify the exchange of carbon between the surface ocean and the atmosphere, ocean acidification, and interior ocean carbon transport and storage (Yver-Kwok et al., 2021). All data from the EMEP–ICOS measurements are available at https://ebas.nilu.no/ (last access: 8 March 2019; EBAS, 2019), the ICOS Carbon Portal (Colomb et al., 2018), and reported annually, e.g. Myhre et al. (2020). Annual trends in atmospheric trace mixing ratios are calculated for clean background data according to Simmonds et al. (2006), whereby the change in the atmospheric mixing ratio of a species as a function of time is fitted to an empirical equation combining Legendre polynomials and harmonic functions with linear, quadratic, and annual and semi-annual harmonic terms.
δ13C measurements (the shift in the carbon-13, 13C, fraction in methane compared to the Vienna Pee Dee Belemnite reference standard, VPDB) were initiated by the INSTAAR (Institute of Arctic and Alpine Research, University of Colorado Boulder) lab in 2001, who also began δD (shift in deuterium, D, compared to Vienna Standard Mean Ocean Water, VSMOW) measurements in 2003. The latter programme was cancelled in 2010. Parallel δ13C measurements by NILU along with new δD measurements began in 2012. In 2017, δ13C measurements were adopted as part of Norwegian national monitoring. The NILU isotope samples are collected in 1 L steel or aluminium canisters at the same air inlet as CH4. Two samples per week are sent to the greenhouse gas laboratory at Royal Holloway, University of London. The CH4 mole fraction is measured using a CRDS (Picarro, G1301), while δ13C analysis is carried out using a modified gas chromatography isotope ratio mass spectrometry system for all samples (Isoprime, GV Instruments) with 0.05 ‰ repeatability. All measurements for the canisters are made in triplicate. See e.g. Nisbet et al. (2019) for more details. δDCH4 measurements are performed at the University of Utrecht on flask samples using a continuous-flow isotope ratio mass spectrometry (CF-IRMS) technique with a precision of 2.3 ‰ (Brass and Röckmann, 2010). A high-resolution (2 min) instrument for CH4 isotopes (CH4 Isotope Monitor for δ13CH4 and δCH3D, Aerodyne) was installed in 2018 by SU, with a precision (30 min averaging) of 0.1 ‰ and 3 ‰ for δ13C and δD, respectively.
For 2001 to 2010, measurements of a wide range of HCFCs and HFCs (e.g. HCFC-141b, HCFC-142b, HFC-134a), methyl halides (CH3Cl, CH3Br, CH3I), and halons (e.g. H-1211, H-1301), see Table 3, were measured with adsorption–desorption system gas chromatography with mass spectrometry (ADS-GCMS) as part of the Advanced Global Atmospheric Gases Experiment (AGAGE) network (Prinn et al., 2008). Many compounds, CFCs and others, were measured with this system but did not meet AGAGE standards for precision due to unsolved instrumental problems, e.g. possible electron overload in the detector (for the CFCs), influence from other species, detection limits (CH3I, CHClCCl2), and unsolved calibration problems (such as for CH3Br). Thus, in September 2010, the ADS-GCMS system was replaced by an online gas chromatography with mass spectrometry (GCMS) instrument (Medusa). The Medusa instrument can be used to measure hydrocarbons (e.g. benzene, ethane, n-butane, n-pentane, propane, and toluene, for ACTRIS) including the halogenated compounds previously measured by the ADS-GCMS system at the parts-per-trillion level (Miller et al., 2008) and is calibrated to AGAGE reference standards.
Gas chromatography with an electron capture detector (GC-ECD) was used for N2O with a high time resolution of 15 min until 2017. N2O at Zeppelin is now measured at a <1 min resolution with a mid-IR CRDS (Picarro G5310) which is calibrated against ICOS reference standards (NOAA scale). Instrument data are submitted to ring tests and measurement control/calibration following ICOS protocols. The high-time-resolution data are also compared to weekly flask samples sent to the NOAA ESRL Global Monitoring Laboratory, Boulder, Colorado.
Table 3Measurements of trace gases at the Zeppelin Observatory, the atmospheric constituent(s) measured, and responsible institutes, listed chronologically by measurement starting year. See table footnotes for full lists of abbreviations.
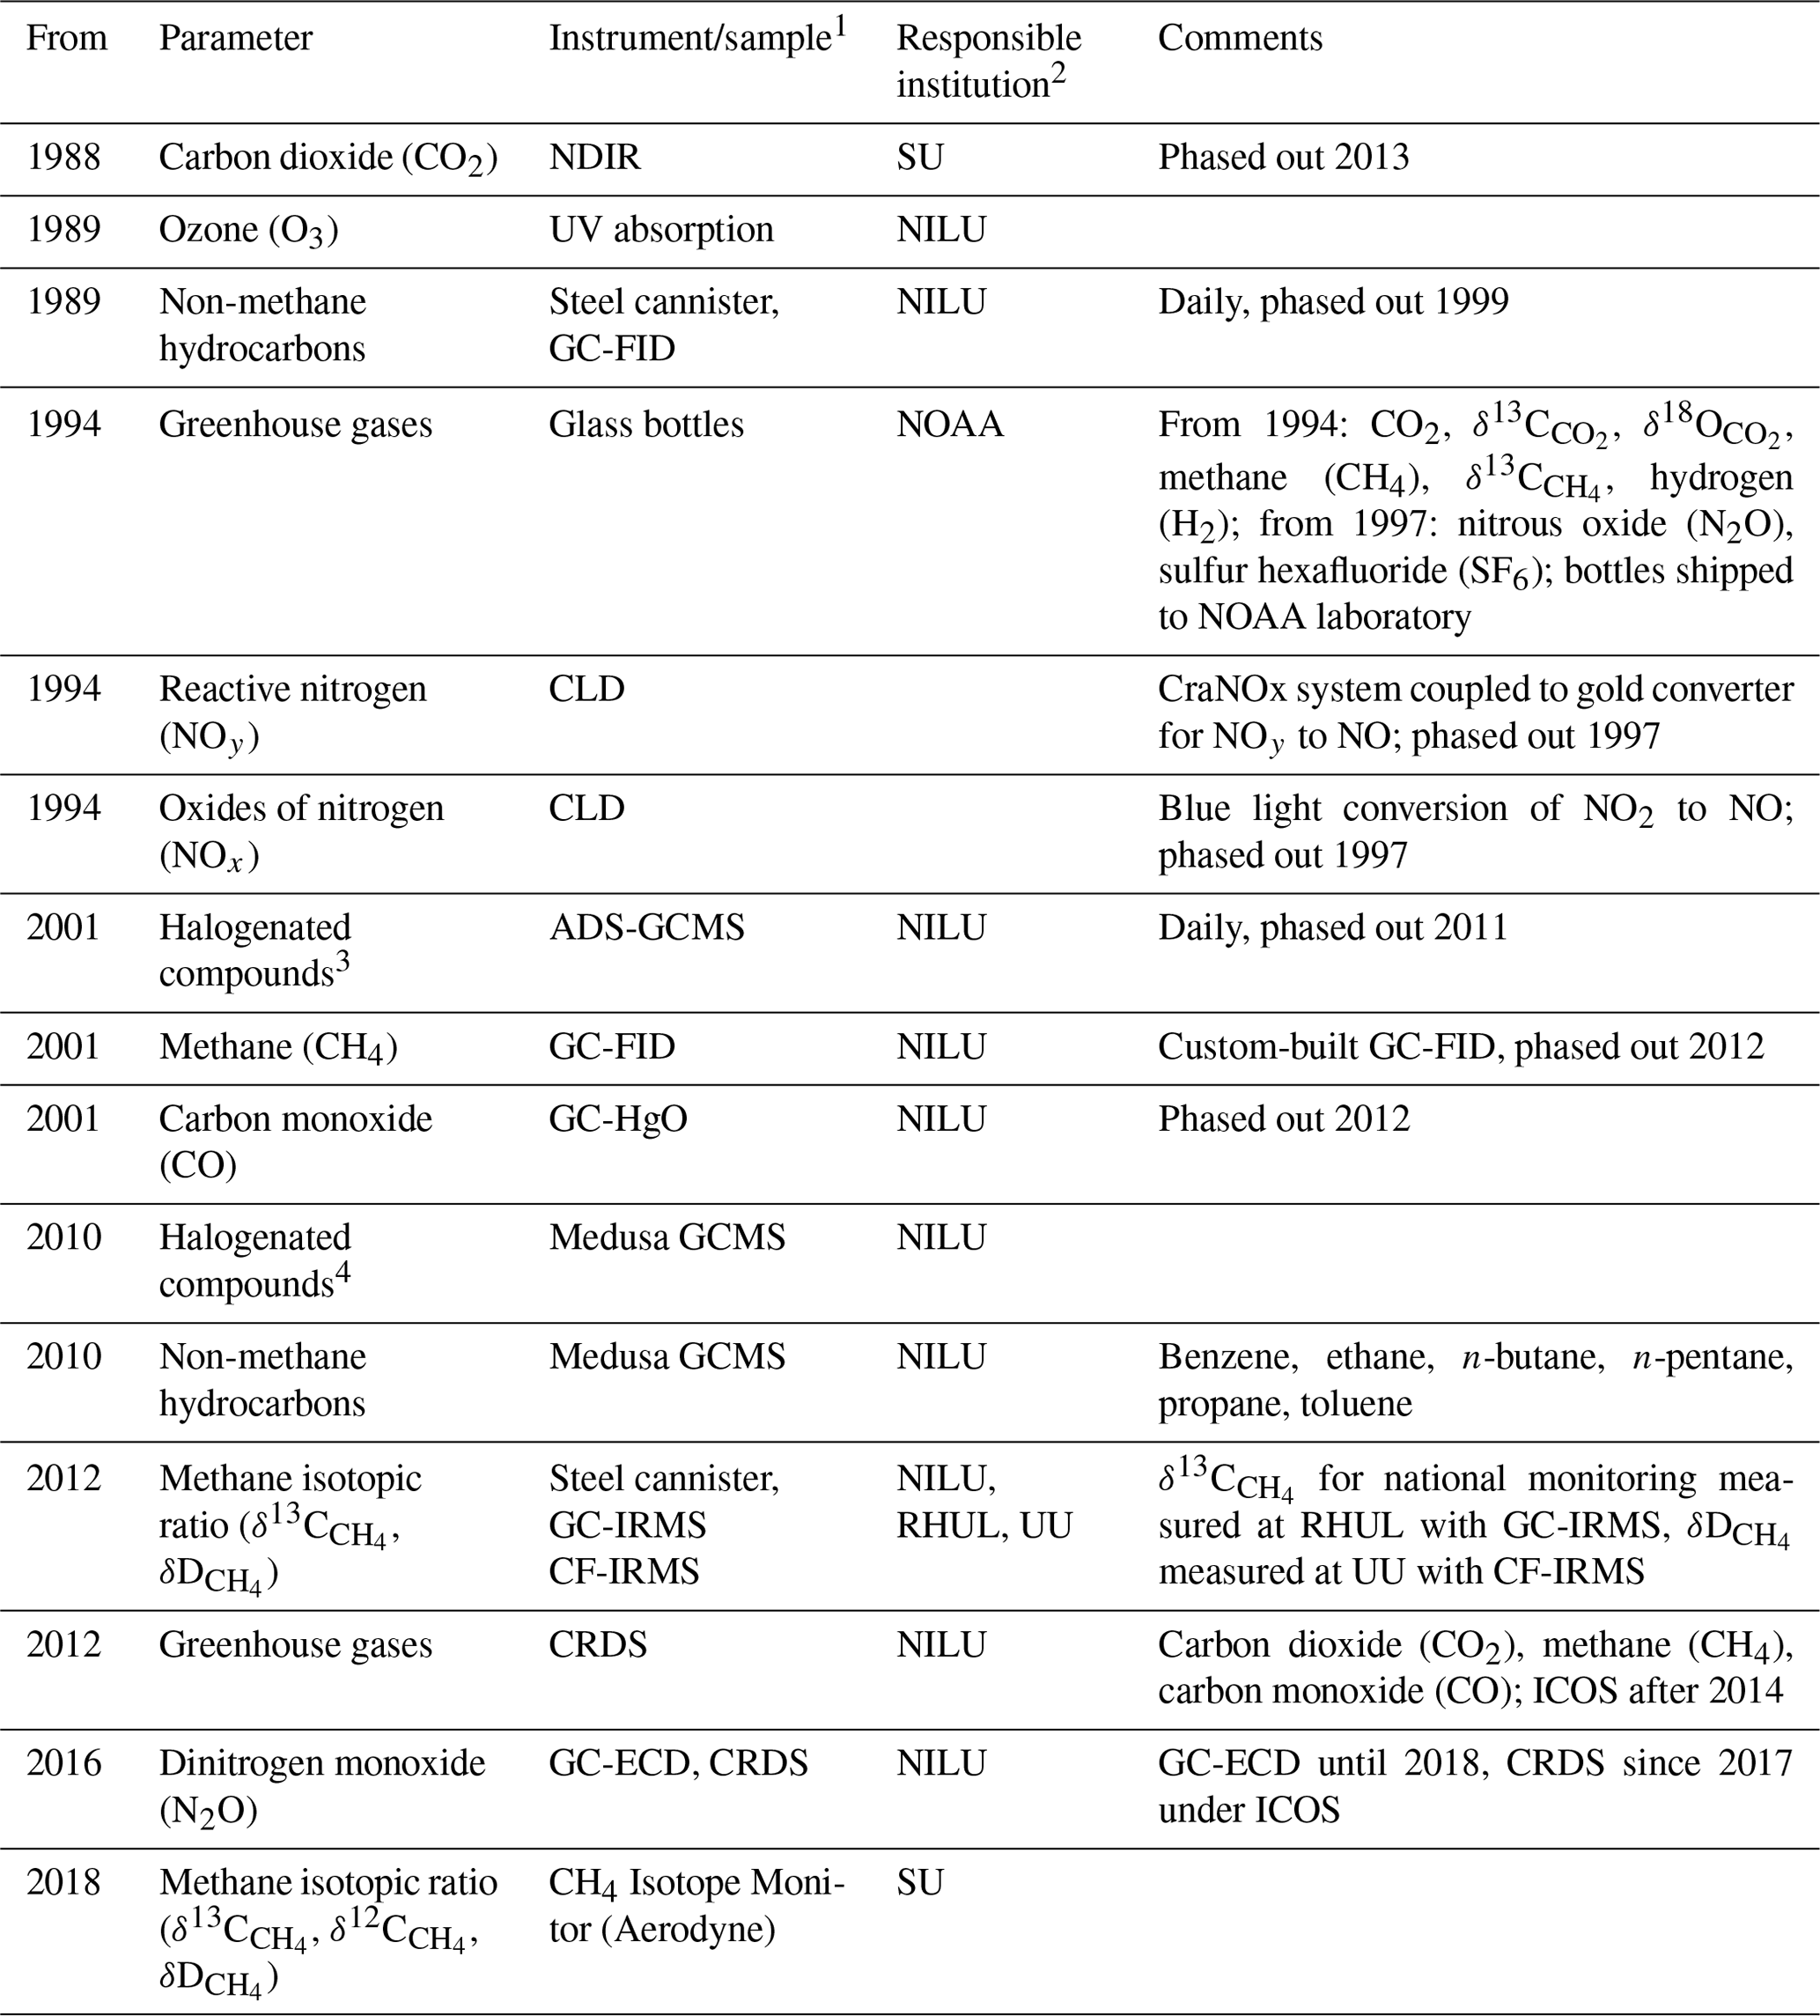
1 NDIR – non-dispersive infrared; CLD: chemiluminescence detector; ADS-GCMS – adsorption–desorption system gas chromatography with mass spectrometry; GC-FID – gas chromatography with flame ionization detector; CD – chemiluminescence detector; GC-HgO – gas chromatography with mercuric oxide (HgO) reaction tube; Medusa GCMS – gas chromatography with mass spectrometry using the Medusa instrument; GC-ECD – gas chromatography with an electron capture detector; GC-IRMS – gas chromatography with isotope ratio mass spectrometry; CF-IRMS – continuous-flow isotope ratio mass spectrometry; CRDS – cavity ring-down spectroscope (Picarro). 2 SU – Stockholm University; NILU – Norwegian Institute for Air Research; RHUL – Royal Holloway, University of London; UU – University of Utrecht. 3 Chlorofluorocarbons: CFC-11, CFC-113, CFC-115, CFC-12 (not within AGAGE required precision but part of the AGAGE quality assurance programme); halons: H-1211, H-1301; hydrochlorofluorocarbons: HCFC-141b, HCFC-142b, HCFC-22; hydrofluorocarbons: HFC-125, HFC-134a, HFC-152a; bromomethane; chloromethane; dichloromethane; sulfur hexafluoride; tetrachloroethene; trichloroethane; trichloroethene; trichloromethane. 4 Chlorofluorocarbons: CFC-11, CFC-113, CFC-115, CFC-12; halons: H-1211, H-1301, H-2402; hydrochlorofluorocarbons: HCFC-141b, HCFC-142b, HCFC-22; hydrofluorocarbons: HFC-125, HFC-134a, HFC-143a, HFC-152a, HFC-227a, HFC-23, HFC-236fa, HFC-245fa, HFC-32, HFC-365mfc, HFC-4310mee; perfluorocarbons: PFC-116, PFC-14, PFC-218, PFC-318; bromomethane; chloromethane; dibromomethane.
4.4 Non-methane hydrocarbons
As part of the EUROTRAC-TOR project (see Sect. 2.3), manual NMHC sampling in steel canisters was initiated at the Zeppelin Observatory when the observatory opened in September 1989 (Hov et al., 1989) (Table 3). The canister samples were collected two to three times a week with a filling time of 10 to 15 min and then shipped to NILU's laboratory for chemical analyses. From 1989 to 1991, samples were analysed for nine C2 to C5 NMHCs. From 1992 this was extended to 26 species including aromatic compounds and C6 to C7 alkanes (Solberg et al., 1996a). In some of the following years the samples were collected every day during the spring to capture the strong decline in concentration levels in that season.
In 1992, a pilot measurement programme on light hydrocarbons, aldehydes, and ketones was initiated within EMEP (Solberg et al., 1995). A collaboration with the ongoing Tropospheric Ozone Research (TOR) project was established, meaning that the monitoring data were reported to both programmes. The aim of this programme was to collect VOC data at rural European background sites as a support to the modelling activities within EMEP.
As part of this pilot programme, regular sampling of aldehydes and ketones started at the Zeppelin Observatory (and nine other EMEP sites) in April 1994. The carbonyl sampling was performed with 2,4-dinitrophenylhydrazine (DNPH) adsorption tubes exposed for 8 h during the daytime on the same dates as the NMHC sampling (Solberg et al., 1996a, and references therein). This was probably the first routine monitoring programme of carbonyls in the world. When the EUROTRAC-2 programme ended, the national funding of the VOC measurements at Ny-Ålesund ended, and thus the monitoring of light hydrocarbons, aldehydes, and ketones had ceased by the end of 1999. In September 2010, an online GCMS instrument (Medusa) was installed at the Zeppelin Observatory for continuous CFC and HCFC monitoring (see previous section). In 2003, as part of the GAW programme, NOAA started scattered measurements of NMHCs with glass flasks at the Zeppelin Observatory. In 2006 the sampling of the NOAA flasks was carried out once a week.
4.5 Persistent organic pollutants
NILU's first director, Brynjulf Ottar, hypothesized that some semi-volatile chlorinated hydrocarbons exhibited the potential to undergo reversible atmospheric deposition, making such pollutants prone to long-term transfer from global source areas in warmer regions and into the Arctic (Ottar, 1981). Measurement campaigns at Ny-Ålesund on a range of such pollutants, now recognized as persistent organic pollutants (POPs), were performed by NILU from 1981 to 1984 (Oehme and Stray, 1982; Oehme and Manø, 1984; Oehme and Ottar, 1984; Pacyna and Oehme, 1988). These early campaigns, combined with air mass back trajectories, were pivotal in terms of documenting the potential for polychlorinated biphenyls (PCBs) and various organochlorine pesticides (e.g. dichlorodiphenyltrichloroethane – DDT) to undergo long-range atmospheric transport to the Arctic (Pacyna and Oehme, 1988; Oehme, 1991). Following 8 years without any further measurements, a new sampling campaign was carried out in 1992 (Oehme et al., 1995). An important objective of the latter campaign at Ny-Ålesund was to prepare for regular monitoring of POPs under the Arctic Monitoring and Assessment Programme (AMAP) (Oehme et al., 1996). Measurements of legacy POPs at Zeppelin, with the aim of an improved understanding of long-range transport of POPs and their spatial and temporal variability, have been a part of the Norwegian national air monitoring programme since 1993. The list of POP compounds included in the monitoring programme is continuously expanded and now also covers POP-like chemicals of emerging concern (POP CECs). POP data from the monitoring programme are reported to EMEP and AMAP, and aggregated data are also made available for use by the Global Monitoring Plan (GMP) of the Stockholm Convention on POPs through a data-sharing arrangement.
Long-term POP monitoring is based on the well-established high-volume active air sampling (HV-AAS) methodology (Bidleman and Olney, 1974). Air is pumped (∼25 m3 h−1) through a sampling unit containing a glass fibre filter for particle-bound POPs and two polyurethane foam (PUF) plugs as an adsorbent for gas-phase (volatile) POPs. The sampling interval is 24 to 72 h, based on a crucial balance of detection and breakthrough of the individual compounds and the interest in studying atmospheric source–receptor relationships using atmospheric transport models, e.g. to track the origin of air masses during interesting episodes (Eckhardt et al., 2007). For some emerging semi-volatile organic compounds not retained by PUF (e.g. per- and polyfluoroalkyl substances, PFASs), the PUF plugs are replaced by a PUF–XAD–PUF sandwich. Air samples for more volatile organic pollutants such as cyclic volatile methyl siloxanes (cVMSs) are collected at 72 h intervals using a solid-phase-extraction low-volume active air sampling (SPE-LV-AAS) instrument at a flow rate of ∼1 m3 h−1. From 2011 to 2019, this sampler contained an ENV+ sorbent (hydroxylated polystyrene divinylbenzene copolymer) but was replaced by an ABN adsorbent in 2019 as the cVMS isomers were shown to degrade/transform on the ENV+ sorbent (Krogseth et al., 2013). This highlights the need for continual development of sampling methodologies (Warner et al., 2020).
POPs are also measured in two international passive air sampling (PAS) networks, the Global Atmospheric Passive Sampling (GAPS) network (Pozo et al., 2006) and the monitoring network (MONET) of Europe (Klánová et al., 2009), alongside occasional PAS campaigns (Halvorsen et al., 2021; Halse et al., 2011) to support the EMEP programme (Tørseth et al., 2012). Passive air samples and active filter samples from the Zeppelin Observatory have also contributed to the Norwegian Environmental Specimen Bank (ESB) since 2014. The ESB contains and stores environmental samples from different matrices across Norway and acts as an archive for future research on currently unrecognized environmental contaminants, with the goal of supporting future environmental contaminant control strategies (e.g. Giege and Odsjö, 1993). The passive air sampling (PAS) is performed on either a polyurethane foam (PUF) disc or XAD-resin adsorbent, yielding time-weighted averages over the exposure period of 30 d to 1 year. Data from the PAS networks are reported to the GMP and have been crucial for global spatial coverage of POP data.
Table 4Measurements of persistent organic pollutants (POPs) and other environmental contaminants at the Zeppelin Observatory listed chronologically by measurement starting year and responsible institutions. See table footnotes for lists of abbreviations.
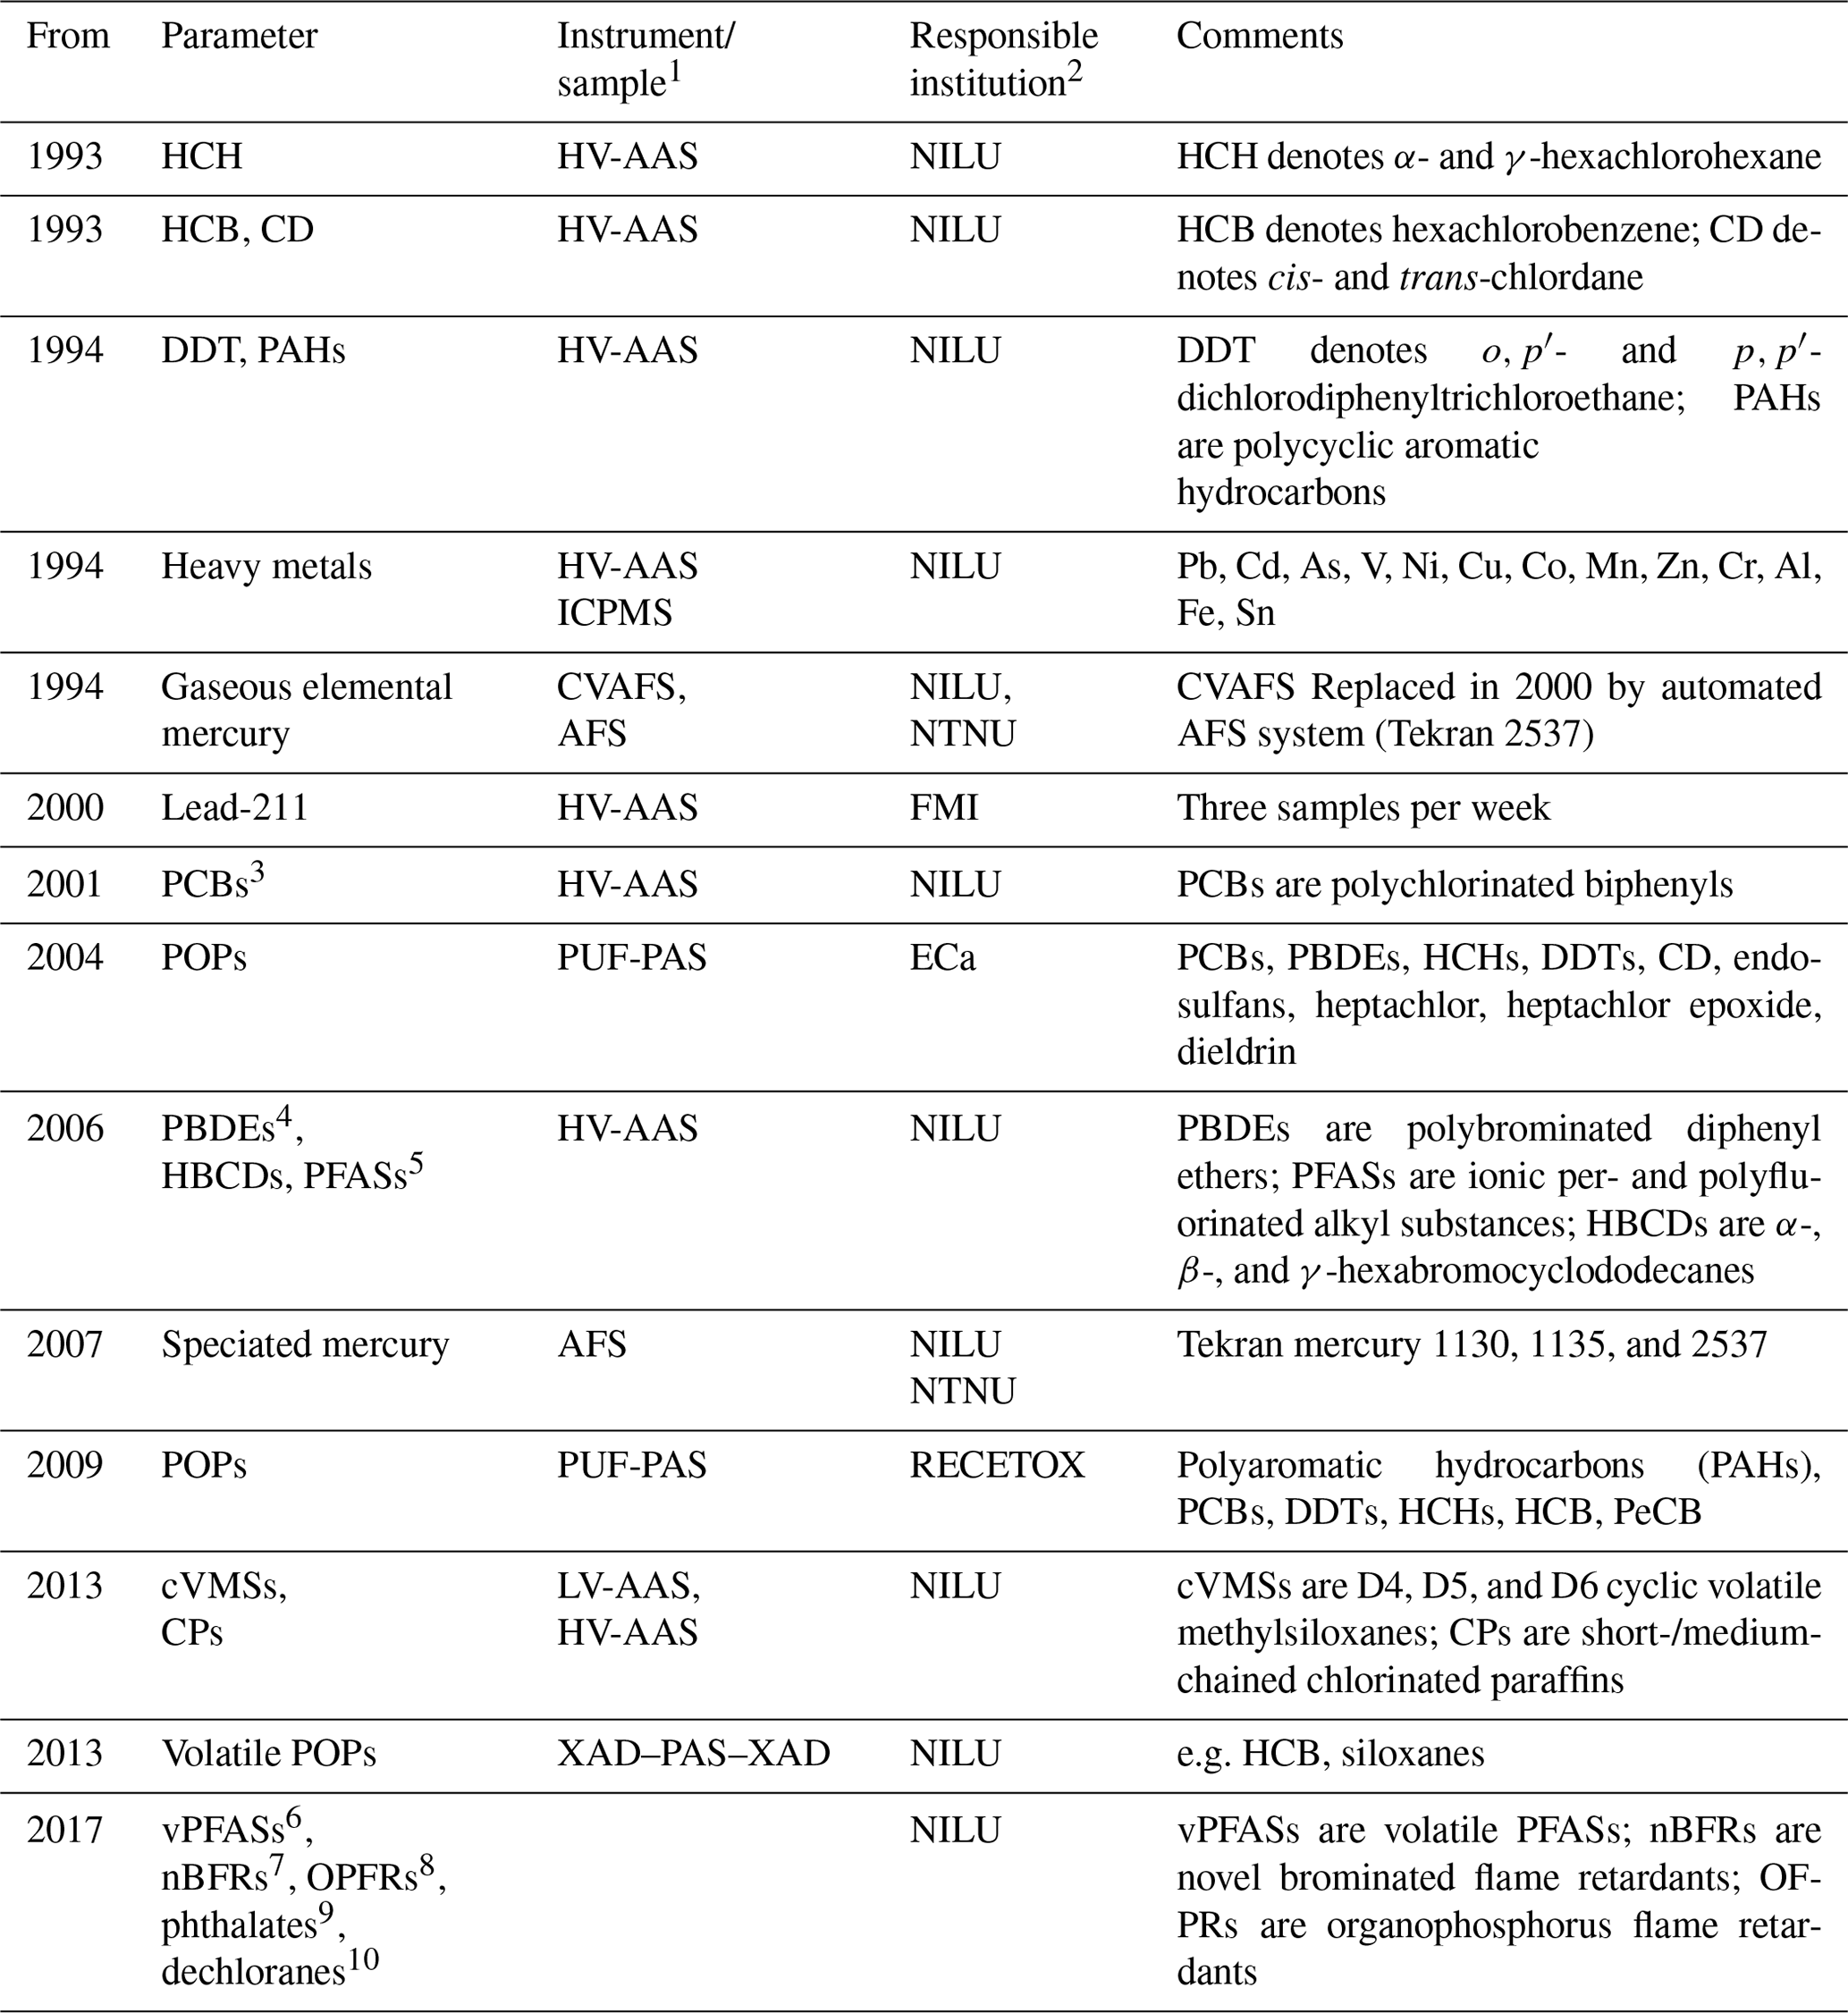
1 PUF-PAS: polyurethane foam passive air sampling; LV-AAS: low-volume active air sampling; HV-AAS: high-volume active air sampling; CVAFS: cold vapour atomic fluorescence spectroscopy; AFS: atomic fluorescence spectrometry; ICPMS: inductively coupled plasma mass spectrometry; XAD: registered trademark of the Dow Chemical Company, comprises a polystyrene copolymer resin; PAS: passive air sampling. 2 NILU – Norwegian Institute for Air Research; NTNU – Norwegian University of Science and Technology; FMI – Finnish Meteorological Institute; ECa – Environment Canada; RECETOX is a research centre at the Masaryk University Faculty of Science. 3 PCB-18, PCB-28, PCB-31, PCB-33, PCB-37, PCB-47, PCB-52, PCB-66, PCB-74, PCB-99, PCB-101, PCB-105, PCB-114, PCB-118, PCB-122, PCB-123, PCB-128, PCB-138, PCB-141, PCB-149, PCB-153, PCB-156, PCB-157, PCB-167, PCB-170, PCB-180, PCB-183, PCB-187, PCB-189, PCB-194, PCB-206, PCB-209. Data available before 2001 are classified as uncertain due to possible local contamination. 4 PBDE-28, PBDE-47, PBDE-49, PBDE-66, PBDE-71, PBDE-77, PBDE-85, PBDE-99, PBDE-100, PBDE-119, PBDE-138, PBDE-153, PBDE-154, PBDE-183, PBDE-196, PBDE-206, PBDE-209. 5 PFPeS, PFHxS, PFHpS, PFOS, PFOSlin, PFNS, PFDS, PFHxA, PFHpA, PFOA, PFNA, PFDA, PFUnDA, PFDoDA, PFTrDA, PFTeDA, PFHxDA, PFODcA, PFOSA, 4:2 FTS, 6:2 FTS, 8:2 FTS, PFBS. 6 4:2 FTOH, 6:2 FTOH, 8:2 FTOH, 10:2 FTOH, N-EtFOSA, N-EtFOSE, N-MeFOSA, N-MeFOSE. 7 ATE (TBP-AE); α-, β-, γ-, and δ-TBECH; BATE; PBT; PBEB; PBBZ; HBB; DPTE; EHTBB; BTBPE; TBPH; DBDPE. 8 TEP, TCEP, TPrP, TCPP, TBP, BdPhP, TPP, DBPhP, TnBP, TDCPP, TBEP, TCP, EHDP, TXP, TIPPP, TTBPP, TEHP. 9 MP, DEP, DPP, DAIP, DIBP, DBP, BBzP, DHP, DEHP, DcHP, DPHP, DINP. 10 Syn-dp, anti-dp, Dec-601, Dec-602, Dec-603, Dec-604, Dba.
4.6 Heavy metals and mercury
Sample collection of heavy metals (HMs) including mercury was initiated in 1994 as part of the Norwegian national monitoring programme (Table 4), and data are reported to EMEP and AMAP (Hung et al., 2010). Air samples of HMs (Pb, Cd, As, V, Ni, Cu, Co, Mn, Zn, and Cr) are collected on paper disc filters (Whatman 41) using a high-volume air sampler. An impactor is used as the sample inlet to discriminate against particles >2 to 3 µm. The airflow is kept constant at 70 m3 h−1, and one 48 h sample is collected weekly. Through 25 years of sample collection, different techniques have been applied to digest the filters. Between 1994 and 2000, filters were digested using nitric acid in closed polytetrafluoroethylene (PTFE) containers at 150 ∘C for 6 to 8 h. Between 2000 and 2012, microwave digestion was applied using nitric acid and hydrogen peroxide. From 2012 onwards, ultraCLAVE microwave digestions were applied using diluted nitric acid. The metals (Pb, Cd, Cu, Zn, Cr, Ni, Co, Mn, and As) have been analysed using different inductively coupled plasma mass spectrometry (ICPMS) instruments (Berg et al., 2004, 2008; Aas et al., 2020). Trends are evaluated by the non-parametric Mann–Kendall test applied to the annual mean concentrations (Gilbert, 1987), and Sen's slope estimator is used to quantify the magnitude of the trends.
Gaseous elemental mercury (GEM) species have been monitored using a combination of manual and automated sampling techniques. Between 1994 and 2000, manual measurements were performed based on mercury amalgamation with gold. GEM was sampled by drawing air at a flow rate of 0.7 L min−1 through quartz glass tubes containing gold-coated quartz glass pieces. Air was drawn through the trap using a pump, and the air volume was measured using a volume meter. The gold traps were returned to NILU and analysed by thermal desorption and cold vapour atomic fluorescence spectroscopy (CVAFS; e.g. Brosset, 1987). Samples were collected during 24 h periods once a week.
Automated measurements were initiated in 2000 using a Tekran 2537 Hg vapour analyser detailed in Aspmo et al. (2005). Briefly, ambient air is sampled at 1.5 L min−1 through a Teflon filter via a heated sampling line. A soda lime (NaOH and Ca(OH)2) trap is mounted in-line in front of the instrument filter. Hg in the air is pre-concentrated for 5 min by amalgamation on two parallel gold cartridges, which alternate between collection and thermal desorption, followed by AFS (atomic fluorescence spectrometry) detection. The instrument is auto-calibrated every 25 h using an internal Hg permeation source, with accuracy verified during routine site audits that include manual injections of Hg from an external source (Aspmo et al., 2005). The detection limits are comparable for both manual and automated methods, at 0.1 ng m−3.
Speciated mercury measurements were performed on a campaign basis several times, particularly during spring (Aspmo et al., 2005; Berg et al., 2003; Sommar et al., 2007); however from 2007 automated mercury speciation using the Tekran mercury 1130, 1135, and 2537 speciation system was initiated by the Norwegian University of Science and Technology (NTNU). Sample collection and analysis are described in detail elsewhere (e.g. Landis et al., 2002; Steffen et al., 2008). In summary, air is pulled into the analyser through a Teflon-coated elutriator and an impactor designed to remove particles >2.5 µm at flow rates of 10 L min−1. The sample air flows over a KCl-coated quartz denuder to trap gaseous organic mercury (GOM) and then over a quartz particulate filter to trap particulate-bound mercury (PBM). GOM and PBM accumulate for 1 to 2 h followed by consecutive thermal desorption and AFS by the Tekran 2537, as with gaseous elemental mercury.
4.7 Surface ozone
As part of the EUROTRAC project TOR (Tropospheric Ozone Research) and EMEP, continuous monitoring of surface ozone was initiated at Ny-Ålesund in October 1988 and then down by the Kongsfjorden shoreline (NILU-1, Fig. 2). The ozone monitor was moved to the Zeppelin Observatory upon opening in September 1989. Surface ozone has been monitored continuously except for during the period 15 June 1999 to 31 January 2000 when the station was completely rebuilt and the ozone monitor had to be taken temporarily down to Gruvebadet.
Standard UV monitors have been used since the start in 1989. The instruments have been replaced by new monitors at various times, and since 1997 each monitor shift has been carried out according to a quality-assured procedure including pre- and post-calibrations and intercomparisons. The very first monitor replacement was made in September 1994 (though there is no available documentation of the QA procedures for that instrument shift). According to the logbook in 1994, the monitor was brought to NILU's laboratory for inspection because the monitor was unstable, and it was replaced by a new monitor. Thus, the data from the last period before the replacement in 1994 are more uncertain.
The World Calibration Centre For Surface Ozone (WCC-Empa) carried out audits of the Zeppelin Observatory in 1997, 2001, 2005, and 2012, and all audits concluded that the on-site ozone monitor provided good and adequate results when compared with WCC-Empa's travelling standard that in turn is traceable to a standard reference photometer (https://www.empa.ch/web/s503/wcc-empa, last access: 8 February 2022). In the first audit in 1997, it was noted that for very low ozone levels (<20 ppb) the instrument was outside tolerance limits. Such low levels occur only during certain episodes in spring in connection with low-ozone episodes (LOEs) linked to rapid destruction of ozone by halogen radicals over the Arctic Ocean as discussed in more detail in Sect. 5.7.
4.8 Reactive nitrogen
Reactive nitrogen species, peroxyacetyl nitrate (PAN), peroxypropionyl nitrate (PPN), NOx (NO + NO2), NOy, and the NO2 photolysis rate were measured at the Zeppelin Observatory from 1994 to 1997 (Beine et al., 1996, 1997, 1999; Krognes and Beine, 1997; Beine and Krognes, 2000; Solberg et al., 1997). Together with measurements of light hydrocarbons, carbonyls, and surface ozone, this constituted a rather unique suite of observational data for an Arctic location at that time and was used to evaluate atmospheric chemistry in detail.
NO and NO2 were measured separately, using a high-sensitivity chemiluminescence detector with a 3σ detection limit of 0.9 and 2.6 ppt at a 1 h average for NO and NO2, respectively (Beine et al., 1996, 1997). NO2 was measured as NO following broadband photolysis by a xenon arc lamp between 350 and 410 nm. Measurements of NOy were made with a Correct Analysis of NOx (CraNOx) instrument consisting of a gold converter coupled to a chemiluminescent NO analyser (TECAN CLD 770). NOy was converted to NO by a converter constructed at UEA (University of East Anglia). After conversion from NOy, the NO was measured by the chemiluminescence produced during reaction of NO and O3. The CLD had a 2σ detection limit of 50 ppt and was calibrated on a weekly basis. More details can be found in Solberg et al. (1997).
To support research into the chemistry of reactive nitrogen compounds in the Arctic, PAN and PPN were measured at the Zeppelin Observatory in 1994 to 1996 using gas chromatography with an electron capture detector (GC-ECD, 10 mCi 63Ni electron source and packed column, Carbowax 400 on a Chromosorb W HP support). The instrument sampled automatically every 15 min, and results were calibrated and aggregated to 1 d averages. Calibration of the GC-ECD was based on a liquid standard of PAN in hexane. NILU initiated and coordinated an extensive project for interlaboratory comparison of the calibration of liquid PAN standards (Krognes et al., 1996). The calibrated standard was transported to the observatory packed in dry ice and stored in a normal freezer at the site. A Tedlar bag was filled with 10 L of pure synthetic air and 5 µL of the standard solution (nominally 10 or 100 µg mL−1 PAN in hexane). The instrument sampled from the bag (in its normal 15 min cycle) for approximately 2 h. Due to thermal decomposition in the bag at room temperature, the concentration of PAN decayed quickly over this period. This decay was plotted and extrapolated back to the time of the standard injection, to find the instrument response to the known initial concentration in the bag. The resulting scaling factor covers the detector response and the systematic loss in the separation column (due to adsorption and thermal decomposition). Despite the complex process and the numerous error sources, the calibration factor was found to be constant over the 3-year campaign period.
The entire dataset has ∼100 000 chromatograms, all initially interpreted automatically by HP ChemStation software and then inspected manually to discard outliers and correct peak detections and baselines where appropriate. The practical detection limit was of the order of 10 pptv for individual samples. During summer, the PPN concentrations were close to this detection limit. Peaks were visible, but the percentage of good samples fell below a quality control criterion of 50 %, and no concentration could be reported (Krognes et al., 1996; Beine and Krognes, 2000).
5.1 Aerosol chemical composition
Organic and elemental carbon (OC and EC) are Arctic haze components, and their evolution in winter and spring 2019 is similar to that of other long-range-transported species such as SO (Fig. 7a). In summer, the OC level is equally high and occasionally higher than the level observed during Arctic haze, whereas the EC level decreases substantially. Hence, the carbonaceous aerosol prevailing in winter, spring, and autumn is elevated in EC compared to in summer when OC becomes more important (Fig. 7b). Annual concentrations of OC (75 ng C m−3) and EC (12 ng C m−3, year 2019) at the Zeppelin Observatory are 8 to 9 times lower than on the Norwegian mainland, where levels are the lowest in regional background Europe (Yttri et al., 2007). By accounting for positive sampling artefacts of OC, an overestimation of approximately 25 % is avoided. The resulting OC corrected for positive sampling artefacts should be considered a conservative estimate of the OC level at the Zeppelin Observatory, as the negative sampling artefact of OC is not accounted for.
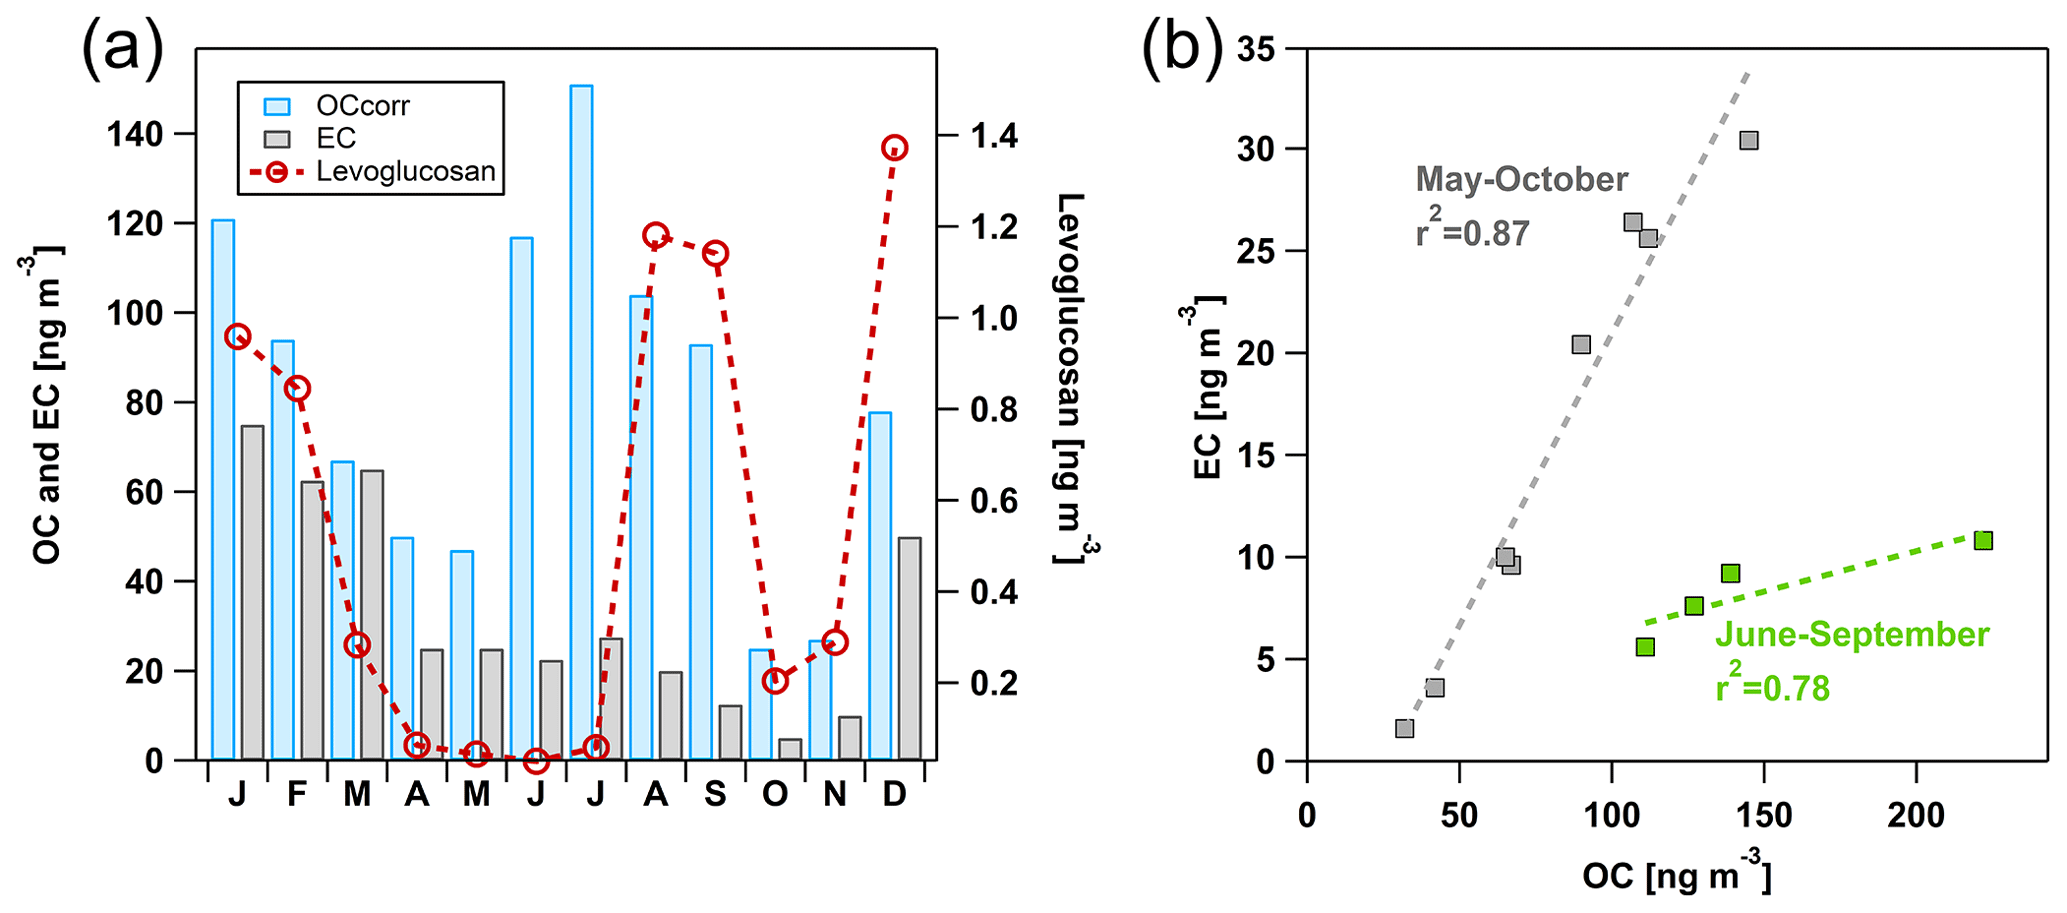
Figure 7(a) Monthly means of EC, OC corrected for the positive sampling artefact, and levoglucosan in the PM10 size fraction at the Zeppelin Observatory in 2019; (b) scatterplot of monthly means of EC and OC in PM10 at the Zeppelin Observatory, October to May and June to September 2019.
The EC levels and fractions are higher in winter, spring, and late autumn (heating season) due to increased emissions from the combustion of fossil fuel and biomass for heating purposes (Yttri et al., 2014) and lower biogenic emissions. Increased OC levels in summer align with those seen for areas in Scandinavia with little anthropogenic influence and where increased levels are explained by biogenic sources, i.e. biogenic secondary organic aerosol (BSOA) and primary biological aerosol particles (PBAPs). Increased BSOA tracer (2-methyltetrols) levels are seen in the first part of summer at the Zeppelin Observatory, whereas PBAP tracers (e.g. arabitol and mannitol) are more abundant in late summer and early autumn (not shown). Levoglucosan is elevated both in the heating season and in late summer–early autumn (Fig. 7a), mirroring increased emissions from residential wood burning in the heating season and boreal wildfires in summer–late autumn (Stohl et al., 2007; Yttri et al., 2014). Hence, a mixture of both primary and secondary carbonaceous aerosol from natural sources explains the increased level observed for June to October, although the classification of wildfires as a natural source can be questioned, as anthropogenic activity explains the majority of cases in Europe where natural vegetation ignites (Winiwarter et al., 1999).
A conversion factor (CF) of 1.9 to 2.2 is suggested for the conversion of OC to organic matter (OM) for non-urban aerosol (Turpin and Lim, 2001), such as at the Zeppelin Observatory, where most aerosol particles are long range transported. An annual mean OM concentration of 165 ng m−3 (CF = 2.2) is noticeably less than for other aerosol species from natural sources such as sea salt aerosol (749 ng m−3) and mineral dust (525 ng m−3) and even non-sea-salt SO (270 ng m−3, Fig. 3).
Annual mean concentrations of inorganic ions such as SO are generally lower than the levels on the Norwegian mainland, e.g. at Birkenes in southern Norway (Aas et al., 2019), a site with some of the lowest levels of particulate matter in Europe, reflecting the remote location of the Zeppelin Observatory. However, the observatory frequently experiences individual sulfate pollution episodes exceeding those seen on the mainland, e.g. an episode with a concentration of 5.1 µg m−3 in 2018 (Aas et al., 2020), while for some years mean sulfur dioxide (SO2) is higher than on the Norwegian mainland. These episodes of sulfur pollution occur due to the arrival of air masses from Russia, for example the Kola Peninsula, due to the presence of heavy industry including non-ferrous metal smelters (Aas et al., 2020).
Determination of background trends in inorganic ions at Zeppelin is a crucial component of the Norwegian environmental monitoring programme, used to measure the effectiveness of the 1999 Gothenburg Protocol (GP) to reduce acidification. The objective of the original 1999 GP was to reduce European emissions of sulfur by 63 % in 2010 compared to 1990 and nitrogen oxides and ammonia by 41 % and 17 %, respectively. In 2012, the protocol was revised, with new emissions targets for 2020 with 2005 as the base year. The current abatement targets for inorganic atmospheric species in the European Union, with Norwegian targets in parentheses, are 59 % (10 %) for SO2, 43 % (23 %) for NOx, and 6 % (8 %) for ammonia. SO2 and sea-salt-corrected SO at Zeppelin have decreased by 75 % and 44 %, respectively, between 1990 and 2019. This is significantly lower than the real-world reductions seen on the Norwegian mainland, e.g. 95 % for SO2 and 74 % for sea-salt-corrected SO at Birkenes, southern Norway (Aas et al., 2020), likely reflecting varying source regions or changes in transport patterns. No significant trend is observed for the 2005 to 2019 period using the Mann–Kendall statistic (Mann, 1945; Kendall, 1948; Aas et al., 2020). Nevertheless, the decreasing levels of sulfur species at the Zeppelin Observatory reflect the success of the Gothenburg Protocol.
5.2 Aerosol physical properties
There are several atmospheric aerosol and cloud studies in polar regions based on short-term campaigns, carried out predominantly in the polar day season. Only a handful of studies cover seasonal cycles and interannual variability (e.g. Jung et al., 2018), allowing longer-term observations of natural variability and trends. Long-range transport of aerosols varies strongly during the year due to changes in radiation flux in the Northern Hemisphere, the movement of the polar front, and accompanying seasonal variability in general circulation patterns. Long-range transport of aerosols primarily from the Eurasian continent slowly increases during the autumn and winter to a major peak during March to May, which is observed as very high concentrations of accumulation mode particles; i.e. the particle median size is above 100 nm. These particles, when observed in remote areas, are usually formed through atmospheric processes such as condensation, coagulation, and cloud processing and are commonly referred to as “aged” particles (see Fig. 8).
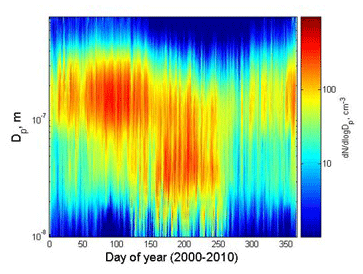
Figure 8Spectral plot of daily-average aerosol number size distributions, March 2000 to December 2010. Units on the x axis are day of the year (Tunved et al., 2013).
With a rather sharp change in air mass transport patterns and related decreased efficiency in long-range transport of aerosols from lower latitudes, the aerosol population changes drastically during late spring and early summer within a period of a couple of weeks (Engvall et al., 2008). The aerosol size distribution changes its shape from accumulation mode dominated to Aitken mode dominated. This change reflects the diminishing influence of sources outside the Arctic while at the same time new particle formation becomes a main source of aerosol. Particle nucleation events followed by particle growth are observed frequently during the lightest part of the year, i.e. April to September, and dominate particle mass during the summer, i.e. June to August (see Fig. 9 and Tunved et al., 2013). The frequency of occurrence of new particle formation during summer is comparable to that in continental areas; however the new particle formation rate and initial growth rate are lower in the Arctic (Lee et al., 2020).
When converting particle numbers into mass, the same pattern as for the aerosol chemistry measurements can be seen (Fig. 9). The winter period is strongly dominated by anthropogenic long-range-transported aerosol, i.e. an Arctic haze period. This is followed by summer observations showing very low atmospheric concentrations mostly influenced by natural sources related to gaseous emissions from the sea and local sources. Long-term aerosol size distribution measurements at Zeppelin combined with observations from several other Arctic stations show that the major source area of accumulation mode aerosol (and thus related aerosol surface and mass) is the Siberian part of Eurasia (Freud et al., 2017). Further investigation is needed to better assess to what degree these particles are related to anthropogenic sources vs. biogenic sources, e.g. boreal forest. This is especially required to understand a clear decrease in concentration of many anthropogenic air pollutants and to understand Arctic haze in general.

Figure 9Annual average variation in integrated surface and mass, March 2000 to March 2010. Mass data calculated from the aerosol number size distribution assuming a density of 1 g cm−3. Error bars show 25th- to 75th-percentile ranges (Tunved et al., 2013).
Long-term observations at high time resolutions provide the opportunity to study the influence of different atmospheric conditions, e.g. precipitation and wet deposition, during transport. In an investigation of 10 years of data, Tunved et al. (2013) demonstrated a strong dependence of aerosol properties on precipitation during the dark winter period (October–February). Strong decreases in accumulation mode particles were seen with just a few millimetres of precipitation, with larger precipitation amounts (>40 mm) eventually almost obliterating the aerosol (Fig. 10, left). During the sunlit period (March to September), an initial decrease in accumulation mode particles is followed by a strong increase in Aitken mode particles, explained by new particle formation followed by subsequent growth (Fig. 10, right). These observations show the influence of different processes and their dependence on sunlight and precipitation.
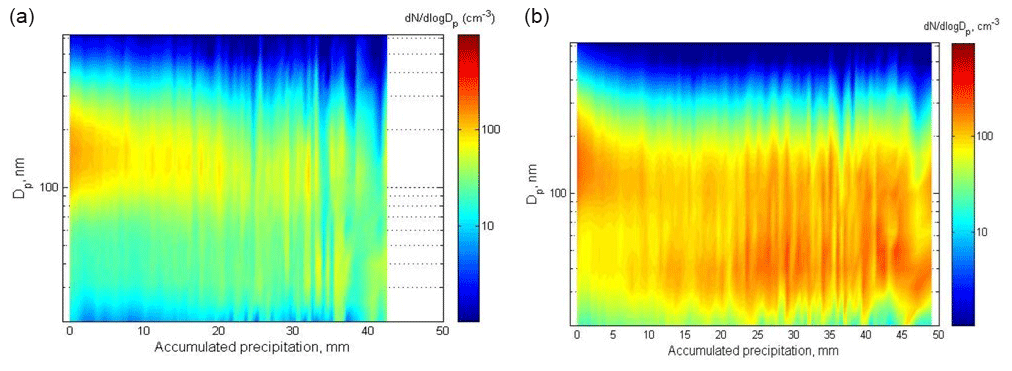
Figure 10Evolution of aerosol number size distribution ( as a function of accumulated precipitation along 240 h trajectories (a) for the dark period (October to February) and (b) for the sunlit period (March to September). All data from 2000 to 2010 (Tunved et al., 2013).
Long-term support and excellent facilities combined with very high quality routines and standards are needed to study long-term trends of the key aerosol parameters. Recently, 18 years of nephelometer measurements at the Zeppelin Observatory was used to evaluate the trends of particle light scattering properties (Fig. 11 and Heslin-Rees et al., 2020). An increase in particle light scattering indicates either an increase in particle concentrations or an increase in particle size; the latter is supported by a decreasing scattering Ångström exponent, showing a shift to larger particles in the particle size distribution. Hence, the increase in particle size and the particle light scattering coefficient seen throughout the 18 years most likely corresponds to an increased contribution from larger particles such as sea spray. Heslin-Rees et al. (2020) argue the observed long-term changes are due to changes in atmospheric circulation, i.e. an increased frequency of long-range transport from the open northern Atlantic. However, new particle formation (NPF) events at the Zeppelin Observatory have been shown to be anti-correlated with sea ice extent, indicating a dependence on more open sea (Dall'Osto et al., 2017). This is also supported by a number of recent studies linking ocean biological activity with biogenic sulfur variability and abundance in the Arctic atmosphere (Jang et al., 2021) and related aerosol properties and cloud condensational nuclei variability (Choi et al., 2019; Park et al., 2021). Naturally driven NPF dominates the summertime Arctic atmospheric aerosol, even though the detailed physiochemical process pathway is not known and is a subject of ongoing research.
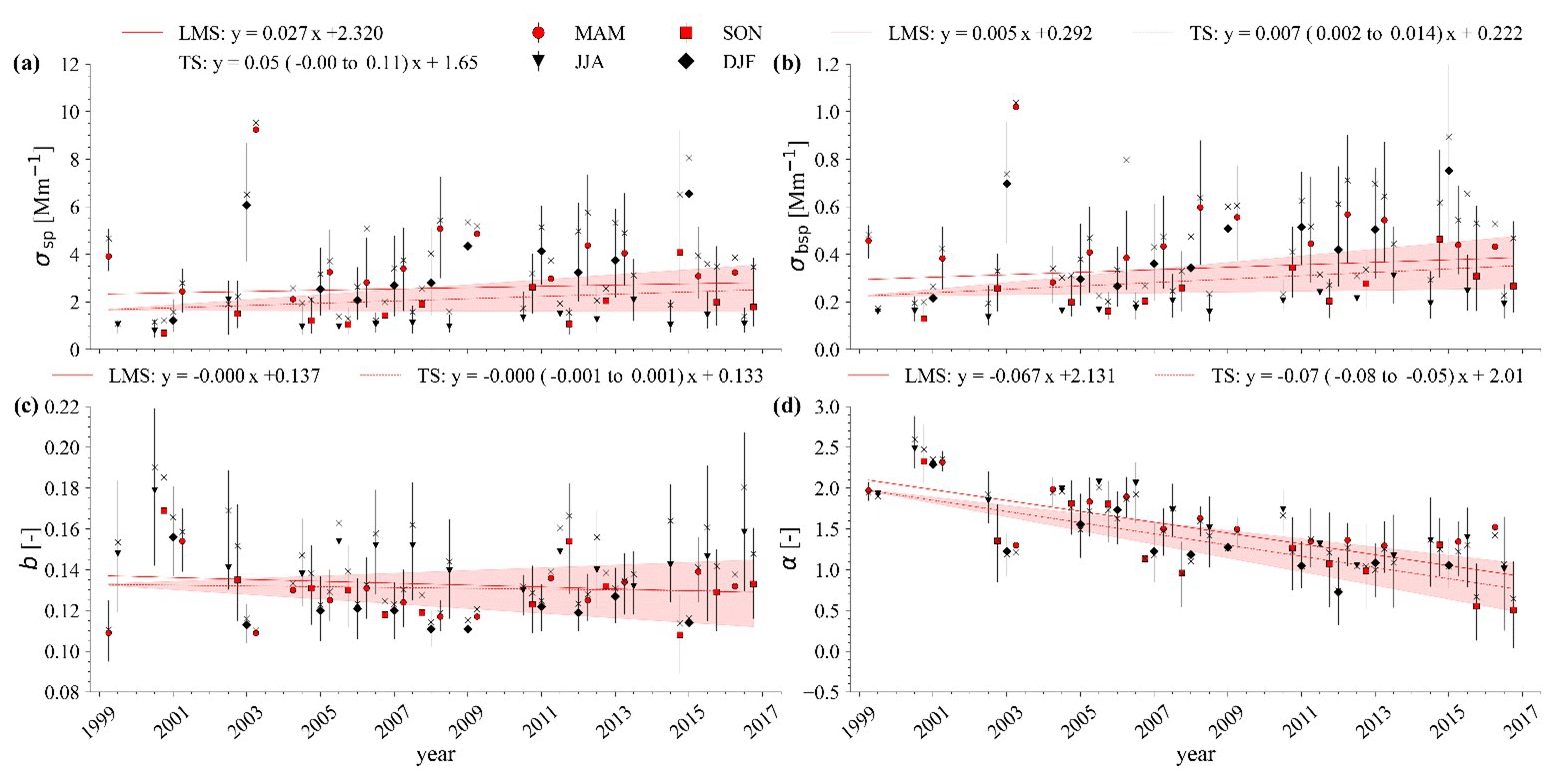
Figure 11Long-term trends of the seasonal medians for (a) the particle light scattering coefficient (wavelength, λ=550 nm), (b) the particle light backscattering coefficient (λ=550 nm), (c) the hemispheric backscattering fraction (λ=550 nm), and (d) the scattering Ångström exponent (λ1=450 nm, λ2=550 nm). The seasonal medians are denoted by their respective symbols. The error bars denote the length of the 25th- and 75th-percentile values. The seasonal mean is given by the cross. The solid and dashed red lines represent the least mean squares (LMS) and Theil–Sen slope (TS) of the seasonal medians, respectively. The red-shaded area denotes the associated 90 % confidence interval of the TS slope. Figure taken from Heslin-Rees et al. (2020).
The observed aerosol physical and chemical properties indicate a decrease in long-range transport during the winter and an increasing contribution of sea spray. Furthermore, it remains difficult to distinguish the direct influence of ongoing climate change as well as the related strong changes in sea ice. As an example of the changes occurring in the wider region, according to Pavlova et al. (2019), based on long-term monitoring of sea ice in Kongsfjorden initiated by NPI in 2003, over the last decade only the northern part of the inner Kongsfjorden has frozen, whereas before 2006 sea ice usually extended into the central fjord.
The changes to aerosol sources described above are likely to impact climate. The atmospheric particle life cycle is directly linked with the life cycle of clouds. The aerosol is modified in number and chemistry by cycling through the clouds, and the cloud droplet number and cloud radiative properties depend on the aerosol size and chemistry. Changes in sources, i.e. number, size, and chemistry, may have a significant influence on the radiation balance and thus on how the Arctic climate develops.
5.3 Atmospheric trace gases of high relevance to global climate change
The atmospheric mixing ratios of CO2 and CH4, the two most important anthropogenic greenhouse gases, are shown in Fig. 12. CO2 is increasing with a long-term trend of 2.5 ppm yr−1 (Table 5) and has increased by ∼15 % since 1989 levels (357 ppm). It should be noted that the growth is positive in all years, highlighting the challenge in meeting emissions reductions needed to meet the Paris Agreement goal of keeping the global annual average temperature increases below 2 ∘C. The CO2 mixing ratio at the Zeppelin Observatory is slightly higher than the global average mixing ratio, e.g. 409.3 ppm at the Zeppelin Observatory vs. 407.8 ppm globally in 2018 (WMO, 2020), since Northern Hemisphere CO2 emissions are higher. However, CO2 at Zeppelin is lower than observed at more continental sites such as Birkenes, southern Norway (416.1 ppm; Myhre et al., 2020).
Table 5Selected greenhouse gases measured at the Zeppelin Observatory and their chemical formulas, global warming potentials (GWPs, CO2 is 1), mean mixing ratios in 2019, fitted trends, and trend fit parameters (error and R2). Measured from 2001.
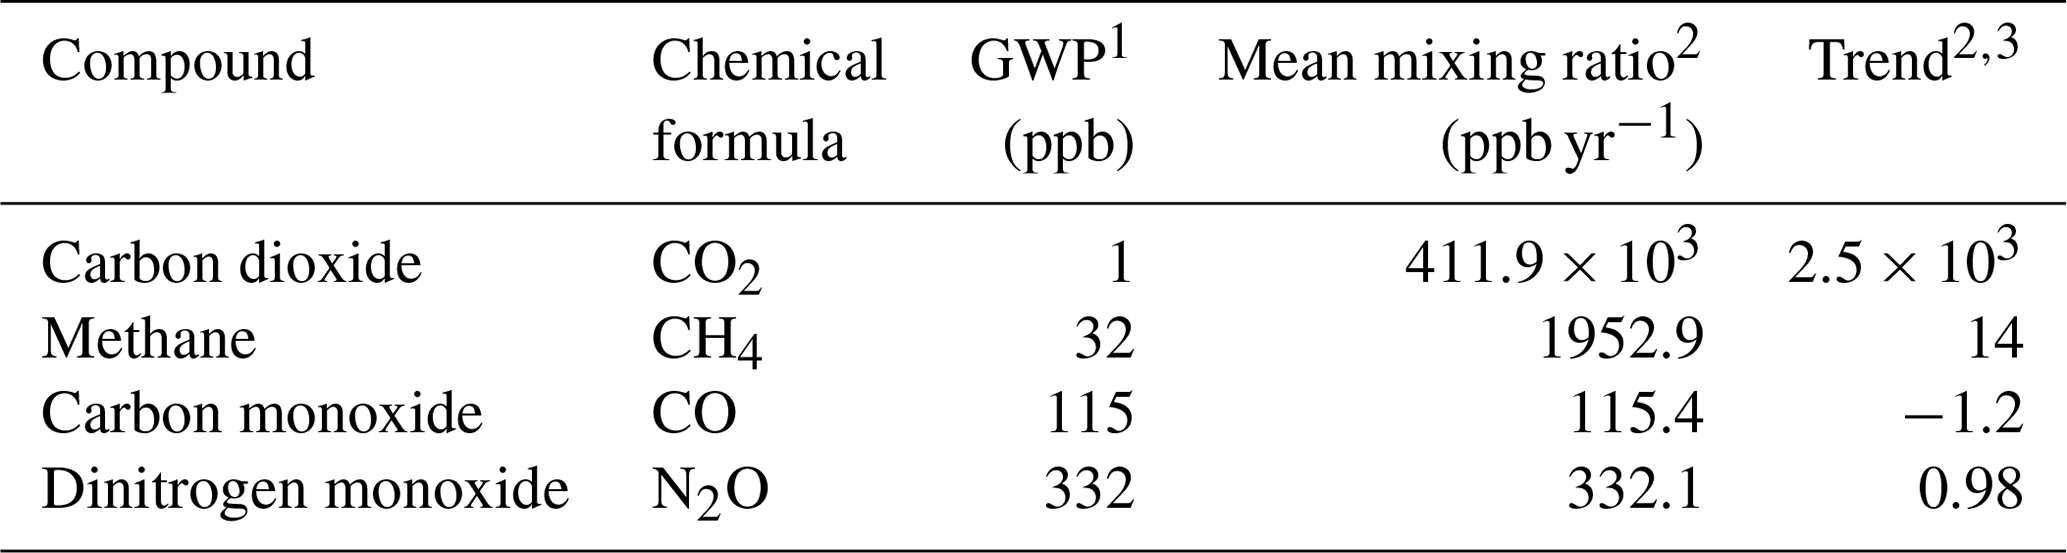
1 Global warming potentials for a 100-year time horizon according to Montzka et al. (2011) and Hodnebrog et al. (2013), where available. 2 From Myhre et al. (2020). 3 Following Simmonds et al. (2006): , where f(t) is the change in the atmospheric mixing ratio of a species as a function of time over N months and a, b, d, and e are fit parameters with a defining the average mole fraction, b defining the trend in the mole fraction, and d and e defining the acceleration in the trend. Coefficients c1 and s1 define the annual cycles in the mole fraction, and Pi denotes the Legendre polynomials of order i.
As well as the annual variation in CO2 (a result of the larger landmass vegetation in the Northern Hemisphere), short-term interannual variations arise due to variability in emissions and sink strengths caused by anthropogenic activity and plant CO2 uptake and release, which are a function of numerous climatic factors. Local influence is minimal (Sect. 3.2). In 2017 to 2018 the annual increase in CO2 at the Zeppelin Observatory was as low as 1.6 ppm compared to 4.1 ppm at Birkenes, as the Zeppelin Observatory received above-normal transport of air masses from the North Atlantic and within the Arctic (Myhre et al., 2020). The standard deviation in CO2 increases at Zeppelin for the last 5 years was 0.89 ppm, or 36 % of the 2018 to 2019 increase, enough to obscure even moderate short-term changes in anthropogenic CO2 emissions. For example, the expected drop in anthropogenic CO2 of around 4 % to 7 % due to the lockdown measures in 2020 related to the COVID-19 pandemic (Le Quéré et al., 2020) is below the level of natural interannual variability in the CO2 trend.
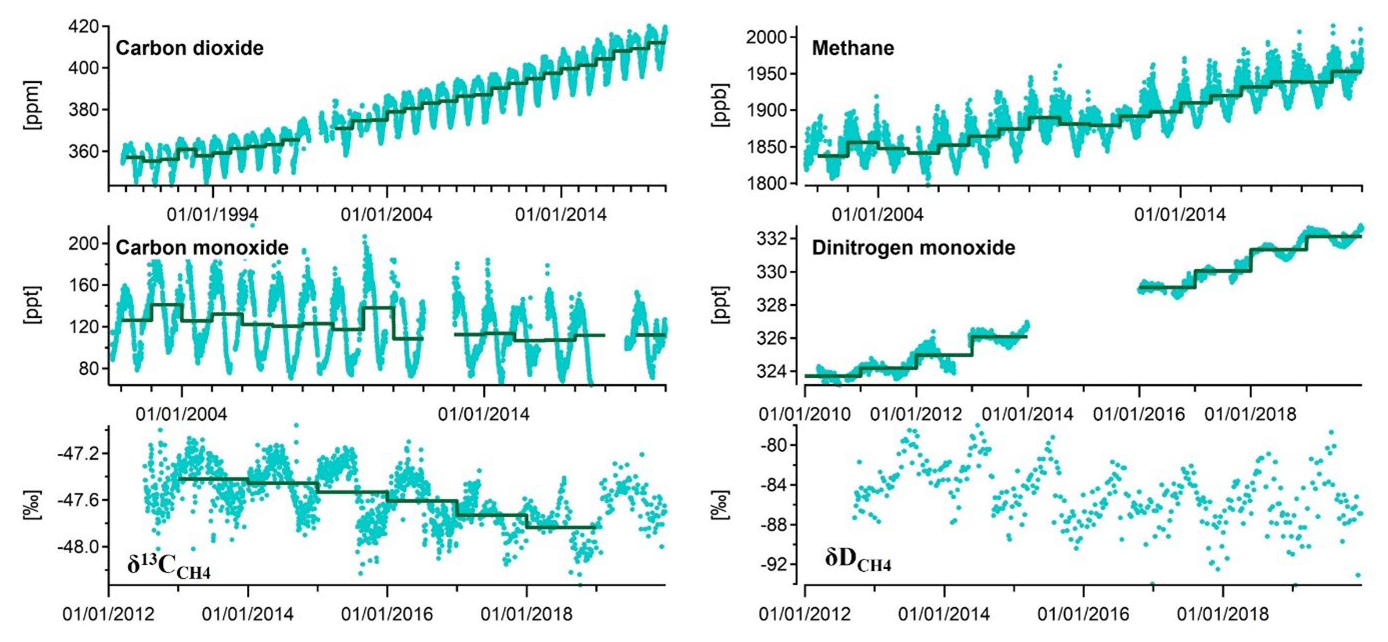
Figure 12Daily (markers) and annual (solid lines) atmospheric mixing ratios of carbon dioxide (CO2), methane (CH4), carbon monoxide (CO), and dinitrogen monoxide (N2O) and isotopic shifts in the carbon and deuterium in methane of carbon-13 (δ13C and deuterium (δD at the Zeppelin Observatory. Daily and annual means calculated only where data coverage is ≥75 % of the total day or year, respectively.
The CH4 mixing ratio is also clearly increasing over time. After a brief pause, since 2005 daily mean CH4 mixing ratios at Zeppelin have increased by an average 5.9±0.3 ppb yr−1 (Platt et al., 2018) and by 14 ppb for 2018 to 2019, reaching a record level of 1952.9 ppb. For comparison, the global mean CH4 mixing ratio in 2019 was 1869 ppb (WMO, 2020), reflecting considerable latitudinal variation in CH4 due to the uneven spatial distribution of sink strength and sources and its relatively short lifetime (approximately 11 years).
The resumption of an increasing CH4 trend in ∼2005 was seen globally and was unexpected and threatens to move the Paris Agreement 2 ∘C goal out of reach by increasing the overall need for abatements via internationally determined contributions, which had not previously assumed an increasing global CH4 mixing ratio (Nisbet et al., 2019). Furthermore, the GWP for CH4 has been revised upwards from 28 to 32 (Etminan et al., 2016), i.e. a 25 % stronger forcing.
At the same time as the mixing ratio has increased, δ13C has shifted, by about −0.03 ‰ yr−1 (Fig. 12), suggesting a change in the balance of the sources and sinks of methane. Due to the Zeppelin Observatory's remote location, δ13C is only minimally perturbed by anthropogenic emissions: Thonat et al. (2019) report synoptic changes of up to −0.2 ‰ in δ13C due to wetland influences, an order of magnitude higher than anthropogenic emissions (<0.02 ‰, excepting some long-range transport episodes), the influence of which is diminished by biomass burning ( ‰) and also by the fractionating effects of the two major sinks ( ‰). Therefore, the location of the Zeppelin Observatory in principle allows the study of emissions from vulnerable (climate-sensitive) hydrocarbon CH4 reservoirs in the Arctic including thawing terrestrial and subsea permafrost and seabed cold seepage (e.g. fuelled by decomposing gas hydrates, GHs), as well as from biomass burning, since the potential for synoptic variations due to localized bio-/geogenic emissions is higher than for other sites.
Based on δ13C, Nisbet et al. (2019) suggest that ruminant and/or mid-latitude wetland emissions are largely responsible for the increased CH4 levels since 2007, since they are strongly negative compared to the ambient value (δ13C ‰ for both, compared to −47 ‰ to −53 ‰ for fossil fuels; France et al., 2016), while increases from wetland emissions are consistent with atmospheric inversion modelling. However, there are other changes in the CH4 budget which may explain the isotopic shift, and Nisbet et al. (2019) also suggest that the ongoing increase in CH4 and negative shift in ambient δ13C are compatible with four non-mutually exclusive hypotheses: (1) increases in very negative biogenic emissions (e.g. wetlands or ruminants); (2) increased fossil fuel emissions accompanied by a negative shift in their mean δ13C (although depending on changes in other sources, a shift in their δ13C is not necessary); (3) changes in the removal rate via reaction with OH; and (4) decreases in biomass burning, combined with increases in both fossil and biogenic emissions of roughly equal magnitude as suggested by Worden et al. (2017) and independently from budget considerations by Jackson et al. (2020). Hypothesis 3 is still an unlikely candidate to explain the isotopic shift, though recent work shows that some influence is possible since there are indications that ambient CO NOx is affecting the OH sink (Dalsøren et al., 2016).
Thompson et al. (2017) included methane observations from the Zeppelin Observatory in a high-latitude (>50∘ N) inversion, finding posterior emissions generally both higher and more variable than prior estimates from inventories. The main increase in CH4 emissions compared to prior emissions was in western Siberian wetlands, with a top-down flux of 19.3 to 19.9 Tg yr−1 compared to, for example, only 4.9 Tg yr−1 from the LPX-Bern bottom-up inventory (Stocker et al., 2014). A large, anomalous increase was seen for western Siberian CH4 in 2007, linked to high temperatures in the same year. This underscores the potential role of high-latitude wetlands as a climate feedback. Note also that wetland emissions likely include a significant fraction of permafrost CH4, due to co-location, and indirect effects including increased leaching of organic carbon into soil and changes in hydrology.
In 1987, the Montreal Protocol was signed with the aim of stopping emissions of stratospheric ozone-depleting substances, at that time mainly chlorofluorocarbons (CFCs), by improving technology and developing replacement compounds with lower ozone-depleting potential. The main sources of these compounds were related to foam blowing, aerosol propellants, refrigeration, solvents, and the electronics industry. The largest production of CFCs was in around 1985, and maximum emissions were around 1987. The first-generation substitutes for CFCs included the hydrochlorofluorocarbons (HCFCs), also included in the Montreal Protocol, followed by the hydrofluorocarbons (HFCs).
Halogenated hydrocarbons have been measured at the Zeppelin Observatory since 2001 as part of the AGAGE programme (Table 3). Figure 13 shows the concentrations of the CFCs, HCFCs, and HFCs measured there. The trends for most major CFCs are negative, e.g. −1.79, −2.51, and −0.64 ppt yr−1 for CFC-11, CFC-12, and CFC-113, respectively; see Table 6. For CFC-115 the trend is still slightly positive, +0.02 ppt yr−1, likely a consequence of its extremely long atmospheric lifetime (>1000 years). Meanwhile, Fig. 13 also shows that either the mixing ratios of the HCFCs, now almost phased out, have peaked or their growth rate is slowing. The 2016 Kigali Amendment to the Montreal Protocol aims to phase out the HFCs, though this is too recent to have impacted the levels seen at the Zeppelin Observatory. Mixing ratios of many HFCs are increasing rapidly (Fig. 13).

Figure 13Daily (dots) and yearly (solid lines) mean halogenated compounds measured at the Zeppelin Observatory with the online adsorption–desorption system gas chromatography with mass spectrometry with a flame ionization detector (ADS-GCMS-FID, green, 2001–2011) and the Medusa GCMS instrument (blue, for 2010 to 2019). Note the higher variability for the ADS-GCMS (many compounds including CFCs did not meet AGAGE precision requirements; see Sect. 4.3). Daily and annual means calculated only where data coverage is ≥75 % of the total day or year, respectively. See also Table 6 for information on chemical formulas and compound names.
Table 6Halogenated compounds measured at the Zeppelin Observatory and their chemical formulas, global warming potentials (GWPs, CO2=1), mean mixing ratios in 2019, fitted trends, and trend fit parameters (error and R2). For compounds measured only from 2010 (see also Table 3), the uncertainty in the trend is higher than for compounds measured from 2001.
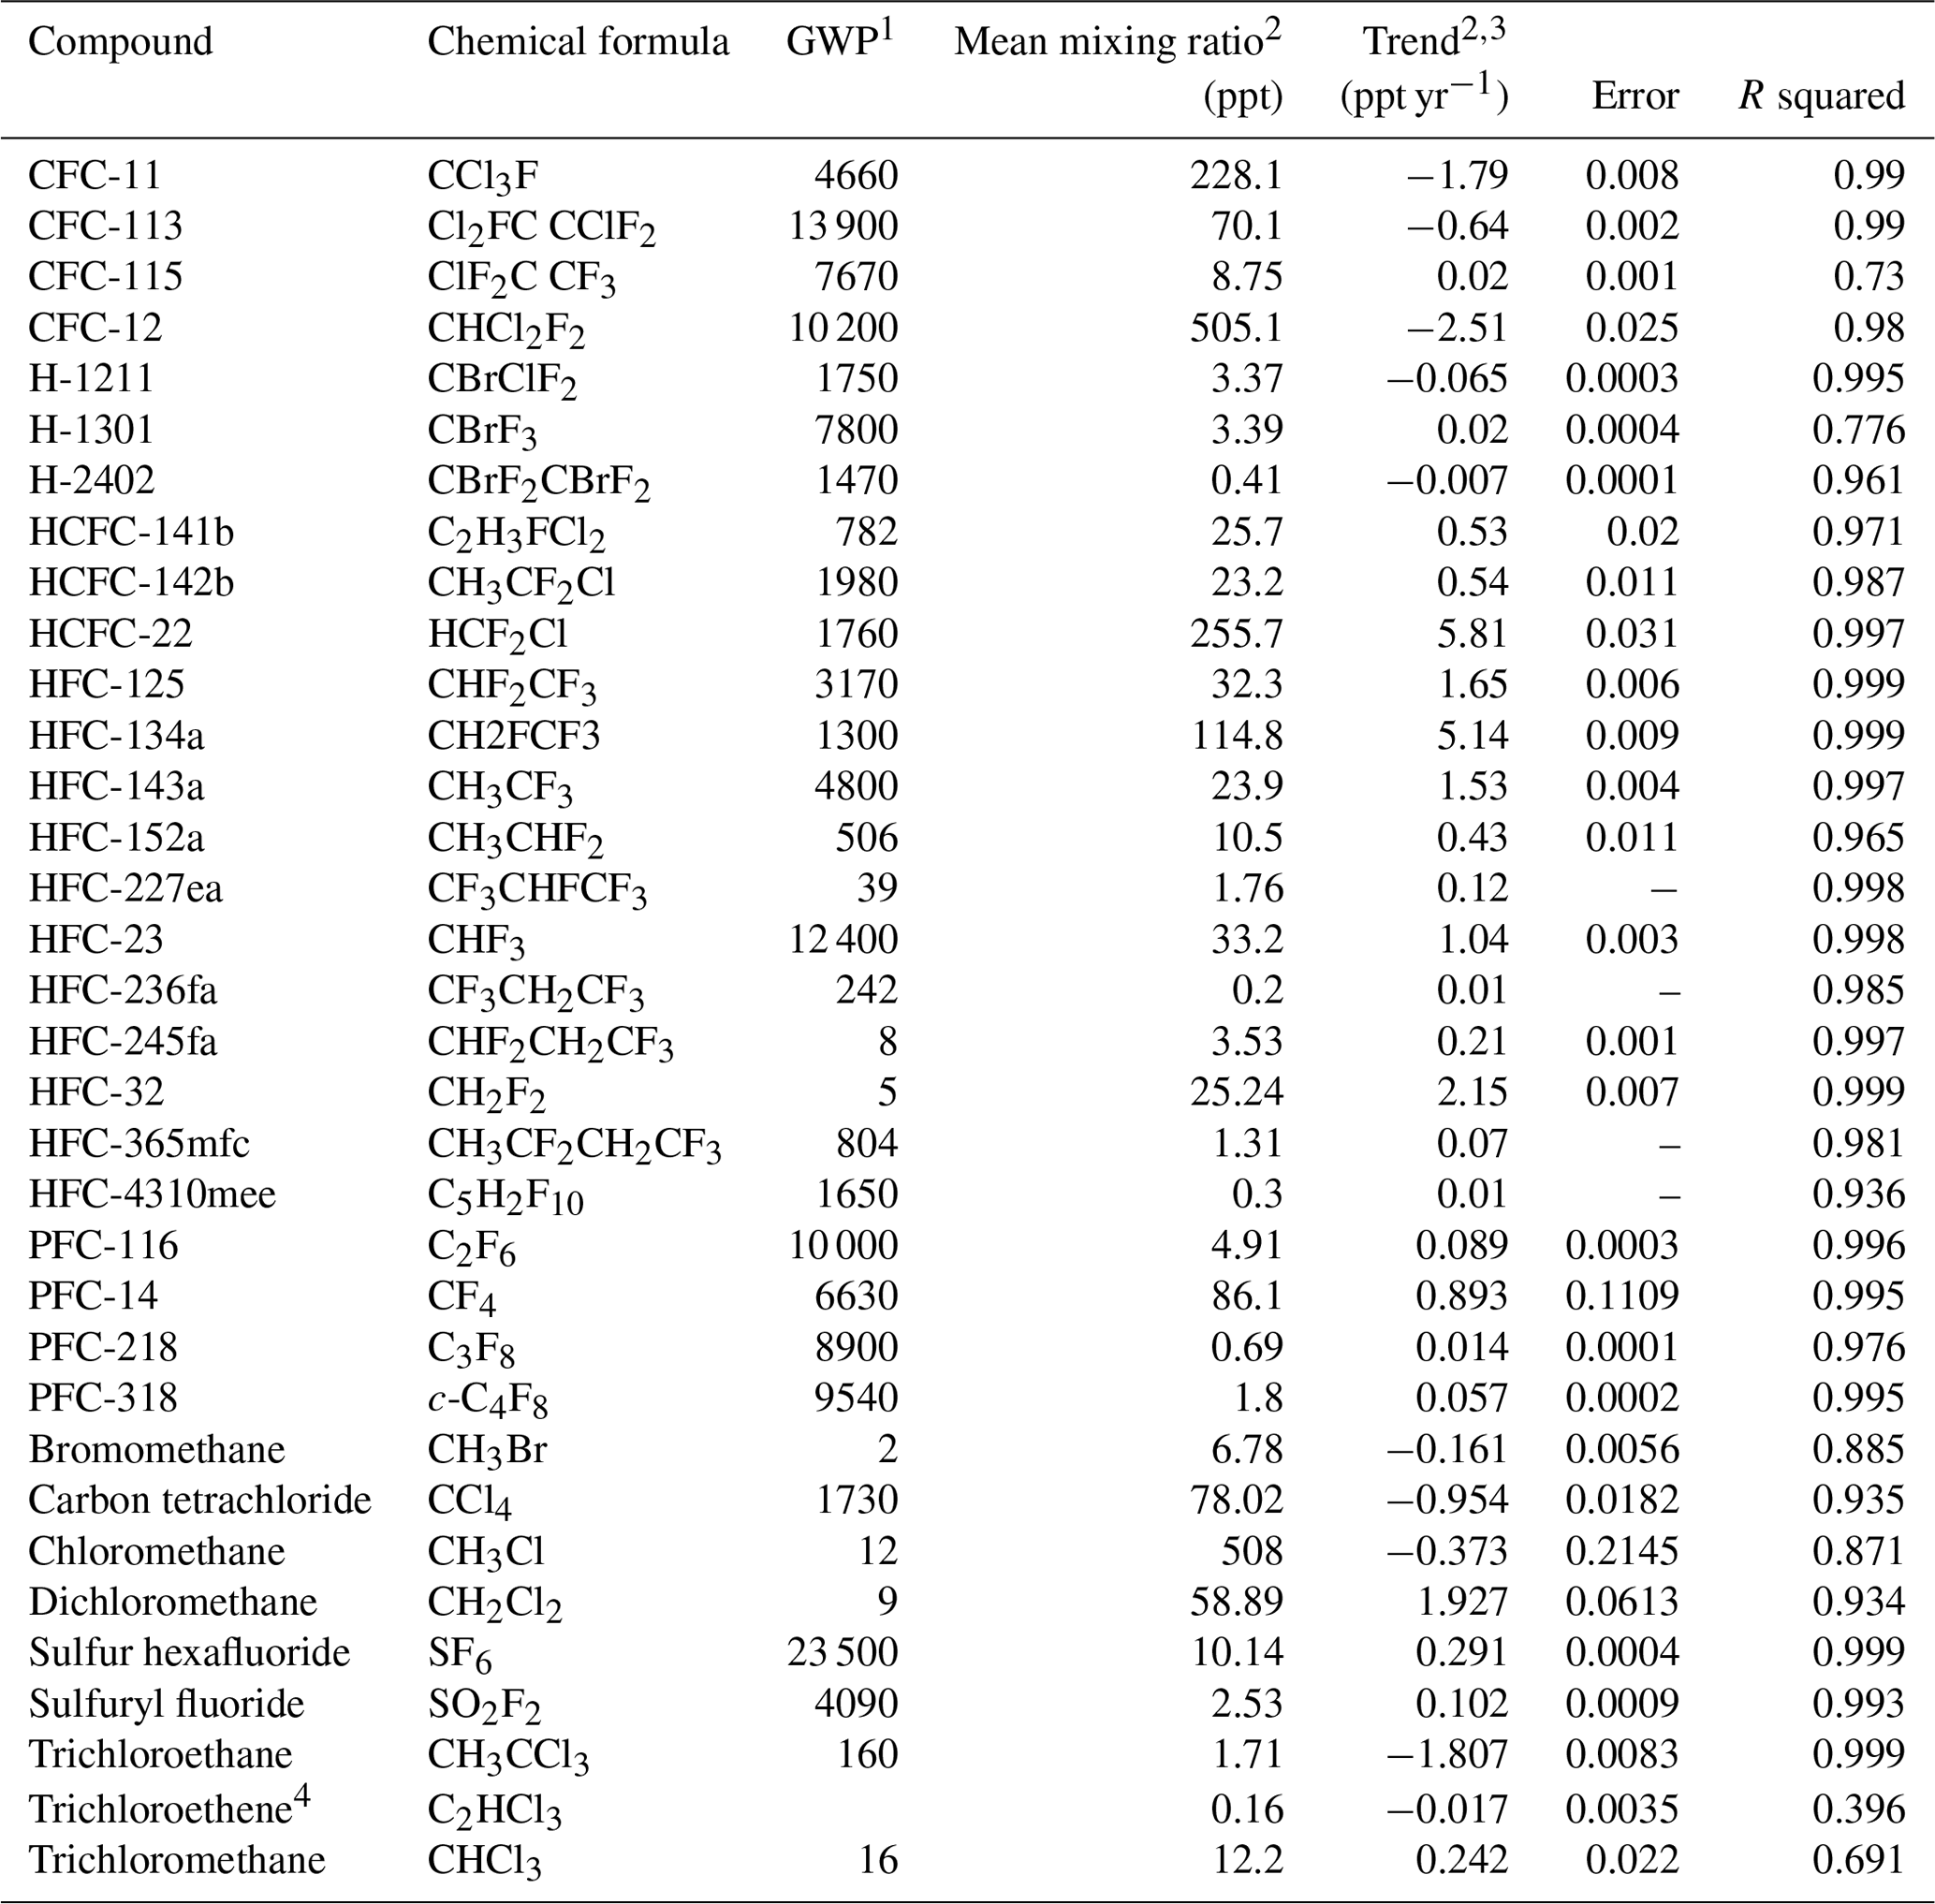
1 Global warming potentials according to Montzka et al. (2011) and Hodnebrog et al. (2013), where available. 2 From Myhre et al. (2020). 3 Following Simmonds et al. (2006): , where f(t) is the change in atmospheric mixing ratio of a species as a function of time over N months and a, b, d, and e are fit parameters with a defining the average mole fraction, b defining the trend in the mole fraction, and d and e defining the acceleration in the trend. Coefficients c1 and s1 define the annual cycles in the mole fraction, and Pi denotes the Legendre polynomials of order i. 4 Larger uncertainties due to low concentrations and instrument memory effects. 5 Larger uncertainties for 2001–2010 from the ADS-GCMS instrument.
Trends for the CFCs and HCFCs at the Zeppelin Observatory demonstrate the remarkable success of the Montreal Protocol. Not only are these compounds destructive to the stratospheric ozone layer, but they also are potent greenhouse gases, strongly absorbing infrared radiation in the part of the spectrum where other GHGs have only low absorption (the so-called “atmospheric window”), with very long atmospheric lifetimes, up to thousands of years. CFC-12, CFC-13, HFC-23, and HFC-12 have global warming potentials more than 10 000 times higher than CO2). Thus, according to Goyal et al. (2019), measures implemented under the Montreal Protocol will have avoided 3 to 4 ∘C Arctic warming and ∼1 ∘C global average warming by 2050 (an ∼25 % mitigation, the most successful abatement so far implemented). However, given the high GWPs of these compounds, it is crucial to monitor changes in levels over the coming decades.
5.4 Non-methane hydrocarbons
On average, the seasonal cycle in the sum of the NMHCs peaks in late winter at a level comparable to the levels in southern Scandinavia (Solberg et al., 1996a). Alkenes (ethene and propene) are an exception to this and have a less pronounced seasonal cycle, indicative of more nearby emissions of these species in summer, presumably linked to natural releases from biogenic activity in the oceans, particularly at the sea ice edge (Solberg et al., 1996a). Meanwhile, carbonyls were measured only in 1994, 1995, 1996, and 1998 and only during parts of the year, so it is harder to evaluate their seasonal cycle with confidence. The data indicate either small variation through the year or a peak in May for some species. The ratio of the carbon-based sum of carbonyls to the carbon-based sum of NMHCs indicates peak values of around 50 % in summer and minimum values of around 10 % in March and October, and there are insufficient data in winter to calculate this ratio. This seasonal pattern in the carbonyl : NMHC ratio agrees with measurement data from the EMEP background stations on the European mainland (Solberg et al., 1996a). For example, a northern European campaign measuring NMHC concentrations at five EMEP sites including Ny-Ålesund was carried out during the spring of 1993. Decreasing concentrations from March to June were observed at all sites. The highest concentrations of hydrocarbons were found in air masses coming in from the southwest to southeast, indicating long-range transport from continental Europe and the UK. The measured concentrations were compared with model calculations covering Europe, and the agreement indicated that the European VOC emission inventory was quite well estimated (Hov et al., 1997).
Time series of NMHCs as measured at the Zeppelin Observatory during 1989 to 2020 are shown in Fig. 14, linking the grab samples from the 1990s with the continuous monitoring in the 2000s. The grab samples in glass flasks made by NOAA are also included in the figure. Mean NMHC levels in the Arctic (and in Europe) have decreased significantly since 1989 (Fig. 15). The percentage change over the entire period 1989 to 2020 defined as , where X is the mixing ratio, is given in Table 7. Due to the infrequent sampling, the strong seasonal cycle, and the long period of missing data, these numbers will be very uncertain but could be taken as an indication of the trends for the different species. This shows highly different trends with no change in ethane as opposed to decreases of the order of 60 % to 80 % for n-butane, n-pentane, and benzene. These differences are seen also if applying a simple Theil–Sen trend calculation by season as shown in Fig. 15. The Theil–Sen statistics give insignificant trends for ethane in all seasons, whereas trends of 1 % yr−1 to 2 % yr−1, corresponding to an approximately 30 % to 60 % decrease over the entire 1989 to 2019 period depending on the season, are found for other species. The NMHC profile, i.e. the relative mix of the individual hydrocarbons, is useful for the study of the low-ozone episodes (LOEs) as discussed in Sect. 5.7. The change in the NMHC profile during LOEs clearly indicated the influence of other oxidants besides OH, namely halogen species.
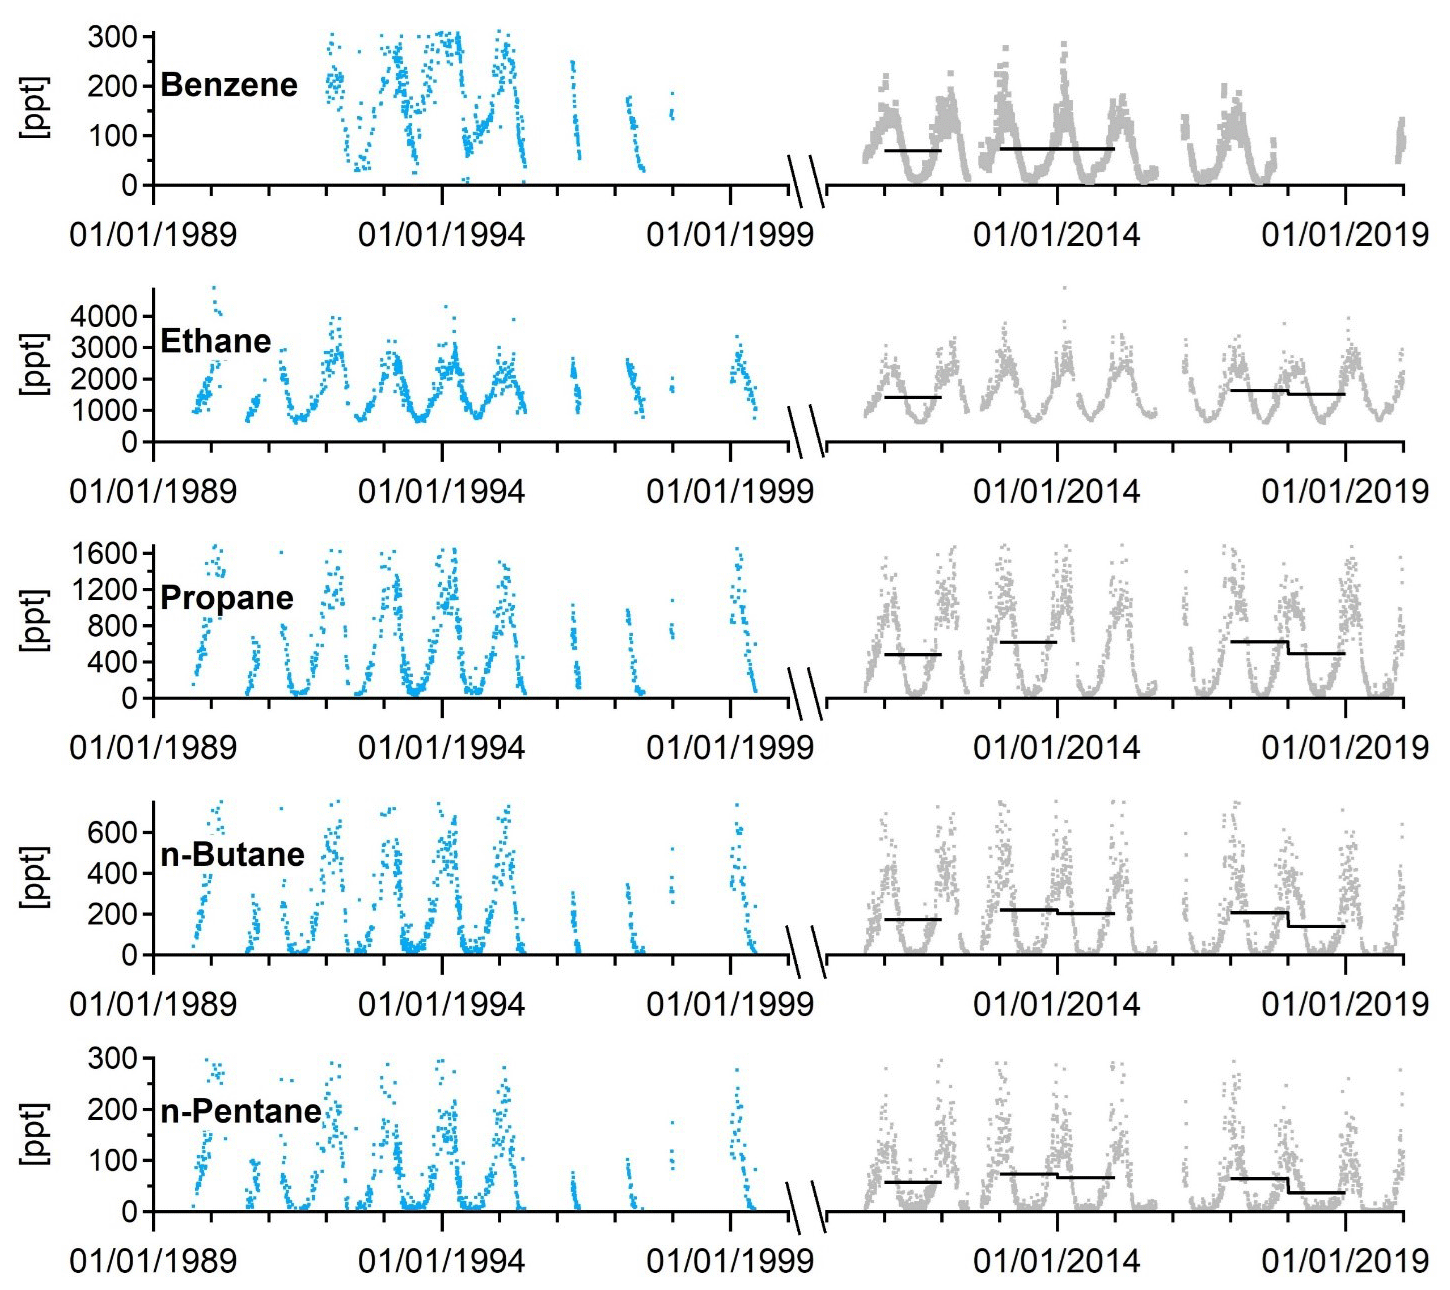
Figure 14Non-methane hydrocarbon (NMHC) mixing ratios at the Zeppelin Observatory from “grab samples” (two to three steel flask samples of 20 min, per week, shipped and analysed at NILU's laboratory) for 1989–2000 (blue) and averaged NMHC from the Medusa GCMS instrument (grey dots) and yearly averaged NMHC from the Medusa GCMS instrument for 2010 to 2019. Daily and annual means calculated only where data coverage is 75 % of the total day or year, respectively.
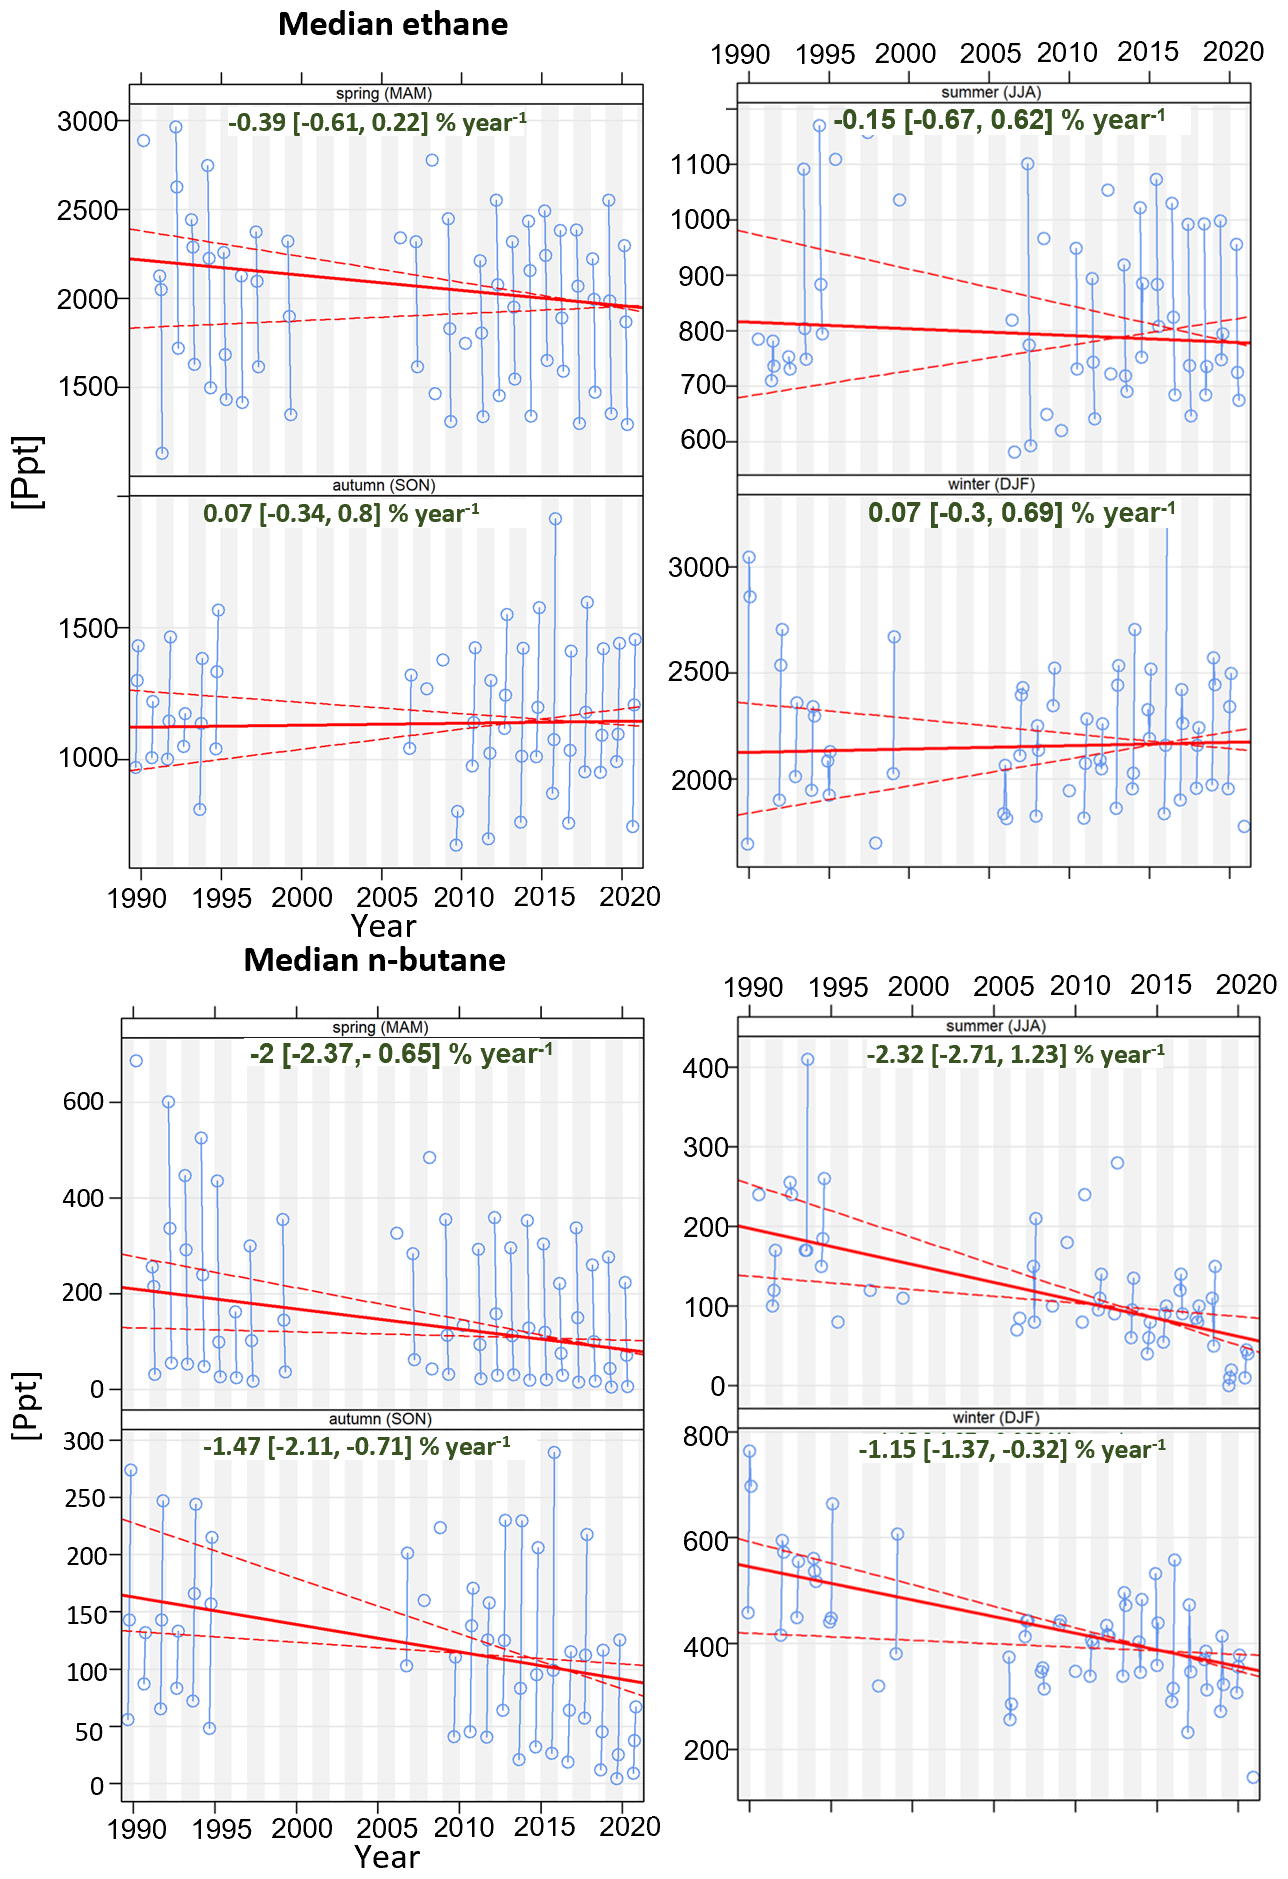
Figure 15Seasonal Theil–Sen slopes (red) and confidence intervals (dashed, red) based on monthly median concentrations (blue) of ethane and n-butane at the Zeppelin Observatory.
Table 7Non-methane hydrocarbons measured at the Zeppelin Observatory; their chemical formulas, atmospheric lifetime, mean mixing ratios in 2019, and fitted trends; and the estimated percentage change over the entire period 1989–2019 as defined as where significant.
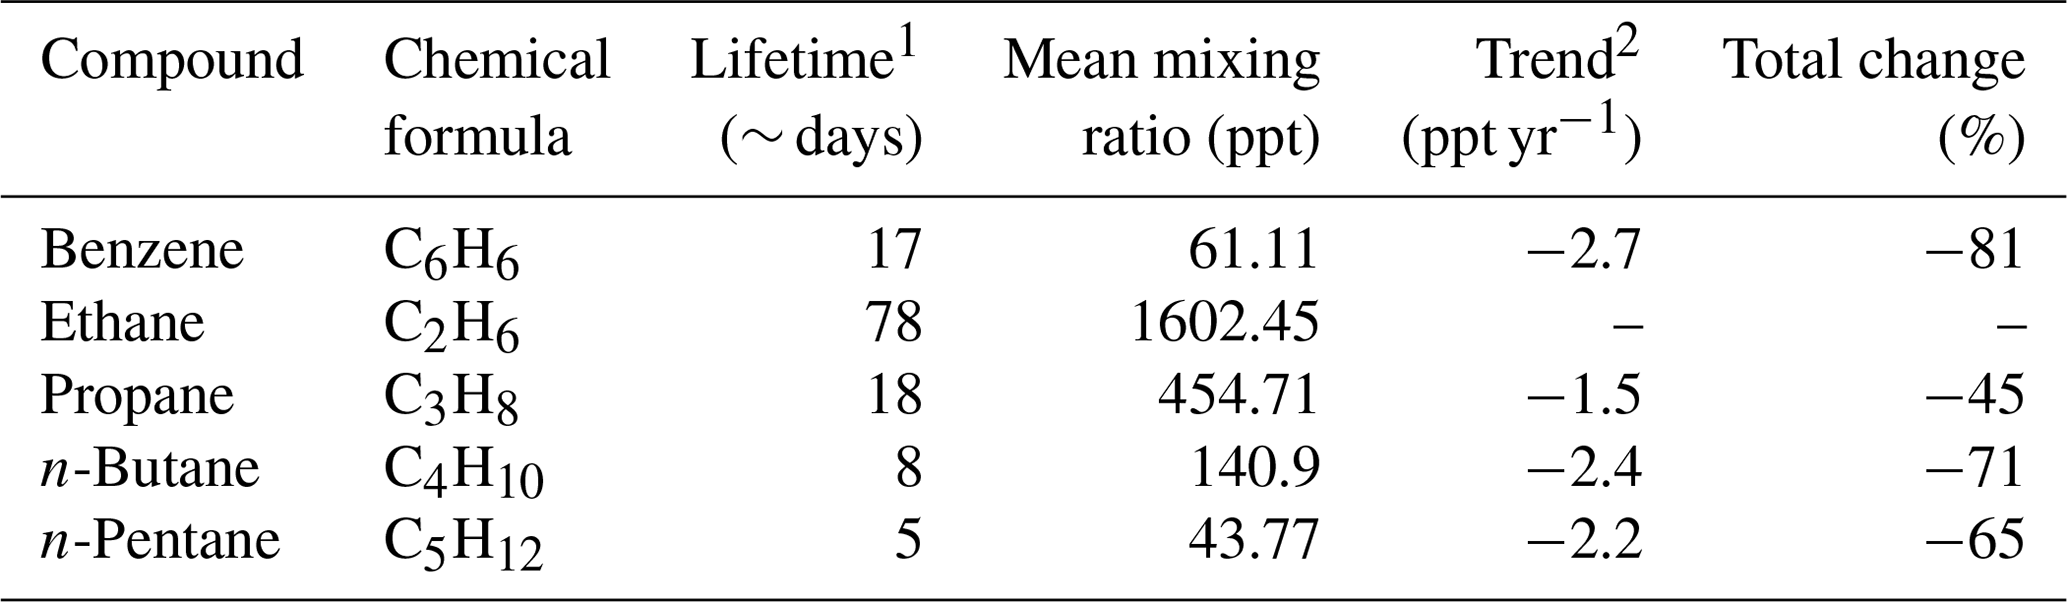
1 Lifetimes in approximate (∼) days according to Hewitt (2000). 2 Following Markwardt (2009), seasonal trends are calculated according to a non-linear least squares fit using , where c(t) is the concentration at a time t of 2019 (in years) and t0 of 1989. The coefficients a0, a1, a2, and a3 represent a simple seasonal cycle with mean concentration a0; amplitude a1; and seasonal phase displacement a2 that changes exponentially over time with a3, defining a positive (a3>0) or negative (a3<0) growth rate or no trend (a3=0).
5.5 Persistent organic pollutants
Hung et al. (2016), Wong et al. (2021), and Petäjä et al. (2020) summarize temporal trends for legacy POPs at the Zeppelin Observatory and three other AMAP stations: Alert, Canada; Pallas, Finland; and Stórhöfði, Iceland. They show that most POPs listed for control under the Stockholm Convention (SC), e.g. hexachlorohexanes (HCHs), polychlorinated biphenyls (PCBs), dichlorodiphenyltrichloroethanes (DDTs), and chlordanes, were declining slowly at all Arctic sites. The decline was largely suggested to reflect reduced primary emissions during the last 2 decades and the increasing importance of secondary emissions from environmental reservoirs. Slow declining trends for these POPs signify their persistence and slow degradation in the Arctic environment, resulting in detectable levels despite being banned for decades in many countries (Ma et al., 2011).
However, not all legacy POPs show a steady, continuous decline in air concentrations at Zeppelin over the entire monitoring time period, as shown in Fig. 16. A notable example is HCB (hexachlorobenzene), which declined during the 1990s (from an annual mean concentration of 95 pg m−3 at the beginning of the 1990s to 55 pg m−3 by 2000), prior to regulation under the Stockholm Convention on POPs, but then started to increase until a few years ago (to an annual mean concentration of 85 pg m−3 in 2014 to 2016), i.e. after HCB became regulated under the SC. Two main hypotheses have been put forward to explain this late increase: (1) increasing primary emissions and (2) enhanced re-volatilization of HCB from previously contaminated surface reservoirs, potentially modulated by increasing temperatures due to a warming climate (e.g. Ma et al., 2011).
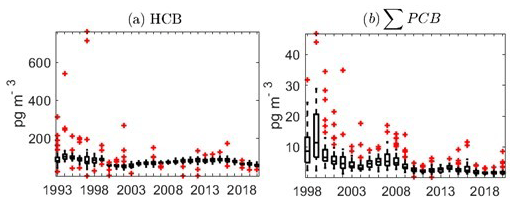
Figure 16Boxplot time series (box top and bottom: 75th and 25th percentiles, respectively; horizontal bar: median; outliers: red crosses) of (a) hexachlorobenzene (HCB) from 1993 to 2019 and (b) the sum of seven polychlorinated biphenyls (PCBs 28, 52, 101, 118, 138, 153, 180) from 1998 to 2019, at the Zeppelin Observatory.
Similarly to the analysis for the eBC in Sect. 3.2, we used FLEXPART to estimate footprint emission sensitivities for periods of high and low HCB concentrations (>80th and <20th percentiles of concentration, respectively) in December to March 2014 to 2017, i.e. during the Arctic haze period, and also when HCB was especially elevated compared to other years. The ratio of each of these footprint sensitivities to the average (Fig. 17) yields a qualitative description of geographic areas linked to high and low levels of haze-time HCB seen at the Zeppelin Observatory. The patterns are distinctively different. FLEXPART predicts that haze periods with higher concentrations of HCB in air at Zeppelin are mainly associated with transport of air masses from Asia and, albeit to a lesser extent, from Greenland and the Arctic Ocean north of Mt Zeppelin (Fig. 17a). In sharp contrast, we attribute periods with lower concentrations of HCB (Fig. 17b) to transport from ocean areas south of Mt Zeppelin and the North American continent (e.g. Alaska). Together, these model predictions show that Asian HCB emissions largely explain the elevated concentrations of HCB observed during December–March at the Zeppelin Observatory. Additionally, secondary emissions of HCB from ice-covered areas in the high Arctic may, to some extent, have contributed during periods with elevated concentrations (Fig. 17a), and large ice-free ocean areas are associated with low concentrations, which suggests that secondary emissions from these regions are of limited significance.
5.6 Heavy metals and mercury
Being elements, metals cannot be broken down into less toxic substances in the environment. Although some metals are essential nutrients at low concentrations, heavy metals can be toxic even in small quantities and are present at high levels in regions remote from most anthropogenic sources, such as the Arctic. Through the 1998 Protocol on Heavy Metals under the UNECE Convention on Long-Range Transboundary Air Pollution (CLRTAP), governments are taking measures to minimize and prevent emissions of Cd, Pb, and Hg by regulating their predominant anthropogenic sources: waste incineration, combustion, and industrial processes. According to the European Environment Agency (EEA), emissions of these elements have been reduced by 55 %, 87 %, and 61 %, respectively, since 1994 (https://www.eea.europa.eu/data-and-maps/indicators/eea32-heavy-metal-hm-emissions-1/assessment-10, last access: 8 February 2022).
A strong seasonal signal is observed for most of the heavy metals with a maximum in winter and minimum in summer (Fig. 18), driven by major weather systems. In winter and spring, a high-pressure system over Siberia pushes the Arctic Front southwards and sensitivity to major polluted areas increases (Fig. 4), including to smelters on the Kola Peninsula (Berg et al., 2004). The signal is most pronounced for the so-called anthropogenic elements Pb, Cd, and As, typically associated with long-range transport, and less pronounced for Ni, Cu, Co, and Zn, elements with Arctic sources from non-ferrous smelters on the Kola Peninsula (Laing et al., 2014a), and Cr, Mn, and V that also have a natural component from soil or sea salt. Similar seasonality has previously been observed at Zeppelin (Berg et al., 2004); Alert, Canada (Gong and Barrie, 2005); Kevo, Finland (Laing et al., 2014a); and over the Russian Arctic coast (Shevchenko et al., 2003).
We estimated the annual trends on a monthly basis (i.e. comparing the same month in consecutive years) using Sen's slope, yielding different magnitudes and signs for the slope (Table 8). Generally, the steepest decreasing trends for most elements are during the winter months, whereas trends are less homogenous during summer months with both increasing and decreasing trends. For Mn an increasing trend is observed for all months but December and September.
Decreasing annual trends are observed for As (−3.8 % yr−1), Cd (−2.8 % yr−1), Cu (−0.9 % yr−1), Pb (−4.6 % yr−1), and V (−3.8 % yr−1), though the trend is not significant for Cu. Increasing annual trends are observed for Mn (1.9 % yr−1) and Cr (2.7 % yr−1); however the trend is significant only for Mn. The annual trend is close to unchanged for Zn (0.1 % yr−1), Co (0.6 % yr−1), and Ni (0.2 % yr−1). These annual trends are in line with observations from other long-term Arctic sites (Gong and Barrie, 2005; Laing et al., 2014b), whereas a previous trend study from Zeppelin for the time period 1994–2003 showed no significant trends for any element except Ni (Berg et al., 2004).
A study by Weinbruch et al. (2012) examining the composition and source of aerosols at Zeppelin found that sea salt, aged sea salt, silicates, and mixed particles are the main constituents of particles at Zeppelin. They also found that the fly ash abundance is not correlated with air masses crossing industrialized regions in central and eastern Europe, Scandinavia, or Russia, indicating a significant reduction in the long-range transport of HMs to Svalbard. The HM trends observed are non-monotonic for all elements, and for Ni and Zn and to some degree Cr, it appears the trend has changed direction and is now increasing. Though Ni was decreasing for the first 10 years of measurements, Ni concentrations are now even higher than when the measurements were initiated in 1994. According to the European Environment Agency, European emissions of Ni, Zn, and Cr to air have steadily decreased since 2007 by more than 50 %, which may indicate that the Ni, Zn and Cr observed at Zeppelin have sources of more local origin.
Mercury (Hg) is a pollutant of particular concern that has a complicated biogeochemical cycle involving atmospheric transport, deposition to land and water surfaces, re-volatilization, and uptake by plants (Selin, 2009). Hg can exist in many different chemical forms and convert between these forms through oxidation. Methylation results in toxic methylmercury that bioaccumulates and biomagnifies through the food web (Selin, 2009). Building on the 1998 Protocol on Heavy Metals, the Minamata Convention on Mercury (MCM) was adopted in 2013 and entered into force in 2017. MCM is a global treaty under the United Nations Environment Programme (UNEP) with the goal of protecting human health and the environment from the adverse effects of Hg. The major content of this treaty includes a ban on new Hg mines, the phasing out of old Hg mines, control measures on air emissions, and international regulation of the informal sector for artisanal and small-scale gold mining.
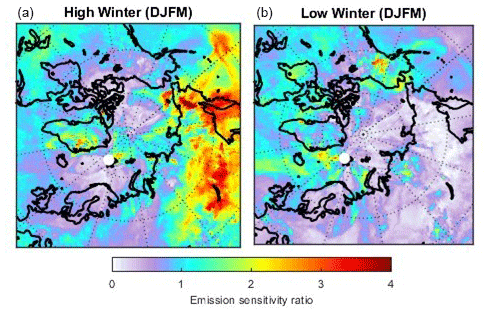
Figure 17The ratio of the hexachlorobenzene (HCB) emission sensitivities to the average at the Zeppelin Observatory during a) high levels (>80th percentile) and b) low levels (<20th percentile) during the Arctic haze period (March to December) in 2014 to 2017. This ratio yields a qualitative description of source regions of HCB with red indicating the source regions contributing most to high HCB levels in (a) and to low HCB levels in (b).
In the atmosphere, mercury is characterized by a variety of chemical and physical forms; however the most abundant is gaseous elemental mercury (GEM) with an atmospheric lifetime of 0.5–1 years (Schroeder and Munthe, 1998). At Zeppelin, the mean GEM concentration, combining manual and automated sample collection methods, is 1.5±0.24 ng m−3. The measurement time series is one of the longest GEM time series worldwide (Fig. 19).
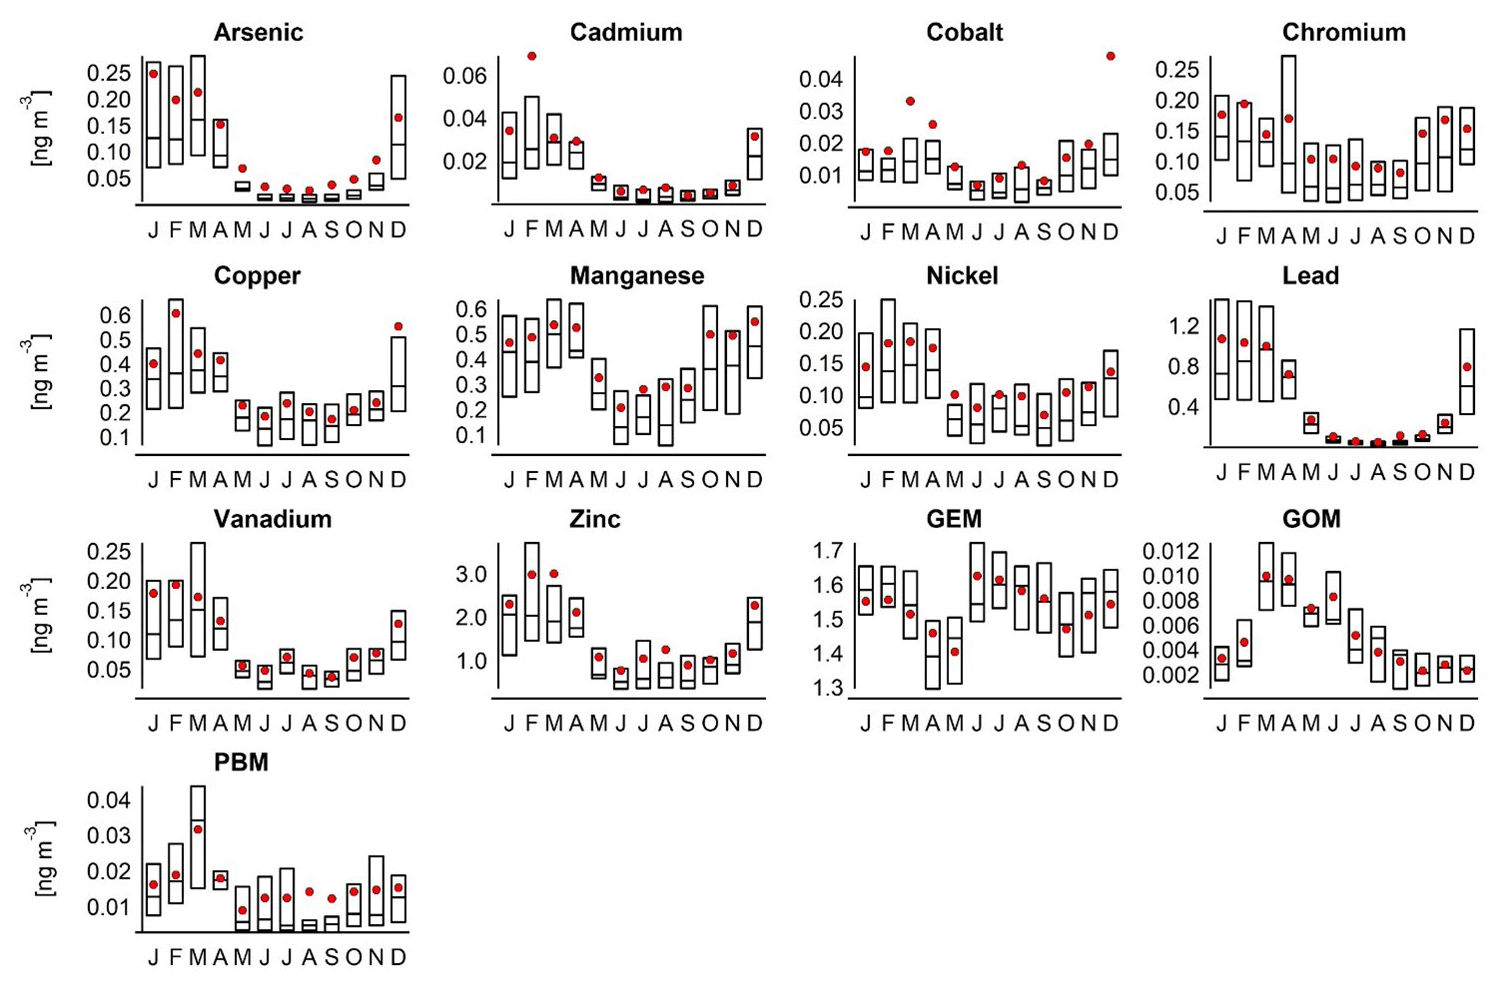
Figure 18Boxplots (box top and bottom: 75th and 25th percentiles, respectively; horizontal bar: median) and monthly averages (red) of heavy metals, gaseous elemental mercury (GEM), gaseous organic mercury (GOM), and particle-bound mercury (PBM) concentrations at the Zeppelin Observatory. Heavy metals and GEM from the period 1994 to 2019 and PBM and GOM from 2007 to 2018.

Figure 19Monthly (violet) and annual (red) mean concentrations of heavy metals, gaseous elemental mercury (GEM), gaseous organic mercury (GOM), and particle-bound mercury (PBM) at the Zeppelin Observatory. Estimated emissions as a percentage of the base year 1994 according to the European Environment Agency (EEA, black) are shown where available (with the scale on the right axes). Monthly and annual means calculated only where data coverage is 75 % of the total month or year, respectively.
GEM is subject to oxidation chemistry and converted into the operationally defined gaseous oxidized mercury (GOM, also commonly called RGM) and particulate-bound mercury (PBM, also known as PM or PHg). Hg in the Arctic undergoes large-scale rapid conversion from GEM to GOM and PBM in the spring during “atmospheric mercury depletion events” (AMDEs) (Schroeder and Munthe, 1998; Berg et al., 2003; Steffen et al., 2008). These chemical reactions are associated with sea ice through surface bromine reactions (Steffen et al., 2008, 2015). Previous trend analysis (Mann–Kendall statistic, Sen's slope) on shorter subsections of the time series does not show any significant trends, neither for combined offline and online sampling, e.g. Berg et al. (2004) for 1994 to 2002 and Berg et al. (2008) for 1994 to 2005, nor for purely online sampling, e.g. Berg et al. (2013) for 2000 to 2010. However, combining the complete data series from 1994 to 2019, a decreasing annual trend of 0.55 % yr−1 was observed (0.6 % yr−1 when considering only online sampling).
Decreasing trends in long-term GEM concentrations have been reported for many ground-based sites in Europe, North America, and Asia in the range of 1.3 % yr−1 to 2.7 % yr−1 as summarized in Lyman et al. (2020). The declines are smaller at Arctic sites compared to temperate locations (Cole and Steffen, 2010; Ebinghaus et al., 2011), and the concentrations are declining more slowly at Zeppelin than Alert (Cole et al., 2013). This is likely due to summertime Hg emissions from the ocean and meteorological effects resulting from climate change (Cole and Steffen, 2010). The main source of high mercury concentrations at the Zeppelin Observatory originates from continental Europe (Hirdman et al., 2010a). Though Hg emissions reductions in Europe have declined by 61 % since 1994, the Hg concentration in air has only been reduced by 14 % during the same period. Furthermore, emissions from East Asia, including China, contribute to the global background levels of mercury, compounding the European emissions reduction signature in the observations (Streets et al., 2019).
The seasonal variation in GEM at the Zeppelin Observatory displays high concentrations in winter and summer and low concentrations in spring and autumn (Fig. 18). This is in contrast to the pattern at temperate northern latitudes with the highest concentrations in winter and lowest concentrations in summer (Sprovieri et al., 2016; Temme et al., 2007), which are mainly attributed to primary anthropogenic mercury emissions from coal combustion for domestic heating (Temme et al., 2007; Weigelt et al., 2015). Global Hg models have so far not been able to test this hypothesis as current anthropogenic mercury emission inventories have no seasonal resolution and are kept constant throughout the year (Holmes et al., 2010; Song et al., 2015; Horowitz et al., 2017). The seasonal pattern at the Zeppelin Observatory is strongly influenced by ADMEs taking place through fast oxidation mechanisms initiated by photochemistry involving halogens derived from heterogeneous reactions on hygroscopic sea salt aerosols (Steffen et al., 2015). AMDEs cause the springtime-low GEM concentrations, and the summertime high is caused by either re-emission of previously deposited GEM during spring or GEM volatilization from the ocean (Hirdman et al., 2009; Berg et al., 2013).
Concentrations of GOM and PBM at Zeppelin are low for most parts of the year but are elevated during spring and summer, again due to AMDEs, though they are still lower compared to other Arctic sites (Lindberg et al., 2002; Steffen et al., 2008). This is likely because Zeppelin is located relatively far from where the AMDEs take place and most of the Hg species have already been deposited before being captured at Zeppelin (Steen et al., 2011). Trends in speciated Hg measurements have been investigated in the most recent AMAP Hg assessment, and it was found that trends for GOM are declining for the months from February through September with no significant trend for the remainder of the year. On the other hand, trends for PBM are increasing for the months January through May and in November and decreasing for September, October, and December. The shift in speciation from GOM to PBM in spring suggests an influence of changing Arctic conditions on AMDEs.
Table 8Annual trends (%) as calculated from Sen's slope for annual and (individual) monthly means. Significant trends at the 95 % confidence level are given in bold.
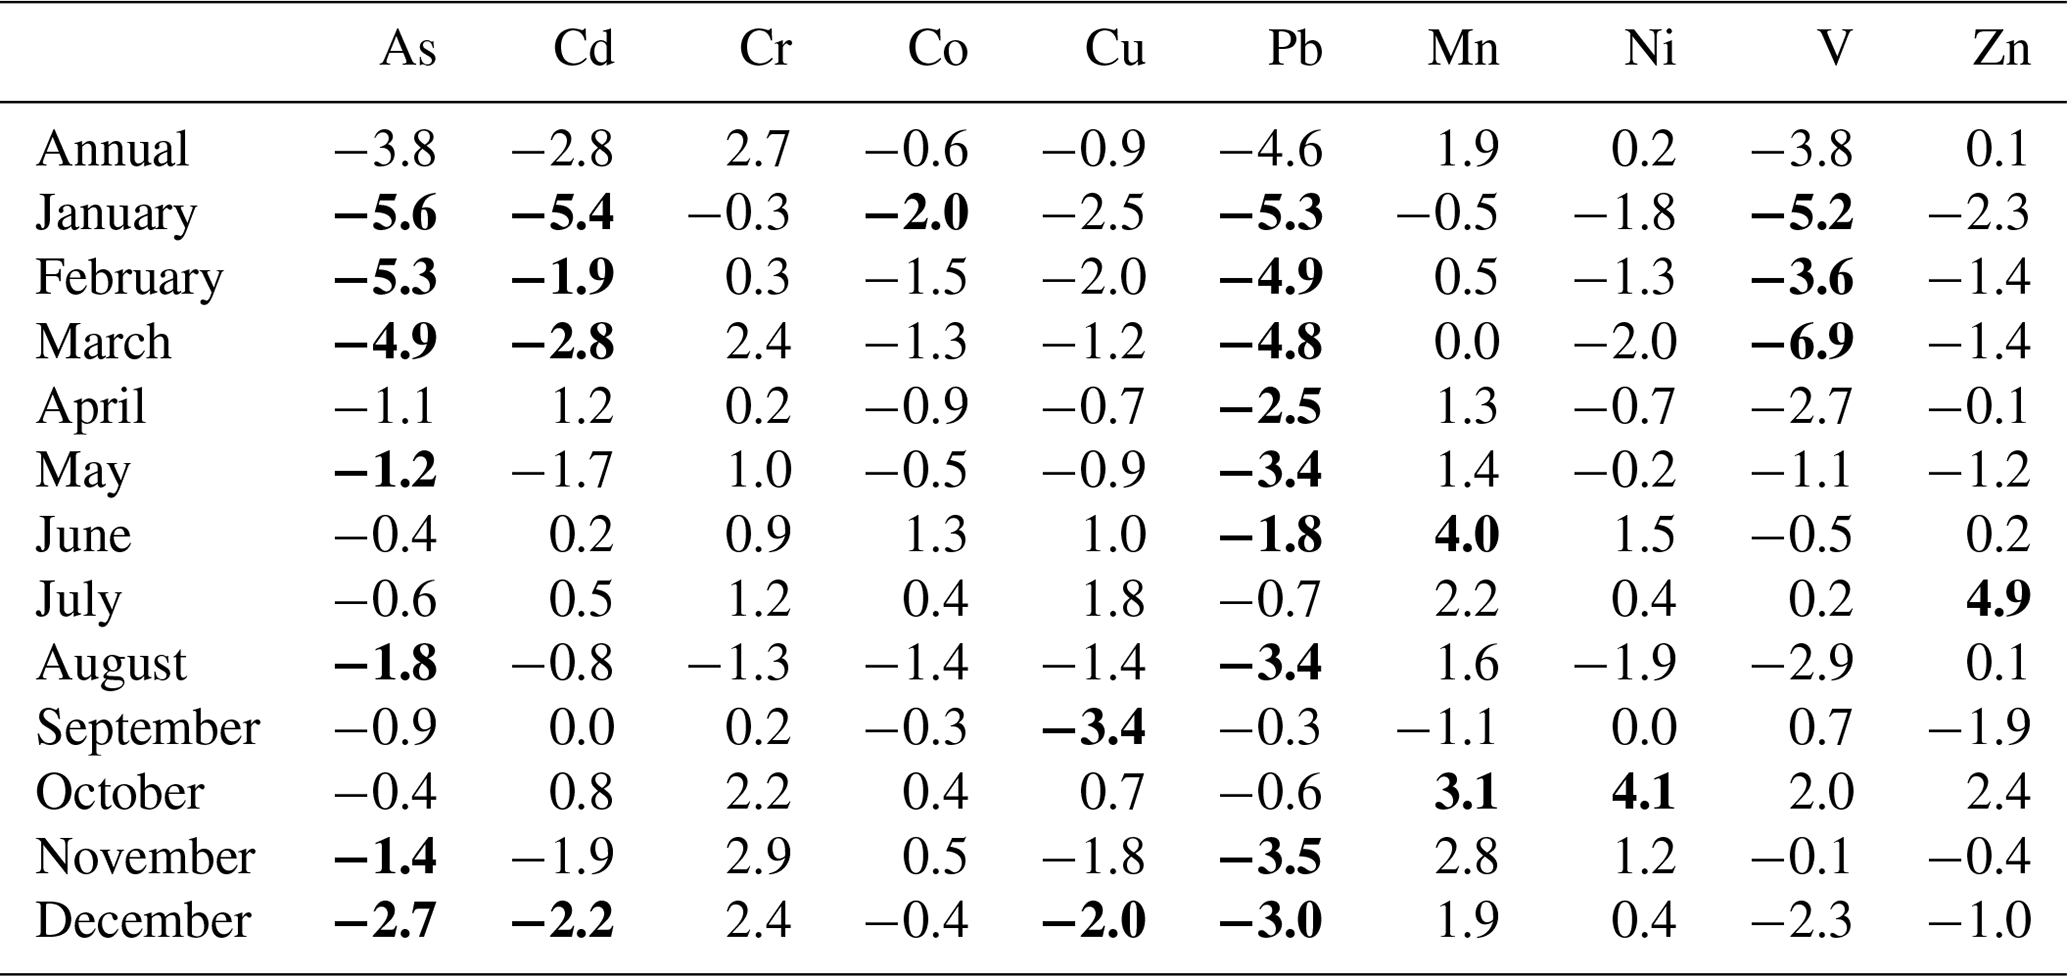
5.7 Surface ozone
Ozone is an important species in the troposphere with implications for global warming and the atmospheric chemistry in general, and knowledge of ozone in the Arctic is of particular interest for assessing the overall chemical state of the background atmosphere in the Northern Hemisphere. The Zeppelin Observatory has one of the longest continuous surface ozone time series in the Arctic with its 30-year history.
As mentioned by Zhou et al. (2017) no clear and consistent trends for baseline ozone in the Northern Hemisphere have been found. The most recent ozone trend evaluation for the Zeppelin Observatory and 26 other remote sites was conducted by Cooper et al. (2020) as a follow-up of the TOAR (Tropospheric Ozone Assessment Report) project. They looked at trends over various time periods – 2000 to 2017; 1995 to 2017; and the full record, i.e. 1989 to 2017 – for the Zeppelin Observatory, and found an increasing trend, but the significance is weak (p<0.10) when analysing the full period starting in 1989. They estimated an increase in mean ozone of 5 % from the start to 2017 for the Zeppelin Observatory. For the other time periods, there was no significant trend based on their data selection (monthly anomalies in mean concentration).
Several projects have been dedicated to processing studies of ozone in the Arctic troposphere (e.g. Polar Study using Aircraft, Remote Sensing, Surface Measurements and Models, of Climate, Chemistry, Aerosols, and Transport – POLARCAT – and Tropospheric Ozone Production about the Spring Equinox – TOPSE), but fewer studies have focused on long-term trends. Results from POLARCAT revealed that in spring and summer, anthropogenic emissions from Europe are found to contribute significantly to ozone in the lower troposphere over the eastern Arctic (Law et al., 2017; Wespes et al., 2012). This is consistent with the atmospheric transport studies by, for example, Stohl (2006) and Pisso et al. (2016) as discussed in more detail in Sect. 3.2.
O3 has slowly increased at the Zeppelin Observatory from an annual average of ∼31 ppb in 1990 to ∼35 ppb in 2019, with a smooth trend indicating a modest increase from the start to 2003–2006 followed by a flat or slightly decreasing levels (Fig. 20). O3 has a marked seasonal cycle with maximum values during the haze period in spring (March) and minimum values in summer (July).
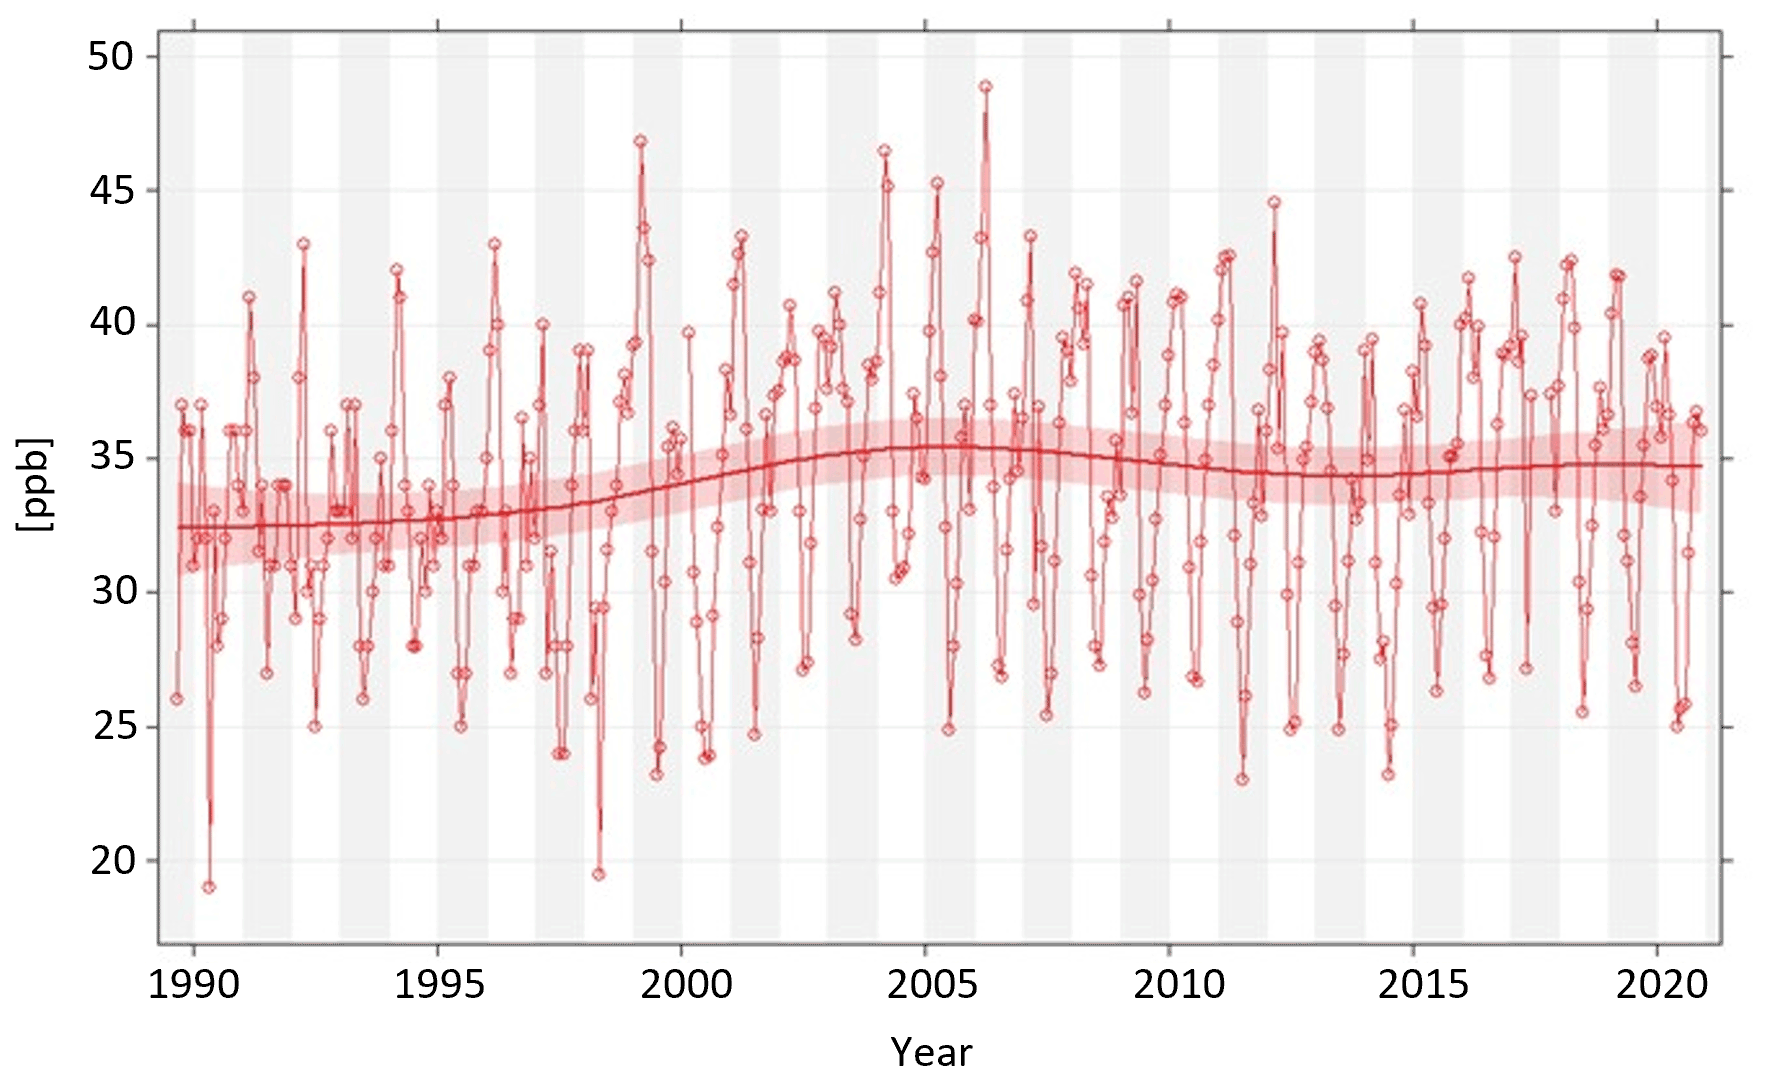
Figure 20Monthly median concentrations of O3 at the Zeppelin Observatory during 1989 to 2020 (ppb). Superimposed on the data is a smooth trend function (based on a generalized additive model (GAM) as provided by the smoothTrend function in the R library). Together with the trend is the 95 % confidence interval shown as a band.
Figure 21 shows the Theil–Sen slope (Sen, 1968) for each 3-month season separately together with the monthly ozone median values. This indicates increasing ozone levels in autumn, winter, and spring and decreasing levels in summer, but the trend is only statistically significant (p<0.05) in winter. The winter trend is clearly driven by a strong increase from 1990 to 2000 and small changes after that, in accordance with the findings of Cooper et al. (2020). Particularly strong variability is found in spring, which reflects the combined effect of a peak in the northern hemispheric tropospheric baseline ozone in this season combined with low-ozone episodes (LOEs) in the Arctic as discussed in more detail below.
Already in the 1980s it was discovered that LOEs occur at the surface every spring in the Arctic (Bottenheim et al., 1986; Barrie et al., 1988). The ozone monitoring at the Zeppelin Observatory showed that the LOEs were frequent even at that high-latitude location and altitude (472 m a.s.l.), and the co-located monitoring of NMHCs offered a good opportunity to evaluate the atmospheric chemistry behind the LOEs (Solberg et al., 1996) since the build-up of NMHCs in the northern-atmosphere cold season is relevant to the spring peak in tropospheric ozone seen at most rural background sites in central and northern Europe (Roemer, 2001).
It was soon proposed that self-catalytic reactions involving halogen radicals (Br and Cl) played an essential role in the LOEs (Barrie et al., 1988; Bottenheim et al., 1990; Hausmann and Platt, 1994). By the early 1980s Berg et al. (1983) found elevated levels of particulate bromine levels in spring at Ny-Ålesund and Barrow but noted that heterogeneous reactions were required to release and activate the particulate Br into gaseous form. Campaign measurements of NMHC at Alert confirmed that halogen reactions were indeed taking place (Jobson et al., 1994).
The measurements at the Zeppelin Observatory revealed that the changes observed in the NMHC profile (the relative distribution of NMHC species) during the LOEs could not be explained by standard OH chemistry, whereas they were consistent with significant levels of Cl radicals in the Arctic atmosphere. Furthermore, particularly low levels of acetylene during LOEs indicated atmospheric oxidation initiated by Br radicals as well since acetylene is particularly reactive with respect to Br (Solberg et al., 1996b). Within the EU research project Arctic Tropospheric Ozone Chemistry (ARCTOC), extensive field campaigns were carried out during 1995 and 1996 at Ny-Ålesund, leading to the detection and quantification of essential components of the halogen self-catalytic reactions, such as Br, Cl, BrO, and ClO.
Initially, the occurrence of LOEs was regarded as an isolated phenomenon only of importance for the Arctic tropospheric ozone budget. Then, measurements at Ny-Ålesund and Alert in 1998 revealed that these episodes were strongly associated with the deposition of particle-bound mercury in the Arctic (Lu et al., 2001). The data showed that the halogen radicals involved in the LOEs also led to a rapid transformation of long-lived gaseous elemental mercury (GEM) into total particulate-phase mercury (TPM) that was subsequently effectively deposited to the surface (Sect. 5.6). This established an important link between the LOEs and the input of Hg to the Arctic biosphere in spring. Furthermore, links between climate change in other regions and the frequency of Arctic LOEs have been proposed. For example, Koo et al. (2014) found correlations between so-called “teleconnection patterns”, i.e. weather patterns in other regions, such as the western Pacific, and the frequency of LOEs in the Arctic.
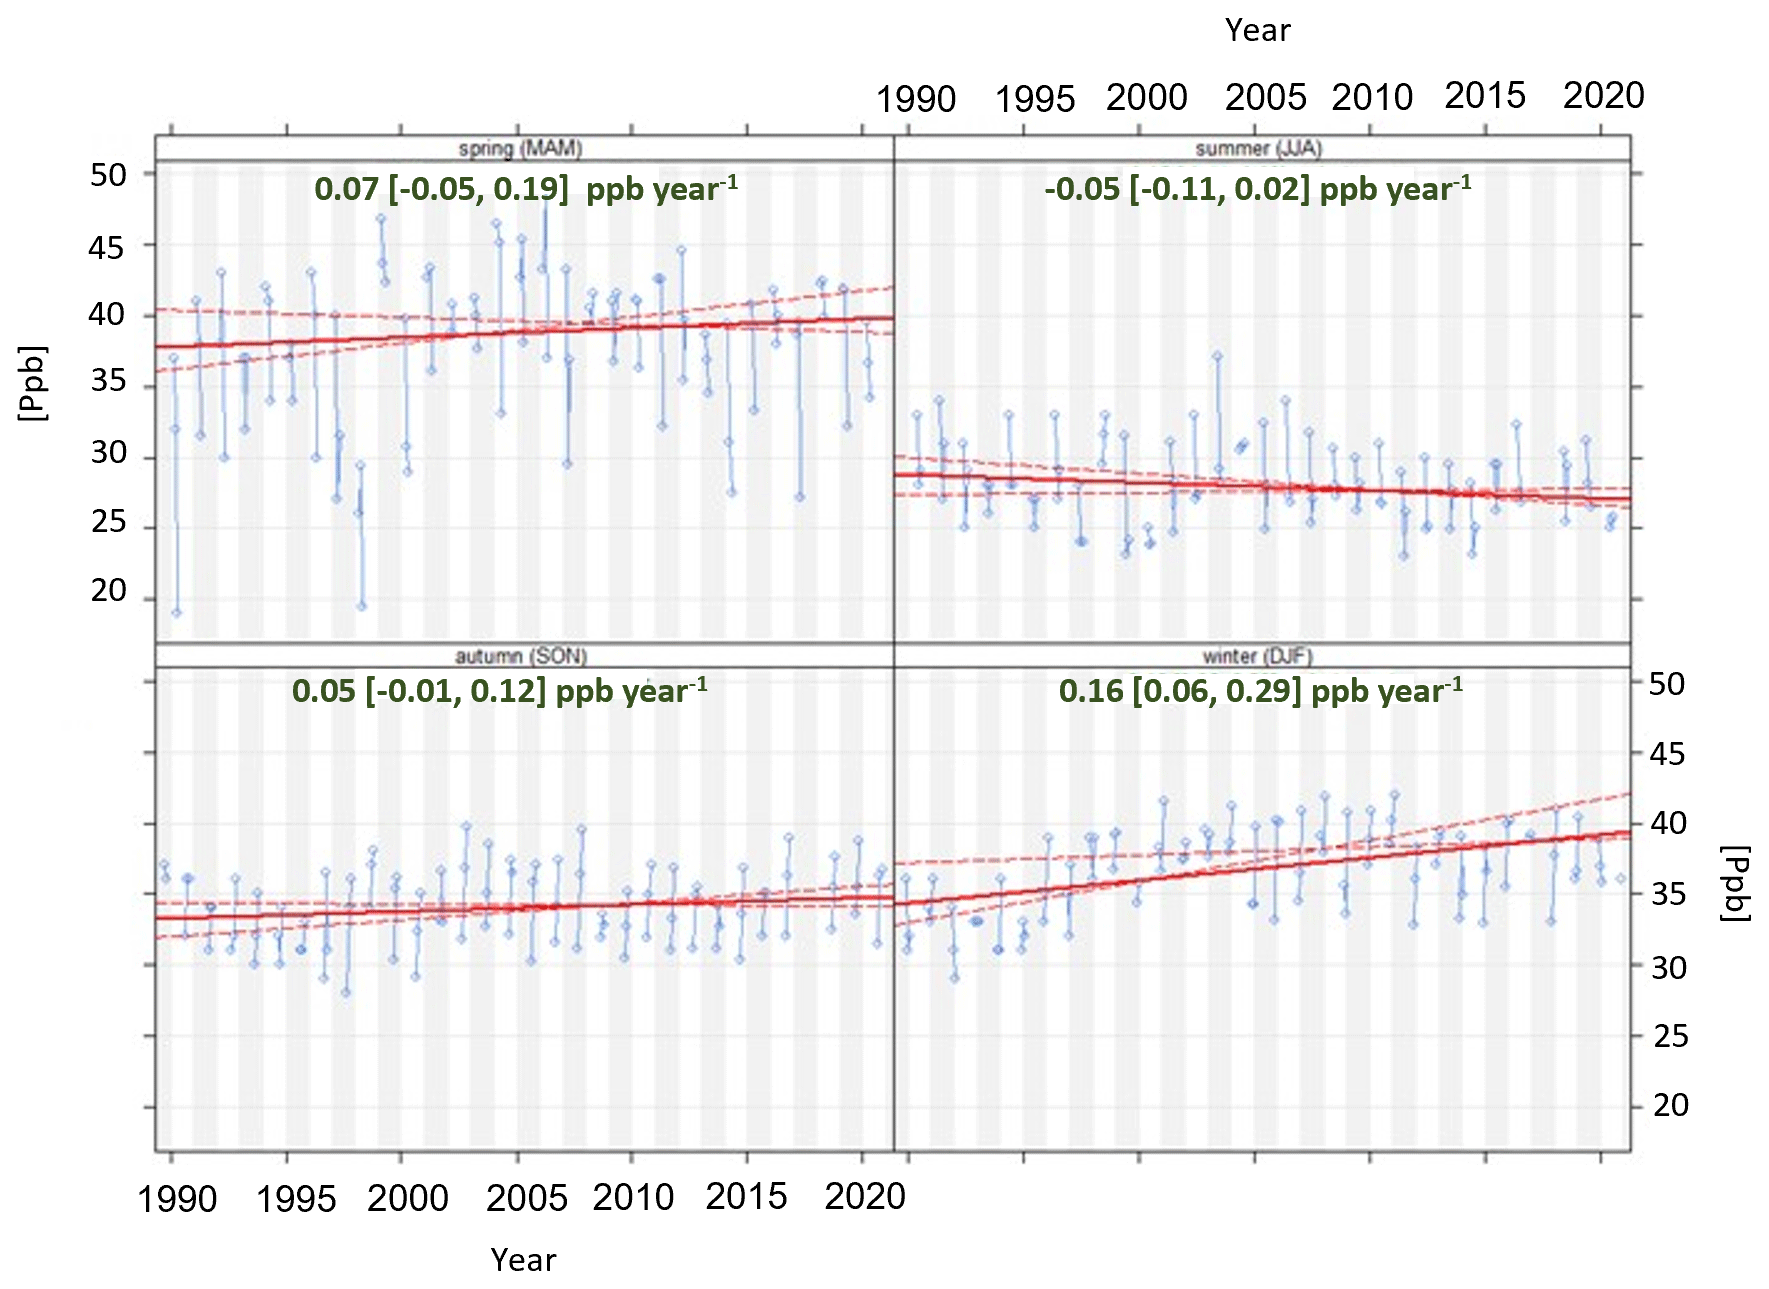
Figure 21Theil–Sen slopes and confidence intervals for monthly median O3 concentrations (ppb) at the Zeppelin Observatory during 1989 to 2020 for four seasons separately.
5.8 Reactive nitrogen
Reactive nitrogen species in the atmosphere play a key role in many issues linked to atmospheric pollutants, e.g. acidification, aerosol formation, and photochemical ozone episodes. The unique polar environment with low temperatures and prolonged periods with little solar radiation means that the behaviour of reactive nitrogen differs in important ways from that seen at lower latitudes. Peroxyacetyl nitrate (PAN) has been suggested as a main reservoir of oxidized nitrogen species in the Arctic atmosphere, particularly in winter, since the chemical lifetime of PAN is strongly dependent on temperature. Furthermore, an Arctic wintertime PAN reservoir has been proposed as a contributing source to the springtime peak in tropospheric ozone in the background Northern Hemisphere. If PAN accumulates at high latitudes during winter, the rising temperatures in spring could lead to PAN being decomposed back to NO2, a main ozone precursor in the background atmosphere.
PAN was measured during 1994 to 1996 at the Zeppelin Observatory, and a marked seasonal cycle was found with a minimum at or below 100 ppt in summer and a maximum in March/April (∼ day of year 90) at levels ∼400 ppt (Fig. 22). This is consistent with the expected behaviour of reactive nitrogen at high latitudes. During summer, concentrations are kept low by thermal breakdown and a multitude of photochemical reaction chains. During the cold and dark winter, thermal decomposition is low, and there is no local photochemical activity. The slightly increased winter concentrations can be attributed to long-range transport of well-mixed air masses. During the spring season, light intensity and photochemical processes increase sharply while thermal decomposition is still low, and we see multiple short-lived episodes of high PAN and PPN concentrations, merging into a spring maximum with a duration of 1 to 3 months.
A close correlation with the seasonal cycle of surface ozone was found, except during low-ozone episodes (LOEs), indicating that PAN was not part of these local events (Beine and Krognes, 2000). In spring, PAN levels approached the level of NOy, confirming that PAN constitutes a major fraction of odd nitrogen species in the Arctic in this season (Solberg et al., 1997). Note that unfortunately, substantial uncertainties (∼20 %) in both the NOy and the PAN measurements hindered a precise calculation of the fractionation of the individual NOy species. Based on the temperatures recorded at the Zeppelin Observatory, it was concluded that PAN was too stable in the Arctic atmosphere in spring to contribute to local NO2 formation and subsequent ozone formation, but it was not ruled out that such processes could occur during air mass transport to the Arctic (Beine and Krognes, 2000).
Along with the PAN measurements, PPN (peroxypropyonyl nitrate) was measured with the same instrument. A PPN PAN ratio of 0.1 to 0.2 was found through the year (Fig. 22). Compared to studies of reactive nitrogen at lower latitudes (e.g. Singh and Salas, 1989; Shepson et al., 1992), this indicates that this ratio may have been overestimated by a factor of 2.
As with many other trace gases measured at the Zeppelin Observatory, a clear link between air mass origin and PPN and PAN concentrations was found, with the highest levels linked to transport from the Russian sector and lowest levels linked to Atlantic marine air (Solberg et al., 1997). The latter reflects that Atlantic air normally carries cleaner air masses, but it was also speculated that heterogeneous reactions involving PAN and other oxidized nitrogen species could reduce the species in humid air as a clear link between humidity and PAN levels was found (Beine et al., 2000).
In addition to PPN and PAN, NOx was measured at the observatory in 1994 along with the NO2 photolysis rate (Beine et al., 1996, 1999). Unlike most other trace gases, a seasonal cycle with a maximum in spring was not found for NOx. Instead, the monitoring data showed levels of parts per trillion on average without any systematic pattern through the year. Based on the NOx data it was indicated that the Zeppelin Observatory was influenced by local emissions from Ny-Ålesund a mere 6 % of the time, but it should be noted that the measurement period was short and that detailed information on the local wind field around Mt Zeppelin was not available.
The main focus of atmospheric research has shifted over the decades. The original emphasis on establishing a global background, e.g. Junge (1972, Sect. 1), has been replaced by an understanding that there is no longer an atmosphere, anywhere on Earth, unperturbed by humans. Thus, the focus of many of the programmes and measurements described above is now on understanding the balance of atmospheric and Earth system processes, with an emphasis on understanding the present and future impact of anthropogenic activities.
We identify two areas important for future research: (1) examining the effects of rapid climate change, particularly for aerosols and the carbon cycle where there is potential for feedbacks and tipping points, and (2) monitoring and study of new and emerging atmospheric trace constituents of relevance to health and climate, e.g. emerging contaminants such as POP-like chemicals of concern and CFCs, HFCs, and HCFCs with very high global warming potentials.
6.1 A changing Arctic
Rapid Arctic warming has changed atmospheric transport patterns: the polar front has moved southwards by 2.5∘ while the polar vortex (strong westerly winds in winter which limit the movement of air between higher and lower latitudes) has grown weaker, due to increased and/or earlier undulations (so-called Rossby waves; Mitchell et al., 2012). This phenomenon results in very cold weather events at lower latitudes and increased heat transport northwards. Thus, global warming, enhanced by Arctic amplification, is shifting the polar climate of Svalbard towards an Atlantic maritime climate, with consequences for the natural biogeochemical exchanges between the atmosphere, ocean, ice, and eventually permafrost. The frequency of important transport pathways of pollution to Ny-Ålesund will also change with the retreat of the ice cover and rapidly increasing lower-troposphere temperatures. The variability and trends in the cycling of water through the Arctic atmosphere as observed at the Zeppelin Observatory comprise one obvious theme worth more focus due to their significance in climate change.
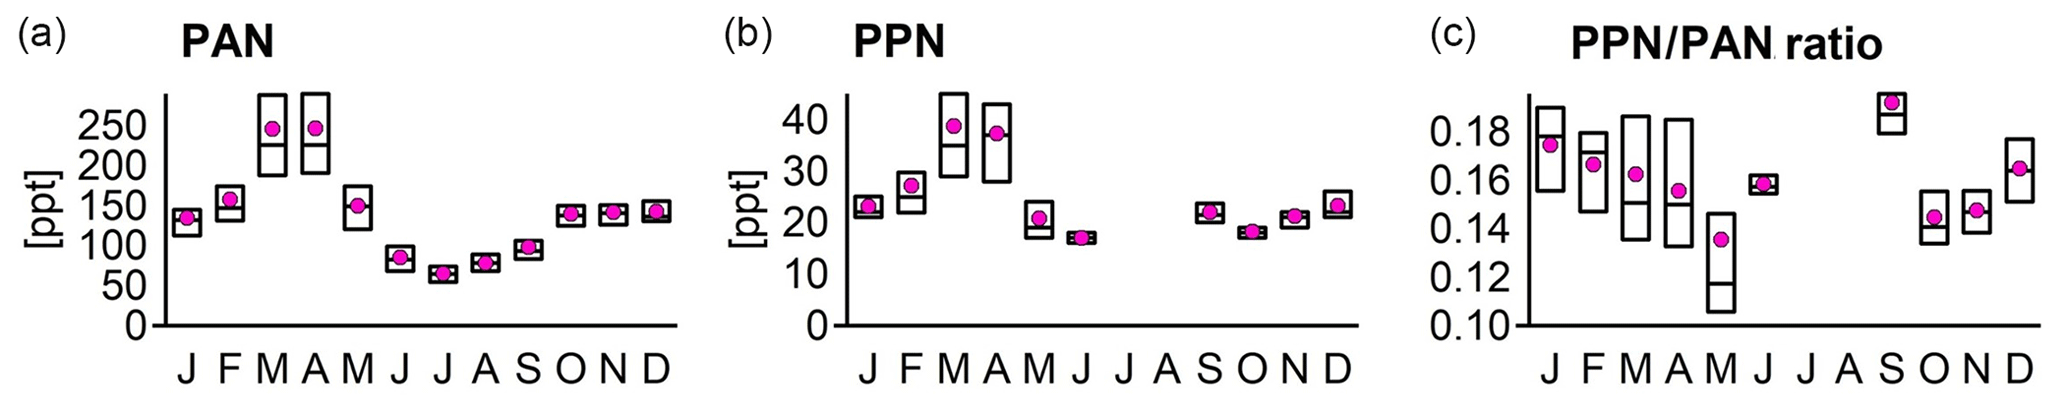
Figure 22Boxplot of monthly variation (box top and bottom: 75th and 25th percentiles, respectively, horizontal bar: median) and monthly averages (pink) of peroxyacetyl nitrate (PAN), peroxypropyonyl nitrate (PPN), and the PPN PAN ratio at the Zeppelin Observatory in 1994 to 1996.
Shifts in aerosol properties are likely to follow these regional changes with, for example, increased biological activity (Myers-Smith et al., 2020), increases in mineral dust from areas recently free of ice, increased wildfires (both forests and tundra scrub; Hu et al., 2015), and societal changes due to easier access to Arctic oil and gas extraction (Harsem et al., 2011) and the opening of new shipping routes (Humpert and Raspotnik, 2012). So far, these changes to Arctic aerosol, and hence to regional and global climate, are not well constrained. For example, Arctic mineral dust is hardly accounted for in global models (Groot Zwaaftink et al., 2016). A shift in the natural aerosol baseline within the Arctic is evident, and improved knowledge of the individual processes is needed to better constrain the future development of the Arctic climate (Schmale et al., 2021).
Changes in the Arctic aerosol burden will in turn influence climate via direct and indirect aerosol effects, i.e. via increased absorption and scattering and via changes in CCN and ice-nucleating particles (INPs), respectively (Schmale et al., 2021). Marine and terrestrial sources both act as INPs (Hartmann et al., 2020). Primary biological aerosol particles (PBAPs) are particularly important, both per se and as a coating on sea salt aerosol and mineral dust, enabling activation at higher temperatures than sea salt aerosol or mineral dust alone. Thawing permafrost can mobilize biological INP precursors into the atmosphere and, via lakes and rivers, to the ocean, and Arctic greening can be a source of INP-active PBAPs. INPs from melting glaciers were also discussed by Tobo et al. (2019). Essential information on polar INPs is lacking, including on activation temperature, composition, sources, origin, and seasonality (e.g. Creamean et al., 2018, 2019, 2020; Hartmann et al., 2019, 2020). Meanwhile, most previous studies of Arctic CCN and cloud properties are based on short-term campaigns, carried out predominantly in summer. Only a handful of studies cover seasonal cycles and interannual variability (Jung et al., 2018), and a recent study highlighted the importance of studying localized chemical composition for cloud formation in the high Arctic, finding that oceanic iodine-driven new particle formation potentially influences cloud formation (Baccarini et al., 2020). Long-term measurements of CCN and INPs are therefore required alongside detailed information on aerosol chemical composition.
Understanding how changing Arctic aerosol composition will influence climate requires knowledge of (1) changes in the Arctic aerosol burden and (2) how these relate to changes in CCN and INP properties. Addressing (1) requires better knowledge in several areas, for example, the investigation of the influence of atmospheric transport patterns (e.g. physical processes and the connection between land use and the composition of air and aerosols moving next to the ground) coupled to historical transport patterns and future projections based on Earth system models. Improved knowledge of sources themselves, including mineral dust and carbonaceous aerosol (e.g. BSOA; biomass burning organic aerosol, BBOA; and EC) and how they evolve due to regional/global change is also required. Addressing (2) requires coupling of aerosol properties to observed INP and CCN properties including concentrations and ice-nucleating/cloud-forming potential. This might be achieved through the comparison of INP and CCN properties to aerosol composition via either comparison to pre-existing long-term datasets or dedicated measurement campaigns incorporating state-of-the-art instrumentation including high-time-resolution measurements of composition. Source apportionment techniques, such as cluster analysis or positive matrix factorization (PMF), would also yield better links between CCN–INP properties and the factors contributing to their formation, e.g. BBOA and mineral dust, to better predict the impact of future changes in these sources.
There is some evidence that levels of mineral dust are increasing at the Zeppelin Observatory. For example, Mn, Cr, Ni, and to a lesser extent Zn and Cd have increased since ∼2007 (Fig. 19). While these elements have anthropogenic sources, e.g. heavy industry, they are also crustal elements. It is therefore interesting to note that at the same time as levels appear to have increased, their estimated anthropogenic emissions have decreased, according to the European Environment Agency. This suggests an increase in local or regional emissions, possibly from increased erosion and levels of mineral dust in an increasingly ice-free Arctic. In the case of Mn, ocean spray is a significant source along with mineral dust (Howe et al., 2004), and the increasing Mn levels might be linked to declining sea ice. A third possible explanation is changing weather patterns. Since mineral dust will influence climate both via aerosol effects and on snow, it is important to elucidate the reason for the increasing levels, e.g. by the transport modelling of emissions and/or by extending the range of HMs analysed to include more crustal elements to distinguish between sources.
Although high-time-resolution measurements of eBC are performed at several Arctic sites (Hirdman et al., 2010a), regular OC (and EC) measurements are generally lacking, as are studies of Arctic organic aerosol. In a rapidly changing Arctic environment with increased temperature and precipitation, retreating sea ice and changed circulation patterns and changes in natural and anthropogenic emissions are likely to affect the carbonaceous aerosol, its speciation, and its sources. We recommend an increased focus on the Arctic carbonaceous aerosol, reflecting the current mismatch between its importance and our knowledge of it, as well increased activity in studying the role of aerosol physical and chemical properties when acting as cloud seeds.
As well as changes in aerosol composition, rapid climate change will have a profound influence on the carbon cycle in the Arctic due to changes in biogeochemistry and the state of carbon reservoirs (see also Sect. 5.3). The complexity of both the natural and the anthropogenic components of the carbon cycle is therefore another crucial topic. For example, the role of Arctic CH4 in future climate is particularly important since levels have been rising unexpectedly since 2007 with negative implications for the Paris Agreement goals (see Sect. 4.3); hence future study of the intermittency of CH4 concentrations and its isotopic composition is of particular importance.
The proximity of Ny-Ålesund to major carbon reservoirs on land and on the coast of Siberia is another aspect that is likely to ensure the future relevance of measurements at the Zeppelin Observatory. For example, the Arctic seabed hosts a vast CH4 reservoir, from 0.28 to 512 Gt of carbon (Marín-Moreno et al., 2016, and references therein), in the form of gas hydrates (GHs). While previous work has demonstrated that the low CH4 fluxes to the atmosphere from seeps and GHs are due to the capacity of methanotrophic bacteria to rapidly convert CH4 to CO2 in the water column, Silyakova et al. (2020) and Puglini et al. (2020), for example, have demonstrated that “sudden” seafloor CH4 releases yield a “window of opportunity” for emissions before microbial communities can react to changing water column CH4.
Increased wildfires in peat beds, forests, and tundra scrub also result from rising temperatures (Hu et al., 2015), as do changes in CH4 release from anaerobic methanogenic microbial communities in high-latitude wetland soils, which also respond to changes in precipitation, i.e. anoxic conditions (Valentine et al., 1994). Thawing permafrost emits CH4 directly and also causes indirect CH4 emissions and is a potential climate feedback (Schuur et al., 2015). The direct CH4 emissions result from release of trapped CH4, while the more important indirect effect is due to the increased release of organic carbon coupled with hydrological changes, increasing the activity of methanogenic microbes (McCalley et al., 2014). Another important non-CO2 greenhouse gas is N2O, with a global warming potential 265 to 298 times that of CO2 (Montzka et al., 2011; Hodnebrog et al., 2013); N2O is also released from anoxic soils, and the changes in wetland soils and microbial communities are also relevant to this species.
Top-down CH4 and N2O estimates from these sources have been assessed with atmospheric inversion frameworks (e.g. FLEXINVERT; Thompson and Stohl, 2014) and the Community Inversion Framework (CIF; Berchet et al., 2021). Such inversions are based on combining observations with an atmospheric transport model (e.g. the FLEXible PARTicle dispersion model, FLEXPART) to relate changes in concentrations to changes in fluxes. The approach uses Bayesian statistics and optimizes (posterior) fluxes by minimizing a “cost function”, accounting for uncertainties in prior flux estimates and observations. Understanding developments in the CH4 and N2O budgets requires the better integration of atmospheric chemistry (e.g. Cl oxidation) and land surface models (e.g. FLUXNET-CH4; Knox et al., 2019) with top-down approaches. Furthermore, inclusion of more observational data is needed at high latitudes and in the Arctic and would reduce errors in posterior flux estimates. This might be achieved via the integration of satellite data fields (such as Sentinel-5P) into inversion models, which would require not only streamlined algorithms to reduce computation times but also careful validation of the satellite data. As one of only a handful of Arctic sites, the Zeppelin Observatory would play a key role.
Finally, the IPCC estimates that carbon emissions must be cut by 45 % by 2030 to prevent warming beyond 1.5 ∘C; thus the next 10 years is crucial for the state of the Earth's climate from a political perspective. Several nationally determined contributions (NDCs) towards meeting the goal of limiting average warming to 2 ∘C will come into effect. For example, Norway submitted an enhanced climate target under the Paris Agreement with the target to reduce GHG emissions by at least 50 % and towards 55 % by 2030 (Norwegian Climate Change Act, https://lovdata.no/dokument/NL/lov/2017-06-16-60, last access: 11 February 2022). The EU has committed to a 40 % reduction by 2030 (European Commission, 2019), and a more ambitious EU plan to cut emissions by 55 % was presented in September 2020. These legal requirements are likely to see considerable focus on GHG emission compliance, and in situ observations at the Zeppelin Observatory will play a key role at the national level (Zeppelin is one of only two ICOS atmospheric observatories on Norwegian territory as of 2020) and the international level as a global background site. This focus on GHG emissions, together with an understanding of the importance of the Arctic for climate, is an opportunity to gain political support to establish pan-Arctic observational capability, crucial to examining the impacts of the rapidly altering regional land and marine conditions on the Arctic rim states. The institutional support of the Zeppelin Observatory should be discussed first at the national level in Norway and Sweden, where weather, marine, and ecosystem research groups should align their objectives and capabilities, and then an international initiative could be undertaken to further develop a pan-Arctic Earth system observing capability involving all the Arctic rim states.
6.2 Emerging environmental concerns
Many emerging pollutants like airborne microplastics (Evangeliou et al., 2020) require study. The backdrop provided by the long-term time series from the Zeppelin Observatory forms a unique opportunity for process-oriented or basic research experiments. Zeppelin will undoubtedly be a primary location for this in years to come. Surprise events with environmental effects can be followed up; radioactivity was for example detected at the Zeppelin Observatory 10 d after the Fukushima nuclear incident (Paatero et al., 2012), demonstrating a different long-term justification for the observatory.
The long-term POP monitoring programme at Zeppelin documents a general decline for most regulated POPs. However, the concentrations of some of these POPs decline only very slowly or even show occasional increases, such as for HCB and PCBs (Sect. 5.5). These examples highlight the need for sustained monitoring at Zeppelin to ensure that global chemical management strategies remain effective. Attention should be given to the legacy POPs which remain of ecotoxicological concern and for which contemporary emissions remain poorly characterized. The example discussed for HCB furthermore illustrates the utility of the FLEXPART model in identifying regional and global source regions when these are poorly constrained.
At the same time, new organic chemicals are continuously entering the market, either as substitutes to replace the regulated POPs or to fulfil new demands. Some of these chemicals may have similar impacts on ecosystems to the legacy POPs, while some may fulfil persistence and mobility criteria but do not necessarily bioaccumulate. The latter do, however, need to be put on an equivalent level of concern to traditional POPs. To support and improve regulatory actions, there is a need to gather proofs of persistence, long-range transport, and the impact of new chemicals. The Zeppelin Observatory is an essential measurement platform in this context, since the detection of a chemical in Arctic air is a good indicator for persistence and long-range transport, after local sources have been excluded.
Targeted screening projects aimed at identifying chemicals of emerging concern (CECs) in various environmental matrices are important to prioritize which CECs should be included in Arctic monitoring programmes. The results of such studies have provided the evidence needed to include cVMSs, chlorinated paraffins, novel flame retardants, dechloranes, and a broader set of PFASs in the routine monitoring programme at Zeppelin. A complementary approach for identifying potential CECs for targeted analysis is to use in situ tools to screen large lists of chemicals in commerce to identify chemicals that can be transported into the Arctic (Brown and Wania, 2008; Howard and Muir, 2010). While the targeted approaches used for monitoring of POPs apply very selective sample clean-up and analytical methods, only allowing for detection and analysis of a very limited number of target compounds, the non-target methods also allow for the detection of unselected chemicals. Recent instrumental developments will allow a much broader analytical approach by using suspect and non-target screening. Röhler et al. (2020) identified previously undetected compounds in Arctic air by using non-target and suspect screening methods on high-volume air samples. This shows that combining air sampling with new analytical methodologies can be a tool for early identification and an early-warning system for airborne CECs.
Lastly, beyond CH4 and N2O, there are several other non-CO2 climate gases monitored at the Zeppelin Observatory with extremely high global warming potential (GWP) compared to that of CO2. These include CFCs such as CFC-11 (GWP of 4660), CFC-12 (GWP of 10 200), and CFC-113 (GWP of 13 100), as well their replacement HFCs, e.g. HFC-23 (GWP of 12 400) and SF6 (GWP of 23 500). Accordingly, the CFC–HCFC–HFC family accounts for 12 % of the increase in radiative forcing since 1750, despite mixing ratios 2 to 3 orders of magnitude lower than that of CO2 (Myhre et al., 2013). Presently, the contribution to global warming posed by CFC–HCFC–HFC is very limited since concentrations are extremely low. However, since levels of many of these compounds are increasing rapidly, their development must be carefully followed (Myhre et al., 2020). Of particular concern, as shown in recent studies, is the slowing down of the rate of decline in CFC-11 by ∼50 % after 2012, both globally and at Zeppelin (Montzka et al., 2018). This is probably related to unreported emissions in China (Rigby et al., 2019), though this emissions source has now been stopped (Park et al., 2021).
The scientific goals described above can only be achieved if a broader goal of maintaining and strengthening the position of the Zeppelin Observatory as a leading global background measurement site is met. Global background sites offer unique opportunities for monitoring and research, and the FLEXible PARTicle dispersion model and the Zeppelin Observatory's location ensure that the observatory will remain at the forefront of atmospheric science for years to come. The partners at the Zeppelin Observatory (NPI, SU, NILU) are actively engaged in securing this future, and a new strategic plan for Zeppelin has been published (Steen et al., 2021). Many changes in human society occur over decadal timescales, if not longer, as do many atmospheric processes linked to, for example, the long lifetimes of CO2 and CFCs; hence background monitoring sites should maintain as many time series as possible which are compatible backwards in time while at the same time introducing new measurements of emerging pollutants, e.g. airborne microplastics, that require study. One must prepare for surprises, where a site like the Zeppelin Observatory can add a lot of information. Hence, the strategic plan includes ensuring data quality via traceable references (good metadata), deploying state-of-the-art instrumentation, and monitoring the parameters that are relevant for understanding anthropogenic influences.
To maintain data quality, continued minimal local contaminant levels must be ensured. As the region rapidly changes, alongside monitoring activities, it is important to survey the effects of local emissions on the measured constituents in all ongoing monitoring programmes. Ensuring minimal local contamination, linked to the activities at the observatory, as well as actively seeking to reduce emissions in the Ny-Ålesund settlement, is essential, as is logging local emissions. The interaction of mixing processes on the local scale, meso-scale, and regional scale needs to be under permanent surveillance to assess how measured constituent levels are impacted by these processes. Examples of such work are the studies of Eckhardt et al. (2013) and Dekhtyareva et al. (2018), demonstrating an influence of cruise ship emissions, now largely mitigated by the 2015 heavy fuel oil ban for ships close to the shoreline around Svalbard. Furthermore, the changing climate in Svalbard is likely to impact the local dispersion characteristics and increase the frequency of local dust and sandstorms (e.g. by decreased glaciation), which would undoubtedly influence aerosol distributions and particle number and metal concentrations both locally and on the regional scale, and there might be associated climate feedbacks. It will remain important to be able to distinguish between the impact of both local and regional dust.
Further steps outlined by Steen et al. (2021) to maintain the leading position of the observatory include maintaining open and accessible data, following FAIR principles (Wilkinson et al., 2016), and making metadata and the physical data available in open databases promptly after reporting. Long-term funding, good management routines, trained staff, and stable and adequate infrastructure are also essential.
With continuous measurements of a range of atmospheric trace gas components since 1989, the Zeppelin Observatory is a cornerstone of national and international monitoring programmes and Arctic atmospheric research. The construction of the observatory was motivated by the need to monitor the global background levels of aerosols; gaseous species related to climate change; ozone layer depletion; Arctic haze; changes in the oxidizing capacity of the global atmosphere; accumulation of persistent organic species in the food chain; heavy metals, in particular mercury; and eventually Earth system dynamics and changes. While the observatory at its inception was primarily focused on national monitoring, the Zeppelin Observatory now hosts measurements from 17 institutions in 13 countries. Although these are mostly long-term measurements, the Zeppelin Observatory regularly hosts instruments for short-term (1 to 3 years) campaigns. Measurement capabilities have been continuously improved to include state-of-the-art instrumentation.
The location of the observatory was selected to minimize local influences and surface exchange, based on measurements of CO2 and sulfate aerosol. Subsequent analysis with the FLEXPART model confirmed that the Zeppelin Observatory receives air mostly from above 500 m a.s.l. due to frequent temperature inversions and from the unpolluted wider Arctic with little influence from the Ny-Ålesund settlement and minor influence from cruise ships. Because of this, the site experiences some of the lowest levels of particulate matter in Europe. The Zeppelin Observatory is therefore an excellent site for basic studies on the atmosphere to establish a baseline for how pollution affects natural systems. Aerosol levels are influenced by the formation of Arctic haze with high levels of EC and OC in the Arctic spring, with a second peak in OC seen in August/September, a result of biogenic emissions of PBAP and BSOA formation. Meanwhile, overall declines in sulfate and nitrate reflect the success of the Gothenburg Protocol. Today, during the summer, biogenic sources dominate the concentrations of atmospheric gases and aerosols, allowing basic studies of the natural biogeochemical cycles and related processes. With decreasing trends in concentrations of many anthropogenically related air pollutants and the magnitude of Arctic haze in general, natural processes and changes in the natural environment within the Arctic and nearby boreal forest zone will likely have increasing importance on the Arctic atmosphere in future.
The Zeppelin Observatory is now an ICOS class-1 site, making an important contribution to Norwegian national monitoring and international monitoring of greenhouse gases. Recently the Zeppelin Observatory became part of the ACTRIS network as an aerosol in situ and a cloud in situ station, within the framework of ACTRIS Sweden. Time series of CO2 and CH4, dating back to 1989 and 1994, respectively (pre-dating ICOS), reflect the global trend of long-term increases in CO2 and recent increases since ∼2007 in CH4. Similarly, CFC–HCFC–HFC monitoring is undertaken at Zeppelin as part of AGAGE, and Zeppelin is a key station for the monitoring of these species as ozone-depleting substances with high global warning potential in view of the Montreal Protocol and efforts made towards meeting the Paris Agreement.
We have shown how Arctic climate change is driving rapidly evolving capabilities to study the Earth system as a seamless, integrated whole, providing new opportunities and responsibilities for the Zeppelin Observatory agenda and for Norwegian authorities and research institutions. The backdrop of the long-term time series provides a unique opportunity for both process-oriented and basic research experiments. The Zeppelin Observatory will undoubtedly be one of the primary locations for these for years to come.
Most data are publicly available at https://ebas.nilu.no/ (last access: 8 March 2019; EBAS, 2019) or else on request via the responsible institutions listed in Tables 1 to 4.
SMP and KjetT led the compiling of co-author inputs and wrote the main text. SMP, KAP, KB, SE, HCH, RK, PBN, SS, AS, and JS prepared figures for the manuscript. SMP, SS, SE, RK, DHR, OH, TK, CL, NS, PBN, TS, KEY, and PZ analysed and interpreted data for the manuscript. SMP, ØH, SS, CAP, JH, KH, SH, SL, and GH provided input on the Introduction section and historical aspects of the paper. NE, AS, and SE provided the main input to the atmospheric transport section. KE, KEY, MF, YJY, KTP, and WA provided input to the sections on aerosol chemical composition. MF, HCH, DHR, RK, JS, PZ, YJY, and KTP provided input to the sections on aerosol physical properties. SMP, OH, TS, CL, EN, RF, DL, TR, and CvdV provided input to the sections on gases with high relevance to climate. SS, NS, and CL provided input to sections on non-methane hydrocarbons. KB, SE, and PBN provided input to sections on persistent organic pollutants. KAP, KEY, and TB provided input to sections on heavy metals and mercury. SS provided input to the sections on surface ozone. TK and SS provided input to sections on reactive nitrogen. SMP, KEY, WA, ØH, CAP, and KH provided input to the section on the future of the Zeppelin Observatory. OH, CL, NS, KjerT, HCH, DHR, RK, JS, PZ, CAP, and KH, were responsible for data collection and station operations. All authors reviewed the final manuscript.
The contact author has declared that neither they nor their co-authors have any competing interests.
Publisher’s note: Copernicus Publications remains neutral with regard to jurisdictional claims in published maps and institutional affiliations.
Individual time series and activities described in this work have been funded through various national or international programmes and projects, and we refer the reader to the References for details. For the Norwegian monitoring activities, the Norwegian Environment Agency is the major source of funding. The authors acknowledge the NPI, SU, and NILU staff and engineers that have worked every day of the week to maintain and operate all the instruments at the Zeppelin Observatory over 30 years. Without them, we would not have had all the high-quality long-term time series without data gaps.
This research has been supported by the Swedish Environmental Protection Agency (grant no. 211-21-011); Norwegian Environment Agency (grant no. 21087006); ICOS Norway, Research Council of Norway (grant no. 296012); and Atmosfæriske miljøgifter 2021–2025, Norwegian Environment Agency (grant no. 21087020).
This paper was edited by Markku Kulmala and reviewed by two anonymous referees.
Aas, W., Mortier, A., Bowersox, V., Cherian, R., Faluvegi, G., Fagerli, H., Hand, J., Klimont, Z., Galy-Lacaux, C., Lehmann, C. M. B., Myhre, C. L., Myhre, G., Olivié, D., Sato, K., Quaas, J., Rao, P. S. P., Schulz, M., Shindell, D., Skeie, R. B., Stein, A., Takemura, T., Tsyro, S., Vet, R., and Xu, X.: Global and regional trends of atmospheric sulfur, Sci. Rep., 9, 953, https://doi.org/10.1038/s41598-018-37304-0, 2019.
Aas, W., Fiebig, M., Solberg, S., and Yttri, K. E.: Monitoring of long-range transported air pollutants in Norway, Annual Report 2019, NILU rapport, ISBN: 978-82-425-3000-4, 2020.
Aspmo, K., Gauchard, P.-A., Steffen, A., Temme, C., Berg, T., Bahlmann, E., Banic, C., Dommergue, A., Ebinghaus, R., and Ferrari, C.: Measurements of atmospheric mercury species during an international study of mercury depletion events at Ny-Ålesund, Svalbard, spring 2003, How reproducible are our present methods?, Atmos. Environ., 39, 7607-7619, 2005.
Barrie, L., Bottenheim, J., Schnell, R., Crutzen, P., and Rasmussen, R.: Ozone destruction and photochemical reactions at polar sunrise in the lower Arctic atmosphere, Nature, 334, 138–141, 1988.
Beine, H., Argentini, S., Maurizi, A., Mastrantonio, G., and Viola, A.: The local wind field at Ny-Å lesund and the Zeppelin mountain at Svalbard, Meteorol. Atmos. Phys., 78, 107–113, 2001.
Beine, H. J., Engardt, M., Jaffe, D. A., Hov, Ø., Holme, K., and Stordal, F.: Measurements of NOx and aerosol particles at the NY-Ålesund Zeppelin mountain station on Svalbard: Influence of regional and local pollution sources, Atmos. Environ., 30, 1067–1079, 1996.
Beine, H. J., Krognes, T., and Stordal, F.: High-latitude springtime photochemistry, Part I: NOx, PAN and ozone relationships, J. Atmos. Chem., 27, 127–153, 1997.
Beine, H. J., Dahlback, A., and Ørbæk, J. B.: Measurements of J (NO2) at Ny-Ålesund, Svalbard, J. Geophys. Res.-Atmos., 104, 16009–16019, 1999.
Beine, H. J. and Krognes, T.: The seasonal cycle of peroxyacetyl nitrate (PAN) in the European Arctic, Atmos. Environ., 34, 933–940, 2000.
Berchet, A., Sollum, E., Thompson, R. L., Pison, I., Thanwerdas, J., Broquet, G., Chevallier, F., Aalto, T., Berchet, A., Bergamaschi, P., Brunner, D., Engelen, R., Fortems-Cheiney, A., Gerbig, C., Groot Zwaaftink, C. D., Haussaire, J.-M., Henne, S., Houweling, S., Karstens, U., Kutsch, W. L., Luijkx, I. T., Monteil, G., Palmer, P. I., van Peet, J. C. A., Peters, W., Peylin, P., Potier, E., Rödenbeck, C., Saunois, M., Scholze, M., Tsuruta, A., and Zhao, Y.: The Community Inversion Framework v1.0: a unified system for atmospheric inversion studies, Geosci. Model Dev., 14, 5331–5354, https://doi.org/10.5194/gmd-14-5331-2021, 2021.
Berg, T., Sekkesæter, S., Steinnes, E., Valdal, A.-K., and Wibetoe, G.: Springtime depletion of mercury in the European Arctic as observed at Svalbard, Sci. Total Environ., 304, 43–51, 2003.
Berg, T., Kallenborn, R., and Manø, S.: Temporal trends in atmospheric heavy metal and organochlorine concentrations at Zeppelin, Svalbard, Arct. Antarct. Alp. Res., 36, 284–291, 2004.
Berg, T., Aas, W., Pacyna, J., Uggerud, H. T., and Vadset, M.: Atmospheric trace metal concentrations at Norwegian background sites during 25 years and its relation to European emissions, Atmos. Environ., 42, 7494–7501, 2008.
Berg, T., Pfaffhuber, K. A., Cole, A. S., Engelsen, O., and Steffen, A.: Ten-year trends in atmospheric mercury concentrations, meteorological effects and climate variables at Zeppelin, Ny-Ålesund, Atmos. Chem. Phys., 13, 6575–6586, https://doi.org/10.5194/acp-13-6575-2013, 2013.
Berg, W. W., Sperry, P. D., Rahn, K. A., and Gladney, E. S.: Atmospheric bromine in the Arctic, J. Geophys. Res.-Oceans, 88, 6719–6736, 1983.
Bidleman, T. and Olney, C.: Chlorinated hydrocarbons in the Sargasso Sea atmosphere and surface water, Science, 183, 516–518, 1974.
Bliss, L. C.: Arctic tundra and polar desert biome, North American Terrestrial Vegetation, 2, 1–40, 2000.
Bottenheim, J. W., Gallant, A. G., and Brice, K. A.: Measurements of NOy species and O3 at 82∘ N latitude, Geophys. Res. Lett., 13, 113–116, 1986.
Bottenheim, J. W., Barrie, L. A., Atlas, E., Heidt, L. E., Niki, H., Rasmussen, R. A., and Shepson, P. B.: Depletion of lower tropospheric ozone during Arctic spring: The Polar Sunrise Experiment 1988, J. Geophys. Res.-Atmos., 95, 18555–18568, 1990.
Brass, M. and Röckmann, T.: Continuous-flow isotope ratio mass spectrometry method for carbon and hydrogen isotope measurements on atmospheric methane, Atmos. Meas. Tech., 3, 1707–1721, https://doi.org/10.5194/amt-3-1707-2010, 2010.
Breivik, K., Sweetman, A., Pacyna, J. M., and Jones, K. C.: Towards a global historical emission inventory for selected PCB congeners – a mass balance approach: 2. Emissions, Sci. Total Environ., 290, 199–224, 2002.
Brosset, C.: The behavior of mercury in the physical environment, Water Air Soil Poll., 34, 145–166, 1987.
Brown, T. N. and Wania, F.: Screening chemicals for the potential to be persistent organic pollutants: A case study of Arctic contaminants, Environ. Sci. Tech., 42, 5202–5209, 2008.
Browse, J., Carslaw, K. S., Arnold, S. R., Pringle, K., and Boucher, O.: The scavenging processes controlling the seasonal cycle in Arctic sulphate and black carbon aerosol, Atmos. Chem. Phys., 12, 6775–6798, https://doi.org/10.5194/acp-12-6775-2012, 2012.
Budyko, M. I.: The effect of solar radiation variations on the climate of the Earth, Tellus, 21, 611–619, https://doi.org/10.3402/tellusa.v21i5.10109, 1969.
Cavalli, F., Viana, M., Yttri, K. E., Genberg, J., and Putaud, J.-P.: Toward a standardised thermal-optical protocol for measuring atmospheric organic and elemental carbon: the EUSAAR protocol, Atmos. Meas. Tech., 3, 79–89, https://doi.org/10.5194/amt-3-79-2010, 2010.
Cavanagh, L. A., Schadt, C. F., and Robinson, E.: Atmospheric hydrocarbon and carbon monoxide measurements at Point Barrow, Alaska, Environ. Sci. Tech., 3, 251–257, https://doi.org/10.1021/es60026a002, 1969.
Chain, E. P. o. C. i. t. F., Knutsen, H. K., Alexander, J., Barregård, L., Bignami, M., Brüschweiler, B., Ceccatelli, S., Cottrill, B., Dinovi, M., and Edler, L.: Risk for animal and human health related to the presence of dioxins and dioxin-like PCBs in feed and food, EFSA J., 16, e05333, https://doi.org/10.2903/j.efsa.2018.5333, 2018.
Cole, A. S. and Steffen, A.: Trends in long-term gaseous mercury observations in the Arctic and effects of temperature and other atmospheric conditions, Atmos. Chem. Phys., 10, 4661–4672, https://doi.org/10.5194/acp-10-4661-2010, 2010.
Cole, A. S., Steffen, A., Pfaffhuber, K. A., Berg, T., Pilote, M., Poissant, L., Tordon, R., and Hung, H.: Ten-year trends of atmospheric mercury in the high Arctic compared to Canadian sub-Arctic and mid-latitude sites, Atmos. Chem. Phys., 13, 1535–1545, https://doi.org/10.5194/acp-13-1535-2013, 2013.
Colomb, A., Conil, S., Delmotte, M., Heliasz, M., Hermannsen, O., Holst, J., Keronen, P., Komínková, K., Kubistin, D., Laurent, O., Lehner, I., Levula, J., Lindauer, M., Lunder, C., Lund Myhre, C., Marek, M., Marklund, P., Mölder, M., Ottosson Löfvenius, M., Pichon, J.-M., Plaß-Dûlmer, C., Ramonet, M., Schumacher, M., Steinbacher, M., Vítková, G., Weyrauch, D., and Yver-Kwok, C.: ICOS Atmospheric Greenhouse Gas Mole Fractions of CO2, CH4, CO, 14CO2 and Meteorological Observations 2016–2018, final quality controlled Level 2 data, https://doi.org/10.18160/rhkc-vp22, ICOS ERIC, 2018.
Commission, E.: Communication from the Commission to the European Parliament, the European Council, the Council, the European Economic and Social Committee and the Committee of the Regions, The European Green Deal, COM/2019/640 final, 2019.
Conway, T. J. and Steele, L. P.: Carbon dioxide and methane in the Arctic atmosphere, J. Atmos. Chem., 9, 81–99, https://doi.org/10.1007/BF00052826, 1989.
Cooper, O. R., Schultz, M. G., Schröder, S., Chang, K.-L., Gaudel, A., Benítez, G. C., Cuevas, E., Fröhlich, M., Galbally, I. E., and Molloy, S.: Multi-decadal surface ozone trends at globally distributed remote locations, Elementa, 8, 23, https://doi.org/10.1525/elementa.420, 2020.
Cui, S., Fu, Q., Ma, W.-L., Song, W.-W., Liu, L.-Y., and Li, Y.-F.: A preliminary compilation and evaluation of a comprehensive emission inventory for polychlorinated biphenyls in China, Sci. Total Environ., 533, 247–255, 2015.
Dall'Osto, M., Beddows, D., Tunved, P., Krejci, R., Ström, J., Hansson, H.-C., Yoon, Y., Park, K.-T., Becagli, S., and Udisti, R.: Arctic sea ice melt leads to atmospheric new particle formation, Sci. Rep., 7, 1–10, 2017.
Dalsøren, S. B., Myhre, C. L., Myhre, G., Gomez-Pelaez, A. J., Søvde, O. A., Isaksen, I. S. A., Weiss, R. F., and Harth, C. M.: Atmospheric methane evolution the last 40 years, Atmos. Chem. Phys., 16, 3099–3126, https://doi.org/10.5194/acp-16-3099-2016, 2016.
Dekhtyareva, A., Holmén, K., Maturilli, M., Hermansen, O., and Graversen, R.: Effect of seasonal mesoscale and microscale meteorological conditions in Ny-Ålesund on results of monitoring of long-range transported pollution, Polar Res., 37, 1508196, https://doi.org/10.1080/17518369.2018.1508196, 2018.
Dye, C., and Yttri, K. E.: Determination of monosaccharide anhydrides in atmospheric aerosols by use of high-performance liquid chromatography combined with high-resolution mass spectrometry, Anal. Chem., 77, 1853–1858, 2005.
EBAS: Data from the Zeppelin Observatory, http://ebas.nilu.no/, [data set], last access: 8 March 2019.
Ebinghaus, R., Jennings, S., Kock, H., Derwent, R., Manning, A., and Spain, T.: Decreasing trends in total gaseous mercury observations in baseline air at Mace Head, Ireland from 1996 to 2009, Atmos. Environ., 45, 3475–3480, 2011.
Eckhardt, S., Breivik, K., Manø, S., and Stohl, A.: Record high peaks in PCB concentrations in the Arctic atmosphere due to long-range transport of biomass burning emissions, Atmos. Chem. Phys., 7, 4527–4536, https://doi.org/10.5194/acp-7-4527-2007, 2007.
Eckhardt, S., Hermansen, O., Grythe, H., Fiebig, M., Stebel, K., Cassiani, M., Baecklund, A., and Stohl, A.: The influence of cruise ship emissions on air pollution in Svalbard – a harbinger of a more polluted Arctic?, Atmos. Chem. Phys., 13, 8401–8409, https://doi.org/10.5194/acp-13-8401-2013, 2013.
Eckhardt, S., Quennehen, B., Olivié, D. J. L., Berntsen, T. K., Cherian, R., Christensen, J. H., Collins, W., Crepinsek, S., Daskalakis, N., Flanner, M., Herber, A., Heyes, C., Hodnebrog, Ø., Huang, L., Kanakidou, M., Klimont, Z., Langner, J., Law, K. S., Lund, M. T., Mahmood, R., Massling, A., Myriokefalitakis, S., Nielsen, I. E., Nøjgaard, J. K., Quaas, J., Quinn, P. K., Raut, J.-C., Rumbold, S. T., Schulz, M., Sharma, S., Skeie, R. B., Skov, H., Uttal, T., von Salzen, K., and Stohl, A.: Current model capabilities for simulating black carbon and sulfate concentrations in the Arctic atmosphere: a multi-model evaluation using a comprehensive measurement data set, Atmos. Chem. Phys., 15, 9413–9433, https://doi.org/10.5194/acp-15-9413-2015, 2015.
Eleftheriadis, K., Vratolis, S., and Nyeki, S.: Aerosol black carbon in the European Arctic: Measurements at Zeppelin station, Ny-Ålesund, Svalbard from 1998–2007, Geophys. Res. Lett., 36, L02809, doi:10.1029/2008GL035741, 2009.
Engvall, A.-C., Krejci, R., Ström, J., Treffeisen, R., Scheele, R., Hermansen, O., and Paatero, J.: Changes in aerosol properties during spring-summer period in the Arctic troposphere, Atmos. Chem. Phys., 8, 445–462, https://doi.org/10.5194/acp-8-445-2008, 2008.
Esau, I. and Repina, I.: Wind climate in Kongsfjorden, Svalbard, and attribution of leading wind driving mechanisms through turbulence-resolving simulations, Adv. Meteorol., 2012, 568454, https://doi.org/10.1155/2012/568454, 2012. Igor Esau, Irina Repina, ”Wind Climate in Kongsfjorden, Svalbard, and Attribution of Leading Wind Driving Mechanisms through Turbulence-Resolving Simulations”, Advances in Meteorology, vol. 2012, Article ID 568454, 16 pages, 2012. https://doi.org/10.1155/2012/568454
Etminan, M., Myhre, G., Highwood, E. J., and Shine, K. P.: Radiative forcing of carbon dioxide, methane, and nitrous oxide: A significant revision of the methane radiative forcing, Geophys. Res. Lett., 43, 12614–12623, https://doi.org/10.1002/2016GL071930, 2016.
Evangeliou, N., Grythe, H., Klimont, Z., Heyes, C., Eckhardt, S., Lopez-Aparicio, S., and Stohl, A.: Atmospheric transport is a major pathway of microplastics to remote regions, Nat. Commun., 11, 3381, https://doi.org/10.1038/s41467-020-17201-9, 2020.
France, J. L., Cain, M., Fisher, R. E., Lowry, D., Allen, G., O'Shea, S. J., Illingworth, S., Pyle, J., Warwick, N., and Jones, B. T.: Measurements of δ13C in CH4 and using particle dispersion modeling to characterize sources of Arctic methane within an air mass, J. Geophys. Res.-Atmos., 121, 14257–14270, 2016.
Freud, E., Krejci, R., Tunved, P., Leaitch, R., Nguyen, Q. T., Massling, A., Skov, H., and Barrie, L.: Pan-Arctic aerosol number size distributions: seasonality and transport patterns, Atmos. Chem. Phys., 17, 8101–8128, https://doi.org/10.5194/acp-17-8101-2017, 2017.
Fritz, S.: IGY Bulletins: No. 19, No. 20, No. 21, Eos Trans. AGU, 40, 41–88, https://doi.org/10.1029/TR040i001p00041, 1959.
Garrett, T. J. and Verzella, L. L.: An evolving history of Arctic aerosols, B. Am. Meteorol. Soc., 89, 299–302, 2008.
Giege, B. and Odsjö, T.: Coordination of environmental specimen banking in the Nordic countries, its mission and strategy, Sci. Total Environ., 139, 37–47, 1993.
Gilbert, R. O.: Statistical methods for environmental pollution monitoring, John Wiley & Sons, ISBN: 0471288780, 1987.
Gong, S. and Barrie, L.: Trends of heavy metal components in the Arctic aerosols and their relationship to the emissions in the Northern Hemisphere, Sci. Total Environ., 342, 175–183, 2005.
Goyal, R., England, M. H., Gupta, A. S., and Jucker, M.: Reduction in surface climate change achieved by the 1987 Montreal Protocol, Environ. Res. Lett., 14, 124041, https://doi.org/10.1088/1748-9326/ab4874, 2019.
Graversen, R. G. and Wang, M.: Polar amplification in a coupled climate model with locked albedo, Clim. Dynam., 33, 629–643, 2009.
Grossman, E.: Nonlegacy PCBs: pigment manufacturing by-products get a second look, National Institute of Environmental Health Sciences, https://doi.org/10.1289/ehp.121-a86, 2013. Grossman E. Nonlegacy PCBs: pigment manufacturing by-products get a second look. Environ Health Perspect. 2013;121(3):A86-A93. doi:10.1289/ehp.121-a86
Hall, A.: The role of surface albedo feedback in climate, J. Climate, 17, 1550–1568, 2004.
Halse, A. K., Schlabach, M., Eckhardt, S., Sweetman, A., Jones, K. C., and Breivik, K.: Spatial variability of POPs in European background air, Atmos. Chem. Phys., 11, 1549–1564, https://doi.org/10.5194/acp-11-1549-2011, 2011.
Halvorsen, H. L., Bohlin-Nizzetto, P., Eckhardt, S., Gusev, A., Krogseth, I. S., Moeckel, C., Shatalov, V., Skogeng, L. P., and Breivik, K.: Main sources controlling atmospheric burdens of persistent organic pollutants on a national scale, Ecotox. Environ. Safe., 217, 112172, https://doi.org/10.1016/j.ecoenv.2021.112172, 2021.
Hanoa, R.: The Kings Bay accident, November 5, 1962, Tidsskr Nor Laegeforen, 109, 1974–1981, 1989.
Hansen, A. M. K., Kristensen, K., Nguyen, Q. T., Zare, A., Cozzi, F., Nøjgaard, J. K., Skov, H., Brandt, J., Christensen, J. H., Ström, J., Tunved, P., Krejci, R., and Glasius, M.: Organosulfates and organic acids in Arctic aerosols: speciation, annual variation and concentration levels, Atmos. Chem. Phys., 14, 7807–7823, https://doi.org/10.5194/acp-14-7807-2014, 2014.
Harsem, Ø., Eide, A., and Heen, K.: Factors influencing future oil and gas prospects in the Arctic, Energ. Pol., 39, 8037–8045, 2011.
Hausmann, M. and Platt, U.: Spectroscopic measurement of bromine oxide and ozone in the high Arctic during Polar Sunrise Experiment 1992, J. Geophys. Res.-Atmos., 99, 25399–25413, 1994.
Heintzenberg, J.: Particle size distribution and optical properties of Arctic haze, Tellus, 32, 251–260, https://doi.org/10.3402/tellusa.v32i3.10580, 1980.
Heintzenberg, J., Hansson, H.-C., and Lannefors, H.: The chemical composition of arctic haze at Ny-Ålesund, Spitsbergen, 33, 162–171, https://doi.org/10.1111/j.2153-3490.1981.tb01741.x, 1981.
Heintzenberg, J.: An investigation of possible sites for a background monitoring station in the European Arctic, Report/Department of Meteorology, University of Stockholm, AP, 0280-444122, Stockholm, 1983.
Heintzenberg, J., Hans-Christen, H., John, A. O., and Sven-Åke, O.: Concept and Realization of an Air Pollution Monitoring Station in the European Arctic, Ambio, 14, 152–157, 1985.
Heslin-Rees, D., Burgos, M., Hansson, H.-C., Krejci, R., Ström, J., Tunved, P., and Zieger, P.: From a polar to a marine environment: has the changing Arctic led to a shift in aerosol light scattering properties?, Atmos. Chem. Phys., 20, 13671–13686, https://doi.org/10.5194/acp-20-13671-2020, 2020.
Hewitt, C. N.: Reactive Hydrocarbons in the Atmosphere, edited by: Nicholas Hewitt, C., J. Atmos. Chem., 35, 319–321, 2000.
Hirdman, D., Aspmo, K., Burkhart, J., Eckhardt, S., Sodemann, H., and Stohl, A.: Transport of mercury in the Arctic atmosphere: Evidence for a spring-time net sink and summer-time source, Geophys. Res. Lett., 36, L12814, https://doi.org/10.1029/2009GL038345, 2009.
Hirdman, D., Burkhart, J. F., Sodemann, H., Eckhardt, S., Jefferson, A., Quinn, P. K., Sharma, S., Ström, J., and Stohl, A.: Long-term trends of black carbon and sulphate aerosol in the Arctic: changes in atmospheric transport and source region emissions, Atmos. Chem. Phys., 10, 9351–9368, https://doi.org/10.5194/acp-10-9351-2010, 2010a.
Hirdman, D., Sodemann, H., Eckhardt, S., Burkhart, J. F., Jefferson, A., Mefford, T., Quinn, P. K., Sharma, S., Ström, J., and Stohl, A.: Source identification of short-lived air pollutants in the Arctic using statistical analysis of measurement data and particle dispersion model output, Atmos. Chem. Phys., 10, 669–693, https://doi.org/10.5194/acp-10-669-2010, 2010.
Hodnebrog, Ø., Etminan, M., Fuglestvedt, J., Marston, G., Myhre, G., Nielsen, C., Shine, K. P., and Wallington, T.: Global warming potentials and radiative efficiencies of halocarbons and related compounds: A comprehensive review, Rev. Geophys., 51, 300–378, 2013.
Holmes, C. D., Jacob, D. J., Corbitt, E. S., Mao, J., Yang, X., Talbot, R., and Slemr, F.: Global atmospheric model for mercury including oxidation by bromine atoms, Atmos. Chem. Phys., 10, 12037–12057, https://doi.org/10.5194/acp-10-12037-2010, 2010.
Holmgren, B., Shaw, G., and Weller, G.: Turbidity in the Arctic atmosphere, AIDJEX Bulletin, available at: http://psc.apl.washington.edu/nonwp_projects/aidjex/files/AIDJEX-27.pdf (last access: 5 February 2020), 1974.
Horowitz, H. M., Jacob, D. J., Zhang, Y., Dibble, T. S., Slemr, F., Amos, H. M., Schmidt, J. A., Corbitt, E. S., Marais, E. A., and Sunderland, E. M.: A new mechanism for atmospheric mercury redox chemistry: implications for the global mercury budget, Atmos. Chem. Phys., 17, 6353–6371, https://doi.org/10.5194/acp-17-6353-2017, 2017.
Hov, Ø., Penkett, S., Isaksen, I., and Semb, A.: Organic gases in the Norwegian Arctic, Geophys. Res. Lett., 11, 425–428, 1984.
Hov, Ø. and Holtet, J., A.: Prosjektering av atmosfærekjemisk forskningsstasjon I Ny-Ålesund på Svalbard, NILU OR 67/87, Lillestrøm, Norway, 1987.
Hov, Ø., Schmidbauer, N., and Oehme, M.: Light hydrocarbons in the Norwegian Arctic, Atmos. Environ., 23, 2471–2482, 1989.
Hov, ø., Sorteberg, A., Schmidbauer, N., Solberg, S., Stordal, F., Simpson, D., Lindskog, A., Areskoug, H., Oyola, P., Lättilä, H., and Heidam, N. Z.: European VOC Emission Estimates Evaluated by Measurements and Model Calculations, J. Atmos. Chem., 28, 173–193, https://doi.org/10.1023/A:1005859027649, 1997.
Howard, P. H. and Muir, D. C. G.: Identifying New Persistent and Bioaccumulative Organics Among Chemicals in Commerce, Environ. Sci. Technol., 44, 2277–2285, https://doi.org/10.1021/es903383a, 2010.
Howe, P., Malcolm, H., and Dobson, S.: Manganese and its compounds: environmental aspects, World Health Organization, ISBN: 9241530634, 2004.
Hu, F. S., Higuera, P. E., Duffy, P., Chipman, M. L., Rocha, A. V., Young, A. M., Kelly, R., and Dietze, M. C.: Arctic tundra fires: natural variability and responses to climate change, Front. Ecol. Environ., 13, 369–377, 2015.
Humpert, M. and Raspotnik, A.: The future of Arctic shipping, Port Technol. Int., 55, 10–11, 2012.
Hung, H., Kallenborn, R., Breivik, K., Su, Y., Brorström-Lundén, E., Olafsdottir, K., Thorlacius, J. M., Leppänen, S., Bossi, R., and Skov, H.: Atmospheric monitoring of organic pollutants in the Arctic under the Arctic Monitoring and Assessment Programme (AMAP): 1993–2006, Sci. Total Environ., 408, 2854–2873, 2010.
Hung, H., Katsoyiannis, A. A., Brorström-Lundén, E., Olafsdottir, K., Aas, W., Breivik, K., Bohlin-Nizzetto, P., Sigurdsson, A., Hakola, H., and Bossi, R.: Temporal trends of Persistent Organic Pollutants (POPs) in arctic air: 20 years of monitoring under the Arctic Monitoring and Assessment Programme (AMAP), Environ. Poll., 217, 52–61, 2016.
INGOS: INGOS-Integrated non-CO2 observing system, https://www.ingos-infrastructure.eu/ (last access: 15 February 2021), 2016.
Isaksen, I. S. A.: Is the oxidizing capacity of the atmosphere changing?, in: The Changing Atmosphere, edited by: Rowland, F. S. and Isaksen, I. S. A., 141–157, John Wiley & Sons, Chichester, 1988.
Iversen, T.: On the atmospheric transport of pollution to the Arctic, Geophys. Res. Lett., 11, 457–460, 1984.
Iversen, T.: Some statistical properties of ground level air pollution at Norwegian Arctic stations and their relation to large scale atmospheric flow systems, Atmos. Environ, 23, 2451–2462, 1989a.
Iversen, T.: Numerical modelling of the long-range atmospheric transport of sulphur dioxide and particulate sulphate to the Arctic, Atmos. Environ., 23, 2571–2595, 1989b.
Jackson, R. B., Saunois, M., Bousquet, P., Canadell, J. G., Poulter, B., Stavert, A. R., Bergamaschi, P., Niwa, Y., Segers, A., and Tsuruta, A.: Increasing anthropogenic methane emissions arise equally from agricultural and fossil fuel sources, Environ. Res. Lett., 15, 071002, https://doi.org/10.1088/1748-9326/ab9ed2, 2020.
Jaworowski, Z.: Pollution of the Norwegian Arctic: A review, Norwegian Polar Institute Report No. 55, available at: https://brage.npolar.no/npolar-xmlui/bitstream/handle/11250/173294/Rapport055.pdf?sequence=1 (last access: 8 March 2020), 1989.
Jobson, B., Niki, H., Yokouchi, Y., Bottenheim, J., Hopper, F., and Leaitch, R.: Measurements of C2-C6 hydrocarbons during the Polar Sunrise1992 Experiment: Evidence for Cl atom and Br atom chemistry, J. Geophys. Res.-Atmos., 99, 25355–25368, 1994.
Joranger, E. and Ottar, B.: Air pollution studies in the Norwegian Arctic, Geophys. Res. Lett., 11, 365–368, https://doi.org/10.1029/GL011i005p00365, 1984.
Jung, C. H., Yoon, Y. J., Kang, H. J., Gim, Y., Lee, B. Y., Ström, J., Krejci, R., and Tunved, P.: The seasonal characteristics of cloud condensation nuclei (CCN) in the arctic lower troposphere, Tellus B, 70, 1–13, 2018.
Junge, C. E.: Our knowledge of the physico-chemistry of aerosols in the undisturbed marine environment, J. Geophys. Res., 77, 5183–5200, https://doi.org/10.1029/JC077i027p05183, 1972.
Karlsson, L., Krejci, R., Koike, M., Ebell, K., and Zieger, P.: A long-term study of cloud residuals from low-level Arctic clouds, Atmos. Chem. Phys., 21, 8933–8959, https://doi.org/10.5194/acp-21-8933-2021, 2021.
Kendall, M. G.: Rank Correlation Methods, Griffin, London, 1–202, 1975.
Klánová, J., Čupr, P., Holoubek, I., Borůvková, J., Přibylová, P., Kareš, R., Kohoutek, J., Dvorská, A., and Komprda, J.: Towards the global monitoring of POPs, Contribution of the MONET Networks, Masaryk University, Brno, 23–26, 2009.
Knox, S. H., Jackson, R. B., Poulter, B., McNicol, G., Fluet-Chouinard, E., Zhang, Z., Hugelius, G., Bousquet, P., Canadell, J. G., and Saunois, M.: FLUXNET-CH4 synthesis activity: Objectives, observations, and future directions, B. Am. Meteorol. Soc., 100, 2607–2632, 2019.
Koike, M., Ukita, J., Ström, J., Tunved, P., Shiobara, M., Vitale, V., Lupi, A., Baumgardner, D., Ritter, C., and Hermansen, O.: Year-round in situ measurements of Arctic low-level clouds: Microphysical properties and their relationships with aerosols, J. Geophys. Res.-Atmos., 124, 1798–1822, 2019.
Koo, J. H., Wang, Y., Jiang, T., Deng, Y., Oltmans, S. J., and Solberg, S.: Influence of climate variability on near-surface ozone depletion events in the Arctic spring, Geophys. Res. Lett., 41, 2582–2589, 2014.
Krognes, T., Danalatos, D., Glavas, S., Collin, P., Toupance, G., Hollander, J. T., Schmitt, R., Oyola, P., Romero, R., and Ciccioli, P.: Interlaboratory calibration of peroxyacetyl nitrate liquid standards, Atmos. Environ., 30, 991–996, 1996.
Krognes, T. and Beine, H.: PAN measurements at the Zeppelin Mountain 1994–1996, 1997.
Krogseth, I. S., Kierkegaard, A., McLachlan, M. S., Breivik, K., Hansen, K. M., and Schlabach, M.: Occurrence and seasonality of cyclic volatile methyl siloxanes in Arctic air, Environ. Sci. Tech., 47, 502–509, 2013.
Laing, J. R., Hopke, P. K., Hopke, E. F., Husain, L., Dutkiewicz, V. A., Paatero, J., and Viisanen, Y.: Long-term particle measurements in Finnish Arctic: Part I – Chemical composition and trace metal solubility, Atmos. Environ., 88, 275–284, 2014a.
Laing, J. R., Hopke, P. K., Hopke, E. F., Husain, L., Dutkiewicz, V. A., Paatero, J., and Viisanen, Y.: Long-term particle measurements in Finnish Arctic: Part II – Trend analysis and source location identification, Atmos. Environ., 88, 285–296, 2014b.
Landis, M. S., Stevens, R. K., Schaedlich, F., and Prestbo, E. M.: Development and characterization of an annular denuder methodology for the measurement of divalent inorganic reactive gaseous mercury in ambient air, Environ. Sci. Tech., 36, 3000–3009, 2002.
Larssen, S. and Hanssen, J. E.: Annual variation and origin of aerosol components in the Norwegian Arctic-subarctic region. Paper presented at the WMO Technical conference on regional and global observation of atmospheric pollution relative to climate, Boulder 20–24 August 1979, WMO Special Environmental report No 14, WMO No. 549, Geneva, available at: https://library.wmo.int/doc_num.php?explnum_id=8359 (last access: 7 March 2020), 252–258, 1980.
Law, K. S., Roiger, A., Thomas, J. L., Marelle, L., Raut, J.-C., Dalsøren, S., Fuglestvedt, J., Tuccella, P., Weinzierl, B., and Schlager, H.: Local Arctic air pollution: Sources and impacts, Ambio, 46, 453–463, 2017.
Le Quéré, C., Jackson, R. B., Jones, M. W., Smith, A. J. P., Abernethy, S., Andrew, R. M., De-Gol, A. J., Willis, D. R., Shan, Y., Canadell, J. G., Friedlingstein, P., Creutzig, F., and Peters, G. P.: Temporary reduction in daily global CO2 emissions during the COVID-19 forced confinement, Nat. Clim. Change, 10, 647–653, https://doi.org/10.1038/s41558-020-0797-x, 2020.
Lee, H., Lee, K., Lunder, C. R., Krejci, R., Aas, W., Park, J., Park, K.-T., Lee, B. Y., Yoon, Y. J., and Park, K.: Atmospheric new particle formation characteristics in the Arctic as measured at Mount Zeppelin, Svalbard, from 2016 to 2018, Atmos. Chem. Phys., 20, 13425–13441, https://doi.org/10.5194/acp-20-13425-2020, 2020.
Lindberg, S. E., Brooks, S., Lin, C.-J., Scott, K. J., Landis, M. S., Stevens, R. K., Goodsite, M., and Richter, A.: Dynamic oxidation of gaseous mercury in the Arctic troposphere at polar sunrise, Environ. Sci. Tech., 36, 1245–1256, 2002.
Lu, J. Y., Schroeder, W. H., Barrie, L. A., Steffen, A., Welch, H. E., Martin, K., Lockhart, L., Hunt, R. V., Boila, G., and Richter, A.: Magnification of atmospheric mercury deposition to polar regions in springtime: the link to tropospheric ozone depletion chemistry, Geophys. Res. Lett., 28, 3219–3222, 2001.
Lupi, A., Busetto, M., Becagli, S., Giardi, F., Lanconelli, C., Mazzola, M., Udisti, R., Hansson, H.-C., Henning, T., and Petkov, B.: Multi-seasonal ultrafine aerosol particle number concentration measurements at the Gruvebadet observatory, Ny-Ålesund, Svalbard Islands, Rendiconti Lincei, 27, 59–71, 2016.
Lyman, S. N., Cheng, I., Gratz, L. E., Weiss-Penzias, P., and Zhang, L.: An updated review of atmospheric mercury, Sci. Total Environ., 707, 135575, https://doi.org/10.1016/j.scitotenv.2019.135575, 2020.
Ma, J., Hung, H., Tian, C., and Kallenborn, R.: Revolatilization of persistent organic pollutants in the Arctic induced by climate change, Nat. Clim. Change, 1, 255–260, 2011.
MacMillan, D. B. and Ekblaw, W. E.: Four Years in the White North, available at: https://books.google.ch/books?id=gkUNAQAAIAAJ (last access: 7 March 2020), Harper & Brothers, 1918.
Mann, H. B.: Nonparametric tests against trend, Econometrica, 13, 245–259, https://doi.org/10.2307/1907187, 1945.
Markwardt, C. B.: Non-linear Least-squares Fitting in IDL with MPFIT, 251 pp., 2009.
Mazzola, M., Viola, A. P., Lanconelli, C., and Vitale, V.: Atmospheric observations at the Amundsen-Nobile climate change tower in Ny-Ålesund, Svalbard, Rendiconti Lincei, 27, 7–18, 2016.
McCalley, C. K., Woodcroft, B. J., Hodgkins, S. B., Wehr, R. A., Kim, E.-H., Mondav, R., Crill, P. M., Chanton, J. P., Rich, V. I., and Tyson, G. W.: Methane dynamics regulated by microbial community response to permafrost thaw, Nature, 514, 478–481, 2014.
McDow, S. R. and Huntzicker, J. J.: Vapor adsorption artifact in the sampling of organic aerosol: face velocity effects, Atmos. Environ., 24, 2563–2571, 1990.
Miller, B. R., Weiss, R. F., Salameh, P. K., Tanhua, T., Greally, B. R., Mühle, J., and Simmonds, P. G.: Medusa: A sample preconcentration and GC/MS detector system for in situ measurements of atmospheric trace halocarbons, hydrocarbons, and sulfur compounds, Anal. Chem., 80, 1536–1545, 2008.
Mitchell, D. M., Osprey, S. M., Gray, L. J., Butchart, N., Hardiman, S. C., Charlton-Perez, A. J., and Watson, P.: The effect of climate change on the variability of the Northern Hemisphere stratospheric polar vortex, J. Atmos. Sci., 69, 2608–2618, 2012.
Mitchell, J.: Visual range in the polar regions with particular reference to the Alaskan Arctic, J. Atmos. Terr. Phys., 17, 195–211, 1957.
Montzka, S. A., Reimannander, S., Engel, A., Kruger, K., Sturges, W. T., Blake, D. R., Dorf, M. D., Fraser, P. J., Froidevaux, L., and Jucks, K.: Ozone-Depleting Substances (ODSs) and Related Chemicals, Chapter 1 in Scientific Assessment of Ozone Depletion: 2010, Global Ozone Research and Monitoring Project-Report No. 52, World Meteorological Organization, Geneva, Switzerland, 516 pp., 2011.
Montzka, S. A., Dutton, G. S., Yu, P., Ray, E., Portmann, R. W., Daniel, J. S., Kuijpers, L., Hall, B. D., Mondeel, D., and Siso, C.: An unexpected and persistent increase in global emissions of ozone-depleting CFC-11, Nature, 557, 413–417, 2018.
Myhre, C. L., Svendby, T. M., Hermansen, O., Lunder, C. R., Platt, S. M., Fiebig, M., Fjæraa, A. M., Hansen, G. H., Schmidbauer, N., and Krognes, T. J. N. R.: Monitoring of greenhouse gases and aerosols at Svalbard and Birkenes in 2019, Annual Report, ISBN: 978-82-425-3018-9, 2020.
Myhre, G., Shindell, D., Bréon, F., Collins, W., Fuglestvedt, J., Huang, J., and Zhang, H.: Anthropogenic and natural radiative forcing, Climate change 2013: The physical science basis. Contribution of Working Group I to the Fifth Assessment Report of the Intergovernmental Panel on Climate Change, Cambridge: Cambridge University Press, 659–740, 2013.
Neuber, R.: A multi-disciplinary Arctic research facility: From the Koldewey-Rabot-Corbel-Stations to the AWI-IPEV research base on Spitsbergen, Polarforschung, 73, 117–123, 2006.
Neuber, R., Ström, J., and Hübner, C.: Atmospheric research in Ny-Ålesund–a flagship programme: based on the Svalbard Science Forum workshop 17–18 November 2008 at the Norwegian Institute for Air Research (NILU), Kjeller, 2011.
Nisbet, E., Manning, M., Dlugokencky, E., Fisher, R., Lowry, D., Michel, S., Myhre, C. L., Platt, S. M., Allen, G., and Bousquet, P.: Very strong atmospheric methane growth in the 4 years 2014–2017: Implications for the Paris Agreement, Global Biogeochem. Cy., 33, 318–342, 2019.
Nisbet, E. G.: Some northern sources of atmospheric methane: production, history, and future implications, Can. J. Earth Sci., 26, 1603–1611, https://doi.org/10.1139/e89-136, 1989.
Nordenskiöld, A.: Nordenskiöld on the inland ice of Greenland, Science, 732–738, 1883.
Ockenden, W. A., Sweetman, A. J., Prest, H. F., Steinnes, E., and Jones, K. C.: Toward an understanding of the global atmospheric distribution of persistent organic pollutants: The use of semipermeable membrane devices as time-integrated passive samplers, Environ. Sci. Tech., 32, 2795–2803, 1998.
Oehme, M. and Stray, H.: Quantitative determination of ultra-traces of chlorinated compounds in high-volume air samples from the Arctic using polyurethane foam as collection medium, Fresenius' Zeitschrift für Analytische Chemie, 311, 665–673, 1982.
Oehme, M. and Manø, S.: The long-range transport of organic pollutants to the Arctic, Fresenius' Zeitschrift für analytische Chemie, 319, 141–146, 1984.
Oehme, M. and Ottar, B.: The long-range transport of polyclorinated hydrocarbons to the Arctic, Geophys. Res. Lett., 11, 1133–1136, 1984.
Oehme, M.: Further evidence for long-range air transport of polychlorinated aromates and pesticides: North America and Eurasia to the Arctic, Ambio, 20, 293–297, 1991.
Oehme, M., Haugen, J.-E., and Schlabach, M.: Ambient air levels of persistent organochlorines in spring 1992 at Spitsbergen and the Norwegian mainland: comparison with 1984 results and quality control measures, Sci. Total Environ., 160, 139–152, 1995.
Oehme, M., Haugen, J.-E., and Schlabach, M.: Seasonal changes and relations between levels of organochlorines in Arctic ambient air: first results of an all-year-round monitoring program at Ny-Ålesund, Svalbard, Norway, Environ. Sci. Tech., 30, 2294–2304, 1996.
Orvin, A. K.: Litt om kilder på Svalbard, Norges Svalbard-og Ishavs-undersøkelser, nr 57, Norsk Geografisk Tidsskrift, X, available at: https://brage.npolar.no/npolar-xmlui/bitstream/handle/11250/296240/Meddelelser057.pdf?sequence=1 (last access: 8 March 2020), 1944.
Ottar, B. and Rahn, K. A.: Sources and significance of natural and man-made aerosols in the Arctic. Report of a workshop supported and organized by the U.S. Office of Naval Research and NILU Lillestrøm 27–28 April 1977, NILU TN 9/80, 55 pp., 1980.
Ottar, B.: The transfer of airborne pollutants to the Arctic region, Atmos. Environ., 15, 1439–1445, 1981.
Ottar, B., Gotaas, Y., Hov, Ø., Iversen, T., Joranger, E., Oehme, M., Pacyna, J. M., Semb, A., Thomas, W., and Vitols, V.: Air pollution in the Arctic. Final report of a research programme conducted on behalf of British Petroleum Ltd, NILU Rpt. OR 30/86, available at: https://nilu.brage.unit.no/nilu-xmlui/handle/11250/2717823 (last access: 2 June 2021), 1986.
Ottar, B.: Arctic air pollution: A Norwegian perspective, Atmos. Environ., 23, 2349–2356, https://doi.org/10.1016/0004-6981(89)90248-5, 1989.
Paatero, J., Vira, J., Siitari-Kauppi, M., Hatakka, J., Holmén, K., and Viisanen, Y.: Airborne fission products in the high Arctic after the Fukushima nuclear accident, J. Environ. Radioac., 114, 41–47, 2012.
Pacyna, J. M. and Oehme, M.: Long-range transport of some organic compounds to the Norwegian Arctic, Atmos. Environ., 22, 243–257, 1988.
Park, S., Western, L. M., Saito, T., Redington, A. L., Henne, S., Fang, X., Prinn, R. G., Manning, A. J., Montzka, S. A., and Fraser, P. J.: A decline in emissions of CFC-11 and related chemicals from eastern China, Nature, 590, 433–437, 2021.
Pavlova, O., Gerland, S., and Hop, H.: Changes in sea-ice extent and thickness in Kongsfjorden, Svalbard (2003–2016), in: The ecosystem of Kongsfjorden, Svalbard, Springer, 105–136, 2019.
Peterson, J. T., Komhyr, W. D., Harris, T. B., and Waterman, L. S.: Atmospheric carbon dioxide measurements at Barrow, Alaska, 1973–1979, Tellus, 34, 166–175, 10.3402/tellusa.v34i2.10799, 1982.
Petäjä, T., Duplissy, E.-M., Tabakova, K., Schmale, J., Altstädter, B., Ancellet, G., Arshinov, M., Balin, Y., Baltensperger, U., Bange, J., Beamish, A., Belan, B., Berchet, A., Bossi, R., Cairns, W. R. L., Ebinghaus, R., El Haddad, I., Ferreira-Araujo, B., Franck, A., Huang, L., Hyvärinen, A., Humbert, A., Kalogridis, A.-C., Konstantinov, P., Lampert, A., MacLeod, M., Magand, O., Mahura, A., Marelle, L., Masloboev, V., Moisseev, D., Moschos, V., Neckel, N., Onishi, T., Osterwalder, S., Ovaska, A., Paasonen, P., Panchenko, M., Pankratov, F., Pernov, J. B., Platis, A., Popovicheva, O., Raut, J.-C., Riandet, A., Sachs, T., Salvatori, R., Salzano, R., Schröder, L., Schön, M., Shevchenko, V., Skov, H., Sonke, J. E., Spolaor, A., Stathopoulos, V. K., Strahlendorff, M., Thomas, J. L., Vitale, V., Vratolis, S., Barbante, C., Chabrillat, S., Dommergue, A., Eleftheriadis, K., Heilimo, J., Law, K. S., Massling, A., Noe, S. M., Paris, J.-D., Prévôt, A. S. H., Riipinen, I., Wehner, B., Xie, Z., and Lappalainen, H. K.: Overview: Integrative and Comprehensive Understanding on Polar Environments (iCUPE) – concept and initial results, Atmos. Chem. Phys., 20, 8551–8592, https://doi.org/10.5194/acp-20-8551-2020, 2020.
Pisso, I., Myhre, C. L., Platt, S. M., Eckhardt, S., Hermansen, O., Schmidbauer, N., Mienert, J., Vadakkepuliyambatta, S., Bauguitte, S., Pitt, J., Allen, G., Bower, K. N., O'Shea, S., Gallagher, M. W., Percival, C. J., Pyle, J., Cain, M., and Stohl, A.: Constraints on oceanic methane emissions west of Svalbard from atmospheric in situ measurements and Lagrangian transport modeling, J. Geophys. Res.-Atmos., 121, 14188–14200, https://doi.org/10.1002/2016JD025590, 2016.
Pithan, F. and Mauritsen, T.: Arctic amplification dominated by temperature feedbacks in contemporary climate models, Nat. Geosci., 7, 181–184, https://doi.org/10.1038/ngeo2071, 2014.
Platt, S. M., Eckhardt, S., Ferré, B., Fisher, R. E., Hermansen, O., Jansson, P., Lowry, D., Nisbet, E. G., Pisso, I., Schmidbauer, N., Silyakova, A., Stohl, A., Svendby, T. M., Vadakkepuliyambatta, S., Mienert, J., and Lund Myhre, C.: Methane at Svalbard and over the European Arctic Ocean, Atmos. Chem. Phys., 18, 17207–17224, https://doi.org/10.5194/acp-18-17207-2018, 2018.
Pozo, K., Harner, T., Wania, F., Muir, D. C., Jones, K. C., and Barrie, L. A.: Toward a global network for persistent organic pollutants in air: results from the GAPS study, Environ. Sci. Tech., 40, 4867–4873, 2006.
Prinn, R. G., Weiss, R. F., Krummel, P. B., O'Doherty, S., Fraser, P., Muhle, J., Reimann, S., Vollmer, M., Simmonds, P. G., and Malone, M.: The ALE/GAGE/AGAGE Network (DB1001), Carbon Dioxide Information Analysis Center (CDIAC), Oak Ridge National, https://doi.org/10.3334/CDIAC/atg.db1001, 2008.
Puglini, M., Brovkin, V., Regnier, P., and Arndt, S.: Assessing the potential for non-turbulent methane escape from the East Siberian Arctic Shelf, Biogeosciences, 17, 3247–3275, https://doi.org/10.5194/bg-17-3247-2020, 2020.
Raatz, W. E.: Observations of “Arctic Haze” during the “Ptarmigan” weather reconnaissance flights, 1948–1961, Tellus B, 36, 126–136, https://doi.org/10.3402/tellusb.v36i2.14882, 1984.
Radke, L. F., Hobbs, P. V., and Pinnons, J. E.: Observations of Cloud Condensation Nuclei, Sodium-Containing Particles, Ice Nuclei and the Light-Scattering Coefficient Near Barrow, Alaska, 15, 982–995, https://doi.org/10.1175/1520-0450(1976)015<0982:Ooccns>2.0.Co;2, 1976.
Rahn, K. A.: Arctic Air Chemistry Proceedings of the Second Symposium, Atmos. Environ., 15, 1345–1516, 1981a.
Rahn, K. A.: Relative importances of North America and Eurasia as sources of arctic aerosol, Atmos. Environ., 15, 1447–1455, https://doi.org/10.1016/0004-6981(81)90351-6, 1981b.
Rahn, K. A.: The Mn/V ratio as a tracer of large-scale sources of pollution aerosol for the Arctic, Atmos. Environ., 15, 1457–1464, 1981c.
Rahn, K. A.: Arctic Air Chemistry Proceedings of the Third Symposium, Atmos. Environ., 19, 1987–2207, 1985.
Rahn, K. A.: Arctic Air Chemistry, Atmos. Environ., 23, 2345–2637, 1989a.
Rahn, K. A.: Foreword, Atmos. Environ., 23, 2345, https://doi.org/10.1016/0004-6981(89)90246-1, 1989b.
Rasmussen, R., Khalil, M., and Fox, R.: Altitudinal and temporal variation of hydrocarbons and other gaseous tracers of Arctic haze, Geophys. Res. Lett., 10, 144–147, 1983.
Rigby, M., Park, S., Saito, T., Western, L., Redington, A., Fang, X., Henne, S., Manning, A., Prinn, R., and Dutton, G.: Increase in CFC-11 emissions from eastern China based on atmospheric observations, Nature, 569, 546–550, 2019.
Roemer, M.: Trends of ozone and precursors in Europe Status report TOR-2 Task group 1, TNO-MEP, Netherlands, 43 pp., 2001.
Röhler, L., Schlabach, M., Haglund, P., Breivik, K., Kallenborn, R., and Bohlin-Nizzetto, P.: Non-target and suspect characterisation of organic contaminants in Arctic air – Part 2: Application of a new tool for identification and prioritisation of chemicals of emerging Arctic concern in air, Atmos. Chem. Phys., 20, 9031–9049, https://doi.org/10.5194/acp-20-9031-2020, 2020.
Schneider, S. H. and Dickinson, R. E.: Climate modeling, Rev. Geophys., 12, 447–493, doiL10.1029/RG012i003p00447, 1974.
Schmale, J., Zieger, P., and Ekman, A. M.: Aerosols in current and future Arctic climate, Nat. Clim. Change, 11, 95–105, 2021.
Schnell, R. C.: Arctic haze and the Arctic Gas and Aerosol Sampling Program (AGASP), Geophys. Res. Lett., 11, 361–364, https://doi.org/10.1029/GL011i005p00361, 1984a.
Schnell, R. C.: Arctic haze: Editorial, Geophys. Res. Lett., 11, 359–359, https://doi.org/10.1029/GL011i005p00359, 1984b.
Schroeder, W. H. and Munthe, J.: Atmospheric mercury – an overview, Atmos. Environ., 32, 809–822, 1998.
Schuur, E. A., McGuire, A. D., Schädel, C., Grosse, G., Harden, J., Hayes, D. J., Hugelius, G., Koven, C. D., Kuhry, P., and Lawrence, D. M.: Climate change and the permafrost carbon feedback, Nature, 520, 171–179, 2015.
Selin, N. E.: Global biogeochemical cycling of mercury: a review, Annu. Rev. Environ. Res., 34, 43–63, 2009.
Sen, P. K.: Estimates of the regression coefficient based on Kendall's tau, J. Am. Stat. Assoc., 63, 1379–1389, 1968.
Serreze, M. C., Barrett, A. P., Stroeve, J. C., Kindig, D. N., and Holland, M. M.: The emergence of surface-based Arctic amplification, The Cryosphere, 3, 11–19, https://doi.org/10.5194/tc-3-11-2009, 2009.
Shepson, P., Hastie, D., So, K., Schiff, H., and Wong, P.: Relationships between PAN, PPN and O3 at urban and rural sites in Ontario, Atmos. Environ., 26, 1259–1270, 1992.
Shevchenko, V., Lisitzin, A., Vinogradova, A., and Stein, R.: Heavy metals in aerosols over the seas of the Russian Arctic, Sci. Total Environ., 306, 11–25, 2003.
Silyakova, A., Jansson, P., Serov, P., Ferré, B., Pavlov, A. K., Hattermann, T., Graves, C. A., Platt, S. M., Myhre, C. L., Gründger, F., and Niemann, H.: Physical controls of dynamics of methane venting from a shallow seep area west of Svalbard, Cont. Shelf Res., 194, 104030, https://doi.org/10.1016/j.csr.2019.104030, 2020.
Simmonds, P., Manning, A., Cunnold, D., McCulloch, A., O'Doherty, S., Derwent, R., Krummel, P., Fraser, P., Dunse, B., and Porter, L.: Global trends, seasonal cycles, and European emissions of dichloromethane, trichloroethene, and tetrachloroethene from the AGAGE observations at Mace Head, Ireland, and Cape Grim, Tasmania, J. Geophys. Res.-Atmos., 111, D18304, https://doi.org/10.1029/2006JD007082, 2006.
Singh, H. B. and Salas, L. J.: Measurements of peroxyacetyl nitrate (PAN) and peroxypropionyl nitrate (PPN) at selected urban, rural and remote sites, Atmos. Environ., 23, 231–238, 1989.
Solberg, S., Dye, C., Schmidbauer, N., and Simpson, D.: Evaluation of the VOC measurement programme within EMEP, EMEP/CCC-Report 5/95, available at: https://projects.nilu.no/ccc/reports.html (last access: 27 May 2021), 1995.
Solberg, S., Dye, C., Schmidbauer, N., Herzog, A., and Gehrig, R.: Carbonyls and nonmethane hydrocarbons at rural European sites from the Mediterranean to the Arctic, J. Atmos. Chem., 25, 33–66, 1996a.
Solberg, S., Schmidbauer, N., Semb, A., Stordal, F., and Hov, Ø.: Boundary-layer ozone depletion as seen in the Norwegian Arctic in spring, J. Atmos. Chem., 23, 301–332, 1996b.
Solberg, S., Krognes, T., Stordal, F., Hov, O., Beine, H., Jaffe, D., Clemitshaw, K., and Penkett, S.: Reactive nitrogen compounds at Spitsbergen in the Norwegian Arctic, J. Atmos. Chem., 28, 209–225, 1997.
Sommar, J., Wängberg, I., Berg, T., Gårdfeldt, K., Munthe, J., Richter, A., Urba, A., Wittrock, F., and Schroeder, W. H.: Circumpolar transport and air-surface exchange of atmospheric mercury at Ny-Ålesund (79∘ N), Svalbard, spring 2002, Atmos. Chem. Phys., 7, 151–166, https://doi.org/10.5194/acp-7-151-2007, 2007.
Song, S., Selin, N. E., Soerensen, A. L., Angot, H., Artz, R., Brooks, S., Brunke, E.-G., Conley, G., Dommergue, A., Ebinghaus, R., Holsen, T. M., Jaffe, D. A., Kang, S., Kelley, P., Luke, W. T., Magand, O., Marumoto, K., Pfaffhuber, K. A., Ren, X., Sheu, G.-R., Slemr, F., Warneke, T., Weigelt, A., Weiss-Penzias, P., Wip, D. C., and Zhang, Q.: Top-down constraints on atmospheric mercury emissions and implications for global biogeochemical cycling, Atmos. Chem. Phys., 15, 7103–7125, https://doi.org/10.5194/acp-15-7103-2015, 2015.
Sprovieri, F., Pirrone, N., Bencardino, M., D'Amore, F., Carbone, F., Cinnirella, S., Mannarino, V., Landis, M., Ebinghaus, R., Weigelt, A., Brunke, E.-G., Labuschagne, C., Martin, L., Munthe, J., Wängberg, I., Artaxo, P., Morais, F., Barbosa, H. D. M. J., Brito, J., Cairns, W., Barbante, C., Diéguez, M. D. C., Garcia, P. E., Dommergue, A., Angot, H., Magand, O., Skov, H., Horvat, M., Kotnik, J., Read, K. A., Neves, L. M., Gawlik, B. M., Sena, F., Mashyanov, N., Obolkin, V., Wip, D., Feng, X. B., Zhang, H., Fu, X., Ramachandran, R., Cossa, D., Knoery, J., Marusczak, N., Nerentorp, M., and Norstrom, C.: Atmospheric mercury concentrations observed at ground-based monitoring sites globally distributed in the framework of the GMOS network, Atmos. Chem. Phys., 16, 11915–11935, https://doi.org/10.5194/acp-16-11915-2016, 2016.
Stathopoulos, V., Mazzola, M., Matsoukas, C., and Eleftheriadis, K.: Black Carbon measurements at different altitudes and boundary layer estimated by radiosonde, on a high-Arctic site (Ny-Ålesund, Svalbard), during 2011–2012, EGUGA, 15699, 2018.
Steen, A. O., Berg, T., Dastoor, A. P., Durnford, D. A., Engelsen, O., Hole, L. R., and Pfaffhuber, K. A.: Natural and anthropogenic atmospheric mercury in the European Arctic: a fractionation study, Atmos. Chem. Phys., 11, 6273–6284, https://doi.org/10.5194/acp-11-6273-2011, 2011.
Steen, H., Tørnkvist, K., and Krejci, R.: Strategy document for the Zeppelin Observatory Ny-Ålesund Research Station 2020–2025, available at: https://nyalesundresearch.no/wp-content/uploads/2021/02/Ny-Alesund-Research-Station-Atmosphere-flagship-01.pdf, last access: 20 May 2021.
Steffen, A., Douglas, T., Amyot, M., Ariya, P., Aspmo, K., Berg, T., Bottenheim, J., Brooks, S., Cobbett, F., Dastoor, A., Dommergue, A., Ebinghaus, R., Ferrari, C., Gardfeldt, K., Goodsite, M. E., Lean, D., Poulain, A. J., Scherz, C., Skov, H., Sommar, J., and Temme, C.: A synthesis of atmospheric mercury depletion event chemistry in the atmosphere and snow, Atmos. Chem. Phys., 8, 1445–1482, https://doi.org/10.5194/acp-8-1445-2008, 2008.
Steffen, A., Lehnherr, I., Cole, A., Ariya, P., Dastoor, A., Durnford, D., Kirk, J., and Pilote, M.: Atmospheric mercury in the Canadian Arctic. Part I: A review of recent field measurements, Sci. Total Environ., 509, 3–15, 2015.
Stocker, B. D., Spahni, R., and Joos, F.: DYPTOP: a cost-efficient TOPMODEL implementation to simulate sub-grid spatio-temporal dynamics of global wetlands and peatlands, Geosci. Model Dev., 7, 3089–3110, https://doi.org/10.5194/gmd-7-3089-2014, 2014.
Stohl, A., Forster, C., Frank, A., Seibert, P., and Wotawa, G.: Technical note: The Lagrangian particle dispersion model FLEXPART version 6.2, Atmos. Chem. Phys., 5, 2461–2474, https://doi.org/10.5194/acp-5-2461-2005, 2005.
Stohl, A.: Characteristics of atmospheric transport into the Arctic troposphere, J. Geophys. Res., 111, D11306, https://doi.org/10.1029/2005JD006888, 2006.
Stohl, A., Berg, T., Burkhart, J. F., Fjǽraa, A. M., Forster, C., Herber, A., Hov, Ø., Lunder, C., McMillan, W. W., Oltmans, S., Shiobara, M., Simpson, D., Solberg, S., Stebel, K., Ström, J., Tørseth, K., Treffeisen, R., Virkkunen, K., and Yttri, K. E.: Arctic smoke – record high air pollution levels in the European Arctic due to agricultural fires in Eastern Europe in spring 2006, Atmos. Chem. Phys., 7, 511–534, https://doi.org/10.5194/acp-7-511-2007, 2007.
Stohl, A., Klimont, Z., Eckhardt, S., Kupiainen, K., Shevchenko, V. P., Kopeikin, V. M., and Novigatsky, A. N.: Black carbon in the Arctic: the underestimated role of gas flaring and residential combustion emissions, Atmos. Chem. Phys., 13, 8833–8855, https://doi.org/10.5194/acp-13-8833-2013, 2013.
Takasuga, T., Senthilkumar, K., Matsumura, T., Shiozaki, K., and Sakai, S.-I.: Isotope dilution analysis of polychlorinated biphenyls (PCBs) in transformer oil and global commercial PCB formulations by high resolution gas chromatography–high resolution mass spectrometry, Chemosphere, 62, 469–484, 2006.
Tanabe, S., Kannan, N., Subramanian, A., Watanabe, S., and Tatsukawa, R.: Highly toxic coplanar PCBs: occurrence, source, persistency and toxic implications to wildlife and humans, Environ. Poll., 47, 147–163, 1987.
Temme, C., Blanchard, P., Steffen, A., Banic, C., Beauchamp, S., Poissant, L., Tordon, R., and Wiens, B.: Trend, seasonal and multivariate analysis study of total gaseous mercury data from the Canadian atmospheric mercury measurement network (CAMNet), Atmos. Environ., 41, 5423–5441, 2007.
Thompson, R. L. and Stohl, A.: FLEXINVERT: an atmospheric Bayesian inversion framework for determining surface fluxes of trace species using an optimized grid, Geosci. Model Dev., 7, 2223–2242, https://doi.org/10.5194/gmd-7-2223-2014, 2014.
Thompson, R. L., Sasakawa, M., Machida, T., Aalto, T., Worthy, D., Lavric, J. V., Lund Myhre, C., and Stohl, A.: Methane fluxes in the high northern latitudes for 2005–2013 estimated using a Bayesian atmospheric inversion, Atmos. Chem. Phys., 17, 3553–3572, https://doi.org/10.5194/acp-17-3553-2017, 2017.
Thonat, T., Saunois, M., Pison, I., Berchet, A., Hocking, T., Thornton, B. F., Crill, P. M., and Bousquet, P.: Assessment of the theoretical limit in instrumental detectability of northern high-latitude methane sources using δ13C atmospheric signals, Atmos. Chem. Phys., 19, 12141–12161, https://doi.org/10.5194/acp-19-12141-2019, 2019.
Tobo, Y., Adachi, K., DeMott, P. J., Hill, T. C. J., Hamilton, D. S., Mahowald, N. M., Nagatsuka, N., Ohata, S., Uetake, J., Kondo, Y., and Koike, M.: Glacially sourced dust as a potentially significant source of ice nucleating particles, Nat. Geosci., 12, 253–258, https://doi.org/10.1038/s41561-019-0314-x, 2019.
Tørseth, K., Aas, W., Breivik, K., Fjæraa, A. M., Fiebig, M., Hjellbrekke, A. G., Lund Myhre, C., Solberg, S., and Yttri, K. E.: Introduction to the European Monitoring and Evaluation Programme (EMEP) and observed atmospheric composition change during 1972–2009, Atmos. Chem. Phys., 12, 5447–5481, https://doi.org/10.5194/acp-12-5447-2012, 2012.
Trivett, N. B. A., Worthy, D. E. J., and Brice, K. A.: Surface measurements of carbon dioxide and methane at Alert during an Arctic haze event in April, 1986, J. Atmos. Chem., 9, 383–397, https://doi.org/10.1007/BF00052844, 1989.
Tunved, P., Ström, J., and Krejci, R.: Arctic aerosol life cycle: linking aerosol size distributions observed between 2000 and 2010 with air mass transport and precipitation at Zeppelin station, Ny-Ålesund, Svalbard, Atmos. Chem. Phys., 13, 3643–3660, https://doi.org/10.5194/acp-13-3643-2013, 2013.
Turpin, B. J., Huntzicker, J. J., and Hering, S. V.: Investigation of organic aerosol sampling artifacts in the Los Angeles Basin, Atmos. Environ., 28, 3061–3071, 1994.
Turpin, B. J., and Lim, H.-J.: Species contributions to PM2.5 mass concentrations: Revisiting common assumptions for estimating organic mass, Aerosol Sci. Tech., 35, 602–610, 2001.
Valentine, D. W., Holland, E. A., and Schimel, D. S.: Ecosystem and physiological controls over methane production in northern wetlands, J. Geophys. Res.-Atmos., 99, 1563–1571, 1994.
Vorkamp, K.: An overlooked environmental issue? A review of the inadvertent formation of PCB-11 and other PCB congeners and their occurrence in consumer products and in the environment, Sci. Total Environ., 541, 1463–1476, 2016.
Warner, N. A., Nikiforov, V., Krogseth, I. S., Bjørneby, S. M., Kierkegaard, A., and Bohlin-Nizzetto, P.: Reducing sampling artifacts in active air sampling methodology for remote monitoring and atmospheric fate assessment of cyclic volatile methylsiloxanes, Chemosphere, 255, https://doi.org/10.1016/j.chemosphere.2020.126967, 126967, 2020.
Weigelt, A., Ebinghaus, R., Manning, A., Derwent, R., Simmonds, P., Spain, T., Jennings, S., and Slemr, F.: Analysis and interpretation of 18 years of mercury observations since 1996 at Mace Head, Ireland, Atmos. Environ., 100, 85–93, 2015.
Weinbruch, S., Wiesemann, D., Ebert, M., Schütze, K., Kallenborn, R., and Ström, J.: Chemical composition and sources of aerosol particles at Zeppelin Mountain (Ny Ålesund, Svalbard): An electron microscopy study, Atmos. Environ., 49, 142–150, 2012.
Wespes, C., Emmons, L., Edwards, D. P., Hannigan, J., Hurtmans, D., Saunois, M., Coheur, P.-F., Clerbaux, C., Coffey, M. T., Batchelor, R. L., Lindenmaier, R., Strong, K., Weinheimer, A. J., Nowak, J. B., Ryerson, T. B., Crounse, J. D., and Wennberg, P. O.: Analysis of ozone and nitric acid in spring and summer Arctic pollution using aircraft, ground-based, satellite observations and MOZART-4 model: source attribution and partitioning, Atmos. Chem. Phys., 12, 237–259, https://doi.org/10.5194/acp-12-237-2012, 2012.
Wilkinson, M. D., Dumontier, M., Aalbersberg, I. J., Appleton, G., Axton, M., Baak, A., Blomberg, N., Boiten, J.-W., da Silva Santos, L. B., and Bourne, P. E.: The FAIR Guiding Principles for scientific data management and stewardship, Sci. Data, 3, 1–9, 2016.
Winiwarter, W., Haberl, H., and Simpson, D.: On the boundary between man-made and natural emissions: Problems in defining European ecosystems, J. Geophys. Res.-Atmos., 104, 8153–8159, 1999.
WMO: WMO/GAW Aerosol Measurement procedures guidelines and recommendations, Tech. Rep. 227, Geneva, Switzerland, 2016.
WMO: WMO Statement on the State of the Global Climate in 2019, World Meteorological Organisation (WMO), available at: https://library.wmo.int/doc_num.php?explnum_id=10211, last access: 10 November 2020.
Wong, C. and Pettit, K.: Global-scale secular CO2 trends and seasonal change at Canadian CO2 stations: Ocean weather station P, Sable island and Alert, paper presented at WMO/UNEP/ICSU Scientific Conference on Analysis and Interpretation of Atmospheric CO2 Data, Bern, 1981.
Wong, F., Hung, H., Dryfhout-Clark, H., Aas, W., Bohlin-Nizzetto, P., Breivik, K., Mastromonaco, M. N., Lundén, E. B., Ólafsdóttir, K., and Sigurðsson, Á.: Time trends of persistent organic pollutants (POPs) and Chemicals of Emerging Arctic Concern (CEAC) in Arctic air from 25 years of monitoring, Sci. Total Environ., 775, 145109, https://doi.org/10.1016/j.scitotenv.2021.145109, 2021.
Worden, J. R., Bloom, A. A., Pandey, S., Jiang, Z., Worden, H. M., Walker, T. W., Houweling, S., and Röckmann, T.: Reduced biomass burning emissions reconcile conflicting estimates of the post-2006 atmospheric methane budget, Nat. Commun., 8, 2227, https://doi.org/10.1038/s41467-017-02246-0, 2017.
Yttri, K. E., Aas, W., Bjerke, A., Cape, J. N., Cavalli, F., Ceburnis, D., Dye, C., Emblico, L., Facchini, M. C., Forster, C., Hanssen, J. E., Hansson, H. C., Jennings, S. G., Maenhaut, W., Putaud, J. P., and Tørseth, K.: Elemental and organic carbon in PM10: a one year measurement campaign within the European Monitoring and Evaluation Programme EMEP, Atmos. Chem. Phys., 7, 5711–5725, https://doi.org/10.5194/acp-7-5711-2007, 2007.
Yttri, K. E., Lund Myhre, C., Eckhardt, S., Fiebig, M., Dye, C., Hirdman, D., Ström, J., Klimont, Z., and Stohl, A.: Quantifying black carbon from biomass burning by means of levoglucosan – a one-year time series at the Arctic observatory Zeppelin, Atmos. Chem. Phys., 14, 6427–6442, https://doi.org/10.5194/acp-14-6427-2014, 2014.
Yttri, K. E., Canonaco, F., Eckhardt, S., Evangeliou, N., Fiebig, M., Gundersen, H., Hjellbrekke, A.-G., Lund Myhre, C., Platt, S. M., Prévôt, A. S. H., Simpson, D., Solberg, S., Surratt, J., Tørseth, K., Uggerud, H., Vadset, M., Wan, X., and Aas, W.: Trends, composition, and sources of carbonaceous aerosol at the Birkenes Observatory, northern Europe, 2001–2018, Atmos. Chem. Phys., 21, 7149–7170, https://doi.org/10.5194/acp-21-7149-2021, 2021.
Yver-Kwok, C., Philippon, C., Bergamaschi, P., Biermann, T., Calzolari, F., Chen, H., Conil, S., Cristofanelli, P., Delmotte, M., Hatakka, J., Heliasz, M., Hermansen, O., Komínková, K., Kubistin, D., Kumps, N., Laurent, O., Laurila, T., Lehner, I., Levula, J., Lindauer, M., Lopez, M., Mammarella, I., Manca, G., Marklund, P., Metzger, J.-M., Mölder, M., Platt, S. M., Ramonet, M., Rivier, L., Scheeren, B., Sha, M. K., Smith, P., Steinbacher, M., Vítková, G., and Wyss, S.: Evaluation and optimization of ICOS atmosphere station data as part of the labeling process, Atmos. Meas. Tech., 14, 89–116, https://doi.org/10.5194/amt-14-89-2021, 2021.
Zhao, S., Jones, K. C., Li, J., Sweetman, A. J., Liu, X., Xu, Y., Wang, Y., Lin, T., Mao, S., and Li, K.: Evidence for major contributions of unintentionally produced PCBs in the air of China: Implications for the national source inventory, Environ. Sci. Tech., 54, 2163–2171, 2019.
Zhou, Y., Mao, H., Demerjian, K., Hogrefe, C., and Liu, J.: Regional and hemispheric influences on temporal variability in baseline carbon monoxide and ozone over the Northeast US, Atmos. Environ., 164, 309–324, 2017.
Zieger, P., Fierz-Schmidhauser, R., Gysel, M., Ström, J., Henne, S., Yttri, K. E., Baltensperger, U., and Weingartner, E.: Effects of relative humidity on aerosol light scattering in the Arctic, Atmos. Chem. Phys., 10, 3875–3890, https://doi.org/10.5194/acp-10-3875-2010, 2010.
Zieger, P., Fierz-Schmidhauser, R., Weingartner, E., and Baltensperger, U.: Effects of relative humidity on aerosol light scattering: results from different European sites, Atmos. Chem. Phys., 13, 10609–10631, https://doi.org/10.5194/acp-13-10609-2013, 2013.
- Abstract
- Introduction
- A history of atmospheric composition measurements in the European Arctic
- The Zeppelin Observatory
- Instrumentation and measurements
- Results and discussion
- The future of measurements at the Zeppelin Observatory
- Securing the future standing of the Zeppelin Observatory
- Conclusions
- Data availability
- Author contributions
- Competing interests
- Disclaimer
- Acknowledgements
- Financial support
- Review statement
- References