the Creative Commons Attribution 4.0 License.
the Creative Commons Attribution 4.0 License.
 | 03 Mar 2022
Stable carbon isotopic composition of biomass burning emissions – implications for estimating the contribution of C3 and C4 plants
Ulrike Dusek
Maria Elena Popa
Anupam Shaikat
Chenxi Qiu
Patrik Winiger
Carina van der Veen
Thomas Callum Eames
Natasha Ribeiro
Guido R. van der Werf
Landscape fires are a significant contributor to atmospheric burdens of greenhouse gases and aerosols. Although many studies have looked at biomass burning products and their fate in the atmosphere, estimating and tracing atmospheric pollution from landscape fires based on atmospheric measurements are challenging due to the large variability in fuel composition and burning conditions. Stable carbon isotopes in biomass burning (BB) emissions can be used to trace the contribution of C3 plants (e.g. trees or shrubs) and C4 plants (e.g. savanna grasses) to various combustion products. However, there are still many uncertainties regarding changes in isotopic composition (also known as fractionation) of the emitted carbon compared to the burnt fuel during the pyrolysis and combustion processes. To study BB isotope fractionation, we performed a series of laboratory fire experiments in which we burned pure C3 and C4 plants as well as mixtures of the two. Using isotope ratio mass spectrometry (IRMS), we measured stable carbon isotope signatures in the pre-fire fuels and post-fire residual char, as well as in the CO2, CO, CH4, organic carbon (OC), and elemental carbon (EC) emissions, which together constitute over 98 % of the post-fire carbon. Our laboratory tests indicated substantial isotopic fractionation in combustion products compared to the fuel, which varied between the measured fire products. CO2, EC, and residual char were the most reliable tracers of the fuel 13C signature. CO in particular showed a distinct dependence on burning conditions; flaming emissions were enriched in 13C compared to smouldering combustion emissions. For CH4 and OC, the fractionation was the other way round for C3 emissions (13C-enriched) and C4 emissions (13C-depleted). This indicates that while it is possible to distinguish between fires that were dominated by either C3 or C4 fuels using these tracers, it is more complicated to quantify their relative contribution to a mixed-fuel fire based on the δ13C signature of emissions. Besides laboratory experiments, we sampled gases and carbonaceous aerosols from prescribed fires in the Niassa Special Reserve (NSR) in Mozambique, using an unmanned aerial system (UAS)-mounted sampling set-up. We also provided a range of C3:C4 contributions to the fuel and measured the fuel isotopic signatures. While both OC and EC were useful tracers of the C3-to-C4 fuel ratio in mixed fires in the lab, we found particularly OC to be depleted compared to the calculated fuel signal in the field experiments. This suggests that either our fuel measurements were incomprehensive and underestimated the C3:C4 ratio in the field or other processes caused this depletion. Although additional field measurements are needed, our results indicate that C3-vs.-C4 source ratio estimation is possible with most BB products, albeit with varying uncertainty ranges.
- Article
(5023 KB) - Full-text XML
- BibTeX
- EndNote


Biomass burning (BB) is an important source of carbonaceous trace gas and aerosol emissions, affecting climate change and air quality. The savanna biome accounts for more than half of the global BB-related carbon emissions (van der Werf et al., 2017). During pyrolysis and subsequent combustion, this emitted carbon is transformed into a large variety of chemical compounds (Andreae, 2019; Yokelson et al., 2013). Emission factors (EFs) describe the amount of a compound that is emitted by burning a kilogram of dry biomass (g kg−1). EFs are known to vary with fire intensity, moisture content, and type and structure of the vegetation (Chen et al., 2010; Urbanski, 2014; Yokelson et al., 1997). The modified combustion efficiency (MCE), calculated as (molar emission ratio) (Ward and Radke, 1993), is an indicator of the completeness of the oxidation process and thus inversely correlated with the EFs of reduced species like methane, non-methane hydrocarbons (NMHCs), and organic particulate matter (PM) (Urbanski, 2013).
Measurements of atmospheric concentrations of BB emissions can teach us much about the importance of fire in the global carbon cycle, provided that EFs and atmospheric transport and chemistry are well understood. Bottom-up emission models use EFs, measured in fresh smoke, combined with satellite-derived burned area and fuel loads to estimate global biomass burning emissions (van der Werf et al., 2017). Advances in satellite observations also allow us to directly measure atmospheric greenhouse gas (GHG) and aerosol concentrations over BB regions and use this to estimate BB emissions and processes (e.g. Pechony et al., 2013; van der Velde et al., 2020; Zheng et al., 2018). So far, there are significant disparities between the temporal trends and emission ratios derived from bottom-up models (combined with atmospheric transport models) and the atmospheric concentration measured by satellites and fixed ground stations (Eck et al., 2013; Mao et al., 2014; Pechony et al., 2013). Isotopes may help to reconstruct the fate of BB emissions once airborne and shed light on the origin of these disparities (e.g. are discrepancies due to errors in bottom-up emissions or are they related to atmospheric chemistry?).
Relative abundances of stable isotopes in ecosystem components can be used to reconstruct ecological processes like photosynthesis and microbial decomposition (Zhu et al., 2019). The difference in the heavy-to-light isotope ratio of stable carbon isotopes (13C:12C) in a sample, compared to the standard Vienna Pee Dee Belemnite (VPDB), is referred to as δ13C and is reported in parts per thousand, or per mill (‰). Plant δ13C composition is often linked to species and water use efficiency, as it relates to C3 and C4 photosynthetic pathways. As photosynthesis discriminates against heavy isotopes, plant material is 13C-depleted compared to the isotopic ratio in the atmospheric CO2 (−7.8 ‰). The metabolism of C3 plants exhibits stronger discrimination against heavier CO2 compared to C4 plants, resulting in more depleted δ13C signatures ranging from roughly −30 ‰ to −25 ‰ vs. −16 ‰ to −12 ‰ for C4 (O'Leary, 1988; Smith and Epstein, 1971). While C3 vegetation dominates the number of plant species, C4 vegetation, in particular savanna grass, is highly relevant for biomass burning because of the important role of savannas in global fire emissions. About 60 % of photosynthesis occurring in savannas is attributable to grasses, ranging from 34 % in central African woodland savannas to 84 % in Northern Hemisphere neotropical grassland savannas (Lloyd et al., 2008). In African and Australian savannas, C3 and C4 photosynthetic pathways can roughly be used to differentiate between wood (trees or shrubs, C3) and grass (C4) vegetation classes (Boutton et al., 1999; Cachier et al., 1985; Lloyd et al., 2008; Swap et al., 2004; L. Wang et al., 2010; Wynn et al., 2020).
δ13C signatures of BB products are widely used in several scientific fields. Since the 1980s, stable carbon isotopes measured in air pollution have been used to distinguish emissions from BB and other sources (Aguilera and Whigham, 2018; Andersson et al., 2020; Cachier et al., 1985; Gromov et al., 2017; Kawashima and Haneishi, 2012). Palaeo-ecologists use pyrolysed carbon signatures in soils to trace vegetation changes (Hall et al., 2008; Masi et al., 2013; Wynn et al., 2020). Isotopic signatures in BB emissions trapped in ice cores are used to reconstruct ancient fire regimes (e.g. Sapart et al., 2012). In many of these applications, the isotopic signature of the pyrolysis product is assumed to represent the signature of the precursor vegetation (Gromov et al., 2017). In a fire, however, organic matter undergoes volatilization and oxidation during which isotopic fractionation takes place. Therefore, the stable isotope ratio in pyrolysis products is determined not only by the source fuel but also by fractionation during pyrolysis and subsequent processes like transport and atmospheric oxidation, meaning product signatures may differ from the signature of the burnt fuel.
One cause of fractionation is related to the internal isotopic variability in the compounds that make up the fuel (Benner et al., 1987; Loader et al., 2003; Steinbeiss et al., 2006; Weigt et al., 2015; Wilson and Grinsted, 1977; Zech et al., 2014). Different parts of a single plant (e.g. leaves, stems, and coarse woody debris) may differ isotopically as they are made up of various sub-components with different enzymatic formation pathways. As combustion efficiency may vary for different plant parts (e.g. logs and leaves are known to burn following different EFs; Urbanski, 2014; Yokelson et al., 1997), these isotopic differences perpetuate into the combustion products. BB kinetics are another source of fractionation. EFs are dependent on the phase and conditions of combustion, and reactions may differ in 13C and 12C atoms. MCE and combustion temperatures are higher in quick-drying well-aerated grasses compared to more densely packed tree litter (Hurst et al., 1994; van Leeuwen and van der Werf, 2011). The kinetic isotope effect (KIE) describes the difference in the rate of a chemical reaction when atoms in the reactants are replaced by their heavier or lighter isotopes (Atkins and De Paula, 2006). As vibrational frequencies are lower in heavier atoms, a higher energetic input is required for heavier isotopes to react, and reaction rates tend to be slower. This may cause 13C depletion in products arising from incomplete reactions. The isotopic fractionation of stable carbon from the fuel into different products during fires is affected by all these processes and not entirely understood.
Many studies have reported some level of stable carbon isotope fractionation during biomass burning, often depending on the fire phase and thus the temperature of combustion (Ballentine et al., 1998; Chanton et al., 2000; Kato et al., 1999; Stevens and Engelkemeir, 1988; Yamada et al., 2006). Since EFs are different for flaming combustion (FC) and residual smouldering combustion (RSC) (Andreae, 2019; Christian et al., 2003; Surawski et al., 2015), isotopic fractionation is not the same for all emission products. Previous studies identified isotopic carbon fractionation in elemental carbon (EC) (e.g. Bird and Ascough, 2012; G. Liu et al., 2014), char (e.g. Das et al., 2010; G. Liu et al., 2014), organic aerosol (Ballentine et al., 1998; Collister et al., 1994), non-methane hydrocarbons (NMHCs) (e.g. Chanton et al., 2000; Czapiewski et al., 2002), CO2 (Turekian et al., 1998), CO (Kato et al., 1999), CH4 (e.g. Chanton et al., 2000; Umezawa et al., 2011), and the remaining biomass and pyrogenic soil organic carbon (SOC) (e.g. Santín et al., 2016; Turekian et al., 1998). However, all of the above-mentioned studies focus on a limited part of the BB carbon balance. Following the fact that the various isotopes are neither destroyed nor created during pyrolysis or combustion, the 13C:12C ratio in the combined biomass burning products must equal the 13C:12C ratio of the original fuel. We measured δ13C in CO2, CO, CH4, organic carbon (OC), and EC, which combined make up over 98 % of the emitted carbon. Coupled with δ13C measurements from various fuel components and the post-fire residue (a combination of the unburned vegetation and non-emitted EC), we provide a comprehensive overview of the carbon mass balance during pyrolysis.
This study comprises a series of laboratory experiments and prescribed fires, in which we sampled different carbonaceous BB emission species and measured their respective δ13C signatures. Under controlled laboratory conditions and during prescribed fires in the Niassa Special Reserve (NSR), Mozambique, we tested whether isotopic signatures in emission products resemble the signature of the fuel mixture. We calculated the isotopic fractionation (ε) following Eq. (1) (Jasper et al., 1994):
where ε refers to the fractionation of the product compared to the precursor fuel and δ13C is given in per mill; positive fractionation means the product is enriched in heavy isotopes relative to the fuel. Table 1 lists the experiments and the measured species in the experiment.
Table 1Overview of the measurements included in this study.
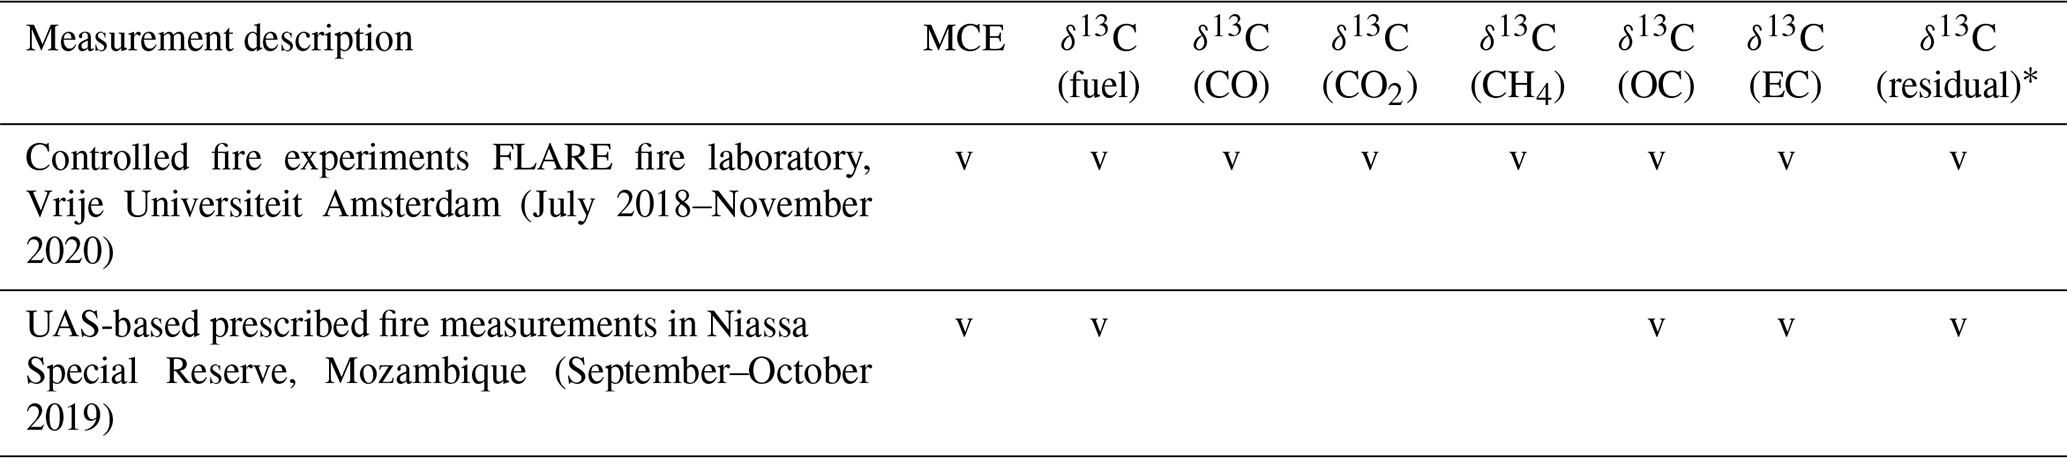
∗ This includes a mixture of unburned fuel and ash sampled after the experiments.
2.1 Laboratory fire experiments
2.1.1 Experimental set-up
Controlled fire experiments were conducted in the Fire Laboratory of Amsterdam for Research in Ecology (FLARE, Vrije Universiteit Amsterdam). The burning set-up consisted of an elevated, perforated metal platform holding the fuel. The fire was enclosed in a reaction room with active ventilation through a chimney located at the highest point of the enclosure. Ambient air can enter from below, and all emissions exit through the active ventilation shaft. The inlets for gas and aerosol sampling were positioned at the centre of the shaft.
Table 2Overview of the different laboratory experiments.
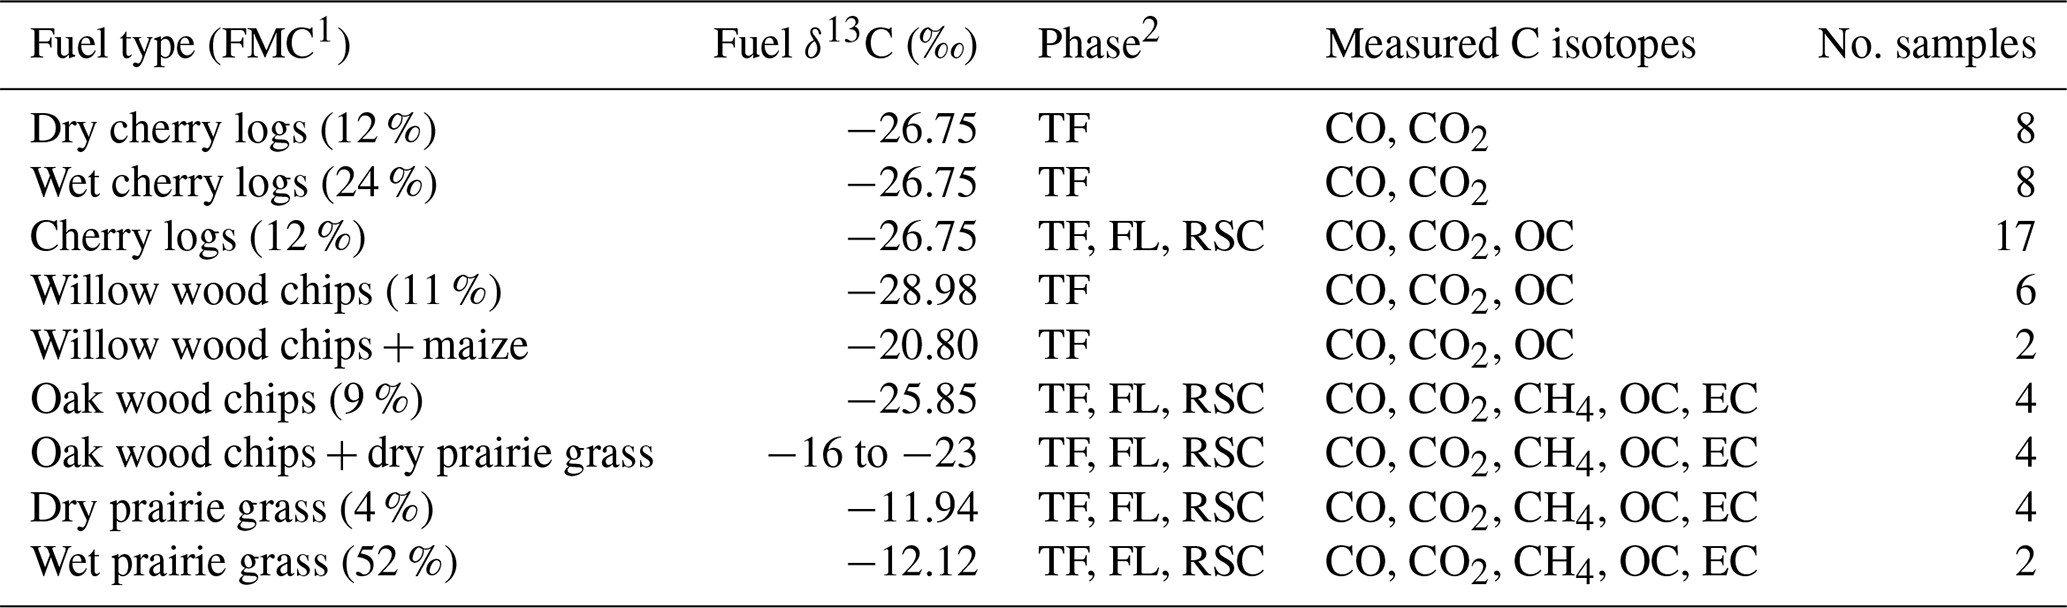
1 FMC: fuel moisture content (percentage of wet weight). 2 TF: total fire; FL: flaming combustion; RSC: residual smouldering combustion.
2.1.2 Fuel compositions
We burned different fuel mixtures, consisting of C3 and C4 vegetation. For C3 vegetation, we used cherry logs (Prunus avium, δ13C of −26.8 ‰), oak shavings (Quercus robur, −25.7 ‰), and willow shavings (Salix alba, −29.0 ‰). For C4 vegetation, we used maize (Zea mays, −12.6 ‰) and prairie grass (Schizachyrium scoparium, −11.9 ‰). Roughly 500 g of fuel was combusted on the platform during each experiment. We used different fuel mixtures, ranging from 100 % C3 to 100 % C4 in 20 % intervals. Oak, willow, maize, and prairie grass had similar carbon contents of 44.5 %, 43.2 %, 42.0 %, and 43.5 %, respectively. Table 2 lists the fuels used in the fire experiments, their fuel moisture content (FMC), the phases sampled, and the measured products.
2.1.3 Laboratory combustion efficiency experiments
To study the effect of fuel conditions, we performed various rounds of experiments varying the moisture content and composition of the fuel (Table 2). To obtain wood with different moisture contents, untreated wood was soaked in water, increasing the weight significantly. Fractions of soaked wood were then dried at 90 ∘C for varying amounts of time and reweighed. For C4 grass, different moisture contents were obtained by drying the freshly cut grass at 60 ∘C for 12 h. We then took subsamples to determine the moisture content, carbon content, and δ13C signature. Where possible, we sampled flaming (FL) and smouldering combustion (RSC) separately, although for aerosols and residuals this was not always possible. In those cases we measured the emissions from the total fire (TF) combined.
2.2 Field campaign
Grassland and woodland savanna fires
Prescribed fires were measured in the Niassa Special Reserve (NSR), a protected area covering 42 000 km2 in the Mozambican states of Niassa and Cabo Delgado. The area is affected by frequent (annual to biannual) fires, with an average fire return interval of 1.8 years, based on the MCD64A1 burned-area dataset (Giglio et al., 2018), averaged over 2010–2019. The dominant vegetation consists of dry Zambezian miombo woodland (Ribeiro et al., 2008), which is interspersed by seasonally flooded grasslands (dambo) in the research area. A more detailed description of the experiments and research location is provided by Russell-Smith et al. (2021). Fires were sampled in September and October of 2019, towards the end of the fire season. We measured the carbon isotopes in the fuel, residue, and emitted particulates as well as the EFs of CO2, CO, and CH4 for 11 fires ranging from pure C4 grasslands to C3-dominated woodlands. Fires were lit between 12:00 and 14:00 LT (local time) in the afternoon and extinguished naturally when humidity increased during the night or the fire reached fire barriers (e.g. roads, early-dry-season fire scars, and riparian corridors).
2.3 Sampling and measurement methodology
2.3.1 Gas sampling and analysis
In the FLARE (laboratory) experiments, a continuous sampling flow was directed from the chimney. Part of this flow was directly measured for CO2, CO, CH4, and N2O mixing ratios using cavity ring-down spectroscopy operating two different instruments: CO2 and CH4 concentrations were measured using a Los Gatos Research microportable gas analyser and CO and N2O concentrations using an Aeris Technologies Pico series analyser. Additionally, we prepared fire-integrated or fire-phase-integrated gas samples for isotopic analysis of CO2, CO, and CH4. For these subsamples, a fraction of the sample flow was diverted to a 10 L Tedlar sample bag, either for a single combustion phase or for the total duration of the fire. Sampling was continued until CO levels dropped back to background conditions. After the experiment was finished, we transferred the sample from the 10 L Tedlar bag through a magnesium perchlorate (Mg(ClO4)2)-filled dryer and a 7 µm particulate filter into 1 L pressure-resistant glass flasks (Normag®, Germany), which were covered with opaque rubber to block UV radiation. We found that CO remains stable for several months under these conditions.
During the field experiments we filled single-polypropylene-fitted Tedlar bags (SKC, type 232-01) with fresh smoke using an unmanned aerial system (UAS)-based (DJI, Matrice 200) sampling system. The UAS sampling methodology was described in detail in Vernooij et al. (2021). In short, we filled 1 L Tedlar bags with fresh smoke at altitudes of roughly 15 m over the fire. For each fire, we filled over 60 bags, covering the different phases of the fire. The samples were protected from UV and analysed for CO2, CO, CH4, and N2O mixing ratios within 12 h using the above-mentioned equipment. Sample bags containing calibration gas were interspersed with smoke samples during the analyses.
Background concentrations measured before the fire were subtracted from the smoke concentration to obtain the excess mixing ratio (EMR) of the respective gases. We then calculated the EFs for CO2, CO, and CH4 following the carbon mass balance approach (Ward and Radke, 1993), using the assumptions described in Vernooij et al. (2021); the carbon emitted as NMHCs and particulates (PM) was estimated based on previous savanna-based EF studies listed by Andreae (2019); the carbon emitted in NMHCs was assumed to be 3.5 times the carbon released as CH4. The total particulate-mass was assumed to be 7 % of the CO emissions, with carbon representing 72 % of the PM. For the field experiments, we split this particulate carbon based on the EC-to-OC ratio measured on the filters.
The δ13C values of CO2, CO, and CH4 were measured at the Institute for Marine and Atmospheric research Utrecht (IMAU) in Utrecht, the Netherlands. CO and CO2 were analysed using a continuous-flow isotope ratio mass spectrometry (CF-IRMS) system, specifically designed for measuring the isotopic compositions in both CO and CO2 from atmospheric samples of a wide range of concentrations. An earlier version of the instrument is discussed in detail in Pathirana et al. (2015). The system is fitted with an inlet selection valve with sample loops of different volumes, which allows measuring samples with up to ∼ 1 % CO and ∼ 16 % CO2. The volume injected for each measurement was adjusted depending on the sample concentration.
For the CO2 isotope measurements, CO2 was collected from the air sample in a cryogenic trap at liquid nitrogen temperature, further purified in a gas chromatographic column, and then directed to the mass spectrometer via an open split interface. The isotope ratios were calibrated using a set of five calibration gases (air in high-pressure cylinders), with the δ13C values of CO2 calibrated at the Max Planck Institute for Biogeochemistry in Jena (Assonov et al., 2020) and reported versus VPDB. For the CO measurements, first the CO2 existing in the air sample is removed by an Ascarite(II) adsorbent; a subsequent liquid nitrogen trap removes the N2O and the remaining CO2 traces. The CO in the sample is then oxidized to CO2 using Schütze reagent. After this step, the analysis proceeds similarly to the one for CO2, with the difference that all the CO2 analysed in this case is derived from CO. The measurement is calibrated using a reference gas (high-pressure air cylinder) with known CO isotopic composition and reported versus VPDB. A “target” gas and additional gases with known composition and running blanks were measured regularly to check the stability of the system in the long term. The typical precision, estimated as 1 standard deviation of the target measurement, was 0.2 ‰ for δ13C, for both CO and CO2.
The isotopic composition of CH4 (δ13C) was measured using the CF-IRMS-based system described in Röckmann et al. (2016). In short, the CH4 from the air sample is selectively collected in a HayeSep D trap cooled to −145 ∘C; the trap is then warmed, and the released CH4 is carried further in a helium (He) flow. For δ13C analysis, the CH4 is directed to a combustion oven containing a Ni catalyst at 1100 ∘C, where it is converted to CO2 and H2O. The derived CO2 contains all the carbon from the CH4 and carries its 13C signature. The CO2 is dried and further purified in a 10 m PoraPLOT Q column (5 ∘C), before entering the IRMS instrument (Thermo DeltaPlus XP) via a GasBench interface. The reported values are linked to the VPDB scale with a repeatability on the order of 0.1 ‰ for δ13C. We used Eq. (2) (Umezawa et al., 2011) to correct for the isotopic composition of the background CO2, CO, CH4, OC, and BC:
2.3.2 Aerosol sampling and analysis
In both the laboratory and the field experiments, aerosol samples were collected on pre-fired (800 ∘C, 48 h) 37 mm quartz-fibre filters (Tissuquartz 2500QAT-UP, Merck). A flow-controlled pump (3 L min−1) was connected to an inertial impactor (Personal Modular Impactor, SKC), providing a particle size cut-off of roughly 2.5 µm before the air reaches the filter. During the laboratory experiments, the filter was placed adjacently to the gas inlet in the centre of the actively ventilated chimney. Filters were replaced before each fire and in some experiments before the flaming and smouldering phases separately. Blank filters were loaded for 5 min in between experiments.
During the field experiments, the flow-controlled filter sampler was mounted on the UAS in conjunction with the gas sampler. To minimize the effect of pressure distortions from the propeller blades on the aerosol composition, both the filter sampler and the gas inlet were attached to the end of a 1 m boom extending out from the propeller airflow. The filter was employed during the full duration of sampling an individual fire (roughly 2–3 h), during which the UAS transitioned from background to smoky conditions several times. After that, we enveloped the filters in pre-treated aluminium foil (500 ∘C, 48 h) and sealed them in airtight polyethylene bags. Samples were transported under cooled (< 10 ∘C) conditions to avoid evaporation of volatiles. During the experiments in Mozambique, blank filters were loaded for 5 min prior to the fire with ambient air at 15 m altitude using the UAS.
We analysed OC and EC on the quartz-fibre filters at the Centre for Isotope Research, Groningen University. OC and EC quantities on the filter samples were determined using a thermal–optical analyser (Sunset Laboratory Inc), according to the EUSAAR-2 protocol. The measurement set-up and measurement protocol for stable carbon isotopes of OC and EC are described in detail by Yao et al. (2022) and Zenker et al. (2020). To stay within the systems' measurement range of 2–24 µg C, small segments of 0.13 to 3.00 cm2 were punched from the filter samples. Samples with a total carbon loading (TC) loading of less than 2 µg C were not considered. For OC, δ13C was analysed for three volatility fractions using a three-step thermal desorption protocol. For 13C analysis of EC, we collected the CO2 evolved after the OC–EC split point of the EUSAAR-2 protocol (Cavalli and Putaud, 2008). The δ13C values were measured with respect to an in-house reference gas (δ13Cref = −3.9 ‰ VPDB). The measurements were calibrated using two-point linear-scale correction based on two in-house caffeine reference materials CAN (−3.9 ‰) and CAF (−38.2 ‰). The international reference material L-valine (−24.03 ‰) (Schimmelmann et al., 2016) was used as quality control. The measurement precision compared to the reference material was 0.18 ‰.
In the literature, there is some ambiguity in the use of the terms elemental carbon, black carbon, ash, char, and soot (Petzold et al., 2013). Therefore, we will clarify our definitions, which we also apply to the analysis of the existing literature, further described in Sect. 4.1 to 4.3. EC in ash and EC in aerosols are treated separately as they are formed following different pathways. Char refers to the (still carbon-rich) fraction that remains after the initial devolatilization. If char is combusted during smouldering combustion, it leaves mineral-rich ash. As we did not separate unburned plant material, char, and ash, it should be noted that the residual fraction comprises all three. The carbon content in this group ranged from 14 % to 66 %, indicating a wide variability in the degree of decarbonization within the residue.
2.3.3 Fuel load sampling and measurements
During the fieldwork campaign in Mozambique, we collected pre- and post-fire vegetation samples. Along randomized 50 m transects in the area selected to burn, we quantified fuels in six different classes: trees, shrubs, grasses, heavy woody debris, coarse woody debris, and litter. The fuel measurements are described in detail by Eames et al. (2021). The fuel load for each fuel class was then calculated following Eq. (3). In addition to determining the fuel load of the respective classes, we collected representative subsamples to measure the moisture, carbon, and nitrogen contents as well as isotopic signatures.
Here FLi is the dry fuel load of class i in t ha−1, is the average biomass collected in the plots in g m−2, Ai is the area over which a single fuel sample is collected in square metres, and MCi is the average moisture content as measured from the subsamples collected from the plot. In a 1 m strip along the transect we counted shrubs in different height classes. The counts were multiplied by shrub weights, and moisture contents were measured in similar miombo woodland vegetation in the late dry season of 2021, in the north of the Kafue National Park in Zambia, and the carbon content and isotopic signature were measured in the original analysis. These weights are obtained by cutting down three specimens from each of the dominant species and, for each height class, drying them in an oven (70 ∘C, > 48 h) and weighing leaves and stems separately. Since the fire disproportionately consumed these classes, stems and leaves were sampled and estimated separately and later combined into one “shrub” pool. For heavy debris and trees we noted the count, diameter, height, and fire consumption within a 10 m distance of the transect. We found that these classes did not significantly contribute to the total fuel load on account of them largely remaining unaffected by the fire.
At the Okavango Research Institute in Maun, Botswana, the subsamples were oven-dried for 48 h at 70 ∘C and ground using a sample mill (Cyclotec 1093, Foss A/S). The samples were then analysed at the Vrije Universiteit Amsterdam where we pulverized the milled samples in a second milling phase using a high-energy vibrational mill (MM 400, Retsch). After drying the sample again for 24 h, 4 mg of powder was analysed for nitrogen and carbon content (FlashEA 1112 series, Thermo Electron Corporation). In a second analysis using 0.4 mg, C and N stable isotopes were analysed using an elemental analyser (FlashEA 1112 NC series, Thermo Electron Corporation) coupled to an isotope ratio mass spectrometry (IRMS) instrument (DeltaPlus XP, Thermo Finnigan). Two standards, USGS40 (−26.39 ‰) and USGS41 (37.63 ‰) (Brand et al., 2014), were measured at the beginning of the run. A third official standard (USGS42, −21.09 ‰) was used as the control standard and was interspersed through the whole measurement run. We then used a linear calibration to calculate the value of all samples and standards at a precision of < 0.3 ‰. The weighted average (WA) δ13C of the combusted vegetation (δ13Cfuel) was calculated using Eqs. (4) and (5):
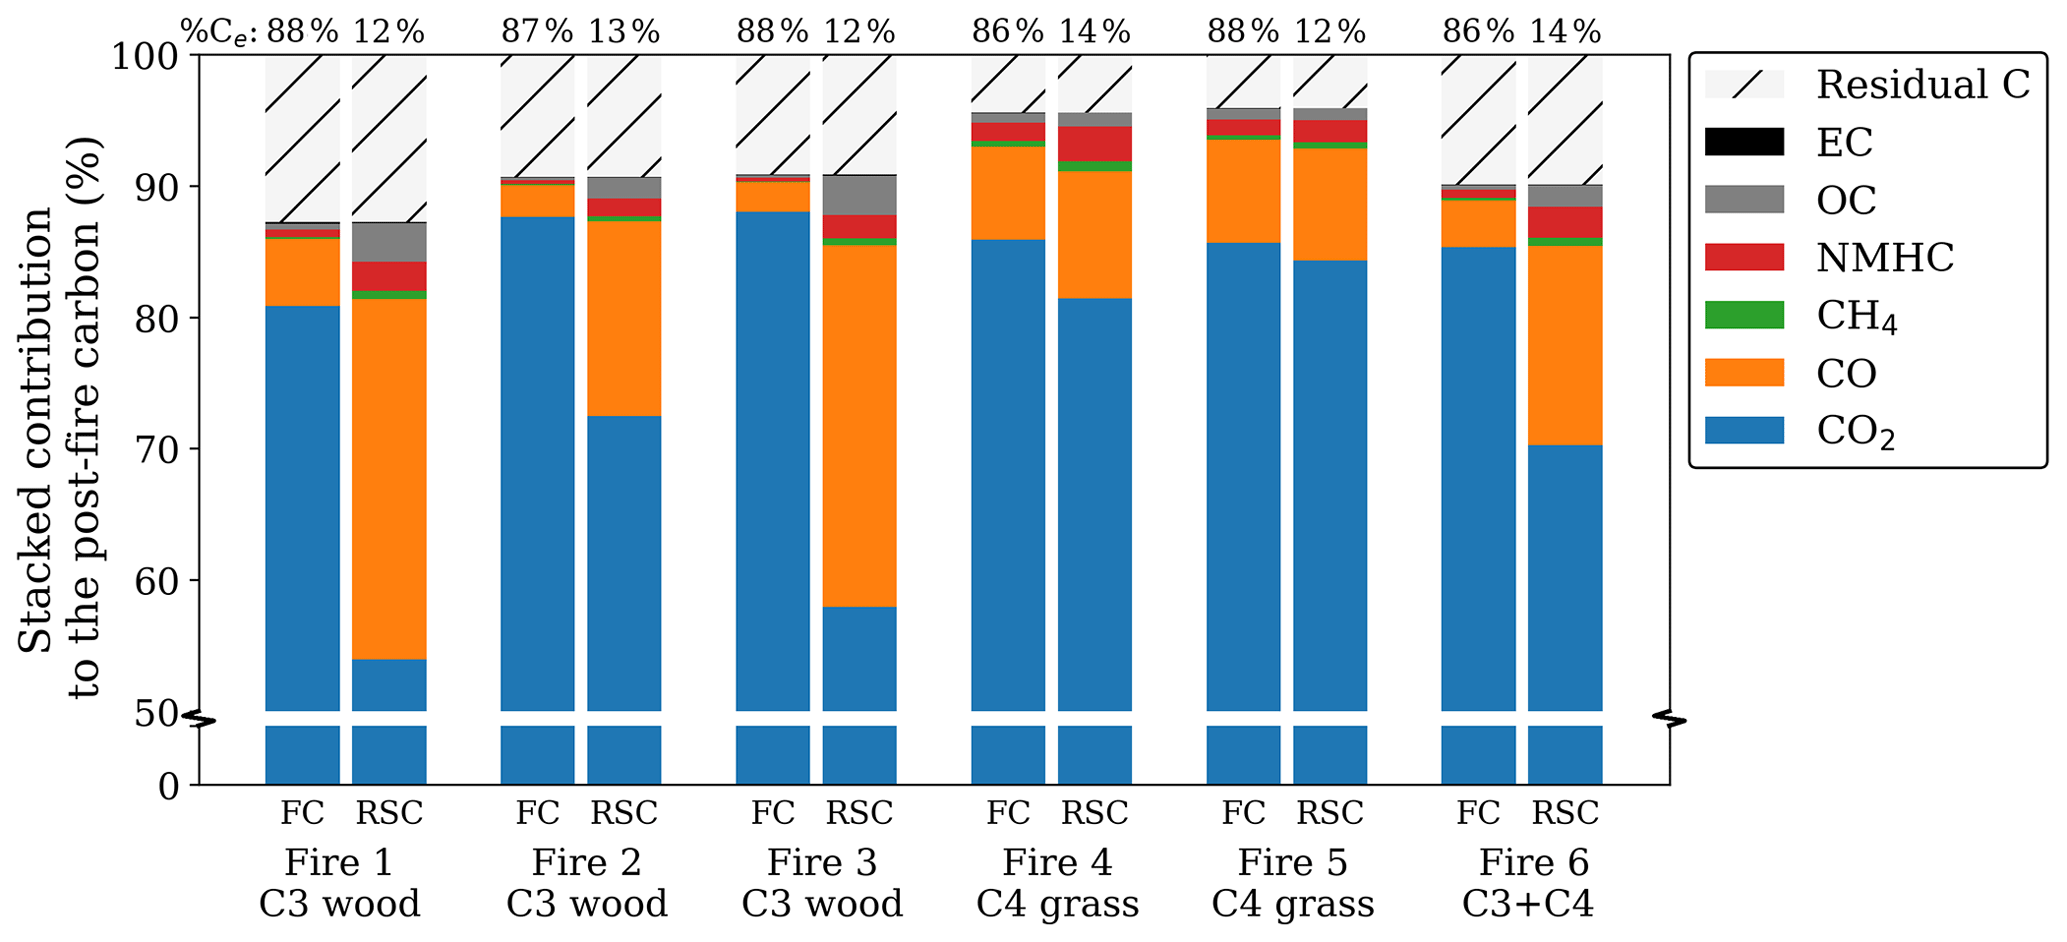
Figure 1Post-fire partitioning of carbon for the flaming (left) and smouldering (right) phase for oak wood chips (C3) and prairie grass (C4). Note that the bottom 50 %, containing only CO2, was cut from the graph to emphasize the smaller fractions. The numbers over the bars represent the percentage of carbon emitted in each phase. As the residue was only measured at the end of the fire, the residual carbon, calculated as the post-fire carbon in the residue over the pre-fire carbon in the fuel, was equally allocated to both phases. Carbon in NMHC was estimated to be 3.5 times the carbon in CH4 based on Andrea (2019).
In Eqs. (4) and (5), Ci is the total carbon emitted from fuel class i, FCi is the carbon content of fuel class i, FLi is the dry fuel load in t ha−1, and is the isotopic signature of the fuel class i. Ctotal is the total carbon consumed from the combined fuel classes. CCi is the combustion completeness, measured as the difference between the pre- and post-fire fuel collections divided by the pre-fire fuel load of fuel class i (ratio). This ratio is calculated over the carbon present in the before and after samples to avoid the carbon mass balance bias from only measuring emissions (Surawski et al., 2016). As it was not possible to distinguish residual carbon in litter and grass separately, these classes were pooled into one post-fire “fine-fuel” class for the combustion completeness calculations.
We describe our results in the following order. First, we quantify how carbon is converted to different BB products in our laboratory experiments. We then interpret the isotopic fractionation in controlled laboratory fires and identify the main uncertainties in our measurements using the BB carbon balance. Finally, we describe the results of the measurements from the experimental field burns in the NSR.
3.1 Laboratory experiments
In a series of laboratory fire experiments with various fuel mixtures and combustion conditions, we tested (1) the relative partitioning of carbon into the reaction products, (2) how well these products retained the δ13C signature of the consumed fuel, (3) whether fractionation was different under different combustion conditions, and (4) whether we can close the isotopic budget of the fire.
3.1.1 EFs of burning products
For several pure-fuel and mixed-fuel fires, we separately assessed the BB products for the FC and RSC phases. Combustion completeness was ∼ 90 % for the wood chip and ∼ 95 % for the grass fires with > 85 % of the carbon being emitted during FC. While reduced species like CO, CH4, and OC were more prevalent in RSC compared to FC, CO2 was still the dominant post-fire carbon stock in RSC (> 50 %). Figure 1 shows the post-fire partitioning of carbon in three laboratory fires using pure C3 wood chips, two fires using C4 grass, and one fire using a 1:1 mixture.
The RSC emissions represented only a small fraction of the total carbon emissions (12 %–14 %); this phase was responsible for only 9 % of total CO2 emissions and 10 % of EC. However, RSC resulted in a substantial proportion of the CO (50 %), CH4 (41 %), and OC (56 %) emissions. For the C4 grass experiments the contribution of RSC was somewhat lower – CO2 (10 %), EC (9 %), CO (34 %), CH4 (27 %), and OC (36 %) – and the phase distinction was less clear from the emission ratios.
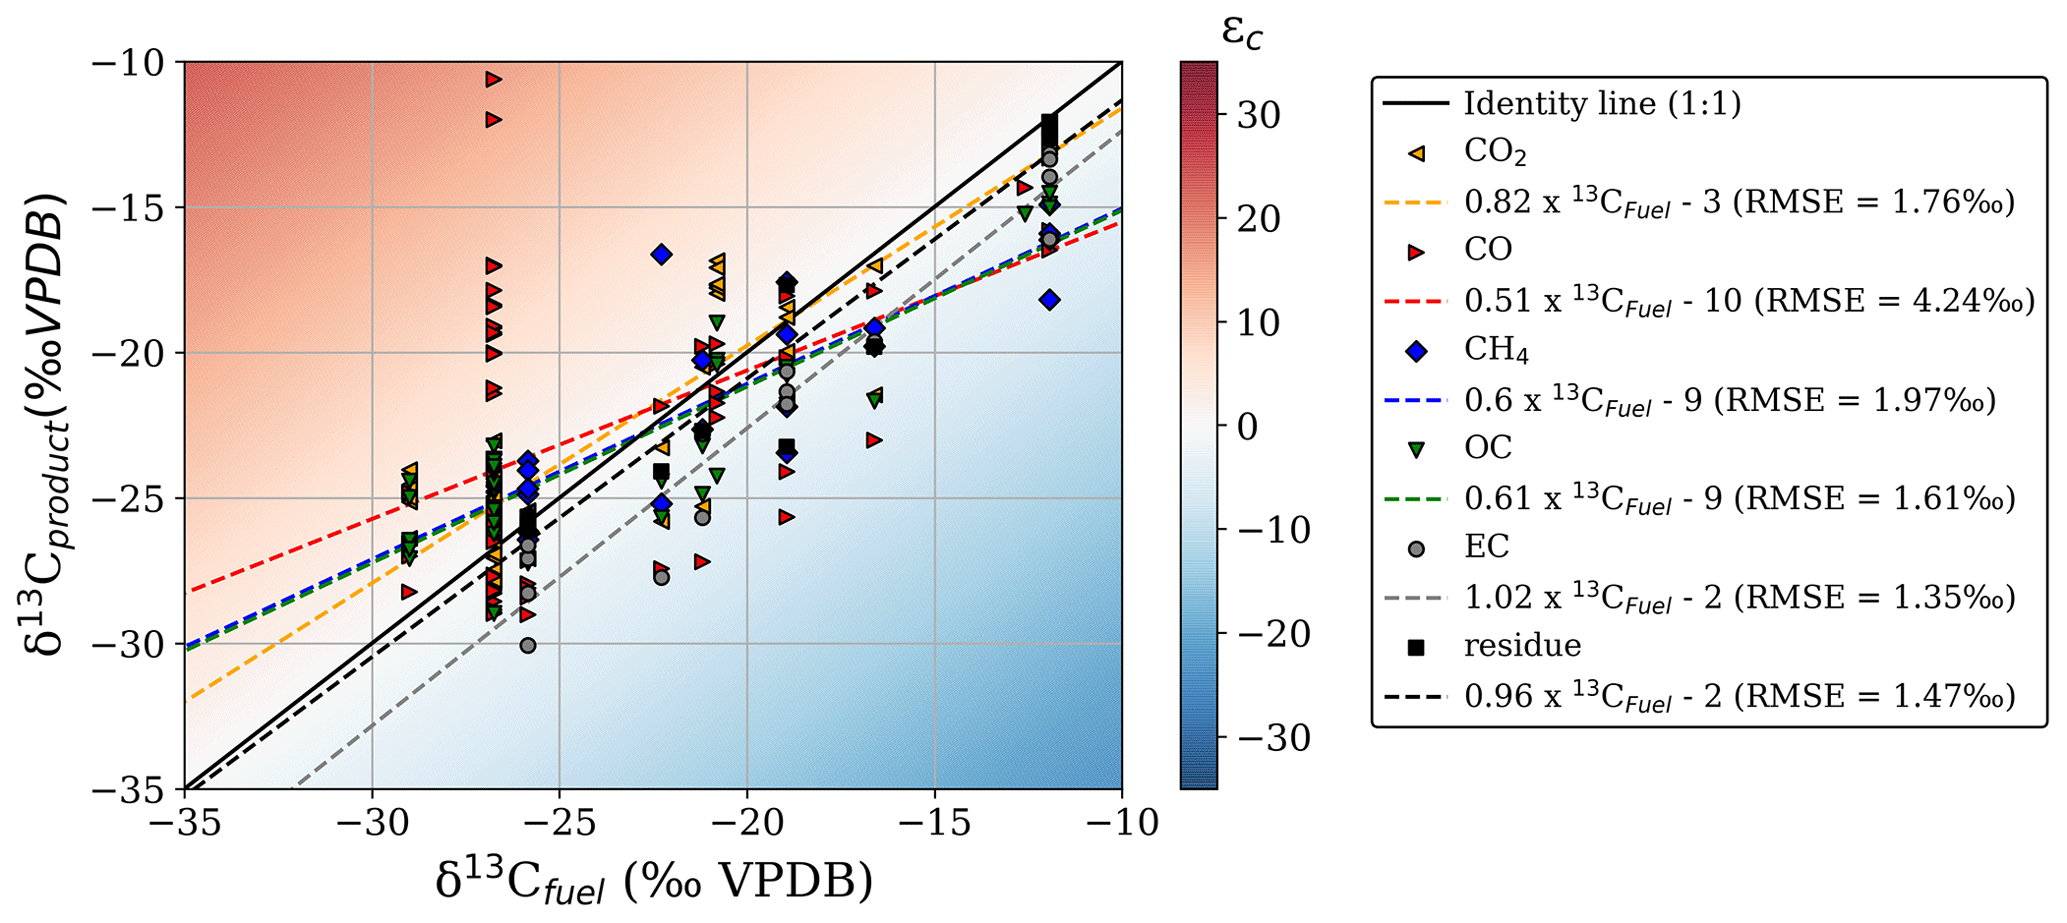
Figure 2δ13C of the combustion products compared to the δ13C of the original fuel. The plot area colour scale represents the absolute fractionation (ε) compared to the precursor fuel. Linear regression formulas of the different curves and RMSE values are given in the legend on the right.
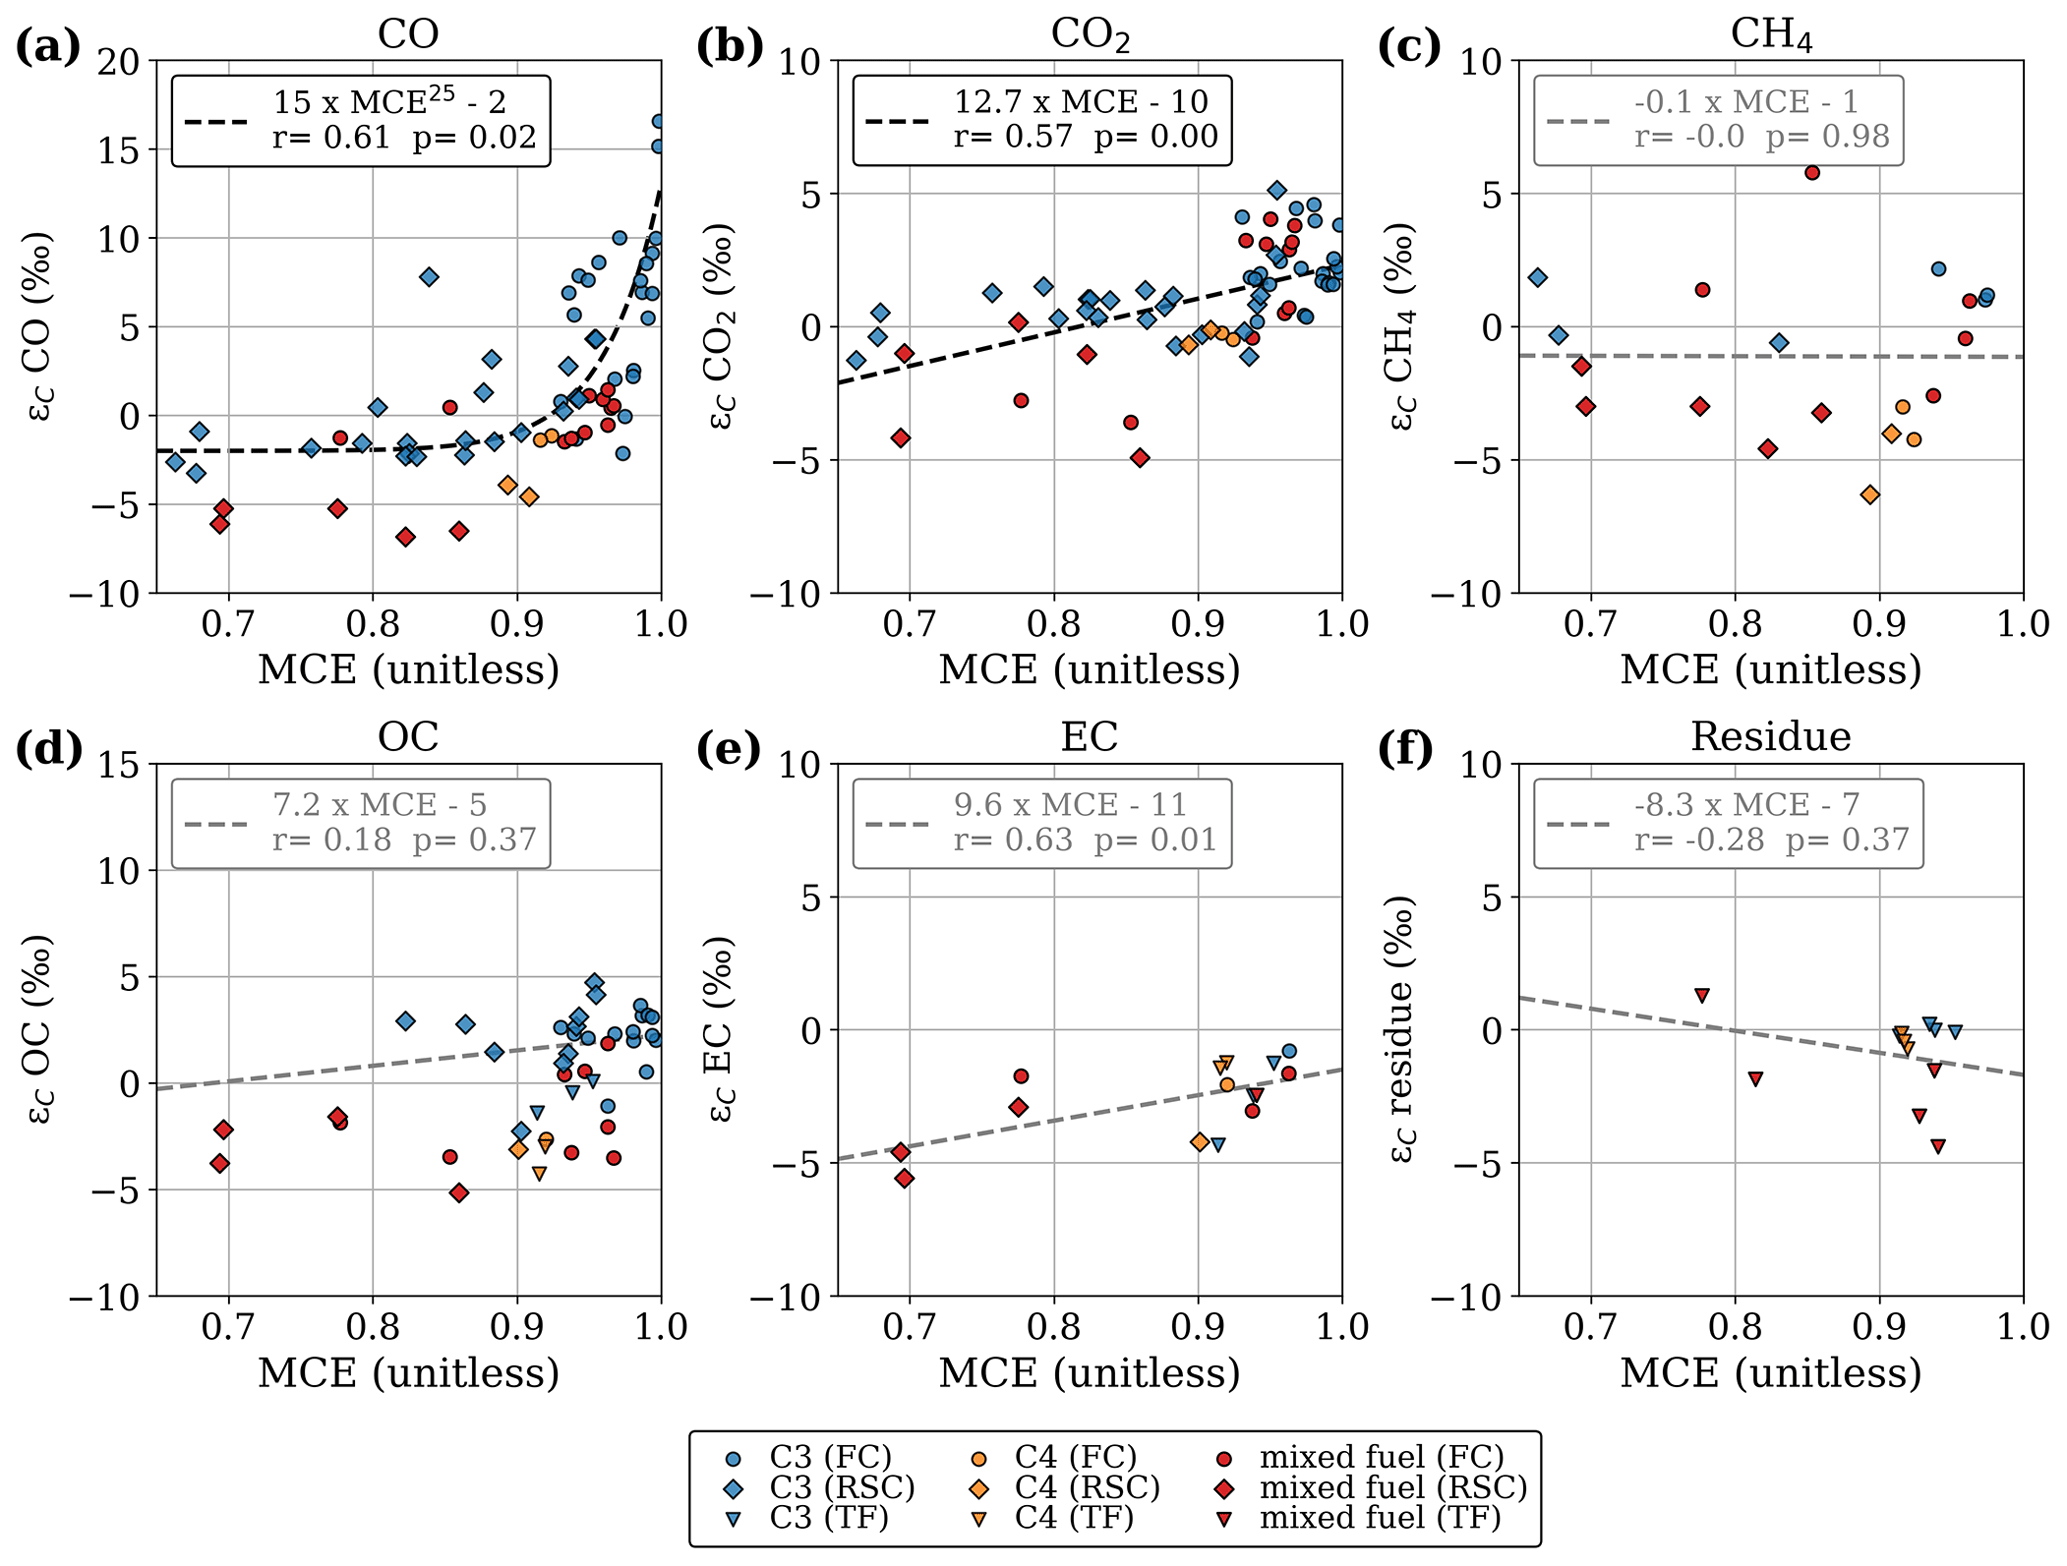
Figure 3Stable carbon isotope fractionation compared to the precursor fuel, plotted against modified combustion efficiency. Results are presented separately for flaming combustion (FC), residual smouldering combustion (RSC), and total fire (TF) samples. Non-significant linear fit lines (p > 0.1) are presented in grey.
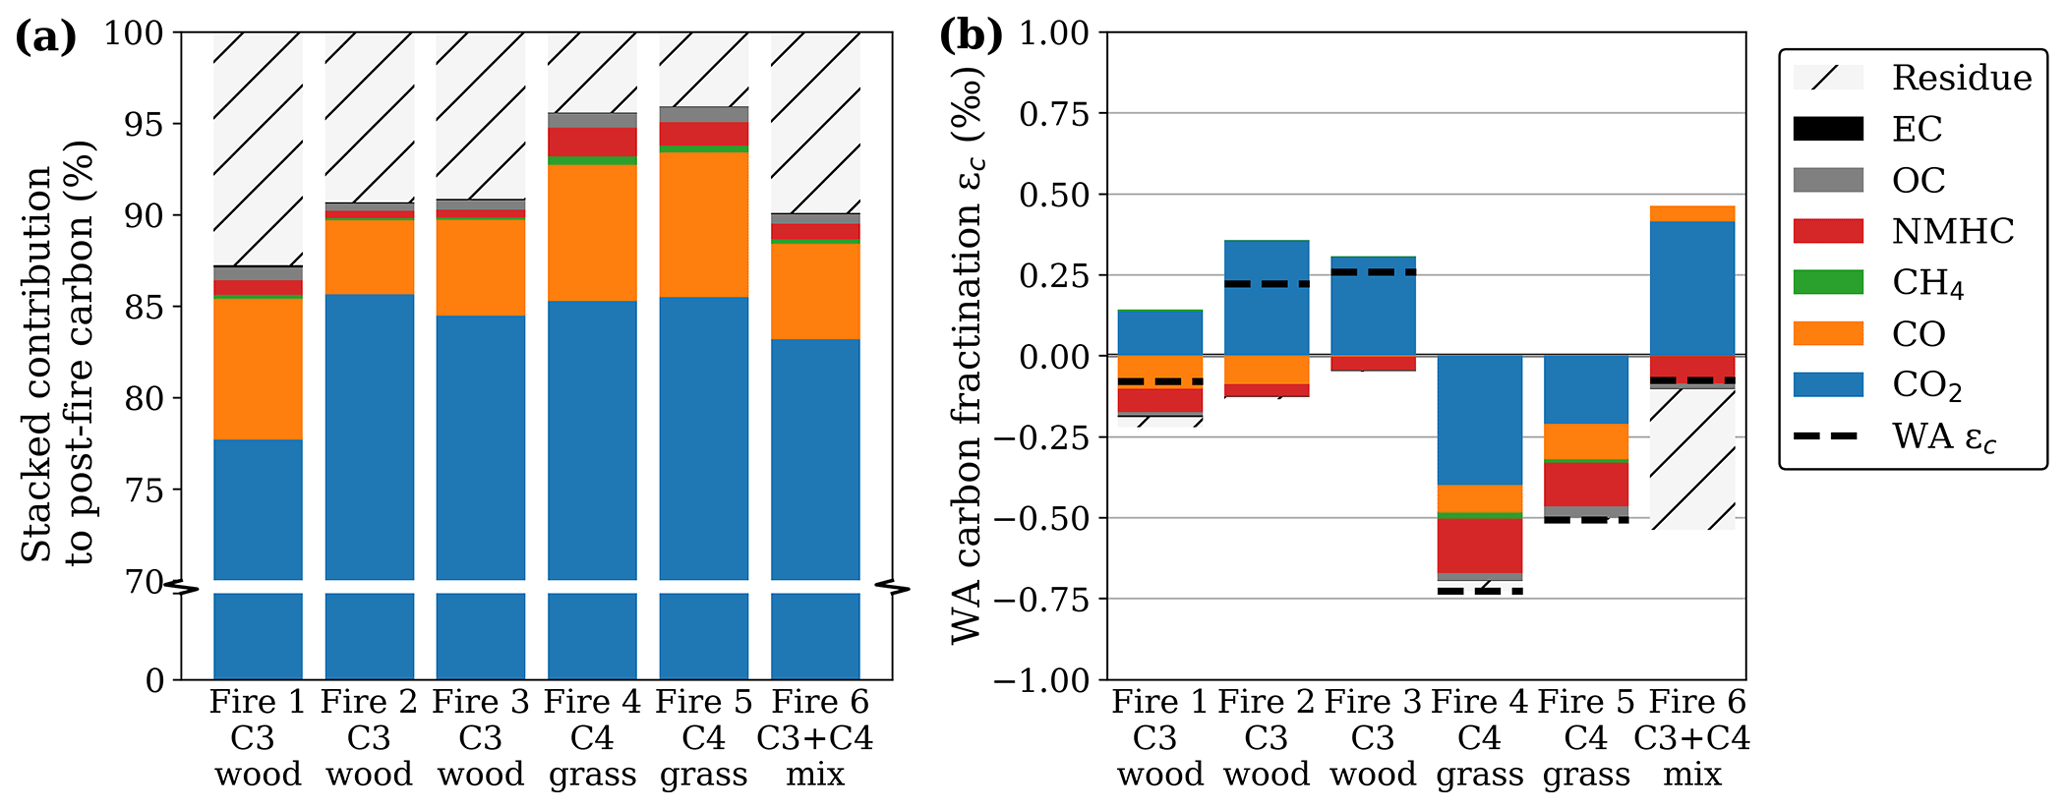
Figure 4Post-fire partitioning of carbon (a) and the resulting fractionation (b) for oak wood chips (C3) and prairie grass (C4) where the weighted average (WA) was calculated as the fire-averaged measured fractionation weighed by the relative contribution (Fig. 3a on a scale of 0–1) of the respective carbonaceous species to the total post-fire carbon budget. Unlike with the other species, we did not measure the fractionation in NMHC directly but rather estimated it based on literature.
3.1.2 δ13C of burning products
We found evidence of fractionation relative to the substrate in most reaction products, albeit with some species better tracers of the source fuel signature than others. Figure 2 gives an overview of the δ13C signatures measured in the fuel and the BB products from all laboratory experiments, including single fuels and mixtures regardless of combustion conditions. The regression slopes of EC, CH4, and residual carbon (including char and ash) against precursor fuel closely matched the 1:1 line (difference < 10 %). In CO, we found a high δ13C variability, mainly due to the large δ13C range (−29.0 to −10.6 ‰ VPDB) for C3 cherry logs. The CO slope was poorly defined, and the mismatch was particularly high (root mean square error (RMSE) > 4 ‰), indicating substantial uncertainty regarding the fractionation of carbon towards CO. These slopes may only be interpreted in terms of how closely each gas represents the fuel composition; there is no weighting by contribution included at this stage.
3.1.3 Fractionation in flaming and smouldering emissions
In accordance with previous studies we found that the isotopic fractionation was positively correlated with MCE for both CO2 and CO. Figure 3 presents the fractionation of the stable carbon isotopes (ε) measured in the laboratory experiments with controlled fuel compositions, as a function of the MCE. Save for OC, the regressions are calculated based on all data points. Experiments in which we separately sampled FC (typically high MCE) and RSC (typically lower MCE), are shown as circles and diamonds, respectively. If only the total fire emission was measured, the value is shown as a triangle.
CO produced during FC was enriched in 13C and became depleted during RSC (Fig. 3a). In CO2 (Fig. 3b) we found a similar pattern but not as pronounced and more linear. This suggests that fuels consumed in flaming combustion consisted of heavier carbon (WA ε over all fuels and species of 0.21 ‰) compared to smouldering fuels (WA ε of −1.18 ‰). In Figs. 2 and 3, it should be noted that for mixed fuels (δ13Cfuel between −25 ‰ and −15 ‰), additional uncertainties arise from the fuel mixture and the dissimilar EFs, combustion rate, and combustion completeness associated with (C4) grass and maize and (C3) wood chips. This may cause the latter to be overrepresented in the reduced species (i.e. CO, CH4, OC) as well as in the residue, whereas C4 grasses would dominate the flaming phase (i.e. CO2).
For OC and CH4, we found opposite directions of fractionation for C3 and C4 vegetation, with the combustion products enriched in 13C for C3 vegetation and depleted for C4 vegetation. As a consequence, the δ13C signatures of CH4 and OC emitted by the combustion of C3 and C4 plants are much closer than the difference in the signatures of the fuel. Our limited 13C measurements on EC in smoke and the residual carbon fraction showed a slight 0 ‰–5 ‰ 13C depletion with no apparent correlation to fuel type or combustion efficiency. Overall, only the regressions for CO2 and CO with MCE were statistically significant (p < 0.05). This is partly related to the larger number of samples; measurements of CH4, EC, and the residual fuel were performed for only a selected number of experiments. In pure-fuel experiments, carbon signatures in the residue were within 1 ‰ of the carbon signatures in the fuel. In mixed-fuel experiments, the residue was typically more depleted compared to the weighted-average fuel signature, indicating that C3 vegetation was overrepresented in the residue (Fig. 3f).
3.1.4 The carbon balance
Although fractionation in the CO2 carbon fraction was small (ε < 1 ‰ on average), CO2 represents the bulk (> 75 %) of the post-fire carbon (Fig. 4a). Therefore, it contributes most to the deviation of the WA post-fire δ13C compared to that of the precursor fuel (Fig. 4b). Note that the y scale in Fig. 4a is interrupted to accentuate the smaller carbonaceous product fractions.
Table 3Weighted-average carbon allocations measured in prescribed burns during the early dry season (EDS) and late dry season (LDS). Pre-fire carbon was allocated to grass, litter, shrubs, and coarse woody debris (CWD) and post-fire carbon to residue (ash, char, and unburned fuels), CO2, CO, CH4, organic carbon (OC), elemental carbon (EC), and non-methane hydrocarbon (NMHC) gases. The latter was estimated from emission ratios in the literature.
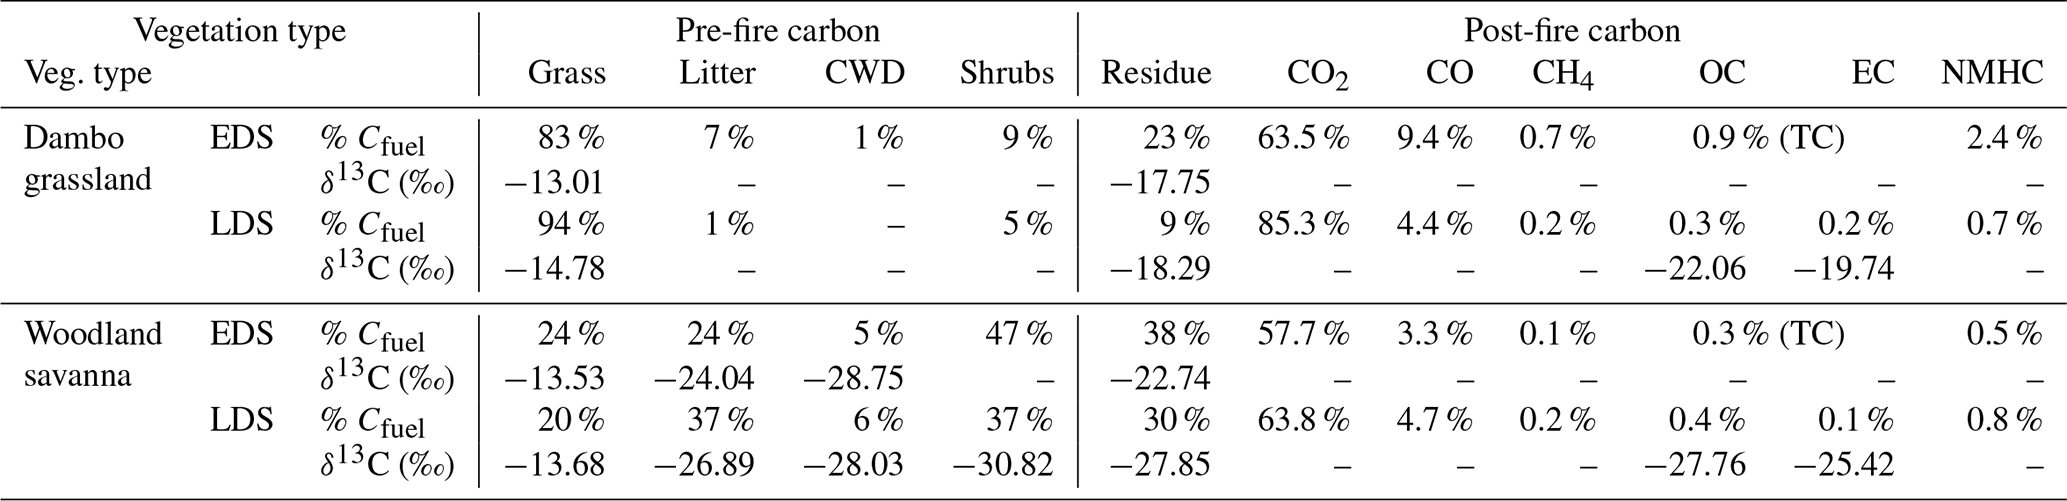
Figure 4b presents the weighted-average (WA) post-fire carbon, calculated as the stacked fractionation of the individual products weighted by the contribution of the respective product to the post-fire carbon budget. As the WA δ13C in the combined products should match the fuel (no isotopes are destroyed or produced), a larger deviation of the WA from 0 indicates a larger uncertainty. Although we did not measure the NMHC isotopic signature directly, previous studies found this fraction to be heavily 13C-depleted. The red bar in Fig. 4b represents the estimated weighted carbon fractionation in NMHC using −9.4 ‰ and −10.6 ‰ for C3 and C4, respectively, based on the average fractionation found by previous studies (Czapiewski et al., 2002; O'Malley et al., 1997; Rudolph et al., 1997; Yamada et al., 2009). The WA fractionation was on average slightly 13C-enriched in C3 and slightly depleted in C4, although over all the carbonaceous products combined, measured signatures deviated less than 0.75 ‰ from the original fuel (Fig. 4b). In mixed fire 6, the 13C enrichment found in the products was compensated for by 13C depletion in the residue (i.e. more C4 was combusted). For C4 fires however, both the products and the residual fraction were depleted in 13C compared to the fuel, indicating that our measurements either underestimated the 13C in the products or overestimated the 13C in the fuel.
3.2 Stable carbon characterization in prescribed burning experiments in the NSR
Applying these measurements to savanna fires imposes several layers of additional complexity related to diverse fuel compositions, weather conditions, background interference, atmospheric chemistry and transport, and sampling challenges. Table 3 lists the carbon balance for the different vegetation types measured in the field campaigns in Mozambique (NSR).
3.2.1 Fuel characterization
In Table 3, the pre-fire carbon was allocated to the fuel classes based on their respective pre-fire fuel load, combustion completeness, and carbon content. On the dambo grassland savanna plots, fires burned almost exclusively in grassy fuels, whereas in the woodland savanna plots in the NSR, the fuel ranged from being grass- to litter-dominated. Average moisture contents (as a percentage of wet weight) decreased from 23 % to 14 % for grass and from 14 % to 6 % for litter between the early dry season (EDS) and late dry season (LDS) while the moisture content of coarse woody debris (CWD) remained roughly the same (7 %). While the CWD contribution to the burned carbon in woodland savanna was only marginal in the EDS, significantly more CWD burned in the LDS. δ13C for grasses was in line with C4 vegetation, and δ13C signatures in litter, CWD, and shrubs were in line with C3 vegetation. While shrubs contributed significantly to the carbon in the fuel load of the woodland vegetation, the estimated percentage of shrub biomass that was consumed in the fires was limited. For different size classes, the estimated percentage of shrub biomass consumed in the EDS was ± 20 % for shrubs of 0–50 cm and ± 15 % for shrubs of 50–100 cm, with larger shrubs being unaffected. In the LDS, the portion of shrubs burned was higher at ± 30 % for shrubs of 0–50 cm, ± 15 % for shrubs of 50–100 cm, ± 8 % for shrubs of 100–200 cm, and only 2 % for shrubs > 200 cm.
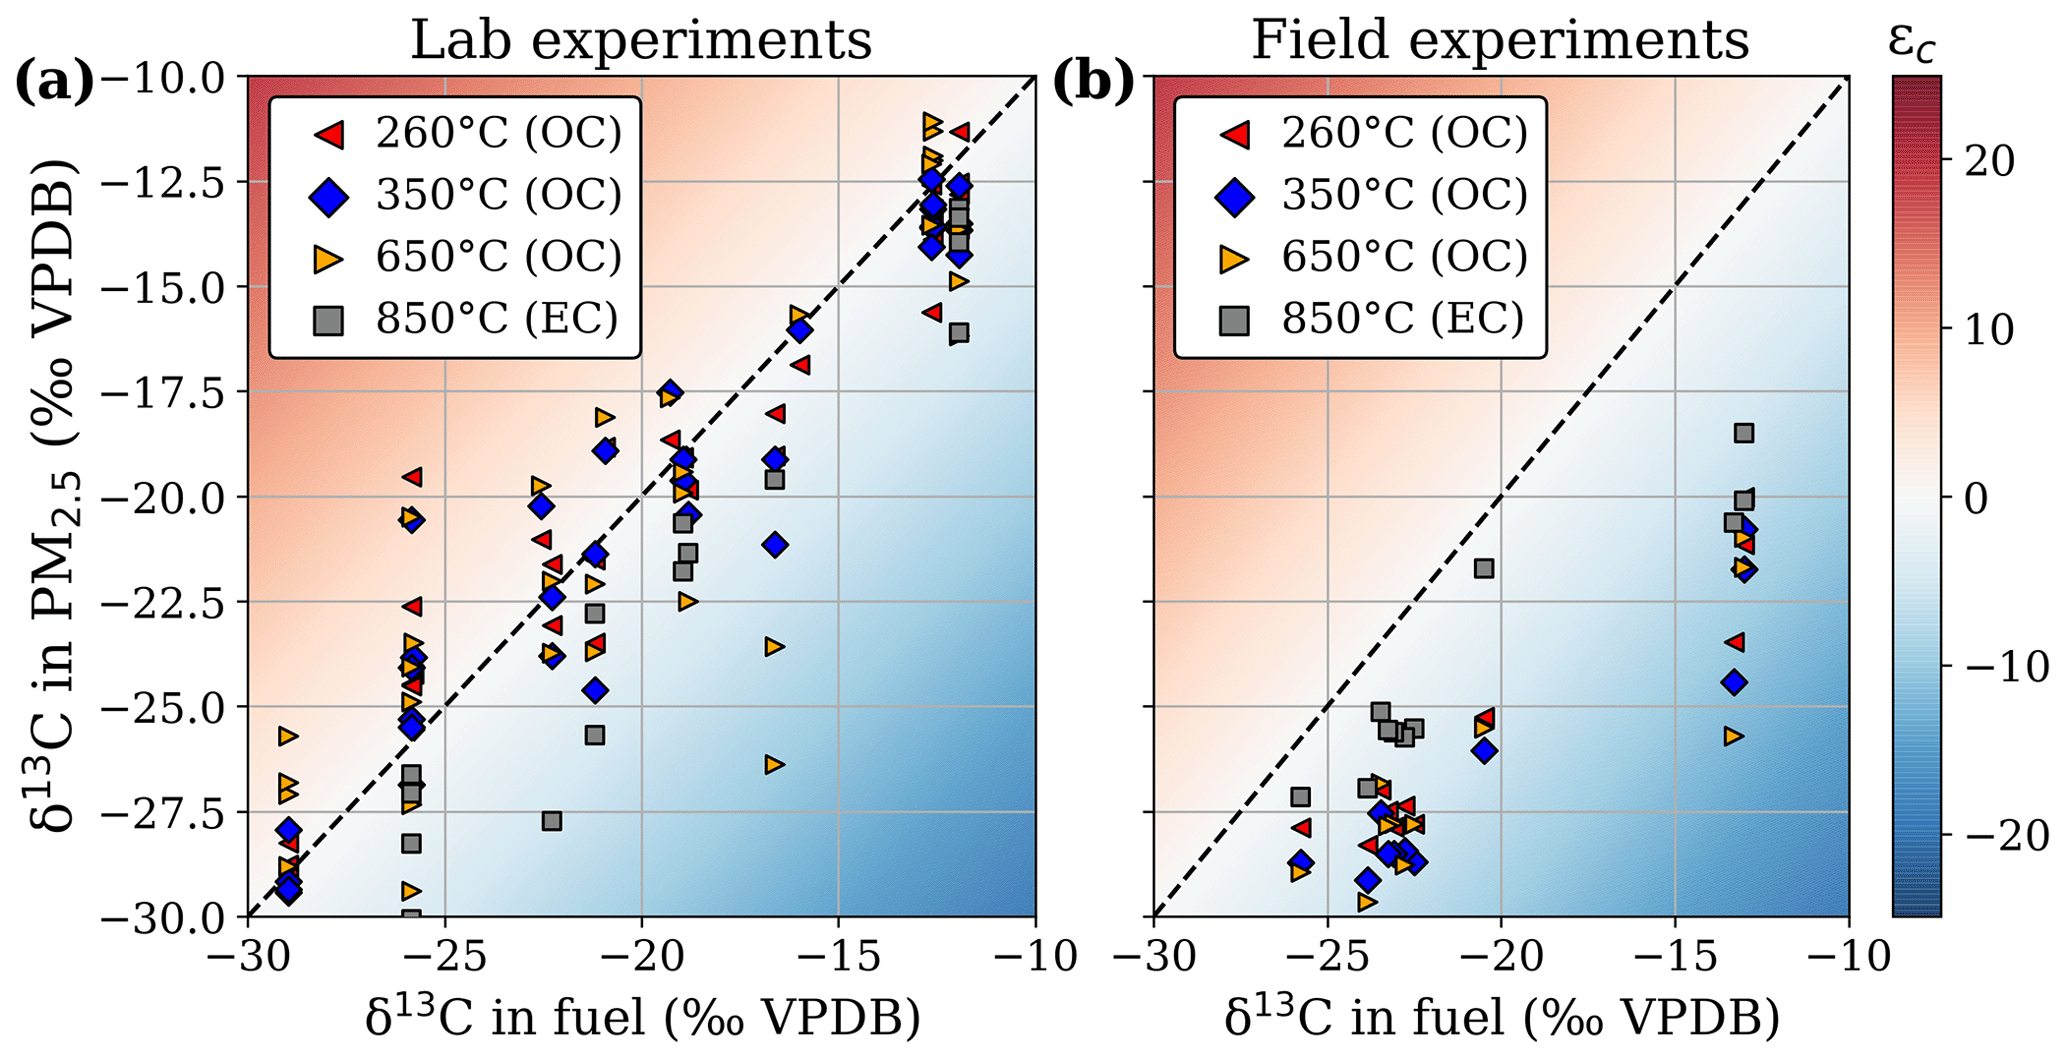
Figure 5The δ13C measured in the different volatility fractions of the captured PM2.5 versus δ13C in the fuel for lab experiments (a) and samples from landscape fires in Mozambique (b). The temperature classes refer to the evaporation temperature steps in the oven of the organic carbon (OC)–elemental carbon (EC) analyser.
3.2.2 Combustion products
EC fractionation behaved roughly similarly in laboratory and field experiments, whereas OC fractionation was quite different. Figure 5 presents the δ13C signatures separately for the different OC volatility fractions and EC. For the laboratory experiments (Fig. 5a), the δ13C signatures measured in the overall PM2.5 scaled well with the isotopic composition of the fuel, considering that not all fuel necessarily burns completely and that EFs may vary significantly for the individual fuels of a mixture. For woodlands, EC depletion compared to the fuel was similar in the laboratory and field experiments, whereas EC from grasslands was much more depleted (mean ε of −6.8 ± 1.1 ‰) compared to laboratory grass fires (mean ε of −2.4 ± 1.9 ‰). All OC volatility fractions for the field experiments (mean ε of −6.6 ± 2.1 ‰) were more depleted relative to the fuel than the laboratory measurements (mean ε of −0.2 ± 2.2 ‰).
Residual carbon signatures in the woodland experiments were close to C3 signatures, suggesting that the residue was C3-dominated. However, we also found the residual fuel samples to be strongly depleted (by 4.5 ‰ to 5.5 ‰) compared to the original C4 fuel in grassland experiments. We are confident that these grasslands consisted almost exclusively of C4 grass, which suggests an effect other than fuel mixture.
We will first relate our findings to the existing literature for the individual carbonaceous emissions. We will then try to provide a comprehensive overview of stable carbon fractionation during biomass burning based on our data and the previous literature combined. Finally, we will discuss the implications of our findings for the use of BB emissions as tracers of the combusted fuel mixture.
The partitioning of emitted carbon into various species (BB products) in both the laboratory (Fig. 4) and the field (Table 2) experiments was in agreement with literature averages for savanna fires: 95 % CO2, 4 % CO, 0.5 % NMHC, 0.3 % PM2.5, and 0.2 % CH4 (Andreae, 2019), with emission ratios being dependent on vegetation type and fire phase (Andreae, 2019; Hoffa et al., 1999). Previous studies have estimated residual EC (char and ash) to make up > 90 % of the total EC (Jones et al., 2019) and 4 % of the total burnt carbon (Surawski et al., 2016). Our residual fraction was substantially higher: 5 %–13 % in the lab experiments and up to 30 % in the field experiments, indicating that non-altered fuel likely dominated the residual fractions in C3 and mixed-fuel experiments.
4.1 Carbon fractionation in different reaction products
Fractionation exceeded the measurement uncertainties in most BB products, with in some cases significant differences between phases and vegetation types. Figure 6 shows the stable carbon fractionation distribution of the measurements in this study compared to previous biomass burning studies. In Figs. 6–8, values more than 1.5 times the interquartile range (IQR) above the upper or below the lower quartile are presented as outliers (diamonds). Whiskers represent the outermost values within 1.5 times the IQR of the respective quartiles. The literature data in these figures include CO (Kato et al., 1999), CO2 (Turekian et al., 1998; Umezawa et al., 2011), CH4 (Chanton et al., 2000; Snover et al., 2000; Stevens and Engelkemeir, 1988; Umezawa et al., 2011; Yamada et al., 2006), OC (Ballentine et al., 1998; Cachier et al., 1985; Czimczik et al., 2002; Garbaras et al., 2015; Turekian et al., 1998), EC (Das et al., 2010; G. Liu et al., 2014), and char (Ascough et al., 2008; Bird and Gröcke, 1997; Czimczik et al., 2002; Das et al., 2010; Jones and Chaloner, 1991; Leavitt et al., 1982; G. Liu et al., 2014; Poole et al., 2002; Purakayastha et al., 2016; Turekian et al., 1998).
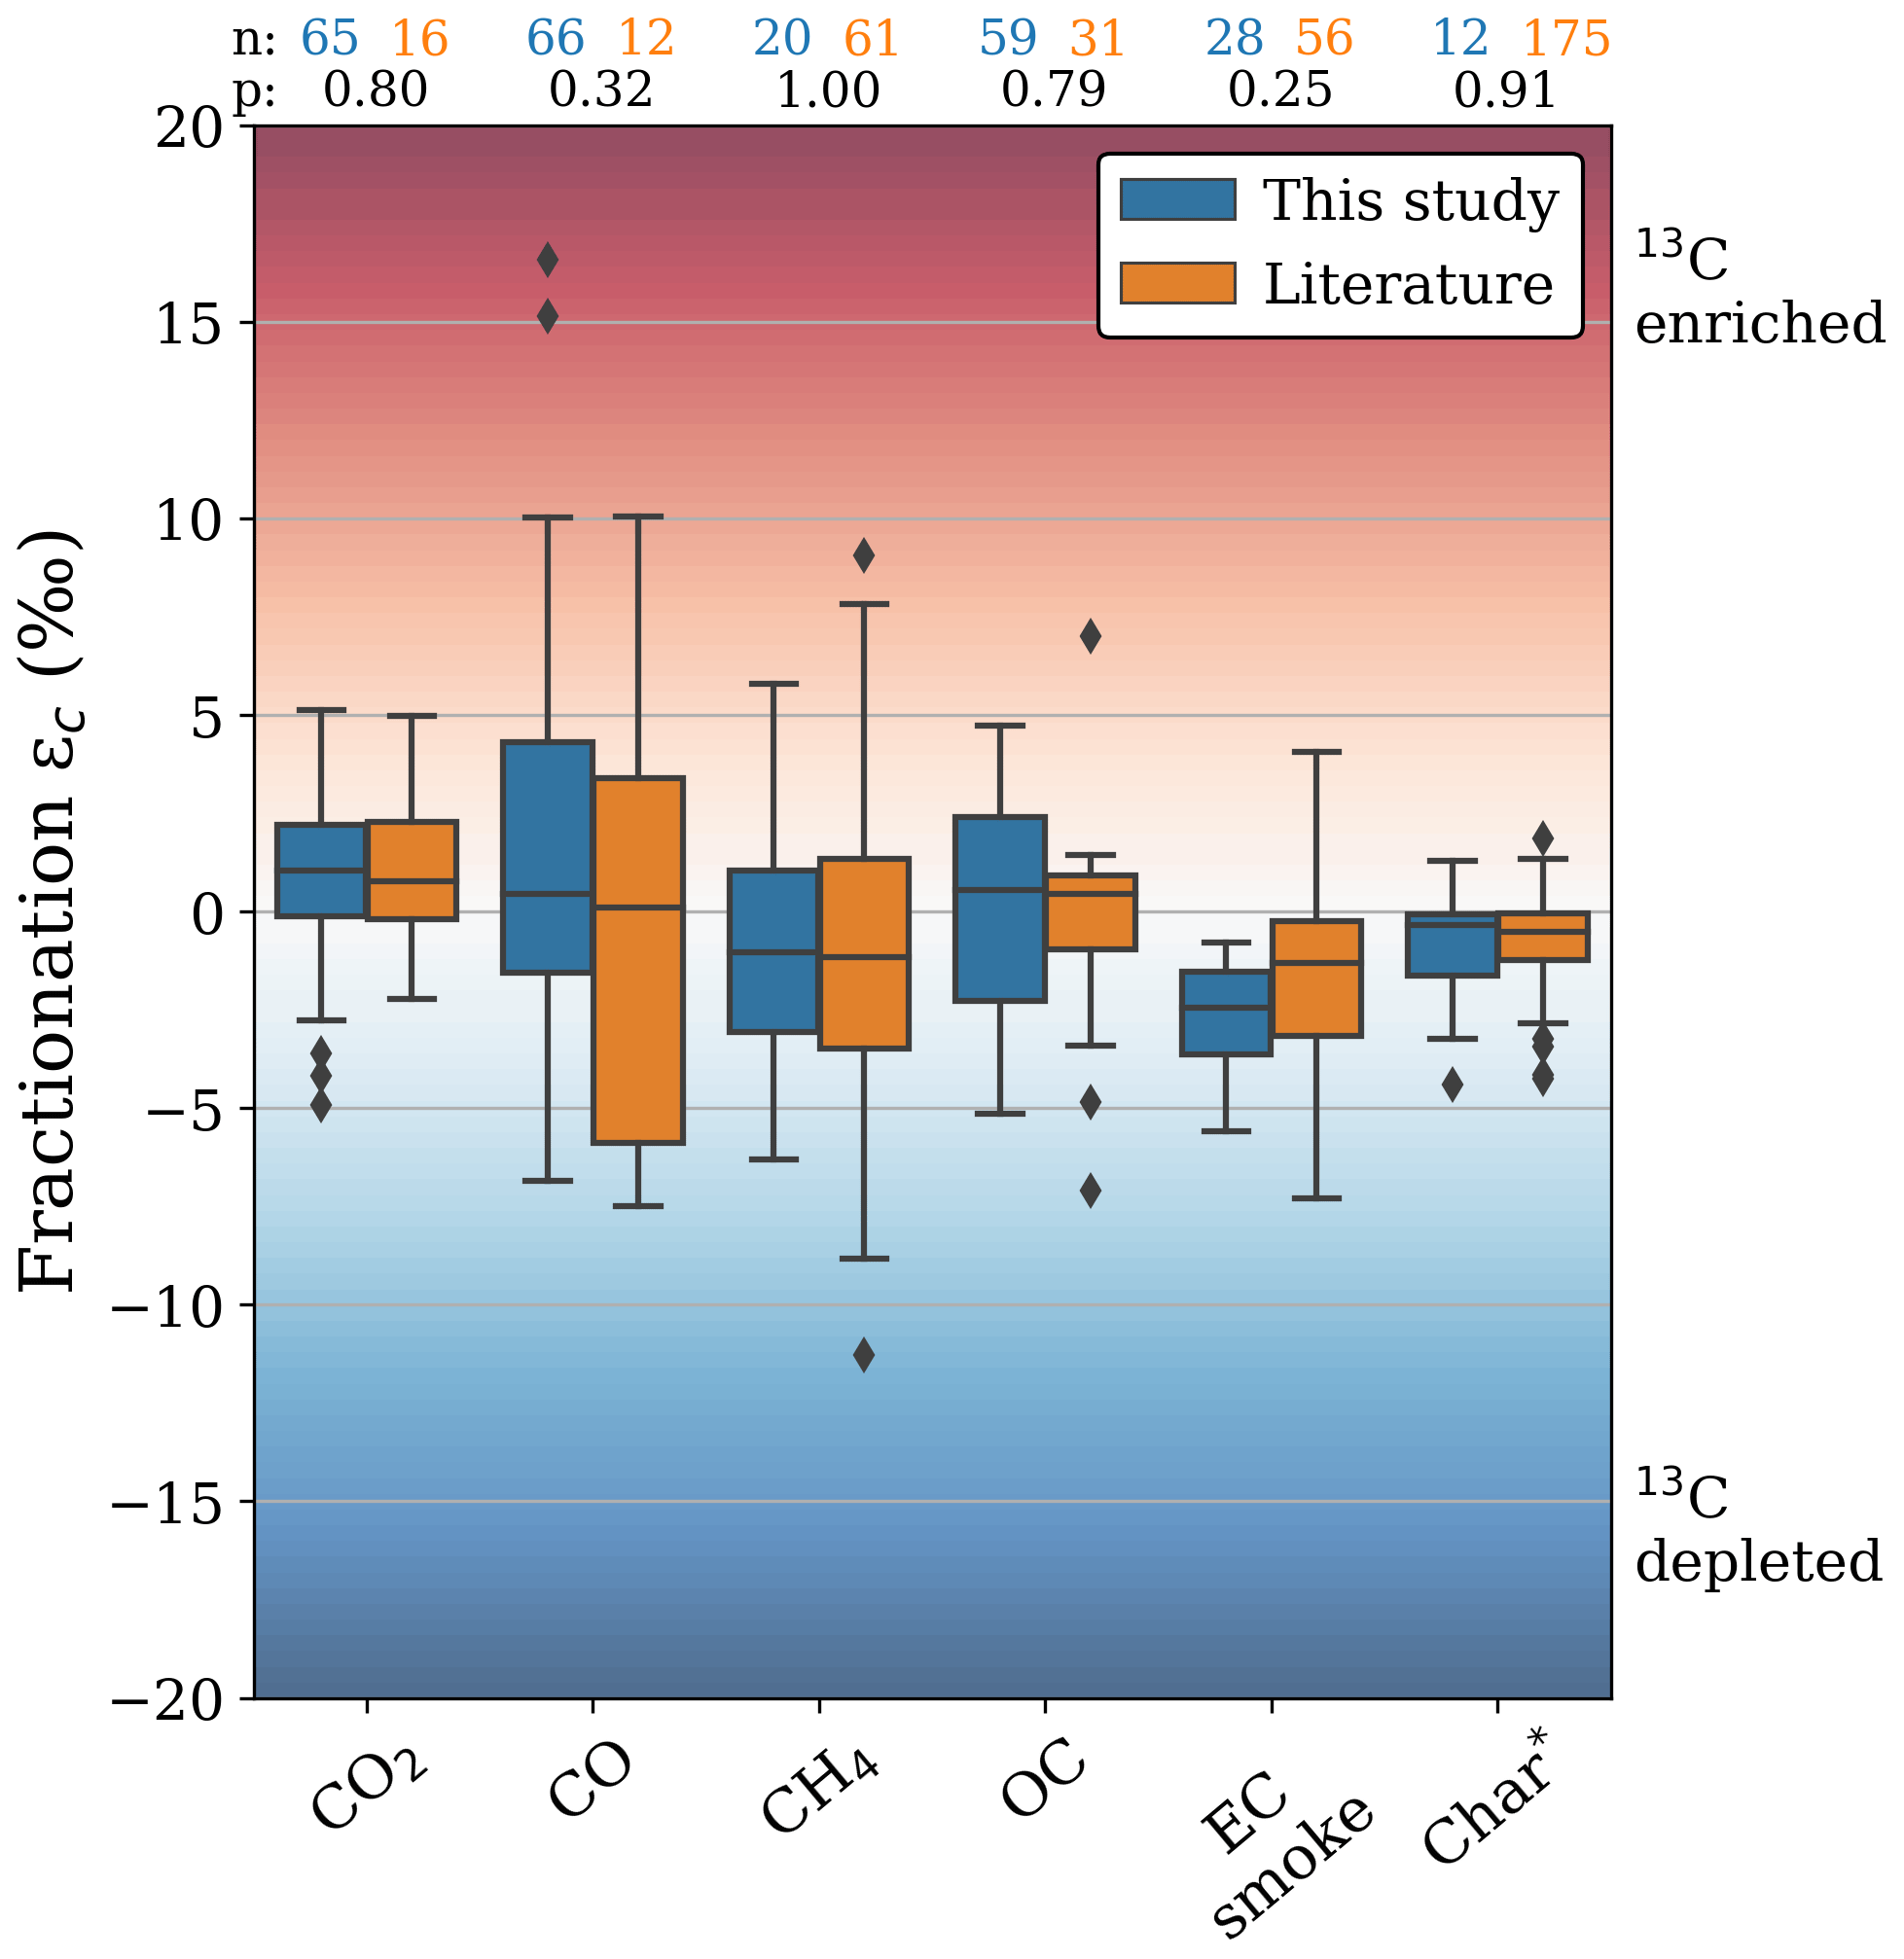
Figure 6δ13C fractionation in burning products from this study (blue) and the previous literature (orange). The numbers above the boxplots (n) and (p) represent the number of individual δ13C measurements and the P value calculated using a two-tailed t test with unequal variance, respectively. The literature “char” fraction was compared to the “residual” fraction in this study.
The fractionation towards CO2 (−1.1 ‰ to +5.1 ‰) was consistent with measurements in Alaskan wildfires (Umezawa et al., 2011) and laboratory burning of C3 and C4 vegetation (Turekian et al., 1998). CO was significantly lighter during RSC (−2.3 ‰ to +4.0 ‰) compared to FC (+0.9 ‰ to +16.6 ‰). Although we found more 13C-enriched CO emissions, our results are in agreement with those of Kato et al. (1999), who found that fractionation in CO from burning experiments in eucalyptus branches (C3) and maize (C4) was strongly related to the combustion phase. During BB, CO is formed both directly and indirectly (through VOCs), and once emitted, it further oxidizes to CO2. The strongly enriched CO may be related to the different substrate components that break up to form CO and VOC (Sect. 4.2) or the kinetic isotope effects during the formation and destruction pathways (Sect. 4.4). In our measurements CH4 from RSC (−2.4 ± 2.4 ‰) was more depleted compared to FC (0.2 ± 3.0 ‰). Moreover, CH4 from C4 grass samples was depleted (−4.3 ± 1.4 ‰), whereas CH4 from C3 wood chips tended to be slightly enriched (0.9 ± 1.1 ‰). These results, as well as the overall average fractionation (−1.1 ± 2.9 ‰), were in line the fractionation described in previous studies (−1.1 ± 4.6 ‰) (Fig. 4). Stevens and Engelkemeir (1988) found little CH4 fractionation for grass (+0.2 ‰), pine (+1.3 ‰), and brush (−0.3 ‰) fires when fuels were dry. In fresh brush fires however, carbon in the emitted CH4 was significantly lighter (−7.9 ‰) compared to the combined carbon in CO and CO2. Umezawa et al. (2011) and Chanton et al. (2000) also reported significant phase differences in the fractionation of CH4, with 13C-enriched flaming emissions and 13C-depleted smouldering emissions in C3 fuels. In our measurements, CH4 from C4 grass was significantly lighter, which corresponded with Chanton et al. (2000), who measured strongly depleted CH4 emissions (−10 ‰) from RSC in Zambian savanna grasslands. Nonetheless, CH4 emissions from other non-BB sources typically have much lower signatures (e.g. wetlands and rice paddies, −60 ± 5 ‰ VPDB; geological origins, −38 ± 7 ‰ VPDB; and cattle, −68 ± 3 ‰ VPDB) (Chanton et al., 2000; Klevenhusen et al., 2009; Sapart et al., 2012). Although the relatively large depletion in C4 samples may thus complicate partitioning between C3 and C4 fuel, BB signatures remain isotopically distinct from those other sources.
OC fractionation ranged from −0.3 ‰ to +3.0 ‰ in our laboratory measurements. While there was no significant difference between FC and RSC fractionation for OC, we found opposite directions of fractionation for emissions from C3 wood (13C-enriched) vs. C4 grass (13C-depleted), which was in line with previous studies. The OC EF was inversely proportional to the MCE (S. Liu et al., 2014; Pokhrel et al., 2016; Yokelson et al., 1997), meaning OC is predominantly emitted during RSC. For the prescribed fires, we found less volatile OC to be more depleted than more volatile OC, which is more often the case for BB (Yao et al., 2022; Zenker et al., 2020). The conversion to EC was relatively stable, though 13C-depleted with average fractionation of −2.2 ± 2.3 ‰, which was similar in FC and RSC emissions. Unlike OC, the EC EF is not strongly correlated with MCE. Combined with the decrease in OC emission factors with MCE, this causes the EC-to-TC ratio to increase exponentially (S. Liu et al., 2014; Pokhrel et al., 2016; Yokelson et al., 1997). This was consistent with the ratio found in our filter measurements. EC emissions were more depleted in 13C with respect to the precursor fuel for C4 compared to C3 vegetation. This was consistent with Das et al. (2010), who found no evidence of depletion or enrichment for C3-emitted EC, whereas for EC from C4 grasses they found a depletion in the range of −0.5 ‰ to −7.2 ‰. While within this range, the average EC fractionation we found for both C3 and C4 vegetation was slightly more depleted compared to previous studies, although the difference is not significant.
With an average fractionation of −0.9 ± 1.6 ‰ we found the signature of the residual carbon to be close to the original fuel. While in some experiments non-chemically altered fuel made up a significant portion of the residue, the small difference in δ13C between residue and fuel also held true for experiments in which the fuel was almost completely combusted, and the residue appeared black, indicating a high char content. This residual char could also be a good tracer for the combusted vegetation, and our residual fraction fractionation was in close alignment with the average fractionation for char found by previous studies (−0.7 ± 1.0 ‰).
While we did not measure the isotopic signatures of NMHC, previous studies may help to constrain the fractionation in this class, which was estimated to account for roughly 0.5 %–2.5 % of the emitted carbon. NMHCs comprise myriad different compounds, and it is therefore not possible to find a common isotope signature for all NMHCs. O'Malley et al. (1997) found n-alkanes and n-alkenes to be depleted by 7.5 ‰–11.5 ‰ for C4 grasses and 3.9 ‰–5.5 ‰ for C3 wood. This depletion was also confirmed by Czapiewski et al. (2002), with heavier molecules being more depleted. Yamada et al. (2009) found a strong relationship between isotopic fractionation in methanol and MCE, which is similar to our findings for CO. NMHC is predominantly emitted in RSC, and EFs are inversely correlated to the MCE (Yokelson et al., 2013). The 13C depletion in the literature confirms the overall phase differences we found in other RSC products like CO and CH4.
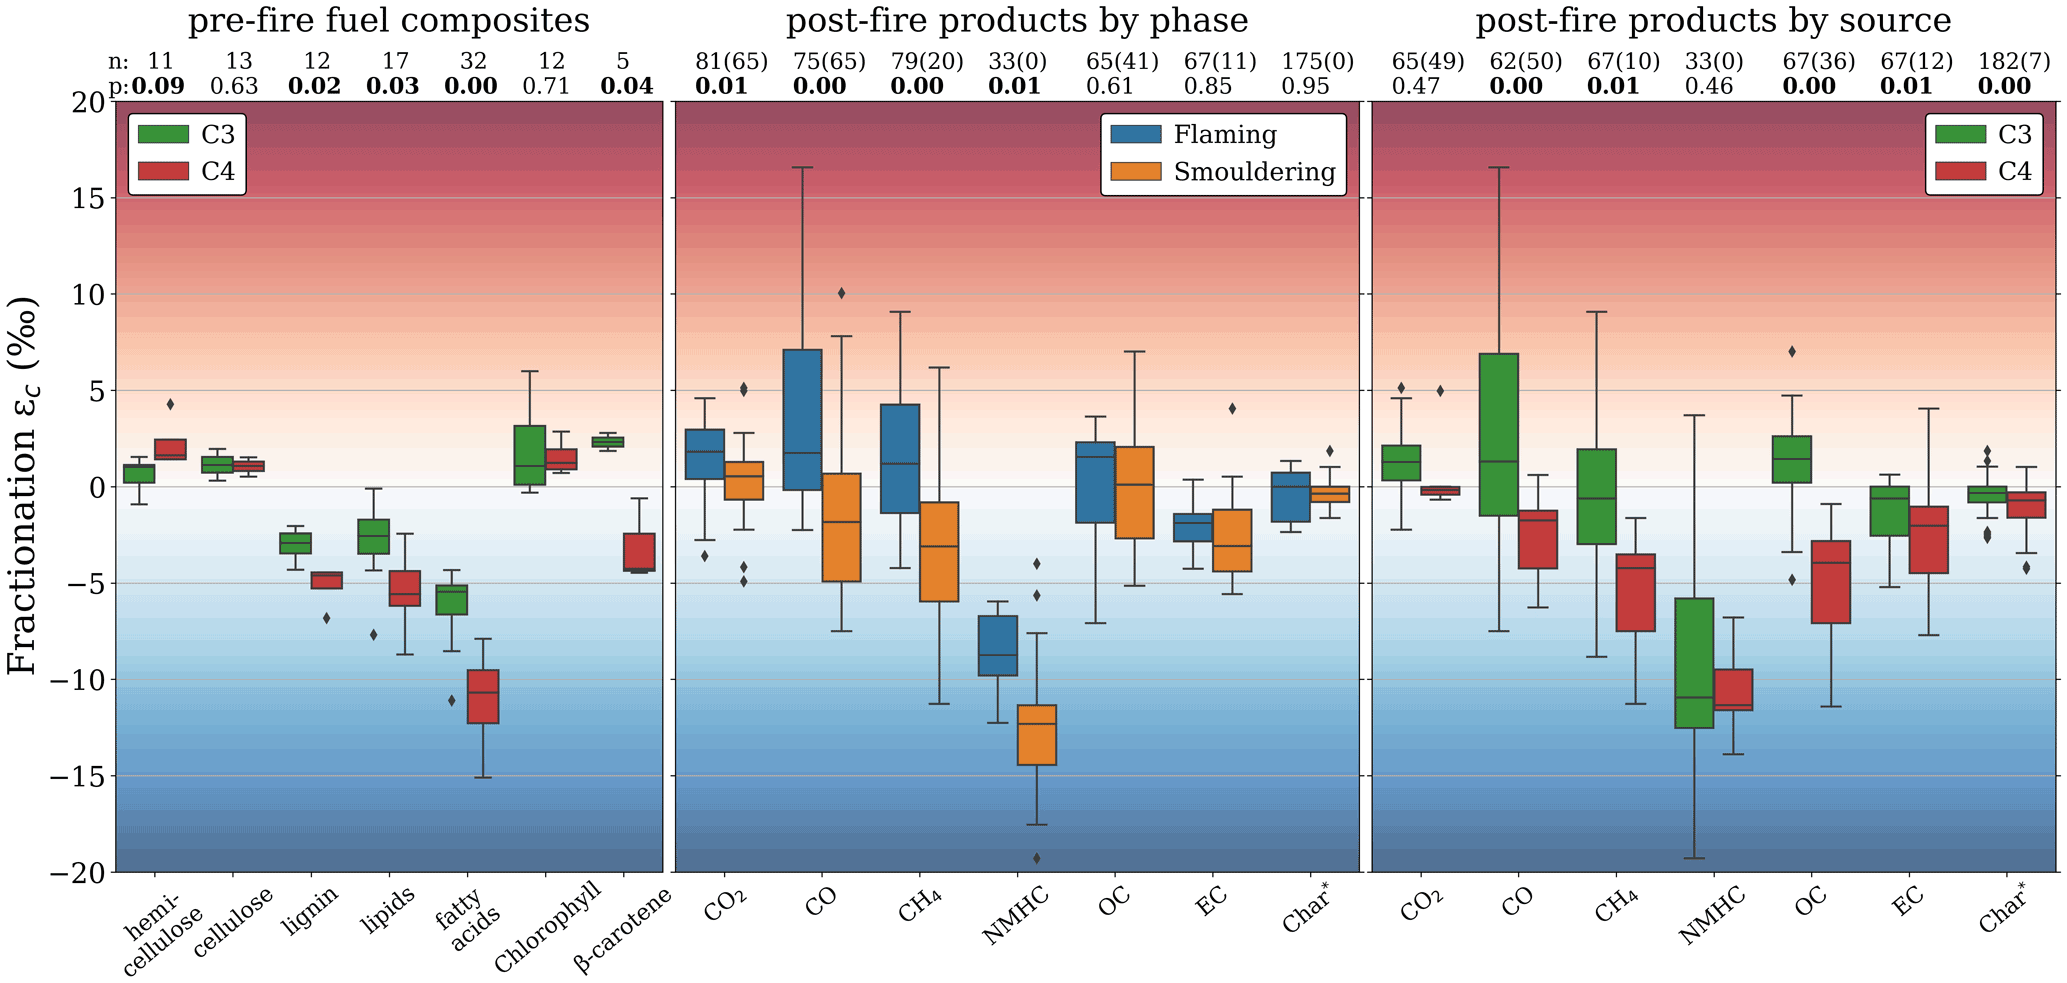
Figure 7Left: δ13C fractionation of various sub-compounds of the fuel compared to the bulk plant (i.e. the combined sub-compounds) for C3 (green) and C4 (red) vegetation. Middle: δ13C fractionation in pyrolysis products for flaming (blue) and smouldering (orange) combustion phases. Right: δ13C fractionation in pyrolysis products for C3 (green) and C4 (red) vegetation. The first row of numbers over the boxplots (n) represent the number of individual δ13C measurements taken from literature and from this study combined, with the number from this study in parentheses. The second row (p) represents the P value calculated using a two-tailed t test with unequal variance.
4.2 Isotopic distinction in biomass sub-components
Our results were in line with previous research focusing on individual emitted species. However, a major novelty of this study is that we measured almost all carbon-containing species. We will therefore now discuss the full carbon budget and the overall implications for BB carbon fractionation. Figure 7 shows the fractionation in the fuel sub-compounds compared to the bulk fuel (left) and burning products (right), based on our data and complemented by measurements reported in previous studies. For studies that listed the MCE but not the combustion phase, we used an MCE threshold of 0.95 to partition the phases.
Biomass consists of three main components: cellulose, hemicellulose, and lignin, which make up roughly 40 wt. % to 40 wt. %, and 10 wt. % to 25 wt. %, respectively, of the dry bulk weight (McKendry, 2002). Pyrolysis of hemicellulose and cellulose is a rapid process, resulting in very low residue. Lignin, on the other hand, pyrolyses at a much slower rate and over a much wider temperature range, generating a relatively large amount of char (∼ 40 wt. %) (Yang et al., 2002). FC is dominated by cellulose decomposition, whereas RSC is driven by lignin pyrolysis and subsequent char combustion (Gani and Naruse, 2007). We know that both cellulose and hemicellulose are typically slightly isotopically enriched (1 ‰–2 ‰) compared to the δ13C in the bulk plant, whereas lignin tends to be depleted by 2 ‰–7 ‰ (Benner et al., 1987; Leavitt et al., 1982; Loader et al., 2003; Steinbeiss et al., 2006; Weigt et al., 2015; Wilson and Grinsted, 1977; Zech et al., 2014). Different combustion phases are dominated by the consumption of different fuel sub-compounds and result in a different palette of combustion products (Sekimoto et al., 2018). We found CO2, CO, and CH4 (representing > 95 % of the carbon emissions) to be heavier during FC than during RSC, which coincides with a shift from cellulose and hemicellulose to lignin. The combustion efficiency is lower for lignin compared to hemicellulose and cellulose, meaning more CO, CH4, and PM are emitted by the former (Yang et al., 2002).
4.3 Fractionation in C3 and C4 fuels
Many studies have reported difference in fractionation between C3 and C4 vegetation (e.g. Das et al., 2010; Chanton et al., 2000) which was consistent with our findings (Figs. 3 and 7). This may be explained by the fuel composition: woody C3 fuels tend to be more lignin-dominated compared to C4 grasses (Benner et al., 1987). The signature of the bulk material is thus shifted towards lignin in C3 wood, which may be why the signature of the lignin is less depleted compared to bulk (Fig. 7). In other words, if lignin is depleted by the same amount compared to hemicellulose and cellulose but the lignin content is lower in C4 grasses, this would cause lignin and subsequently lignin-derived BB products to be more 13C-depleted compared to the bulk signature of those grasses. This coincides with our finding that RSC emissions from C4 fires were more depleted with respect to the bulk-fuel signature compared to fires in C3 fuels. Particularly in C3 fuels, which are much more heterogeneous in nature, the large variation in fuels also showed in the fractionation range of the fuel. Oxidation in C3 fuels (e.g. densely packed leaf litter and woody debris) is much less efficient compared to in well-aerated and quick-drying grasses and dry leaves. Therefore, C3 fires emit more CO, CH4, NMHC, and particulates. Emissions from these species were isotopically more similar to the C3 bulk fuel compared to C4 vegetation, while the opposite was true for CO2.
4.4 The KIE and pyrolysis temperature
Temperature-modulated charring experiments also indicate that carbon fractionation in both the charred fuel and the volatilized fraction is strongly dependent on the charring temperature (Czimczik et al., 2002; Purakayastha et al., 2016; Song et al., 2012). Kinetic fractionation would be most relevant at lower temperatures, where only some of the bonds pass the activation energy. As the activation energy for 13C–12C is higher, fewer of these bonds can be broken. At higher temperatures, the available energy is enough for any bond to be broken and the fractionation is expected to be lower. RSC is typically associated with much lower temperatures (500–700 ∘C) than FC (1500–1800 ∘C) (Rein, 2013; Rein et al., 2009), indicating isotopic selection from the KIE would be more significant. This may contribute to the more 13C-depleted values we found in emissions from RSC, e.g. in CO (Kato et al., 1999).
4.5 Particulate carbon signatures from the field experiments
For the lab experiments OC was a decent indicator for the isotopic signature of the fuel. Although we found OC from the field samples to be depleted by −6.6 ± 2.1 ‰, the signature was still strongly correlated to the initial fuel fraction. This may indicate that our fuel combustion measurements were underestimating the C3:C4 ratio of the consumed fuel. While this is not unthinkable, the observed depletion in EC compared to laboratory results was not proportionate to the C3:C4 fuel ratios found in the plots. Contrarily, the difference was the largest for the C4 grasslands, for which we were confident that there was no significant C3 fuel.
Besides kinetic and sub-compound-based fractionation, the lower δ13C may be related to several reasons including (1) OC being disproportionally more emitted by C3 (woody, RSC-prone) fuel with a lower δ13C signature (i.e. OC EFs vary for laboratory and field measurements), (2) condensation of semi-volatiles and quick chemical reactions occurring in the ambient plume which did not happen in the dark lab chimney, or (3) underestimation of the background OC in the field plots. Any of these explanations would require the behaviour in the field to significantly differ from the laboratory fires in mixed fuels, in which we did not find this depletion. Previous studies on isotopic fractionation of BB products have been almost exclusively performed under laboratory conditions. Additional isotopic measurements from landscape fires are necessary to explain the discrepancy in our laboratory and field results.
4.6 δ13C as an indicator for fuel sources
Figure 8 shows the δ13C signature of C3, C4, and mixed fuels (left) as well as the signatures for various BB products (right) derived from this study, complemented with the previous literature. While these literature studies also include experiments in non-savanna fuels, the δ13C signatures we found for savanna grasses and trees were in line with those of C3 and C4 vegetation. For CO, CH4, OC, and to a lesser extent EC, fractionation led to the convergence of C3 and C4 isotopic signatures, complicating fuel source appointment. Uncertainty remains particularly large in CO and CH4 which may affect the interpretation of historic fire regimes using gas trapped in ice cores (e.g. Z. Wang et al., 2010; Ferretti et al., 2005). CO2, EC, and char retained the isotopic signature of the precursor plant mixture well. They are thus suitable for identifying fuel sources. This contrasts with OC and CH4, for which differences in fractionation between C3 and C4 plants and the fire phase, combined with the high uncertainties, complicate the source allocation of smoke from mixed vegetation. While CO measurements showed significant variability, this was primarily the result of high-MCE (therefore low CO concentration) measurements. This small amount of highly enriched CO may therefore become insignificant in the overall signature of a mixed smoke plume, meaning that the bulk CO signature will be much closer to the signature of the burned fuel.
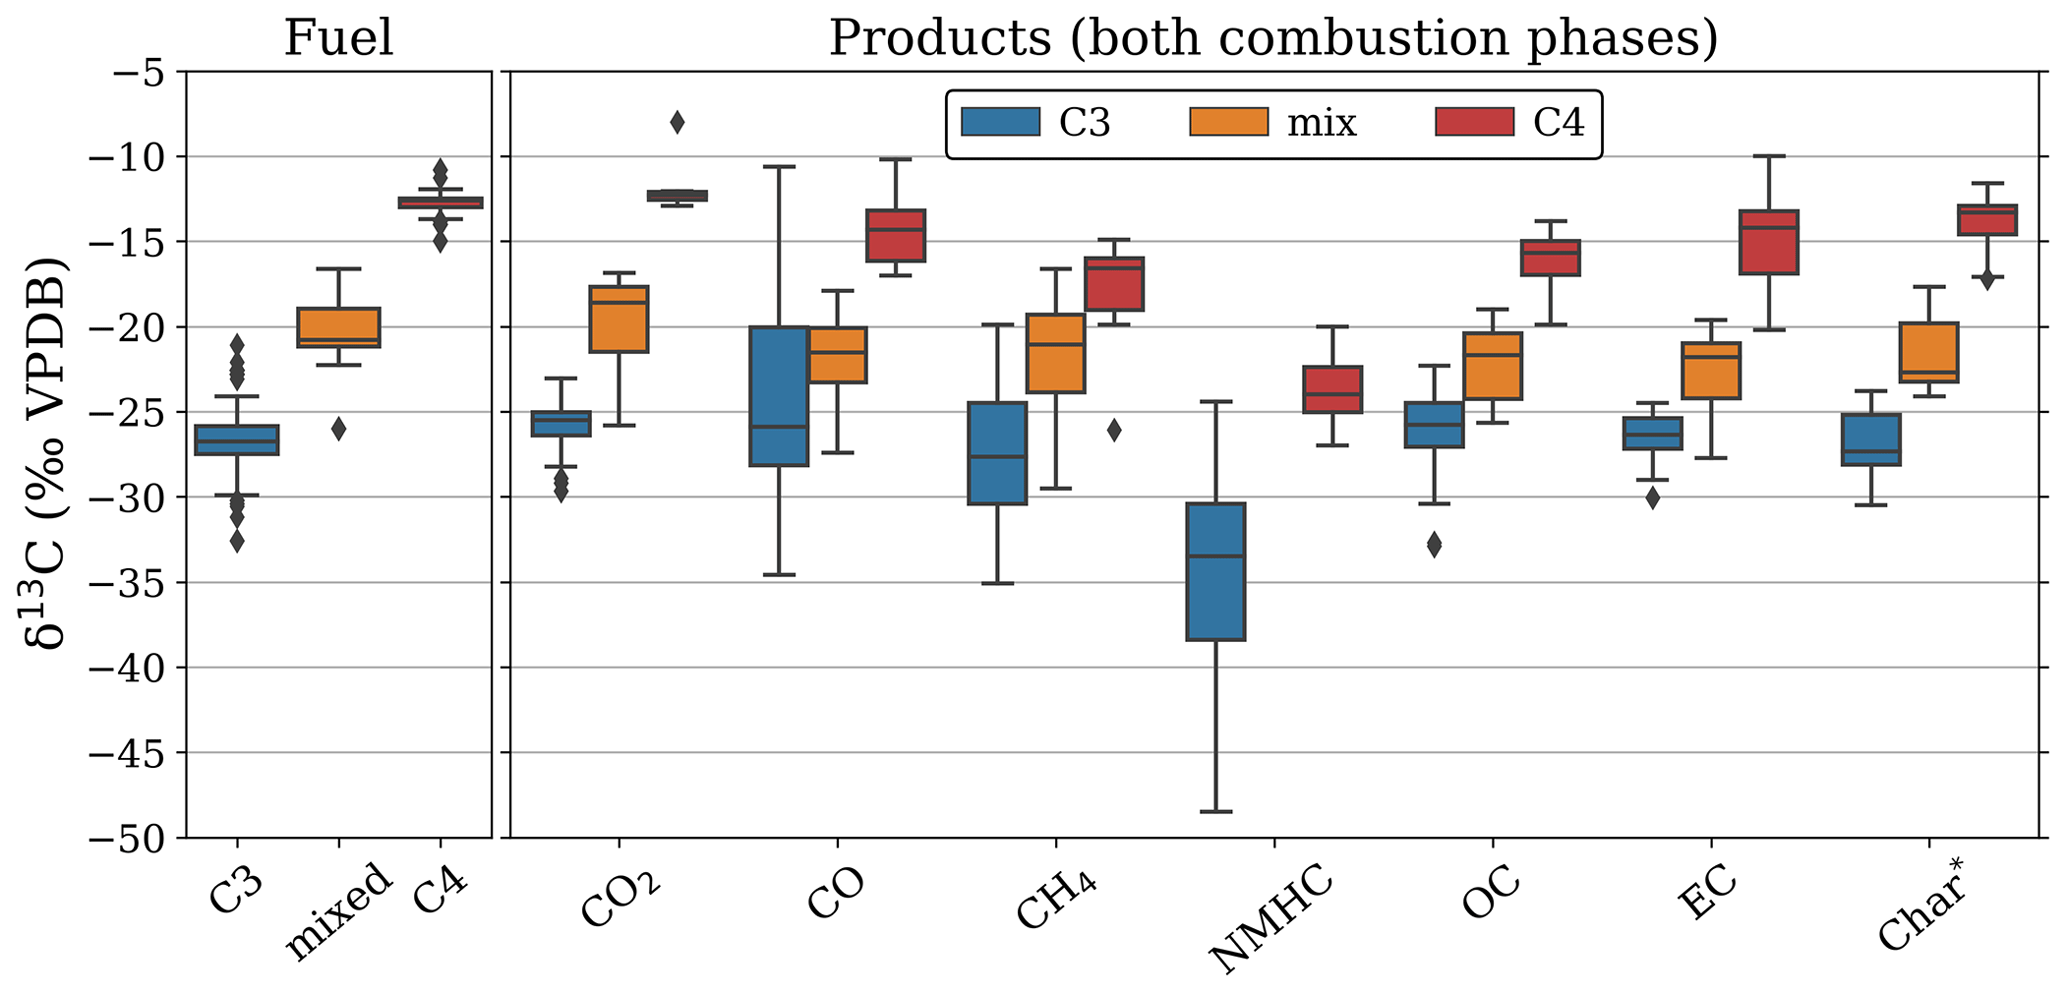
Figure 8Representativeness of the stable carbon isotopic signature of different biomass burning products for the precursor fuel. Left: signature range of the bulk fuel. Right: signature range of the biomass burning products.
4.7 Correction for source identification
Now we have established some relations between fuel type, combustion conditions, and isotopic fractionation, correction can be performed in multiple ways. If the MCE is measured, fractionation towards CO and CO2 can be corrected for using its correlation with MCE described in Fig. 3a and b. Equation (6) is an example:
Applying this correction led to a reduction of 26 % for CO2 and 29 % for CO in the difference between the signatures of the product and the fuel. The relative contribution of C4 to the fuel mixture can be calculated using Eq. (7):
where is the relative contribution of C4 to the fuel and δ13Cproduct is the isotopic signature measured in the emissions. and are the assumed isotopic signatures for C4 and C3 vegetation. For the field measurements, we used −14.9 ‰ and −27.6 ‰, respectively, based on the pre-fire fuel collections. Since both EC and OC fractionation were not significantly correlated with MCE (Fig. 3), a correction like Eq. (6) cannot be applied. We therefore corrected the field measurements by correcting assumed isotopic signatures for C4 and C3 vegetation with the average fractionation for C3 and C4 (+1.27 ‰ and −4.77 ‰, respectively) when measuring OC (−1.28 ‰ and −2.67 ‰, respectively) and when measuring EC. This approach reduced the error in the estimation of the C4 contribution to the Mozambican samples by 64 % using EC as a tracer and by 43 % using OC as a tracer. On average, the difference between the estimation of the C4 contribution to the total fuel mixture measured by ground measurements and derived from the isotopic signatures of the EC and OC particulates was 10 % using EC and 21 % using OC.
4.8 Uncertainties
4.8.1 Carbon from other sources
While the carbon pools we measured should be almost comprehensive in a closed system, field experiments like the ones conducted here are not closed systems. Cachier et al. (1995) proposed that aeolian erosion resulting from the thermal updraft over the fire can cause a significant atmospheric influx of fine biogenic particles from the soil. These particles can originate from far away or from older vegetation and thus do not necessarily reflect the current isotopic signature of the local vegetation. Soil organic carbon may contribute to the fuel mixture, with signatures deviating from the live vegetation (Santín et al., 2016). Humic soil organic carbon (SOC) is generally enriched in 13C compared to its plant source (Ehleringer et al., 2000). This enrichment is positively correlated to the stage of decomposition, with 1 ‰–3 ‰ enrichment of older SOM compared to fresh litter. As we measured areas that have been subjected to frequent (annual to biannual) high-intensity fires, we believe the combustion of old SOC to be small.
4.8.2 Fuel load representativeness
Fuel measurements of unevenly distributed fuels like trees, logs, and even shrubs may be of limited value due to the small (50 m × 20 m) plot size. While for fine fuels (i.e. grass and litter) we use weighted measurements before and after the fire, the combustion completeness of coarse woody debris, trees, and shrubs was estimated. Even though the contribution of these classes during LDS fires is very low, this subjective and rough estimate leaves uncertainty over the contribution of these fuel types to the fuel mixture.
In measurements of isotopic signatures of the fuel, a minute fraction of the carbon content is assumed to be representative of the carbon in the bulk. In the case of the fine-fuel measurements, fuel from ten 1 m2 plots is collected. This is assumed to be representative of an entire fire which could be several square kilometres. Of this material a small portion, which is thought to be representative of the larger sample, is dried and ground to a powder. Of this material, the carbon isotopes of approximately 100–400 ng are measured. Hence the representativeness of our samples can be questioned, but given that the average difference between duplicate fuel samples was 0.24 ± 0.13 ‰, we assume this effect to be limited.
Regional differences in species distribution and climatological conditions may require a separate local fuel assessment before the isotopic source allocation of BB emissions. For example, while in Africa grasses tend to be well represented by C4, the widespread existence of C3 grasses (e.g. Echinolaena inflexa) in the Brazilian Cerrado (Lloyd et al., 2008) makes the extrapolation from C3 vs. C4 to trees and shrubs vs. grasses more problematic. Besides photosynthetic pathways, isotopic signatures of the fuel are susceptible to relative humidity, temperature, and precipitation regimes (Zech et al., 2014), which may lead to spatio-temporal variability.
We measured isotopic fractionation in biomass burning (BB) products during pure- and mixed-fuel fire experiments under laboratory conditions and during prescribed savanna fires. Our results indicated that although the precursor plant material was the most important indicator for the isotopic δ13C signature in the emitted products, different combustion pathways in different fuel compounds as well as the kinetic isotope effect led to isotopic fractionation. In most products, the degree of fractionation was dependent on both the combustion phase and the vegetation type. Nonetheless, some emitted species proved to be more reliable for biomass source appointment than others.
During flaming combustion, CO and CO2, which make up the bulk of the carbon emissions, were both enriched compared to the bulk of the fuel. The trend of flaming emission samples being 13C-enriched compared to smouldering samples also held true for CH4, organic carbon (OC), and elemental carbon (EC). This corresponds to the hypothesis that flaming combustion (FC) is dominated by combustion of relatively 13C-rich cellulose and hemicellulose, whereas residual smouldering combustion (RSC) is accompanied by a shift towards 13C-poor lignin-dominated fuel. In addition, we found fractionation in CH4, CO, OC, EC, and residual carbon to be significantly different (p < 0.1) for C3 and C4 vegetation. This difference resulted in a convergence of the overall δ13C signatures of C3 and C4 emissions, which was particularly strong for CH4 and OC.
While CO is often used as a tracer due to its high departure from relatively low background concentration, our results indicate that with the broad range of CO isotopic fractionation, CO from C3 plants emitted during the flaming phase may have a similar δ13C signature to that of CO emitted during smouldering of C4 plants. The large uncertainty range in the fractionation in CO suggests that it is not always possible to distinguish CO isotopes emitted from C3 and C4 plants, though it should be noted that relative CO emissions are inversely proportional to the MCE and high enrichment thus only affects a small fraction of the CO emissions.
For BB aerosols, our measurements from prescribed fires in the Niassa Special Reserve, Mozambique, showed that while product and fuel signatures were highly correlated, particularly OC was strongly 13C-depleted compared to the fuel. This suggested that either our fuel measurements significantly underestimated the C3:C4 ratio of the fuel or 13C depletion due to other processes (e.g. different EFs from the lab experiments, rapid chemical alteration in the atmosphere, sample evaporation, or strong influence of background aerosol) complicated the source allocation of mixed fuels. Therefore, especially when using CO, CH4, OC, and EC, a thorough understanding of background levels, δ13C signatures, and atmospheric chemistry is necessary. More field measurements of carbon fractionation in landscape fires may elucidate this.
We found isotopic δ13C signatures in CO2, EC, and char to be the most representative of the δ13C signature of the precursor fuel. Typical residual smouldering emissions showed a stronger dependence on burning conditions, which may complicate source appointment. It is therefore appropriate to account for some level of fractionation in order to use stable carbon isotopes for source allocation of savanna burning emissions. Since savannas are highly diverse in the C3:C4 ratios and burning conditions which affect this fractionation, more direct measurements could prove beneficial for better understanding and constraining this fractionation. Nonetheless, our findings show that particularly through CO2 and EC emissions, stable carbon isotopes can be used to successfully estimate the ratio of C3:C4 fuels in the fire.
The data that support the findings of this study are available from the corresponding author, Roland Vernooij, upon reasonable request.
RV, GRvdW, UD, and EP designed the study. RV, AS, CQ, and PW conducted the experiments in the laboratory. RV, PW, and TE conducted the field measurements. AS, PY, CQ, RV, EP, UD, and CvdV conducted the isotope analyses on the samples. RV wrote the manuscript with help from PW, UD, EP, and GRvdW.
The contact author has declared that neither they nor their co-authors have any competing interests.
Publisher's note: Copernicus Publications remains neutral with regard to jurisdictional claims in published maps and institutional affiliations.
This article is part of the special issue “The role of fire in the Earth system: understanding interactions with the land, atmosphere, and society (ESD/ACP/BG/GMD/NHESS inter-journal SI)”. It is a result of the EGU General Assembly 2020, 3–8 May 2020.
This research was supported by the Dutch Research Council (NWO) (Vici scheme research programme, no. 016.160.324) and a KNAW Ammodo grant. The CO and CO2 isotope measurements were supported by the NWO project number 824.14.015. We owe great thanks to Natasha Ribeiro (Eduardo Mondlane University, Mozambique) and Franziska Steinbruch (Wildlife Conservation Society Mozambique) for making the field measurements possible. We are also grateful to Hans Cornelissen and Richard van Logtestijn for their help and allowing us to use the FLARE facilities and to Cameron Yates and Jeremy Russel-Smith (Charles Darwin University, Australia) for their invaluable help with the shrub biomass calculations.
This work was funded by grants from KNAW Ammodo and the Dutch Research Council (NWO) (grant nos. 016.160.324 and 824.14.015).
This paper was edited by Ivan Kourtchev and reviewed by two anonymous referees.
Aguilera, J. and Whigham, L. D.: Using the 13C/12C carbon isotope ratio to characterise the emission sources of airborne particulate matter: a review of literature, Isot. Environ. Health S., 54, 573–587, https://doi.org/10.1080/10256016.2018.1531854, 2018.
Andersson, A., Kirillova, E. N., Decesari, S., DeWitt, L., Gasore, J., Potter, K. E., Prinn, R. G., Rupakheti, M., de Dieu Ndikubwimana, J., Nkusi, J., and Safari, B.: Seasonal source variability of carbonaceous aerosols at the Rwanda Climate Observatory, Atmos. Chem. Phys., 20, 4561–4573, https://doi.org/10.5194/acp-20-4561-2020, 2020.
Andreae, M. O.: Emission of trace gases and aerosols from biomass burning – an updated assessment, Atmos. Chem. Phys., 19, 8523–8546, https://doi.org/10.5194/acp-19-8523-2019, 2019.
Ascough, P. L., Bird, M. I., Wormald, P., Snape, C. E., and Apperley, D.: Influence of production variables and starting material on charcoal stable isotopic and molecular characteristics, Geochim. Cosmochim. Ac., 72, 6090–6102, https://doi.org/10.1016/j.gca.2008.10.009, 2008.
Assonov, S., Groening, M., Fajgelj, A., Hélie, J. F., and Hillaire-Marcel, C.: Preparation and characterisation of IAEA-603, a new primary reference material aimed at the VPDB scale realisation for δ13C and δ18O determination, Rapid Commun. Mass Sp., 34, e8867, https://doi.org/10.1002/rcm.8867, 2020.
Atkins, P. W. and De Paula, J.: Atkins' Physical Geochemistry, 8th edn., Oxford University Press, Oxford, 2006.
Ballentine, D. C., MacKo, S. A., and Turekian, V. C.: Variability of stable carbon isotopic compositions in individual fatty acids from combustion of C4 and C3 plants: Implications for biomass burning, Chem. Geol., 152, 151–161, https://doi.org/10.1016/S0009-2541(98)00103-X, 1998.
Benner, R., Fogel, M. L., Sprague, E. K., and Hodson, R. E.: Depletion of C in lignin and its implications for stable carbon isotope studies, Nature, 329, 708–710, https://doi.org/10.1038/329708a0, 1987.
Bird, M. I. and Ascough, P. L.: Isotopes in pyrogenic carbon: A review, Org. Geochem., 42, 1529–1539, https://doi.org/10.1016/j.orggeochem.2010.09.005, 2012.
Bird, M. I. and Gröcke, D. R.: Determination of the abundance and carbon isotope composition of elemental carbon in sediments, Geochim. Cosmochim. Ac., 61, 3413–3423, https://doi.org/10.1016/S0016-7037(97)00157-9, 1997.
Boutton, T. W., Archer, S. R., and Midwood, A. J.: Stable isotopes in ecosystem science: Structure, function and dynamics of a subtropical savanna, Rapid Commun. Mass Sp., 13, 1263–1277, https://doi.org/10.1002/(SICI)1097-0231(19990715)13:13<1263::AID-RCM653>3.0.CO;2-J, 1999.
Brand, W. A., Coplen, T. B., Vogl, J., Rosner, M., and Prohaska, T.: Assessment of international reference materials for isotope-ratio analysis (IUPAC technical report), Pure Appl. Chem., 86, 425–467, https://doi.org/10.1515/pac-2013-1023, 2014.
Cachier, H., Buat-Menard, P., Fontugne, M., and Rancher, J.: Source terms and source strengths of the carbonaceous aerosol in the tropics, J. Atmos. Chem., 3, 469–489, https://doi.org/10.1007/BF00053872, 1985.
Cachier, H., Liousse, C., Buat-Menard, P., and Gaudichet, A.: Particulate content of savanna fire emissions, J. Atmos. Chem., 22, 123–148, https://doi.org/10.1007/BF00708185, 1995.
Cavalli, F., Viana, M., Yttri, K. E., Genberg, J., and Putaud, J.-P.: Toward a standardised thermal-optical protocol for measuring atmospheric organic and elemental carbon: the EUSAAR protocol, Atmos. Meas. Tech., 3, 79–89, https://doi.org/10.5194/amt-3-79-2010, 2010.
Chanton, J. P., Rutkowski, C. M., Schwartz, C. C., Ward, D. E., and Boring, L.: Factors influencing the stable carbon isotopic signature of methane from combustion and biomass burning, J. Geophys. Res.-Atmos., 105, 1867–1877, https://doi.org/10.1029/1999JD900909, 2000.
Chen, L.-W. A., Verburg, P., Shackelford, A., Zhu, D., Susfalk, R., Chow, J. C., and Watson, J. G.: Moisture effects on carbon and nitrogen emission from burning of wildland biomass, Atmos. Chem. Phys., 10, 6617–6625, https://doi.org/10.5194/acp-10-6617-2010, 2010.
Christian, T. J., Kleiss, B., Yokelson, R. J., Holzinger, R., Crutzen, P. J., Hao, W. M., Saharjo, B. H., and Ward, D. E.: Comprehensive laboratory measurements of biomass-burning emissions: 1. Emissions from Indonesian, African, and other fuels, J. Geophys. Res.-Atmos., 108, 4719, https://doi.org/10.1029/2003jd003704, 2003.
Collister, J. W., Rieley, G., Stern, B., Eglinton, G., and Fry, B.: Compound-specific δ13C analyses of leaf lipids from plants with differing carbon dioxide metabolisms, Org. Geochem., 21, 619–627, https://doi.org/10.1016/0146-6380(94)90008-6, 1994.
Czapiewski, K. V., Czuba, E., Huang, L., Ernst, D., Norman, A. L., Koppmann, R., and Rudolph, J.: Isotopic composition of non-methane hydrocarbons in emissions from biomass burning, J. Atmos. Chem., 43, 45–60, https://doi.org/10.1023/A:1016105030624, 2002.
Czimczik, C. I., Preston, C. M., Schmidt, M. W. I., Werner, R. A., and Schulze, E. D.: Effects of charring on mass, organic carbon, and stable carbon isotope composition of wood, Org. Geochem., 33, 1207–1223, https://doi.org/10.1016/S0146-6380(02)00137-7, 2002.
Das, O., Wang, Y., and Hsieh, Y. P.: Chemical and carbon isotopic characteristics of ash and smoke derived from burning of C3 and C4 grasses, Org. Geochem., 41, 263–269, https://doi.org/10.1016/j.orggeochem.2009.11.001, 2010.
Eames, T., Russell-Smith, J., Yates, C., Edwards, A., Vernooij, R., Ribeiro, N., Steinbruch, F., and van der Werf, G. R.: Instantaneous Pre-Fire Biomass and Fuel Load Measurements from Multi-Spectral UAS Mapping in Southern African Savannas, Fire, 4, 2, https://doi.org/10.3390/fire4010002, 2021.
Eck, T. F., Holben, B. N., Reid, J. S., Mukelabai, M. M., Piketh, S. J., Torres, O., Jethva, H. T., Hyer, E. J., Ward, D. E., Dubovik, O., Sinyuk, A., Schafer, J. S., Giles, D. M., Sorokin, M., Smirnov, A., and Slutsker, I.: A seasonal trend of single scattering albedo in southern African biomass-burning particles: Implications for satellite products and estimates of emissions for the world' s largest biomass-burning source, J. Geophys. Res.-Atmos., 118, 6414–6432, https://doi.org/10.1002/jgrd.50500, 2013.
Ehleringer, J. R., Buchmann, N., and Flanagan, L. B.: Carbon Isotope Ratios in Belowground Carbon Cycle Processes, Ecol. Appl., 10, 412, https://doi.org/10.2307/2641103, 2000.
Ferretti, D. F., Miller, B., Whitem W. C., Etherige, M., Lassey, R., Lowe, C., Macfarling Meure, C. M., Dreier, F., Trudinger, M., van Ommen, T. D., and Langenfelds, R. L.: Unexpected Changes to the Global Methane Budget over the Past 2000 Years, Science, 309, 1714–1717, https://doi.org/10.1126/science.1115193, 2005.
Gani, A. and Naruse, I.: Effect of cellulose and lignin content on pyrolysis and combustion characteristics for several types of biomass, Renew. Energ., 32, 649–661, https://doi.org/10.1016/j.renene.2006.02.017, 2007.
Garbaras, A., Masalaite, A., Garbariene, I., Ceburnis, D., Krugly, E., Remeikis, V., Puida, E., Kvietkus, K., and Martuzevicius, D.: Stable carbon fractionation in size-segregated aerosol particles produced by controlled biomass burning, J. Aerosol Sci., 79, 86–96, https://doi.org/10.1016/j.jaerosci.2014.10.005, 2015.
Giglio, L., Boschetti, L., Roy, D. P., Humber, M. L., and Justice, C. O.: The Collection 6 MODIS burned area mapping algorithm and product, Remote Sens. Environ., 217, 72–85, https://doi.org/10.1016/j.rse.2018.08.005, 2018.
Gromov, S., Brenninkmeijer, C. A. M., and Jöckel, P.: Uncertainties of fluxes and 13C∕12C ratios of atmospheric reactive-gas emissions, Atmos. Chem. Phys., 17, 8525–8552, https://doi.org/10.5194/acp-17-8525-2017, 2017.
Hall, G., Woodborne, S., and Scholes, M.: Stable carbon isotope ratios from archaeological charcoal as palaeoenvironmental indicators, Chem. Geol., 247, 384–400, https://doi.org/10.1016/j.chemgeo.2007.11.001, 2008.
Hoffa, E. A., Ward, D. E., Hao, W. M., Susott, R. A., and Wakimoto, R. H.: Seasonality of carbon emissions from biomass burning in a Zambian savanna, J. Geophys. Res., 104, 13841–13853, https://doi.org/10.1029/1999JD900091, 1999.
Hurst, D. F., Griffith, D. W. T., and Cook, G. D.: Trace gas emissions from biomass burning in tropical Australian savannas, J. Geophys. Res., 99, 16441, https://doi.org/10.1029/94JD00670, 1994.
Jasper, J. P., Hayes, J. M., Mix, A. C., and Prahl, F. G.: Photosynthetic fractionation of 13C and concentrations of dissolved CO2 in the central equatorial Pacific during the last 255,000 years, Paleoceanography, 9, 781–798, https://doi.org/10.1029/94PA02116, 1994.
Jones, M. W., Santín, C., van der Werf, G. R., and Doerr, S. H.: Global fire emissions buffered by the production of pyrogenic carbon, Nat. Geosci., 12, 742–747, https://doi.org/10.1038/s41561-019-0403-x, 2019.
Jones, T. P. and Chaloner, W. G.: Fossil charcoal, its recognition and palaeoatmospheric significance, Palaeogeogr. Palaeocl., 97, 39–50, https://doi.org/10.1016/0031-0182(91)90180-Y, 1991.
Kato, S., Akimoto, H., Ro, T., Bra, M., and Brenninkmeijer, C. A. M.: Stable isotopic compositions of carbon monoxide from biomass burning experiments, Atmos. Environ., 33, 4357–4362, 1999.
Kawashima, H. and Haneishi, Y.: Effects of combustion emissions from the Eurasian continent in winter on seasonal δ13C of elemental carbon in aerosols in Japan, Atmos. Environ., 46, 568–579, https://doi.org/10.1016/j.atmosenv.2011.05.015, 2012.
Klevenhusen, F., Bernasconi, S. M., Hofstetter, T. B., Bolotin, J., Kunz, C., and Soliva, C. R.: Efficiency of monolaurin in mitigating ruminal methanogenesis and modifying C-isotope fractionation when incubating diets composed of either C3 or C4 plants in a rumen simulation technique (Rusitec) system, 102, 1308–1317, https://doi.org/10.1017/S0007114509990262, 2009.
Leavitt, S. W., Donahue, D. J., and Long, A.: Charcoal production and cellulose: Implications to radicarbon dates and accelerator target production, Radiocarbon, 24, 27–35, https://doi.org/10.1017/S0033822200004860, 1982.
Liu, G., Li, J., Xu, H., Wu, D., Liu, Y., and Yang, H.: Isotopic compositions of elemental carbon in smoke and ash derived from crop straw combustion, Atmos. Environ., 92, 303–308, https://doi.org/10.1016/j.atmosenv.2014.04.042, 2014.
Liu, S., Aiken, A. C., Arata, C., Dubey, M. K., Stockwell, C. E., Yokelson, R. J., Stone, E. A., Jayarathne, T., Robinson, A. L., DeMott, P. J., and Kreidenweis, S. M.: Aerosol single scattering albedo dependence on biomass combustion efficiency: Laboratory and field studies, Geophys. Res. Lett., 41, 742–748, https://doi.org/10.1002/2013GL058392, 2014.
Lloyd, J., Bird, M. I., Vellen, L., Miranda, A. C., Veenendaal, E. M., Djagbletey, G., Miranda, H. S., Cook, G., and Farquhar, G. D.: Contributions of woody and herbaceous vegetation to tropical savanna ecosystem productivity: A quasi-global estimate, Tree Physiol., 28, 451–468, https://doi.org/10.1093/treephys/28.3.451, 2008.
Loader, N. J., Robertson, I., and McCarroll, D.: Comparison of stable carbon isotope ratios in the whole wood, cellulose and lignin of oak tree-rings, Palaeogeogr. Palaeocl., 196, 395–407, https://doi.org/10.1016/S0031-0182(03)00466-8, 2003.
Mao, Y. H., Li, Q. B., Chen, D., Zhang, L., Hao, W.-M., and Liou, K.-N.: Top-down estimates of biomass burning emissions of black carbon in the Western United States, Atmos. Chem. Phys., 14, 7195–7211, https://doi.org/10.5194/acp-14-7195-2014, 2014.
Masi, A., Sadori, L., Zanchetta, G., Baneschi, I., and Giardini, M.: Climatic interpretation of carbon isotope content of mid-Holocene archaeological charcoals from eastern Anatolia, Quatern. Int., 303, 64–72, https://doi.org/10.1016/j.quaint.2012.11.010, 2013.
McKendry, P.: Energy production from biomass (part 1): Overview of biomass, Bioresource Technol., 83, 37–46, https://doi.org/10.1016/S0960-8524(01)00118-3, 2002.
O'Leary, M. H.: Carbon Isotopes in Photosynthesis, Bioscience, 38, 328–336, https://doi.org/10.2307/1310735, 1988.
O'Malley, V. P., Burke, R. A., and Schlotzhauer, W. S.: Using GC-MS/Combustion/IRMS to determine the 13C/12C ratios of individual hydrocarbons produced from the combustion of biomass materials – Application to biomass burning, Org. Geochem., 27, 567–581, https://doi.org/10.1016/S0146-6380(97)00087-9, 1997.
Pathirana, S. L., van der Veen, C., Popa, M. E., and Röckmann, T.: An analytical system for stable isotope analysis on carbon monoxide using continuous-flow isotope-ratio mass spectrometry, Atmos. Meas. Tech., 8, 5315–5324, https://doi.org/10.5194/amt-8-5315-2015, 2015.
Pechony, O., Shindell, D. T., and Faluvegi, G.: Direct top-down estimates of biomass burning CO emissions using TES and MOPITT versus bottom-up GFED inventory, J. Geophys. Res.-Atmos., 118, 8054–8066, https://doi.org/10.1002/jgrd.50624, 2013.
Petzold, A., Ogren, J. A., Fiebig, M., Laj, P., Li, S.-M., Baltensperger, U., Holzer-Popp, T., Kinne, S., Pappalardo, G., Sugimoto, N., Wehrli, C., Wiedensohler, A., and Zhang, X.-Y.: Recommendations for reporting ”black carbon” measurements, Atmos. Chem. Phys., 13, 8365–8379, https://doi.org/10.5194/acp-13-8365-2013, 2013.
Pokhrel, R. P., Wagner, N. L., Langridge, J. M., Lack, D. A., Jayarathne, T., Stone, E. A., Stockwell, C. E., Yokelson, R. J., and Murphy, S. M.: Parameterization of single-scattering albedo (SSA) and absorption Ångström exponent (AAE) with for aerosol emissions from biomass burning, Atmos. Chem. Phys., 16, 9549–9561, https://doi.org/10.5194/acp-16-9549-2016, 2016.
Poole, I., Braadbaart, F., Boon, J. J., and Van Bergen, P. P.: Stable carbon isotope changes during artificial charring of propagules, Org. Geochem., 33, 1675–1681, https://doi.org/10.1016/S0146-6380(02)00173-0, 2002.
Purakayastha, T. J., Das, K. C., Gaskin, J., Harris, K., Smith, J. L., and Kumari, S.: Effect of pyrolysis temperatures on stability and priming effects of C3 and C4 biochars applied to two different soils, Soil Till. Res., 155, 107–115, https://doi.org/10.1016/j.still.2015.07.011, 2016.
Rein, G.: Smouldering Fires and Natural Fuels, in: Fire Phenomena and the Earth System: An Interdisciplinary Guide to Fire Science, edited by: Belcher, C. M., John Wile & Sons, 15–33, https://doi.org/10.1002/9781118529539.ch2, 2013.
Rein, G., Cohen, S., and Simeoni, A.: Carbon emissions from smouldering peat in shallow and strong fronts, P. Combust. Inst., 32 II, 2489–2496, https://doi.org/10.1016/j.proci.2008.07.008, 2009.
Ribeiro, N. S., Shugart, H. H., and Washington-Allen, R.: The effects of fire and elephants on species composition and structure of the Niassa Reserve, northern Mozambique, Forest Ecol. Manag., 255, 1626–1636, https://doi.org/10.1016/j.foreco.2007.11.033, 2008.
Röckmann, T., Eyer, S., van der Veen, C., Popa, M. E., Tuzson, B., Monteil, G., Houweling, S., Harris, E., Brunner, D., Fischer, H., Zazzeri, G., Lowry, D., Nisbet, E. G., Brand, W. A., Necki, J. M., Emmenegger, L., and Mohn, J.: In situ observations of the isotopic composition of methane at the Cabauw tall tower site, Atmos. Chem. Phys., 16, 10469–10487, https://doi.org/10.5194/acp-16-10469-2016, 2016.
Rudolph, J., Lowe, D. C., Martin, R. J., and Clarkson, T. S.: A novel method for compound specific determination of δ13C in volatile organic compounds at ppt levels in ambient air, Geophys. Res. Lett., 24, 659–662, https://doi.org/10.1029/97GL00537, 1997.
Russell-smith, J., Yates, C., Vernooij, R., Eames, T., Werf, G. Van Der, Ribeiro, N., Edwards, A., Beatty, R., Lekoko, O., Mafoko, J., Monagle, C., and Johnston, S.: Opportunities and challenges for savanna burning emissions abatement in southern Africa, J. Environ. Manage., 288, 112414, https://doi.org/10.1016/j.jenvman.2021.112414, 2021.
Santín, C., Doerr, S. H., Merino, A., Bryant, R., and Loader, N. J.: Forest floor chemical transformations in a boreal forest fire and their correlations with temperature and heating duration, Geoderma, 264, 71–80, https://doi.org/10.1016/j.geoderma.2015.09.021, 2016.
Sapart, C. J., Monteil, G., Prokopiou, M., Van De Wal, R. S. W., Kaplan, J. O., Sperlich, P., Krumhardt, K. M., Van Der Veen, C., Houweling, S., Krol, M. C., Blunier, T., Sowers, T., Martinerie, P., Witrant, E., Dahl-Jensen, D., and Röckmann, T.: Natural and anthropogenic variations in methane sources during the past two millennia, Nature, 490, 85–88, https://doi.org/10.1038/nature11461, 2012.
Schimmelmann, A., Qi, H. P., Coplen, T. B., Brand, W. A., J., F., Meier-Augenstein, W., Kemp, H. F., Toman, B., Ackermann, A., Assonov, S., Aerts-Bijma, A. T., Brejcha, R., Chikaraishi, Y., Darwish, T., Elsner, M., Gehre, M., Geilmann, H., Gröning, M., Helie, J. F., Herrero-Martin, S., Meijer, H. A. J., Sauer, P. E., Sessions, A. L., and Werner, R. A.: Organic Reference Materials for Hydrogen, Carbon, and Nitrogen Stable Isotope-Ratio Measurements: Caffeines, n-Alkanes, Fatty Acid Methyl Esters, Glycines, L-Valines, Polyethylenes, and Oils, Anal. Chem., 88, 4294–4302, 2016.
Sekimoto, K., Koss, A. R., Gilman, J. B., Selimovic, V., Coggon, M. M., Zarzana, K. J., Yuan, B., Lerner, B. M., Brown, S. S., Warneke, C., Yokelson, R. J., Roberts, J. M., and de Gouw, J.: High- and low-temperature pyrolysis profiles describe volatile organic compound emissions from western US wildfire fuels, Atmos. Chem. Phys., 18, 9263–9281, https://doi.org/10.5194/acp-18-9263-2018, 2018.
Smith, B. N. and Epstein, S.: Two Categories of Ratios for Higher Plants, Plant Physiol., 47, 380–384, https://doi.org/10.1104/pp.47.3.380, 1971.
Snover, A. K., Quay, P. D., and Hao, W. M.: The content of methane emitted from biomass burning, Global Biogeochem. Cy., 14, 11–24, https://doi.org/10.1029/1999GB900075, 2000.
Song, J., Huang, W., and Peng, P.: Stability and carbon isotope changes of soot and char materials during thermal oxidation: Implication for quantification and source appointment, Chem. Geol., 330–331, 159–164, https://doi.org/10.1016/j.chemgeo.2012.08.003, 2012.
Steinbeiss, S., Schmidt, C. M., Heide, K., and Gleixner, G.: δ13C values of pyrolysis products from cellulose and lignin represent the isotope content of their precursors, J. Anal. Appl. Pyrol., 75, 19–26, https://doi.org/10.1016/j.jaap.2005.03.009, 2006.
Stevens, C. M. and Engelkemeir, A.: Stable carbon isotopic composition of methane from some natural and anthropogenic sources, J. Geophys. Res., 93, 725, https://doi.org/10.1029/jd093id01p00725, 1988.
Surawski, N. C., Sullivan, A. L., Meyer, C. P., Roxburgh, S. H., and Polglase, P. J.: Greenhouse gas emissions from laboratory-scale fires in wildland fuels depend on fire spread mode and phase of combustion, Atmos. Chem. Phys., 15, 5259–5273, https://doi.org/10.5194/acp-15-5259-2015, 2015.
Surawski, N. C., Sullivan, A. L., Roxburgh, S. H., Meyer, C. P. M., and Polglase, P. J.: Incorrect interpretation of carbon mass balance biases global vegetation fire emission estimates, Nat. Commun., 7, 1–5, https://doi.org/10.1038/ncomms11536, 2016.
Swap, R. J., Aranibar, J. N., Dowty, P. R., Gilhooly, W. P., and Macko, S. A.: Natural abundance of 13C and 15N in C3 and C4 vegetation of southern Africa: Patterns and implications, Glob. Change Biol., 10, 350–358, https://doi.org/10.1111/j.1365-2486.2003.00702.x, 2004.
Turekian, V. C., MacKo, S., Ballentine, D., Swap, R. J., and Garstang, M.: Causes of bulk carbon and nitrogen isotopic fractionations in the products of vegetation burns: Laboratory studies, Chem. Geol., 152, 181–192, https://doi.org/10.1016/S0009-2541(98)00105-3, 1998.
Umezawa, T., Aoki, S., Kim, Y., Morimoto, S., and Nakazawa, T.: Carbon and hydrogen stable isotopic ratios of methane emitted from wetlands and wildfires in Alaska: Aircraft observations and bonfire experiments, J. Geophys. Res.-Atmos., 116, 1–15, https://doi.org/10.1029/2010JD015545, 2011.
Urbanski, S.: Forest Ecology and Management Wildland fire emissions, carbon, and climate: Emission factors, Forest Ecol. Manag., 317, 51–60, https://doi.org/10.1016/j.foreco.2013.05.045, 2014.
Urbanski, S. P.: Combustion efficiency and emission factors for wildfire-season fires in mixed conifer forests of the northern Rocky Mountains, US, Atmos. Chem. Phys., 13, 7241–7262, https://doi.org/10.5194/acp-13-7241-2013, 2013.
van der Velde, I. R., van der Werf, G. R., Houweling, S., Eskes, H. J., Veefkind, J. P., Borsdorff, T., and Aben, I.: Biomass burning combustion efficiency observed from space using measurements of CO and NO2 by the TROPOspheric Monitoring Instrument (TROPOMI), Atmos. Chem. Phys., 21, 597–616, https://doi.org/10.5194/acp-21-597-2021, 2021.
van der Werf, G. R., Randerson, J. T., Giglio, L., van Leeuwen, T. T., Chen, Y., Rogers, B. M., Mu, M., van Marle, M. J. E., Morton, D. C., Collatz, G. J., Yokelson, R. J., and Kasibhatla, P. S.: Global fire emissions estimates during 1997–2016, Earth Syst. Sci. Data, 9, 697–720, https://doi.org/10.5194/essd-9-697-2017, 2017.
van Leeuwen, T. T. and van der Werf, G. R.: Spatial and temporal variability in the ratio of trace gases emitted from biomass burning, Atmos. Chem. Phys., 11, 3611–3629, https://doi.org/10.5194/acp-11-3611-2011, 2011.
Vernooij, R., Giongo, M., Borges, M. A., Costa, M. M., Barradas, A. C. S., and van der Werf, G. R.: Intraseasonal variability of greenhouse gas emission factors from biomass burning in the Brazilian Cerrado, Biogeosciences, 18, 1375–1393, https://doi.org/10.5194/bg-18-1375-2021, 2021.
Wang, L., D'Odorico, P., Ries, L., and Macko, S. A.: Patterns and implications of plant-soil δ13C and δ15N values in African savanna ecosystems, Quaternary Res., 73, 77–83, https://doi.org/10.1016/j.yqres.2008.11.004, 2010.
Wang, Z., Chappellaz, J., Park, K., and Mak, J. E.: Large Variations in Southern Hemisphere Biomass Burning During the Last 650 Years, Science, 330, 1663–1666, https://doi.org/10.1126/science.1197257, 2010.
Ward, D. E. and Radke, L. F.: Emissions Measurements from Vegetation Fires: A Comparative Evaluation of Methods and Results, in: Fire Environ. Ecol. Atmos. Clim. Importance Veg. Fires, edited by: Crutzen, P. J. and Goldammer, J. G., John Wiley & Sons, 53–76, 1993.
Weigt, R. B., Bräunlich, S., Zimmermann, L., Saurer, M., Grams, T. E. E., Dietrich, H. P., Siegwolf, R. T. W., and Nikolova, P. S.: Comparison of δ18O and δ13C values between tree-ring whole wood and cellulose in five species growing under two different site conditions, Rapid Commun. Mass Sp., 29, 2233–2244, https://doi.org/10.1002/rcm.7388, 2015.
Wilson, A. T. and Grinsted, M. J.: in cellulose and lignin as palaeothermometers, Nature, 265, 133–135, 1977.
Wynn, J. G., Duvert, C., Bird, M. I., Munksgaard, N. C., Setterfield, S. A., and Hutley, L. B.: Land transformation in tropical savannas preferentially decomposes newly added biomass, whether C3 or C4 derived, Ecol. Appl., 30, 1–16, https://doi.org/10.1002/eap.2192, 2020.
Yamada, K., Ozaki, Y., Nakagawa, F., Sudo, S., Tsuruta, H., and Yoshida, N.: Hydrogen and carbon isotopic measurements of methane from agricultural combustion: Implications for isotopic signatures of global biomass burning sources, J. Geophys. Res.-Atmos., 111, 1–12, https://doi.org/10.1029/2005JD006750, 2006.
Yamada, K., Hattori, R., Ito, Y., Shibata, H., and Yoshida, N.: Carbon isotopic signatures of methanol and acetaldehyde emitted from biomass burning source, Geophys. Res. Lett., 36, L18807, https://doi.org/10.1029/2009GL038962, 2009.
Yang, H., Yan, R., Chen, H., Lee, D. H., and Zheng, C.: Characteristics of hemicellulose, cellulose and lignin pyrolysis, Fuel, 86, 1781–1788, https://doi.org/10.1016/j.fuel.2006.12.013, 2002.
Yao, P., Ni, H., Paul, D., Masalaite, A., Huang, R.-J., Meijer, H. A. J., and Dusek, U.: An automated method for thermal-optical separation of aerosol organic/elemental carbon for 13C analysis at the sub-µg C level: A comprehensive assessment, Sci. Total Environ., 804, 150031, https://doi.org/10.1016/j.scitotenv.2021.150031, 2022.
Yokelson, R. J., Susott, R., Ward, D. E., Reardon, J., and Griffith, D. W. T.: Emissions from smoldering combustion of biomass measured by open-path Fourier transform infrared spectroscopy, J. Geophys. Res.-Atmos., 102, 865–877, 1997.
Yokelson, R. J., Burling, I. R., Gilman, J. B., Warneke, C., Stockwell, C. E., de Gouw, J., Akagi, S. K., Urbanski, S. P., Veres, P., Roberts, J. M., Kuster, W. C., Reardon, J., Griffith, D. W. T., Johnson, T. J., Hosseini, S., Miller, J. W., Cocker III, D. R., Jung, H., and Weise, D. R.: Coupling field and laboratory measurements to estimate the emission factors of identified and unidentified trace gases for prescribed fires, Atmos. Chem. Phys., 13, 89–116, https://doi.org/10.5194/acp-13-89-2013, 2013.
Zech, M., Mayr, C., Tuthorn, M., Leiber-Sauheitl, K., and Glaser, B.: Oxygen isotope ratios (18O/16O) of hemicellulose-derived sugar biomarkers in plants, soils and sediments as paleoclimate proxy I: Insight from a climate chamber experiment, Geochim. Cosmochim. Ac., 126, 614–623, https://doi.org/10.1016/j.gca.2013.10.048, 2014.
Zenker, K., Sirignano, C., Riccio, A., Chianese, E., Calfapietra, C., Prati, M. V., Masalaite, A., Remeikis, V., Mook, E., Meijer, H. A. J., and Dusek, U.: δ13C signatures of organic aerosols: Measurement method evaluation and application in a source study, J. Aerosol Sci., 145, 105534, https://doi.org/10.1016/j.jaerosci.2020.105534, 2020.
Zheng, B., Chevallier, F., Ciais, P., Yin, Y., and Wang, Y.: On the Role of the Flaming to Smoldering Transition in the Seasonal Cycle of African Fire Emissions, Geophys. Res. Lett., 45, 11,998-12,007, https://doi.org/10.1029/2018GL079092, 2018.
Zhu, X. C., Di, D. R., Ma, M. G., and Shi, W. Y.: Stable isotopes in greenhouse gases from soil: A review of theory and application, Atmosphere-Basel, 10, 1–14, https://doi.org/10.3390/atmos10070377, 2019.