the Creative Commons Attribution 4.0 License.
the Creative Commons Attribution 4.0 License.
 | 25 Feb 2022
Surface ozone impacts on major crop production in China from 2010 to 2017
Dianyi Li
Drew Shindell
Dian Ding
Lin Zhang
Yuqiang Zhang
Exposure to elevated surface ozone is damaging to crops. In this study, we performed an analysis of temporal and spatial distributions of relative yield losses (RYLs) attributable to surface ozone for major crops in China from 2010 to 2017, by applying AOT40 metrics (hourly ozone concentration over a threshold of 40 ppbv during the growing season) simulated using a chemical transport model. The major crops in China include wheat, rice (including double early and late rice, and single rice), maize (including north and south maize), and soybean. The aggregated production and associated economic losses in China and major provinces were evaluated by combing annual crop production yields and crop market prices. We estimated that the national annual average AOT40 in China increased from 21.98 ppm h in 2010 to 23.85 ppm h in 2017, with a peak value of 35.69 ppm h in 2014, as simulated with the model. There is significant spatial heterogeneity for the AOT40 and RYLs across the four crops due to the seasonal ozone variations. We calculated that national mean RYLs for wheat, rice, maize, and soybean were 11.45 %–19.74 %, 7.59 %–9.29 %, 0.07 %–3.35 %, and 6.51 %–9.92 %, respectively, from 2010 to 2017. The associated crop yield losses were estimated at 13.81–36.51, 16.89–20.03, 4.59–8.17, and 1.09–1.84 million metric tons (Mt) respectively, which accounted for annual average economic loss of USD 9.55 billion, USD 8.53 billion, USD 2.23 billion, and USD 1.16 billion individually over the 8 years. Our study provides the first long-term quantitative estimation of crop yield losses and their economic cost from surface ozone exposure in China before and after the China Clean Air Act in 2013, and improves understanding of the spatial sensitivity of Chinese crops to ozone impacts.
- Article
(5008 KB) - Full-text XML
-
Supplement
(2636 KB) - BibTeX
- EndNote


Tropospheric ozone, as a secondary air pollutant, is harmful to both human and vegetation health (Booker et al., 2009; Van Dingenen et al., 2009; Brauer et al., 2016). Since the 19th century, rapid industrialization and urbanization have significantly elevated the background ozone concentration in the Northern Hemisphere (Royal Society, 2008). As a greenhouse gas that is not directly emitted by human activities, tropospheric ozone is mainly generated from sunlight-driven photochemical oxidation of volatile organic compounds (VOC), carbon monoxide, and methane in the presence of nitrogen oxides (NOx) (Atkinson, 2000). In the past few decades, the strong linkage between fossil fuel usage and economic growth boosted emissions of ozone precursors in China. Since 2012, due to the severe fine particulate matter (PM2.5) pollution in China, the Chinese government has adopted a stringent emission and pollution monitoring and control policy (the so-called Air Pollution Prevention and Control Action Plan (APPCAP), L. Zhang et al., 2016). The APPCAP has led to a significant decline of air pollutants emissions, including a 17 % decrease of anthropogenic emission of NOx, 27 % of CO, and 62 % of SO2 from 2010 to 2017 (Zheng et al., 2018). These significant emissions reductions have led to a 33 % decline of annual PM2.5 concentration in China from 2013 to 2017, and avoided 0.41 million premature deaths associated with the ambient PM2.5 reductions (Zhang et al., 2019). At the same time, however, anthropogenic emission of VOC increased by 11 % due to the lack of effective emission controls (Zheng et al., 2018), and surface observations show that the ozone concentration in China is still increasing (Wang et al., 2019, 2020; Li et al., 2018, 2019; Lu et al., 2018, 2020). The increasing trend of surface ozone may be partially explained by its decreased titration due to the decreased NOx emissions, especially in megacities (Liu and Wang, 2020a, b; Li et al., 2022), or decreasing PM2.5 which scavenges the radical precursors of ozone (Li et al., 2019, 2020), though this chemical pathway is still under debate (Tan et al., 2020).
The growth of ozone concentrations in China has led to emerging concerns (Lu et al., 2018, 2020). As indicated in many biological and ecological studies, high ozone concentration can seriously damage vegetation and substantially impair crop yield, which leads to economic costs and threatens food security (Krupa et al., 1998; Mills et al., 2007; Van Dingenen et al., 2009, 2018; Avnery et al., 2011a, b). A previous study estimated that for the year 2000, surface ozone exposure induced global crop yield losses of 3.9 %–15 % for wheat, 2.2 %–5.5 % for maize, and 8.5 %–14.0 % for soybeans, with a global crop production loss of 79–121 million metric tons (Mt), based on different field-based concentration–response studies (Avnery et al., 2011a). For eastern Asia, the ozone-induced maize reduction loss was around 3.8 %, 17 % for wheat, and as high as 21 % for soybean in 2000 (Avnery et al., 2011a). Throughout China specifically, exposure to surface ozone in 2020 was estimated to decrease production of wheat (including both winter and spring wheat) by 6.4 %–14.9 % (Tang et al., 2013). Zhang et al. (2017) estimated that the current O3 level in 2014 could cause annual soybean yields loss of 23.4 %–30.2 % in Northeast China. By using surface ozone concentration simulated from a regional chemical transport model, Lin et al. (2018) estimated that exposure to surface ozone in 2014 induced relative yield losses between 8.5 % and 14 % for winter wheat, 9 %–15.0 % for rice, and 2.2 %–5.5 % for maize, and then could cause 78.4 Mt of production losses from all crops. By using observational data, the exposure to surface ozone in the North China Plain (NCP) was estimated to cause an annual average of USD 2.3 billion loss for maize, and USD 9.3 billion loss for wheat from 2014 to 2017 (Feng et al., 2020; Hu et al., 2020).
To date, very few studies have investigated the long-term trends and spatial patterns of ozone impacts on crop production in China. Previous studies have mainly focused on a specific region of China, such as the NCP (Zhang et al., 2017; Hu et al., 2020; Feng et al., 2020), or the Yangtze River Delta (Wang et al., 2012). In this study, we focus on a long-term ozone-exposure impact analysis from 2010 to 2017 in China to assess the yield losses of four major crops (wheat, maize, rice, and soybean) and evaluate their associated economic losses. The specific period of 2010–2017 was chosen to cover the emission changes before and after the establishment of the APPCAP in 2013. Previous studies have reported crop yield losses in one year (e.g., Lin et al., 2018; Yi et al., 2018; Feng et al., 2019a, b), or several years after the APPCAP (Zhao et al., 2020; Wang et al., 2022). Our study aims to present a comprehensive analysis of ozone-induced crop yield losses and economic impacts in the agriculture sector before and after the China APPCAP. Such an analysis is expected to provide scientific support to policymakers for their decision making.
2.1 Model simulated hourly ozone and surface observation in China
Hourly ozone concentrations over China from 2010 to 2017 were simulated by using a state-of-the-art global chemistry model (CAM_Chem, Lamarque et al., 2012). The original model was run at a horizontal resolution of 1.9∘ × 2.5∘ (Y. Zhang et al., 2016, 2021a, b), and then regridded to 1∘ × 1∘ to match the crop production data (see Sect. 2.2). The anthropogenic emissions in China from 2010 to 2017 are from the Multi-resolution Emission Inventory (MEIC) developed by Tsinghua University (http://meicmodel.org/, last access: 15 July 2020). Emissions outside of China are from the Community Emissions Data System (CEDS); these were prepared for the Coupled Model Intercomparison Project Phase 6 (CMIP6) experiments (Hoesly et al., 2018). Hourly surface ozone data simulated by the model were saved from 2010 to 2017. We then adjusted the model simulated surface ozone from the lowest grid box height (usually above 30 m) to the crop height (usually 1–3 m at the ambient observation sites), which usually reduced the simulated ozone concentration by 30 %–50 % (Van Dingenen et al., 2009; Zhang et al., 2012).
We first evaluated the model's performance by comparing the model simulated annual average maximum daily 8 h average (MDA8) O3 with the surface observations from 2013 to 2017, which were downloaded from National Environmental Monitoring Center (CNEMC) Network (http://106.37.208.233:20035/, last access: 22 February 2022). CNEMC collects at least 100 million environmental monitoring data from 1497 established air quality monitoring stations annually for national environmental quality assessment (Lu et al., 2018, 2020). Ozone observation data before 2013 were not available. In general, our model captures spatial patterns of ozone distribution in China (Fig. S6 in Zhang et al., 2021b), but overestimates the annual MDA8 O3 concentration, with mean bias of 5.7 ppbv and normalized mean bias of 13.7 % for 5-year average from 2013 to 2017 (Table 1 in Zhang et al., 2021b).
2.2 Ozone crop metrics
In order to assess the crop yield loss from exposure to surface ozone, different crop-ozone metrics have been developed to measure the chronic ozone exposure risk of vegetation (e.g., Mauzerall and Wang, 2001; Van Dingenen et al., 2009; Avnery et al., 2011a, b). In this study, we adopted the ozone metric of AOT40, which is the European standard for the protection of vegetation, and also a commonly used and reliable indicator in both America and Asia for crop yield assessment (Tang et al., 2013; Lefohn et al., 2018; Lin et al., 2018; Feng et al., 2019a, b). The AOT40 metric is also considered to be more accurate at high levels of ozone concentration (Tuovinen, 2000; Hollaway et al., 2012; Lin et al., 2018), such as China (Lu et al., 2018, 2020). AOT40 is calculated by summing up hourly ozone exposure concentrations over the threshold of 40 ppbv during the 12 h, 08:00–19:59 China Standard Time (Eq. 1). By including concentrations over 40 ppbv, AOT40 is able to sensitively capture the influence of extremely high ozone concentration (Van Dingenen et al., 2009; Hollaway et al., 2012). In a synthesis study by Mills et al. (2007), the AOT40 showed a statistically significant relationship with many crops.
In Eq. (1), [O3]i denotes the hourly ozone concentration level during daylight hours (08:00–19:59, GMT+8) at each grid cell (i), n is the total hours of growing season counted as the 3-month harvest season based on the crop calendar (Lin et al., 2018), or 75 d composed by 44 and 31 d before and after the anthesis dates (Feng et al., 2019a, b, 2020). Growing seasons for the major crops in China are indicated in Table 1, and acquired from Major World Crop Areas and Climate Profiles (MWCACP), and the Food and Agriculture Organization of the United Nation (FAO) (Lin et al., 2018; Zhao et al., 2020). In this study, we focused on four major crops in China – wheat, rice (including double early rice, double late rice, and single rice), maize (including north maize and south maize), and soybean.
Table 1Overview of the concentration–response function for the relative yields (RY) for ozone exposure on different crops.

a Double early/late rice is considered to grow in Zhejiang, Jiangxi, Anhui, Hunan, Hubei, Fujian, Guangdong, Guangxi, Hainan, Yunnan, Hong Kong, Macao and Taiwan (Lin et al., 2018; Zhao et al., 2020). b Single rice is considered to grow in Heilongjiang, Jilin, Liaoning, Hebei, Beijing, Tianjin, Shanxi, Shaanxi, Ningxia, Gansu, Xinjiang, Nei Mongol, Shanghai, Jiangsu, Zhejiang, Anhui, Fujian, Jiangxi, Shandong, Henan, Hubei, Hunan, Guangxi, Sichuan, Chongqing, Guizhou and Yunnan (Lin et al., 2018; Zhao et al., 2020). c North maize is considered to grow in northern provinces, including Heilongjiang, Jilin, Liaoning, Beijing, Tianjin, Hebei, Henan, Shandong, Shanxi, Shaanxi, Gansu, Qinghai, Ningxia, Nei Mongol, Xinjiang and Anhui (Zhao et al., 2020). d South maize is in southern provinces only, including Shanghai, Jiangsu, Zhejiang, Fujian, Jiangxi, Hubei, Hunan, Guangdong, Guangxi, Sichuan, Chongqing, Guizhou, Xizang, Yunnan, Hainan, Hong Kong, Macao and Taiwan (Zhao et al., 2020).
2.3 Crop relative yields and economic losses
In our study, relative yield (RY) was calculated based on the exposure-response function (ERF) provided by Mills et al. (2007), where RY is expressed as a percentage and AOT40 is in ppm h (Table 1). The ERF for north maize and south maize is the same with different growing seasons and growing areas (Table 1; Zhao et al., 2020). The same ERF applies to all the rice varieties, with differences in growing season and provinces as well (Table 1).
The relative yield loss (RYLi) in each grid cell was then calculated using Eq. (2):
The crop production loss (CPLi) was then calculated using Eq. (3) (Wang and Mauzerall, 2004; Van Dingenen et al., 2009; Avnery et al., 2011a, b):
where CPi is the annual crop production with a unit of 1000 t yr−1. Grid cell annual crop production data for major crops were originally developed by Van Dingenen et al. (2009) from USDA national and regional production numbers and Agro-Ecological Zones suitability index. These contain global crop production data for 2000 with horizontal resolution of 1∘ × 1∘. We then scaled the annual national total crop yields in China to match the yearly data from the Statistical Yearbook of China from 2010 to 2017 (http://www.stats.gov.cn/tjsj/ndsj/2019/indexeh.htm, last access: 9 December 2021). For provinces growing both double and single rice (such as Zhejiang and Jiangxi, see the highlighted bold notes in Table 1), the fractions for double and single rice production were scaled based on the production data from the National Bureau of Statistics (http://data.stats.gov.cn, last access: 26 March 2020). For provinces growing double early or late rice only, the rice production was assumed to be equal for each rice (Zhao et al., 2020).
National average relative yields loss (ARYL, unit of %), is then calculated based on CPLi and CPi to identify the fractions of production loss in total crop production (Eq. 4):
National economics costs for each crops (ECp) were then quantified by multiplying the market price in each year using Eq. (5):
where Crop Pricep stands for the annual market price for each crop in China every year with a unit of USD Mt−1. Crop market prices were acquired from FAOSTAT (http://www.fao.org/faostat/, last access: 26 March 2020; Feng et al., 2019a), and are shown in Table S1. The market price in 2017 is only available for maize, so we used the 3-year average from 2014 to 2016 to calculate the economic losses in 2017 for the other three crops. From 2010 to 2017, soybean had the highest crop market price, ranging from 677.9 to 869.7 USD t−1, followed by rice (296.6 to 559.9 USD t−1), wheat (279.5 to 391.4 USD t−1), and maize (252.2 to 489.1 USD t−1). For soybean, wheat, and maize, the market price usually peaked in 2014 or 2015, which contributed to the peak economic loss in these years (see Sect. 3.3).
3.1 Temporal and spatial distribution of accumulated ozone change
Since the surface ozone in China has a distinct seasonal variation, thus making the direct comparison of the accumulated AOT40 values between the four crops impossible (Table 1), here we present the temporal and spatial distribution of annual accumulated AOT40 in China from 2010 to 2017. From Fig. 1, we see that the 8-year average annual accumulated AOT40 values are usually larger than 16 ppm h, with hotspots identified in West China (40–56 ppm h), Beijing-Tianjin-Hebei (a.k.a. JJJ, 32–40 ppm h), and Northeast China (24–32 ppm h), as well as Yangtze Delta Region (a.k.a. YRD, Fig. S1). At the provinces level, Xizang (41.47 ppm h for 8-year average), Tianjin (34.79 ppm h), and Qinghai (34.51 ppm h) are the top three provinces with the highest annual accumulated AOT40 (Table S2). For temporal changes, we conclude that the national annual accumulated AOT40 increased from 21.98 ppm h in 2010 to 23.85 ppm h in 2017, peaking in 2014 with 35.69 ppm h (Fig. 2). The peak value of the annual accumulated AOT40 in 2014 and 2015 was mainly caused by the high ozone values in western China (Fig. S1), dominantly resulting from the transboundary transport from foreign sources driven by strong westerly winds and stratosphere–troposphere exchange (Zhang et al., 2008; Wang et al., 2011; Ni et al., 2018; Lu et al., 2019).
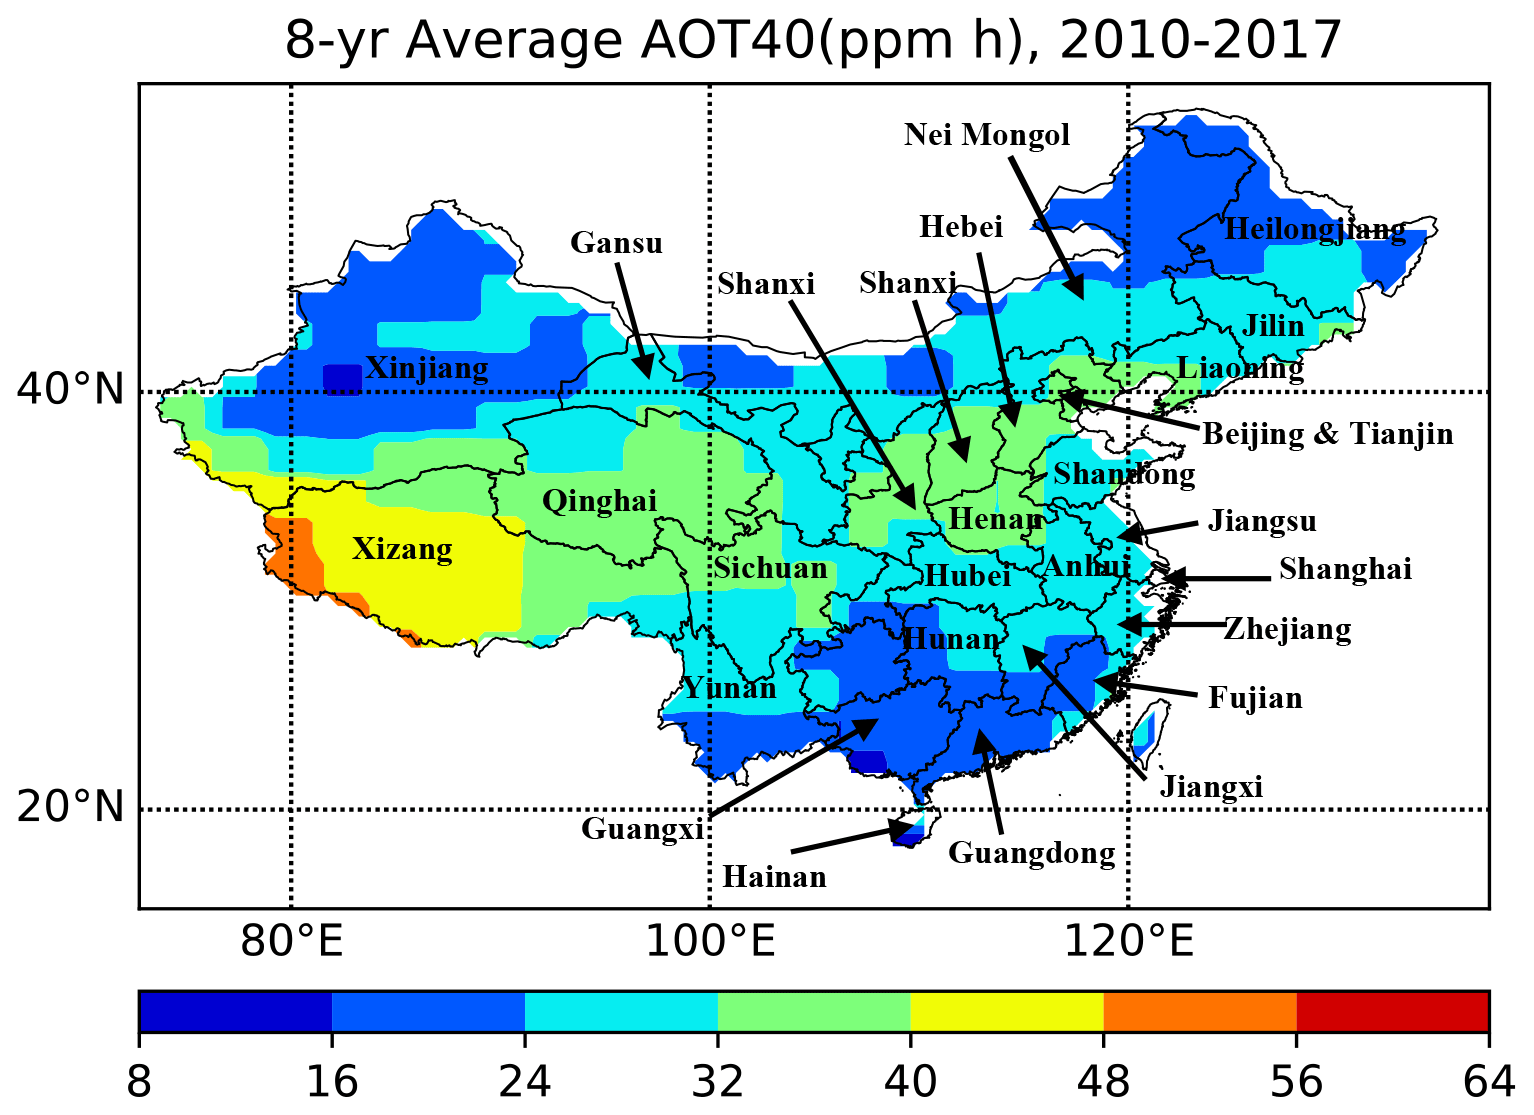
Figure 1Spatial distribution of annual accumulated AOT40 (ppm h) in China for 8-year average (from 2010 to 2017).
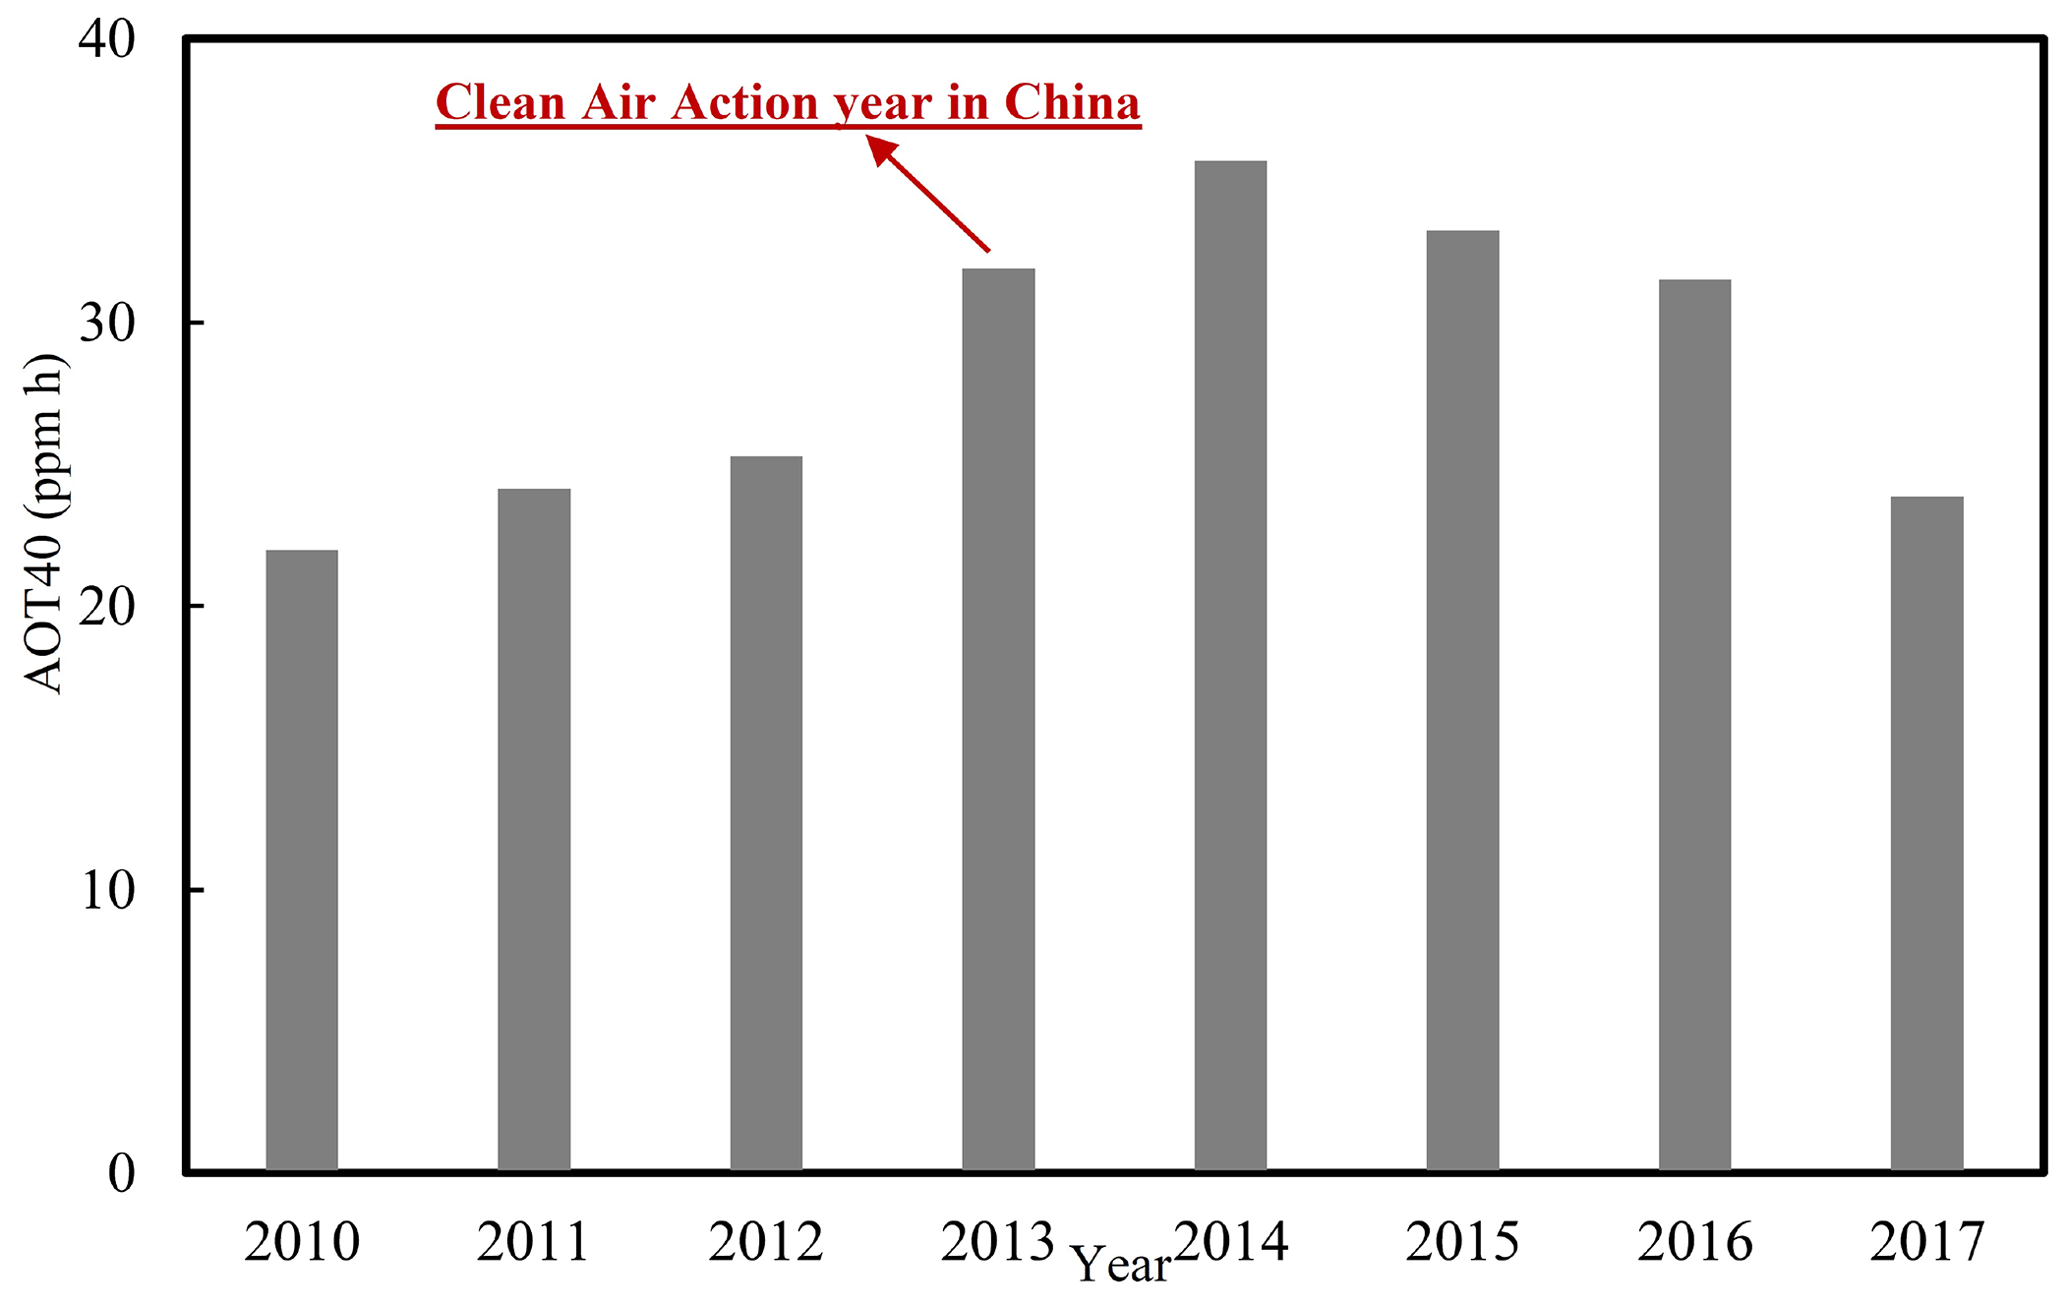
Figure 2The national annual accumulated AOT40 values in China from 2010 to 2017. The unit is ppm h.
3.2 Growing-season ozone concentration and relative yield loss (RYL)
The accumulated AOT40 values vary among the four crops, mainly determined by the seasonality of ozone concentrations. During the growing season for wheat (March, April and May), the AOT40 values revealed to be higher in the Tibet Plateau and YRD, and lower in South China, such as Hainan, Guangdong and Guangxi (Fig. 3a; Table S3). At province level (Table S3), the highest AOT40 is in Xizang (14.99 ppm h), following by Yunan (12.60 ppm h) and Qinghai (11.77 ppm h), with the lowest values in Hainan (4.43 ppm h). We also noticed that the AOT40 values for wheat were decreasing in West China, but increasing in Central and East China from 2010 to 2017 (Fig. S2), which were caused by a combination of unfavorable meteorological conditions and decreased anthropogenic emissions (Liu and Wang, 2020a). The RYL for wheat has a similar spatial pattern as AOT40, highest in Xizang (25.14 %), and lowest in Hainan (8.13 %) for the 8-year average (Table S3).
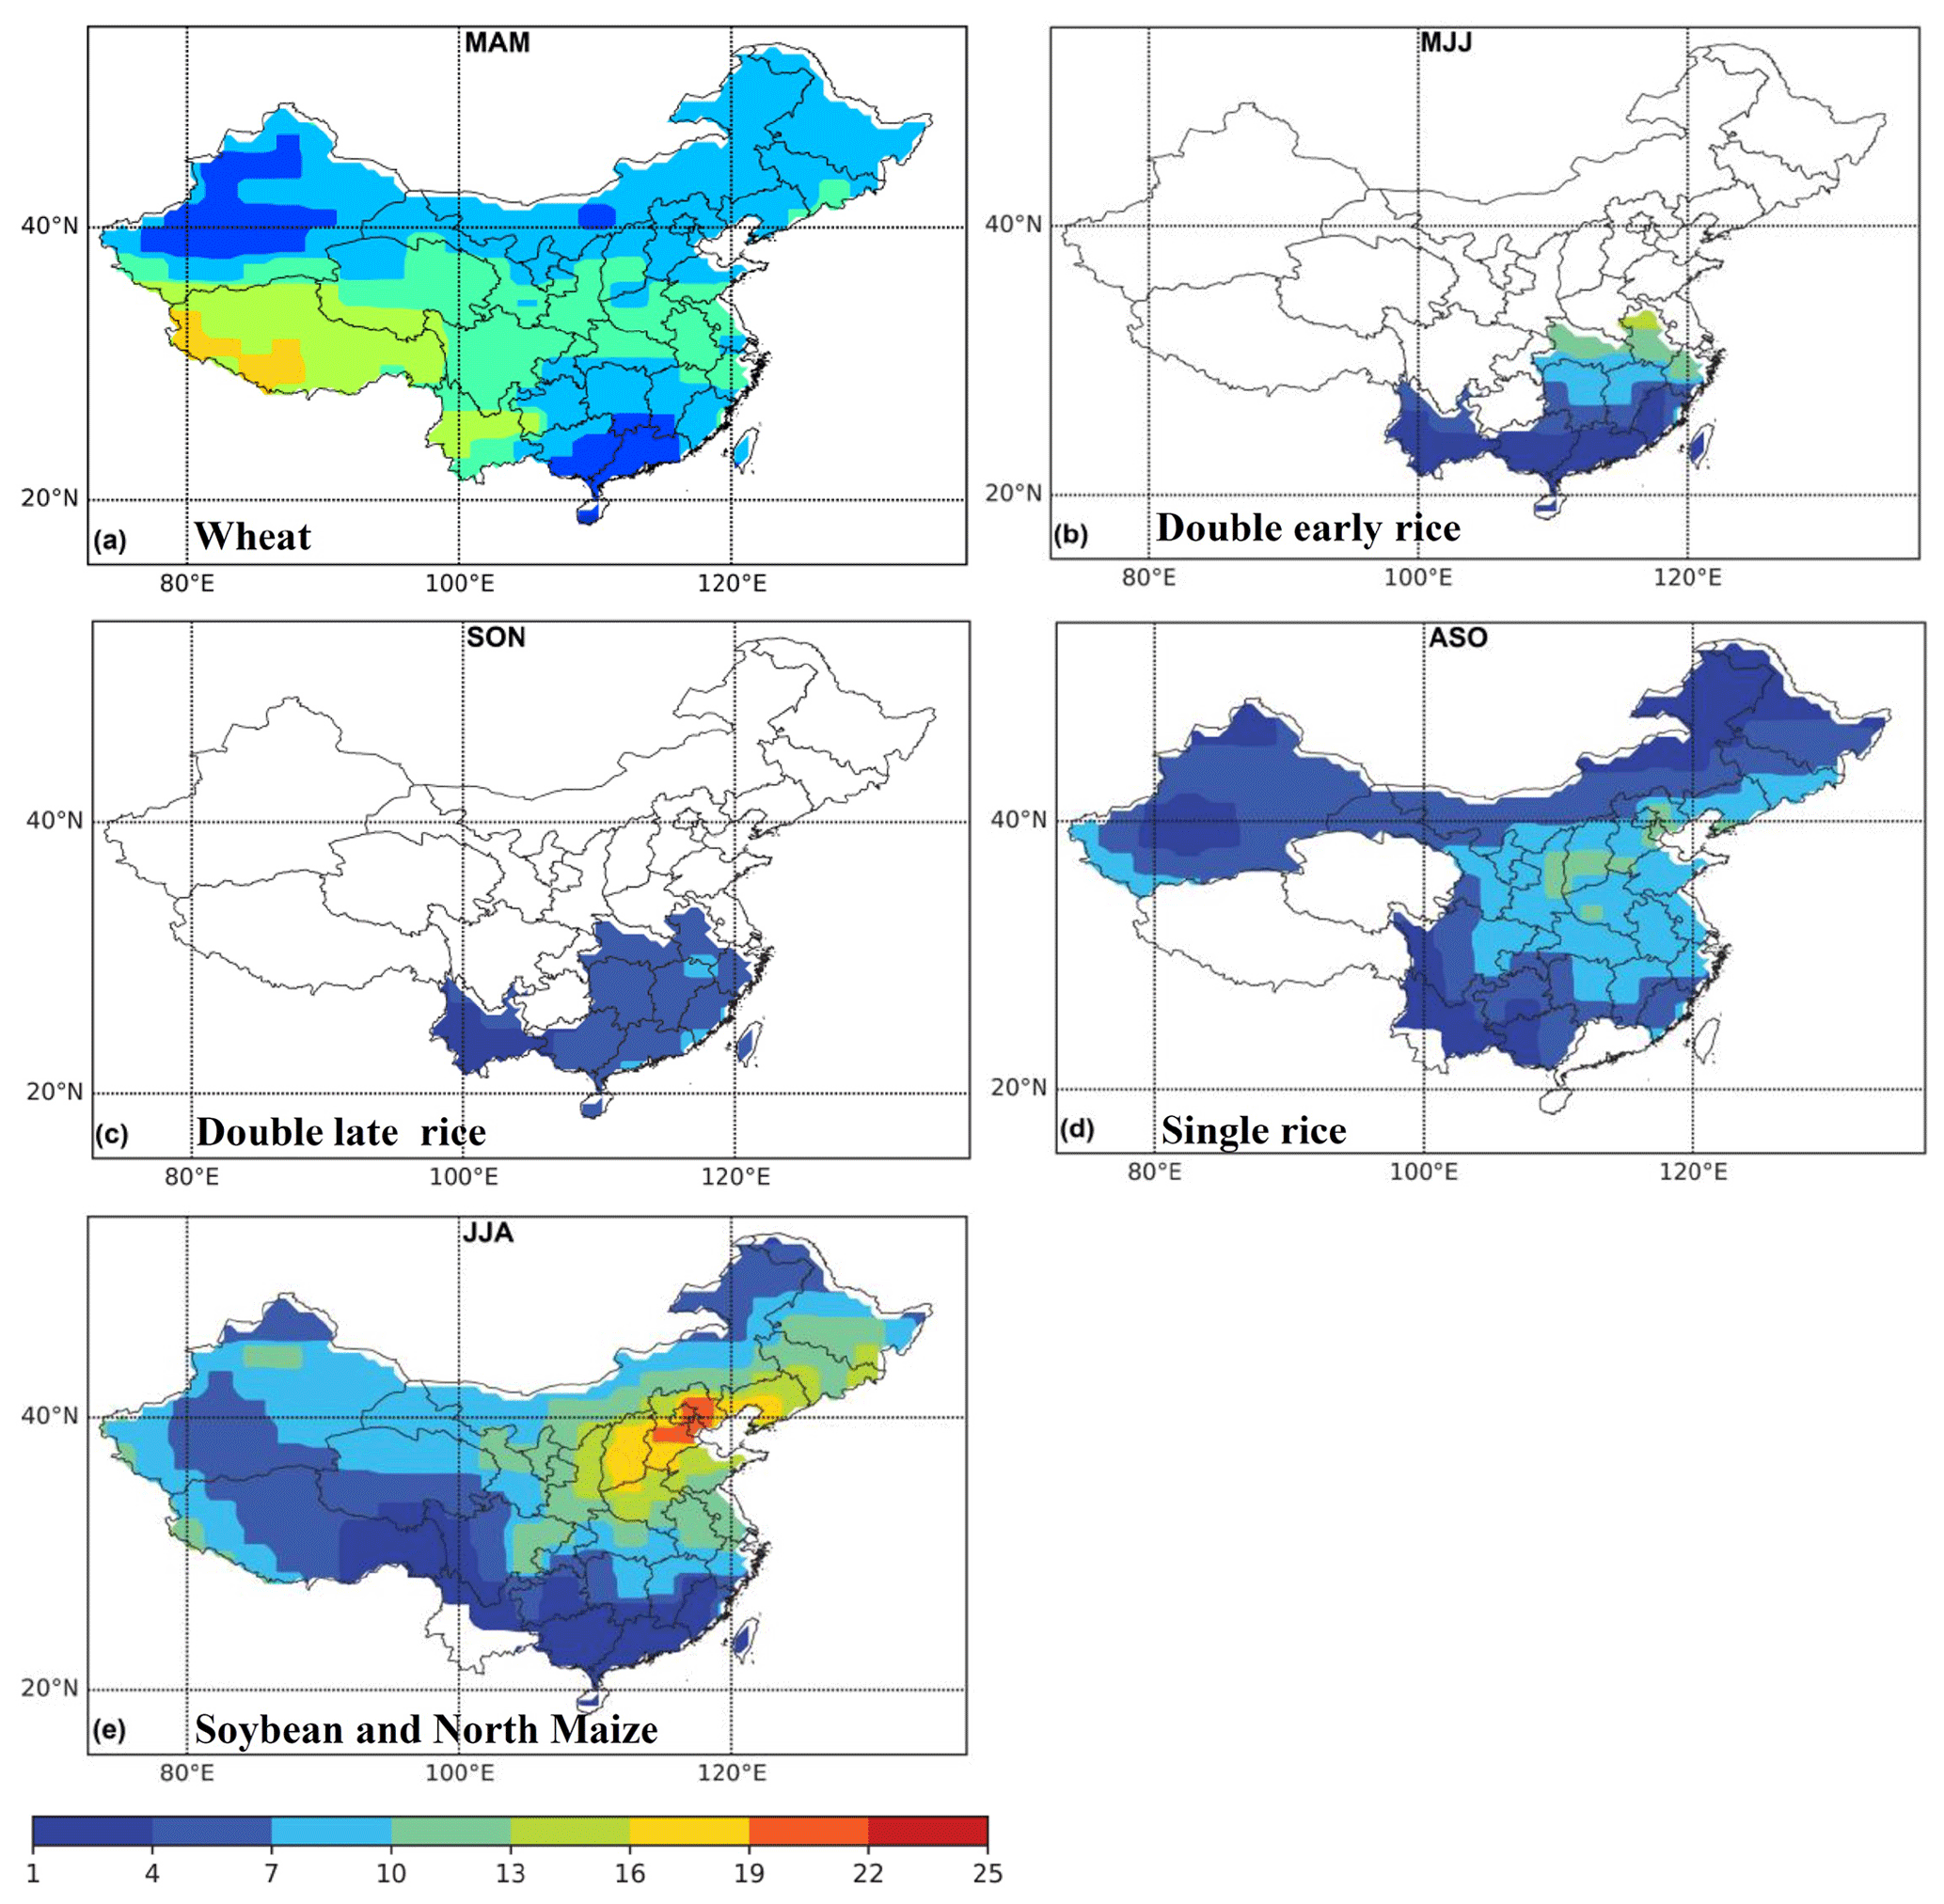
Figure 3The spatial distribution of 8-year average growing season accumulated AOT40 for (a) wheat, (b) double early rice, (c) double late rice, (d) single rice and south maize, and (e) soybean and north maize. The unit is ppm h.
The AOT40 values for double early rice (May, June, July) are lower than those for wheat (Fig. 3b), with the highest values in Anhui province (12.09 ppm h), and the lowest in Hainan (1.84 ppm h; Table S4). The AOT40 values for double late rice are much lower than the early rice (Fig. 3c), with the highest values in Fujian (6.47 ppm h), and lowest in Yunan (2.86 ppm h; Table S4). The spatial distribution of AOT40 for early and late rice varies as well, with hotspots in East China for early rice and South China for late rice (Figs. S3–S4). The RYLs for the double rice range from 10.71 % in Anhui to 7.11 % in Yunan for the 8-year average (Table S4). For the single rice, the NCP experiences high ozone exposure during the growing season (August, September, October), but is lower in South China (Fig. 3d). AOT40 level ranges from 1.0 ppm h (Yunnan in 2017) to 14.1 ppm h (Tianjin in 2015). Highest RYLs for the single rice are identified in the NCP, including Tianjin (8-year average RYL of 10.22 %), Shanxi (9.81 %), and Henan (9.67 %; Table S5).
Hotspots for AOT40 values for north maize during the growing season (June, July, August) are also identified in the NCP (Figs. 3e; S7), including Tianjin (20.24 ppm h), Beijing (17.92 ppm h), and Hebei (17.80 ppm h). The provincial averaged RYLs range from 0.48 % in Qinghai to 5.29 % in Tianjin (Table S6). When looking at the AOT40 values for south maize (August, September, October), we found that they are much lower than the values for north maize, with the highest in Jiangsu (8.18 ppm h for 8-year average) and lowest in Yunan (2.02 ppm h). For the spatial pattern, the AOT40 values are higher in West China, and lower in South China (Figs. 3d; S7). The 8-year averaged RYLs for each province are all below 1 % (Table S6).
The growing seasons for soybean are the same as for north maize, and thus they have the same hotspots as in NCP (Fig. 3e). For the 8-year average, the highest AOT40 values is in Tianjin (20.2 ppm h with RYL of 21.48 %), followed by Beijing (17.9 ppm h with RYL of 18.79 %), and Hebei (17.8 ppm h with RYL 18.65 %) (Table S7).
3.3 Crop production loss (CPL)
From Eq. (3), we expect that the spatial distribution of CPL among the four crops would be different from their RYLs. From the Statistical Yearbook of China, the national wheat production, mainly planted in the NCP, increased from 115.19 Mt in 2010 to 134.34 Mt in 2017 (http://www.stats.gov.cn/tjsj/ndsj/2019/indexeh.htm, last access: 9 December 2021). We estimated that, on average, 26.42 Mt of wheat were lost in China due to surface ozone exposure, ranging from 13.81 Mt in 2010 to 36.51 Mt in 2015 (Fig. 4; Table S8). Figure 5 shows the top five provinces with the highest wheat CPLs from 2010 to 2017, including Henan (5.23 Mt for 8-year average), Shandong (4.77), Hebei (2.79), Jiangsu (2.66), and Anhui (2.58). We conclude that the wheat CPLs due to ozone exposure increased from 2010 to 2017, with the peak year varying from province to province, but were generally later than 2014 (Table S8). The hotspots for wheat production losses were in the NCP, which is not consistent with the patterns of RYL (Fig. S2). This was not surprising, since the regions with high RYL, such as Xizang and Xingjiang in West China, usually have limited wheat production.
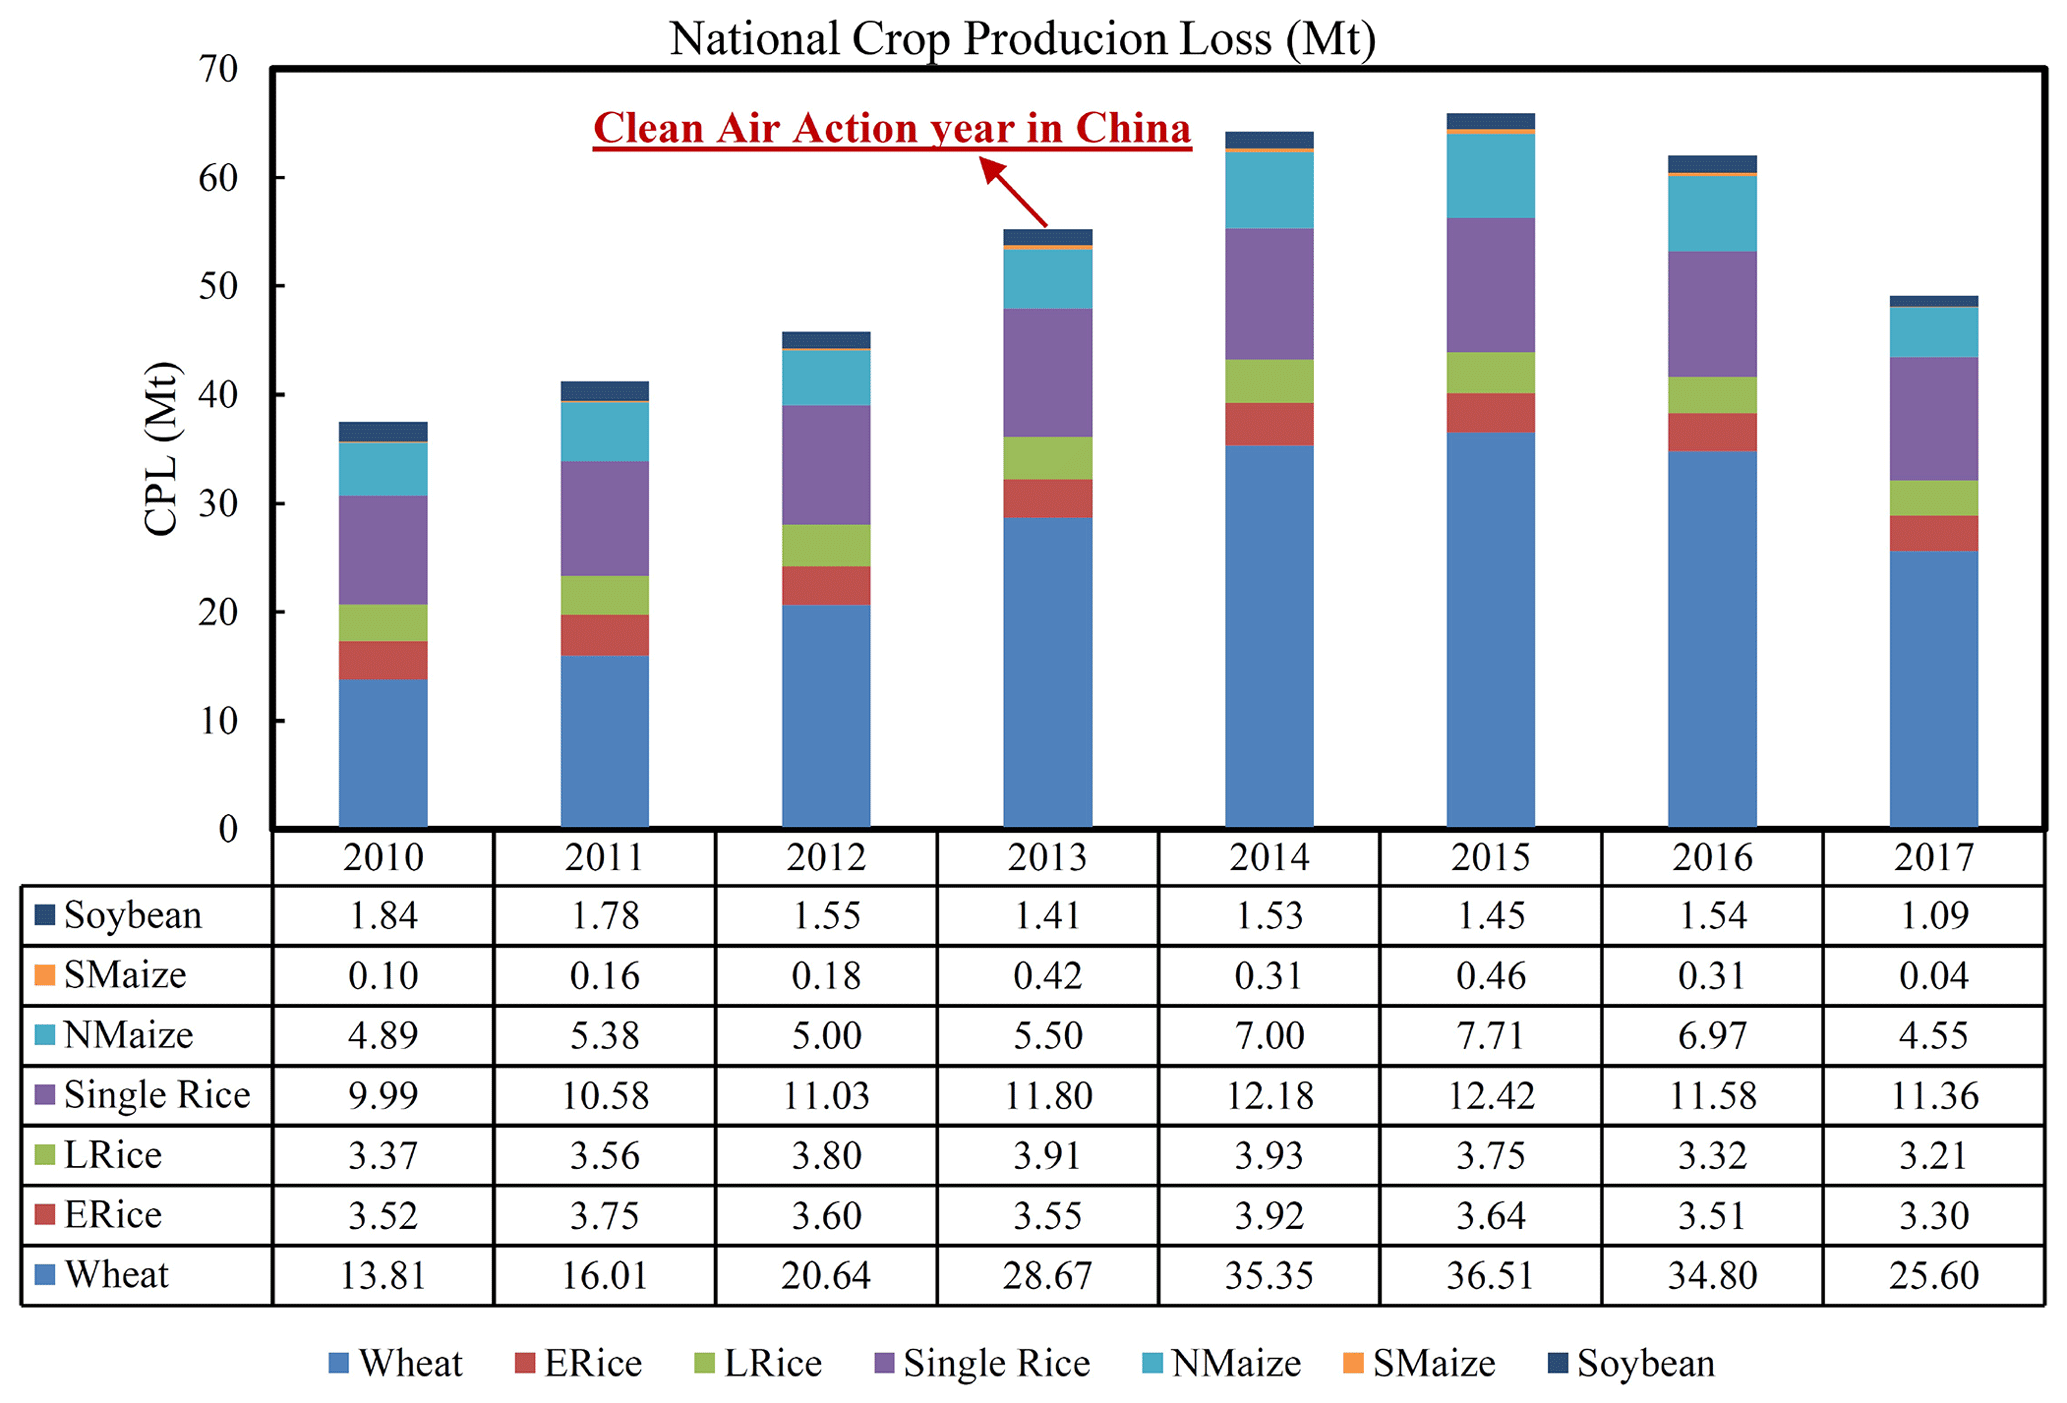
Figure 4National crop production loss (CPL) for major crops, with SMaize for south maize, NMaize for north maize, LRice for Late Rice, ERice for early rice. Unit is million metric tonnes.
National double rice (including both early and late rice) production ranged from 77.94 to 80.70 Mt from 2010 to 2017. We estimated that the national CPLs for the early rice were between 3.51 and 3.92 Mt in China, with an 8-year average of 3.60 Mt (Fig. 3; Table S9). The CPLs for the late rice are comparable with the early rice, ranging from 3.21 to 3.93 with an 8-year average of 3.61 Mt (Fig. 3; Table S10). The CPLs for double early and late rice both peaked in 2014, but had lowest values in different years (Tables S9 and S10), highlighting the seasonal variation of ozone concentration between different growing seasons (Table 1). In China, more provinces (27) grow single rice than the double rice. The CPLs for the single rice were also higher than the double rice, ranging from 10.00 to 12.42 Mt, with an 8-year average of 11.37 Mt (Fig. 3; Table S11). The leading provinces with the highest CPL for the single rice were Anhui (1.69–2.14 Mt from 2010 to 2017), Jiangsu (1.55–1.91), Hubei (1.13–1.52), and Sichuan (1.13–1.52), which all exceed 1 Mt for the 8-year average (Fig. 5; Table S11). CPLs for most provinces peaked in 2015 (Fig. 6). The annual CPLs for all the rice range from 16.89 Mt in 2010 to 20.03 Mt in 2014, with an 8-year average of 18.58 Mt.
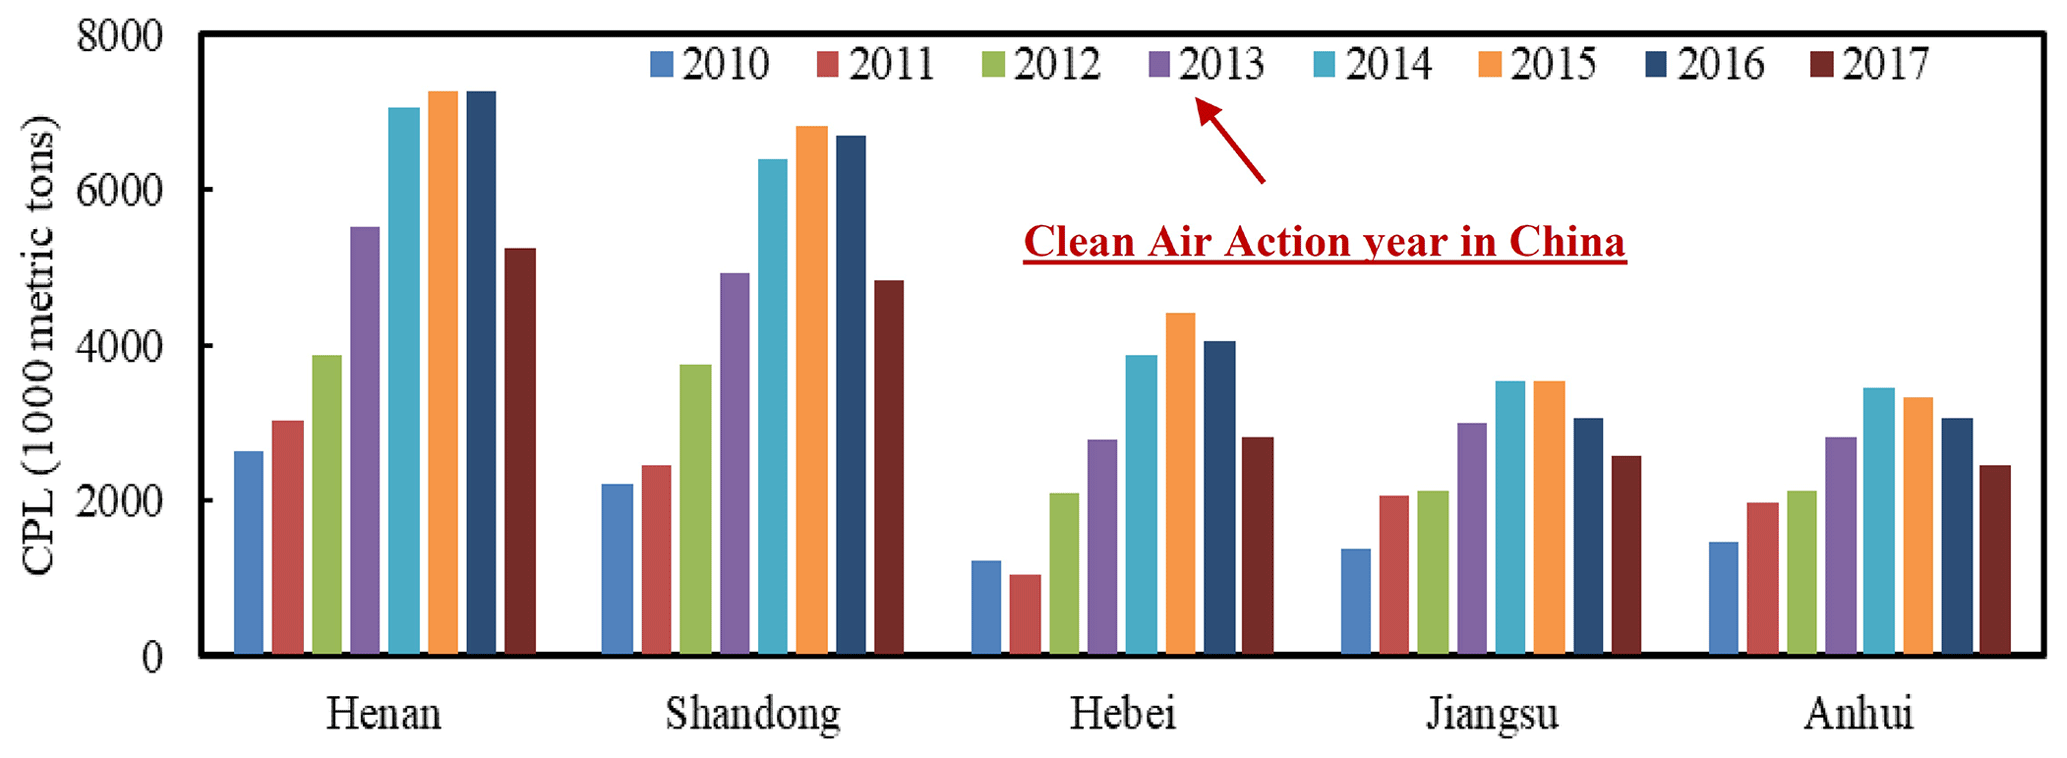
Figure 5Annual wheat production loss by province from 2010 to 2017 (1000 t) due to surface ozone exposure.
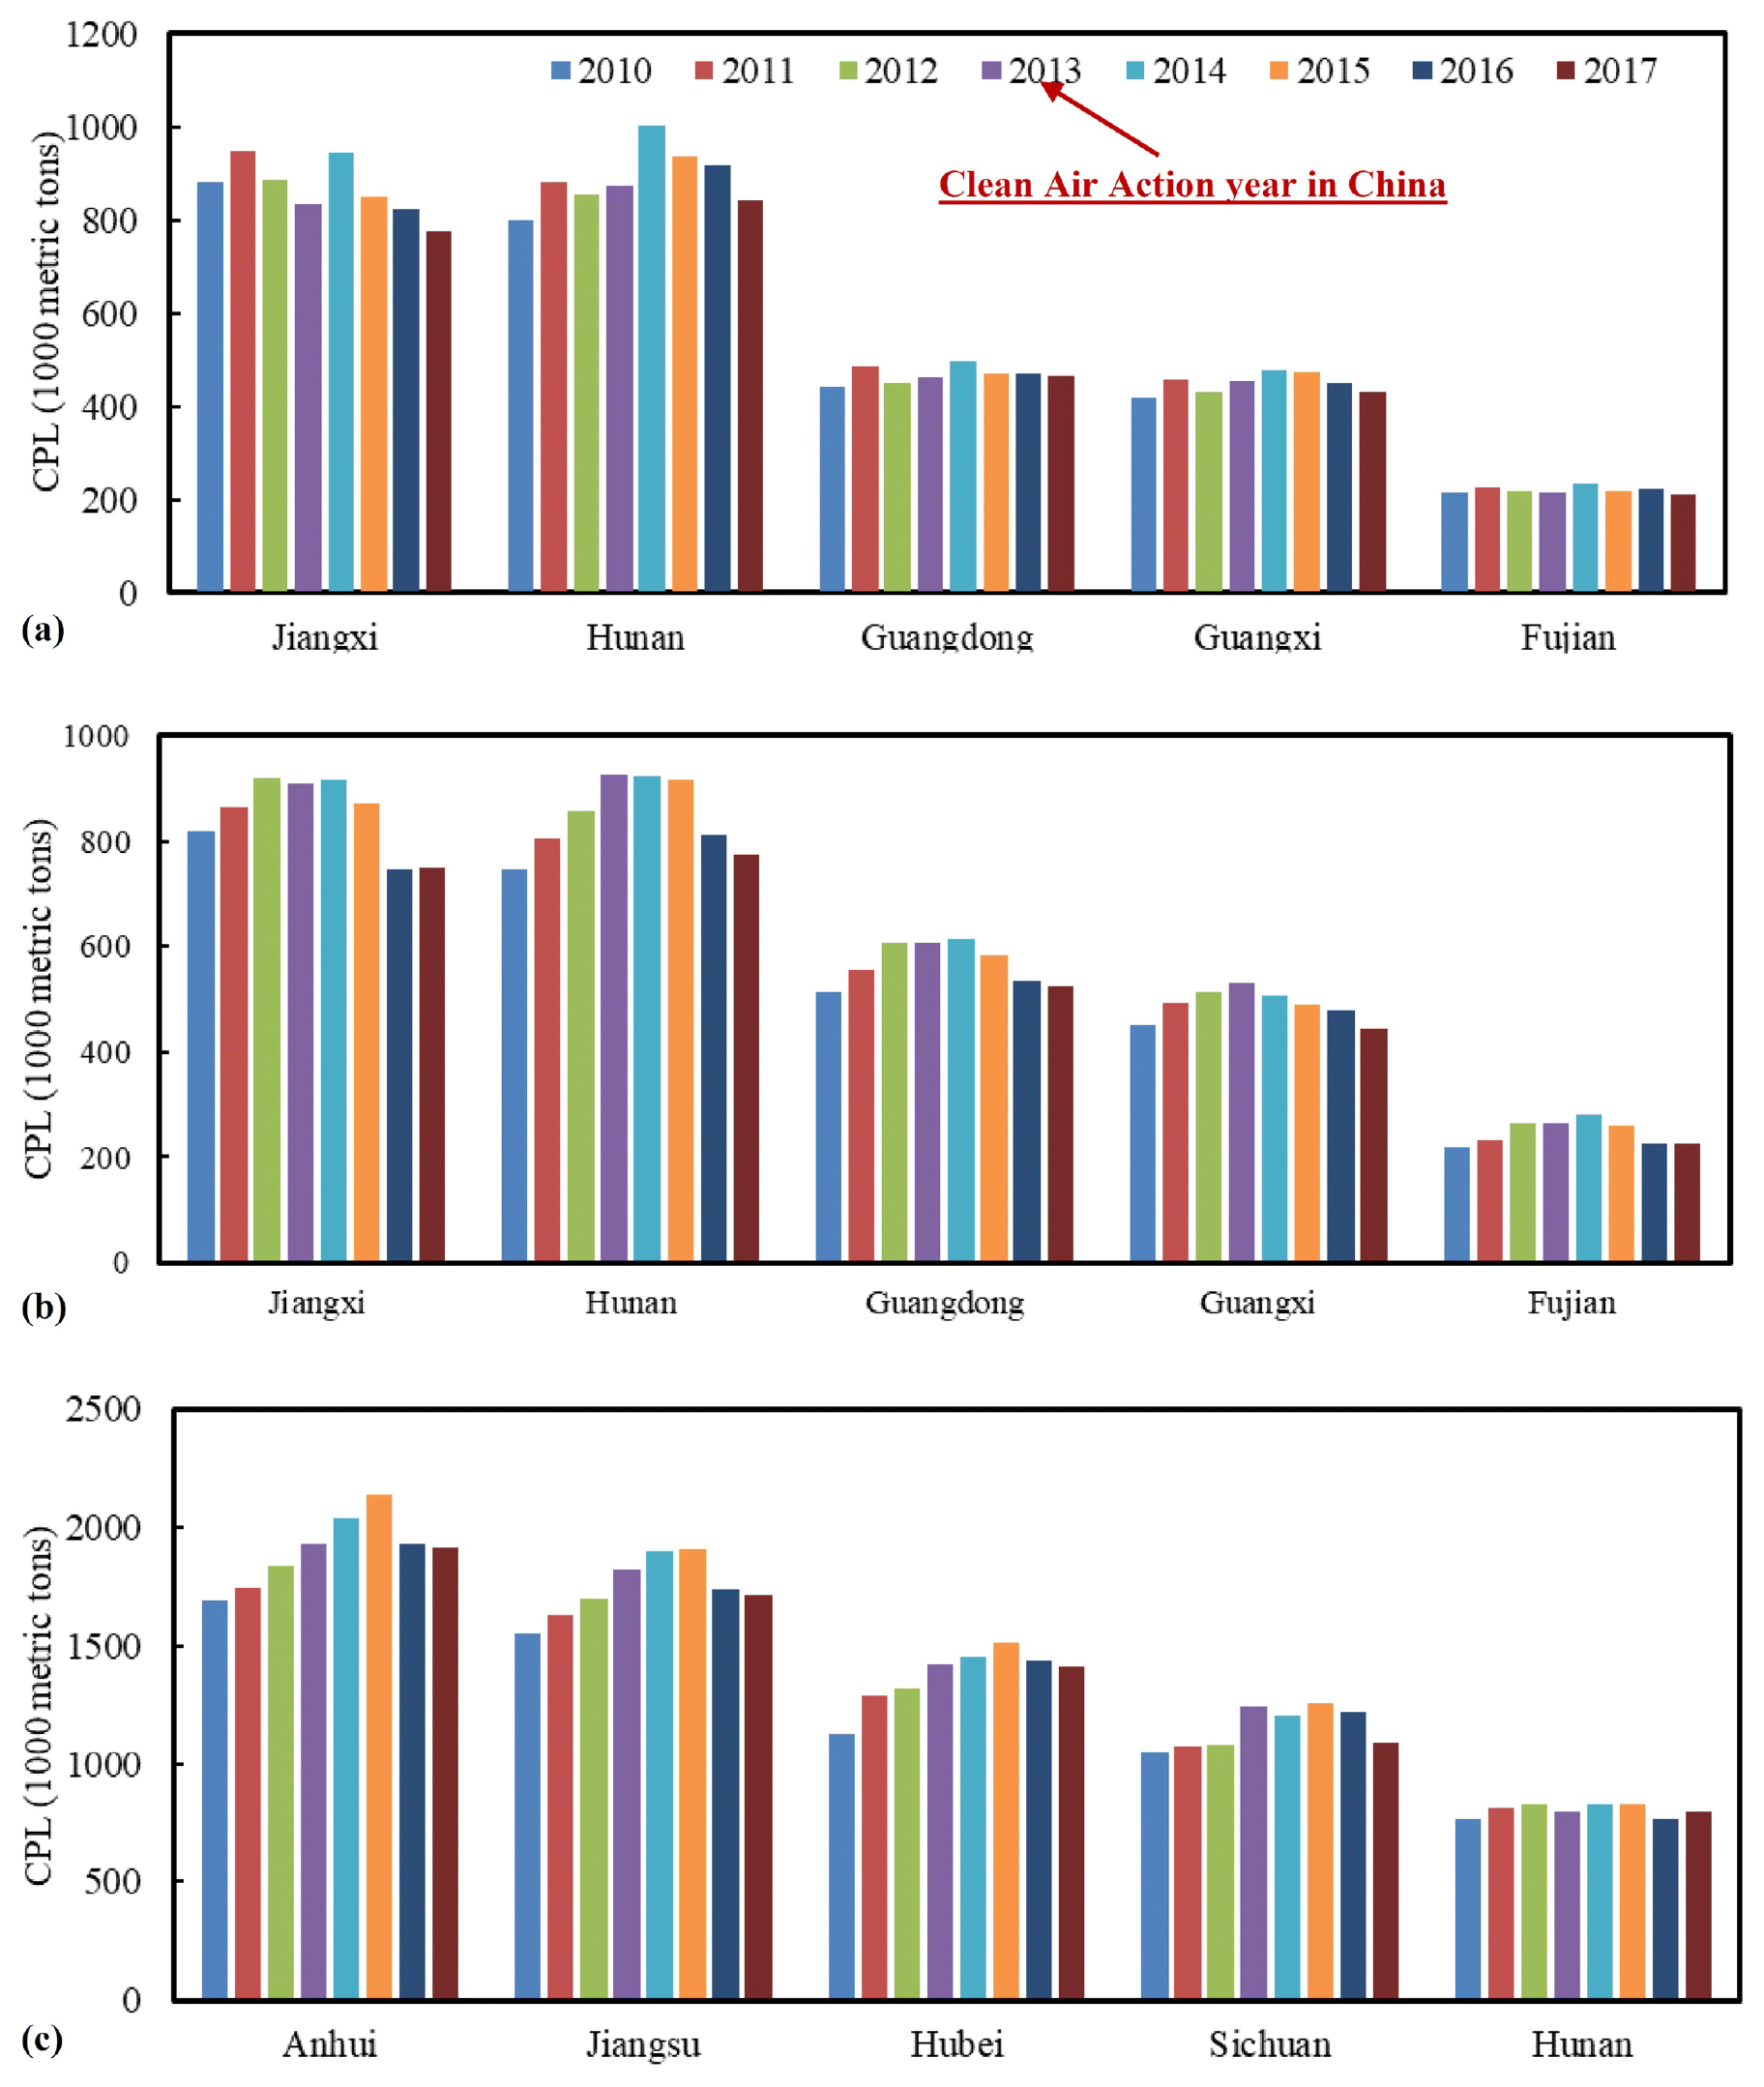
Figure 6The production losses for rice, including (a) double early rice, (b) double late rice, and (c) single rice in all the China provinces. Unit is thousands metric tonnes.
Maize in China is mainly planted in NCP and Northeast China, with north maize production dominating the total national maize production (82 %, with a peak value of 8.17 Mt in year 2015, and lowest value of 4.59 Mt in 2017). The CPLs for maize peaked in 2015 (8.17 Mt, Fig. 4), with the largest contributions from Hebei (1.02–1.81 Mt), Shandong (0.81–1.31 Mt), and Henan (0.53–0.85 Mt) (Table S12; Fig. S9). Soybean mainly grows in the NCP. Total soybean production in China decreased from 15.08 Mt in 2010 to 11.79 Mt in 2015, and then increased slightly to 13.13 Mt in 2017. Heilongjiang was the largest soybean producer, contributing around 50 % of the national soybean production (8-year average of 6.38 Mt), followed by Anhui (1.25 Mt), and Henan (1.03 Mt). We estimated that the ozone-induced CPL for soybean ranged from 1.09 Mt in 2017 to 1.84 Mt in 2010, with an 8-year annual average of 1.52 Mt (Fig. 4; Table S13). Heilongjiang, Anhui, and Henan were the three provinces with the highest CPLs, with 0.69, 0.17, 0.16 Mt losses on average, respectively (Table S13).
3.4 National average relative yield loss (ARYL) and economic loss (EC)
From Fig. 7, we conclude that wheat has the largest national ARYL, ranging from 11 % to 22 % from 2010 to 2017, comparable with previous estimates: 14 % in 2015 estimated by Lin et al. (2018) using regional model simulation, and 20.1 %–33.3 % from 2015 to 2018 estimated by Zhao et al. (2020) using nationwide ozone monitoring data. National ARYLs for rice were around 8 %–9 %, ranking in second among the four crops. The lowest ARYLs were observed for south maize (0 %–1 %). It is noteworthy that, for most crops, the highest national ARYLs were observed in 2014, while the lowest values were observed in 2010 for wheat and 2017 for the other three crops (Fig. 7).
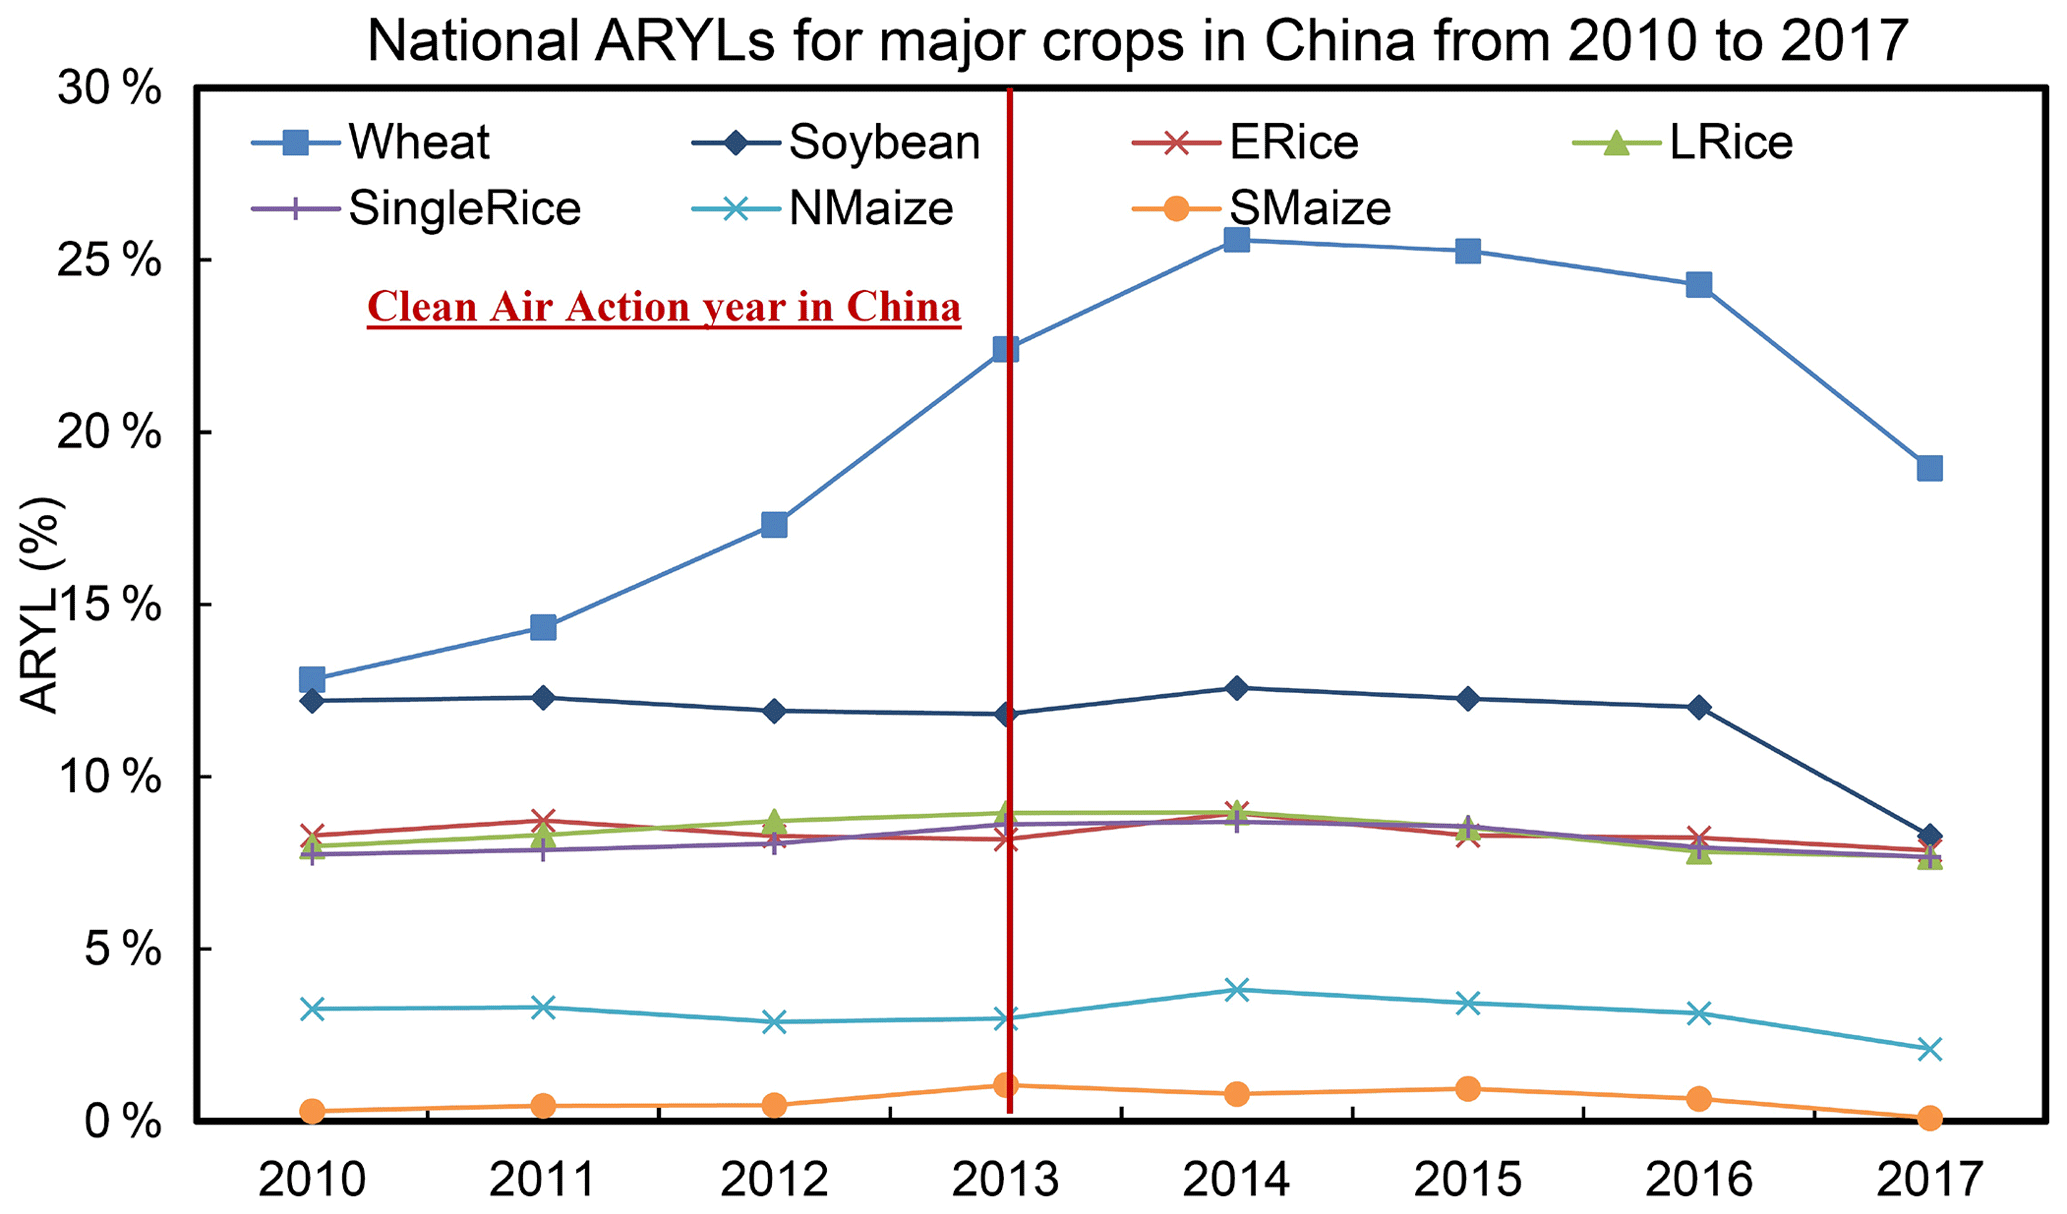
Figure 7National average relative yield loss (ARYLs) from 2010 to 2017. The south maize (SMaize) and soybean are multiplied by 10 to be comparable with other crops.
When converted to EC, we estimated that USD 3.86 billion to USD 14.29 billion would be lost annually due to surface ozone exposure on wheat (Fig. 8a), with the top five provinces all above USD 1 billion, including Henan, Shandong, Hebei, Jiangsu and Anhui (Table S8). Our estimates are consistent with the previous study, which reported USD 10.3 billion and USD 10.7 billion for wheat in 2015 and 2016 (Feng et al., 2019a). National economic loss for double early and late rice increased consistently from USD 2.05 billion to USD 3.87 billion (Fig. 8a). The top three provinces with the highest losses were Hunan, Jiangxi, and Guangzhou, with 8-year average of USD 0.80 billion, USD 0.79 billion and USD 0.47 billion losses, respectively. For the single rice, the national economic loss ranged from USD 2.96 billion to USD 6.49 billion (Fig. 8a), with top provinces in Anhui (8-year average USD 0.87 billion), Jiangsu (USD 0.80 billion) and Hubei (USD 0.63 billion). The ECs for north maize ranged from USD 1.15 billion to USD 3.33 billion, much higher than for south maize (Fig. 8b). Soybean had the lowest economic losses compared with the other three crops, ranging from USD 0.82 billion to USD 1.43 billion annually (Fig. 8b), with major contributions from Heilongjiang province (USD 335 million to USD 646 million).
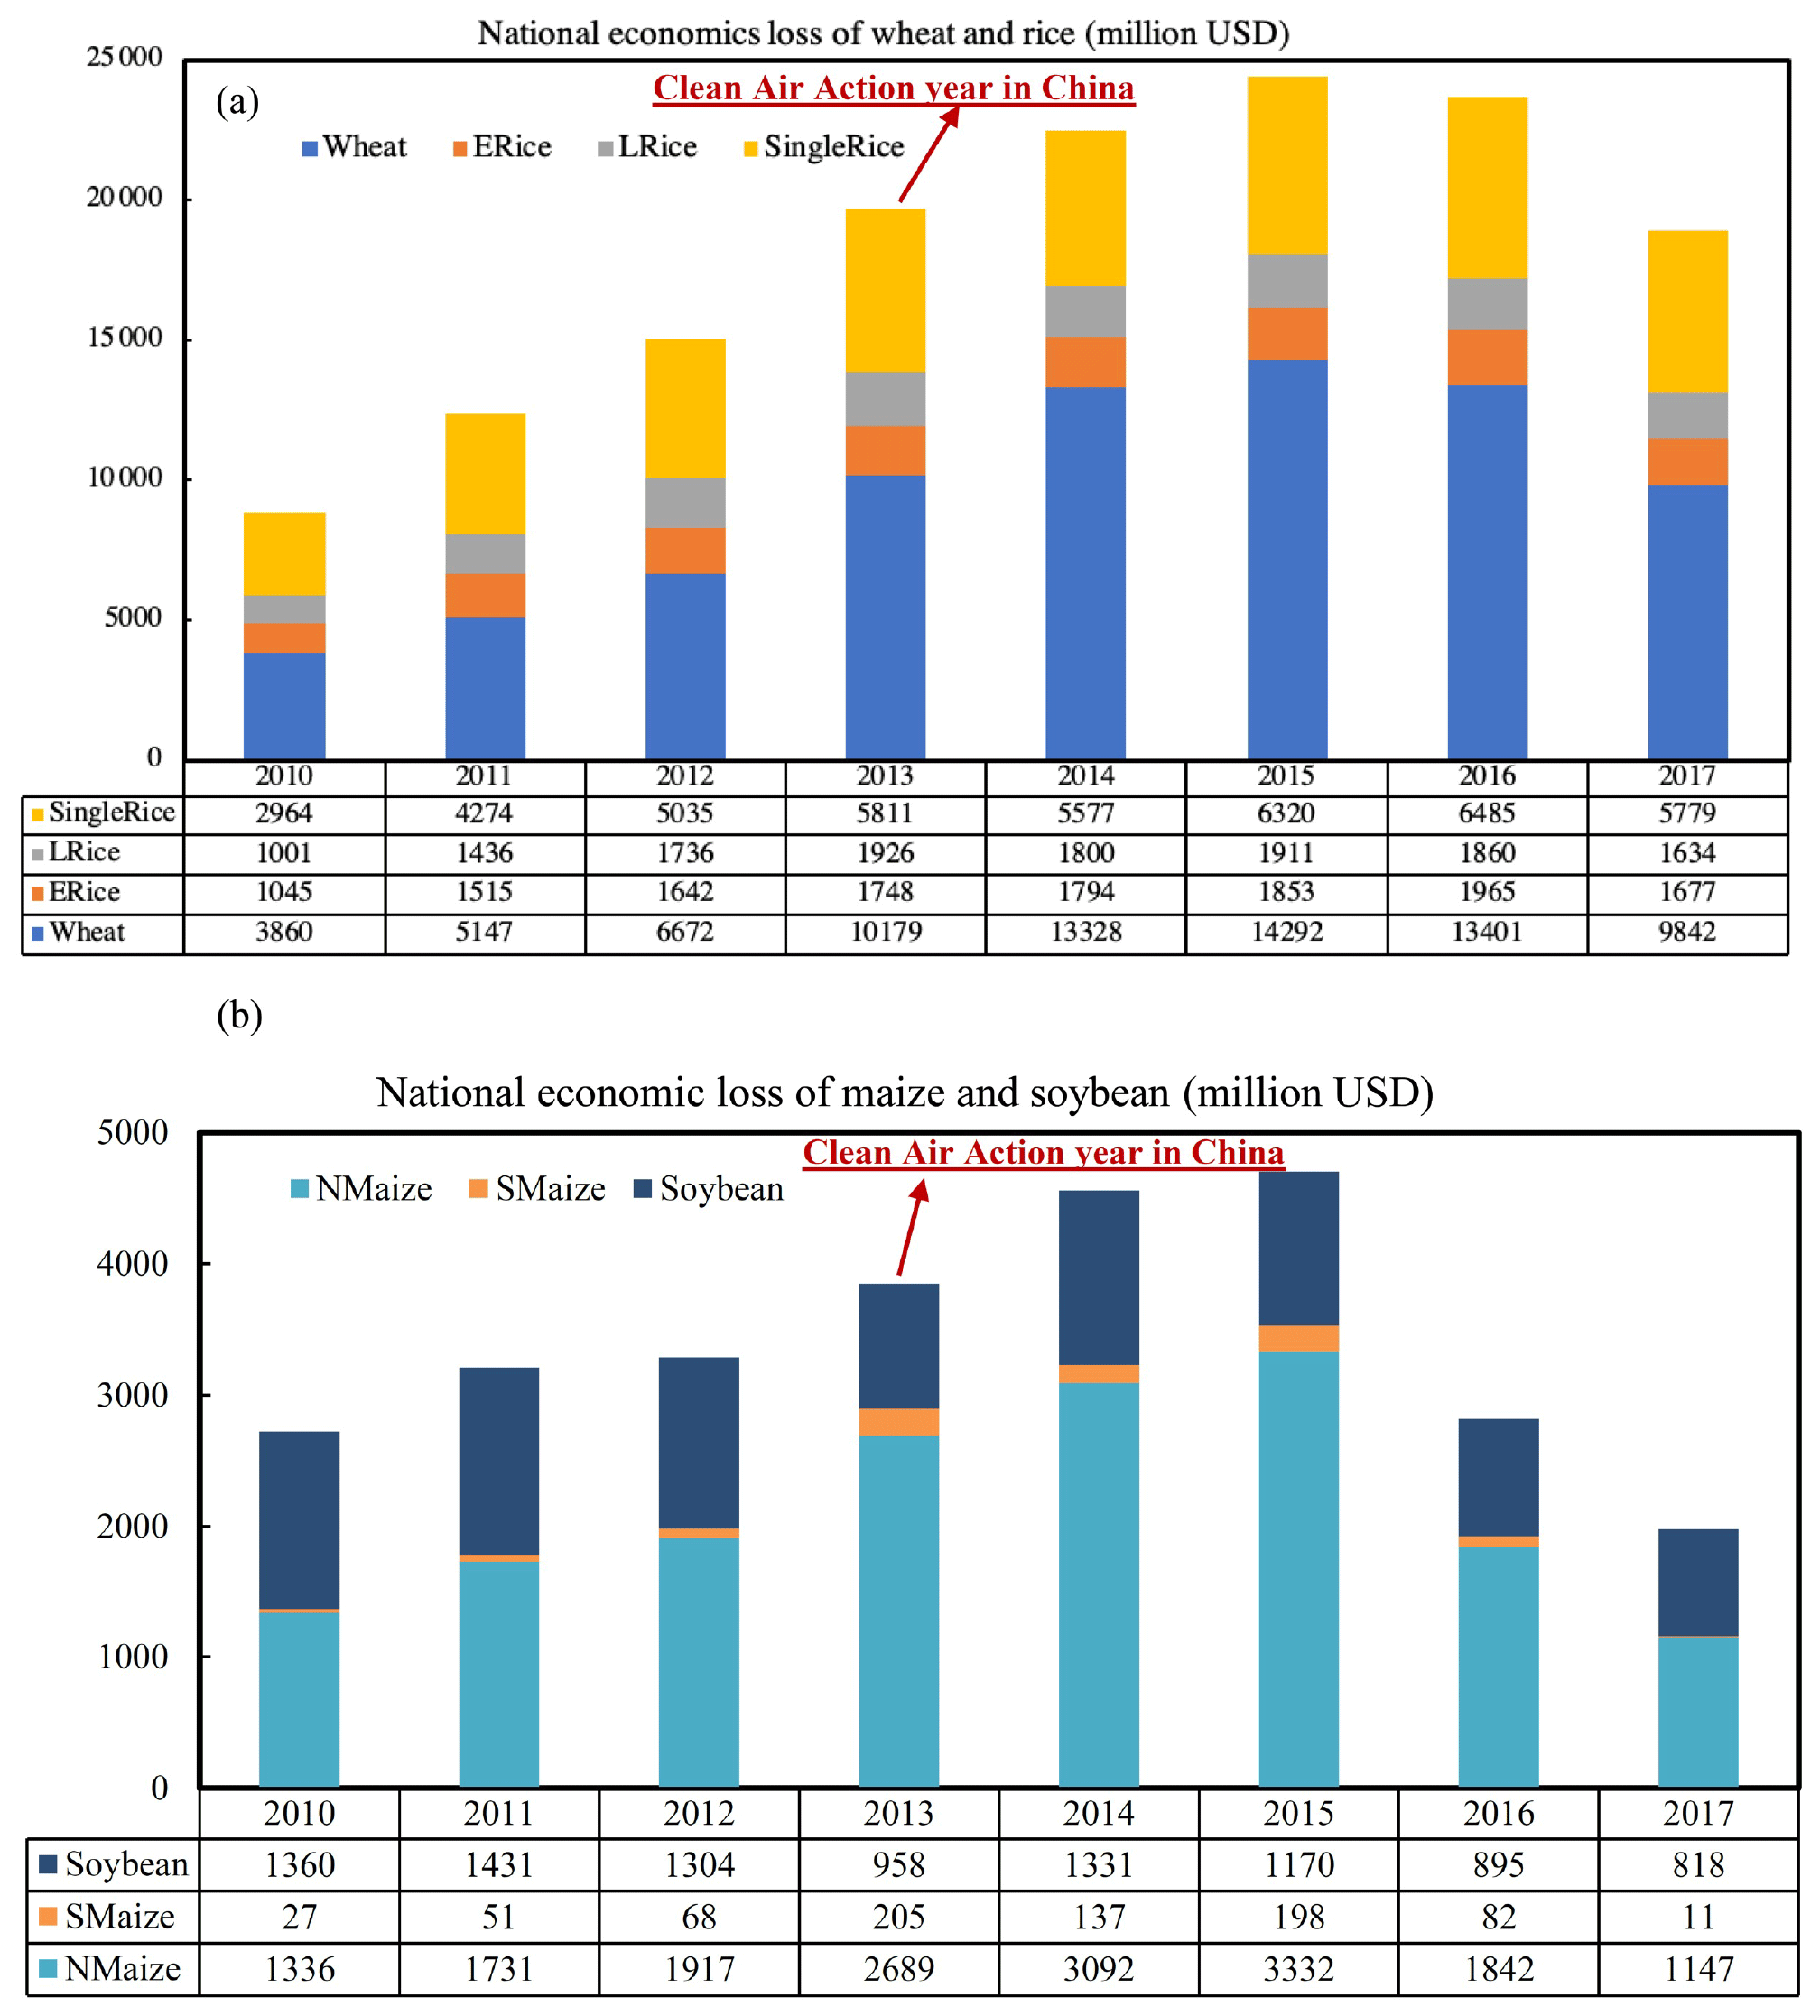
Figure 8National economic loss from crop production loss from (a) wheat and rice (double early and late rice, single rice) and from (b) maize (north maize and south maize) and soybean from 2010 to 2017. The units are million USD.
Surface ozone has emerged as an important environmental issue in China, and both modeling and observation data have shown that ozone has been increasing in major megacities for the past few years (Lu et al., 2018, 2019, 2020; Li et al., 2020; Liu and Wang, 2020a, b; Ni et al., 2018; Wang et al., 2020), though strict clean air regulations have been implemented since 2013. Exposure to high concentrations of surface ozone not only poses threats to human health, but also damages crops. Our study presented a comprehensive analysis of the impact of surface ozone exposure on four major crop production losses in China: wheat, rice (double early and late rice, single rice), maize (north maize and south maize), and soybean. Unlike the surface ozone trend, we showed that the national crop yields for major crops in China usually peaked in 2014 or 2015, shortly after the strict clean air regulations were introduced in 2013. The decreasing trend of crop yield losses from surface ozone exposure could be explained by the fact that the surface ozone in China was increasing in urban areas, while decreasing in rural areas (Li et al., 2022), where major crops are planted. Nonetheless, the relatively higher ozone, especially compared with developed countries, such as the United States and Japan (Lu et al., 2018), is still posing great threats to crop production in China. From the annual crop production from the Statistical Yearbook of China, we estimated that the surface ozone in China could cause an average of 26.42 Mt losses of wheat production from 2010 to 2017. These losses are comparable to the annual average wheat production during the same period in Paris, which is the fifth-largest wheat producer in the world (http://www.fao.org/faostat/en/#data/QC, last access: 12 December 2021). We also estimated that surface ozone exposure could cause 18.58 Mt losses of rice production in China, comparable to the annual rice production in the Philippines, the world's eighth largest rice production. Converting to economic values, we estimated the surface ozone exposure could cost more than USD 20 billion in losses, representing more than 0.20 % of the annual average gross domestic product (GDP) in China from 2010 to 2017. The latest edition of the “State of Food Security and Nutrition in the World” estimated that between 720 and 811 million people in the world faced hunger in 2020, with 161 million increases compared with 2019, and nearly 2.37 billion people did not have access to adequate food, with no regions spared (FAO et al., 2021). Therefore, reducing surface ozone pollution could not only bring benefits of reducing ozone-related premature deaths, but also bring benefits of controlling global hunger and malnutrition issues, thus helping to reach Sustainable Development Goal 2 of “Zero Hunger”. Meanwhile, the Chinese population is projected to continue to increase, and peak around 2025 under all the shared socioeconomic pathways (Chen et al., 2020), making it more urgent to improve crop production by all means.
Uncertainties exist in the design of our study, including the coarse resolution of the global transport model we used, the regional emission inventories, as well as the concentration–response functions. From the evaluation, we learned that our model tends to overestimate the annual MDA8 O3 concentration in China. However, through sensitivity experiences, Wang et al. (2022) showed that model biases in ozone were likely to have a relatively small impact on estimated production losses. The uncertainties from the changes in growing seasons and the concentration–response functions tend to have larger effects. We propose that further studies, using high-resolution bias-corrected ozone concentration data and region-specific response functions, need to be carried out to quantify the negative effects of surface ozone on crops. In our study, we also did not consider the possible climate changes on the crop production. However, previous studies have demonstrated that temperature increases could significantly reduce crop production as well (Rosenzweig et al., 2014; Asseng et al., 2015; Wiebe et al., 2015; Liu et al., 2016; Zhao et al., 2016, 2017). Despite these limitations and uncertainties, our study strives to estimate the long-term negative effects of surface ozone exposure in China before and after the clean air action in China. These estimations could provide the government and policymakers with useful references to be taken into account on the detrimental effects of ozone exposure on crop productions in China when making regional-specific ozone control policies.
In this study, we applied chemical transport model simulation with the latest annual anthropogenic emission inventory to study the long-term trend of O3-induced crop production losses from 2010 to 2017 in China. We found that the annual AOT40 (hourly ozone concentration over a threshold of 40 ppbv during the growing season) in China showed an increasing trend since 2010, with a peak in 2014, which was mainly caused by the high ozone concentration in West China, and then decreased thereafter. Spatially, the annual AOT40 values were higher in West China, North China Plain, and Yangtze River Delta, with the 8-year annual average AOT40 highest in Xizang (41.47 ppm h), Tianjin (34.79 ppm h) and Qinghai (34.51 ppm h). The growing season AOT40 values were relatively higher for wheat, north maize and soybean, showing the double-hump shape for the seasonal O3 distribution (with a growing season of March, April and May for wheat, and June, July and August for north maize and soybean). We estimated that, at the province level, the relative yield losses (RYLs) for wheat ranged from 8.13 % to 25.14 %, 6.72 % to 10.71 % for double early rice, 7.11 % to 8.53 % for double late rice, 6.79 % to 10.22 % for single rice, 0.48 % to 5.29 % for north maize, up to 0.94 % for south maize, and up to 21.48 % for soybean for the 8-year average from 2010 to 2017. The annual national average RYLs (ARYLs), which considers the fractions of the crop production loss with the hypothetical total production without ozone pollution, ranged from 11 % to 22 % for wheat, 8 % to 9 % for rice, 2 % to 4 % for north maize, ∼ 1 % for south maize, and 8.27 % to 12.59 % for soybean. The estimates were comparable to previous studies (Avnery et al., 2011a; Lin et al., 2018; Feng et al., 2019a; Zhao et al., 2020; Wang et al., 2022). Using annual crop production from the Statistical Yearbook of China, we estimated that national aggregated CPL varied from 13.81 to 36.51 Mt from 2010 to 2017 for wheat. The annual CPLs for rice, including both double early and late rice, and single rice, ranged from 16.89 Mt in 2010 to 20.03 Mt in 2014. The CPLs for maize ranged from 4.59 to 8.17 Mt, and 1.09 to 1.84 Mt for Soybean. Accordingly, economic losses from surface ozone exposure ranged from USD 3.86 billion to USD 14.29 billion for wheat, USD 2.05 billion to USD 3.87 billion for double rice (with early and late rice contributing almost equally), USD 2.96 billion to USD 6.49 billion for single rice, USD 1.16 billion to USD 3.53 billion for maize (with north maize contributing to more than 90 % of the total), and USD 0.82 billion to USD 1.43 billion for soybean.
Overall, from 2010 to 2017, the ozone-induced crop production loss in China is significant. The overlaps of major crop growing areas, populated and industrial zones, and ozone concentration hotspots highlight the urgency of a better structured and balanced control on ozone precursors to limit ozone concentration and preserve food security efficiently. Our findings confirmed that the strict air quality regulations in China effectively reduced the crop yield losses associated with the high surface ozone exposure, especially in rural areas. However, current ozone pollution in China still has surprisingly high burdens on crop yields. To protect food security in China, the government needs to make more effort to control the ozone pollution.
Global anthropogenic emissions data from CEDS are available from https://esgf-node.llnl.gov/search/input4mips/ (Hoesly et al., 2018). MEIC emission inventory is available from http://meicmodel.org/?page_id=560 (Tsinghua University, 2022). The CAM-Chem model is available at http://www.cesm.ucar.edu/models/cesm1.2/ (National Center for Atmospheric Research, 2021). Data from CAM-Chem modeling are available at https://doi.org/10.5281/zenodo.5899020 (Li et al., 2022) and the processing scripts that support the findings of this study are available at https://github.com/zyqzxn/China_Crop_Losses_Ozone (last access: 22 February 2022).
The supplement related to this article is available online at: https://doi.org/10.5194/acp-22-2625-2022-supplement.
YZ and DS initiated the research, and designed the paper framework. YZ ran the model, and DL processed the data, performed the data analysis, and made the plots. YZ and DL analyzed the results and wrote the paper, with contributions from DD, XL, and LZ.
The contact author has declared that neither they nor their co-authors have any competing interests.
Publisher’s note: Copernicus Publications remains neutral with regard to jurisdictional claims in published maps and institutional affiliations.
We appreciate the efforts of the China Ministry of Ecology and Environment with respect to supporting the nationwide observation network and the publishing of hourly air pollutant concentrations. We also thank Qiang Zhang and Bo Zheng from Tsinghua University for providing the MEIC emission inventory in China from 2010 to 2017. We would like to thank the University of North Carolina at Chapel Hill and the Research Computing group for providing computational resources and support that have contributed to these research results. We thank Russell Harwood at Duke University for the language editing of the manuscript. We also want to express our sincere gratitude for the editor and three reviewers who significantly improved our original paper.
Xiao Lu is supported by the National Natural Science Foundation of China (grant no. 42105103).
This paper was edited by Hang Su and reviewed by three anonymous referees.
Atkinson, R.: Atmospheric chemistry of VOCs and NOx, Atmos. Environ., 34, 2063–2101, 2000.
Asseng, S., Ewert, F., Martre, P., Rötter, R. P., Lobell, D. B., Cammarano, D., Kimball, B. A., Ottman, M. J., Wall, G. W., White, J. W., Reynolds, M. P., Alderman, P. D., Prasad, P. V. V., Aggarwal, P. K., Anothai, J., Basso, B., Biernath, C., Challinor, A. J., De Sanctis, G., Doltra, J., Fereres, E., Garcia-Vila, M., Gayler, S., Hoogenboom, G., Hunt, L. A., Izaurralde, R. C., Jabloun, M., Jones, C. D., Kersebaum, K. C., Koehler, A. K., Müller, C., Naresh Kumar, S., Nendel, C., O'leary, G., Olesen, J. E., Palosuo, T., Priesack, E., Eyshi Rezaei, E., Ruane, A. C., Semenov, M. A., Shcherbak, I., Stöckle, C., Stratonovitch, P., Streck, T., Supit, I., Tao, F., Thorburn, P. J., Waha, K., Wang, E., Wallach, D., Wolf, J., Zhao, Z., and Zhu, Y.: Rising temperatures reduce global wheat production, Nat. Clim. Change, 5, 143–147, https://doi.org/10.1038/nclimate2470, 2015.
Avnery, S., Mauzerall, D. L., Liu, J., and Horowitz, L. W.: Global crop yield reductions due to surface ozone exposure: 1. Year 2000 crop production losses and economic damage, Atmos. Environ., 45, 2284–2296, https://doi.org/10.1016/j.atmosenv.2010.11.045, 2011a.
Avnery, S., Mauzerall, D. L., Liu, J., and Horowitz, L. W.: Global crop yield reductions due to surface ozone exposure: 2. Year 2030 potential crop production losses and economic damage under two scenarios of O3 pollution, Atmos. Environ., 45, 2297–2309, https://doi.org/10.1016/j.atmosenv.2011.01.002, 2011b.
Booker, F., Muntifering, R., Mcgrath, M., Burkey, K., Decoteau, D., Fiscus, E., Manning, W., Krupa, S., Chappelka, A., and Grantz, D.: The ozone component of global change: Potential effects on agricultural and horticultural plant yield, product quality and interactions with invasive species, J. Integr. Plant Biol., 51, 337–351, https://doi.org/10.1111/j.1744-7909.2008.00805.x, 2009.
Brauer, M., Freedman, G., Frostad, J., Van Donkelaar, A., Martin, R. V., Dentener, F., Dingenen, R. Van, Estep, K., Amini, H., Apte, J. S., Balakrishnan, K., Barregard, L., Broday, D., Feigin, V., Ghosh, S., Hopke, P. K., Knibbs, L. D., Kokubo, Y., Liu, Y., Ma, S., Morawska, L., Sangrador, J. L. T., Shaddick, G., Anderson, H. R., Vos, T., Forouzanfar, M. H., Burnett, R. T., and Cohen, A.: Ambient Air Pollution Exposure Estimation for the Global Burden of Disease 2013, Environ. Sci. Technol., 50, 79–88, https://doi.org/10.1021/acs.est.5b03709, 2016.
Chen, Y., Guo, F., Wang, J., Cai, W., Wang, C., and Wang, K.: Provincial and gridded population projection for China under shared socioeconomic pathways from 2010 to 2100, Sci. Data, 7, 1–13, https://doi.org/10.1038/s41597-020-0421-y, 2020.
FAO, IFAD, UNICEF, WFP, and WHO: The State of Food Security and Nutrition in the World 2021. Transforming food systems for food security, improved nutrition and affordable healthy diets for all, Rome, FAO, https://doi.org/10.4060/cb4474en, 2021.
Feng, Z., De Marco, A., Anav, A., Gualtieri, M., Sicard, P., Tian, H., Fornasier, F., Tao, F., Guo, A., and Paoletti, E.: Economic losses due to ozone impacts on human health, forest productivity and crop yield across China, Environ. Int., 131, 104966, https://doi.org/10.1016/j.envint.2019.104966, 2019a.
Feng, Z., Kobayashi, K., Li, P., Xu, Y., Tang, H., Guo, A., Paoletti, E., and Calatayud, V.: Impacts of current ozone pollution on wheat yield in China as estimated with observed ozone, meteorology and day of flowering, Atmos. Environ., 217, 116945, https://doi.org/10.1016/j.atmosenv.2019.116945, 2019b.
Feng, Z., Hu, T., Tai, A. P. K., and Calatayud, V.: Yield and economic losses in maize caused by ambient ozone in the North China Plain (2014–2017), Sci. Total Environ., 722, 137958, https://doi.org/10.1016/j.scitotenv.2020.137958, 2020.
Hoesly, R. M., Smith, S. J., Feng, L., Klimont, Z., Janssens-Maenhout, G., Pitkanen, T., Seibert, J. J., Vu, L., Andres, R. J., Bolt, R. M., Bond, T. C., Dawidowski, L., Kholod, N., Kurokawa, J.-I., Li, M., Liu, L., Lu, Z., Moura, M. C. P., O'Rourke, P. R., and Zhang, Q.: Historical (1750–2014) anthropogenic emissions of reactive gases and aerosols from the Community Emissions Data System (CEDS), Geosci. Model Dev., 11, 369–408, https://doi.org/10.5194/gmd-11-369-2018, 2018 (data available at: https://esgf-node.llnl.gov/search/input4mips/, last access: 22 February 2022).
Hollaway, M. J., Arnold, S. R., Challinor, A. J., and Emberson, L. D.: Intercontinental trans-boundary contributions to ozone-induced crop yield losses in the Northern Hemisphere, Biogeosciences, 9, 271–292, https://doi.org/10.5194/bg-9-271-2012, 2012.
Hu, T., Liu, S., Xu, Y., Feng, Z., and Calatayud, V.: Assessment of O3-induced yield and economic losses for wheat in the North China Plain from 2014 to 2017, China, Environ. Pollut., 258, 113828, https://doi.org/10.1016/j.envpol.2019.113828, 2020.
Krupa, S. V., Nosal, M., and Legge, A. H.: A numerical analysis of the combined open-top chamber data from the USA and Europe on ambient ozone and negative crop responses, Environ. Pollut., 101, 157–160, 1998.
Lamarque, J.-F., Emmons, L. K., Hess, P. G., Kinnison, D. E., Tilmes, S., Vitt, F., Heald, C. L., Holland, E. A., Lauritzen, P. H., Neu, J., Orlando, J. J., Rasch, P. J., and Tyndall, G. K.: CAM-chem: description and evaluation of interactive atmospheric chemistry in the Community Earth System Model, Geosci. Model Dev., 5, 369–411, https://doi.org/10.5194/gmd-5-369-2012, 2012.
Lefohn, A. S., Malley, C. S., Smith, L., Wells, B., Hazucha, M., Simon, H., Naik, V., Mills, G., Schultz, M. G., Paoletti, E., De Marco, A., Xu, X., Zhang, L., Wang, T., Neufeld, H. S., Musselman, R. C., Tarasick, D., Brauer, M., Feng, Z., Tang, H., Kobayashi, K., Sicard, P., Solberg, S., and Gerosa, G.: Tropospheric ozone assessment report: Global ozone metrics for climate change, human health, and crop/ecosystem research, Elementa, 6, 27, https://doi.org/10.1525/elementa.279, 2018.
Li, D., Shindell, D., Ding, D., Lu, X., Zhang, L., and Zhang, Y.: Surface ozone impacts on major crop production in China from 2010 to 2017, Zenodo [data set], https://doi.org/10.5281/zenodo.5899020, 2022.
Li, K., Jacob, D. J., Zhang, Q., Liao, H., Bates, K. H., and Shen, L.: Anthropogenic drivers of 2013–2017 trends in summer surface ozone in China, P. Natl. Acad. Sci. USA, 116, 422–427, https://doi.org/10.1073/pnas.1812168116, 2018.
Li, K., Jacob, D. J., Liao, H., Zhu, J., Shah, V., Shen, L., Bates, K. H., Zhang, Q., and Zhai, S.: A two-pollutant strategy for improving ozone and particulate air quality in China, Nat. Geosci., 12, 906–910, https://doi.org/10.1038/s41561-019-0464-x, 2019.
Li, K., Jacob, D. J., Shen, L., Lu, X., De Smedt, I., and Liao, H.: Increases in surface ozone pollution in China from 2013 to 2019: anthropogenic and meteorological influences, Atmos. Chem. Phys., 20, 11423–11433, https://doi.org/10.5194/acp-20-11423-2020, 2020.
Li, X., Yuan, B., Parrish, D. D., Chen, D., Song, Y., Yang, S., Liu, Z., and Shao, M.: Long-term trend of ozone in southern China reveals future mitigation strategy for air pollution, Atmos. Environ., 269, 118869, https://doi.org/10.1016/j.atmosenv.2021.118869, 2022.
Lin, Y., Jiang, F., Zhao, J., Zhu, G., He, X., Ma, X., Li, S., Sabel, C. E., and Wang, H.: Impacts of O3 on premature mortality and crop yield loss across China, Atmos. Environ., 194, 41–47, https://doi.org/10.1016/j.atmosenv.2018.09.024, 2018.
Liu, B., Asseng, S., Müller, C., Ewert, F., Elliott, J., Lobell, D. B., Martre, P., Ruane, A. C., Wallach, D., Jones, J. W., Rosenzweig, C., Aggarwal, P. K., Alderman, P. D., Anothai, J., Basso, B., Biernath, C., Cammarano, D., Challinor, A., Deryng, D., De Sanctis, G., Doltra, J., Fereres, E., Folberth, C., Garcia-Vila, M., Gayler, S., Hoogenboom, G., Hunt, L. A., Izaurralde, R. C., Jabloun, M., Jones, C. D., Kersebaum, K. C., Kimball, B. A., Koehler, A. K., Kumar, S. N., Nendel, C., O'Leary, G. J., Olesen, J. E., Ottman, M. J., Palosuo, T., Prasad, P. V. V., Priesack, E., Pugh, T. A. M., Reynolds, M., Rezaei, E. E., Rötter, R. P., Schmid, E., Semenov, M. A., Shcherbak, I., Stehfest, E., Stöckle, C. O., Stratonovitch, P., Streck, T., Supit, I., Tao, F., Thorburn, P., Waha, K., Wall, G. W., Wang, E., White, J. W., Wolf, J., Zhao, Z., and Zhu, Y.: Similar estimates of temperature impacts on global wheat yield by three independent methods, Nat. Clim. Change, 6, 1130–1136, https://doi.org/10.1038/nclimate3115, 2016.
Liu, Y. and Wang, T.: Worsening urban ozone pollution in China from 2013 to 2017 – Part 1: The complex and varying roles of meteorology, Atmos. Chem. Phys., 20, 6305–6321, https://doi.org/10.5194/acp-20-6305-2020, 2020a.
Liu, Y. and Wang, T.: Worsening urban ozone pollution in China from 2013 to 2017 – Part 2: The effects of emission changes and implications for multi-pollutant control, Atmos. Chem. Phys., 20, 6323–6337, https://doi.org/10.5194/acp-20-6323-2020, 2020b.
Lu, X., Hong, J., Zhang, L., Cooper, O. R., Schultz, M. G., Xu, X., Wang, T., Gao, M., Zhao, Y., and Zhang, Y.: Severe Surface Ozone Pollution in China: A Global Perspective, Environ. Sci. Tech. Let., 5, 487–494, https://doi.org/10.1021/acs.estlett.8b00366, 2018.
Lu, X., Zhang, L., Chen, Y., Zhou, M., Zheng, B., Li, K., Liu, Y., Lin, J., Fu, T.-M., and Zhang, Q.: Exploring 2016–2017 surface ozone pollution over China: source contributions and meteorological influences, Atmos. Chem. Phys., 19, 8339–8361, https://doi.org/10.5194/acp-19-8339-2019, 2019.
Lu, X., Zhang, L., Wang, X., Gao, M., Li, K., Zhang, Y., Yue, X., and Zhang, Y.: Rapid Increases in Warm-Season Surface Ozone and Resulting Health Impact in China Since 2013, Environ. Sci. Tech. Let., https://doi.org/10.1021/acs.estlett.0c00171, 2020.
Mauzerall, D. L. and Wang, X.: Protecting agricultural crops from the effects of tropospheric ozone exposure: reconciling Science and Standard Setting in the United States, Europe, and Asia, Annu. Rev. Energ. Env., 26, 237–268, https://doi.org/10.1146/annurev.energy.26.1.237, 2001.
Mills, G., Buse, A., Gimeno, B., Bermejo, V., Holland, M., Emberson, L., and Pleijel, H.: A synthesis of AOT40-based response functions and critical levels of ozone for agricultural and horticultural crops, Atmos. Environ., 41, 2630–2643, https://doi.org/10.1016/j.atmosenv.2006.11.016, 2007.
National Bureau of Statistics of China: National data, http://data.stats.gov.cn (last access: 22 February 2022), 2018.
National Center for Atmospheric Research: CAM-Chem model, http://www.cesm.ucar.edu/models/cesm1.2/, last access: 12 May 2021.
Ni, R., Lin, J., Yan, Y., and Lin, W.: Foreign and domestic contributions to springtime ozone over China, Atmos. Chem. Phys., 18, 11447–11469, https://doi.org/10.5194/acp-18-11447-2018, 2018.
Rosenzweig, C., Elliott, J., Deryng, D., Ruane, A. C., Müller, C., and Arneth, A.: Assessing agricultural risks of climate change in the 21st century in a global gridded crop model intercomparison, P. Natl. Acad. Sci. USA, 111, 3268–3273, https://doi.org/10.1073/pnas.1222463110, 2014.
Royal Society: Ground-level ozone in the 21st century: future trends, impacts and policy implications. Sci. Policy Rep. 15/08, 1–148, 2008.
Tan, Z., Hofzumahaus, A., Lu, K., Brown, S. S., Holland, F., Huey, L. G., Kiendler-Scharr, A., Li, X., Liu, X., Ma, N., Min, K. E., Rohrer, F., Shao, M., Wahner, A., Wang, Y., Wiedensohler, A., Wu, Y., Wu, Z., Zeng, L., Zhang, Y., and Fuchs, H.: No Evidence for a Significant Impact of Heterogeneous Chemistry on Radical Concentrations in the North China Plain in Summer 2014, Environ. Sci. Technol., 54, 5973–5979, https://doi.org/10.1021/acs.est.0c00525, 2020.
Tang, H., Takigawa, M., Liu, G., Zhu, J., and Kobayashi, K.: A projection of ozone-induced wheat production loss in China and India for the years 2000 and 2020 with exposure-based and flux-based approaches, Glob. Change Biol., 19, 2739–2752, 2013.
Tsinghua University: MEIC emission inventory, http://meicmodel.org/?page_id=560, last access: 22 February 2022.
Tuovinen, J. P.: Assessing vegetation exposure to ozone: Properties of the AOT40 index and modifications by deposition modelling, Environ. Pollut., 109, 361–372, https://doi.org/10.1016/S0269-7491(00)00040-3, 2000.
Van Dingenen, R., Dentener, F. J., Raes, F., Krol, M. C., Emberson, L., and Cofala, J.: The global impact of ozone on agricultural crop yields under current and future air quality legislation, Atmos. Environ., 43, 604–618, https://doi.org/10.1016/j.atmosenv.2008.10.033, 2009.
Van Dingenen, R., Dentener, F., Crippa, M., Leitao, J., Marmer, E., Rao, S., Solazzo, E., and Valentini, L.: TM5-FASST: a global atmospheric source–receptor model for rapid impact analysis of emission changes on air quality and short-lived climate pollutants, Atmos. Chem. Phys., 18, 16173–16211, https://doi.org/10.5194/acp-18-16173-2018, 2018.
Wang, N., Lyu, X., Deng, X., Huang, X., Jiang, F., and Ding, A.: Aggravating O3 pollution due to NOx emission control in eastern China, Sci. Total Environ., 677, 732–744, 2019.
Wang, X. and Mauzerall, D. L.: Characterizing distributions of surface ozone and its impact on grain production in China, Japan and South Korea: 1990 and 2020, Atmos. Environ., 38, 4383–4402, 2004.
Wang, X., Zhang, Q., Zheng, F., Zheng, Q., Yao, F., Chen, Z., Zhang, W., Hou, P., Feng, Z., Song, W., Feng, Z., and Lu, F.: Effects of elevated O3 concentration on winter wheat and rice yields in the Yangtze River Delta, China, Environ. Pollut., 171, 118–125, https://doi.org/10.1016/j.envpol.2012.07.028, 2012.
Wang, Y., Zhang, Y., Hao, J., and Luo, M.: Seasonal and spatial variability of surface ozone over China: contributions from background and domestic pollution, Atmos. Chem. Phys., 11, 3511–3525, https://doi.org/10.5194/acp-11-3511-2011, 2011.
Wang, Y., Gao, W., Wang, S., Song, T., Gong, Z., Ji, D., Wang, L., Liu, Z., Tang, G., Huo, Y., Tian, S., Li, J., Li, M., Yang, Y., Chu, B., Petäjä, T., Kerminen, V. M., He, H., Hao, J., Kulmala, M., Wang, Y., and Zhang, Y.: Contrasting trends of PM2.5 and surface-ozone concentrations in China from 2013 to 2017, Natl. Sci. Rev., 7, 1331–1339, https://doi.org/10.1093/nsr/nwaa032, 2020.
Wang, Y., Wild, O., Ashworth, K., Chen, X., Wu, Q., Qi, Y., and Wang, Z.: Reductions in crop yields across China from elevated ozone, Environ. Pollut., 292, 118218, https://doi.org/10.1016/j.envpol.2021.118218, 2022.
Wiebe, K., Lotze-Campen, H., Sands, R., Tabeau, A., Van Der Mensbrugghe, D., Biewald, A., Bodirsky, B., Islam, S., Kavallari, A., Mason-D'Croz, D., Müller, C., Popp, A., Robertson, R., Robinson, S., Van Meijl, H., and Willenbockel, D.: Climate change impacts on agriculture in 2050 under a range of plausible socioeconomic and emissions scenarios, Environ. Res. Lett., 10, 85010, https://doi.org/10.1088/1748-9326/10/8/085010, 2015.
Yi, F., McCarl, B. A., Zhou, X., and Jiang, F.: Damages of surface ozone: Evidence from agricultural sector in China, Environ. Res. Lett., 13, 034019, https://doi.org/10.1088/1748-9326/aaa6d9, 2018.
Zhang, L., Jacob, D. J., Boersma, K. F., Jaffe, D. A., Olson, J. R., Bowman, K. W., Worden, J. R., Thompson, A. M., Avery, M. A., Cohen, R. C., Dibb, J. E., Flock, F. M., Fuelberg, H. E., Huey, L. G., McMillan, W. W., Singh, H. B., and Weinheimer, A. J.: Transpacific transport of ozone pollution and the effect of recent Asian emission increases on air quality in North America: an integrated analysis using satellite, aircraft, ozonesonde, and surface observations, Atmos. Chem. Phys., 8, 6117–6136, https://doi.org/10.5194/acp-8-6117-2008, 2008.
Zhang, L., Jacob, D. J., Knipping, E. M., Kumar, N., Munger, J. W., Carouge, C. C., van Donkelaar, A., Wang, Y. X., and Chen, D.: Nitrogen deposition to the United States: distribution, sources, and processes, Atmos. Chem. Phys., 12, 4539–4554, https://doi.org/10.5194/acp-12-4539-2012, 2012.
Zhang, L., Shao, J., Lu, X., Zhao, Y., Hu, Y., Henze, D. K., Liao, H., Gong, S., and Zhang, Q.: Sources and Processes Affecting Fine Particulate Matter Pollution over North China: An Adjoint Analysis of the Beijing APEC Period, Environ. Sci. Technol., 50, 8731–8740, https://doi.org/10.1021/acs.est.6b03010, 2016.
Zhang, Q., Zheng, Y., Tong, D., Shao, M., Wang, S., Zhang, Y., Xu, X., Wang, J., He, H., Liu, W., Ding, Y., Lei, Y., Li, J., Wang, Z., Zhang, X., Wang, Y., Cheng, J., Liu, Y., Shi, Q., Yan, L., Geng, G., Hong, C., Li, M., Liu, F., Zheng, B., Cao, J., Ding, A., Gao, J., Fu, Q., Huo, J., Liu, B., Liu, Z., Yang, F., He, K., and Hao, J.: Drivers of improved PM2.5 air quality in China from 2013 to 2017, P. Natl. Acad. Sci. USA, 116, 24463–24469, https://doi.org/10.1073/pnas.1907956116, 2019.
Zhang, W., Feng, Z., Wang, X., Liu, X., and Hu, E.: Quantification of ozone exposure- and stomatal uptake-yield response relationships for soybean in Northeast China, Sci. Total Environ., 599–600, 710–720, https://doi.org/10.1016/j.scitotenv.2017.04.231, 2017.
Zhang, Y., Cooper, O. R., Gaudel, A., Thompson, A. M., Nédélec, P., Ogino, S. Y., and West, J. J.: Tropospheric ozone change from 1980 to 2010 dominated by equatorward redistribution of emissions, Nat. Geosci., 9, 875–879, https://doi.org/10.1038/ngeo2827, 2016.
Zhang, Y., West, J. J., Emmons, L. K., Flemming, J., Jonson, J. E., Lund, M. T., Sekiya, T., Sudo, K., Gaudel, A., Chang, K.-L., Nédélec, P., and Thouret, V.: Regional emission changes contributions to the global tropospheric ozone burden change from 1980 to 2010, Geophys. Res. Lett., 48, e2020GL089184, https://doi.org/10.1029/2020GL089184, 2021a.
Zhang, Y., Shindell, D., Seltzer, K., Shen, L., Lamarque, J.-F., Zhang, Q., Zheng, B., Xing, J., Jiang, Z., and Zhang, L.: Impacts of emission changes in China from 2010 to 2017 on domestic and intercontinental air quality and health effect, Atmos. Chem. Phys., 21, 16051–16065, https://doi.org/10.5194/acp-21-16051-2021, 2021b.
Zhao, C., Piao, S., Wang, X., Huang, Y., Ciais, P., Elliott, J., Huang, M., Janssens, I. A., Li, T., Lian, X., Liu, Y., Müller, C., Peng, S., Wang, T., Zeng, Z., and Peñuelas, J.: Plausible rice yield losses under future climate warming, Nat. Plants, 3, 1–5, https://doi.org/10.1038/nplants.2016.202, 2016.
Zhao, C., Liu, B., Piao, S., Wang, X., Lobell, D. B., Huang, Y., Huang, M., Yao, Y., Bassu, S., Ciais, P., Durand, J. L., Elliott, J., Ewert, F., Janssens, I. A., Li, T., Lin, E., Liu, Q., Martre, P., Müller, C., Peng, S., Peñuelas, J., Ruane, A. C., Wallach, D., Wang, T., Wu, D., Liu, Z., Zhu, Y., Zhu, Z., and Asseng, S.: Temperature increase reduces global yields of major crops in four independent estimates, P. Natl. Acad. Sci. USA, 114, 9326–9331, https://doi.org/10.1073/pnas.1701762114, 2017.
Zhao, H., Zheng, Y., Zhang, Y., and Li, T.: Evaluating the effects of surface O3 on three main food crops across China during 2015–2018, Environ. Pollut., 258, 113794, https://doi.org/10.1016/j.envpol.2019.113794, 2020.
Zheng, B., Tong, D., Li, M., Liu, F., Hong, C., Geng, G., Li, H., Li, X., Peng, L., Qi, J., Yan, L., Zhang, Y., Zhao, H., Zheng, Y., He, K., and Zhang, Q.: Trends in China's anthropogenic emissions since 2010 as the consequence of clean air actions, Atmos. Chem. Phys., 18, 14095–14111, https://doi.org/10.5194/acp-18-14095-2018, 2018.