the Creative Commons Attribution 4.0 License.
the Creative Commons Attribution 4.0 License.
 | 25 Feb 2022
Urban inland wintertime N2O5 and ClNO2 influenced by snow-covered ground, air turbulence, and precipitation
Kathryn D. Kulju
Stephen M. McNamara
Qianjie Chen
Hannah S. Kenagy
Jacinta Edebeli
Jose D. Fuentes
Steven B. Bertman
The atmospheric multiphase reaction of dinitrogen pentoxide (N2O5) with chloride-containing aerosol particles produces nitryl chloride (ClNO2), which has been observed across the globe. The photolysis of ClNO2 produces chlorine radicals and nitrogen dioxide (NO2), which alter pollutant fates and air quality. However, the effects of local meteorology on near-surface ClNO2 production are not yet well understood, as most observational and modeling studies focus on periods of clear conditions. During a field campaign in Kalamazoo, Michigan, from January–February 2018, N2O5 and ClNO2 were measured using chemical ionization mass spectrometry, with simultaneous measurements of atmospheric particulate matter and meteorological parameters. We examine the impacts of atmospheric turbulence, precipitation (snow, rain) and fog, and ground cover (snow-covered and bare ground) on the abundances of ClNO2 and N2O5. N2O5 mole ratios were lowest during periods of lower turbulence and were not statistically significantly different between snow-covered and bare ground. In contrast, ClNO2 mole ratios were highest, on average, over snow-covered ground, due to saline snowpack ClNO2 production. Both N2O5 and ClNO2 mole ratios were lowest, on average, during rainfall and fog because of scavenging, with N2O5 scavenging by fog droplets likely contributing to observed increased particulate nitrate concentrations. These observations, specifically those during active precipitation and with snow-covered ground, highlight important processes, including N2O5 and ClNO2 wet scavenging, fog nitrate production, and snowpack ClNO2 production, that govern the variability in observed atmospheric chlorine and nitrogen chemistry and are missed when considering only clear conditions.
- Article
(2744 KB) - Full-text XML
-
Supplement
(1842 KB) - BibTeX
- EndNote


Atmospheric halogen radicals are highly oxidizing agents of tropospheric pollutants (Simpson et al., 2015). Following nighttime formation, the photolysis of nitryl chloride (ClNO2) upon sunrise is a source of chlorine radicals (Reaction R1) at a time when other oxidants, including the hydroxyl radical (OH), are less abundant (Young et al., 2014), leading to enhanced oxidation of volatile organic compounds (Osthoff et al., 2008). ClNO2 photolysis also releases NO2 (Reaction R1), thus recycling nitrogen oxides (NOx = NO + NO2) that drive ozone formation (Crutzen, 1979).
ClNO2 is formed by the multiphase reaction of dinitrogen pentoxide (N2O5) on a chloride-containing surface (Reaction R2), particularly sea spray aerosol (Finlayson-Pitts and Pitts, 1989; Osthoff et al., 2008).
In the Northern Hemisphere, surface-level ClNO2 abundance is simulated to be highest during winter; this is thought to be due to greater N2O5 abundances, shallower mixed layer heights or even stable boundary layers, lower air temperatures, and higher ClNO2 yields (Sarwar et al., 2014). ClNO2 production has been previously studied in the laboratory following the reaction of N2O5 with aqueous aerosols (e.g., Behnke et al., 1997; Bertram and Thornton, 2009; Roberts et al., 2009; Thornton and Abbatt, 2005) and frozen solutions (Lopez-Hilfiker et al., 2012). A recent modeling study suggests that ClNO2 may be produced from heterogeneous reaction on the snowpack, in addition to aerosols (Wang et al., 2020). In addition to marine and coastal environments, ClNO2 has been measured in inland environments, including Boulder, Colorado, USA (Riedel et al., 2013; Thornton et al., 2010); Calgary, Alberta, Canada (Mielke et al., 2011); Frankfurt, Germany (Phillips et al., 2012); Jinan, Shandong, China (e.g., Wang et al., 2017); and southwest Baoding, Hebei, China (e.g., Tham et al., 2018). In these inland environments, ClNO2 abundance is typically hundreds of parts per trillion (ppt). Recently, a study in Ann Arbor, Michigan, identified road salt aerosol as the dominant aerosol chloride source for ClNO2 production during winter (McNamara et al., 2020). Measurements in Kalamazoo, Michigan, also identified road-salt-contaminated snowpack as a ClNO2 source (McNamara et al., 2021). A study in coastal British Columbia, Canada, suggested scavenging of ClNO2 by rain and/or fog droplets as a potential loss process (Osthoff et al., 2018). However, the authors pointed out that scavenging of the nitrate radical (NO3), N2O5, and ClNO2 has not been constrained by laboratory investigations (in contrast to other gases like sulfur dioxide (SO2) and ammonia (NH3)), and so periods of precipitation were excluded from subsequent calculations of N2O5 uptake and ClNO2 yield (Osthoff et al., 2018).
N2O5, the precursor to ClNO2, is formed from the reaction of NO2 with NO3 (Reaction R3), which is formed from the reaction of NO2 with ozone (O3, Reaction R4). The net formation of N2O5 from NO2 and NO3 is a temperature-dependent equilibrium, with net N2O5 production favored at lower temperatures (Asaf et al., 2010; Wagner et al., 2013). At a NO2 background level of 1 part per billion (ppb), the ratio of N2O5 : NO3 (Reaction R3) is ∼ 1 at 295 K, but this N2O5 : NO3 ratio is ∼ 10 at 278 K (Chang et al., 2011). Loss of N2O5 is an important terminal sink for nitrogen oxides (NOx) in the troposphere (Simpson et al., 2015). Long-term data show that direct N2O5 loss via hydrolysis, to produce nitric acid (HNO3, Reaction R5), is most important during winter, and indirect N2O5 loss (removal of NO3 via reaction with hydrocarbons and NO, Reactions R6–R7) is most important during summer (Allan et al., 1999; Geyer et al., 2001; Heintz et al., 1996).
Experimental investigations of the impacts of meteorology on N2O5 abundance are primarily limited to observations of uptake by fog in coastal regions (Brown et al., 2016; Osthoff et al., 2006; Sommariva et al., 2009; Wood et al., 2005). In addition to forming HNO3, hydrolysis of N2O5 can produce particle-phase nitrate (NO) (Brown et al., 2004; Osthoff et al., 2006). Particle-phase nitrate has been observed to increase, then subsequently decrease, during fog episodes, which is hypothesized to be the result of N2O5 hydrolysis to form nitrate, followed by wet removal of nitrate from the fog layer (Lillis et al., 1999).
The review by Chang et al. (2011) stated that future observation-based research is needed to further investigate how N2O5 is affected by meteorological conditions, due to its impacts on ClNO2 and particulate matter abundances, as well as on the oxidative capacity of the atmosphere. Many gaps remain in our understanding of the fates and production of N2O5 and ClNO2, especially in inland locations, and how they are influenced by meteorological conditions such as precipitation events, fog, and turbulent mixing. Notably, Stanier et al. (2012) identified the impacts of fog and snow cover as important knowledge gaps in understanding wintertime atmospheric composition, and nitrate formation in particular, in the Midwest United States.
The SNow and Atmospheric Chemistry in Kalamazoo (SNACK) field campaign was conducted during January and February 2018 in Kalamazoo, MI, on the campus of Western Michigan University (WMU). In our previous publication from this study, we showed photochemical snowpack HONO production due to snow nitrate photolysis (Chen et al., 2019). Through vertical gradient measurements on select nights of the SNACK field campaign, we showed that N2O5 deposits at the same rate over bare and snow-covered ground, whereas, while ClNO2 deposits on bare ground, it can be emitted from the saline snow-covered ground, with snow chamber experiments confirming saline snow ClNO2 production (McNamara et al., 2021). Here, we focus on the observational time series of near-surface ClNO2 and its precursor N2O5 and examine the influences of precipitation (rain, snow) and fog, atmospheric turbulence, ground cover (snow-covered vs. bare ground), particulate chloride and nitrate, temperature, and relative humidity (RH) on the nighttime abundances of these compounds, measured by chemical ionization mass spectrometry. This study provides new insights into the biases associated with modeling and observations focused on cloudless (clear) conditions, which has been shown to impact predictions of aerosol chemical composition (Christiansen et al., 2020).
The sampling site (42.28∘ N, 85.61∘ W) on the campus of WMU in Kalamazoo, MI, was located next to a field and was approximately 90 m from a major roadway, as previously described by McNamara et al. (2021). As described below, measurements of trace gases (N2O5 and ClNO2), PM2.5 (particulate matter with a diameter ≤ 2.5 µm) inorganic chemical composition, three-dimensional wind speed, and temperature were conducted at the field site from 20 January to 24 February 2018. Daily photographs and field notes were used to determine ground cover and spatial extent of snow cover.
Because N2O5 and ClNO2 were present almost exclusively at night, we define “nocturnal”/“nighttime” as the period between 18:00 and 08:00 eastern standard time (EST, coordinated universal time (UTC)−5 h), which was approximately ±30 min from sunrise and sunset during the campaign. At the start of the campaign (20 January) sunrise was at 08:05 local time (eastern standard time, EST), and sunset was at 17:42. At the end of the campaign (24 February) sunrise was at 07:23 EST, and sunset was at 18:27.
2.1 Meteorological measurements
Air temperature and three-dimensional wind speed (u, v, and w) were measured from a height of 1.4 m and at a frequency of 20 Hz using a sonic anemometer (model CSAT3, Campbell Scientific Inc., Logan, UT). The sonic anemometer was not operational from 20–21 February due to complications associated with heavy rainfall. Friction velocity (u∗) was calculated from turbulent covariance of three-dimensional wind speed based on 30 min averaging, where u′, v′, and w′ are fluctuations about the 30 min mean wind speed in its zonal (u), meridional (v), and vertical (w) components, respectively (Eq. 1) (Stull, 1988).
Kinematic heat flux () was also calculated from sonic anemometer data, where w′ and T′ are deviations in vertical velocity and temperature from 5 min averages, respectively (Monin and Obukhov, 1954). Kinematic heat flux values were then further averaged to obtain 30 min time resolution quantities. This heat flux value describes the transport of thermal energy by eddies; negative values of indicate heat transport from the atmosphere to the surface and are associated with a temperature inversion (Stull, 1988).
Weather conditions (rain, snow, and fog) and pressure were recorded at the Kalamazoo–Battle Creek International Airport (KAZO), which is located ∼ 7 km to the southeast; data were retrieved from Weather Underground (https://www.wunderground.com/history/daily/us/mi/kalamazoo/KAZO, last access: 23 July 2018). Weather conditions were reported with a maximum time resolution of 1 h. This relatively long time resolution limits the use of higher-frequency data from other measurements, and therefore, we use 30 min averaged data, with the assumption that the weather condition lasted the entire hour. Weather conditions were classified using reported National Weather Service designations: clear weather conditions include fair, cloudy, mostly cloudy, and partly cloudy; snowfall includes light snow, snow, heavy snow, and wintry mix; fog includes fog and haze; and rainfall refers to light rain, rain, heavy rain, and thunderstorms. Wind speed and temperature data were also obtained from this weather station to supplement the rain case study (20–21 February), during which data from the sonic anemometer were unavailable.
2.2 Chemical ionization mass spectrometry measurements
Measurements of N2O5 and ClNO2 were conducted using a chemical ionization mass spectrometer (CIMS, THS Instruments) (Liao et al., 2011). The CIMS instrument uses iodide–water cluster reagent ions, I(H2O)−, to ionize analyte molecules, which are separated and quantified using a quadrupole mass analyzer. The CIMS was housed in a mobile laboratory trailer at the field site and sampled ambient air at ∼ 300 L min−1 through a specialized inlet. The inlet was designed to prevent wall losses of reactive species by allowing for the sampled air at the center of the ring to be de-coupled from the inlet walls (laminar flow), thereby avoiding wall surfaces (Huey et al., 2004; Neuman et al., 2002), as in previous campaigns (e.g., McNamara et al., 2019). The inlet consisted of a 30 cm long, 4.6 cm i.d. aluminum pipe attached to a stainless-steel ring torus 1.5 m above ground level. The airflow from this inlet was subsampled at 6.6 L min−1 into a 48 cm long, 0.95 cm i.d. FEP Teflon tube and through a custom three-way heated valve (30 ∘C) used to obtain calibration and background measurements. Of this airflow, an ozone monitor (model 205, 2B Technologies, Boulder, CO) sub-sampled 1.7 L min−1, and 0.9 L min−1 was sub-sampled into the CIMS ion-molecule reaction region, which was held at a constant pressure of 15.5 Torr. I(H2O)− reagent ions (Slusher et al., 2004) were generated by passing iodomethane (CH3I) in nitrogen (N2) through a 210Po radioactive ion source. The ion-molecule reaction region was humidified using water vapor from an impinger to prevent changes in ambient RH from altering CIMS sensitivity (Kercher et al., 2009; McNamara et al., 2019).
CIMS background measurements were conducted for 2 min every 15 min by passing the ambient air flow through a scrubber containing glass wool and stainless-steel wool (heated to 120 ∘C), which removed N2O5 and ClNO2 with 96.4 ± 0.8 % and 89 ± 1 % efficiency (mean ± 95 % confidence interval), respectively (McNamara et al., 2021). N2O5 was monitored at 235 (IN2O), and ClNO2 was monitored at 208 (I35ClNO) and 210 (I37ClNO), each with dwell times of 1.5 s. ClNO2 was positively identified using its measured isotopic ratio (Fig. S1 in the Supplement). The 3σ limits of detection (LODs), corresponding to the 2 min background periods, were 1.3 and 0.4 ppt for N2O5 and ClNO2, respectively. We report mole ratios as 30 min averages, for which the 3σ LODs for N2O5 and ClNO2 are estimated to be 0.3 and 0.1 ppt for N2O5 and ClNO2, respectively, calculated in the same manner as Liao et al. (2011). CIMS measurement uncertainties, which include propagated uncertainties associated with calibrations and fluctuations in the background signal, are estimated as 22 % + 0.3 ppt and 22 % + 0.1 ppt for 30 min averaged N2O5 and ClNO2 mole ratios, respectively. Calibrations in the field were conducted every 2 h by adding 0.2 L min−1 of 12.3 ± 0.2 ppb Cl2 (in N2) from a permeation source (VICI Metronics, Inc., Poulsbo, WA) to the ambient airflow. The permeation rate was measured by bubbling the permeation output into a solution of potassium iodide and measuring the oxidation product, triiodide (I), using UV–visible spectrophotometry at 352 nm (Liao et al., 2011). The instrument responses for N2O5 and ClNO2 were calibrated in the laboratory, with calibration factors relative to the response to Cl2 obtained, as described in McNamara et al. (2019).
Cl2 was monitored as I(Cl2)− at 197 and 199, each with dwell times of 0.5 s. The LOD for Cl2 at 197 was 2.4 ppt (0.6 ppt for 30 min averaged data). Cl2 was below its estimated LOD for 30 min averaging for 96 % of the nighttime periods (and 91 % of daytime periods), and therefore these limited data are not discussed. HNO3 was also monitored as I(HNO3)− at 190 with a dwell time of 0.5 s and calibrated offline relative to Cl2 (McNamara et al., 2020). However, there was a high background signal due to poor scrubbing efficiency (12±1 %), resulting in a high LOD of 43 ppt (11 ppt for 30 min averaged data). A total of 40 % of the nighttime HNO3 data during the campaign were below the LOD estimated for 30 min averaging, and therefore these data are not discussed in detail in this work. These upper limits for Cl2 and HNO3 mole ratios are important to report, given limited measurements of these compounds in urban snow-covered environments.
2.3 Ambient ion monitor–ion chromatography (AIM–IC)
PM2.5 chloride (Cl−) and nitrate (NO) were measured by an ambient ion monitor–ion chromatography instrument (AIM–IC; model 9000D, URG Corp., Chapel Hill, NC), as described in Chen et al. (2019). The AIM–IC and custom outdoor sampling inlet are described in detail by Markovic et al. (2012). Briefly, ambient air was sampled at 3 L min−1 through a 2.5 µm cyclone at a height of 1.8 m. A parallel-plate wet denuder (PPWD) supplied with diluted H2O2 separated soluble inorganic trace gases. Particles entered a supersaturation chamber (SSC), where hygroscopic growth was initiated prior to an inertial particle separator. The PPWD and SSC were placed outside in an insulated and heated aluminum case to reduce the sampling line length. Trace gas and particle samples were collected every hour using concentrator columns (anion, UTAC-ULP1, ultra-trace anion concentrator ultralow pressure; cation, TCC-ULP1, trace cation concentrator ultralow pressure; Thermo Fisher Scientific, Waltham, MA) for measurements every 2–4 h (3 h after 24 January) by an ion chromatograph (ICS-2100; Dionex Inc., Sunnyvale, CA). LiF was used as an internal standard. The 3σ LODs for Cl− and NO were 0.004 and 0.05 µg m−3, respectively, for 3 h sampling.
2.4 Aerosol size distribution measurements
Aerosol size distributions were measured using a scanning mobility particle sizer (SMPS, model 3082, TSI, Inc., Shoreview, MN), which measured electrical mobility diameter from 14.1–736.5 nm, and an aerodynamic particle sizer (APS, model 3321, TSI, Inc., Shoreview, MN), which measured aerodynamic diameter from 0.5–20 µm. The air was sampled through a 2.5 µm cyclone (URG Corp., Chapel Hill, NC) from an inlet height of ∼ 3 m. This flow was split from a manifold with a total flow rate of 16.8 L min−1 into foam-insulated copper tubing for each instrument; the SMPS and APS sub-sampled at 0.3 and 4.9 L min−1, respectively.
The field campaign nights from 20 January–24 February were divided into categories to investigate the impacts of weather events (rain, snowfall, fog), ground cover (snow-covered and bare ground), and atmospheric turbulence on the near-surface (∼ 1.5 m above ground) abundances of N2O5 and ClNO2 (Fig. 1). Time periods that were below LOD (0.3 and 0.1 ppt for 30 min averaged N2O5 and ClNO2, respectively) are included in calculations as 0.5×LOD. Data after 08:00 (approximately ±30 min from sunrise, which was at 08:07 on 20 January and 07:25 on 24 February) are not included such that air entrainment from the residual boundary layer, discussed elsewhere (e.g., Tham et al., 2016), does not influence the results discussed below.

Figure 1Mole ratios of 30 min averaged (a) ClNO2 and (b) N2O5 during the campaign and occurrence of snowfall (light blue), fog (green), and rainfall (purple). The shading below the x axis represents ground cover – snow (blue) or bare ground(brown). The black bars on the top of the plot show the selected case study nights for each weather event type. Between 18:00 and 08:00 EST, where n is number of 30 min periods, the air was clear 72 % of the time (n=726; 363 h), snowfall occurred 16 % of the time (n=157; 78.5 h), rainfall occurred 6 % of the time (n=63; 31.5 h), and fog occurred 6 % of the time (n=58; 29 h). The ground was snow-covered for 57 % of the study (20 d) and was bare for 43 % of the study (15 d). Figure S3 gives further details about the occurrence of weather events (rainfall, fog, snowfall) in relation to friction velocity and ground cover.
3.1 Effects of rain, snow, and fog (campaign-wide)
The nighttime abundances of N2O5 and ClNO2 during rain, snowfall, and fog were all significantly different (p<0.05, six t tests) from clear conditions (Fig. 2). Campaign-wide average nighttime (18:00–08:00) N2O5 and ClNO2 mole ratios during clear conditions and each type of weather event are listed in Table 1, with additional data (PM2.5 Cl− and NO, temperature, relative humidity, and friction velocity) for these time periods provided in Table S1. Here we discuss observations during these weather events across the entire campaign; example case studies are discussed in Sect. 3.2. The average nighttime N2O5 mole ratios (±95 % confidence interval) were 84±5, 47±2, 14±2, and 7.1±0.6 ppt during clear, snowfall, rain, and fog conditions, respectively (Fig. 2). In comparison to clear conditions, average N2O5 mole ratios were 37±5 ppt (factor of 1.8), 70±5 ppt (factor of 6.0), and 77±5 ppt (factor of 12) lower during snowfall, rain, and fog, respectively. The decrease in N2O5 abundance during fog suggests N2O5 uptake by fog droplets and is consistent with previous observations (Brown et al., 2016; Osthoff et al., 2006; Sommariva et al., 2009; Wood et al., 2005). More recently, a study by Osthoff et al. (2018) noted decreased ClNO2 abundance during drizzle/rain and fog during July–August in coastal British Columbia. However, clear conditions are generally the focus of previous N2O5 and ClNO2 studies (Chang et al., 2011; Simpson et al., 2015).
Table 1Mean (±95 % confidence interval) mole ratios of N2O5 and ClNO2, PM2.5 Cl− and NO concentrations, temperatures, and relative humidity during each type of weather event (clear, snow, fog, and rain) and ground cover (bare and snow-covered ground) measured across the entire campaign, between 18:00–08:00 EST. The numbers of 30 min periods (n) and percentages of nighttime periods classified as each weather condition are included in parentheses. Note that bare and snow-covered ground co-existed with the weather conditions, as discussed in Sect. 3.4. Averaged (30 min) values are reported with 95 % confidence intervals.
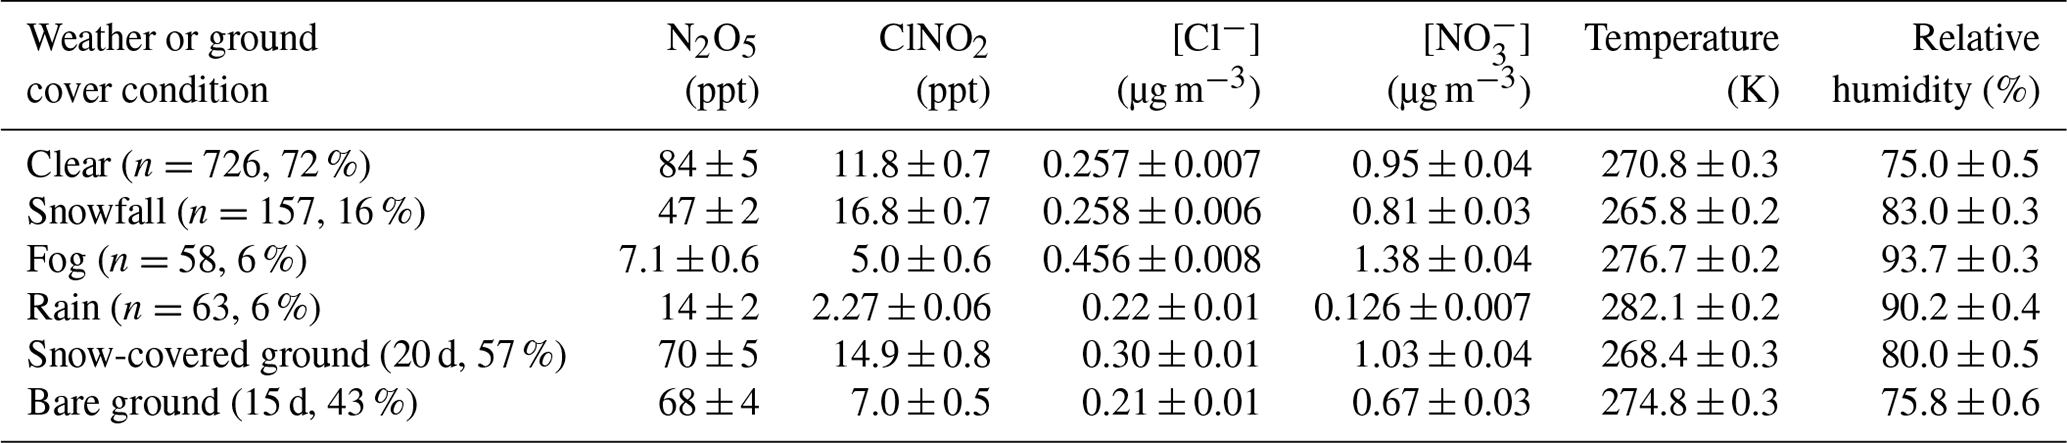
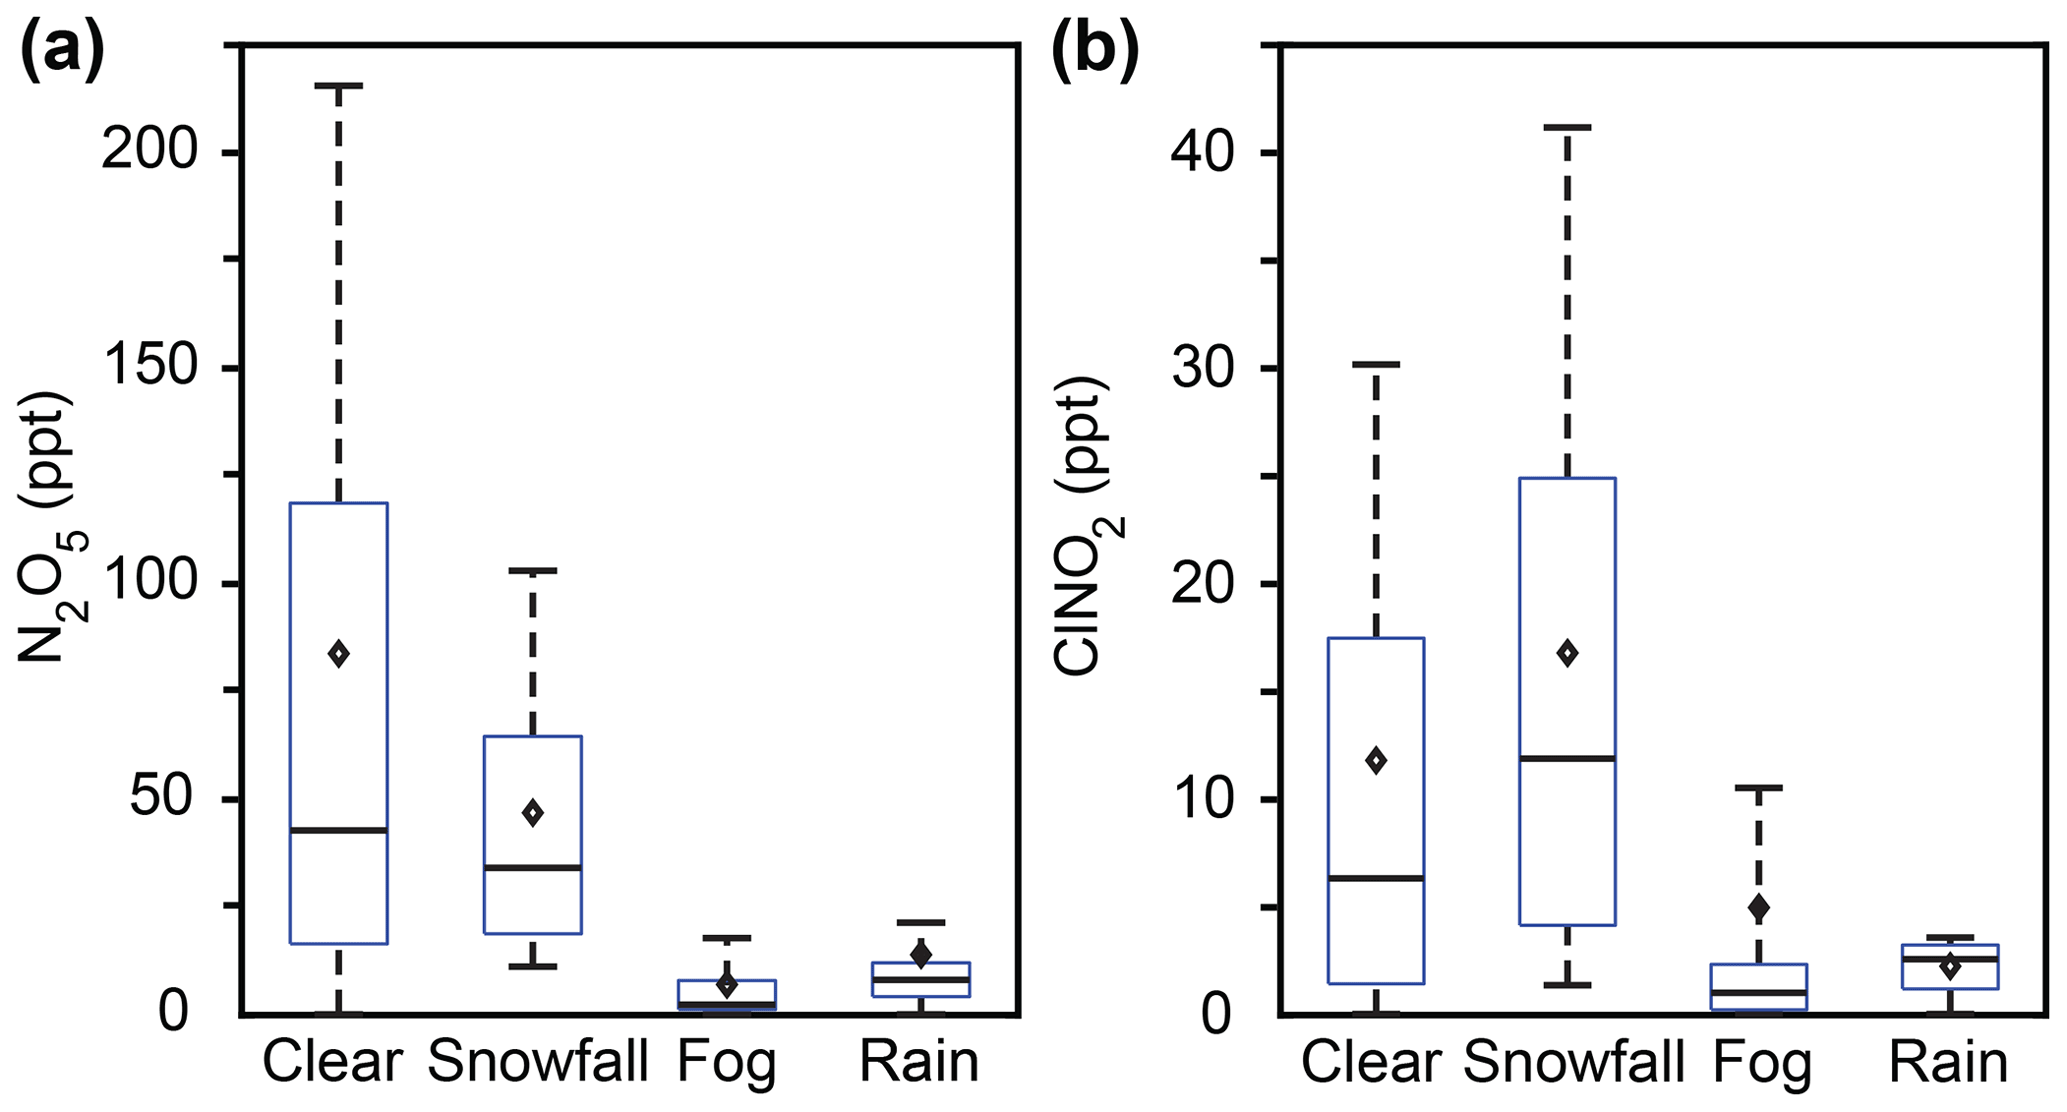
Figure 2Box plots showing 30 min averaged mole ratios of (a) N2O5 and (b) ClNO2 during clear conditions and weather events (snowfall, fog, and rain) from the entire campaign, 20 January–24 February. Bars represent the 10th, 50th, and 90th percentiles; boxes represent the 25th and 75th percentiles; and diamonds represent the means. Only nighttime data between 18:00 and 08:00 EST are included. Data during all weather events (snowfall, fog, rain) are significantly different (p<0.05, t test) from clear conditions.
The average ClNO2 mole ratios were 16.8 ± 0.7 ppt during snowfall, 11.8 ± 0.7 ppt in clear conditions, 5.0 ± 0.6 ppt during fog, and 2.27 ± 0.06 ppt when raining (Fig. 2). In comparison to clear conditions, average ClNO2 mole ratios were 6.8 ± 0.9 ppt (factor of 2.4) and 9.5 ± 0.7 ppt (factor of 5.2) lower during fog and rain, respectively. Lower average abundances of ClNO2 during fog and rainfall, compared to clear conditions, are consistent with previous observations (Osthoff et al., 2018) and were likely due to scavenging of either ClNO2 directly or its precursors (Reaction R2). In contrast, average ClNO2 mole ratios were 5 ± 1 ppt (factor of 1.4) higher during snowfall than clear conditions. This result is surprising, considering that its precursor, N2O5, showed lower mole ratios, on average, during snowfall in comparison to clear conditions. We hypothesize that snowpack ClNO2 production contributes to this observation, which is discussed in Sect. 3.3–3.4. Particle-phase chloride and nitrate concentrations were not statistically significantly different between clear and snowfall conditions (p=0.96 and 0.08, respectively), nor were aerosol number or surface area concentrations (p=0.06 and 0.31, respectively), as discussed in Sect. 3.5. The effects of temperature and relative humidity are discussed in Sect. 3.5.
3.2 Effects of rain, snow, and fog (case study nights)
To further examine the behavior of N2O5 and ClNO2 mole ratios in response to snowfall, rain, and fog, we present four nocturnal case study periods that were representative of the four different weather conditions (clear, snowfall, fog, and rain) observed during the campaign (Fig. 3). Case study nights were chosen to capture a sustained weather event (e.g., >7 h of clear conditions, snowfall, fog, or rainfall). Additionally, ground cover and friction velocity were matched as closely as possible for case study nights to the campaign-wide averages during different types of weather events. Additional data specific to the case studies are provided in the Supplement (Table S2, Figs. S4–S6). The clear-case night of 31 January–1 February had no precipitation or fog, an average u* of 0.16 ± 0.01 m s−1 (campaign average u* was 0.150 ± 0.004 m s−1 during nighttime clear conditions), and bare ground. N2O5 mole ratios were fairly stable around 200 ppt (average 200 ± 16 ppt, range 75–274 ppt) throughout the night, with ClNO2 mole ratios increasing steadily between 18:00–07:30 from 1.5 to 45 ppt (average 23 ± 5 ppt, range 0.6–4.5 ppt) (Fig. 3a).
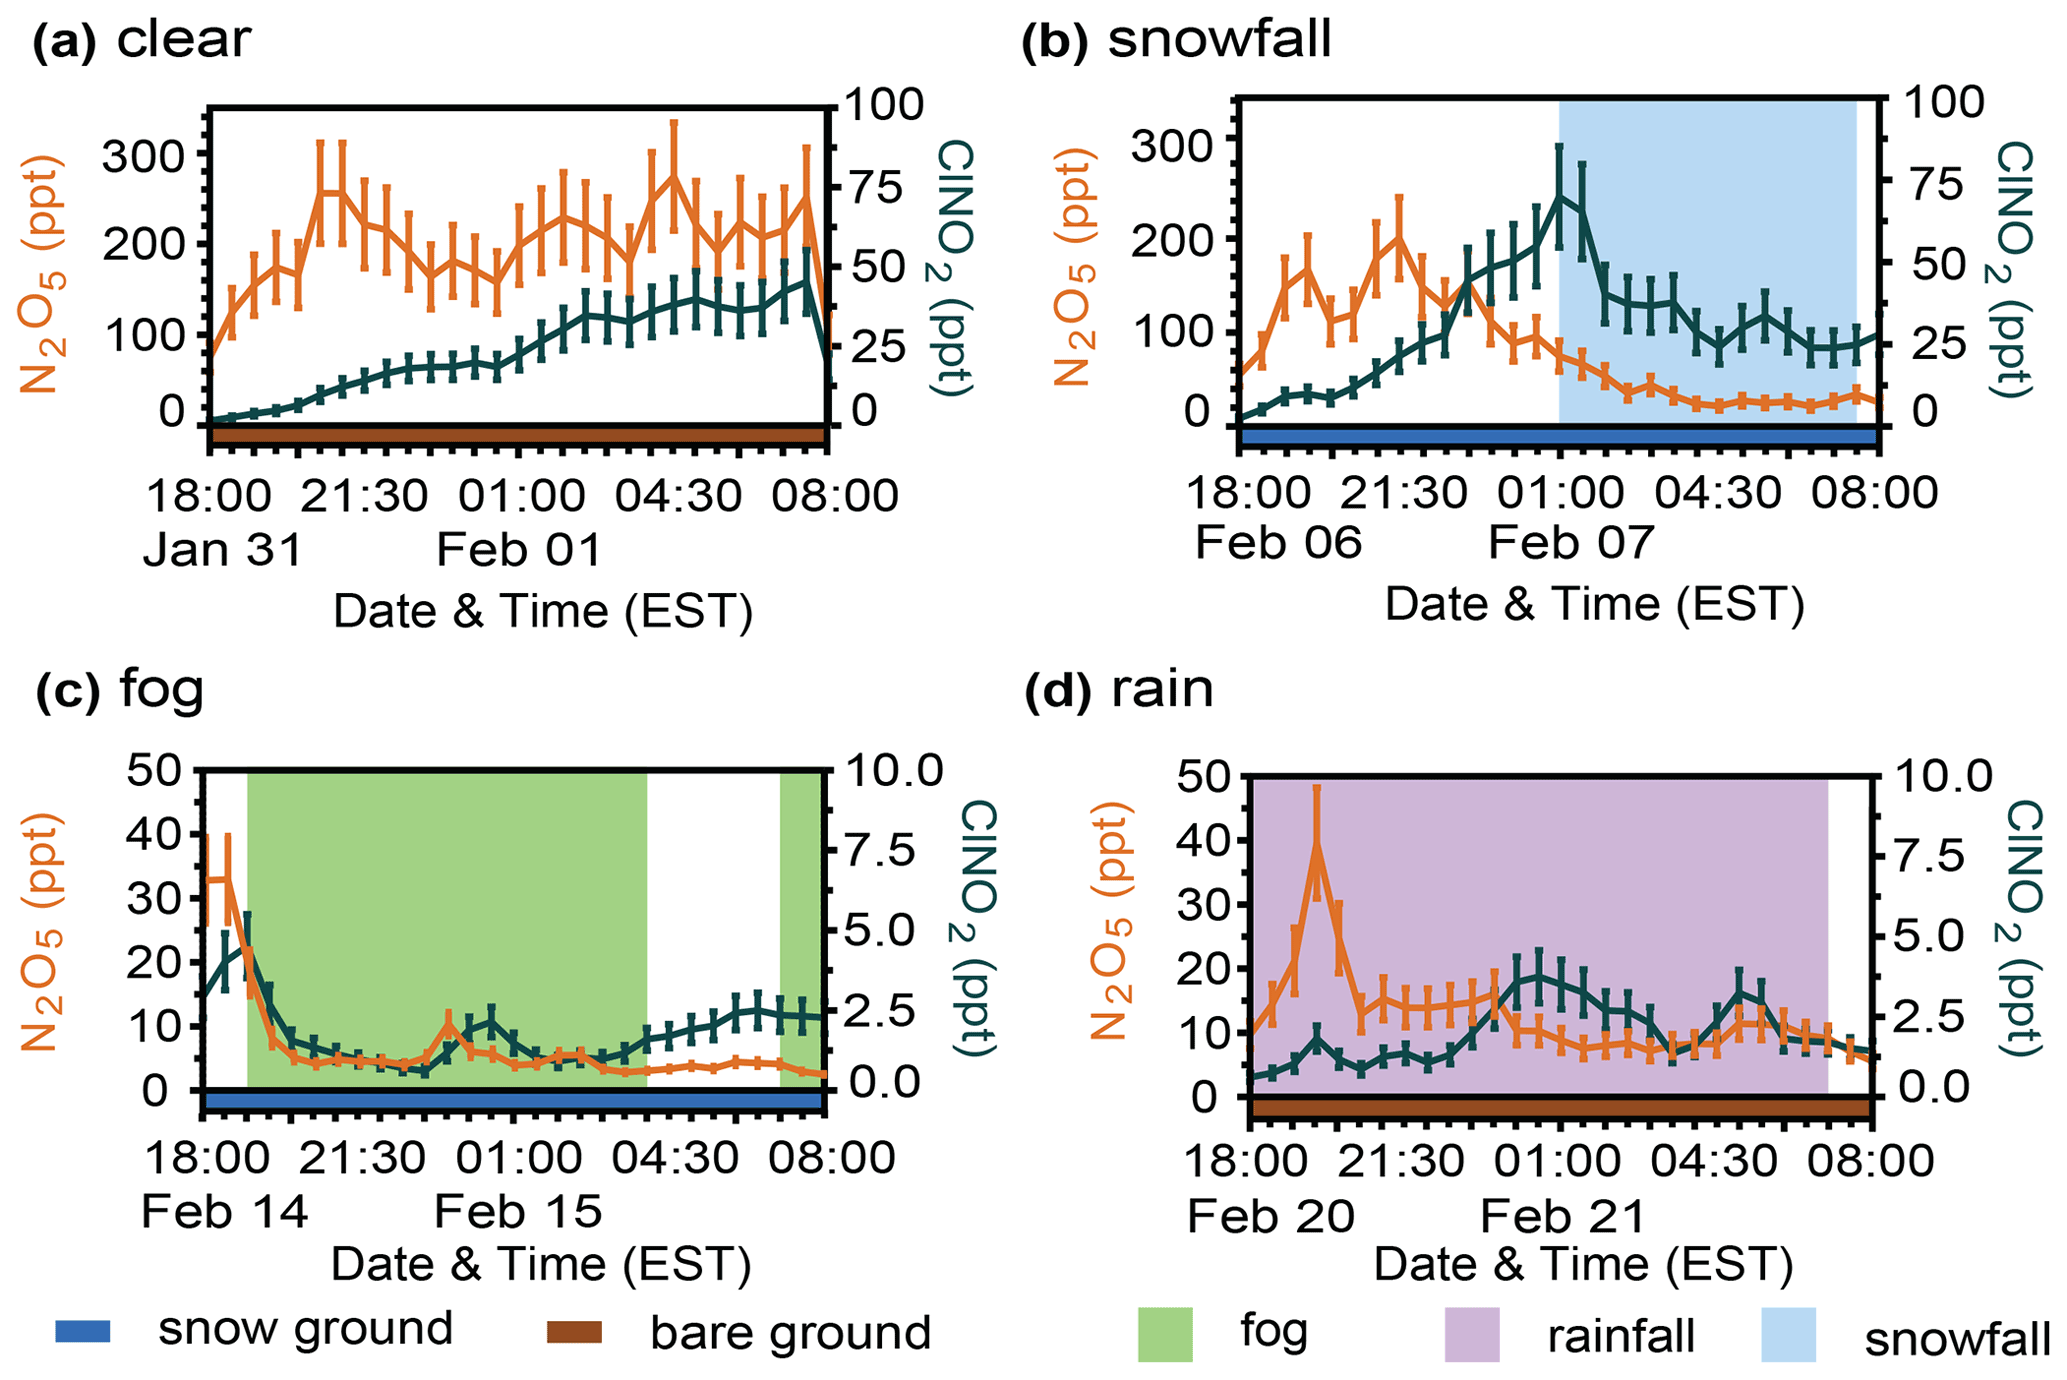
Figure 3Four example case study periods are shown, corresponding to (a) clear conditions, (b) snowfall, (c) fog, and (d) rainfall. The 30 min averaged abundances of N2O5 (orange) and ClNO2 (dark blue) are displayed for each case. Error bars represent propagated uncertainties. The shading below the x axis represents ground cover – snow (blue) or bare ground (brown).
To discuss changes in gas-phase concentrations during precipitation and fog, we apply the concept of solution equilibrium to the surface layer of a drop (i.e., a rain or fog droplet) in terms of a local equilibrium between the analyte in the gas phase and the analyte dissolved in the surface layer (Pruppacher and Klett, 1997). This equilibrium can then be described using Henry's law and Henry's law constants (KH). For N2O5, fast, irreversible hydrolysis is assumed, equivalent to an infinite effective KH (Jacob, 1986; Sander, 2015). For ClNO2, the mol m−3 Pa−1 at standard temperature (Frenzel et al., 1998; Sander, 2015), showing little variation between ∼ 278 and 294 K. Converting the KH for ClNO2 to its dimensionless Henry solubility (also called the air–water partitioning coefficient, KAW), as in Sander (2015), gives a unitless ratio between the aqueous and gas phases of >1 at temperatures above freezing. This means, at equilibrium, ClNO2 is expected to be more abundant in the aqueous phase than in the gas phase. The fast, irreversible hydrolysis assumed for N2O5 makes it more water soluble than ClNO2; therefore, scavenging by liquid droplets is expected for both gas-phase N2O5 and ClNO2, but to a greater extent for N2O5.
Here, we examine the fog and rainfall case studies to characterize the effects of scavenging by aqueous droplets on N2O5 and ClNO2 abundance. Variations in N2O5 and ClNO2 over the course of the nights are likely due to variability in fog/rainfall that were not resolved by the time resolution of the reported weather conditions, which also do not reflect precipitation rates or fog concentrations that would be expected to vary through the nights. For the fog case night of 14–15 February, fog was present from 19:00–04:00 and 07:00–08:00 (Fig. 3c). This case had an average u* of 0.18 ± 0.02 m s−1 (campaign average u* was 0.162 ± 0.007 m s−1 during nighttime fog) and snow-covered ground. N2O5 mole ratios decreased rapidly from the maximum of 32 ppt at 18:00 and fell to a local minimum of 2.3 ppt at 22:30; it then remained low in abundance (<10 ppt) for the rest of the night, reaching its true minimum of 1.1 ppt at 03:30. ClNO2 mole ratios reached the maximum of 4.5 ppt at 19:00 and then decreased coincident with the appearance of fog and remained low in abundance (<3 ppt) for the rest of the night, reaching its minimum of 0.6 ppt at 23:00. Considering the first hour after the fog onset (19:00–20:00), N2O5 mole ratios decreased from 16.6 ppt to 3.4 ppt (decrease of 13.2 ppt or 80 %), and ClNO2 mole ratios decreased from 4.5 to 1.6 ppt (decrease of 2.9 ppt or 64 %).
Similarly, the rainfall case night of 20–21 February was characterized by rainfall from 18:00–07:00 and bare ground (Fig. 3d). While sonic anemometer data were unavailable on this night, elevated wind speeds of 2.2–8.9 m s−1 (average = 5.0 ± 0.5 m s−1) (Fig. S4 and Table S2) are consistent with increased turbulence, with u* likely greater than 0.25 m s−1 for the duration of the night (Fig. S5). N2O5 mole ratios decreased rapidly from the maximum of 40 ppt at 19:30, stabilized at ∼ 15 ppt from 20:30–00:00, and then decreased again to ∼ 10 ppt until 08:00. ClNO2 mole ratios reached the maximum of 3.7 ppt at 00:30, with a second local maximum of 3.0 ppt at 05:30; ClNO2 abundance was < 2 ppt before 23:30 and after 06:00. The observations during the fog and rainfall case studies reinforce the trends observed for the campaign averages (Figs. 2–3) and illustrate the importance of scavenging by liquid droplets.
The snowfall case night of 6–7 February was characterized by snowfall from 01:00–07:30 (Fig. 3b), an average u* of 0.06 ± 0.01 m s−1 (campaign average u* was 0.129 ± 0.004 m s−1 during nighttime snowfall), and snow-covered ground. N2O5 mole ratios reached the maximum of 201 ppt at 21:30 and then gradually decreased throughout the rest of the night; it reached its minimum of 22 ppt at 04:00 and then remained low in abundance (22–34 ppt). ClNO2 mole ratios reached the maximum of 70 ppt at 01:00, the same time that snowfall began, and then decreased steadily to the minimum of 24 ppt at 04:30, after which it also remained low in abundance (24–34 ppt). Considering the first hour after snowfall onset (01:00–02:00), N2O5 mole ratios decreased from 74.8 to 53.6 ppt (decrease of 21.2 ppt or 28 %), and ClNO2 mole ratios decreased from 69.8 to 40.3 ppt (decrease of 29.5 ppt or 42 %).
The observations during the snowfall case are also consistent with campaign-wide observations (Figs. 2–3). In comparison to the clear case, the snowfall case night shows that N2O5 mole ratios were generally lower during snowfall (by a factor of 2.1, on average), whereas ClNO2 mole ratios were typically higher during snowfall (by a factor of 1.4, on average). Even though the clear case study had the highest mole ratios of N2O5, the snowfall case study had the highest mole ratios of ClNO2 (Fig. 3 and Table S2). The clear and snowfall case studies differed in both ground cover and air turbulence, with lower friction velocity (average = 0.06 ± 0.01 m s−1) and snow-covered ground observed during the snowfall case and intermediate friction velocity (average = 0.16 ± 0.01 m s−1) and bare ground observed during the clear case study. Additional effects on the abundances of N2O5 and ClNO2 are further investigated in the following sections.
3.3 Effects of turbulence
Turbulent mixing (quantified here using friction velocity, u*, Eq. 1) affects abundances of surface-level trace gases (Stull, 1988). Stronger turbulent mixing promotes vertical transport, and weaker turbulent mixing keeps trace gases near the ground (Stull, 1988). Turbulence regimes were divided within the context of our study to allow subsequent analysis by binning with sufficient data in each bin. Here, lower turbulence refers to m s−1, higher turbulence is m s−1, and mid-turbulence refers to m s−1. Lower turbulence occurred 39 % of the time, mid-turbulence occurred 42 % of the time, and higher turbulence occurred 14 % of the time (Fig. S3). For context, typical u* values range from near 0 m s−1 during calm conditions to 1 m s−1 during strong winds; moderate wind values often have u* values near 0.5 m s−1 (Stull, 2017). Lower friction velocity, in general, was observed during our study, which focuses on nighttime measurements during winter. We investigate the effects of atmospheric turbulence on the abundances of ClNO2 and N2O5 by comparing lower ( m s−1) and higher-turbulence ( m s−1) periods across 30 min averaged periods for a full diel cycle during the entire campaign (Fig. 4). Periods of snowfall, fog, and rainfall were included in this analysis due to the relationships which exist between weather events and friction velocity; for example, snowfall occurred most often during lower-turbulence conditions, while rainfall occurred most often during higher-turbulence conditions, the effects of which are further discussed in Sect. 3.5.
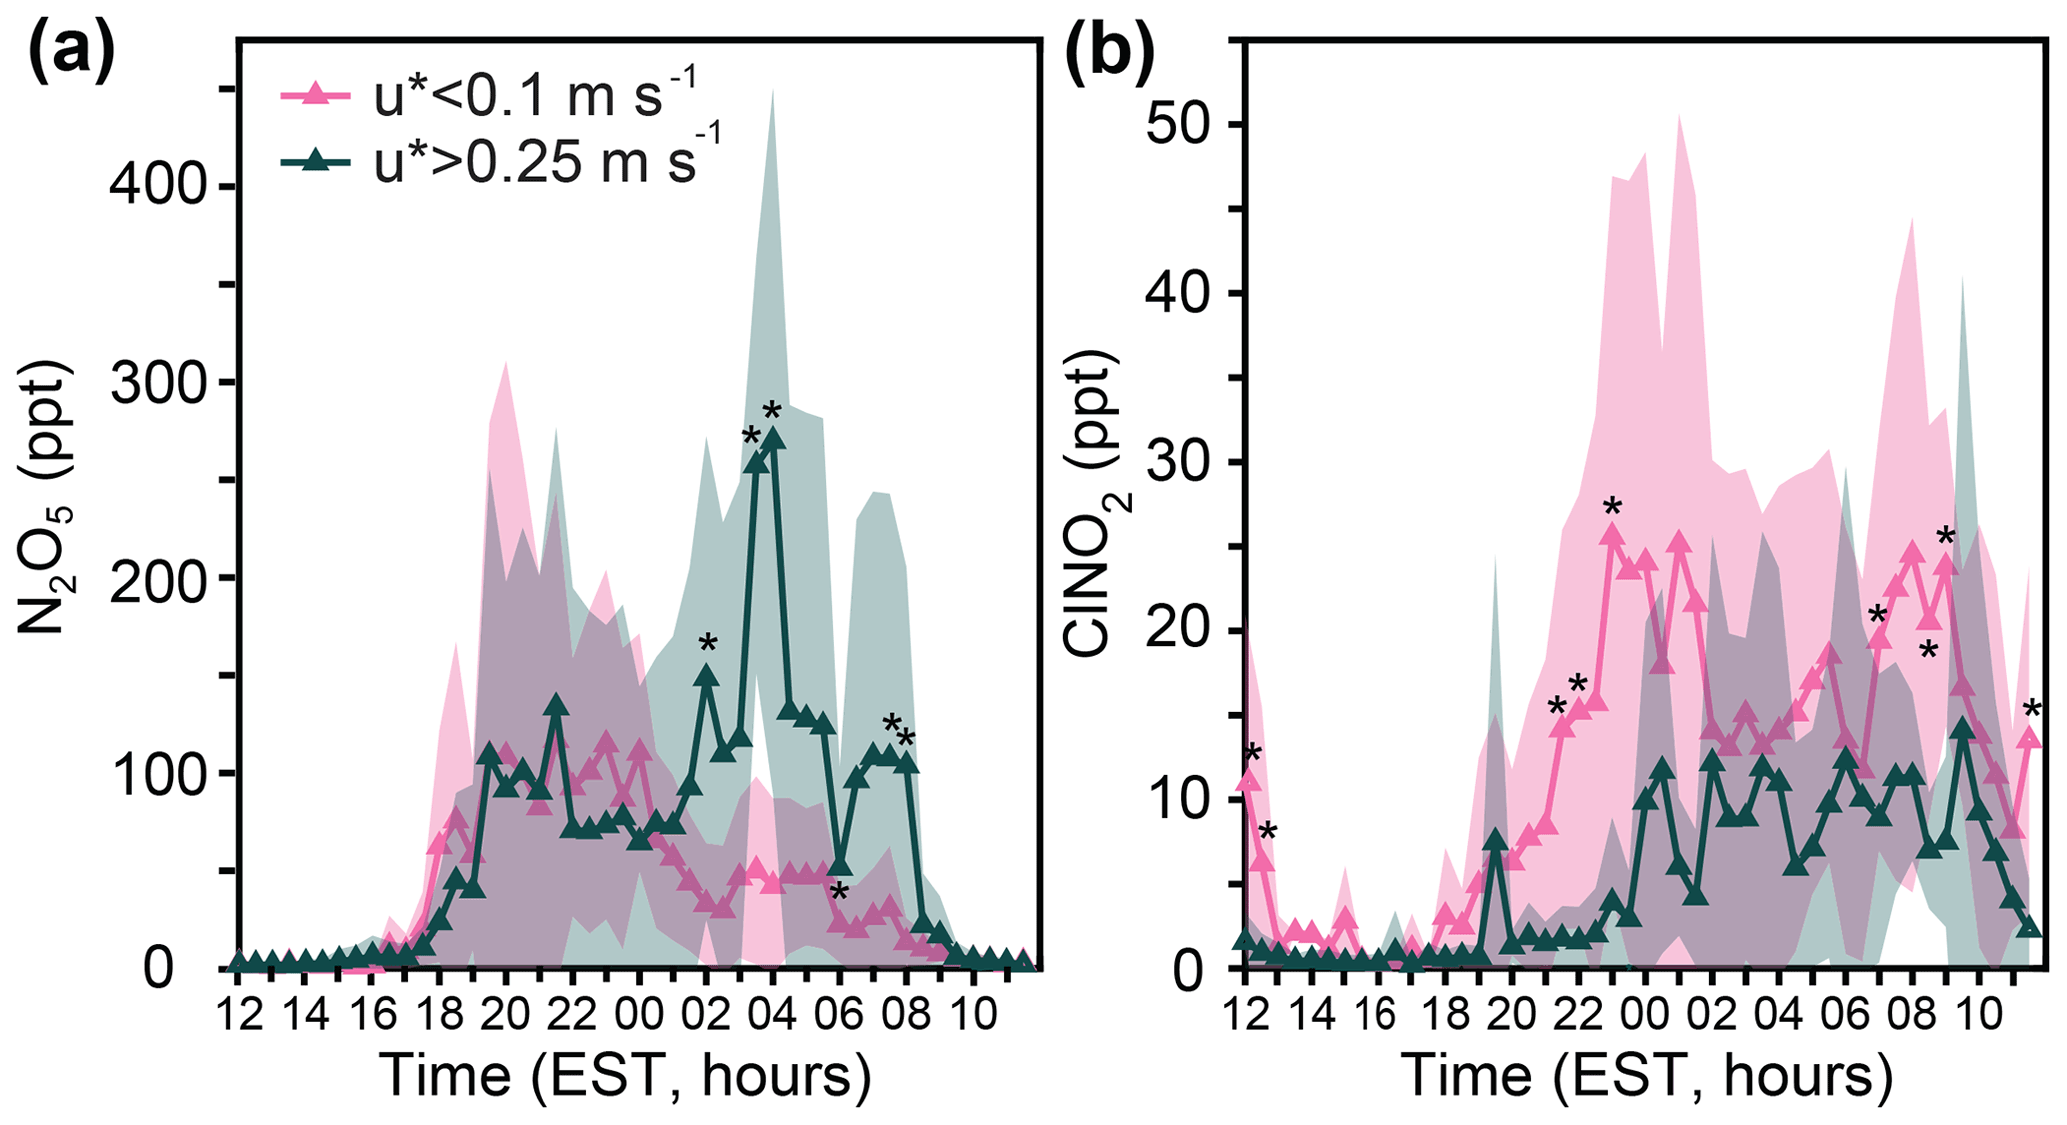
Figure 4Campaign-wide diel patterns of 30 min averaged (a) N2O5 and (b) ClNO2, binned by lower ( m s−1) and higher ( m s−1) friction velocities. Shading represents 1 standard deviation. Asterisks represent statistically significant (t test) differences at the p<0.05 level between the lower and higher friction velocity bins for each 30 min period from 20 January–24 February (excluding 20–21 February when the sonic anemometer was not operational). The number of 30 min time periods, from 18:00–08:00, is reported as n. Lower turbulence occurred 39 % of the time (n=391), and higher turbulence occurred 14 % (n=137) of the time. Sonic anemometer data were unavailable for 5 % (n=53) of nighttime periods.
Significantly higher (p<0.05, t test) N2O5 mole ratios were observed under higher-turbulence conditions at 02:00, 03:30, 04:00, 06:00, 07:30, and 08:00 (Fig. 4a). These statistically significant time points correspond to, on average, 5.9 times higher N2O5 mole ratios during higher-turbulence conditions, in comparison to lower-turbulence conditions. Considering the entire period of 02:00–08:00, N2O5 mole ratios were 4.0 times higher, on average, during higher-turbulence conditions in comparison to lower-turbulence conditions. Before 02:00, no statistically significant differences were observed in N2O5 abundance between higher- and lower-turbulence conditions, suggesting that titration of NO3 (N2O5 precursor, Reaction R3) by NO was not significant during these time periods. Considering the nighttime period as a whole (18:00–08:00), N2O5 mole ratios were higher by 24 ± 4 ppt (1.6-fold) during higher turbulence, in comparison to lower-turbulence conditions. For context in relation to the various weather conditions, higher turbulence ( m s−1) was present for 13 %, 9 %, 19 %, and 17 % of the time during clear, snowfall, fog, and rainfall conditions, respectively (Fig. S3).
NO3, a reactant necessary to produce N2O5 (Reaction R3), is sensitive to changes in NO and O3 levels; in particular, titration of NO3 by NO (Reaction R7) is an important loss process at night and results in lower N2O5 production (Asaf et al., 2010). Therefore, when NO is emitted and confined near the ground in the stable nocturnal boundary layer, NO3 has a short near-surface lifetime, thereby limiting N2O5 levels (Brown et al., 2007; Wang et al., 2006). Such stable conditions are associated with nocturnal temperature inversions, which can be observed during wintertime in the midlatitudes (Leblanc and Hauchecorne, 1997). As expressed by a kinematic heat flux less than 0 K m s−1, a nocturnal temperature inversion was observed every night of the study (Fig. S7). As expected during more stable conditions, reduced N2O5 mole ratios were observed during nighttime lower-turbulence periods ( m s−1) compared to higher-turbulence periods ( m s−1) (average N2O5 mole ratios of 40 ± 2 and 64 ± 3 ppt, respectively).
Vehicle NOx emissions from the nearby roadway located ∼ 80 m away (McNamara et al., 2021) are suggested to control the magnitude of the nighttime titration effect at the field site, as few time periods overnight were statistically different in O3 mole ratios between the lower- and higher-turbulence conditions, on average (Fig. S8). However, despite 39 % of the nighttime periods being characterized by lower turbulence ( m s−1) (Fig. S3), N2O5 mole ratios during the full campaign ranged from 0.15–702 ppt (mean 44 ± 4 ppt) during nighttime, resulting in the observed ClNO2 production even under lower-turbulence conditions. We explored the loss of NO3 to reaction with volatile organic compounds (e.g., Reaction R6) using a box numerical model (Sect. S1, Fig. S14 in the Supplement). These modeling results show that during the four case nights, which had varying temperatures, friction velocities, and ground cover (Fig. 3, Table S2), NO3 is simulated to be lost primarily through formation of ClNO2 and HNO3 (Fig. S14), rather than reaction with volatile organic compounds.
In contrast to its precursor N2O5, ClNO2 shows significantly higher (p<0.05, t test) average mole ratios under lower-turbulence ( m s−1) conditions at 21:30, 22:00, 23:00, and 07:00 (Fig. 4b). These statistically significant time periods correspond to an average 6.3 times higher ClNO2 mole ratio during lower-turbulence conditions, in comparison to higher-turbulence conditions. Considering the entire period of 21:30–07:30, ClNO2 mole ratios were 3.6 times higher, on average, during lower-turbulence conditions in comparison to higher-turbulence conditions. Considering the nighttime period as a whole (18:00–08:00), ClNO2 mole ratios were higher by 7 ± 1 ppt (2.6-fold) during lower-turbulence conditions, in comparison to higher-turbulence conditions.
In summary, average N2O5 mole ratios were significantly higher (p<0.05) at six different 30 min time periods, corresponding to 5.9 times higher N2O5 mole ratios during higher turbulence conditions, in comparison to lower-turbulence conditions. The reduced N2O5 mole ratios observed under lower-turbulence conditions are likely due to the short lifetime of NO3 (N2O5 precursor, Reaction R3) when vehicle NOx is emitted into the stable boundary layer, as observed in previous studies (Brown et al., 2007; Wang et al., 2006). However, average ClNO2 mole ratios were significantly higher (p<0.05) during four different 30 min time periods, corresponding to 6.3 times higher ClNO2 mole ratios during lower-turbulence conditions, in comparison to higher-turbulence conditions. This points to a likely surface source of ClNO2 upon surface deposition of N2O5. Therefore, in Sect. 3.4, we investigated the influence of ground cover.
3.4 Effects of ground cover
There were no statistically significant (p<0.05, t test) differences in the average abundances of N2O5 over the diel period for snow-covered vs. bare ground (Fig. 5a). This is consistent with measurements of similar net negative (deposition) fluxes of N2O5 over both snow-covered and bare ground (McNamara et al., 2021). The nighttime average mole ratios of N2O5 were 70 ± 5 and 68 ± 4 ppt over snow-covered and bare ground, respectively. In contrast, Fig. 5b shows significantly higher (p<0.05, t test) average ClNO2 mole ratios observed over snow-covered ground at 19:30–22:00, 23:00–00:00, 01:00–01:30, 03:00, and 07:30. These statistically significant time points correspond to, on average, 3.5 times higher ClNO2 mole ratios over snow-covered ground, in comparison to bare ground. Considering the entire period of 19:30–07:30, ClNO2 mole ratios were 2.8 times higher, on average, over snow-covered ground in comparison to bare ground. This is consistent with measurements of typical net positive (production) fluxes of ClNO2 over snow-covered ground, and with field-based chamber experiments showing that ClNO2 can be produced from the reaction of N2O5 on the saline snowpack (McNamara et al., 2021). The nighttime average mole ratios of ClNO2 were 14.9 ± 0.8 and 7.0 ± 0.5 ppt over snow-covered and bare ground, respectively.
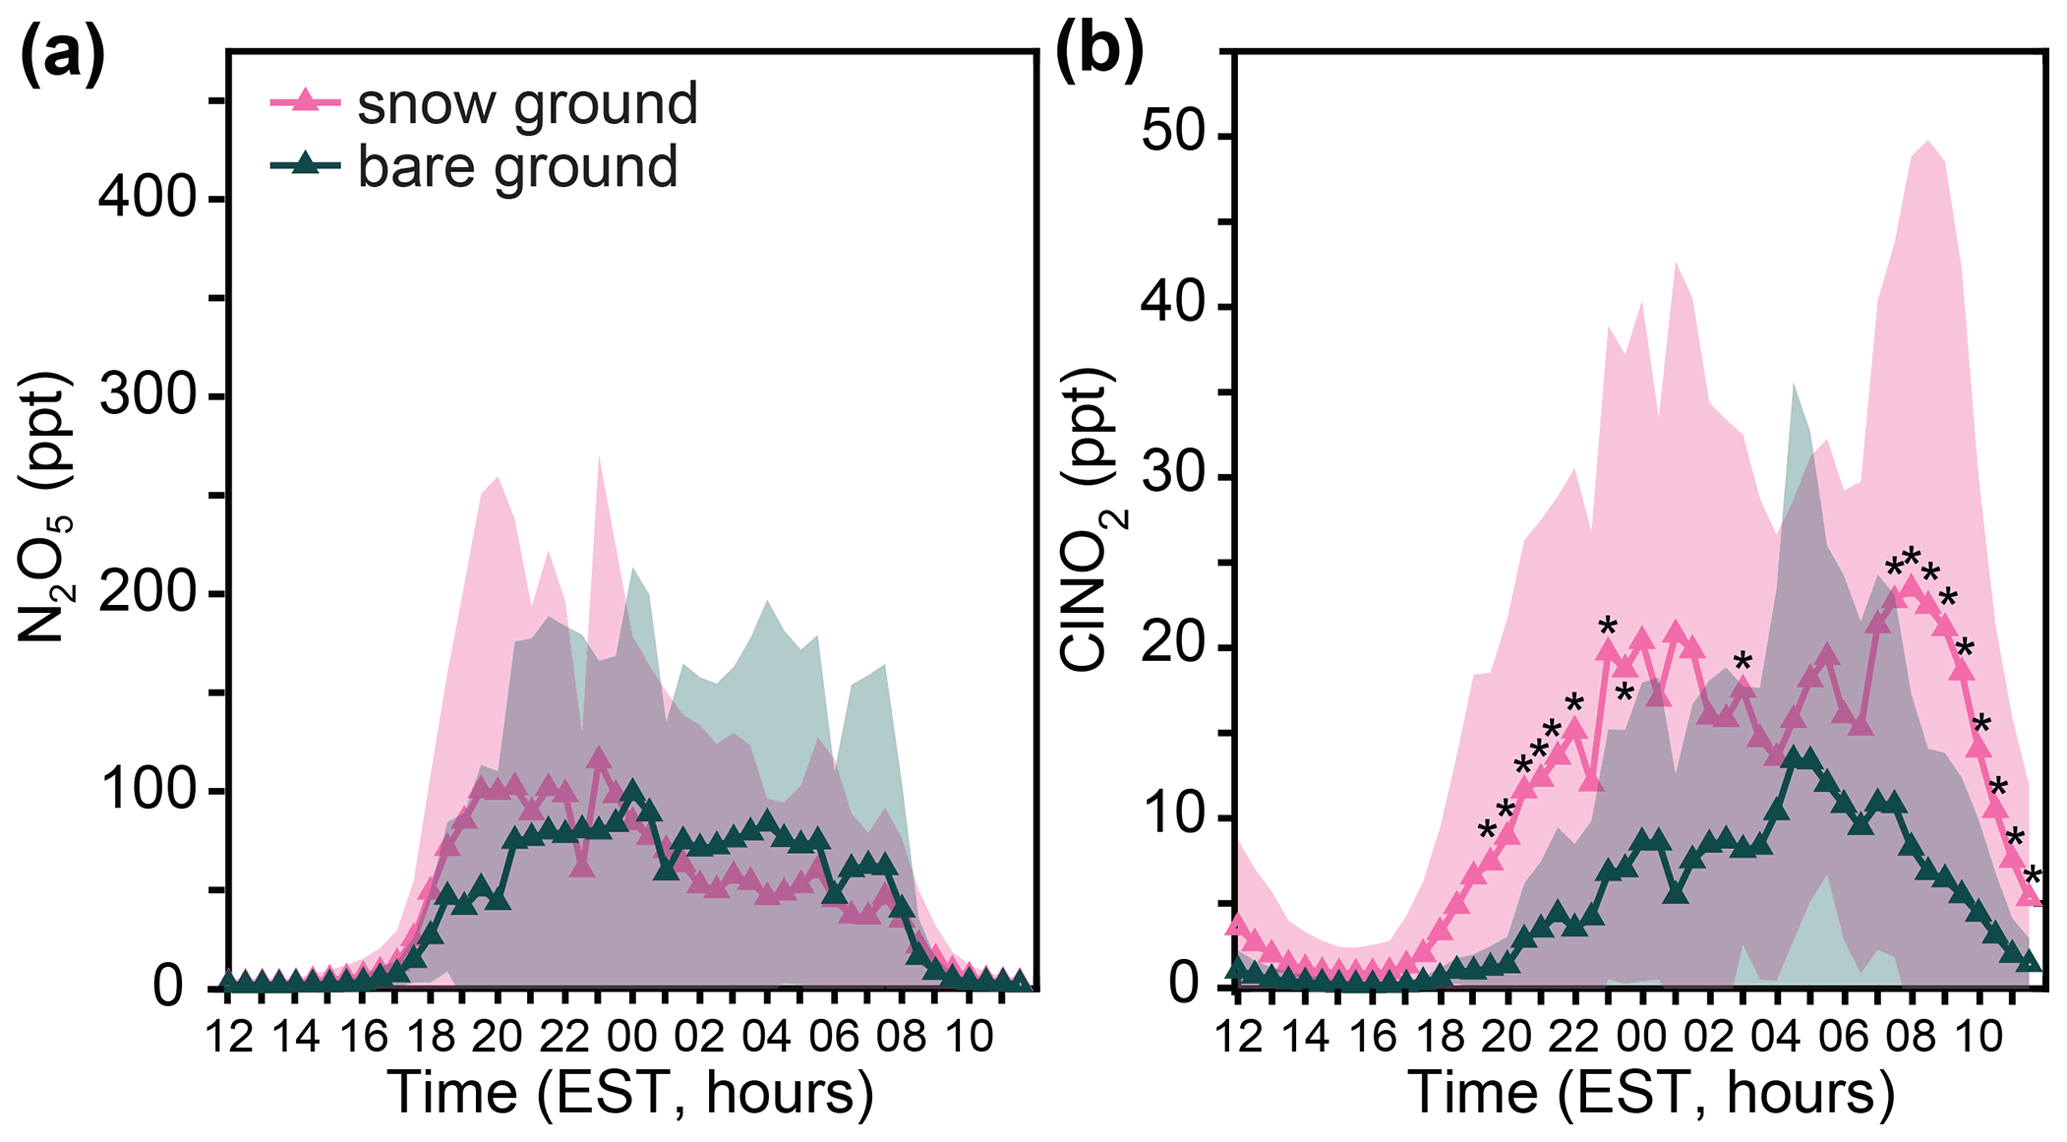
Figure 5Diel patterns of 30 min averaged mole ratios of (a) N2O5 and (b) ClNO2 binned by snow-covered and bare-ground conditions from 20 January to 24 February. Shading represents 1 standard deviation. Asterisks represent statistically significant (t test) differences at the p < 0.05 level between snow-covered and bare ground for each 30 min time period. The ground was snow-covered 57 % (20 d) of the study and was bare for 43 % (15 d) of the study.
To summarize, there were no statistically significant (p<0.05) differences in average N2O5 mole ratios over the diel period for snow-covered versus bare ground. Yet, significantly higher (p<0.05) average ClNO2 mole ratios were observed over snow-covered ground for 11 (of 28) nighttime 30 min time periods, corresponding to 3.5 times higher ClNO2 mole ratios over snow-covered ground, in comparison to bare ground. During the same field campaign, net positive (production) fluxes of ClNO2 were measured over snow-covered ground, and field-based chamber experiments showed that ClNO2 can be produced from the reaction of N2O5 on the saline snowpack (McNamara et al., 2021). The observed enhancement of ClNO2 over snow-covered ground results herein suggests that snowpack ClNO2 production was a frequent and significant occurrence across the field campaign (e.g., enough to influence the campaign-wide average results). We investigate the effects of other parameters (e.g., PM2.5 Cl−, NO, temperature, relative humidity, O3 concentration, aerosol surface area, and pressure) in Sect. 3.5.
3.5 Competing effects of environmental conditions
Many of the environmental conditions discussed (precipitation/fog, turbulence regimes, and snow-covered/bare ground) occur simultaneously and, as a result, are difficult to discuss in isolation. Higher mole ratios of N2O5 were observed under higher-turbulence conditions ( m s−1) (Sect. 3.3), which occurred most frequently (67 %) over bare ground (Fig. S3). In contrast, higher mole ratios of ClNO2 were observed under lower-turbulence conditions ( m s−1) (Sect. 3.3), which occurred most frequently (73 %) over snow-covered ground (Fig. S3). For select nights when vertical profile experiments were conducted by McNamara et al. (2021) during the same campaign, no statistically significant difference (p=0.48) was observed for N2O5 deposition fluxes over bare ground versus snow-covered ground. Lower turbulence ( m s−1) and snow-covered ground were observed simultaneously for 24 %, 48 %, 26 %, and 2 % of the time during clear, snowfall, fog, and rainfall conditions, respectively (Fig. S3). The prevalence of lower turbulence and snow-covered ground during snowfall likely also contributes to the result that mole ratios of ClNO2 were highest on average during snowfall (Fig. 2). These trends are consistent with snowpack ClNO2 production, as also evidenced by the positive (upward) ClNO2 fluxes observed over snow-covered ground and negative (downward) ClNO2 fluxes observed over bare ground, during separate vertical profile experiments during the same campaign (McNamara et al., 2021).
Given that multiple environmental factors that control N2O5 and ClNO2 mole ratios were changing across the various weather conditions, we used a box numerical model, described in Sect. S1, to explore the variations in N2O5 and ClNO2 abundances that can be attributed to changes in temperature, pressure, O3 mole ratios, and aerosol surface area across the four case study nights. This numerical model does not consider the impacts of fog, rainfall, snowfall, ground cover, turbulence, or advection. Note that no relationship was observed between wind direction or wind speed and mole ratios of N2O5 or ClNO2 (Fig. S13), suggesting limited advection influence. Further, under the low-wind-speed conditions of the campaign (nighttime median = 1.0 m s−1), the gas mole ratios are expected to be higher in response to decreased atmospheric dispersion of gases and emissions/deposition from nearby sources and/or sinks. Therefore, we mainly attribute differences between calculated and measured N2O5 and ClNO2 abundances primarily to the effects of non-parameterized meteorological processes (e.g., wet deposition and fog droplet scavenging). The model results (Figs. 6, S14–S16) are discussed in detail in Sect. S2. Importantly, we conclude that variations in temperature, pressure, O3 mole ratios, and aerosol surface area between the different case studies are insufficient to explain the significant differences in N2O5 and ClNO2 mole ratios observed between these case study nights and point to the importance of other processes, including scavenging, discussed in this paper.
For the clear, snowfall, fog, and rainfall case study nights, simulated N2O5 mole ratios averaged 150, 190, 140, and 380 ppt, respectively, during the last 4 h of the simulation (hours 10–14, 04:00–08:00 EST, to account for model spin-up and stabilization) (Fig. 6). In comparison, the maximum observed N2O5 mole ratios were 274, 34.2, 2.7, and 11.4 ppt from 04:00–08:00 EST during the clear, snowfall, fog, and rainfall cases, respectively (Fig. 6). While plausible scenarios of [NO2] and N2O5 uptake could simulate the observed N2O5 mole ratios (Fig. S15), the model scenario corresponding to previous work in wintertime Ann Arbor, MI (McNamara et al., 2020), underpredicts the average N2O5 mole ratio (229 ppt) by 42 %. However, in contrast, the model drastically overpredicted N2O5 mole ratios for both the fog case (by a factor of ∼ 50) and rainfall case (by a factor of ∼ 30) and also overpredicted N2O5 mole ratios during the snowfall case (by a factor of ∼ 5). As discussed in Sect. S2, realistic model conditions could not simulate the observed N2O5 mole ratios for the fog, rainfall, and snowfall cases. This supports scavenging as a missing N2O5 sink, with this being most significant during fog and rainfall and potentially also contributing during snowfall.
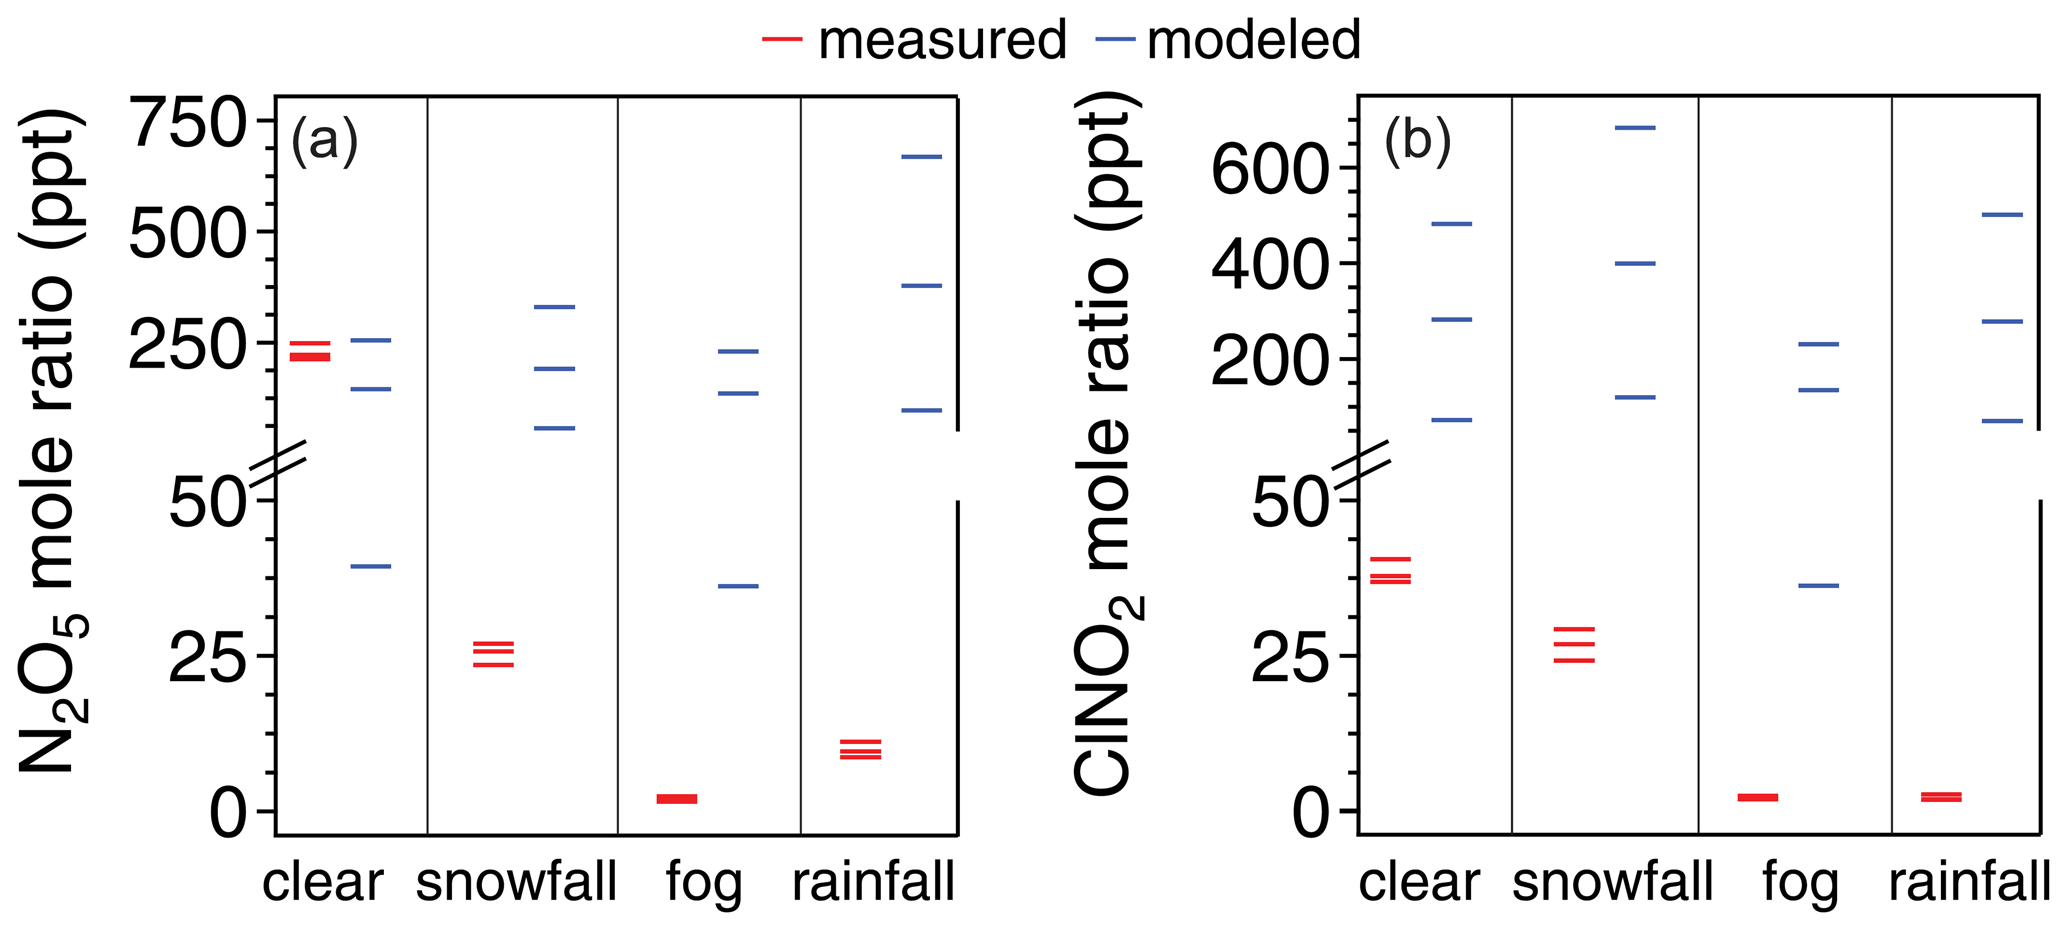
Figure 6A comparison of measured (red) vs. modeled (blue) mole ratios of N2O5 (a) and ClNO2 (b) for each case study night. For measured values, the minimum, average, and maximum mole ratios from 04:00–08:00 EST of each case study (Fig. 3) are shown. For modeled values, the average mole ratios from the last 4 h of each 14 h simulation are shown; model inputs for the case studies are described in Sect. S1. Here, we hold the γ×φ product (N2O5 uptake × ClNO2 yield) constant at 0.0037, and we show the model outputs when [NO2] = 9.4, 31, and 59 ppb, respectively; [NO2] = 9.4 ppb produced the lowest modeled values of N2O5 and ClNO2, and [NO2] = 59 ppb produced the highest modeled values of N2O5 and ClNO2. For context, McNamara et al. (2020) previously reported a modeled median [NO2] of 31 ppb and γ×φ product constant of 0.0037 for wintertime Ann Arbor, MI.
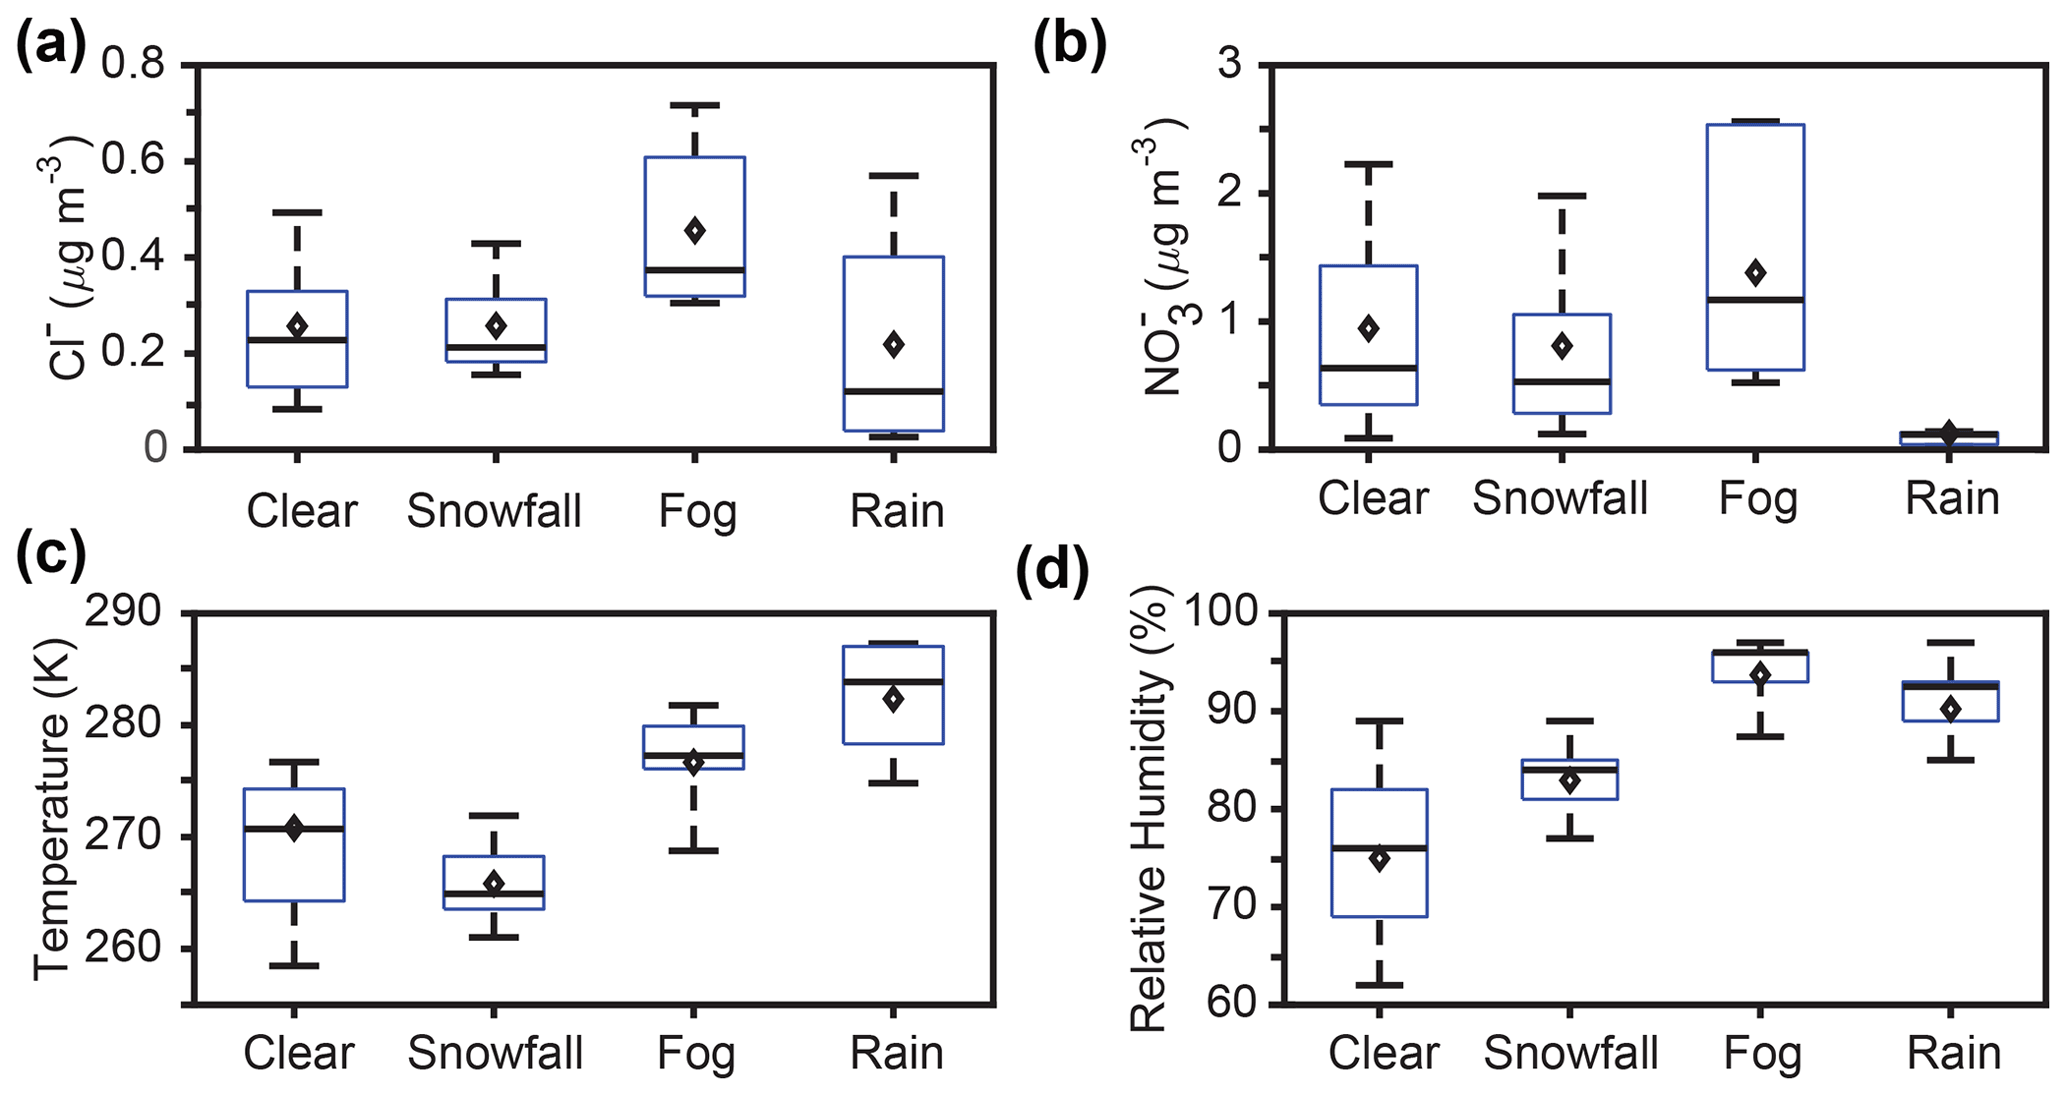
Figure 7Box plots showing 30 min averaged PM2.5 (a) chloride and (b) nitrate concentrations, (c) air temperatures, and (d) relative humidity values during clear conditions and weather events (snowfall, fog, and rain). Bars represent the 10th, 50th, and 90th percentiles, boxes represent the 25th and 75th percentiles, and diamonds represent the means. Only nighttime data, between 18:00 and 08:00 EST, are included.
Considering the entire SNACK field campaign, temperature was statistically significantly different between clear conditions and snowfall, fog, and rainfall, respectively (p<0.05, t test) (Fig. 7c). The average nighttime temperatures were 265.8 ± 0.2, 270.8 ± 0.3, 276.7 ± 0.2, and 282.1 ± 0.2 K during snowfall, clear conditions, fog, and rainfall, respectively. Since net N2O5 production (Reaction R3) is favored at lower temperatures (Asaf et al., 2010; Wagner et al., 2013), and because snowfall conditions had the lowest average temperature (Fig. 7c), we would expect N2O5 to be highest in abundance during snowfall if other processes did not dominate. In contrast, the measurements showed the highest average N2O5 mole ratios during clear conditions (Fig. 2), highlighting the importance of other effects, including wet scavenging. Further, as shown in the case study model simulations, discussed above, which did not consider scavenging, simulated N2O5 mole ratios were highest during the rainfall case due to lower aerosol surface area concentrations and second highest during the snowfall case because of the temperature effect (Fig. 7). Therefore, we conclude that temperature alone cannot explain the significant differences in N2O5 mole ratios between the clear, fog, rainfall, and snowfall conditions.
Relative humidity was also statistically significantly different between clear conditions and snowfall, fog, and rainfall, respectively (p<0.05) across the SNACK field campaign (Fig. 7d). The average nighttime RH values were 75.0 ± 0.5 %, 83.0 ± 0.3 %, 90.2 ± 0.4 %, and 93.7 ± 0.3 % during clear conditions, snowfall, rainfall, and fog, respectively. Higher RH typically increases N2O5 partitioning from the gas to aqueous phases (e.g., Osthoff et al., 2006; Sommariva et al., 2009; Wood et al., 2005). Indeed, the pattern of N2O5 abundance was anticorrelated with RH (Figs. 2 and 7d). This reinforces that N2O5 heterogeneous uptake is strongly RH dependent (Bertram et al., 2009; Davis et al., 2008; Evans and Jacob, 2005; Griffiths and Cox, 2009; Hallquist et al., 2003), with enhanced uptake and removal occurring when RH and aerosol liquid water content are high.
The box model overestimated ClNO2 mole ratios for the clear case (by a factor of ∼ 6), despite lower simulated N2O5 mole ratios compared to modeled values (by ∼ 42 %) (Fig. 6), as discussed in the Sect. S2. Since the chosen values for [NO2], N2O5 uptake, and ClNO2 yield corresponded to previous work in wintertime Ann Arbor, MI (McNamara et al., 2020), this points to the variability and need to better constrain N2O5 uptake and ClNO2 yield, as highlighted previously by McDuffie et al. (2018). However, realistic model conditions could be chosen to simulate the observed clear-case N2O5 and ClNO2 mole ratios (Figs. S15 and S16). In contrast to the clear case, realistic [NO2], N2O5 uptake, and ClNO2 yield values could not be chosen to simulate the observed ClNO2 mole ratios for the other conditions, similar to the result for N2O5 mole ratios, discussed above. Average simulated ClNO2 mole ratios were 400, 140, and 280 ppt for the snowfall, fog, and rainfall cases, respectively, during the last 4 h of the simulation (Fig. 6). In comparison, the maximum observed ClNO2 mole ratios were 33.6, 2.5, and 3.2 ppt from 04:00–08:00 EST of the snowfall, fog, and rainfall cases, respectively (Fig. 6). Further, the model drastically overpredicted ClNO2 mole ratios during the fog case (by a factor of ∼ 50, similar to the N2O5 mole ratio overprediction) and rainfall case (by a factor of ∼90, compared to ∼30 times overprediction of N2O5 mole ratios), but also overpredicted ClNO2 mole ratios during the snowfall case (by a factor of ∼ 12, compared to a factor of ∼ 5 for N2O5 mole ratios). The similar overprediction of N2O5 and ClNO2 during fog supports fog droplet scavenging of N2O5, in particular, as a missing sink in the model. The higher overprediction of ClNO2 mole ratios, compared to N2O5, during the rainfall case, in particular, suggests that ClNO2, in addition to N2O5, likely undergoes scavenging/wet deposition.
We also investigated N2O5 and ClNO2 levels in the context of observed PM2.5 Cl− and NO concentrations. The measurement averages for these parameters are given for clear conditions and each type of weather event in Table 1, with additional data provided in Table S2. As shown by Bertram and Thornton (2009), both N2O5 uptake and the product yield of ClNO2 are expected to increase with increasing particulate chloride concentrations. The effects of increased particulate chloride are twofold, with less N2O5 expected to remain in the gas phase due to the increased uptake and a higher ClNO2 abundance expected because of the higher product yield. PM2.5 Cl− concentrations were not statistically significantly different between snowfall and clear conditions (p=0.96, t test), between snowfall and rainfall (p=0.11), or between clear and rainfall conditions (p=0.10) (Fig. 7a).
PM2.5 Cl− concentrations were statistically significantly higher during fog, in comparison to clear conditions (p<0.05), with the average concentration during fog higher by 0.20 ± 0.01 µg m−3 (factor of 1.8) on average. Although total submicron aerosol number concentrations were not statistically significantly different between clear and fog conditions (p=0.88), submicron aerosol surface area concentrations were significantly higher (p<0.05) during fog compared to clear conditions, by 52 ± 7 µm2 cm−3 (factor of 1.3) with respect to campaign averages (Figs. S11–S12). N2O5 uptake is expected to increase with increasing aerosol surface area concentration (Bertram and Thornton, 2009), but despite elevated PM2.5 Cl− and aerosol surface area concentrations during fog, average ClNO2 abundance was lower during fog in comparison to clear conditions (Fig. 2). We expect that, during fog, elevated RH (Fig. 7d) has a greater impact on ClNO2 abundance than PM2.5 Cl− concentration or aerosol surface area concentration. Production of particle-phase chloride, presumed to be from uptake of gas-phase HCl, has been observed previously during fog/haze events in highly polluted urban India (Gunthe et al., 2021) and near an incinerator (Johnson et al., 1987). However, for this study in Kalamazoo, MI, road salting seems more plausible as the dominant source of increased PM2.5 Cl− (Kolesar et al., 2018) during wintertime fog.
N2O5 uptake results in particulate nitrate production; however, the efficiency of N2O5 uptake to particles decreases with increasing particulate nitrate concentrations (Bertram and Thornton, 2009). PM2.5 NO concentrations were not statistically significantly different between snowfall and clear conditions (p=0.08). PM2.5 NO concentrations during rain were statistically significantly lower, in comparison to clear conditions (p<0.05), with average concentrations lower by 0.82 ± 0.04 µg m−3 (a factor of 7.5) (Fig. 6b). This is attributed to increased scavenging and wet deposition of nitrate during rainfall, compared to snowfall, which is consistent with previous observations and calculations of scavenging coefficients for nitrate during rainfall and snowfall in winter in New York (Hameed and Sperber, 1986).
Particles rich in nitrate have been observed previously in the droplet mode (0.8–0.9 µm) during fog events; these particles form following fog droplet evaporation after nitrate production from HNO3 and N2O5 uptake (Dall'Osto et al., 2009; Ge et al., 2012). In contrast to rain and snowfall, PM2.5 NO concentrations were statistically significantly higher during fog, in comparison to clear conditions (p<0.05), by 0.43 ± 0.06 µg m−3 (160 ± 20 ppt; a factor of 1.5) (Figs. 6b and S10). The increase in PM2.5 NO is likely, in part, the result of heterogeneous uptake and hydrolysis of N2O5 (Brown et al., 2004; Osthoff et al., 2006), consistent with our observation of the lower average N2O5 mole ratios during fog (Fig. 2). On average, N2O5 was 76 ± 5 ppt lower during fog compared to clear conditions (Figs. 2 and S10). While this difference is not completely attributable to N2O5 uptake, it would correspond to a nitrate concentration of 0.21 µg m−3. In addition to N2O5, gas-phase HNO3 uptake likely also contributed to the increased PM2.5 NO observed during fog. Due to its high solubility, HNO3 is predicted to be efficiently scavenged by fog droplets (> 90 %–100 % removal) (Ervens, 2015). However, due to the limited HNO3 data available (Fig. S9), a quantitative evaluation of HNO3 contribution to nitrate production was not possible. It is likely that both N2O5 and HNO3 uptake, followed by aqueous-phase nitrate formation, led to the increased PM2.5 NO observed during fog.
We examined the impacts of precipitation (rain, snowfall) and fog, atmospheric turbulence, and ground cover (snow-covered vs. bare) on near-surface (∼ 1.5 m above ground) N2O5 and ClNO2 observed from January to February 2018 in Kalamazoo, Michigan. While N2O5 was observed during all nights of the campaign, N2O5 mole ratios were lowest during periods of lower turbulence ( m s−1) due to titration of NO3 and O3 by NO in the stable nocturnal boundary layer. N2O5 mole ratios were not statistically significantly different over bare versus snow-covered ground. ClNO2 mole ratios were highest during periods of lower turbulence and snow-covered ground. This is consistent with N2O5 depositing and reacting with the chloride-containing snowpack to produce ClNO2. Indeed, vertical gradient measurements during the same study showed N2O5 deposition and an average positive (production) ClNO2 flux over snow-covered ground, and snow chamber experiments showed that synthesized N2O5 reacted with the local saline snow to produce ClNO2 (McNamara et al., 2021). This finding is also consistent with the laboratory study by Lopez-Hilfiker et al. (2012), which showed that N2O5 can react on halide-doped ice surfaces to produce ClNO2. The contribution of the snowpack as a common ClNO2 source across the field campaign has important implications for the vertical distribution of atmospheric chlorine chemistry, which will be examined in a future paper through one-dimensional modeling for comparison with chloride-containing aerosol particles that serve as a major ClNO2 source.
On average, both N2O5 and ClNO2 abundances were lowest during rainfall and fog due to scavenging. While both species are water soluble, N2O5 undergoes more efficient scavenging by liquid droplets, particularly fog, as expected based on its higher Henry's law constant and uptake coefficient (Fickert et al., 1998; Gržinić et al., 2017). N2O5 uptake by fog droplets likely contributed to observed elevated PM2.5 NO during fog events. Little is known about N2O5 and ClNO2 scavenging by precipitation, supporting the need for further investigation of this process. Overall, our results show that observational and modeling studies of only clear conditions miss important processes including scavenging, fog nitrate production, and the snowpack as a ClNO2 source. This is important as rainfall, fog, and snowfall occurred during 28 % of the nighttime periods, representing a significant portion that contributes significantly to the variability observed during this winter study.
The CIMS and AIM–IC datasets are archived through PANGAEA: https://doi.org/10.1594/PANGAEA.933765 (Kulju and Pratt, 2021).
The supplement related to this article is available online at: https://doi.org/10.5194/acp-22-2553-2022-supplement.
KDK wrote the paper, with feedback from all coauthors. KAP designed the study, and SMM and JE conducted the measurements and calibrations. KDK led data analysis and interpretation, with contributions from SMM, JE, QC, JDF, and KAP. HSK and KDK completed the box modeling. JDF assisted with the air turbulence measurements and analysis, in particular. SBB coordinated logistics at the field site.
The contact author has declared that neither they nor their co-authors have any competing interests.
Publisher’s note: Copernicus Publications remains neutral with regard to jurisdictional claims in published maps and institutional affiliations.
We thank Andrew Ault, Nicholas Ellsworth, and Matthew McNamara for assistance in preparing the mobile laboratory; Angela Raso, Peter Peterson, Guy Burke, and Alexa Watson for fieldwork assistance; and Western Michigan University for use of their facilities for this study.
This research was supported by the National Science Foundation (grant nos. AGS-1738588 and PLR-1417914), an Alfred P. Sloan Foundation Research Fellowship in Chemistry, the Schweizerischer Nationalfonds zur Förderung der Wissenschaftlichen Forschung (grant no. 155999), and the University of Michigan.
This paper was edited by Jennifer G. Murphy and reviewed by three anonymous referees.
Allan, B. J., Carslaw, N., Coe, H., Burgess, R. A., and Plane, J. M. C.: Observations of the nitrate radical in the marine boundary layer, J. Atmos. Chem., 33, 129–154, https://doi.org/10.1023/A:1005917203307, 1999.
Asaf, D., Tas, E., Pedersen, D., Peleg, M., and Luria, M.: Long-term measurements of NO3 radical at a semiarid urban site: 2. Seasonal trends and loss mechanisms, Environ. Sci. Technol., 44, 5901–5907, https://doi.org/10.1021/es100967z, 2010.
Behnke, W., George, C., Scheer, V., and Zetzsch, C.: Production and decay of ClNO2 from the reaction of gaseous N2O5 with NaCl solution: Bulk and aerosol experiments, J. Geophys. Res., 102, 3795–3804, https://doi.org/10.1029/96JD03057, 1997.
Bertram, T. H. and Thornton, J. A.: Toward a general parameterization of N2O5 reactivity on aqueous particles: the competing effects of particle liquid water, nitrate and chloride, Atmos. Chem. Phys., 9, 8351–8363, https://doi.org/10.5194/acp-9-8351-2009, 2009.
Bertram, T. H., Thornton, J. A., Riedel, T. P., Middlebrook, A. M., Bahreini, R., Bates, T. S., Quinn, P. K., and Coffman, D. J.: Direct observations of N2O5 reactivity on ambient aerosol particles, Geophys. Res. Lett., 36, 1–5, https://doi.org/10.1029/2009GL040248, 2009.
Brown, S. S., Dibb, J. E., Stark, H., Aldener, M., Vozella, M., Whitlow, S., Williams, E. J., Lerner, B. M., Jakoubek, R., Middlebrook, A. M., DeGouw, J. A., Warneke, C., Goldan, P. D., Kuster, W. C., Angevine, W. M., Sueper, D. T., Quinn, P. K., Bates, T. S., Meagher, J. F., Fehsenfeld, F. C., and Ravishankara, A. R.: Nighttime removal of NOx in the summer marine boundary layer, Geophys. Res. Lett., 31, 2–6, https://doi.org/10.1029/2004GL019412, 2004.
Brown, S. S., Dubé, W. P., Osthoff, H. D., Stutz, J., Ryerson, T. B., Wollny, A. G., Brock, C. A., Warneke, C., de Gouw, J. A., Atlas, E., Neuman, J. A., Holloway, J. S., Lerner, B. M., Williams, E. J., Kuster, W. C., Goldan, P. D., Angevine, W. M., Trainer, M., Fehsenfeld, F. C., and Ravishankara, A. R.: Vertical profiles in NO3 and N2O5 measured from an aircraft: Results from the NOAA P-3 and surface platforms during the New England Air Quality Study 2004, J. Geophys. Res.-Atmos., 112, 1–17, https://doi.org/10.1029/2007JD008883, 2007.
Brown, S. S., Dubé, W. P., Tham, Y. J., Zha, Q., Xue, L., Poon, S., Wang, Z., Blake, D. R., Tsui, W., Parrish, D. D., and Wang, T.: Nighttime chemistry at a high altitude site above Hong Kong, J. Geophys. Res.-Atmos., 121, 2457–2475, https://doi.org/10.1002/2015JD024566, 2016.
Chang, W. L., Bhave, P. V, Brown, S. S., Riemer, N., Stutz, J., and Dabdub, D.: Heterogeneous Atmospheric Chemistry, Ambient Measurements, and Model Calculations of N2O5: A Review, Aerosol Sci. Tech., 45, 665–695, https://doi.org/10.1080/02786826.2010.551672, 2011.
Chen, Q., Edebeli, J., McNamara, S. M., Kulju, K. D., May, N. W., Bertman, S. B., Thanekar, S., Fuentes, J. D., and Pratt, K. A.: HONO, Particulate Nitrite, and Snow Nitrite at a Midlatitude Urban Site during Wintertime, ACS Earth Space Chem., 3, 811–822, https://doi.org/10.1021/acsearthspacechem.9b00023, 2019.
Christiansen, A. E., Carlton, A. G., and Henderson, B. H.: Differences in fine particle chemical composition on clear and cloudy days, Atmos. Chem. Phys., 20, 11607–11624, https://doi.org/10.5194/acp-20-11607-2020, 2020.
Crutzen, P. J.: The Role of NO and NO2 in the Chemistry of the Troposphere and Stratosphere, Annu. Rev. Earth Pl. Sc., 7, 443–72, https://doi.org/10.1146/annurev.ea.07.050179.002303, 1979.
Dall'Osto, M., Harrison, R. M., Coe, H., and Williams, P.: Real-time secondary aerosol formation during a fog event in London, Atmos. Chem. Phys., 9, 2459–2469, https://doi.org/10.5194/acp-9-2459-2009, 2009.
Davis, J. M., Bhave, P. V., and Foley, K. M.: Parameterization of N2O5 reaction probabilities on the surface of particles containing ammonium, sulfate, and nitrate, Atmos. Chem. Phys., 8, 5295–5311, https://doi.org/10.5194/acp-8-5295-2008, 2008.
Ervens, B.: Modeling the processing of aerosol and trace gases in clouds and fogs, Chem. Rev., 115, 4157–4198, https://doi.org/10.1021/cr5005887, 2015.
Evans, M. J. and Jacob, D. J.: Impact of new laboratory studies of N2O5 hydrolysis on global model budgets of tropospheric nitrogen oxides, ozone, and OH, Geophys. Res. Lett., 32, 1–4, https://doi.org/10.1029/2005GL022469, 2005.
Fickert, S., Helleis, F., Adams, J. W., Moortgat, G. K., and Crowley, J. N.: Reactive uptake of ClNO2 on aqueous bromide solutions, J. Phys. Chem. A, 102, 10689–10696, https://doi.org/10.1021/jp983004n, 1998.
Finlayson-Pitts, B. J. and Pitts, J. N.: Formation of chemically active chlorine compounds by reactions of atmospheric NaCl particles with gaseous N2O5 and ClONO2, Nature, 337, 241–244, https://doi.org/10.1038/337241a0, 1989.
Frenzel, A., Scheer, V., Sikorski, R., George, C., Behnke, W., and Zetzsch, C.: Heterogeneous interconversion reactions of BrNO2, ClNO2, Br2, and Cl2, J. Phys. Chem. A, 102, 1329–1337, https://doi.org/10.1021/jp973044b, 1998.
Ge, X., Zhang, Q., Sun, Y., Ruehl, C. R., and Setyan, A.: Effect of aqueous-phase processing on aerosol chemistry and size distributions in Fresno, California, during wintertime, Environ. Chem., 9, 221–235, https://doi.org/10.1071/EN11168, 2012.
Geyer, A., Alicke, B., Konrad, S., Schmitz, T., Stutz, J., and Platt, U.: Chemistry and oxidation capacity of the nitrate radical in the continental boundary layer near Berlin, J. Geophys. Res.-Atmos., 106, 8013–8025, https://doi.org/10.1029/2000JD900681, 2001.
Griffiths, P. T. and Cox, R. A.: Temperature dependence of heterogeneous uptake of N2O5 by ammonium sulfate aerosol, Atmos. Sci. Lett., 10, 159–163, https://doi.org/10.1002/asl.225, 2009.
Gržinić, G., Bartels-Rausch, T., Türler, A., and Ammann, M.: Efficient bulk mass accommodation and dissociation of N2O5 in neutral aqueous aerosol, Atmos. Chem. Phys., 17, 6493–6502, https://doi.org/10.5194/acp-17-6493-2017, 2017.
Gunthe, S. S., Liu, P., Panda, U., Raj, S. S., Sharma, A., Darbyshire, E., Reyes-Villegas, E., Allan, J., Chen, Y., Wang, X., Song, S., Pöhlker, M. L., Shi, L., Wang, Y., Kommula, S. M., Liu, T., Ravikrishna, R., McFiggans, G., Mickley, L. J., Martin, S. T., Pöschl, U., Andreae, M. O., and Coe, H.: Enhanced aerosol particle growth sustained by high continental chlorine emission in India, Nat. Geosci., 14, 77–84, https://doi.org/10.1038/s41561-020-00677-x, 2021.
Hallquist, M., Stewart, D. J., Stephenson, S. K., and Cox, R. A.: Hydrolysis of N2O5 on sub-micron sulfate aerosols, Phys. Chem. Chem. Phys., 5, 3453–3463, https://doi.org/10.1039/b301827j, 2003.
Hameed, S. and Sperber, K. R.: Rate of precipitation scavenging of nitrates on central Long Island, J. Geophys. Res.-Atmos., 91, 11833–11839, https://doi.org/10.1029/JD091iD11p11833, 1986.
Heintz, F., Platt, U., Flentje, H., and Dubois, R.: Long-term observation of nitrate radicals at the Tor Station, Kap Arkona (Rügen), J. Geophys. Res., 101, 22891–22910, 1996.
Huey, L. G., Tanner, D. J., Slusher, D. L., Dibb, J. E., Arimoto, R., Chen, G., Davis, D., Buhr, M. P., Nowak, J. B., Mauldin, R. L., Eisele, F. L., and Kosciuch, E.: CIMS measurements of HNO3 and SO2 at the South Pole during ISCAT 2000, Atmos. Environ., 38, 5411–5421, https://doi.org/10.1016/j.atmosenv.2004.04.037, 2004.
Jacob, J.: Chemistry of OH in Remote Clouds and Its Role in the Production of Formic Acid and Peroxymonosulfate, J. Geophys. Res., 91, 9807–9826, 1986.
Johnson, C. A., Sigg, L., and Zobrist, J.: Case studies on the chemical composition of fogwater: The influence of local gaseous emissions, Atmos. Environ., 21, 2365–2374, https://doi.org/10.1016/0004-6981(87)90371-4, 1987.
Kercher, J. P., Riedel, T. P., and Thornton, J. A.: Chlorine activation by N2O5: simultaneous, in situ detection of ClNO2 and N2O5 by chemical ionization mass spectrometry, Atmos. Meas. Tech., 2, 193–204, https://doi.org/10.5194/amt-2-193-2009, 2009.
Kolesar, K. R., Mattson, C. N., Peterson, P. K., May, N. W., Prendergast, R. K., and Pratt, K.A.: Increases in wintertime PM2.5 sodium and chloride linked to snowfall and road salt application. Atmos. Environ., 177, 195–202, https://doi.org/10.1016/j.atmosenv.2018.01.008, 2018.
Kulju, K. and Pratt, K. A.: N2O5, ClNO2, PM2.5 chloride, and PM2.5 nitrate in Kalamazoo, Michigan, USA during January–February 2018, PANGAEA [data set], https://doi.org/10.1594/PANGAEA.933765, 2021.
Leblanc, T. and Hauchecorne, A.: Recent observations of mesospheric temperature inversions, J. Geophys. Res.-Atmos., 102, 19471–19482, https://doi.org/10.1029/97JD01445, 1997.
Liao, J., Sihler, H., Huey, L. G., Neuman, J. A., Tanner, D. J., Friess, U., Platt, U., Flocke, F. M., Orlando, J. J., Shepson, P. B., Beine, H. J., Weinheimer, A. J., Sjostedt, S. J., Nowak, J. B., Knapp, D. J., Staebler, R. M., Zheng, W., Sander, R., Hall, S. R., and Ullmann, K.: A comparison of Arctic BrO measurements by chemical ionization mass spectrometry and long path-differential optical absorption spectroscopy, J. Geophys. Res.-Atmos., 116, 1–14, https://doi.org/10.1029/2010JD014788, 2011.
Lillis, D., Cruz, C. N., Collett, J., Willard Richards, L., and Pandis, S. N.: Production and removal of aerosol in a polluted fog layer: Model evaluation and fog effect on PM, Atmos. Environ., 33, 4797–4816, https://doi.org/10.1016/S1352-2310(99)00264-2, 1999.
Lopez-Hilfiker, F. D., Constantin, K., Kercher, J. P., and Thornton, J. A.: Temperature dependent halogen activation by N2O5 reactions on halide-doped ice surfaces, Atmos. Chem. Phys., 12, 5237–5247, https://doi.org/10.5194/acp-12-5237-2012, 2012.
Markovic, M. Z., Vandenboer, T. C., and Murphy, J. G.: Characterization and optimization of an online system for the simultaneous measurement of atmospheric water-soluble constituents in the gas and particle phases, J. Environ. Monit., 14, 1872–1884, https://doi.org/10.1039/c2em00004k, 2012.
McDuffie, E. E., Fibiger, D. L., Dubé, W. P., Lopez Hilfiker, F., Lee, B. H., Jaeglé, L., Guo, H., Weber, R. J., Reeves, J. M., Weinheimer, A. J., Schroder, J. C., Campuzano-Jost, P., Jimenez, J. L., Dibb, J. E., Veres, P., Ebben, C., Sparks, T. L., Wooldridge, P. J., Cohen, R. C., Campos, T., Hall, S. R., Ullmann, K., Roberts, J. M., Thornton, J. A., and Brown, S. S.: ClNO2 Yields From Aircraft Measurements During the 2015 WINTER Campaign and Critical Evaluation of the Current Parameterization, J. Geophys. Res.-Atmos., 123, 12994–13015, https://doi.org/10.1029/2018JD029358, 2018.
McNamara, S. M., Raso, A. R. W., Wang, S., Thanekar, S., Boone, E. J., Kolesar, K. R., Peterson, P. K., Simpson, W. R., Fuentes, J. D., Shepson, P. B., and Pratt, K. A.: Springtime Nitrogen Oxide-Influenced Chlorine Chemistry in the Coastal Arctic, Environ. Sci. Technol., 53, 8057–8067, https://doi.org/10.1021/acs.est.9b01797, 2019.
McNamara, S. M., Kolesar, K. R., Wang, S., Kirpes, R. M., May, N. W., Gunsch, M. J., Cook, R. D., Fuentes, J. D., Hornbrook, R. S., Apel, E. C., China, S., Laskin, A., and Pratt, K. A.: Observation of Road Salt Aerosol Driving Inland Wintertime Atmospheric Chlorine Chemistry, ACS Cent. Sci., 6, 684–694, https://doi.org/10.1021/acscentsci.9b00994, 2020.
McNamara, S. M., Chen, Q., Edebeli, J., Kulju, K. D., Mumpfield, J., Fuentes, J. D., Bertman, S. B., and Pratt, K. A.: Observation of N2O5 deposition and ClNO2 production on the saline snowpack, ACS Earth Space Chem., 5, 1020–1031, https://doi.org/10.1021/acsearthspacechem.0c00317, 2021.
Mielke, L. H., Furgeson, A., and Osthoff, H. D.: Observation of ClNO2 in a Mid-Continental Urban Environment, Environ. Sci. Technol, 45, 8889–8896, https://doi.org/10.1021/es201955u, 2011.
Monin, A. S. and Obukhov, A. M.: Basic laws of turbulent mixing in the surface layer of the atmosphere, https://gibbs.science/teaching/efd/handouts/monin_obukhov_1954.pdf (last access: 31 May 2019), 1954.
Neuman, J. A., Huey, L. G., Dissly, R. W., Fehsenfeld, F. C., Flocke, F., Holecek, J. C., Holloway, J. S., Hübler, G., Jakoubek, R., Nicks, D. K., Parrish, D. D., Ryerson, T. B., Sueper, D. T., and Weinheimer, A. J.: Fast-response airborne in situ measurements of HNO3 during the Texas 2000 Air Quality Study, J. Geophys. Res.-Atmos., 107, 1–12, https://doi.org/10.1029/2001JD001437, 2002.
Osthoff, H. D., Sommariva, R., Baynard, T., Pettersson, A., Williams, E. J., Lerner, B. M., Roberts, J. M., Stark, H., Goldan, P. D., Kuster, W. C., Bates, T. S., Coffman, D., Ravishankara, A. R., and Brown, S. S.: Observation of daytime N2O5 in the marine boundary layer during New England Air Quality Study – Intercontinental Transport and Chemical Transformation 2004, J. Geophys. Res.-Atmos., 111, 1–13, https://doi.org/10.1029/2006JD007593, 2006.
Osthoff, H. D., Roberts, J. M., Ravishankara, A. R., Williams, E. J., Lerner, B. M., Sommariva, R., Bates, T. S., Coffman, D., Quinn, P. K., Dibb, J. E., Stark, H., Burkholder, J. B., Talukdar, R. K., Meagher, J., Fehsenfeld, F. C., and Brown, S. S.: High levels of nitryl chloride in the polluted subtropical marine boundary layer, Nat. Geosci., 1, 324–328, https://doi.org/10.1038/ngeo177, 2008.
Osthoff, H. D., Odame-Ankrah, C. A., Taha, Y. M., Tokarek, T. W., Schiller, C. L., Haga, D., Jones, K., and Vingarzan, R.: Low levels of nitryl chloride at ground level: nocturnal nitrogen oxides in the Lower Fraser Valley of British Columbia, Atmos. Chem. Phys., 18, 6293–6315, https://doi.org/10.5194/acp-18-6293-2018, 2018.
Phillips, G. J., Tang, M. J., Thieser, J., Brickwedde, B., Schuster, G., Bohn, B., Lelieveld, J., and Crowley, J. N.: Significant concentrations of nitryl chloride observed in rural continental Europe associated with the influence of sea salt chloride and anthropogenic emissions, Geophys. Res. Lett., 39, 1–5, https://doi.org/10.1029/2012GL051912, 2012.
Pruppacher, H. R. and Klett, J. D.: Microphysics of Clouds and Precipitation, 2nd Edn., Kluwer Academic Publishers, Dordrecht, ISBN 0-7923-4211-9, 1997.
Riedel, T. P., Wagner, N. L., Dubé, W. P., Middlebrook, A. M., Young, C. J., Öztürk, F., Bahreini, R., Vandenboer, T. C., Wolfe, D. E., Williams, E. J., Roberts, J. M., Brown, S. S., and Thornton, J. A.: Chlorine activation within urban or power plant plumes: Vertically resolved ClNO2 and Cl2 measurements from a tall tower in a polluted continental setting, J. Geophys. Res.-Atmos., 118, 8702–8715, https://doi.org/10.1002/jgrd.50637, 2013.
Roberts, J. M., Osthoff, H. D., Brown, S. S., Ravishankara, A. R., Coffman, D., Quinn, P., and Bates, T.: Laboratory studies of products of N2O5 uptake on Cl- containing substrates, Geophys. Res. Lett., 36, 1–5, https://doi.org/10.1029/2009GL040448, 2009.
Sander, R.: Compilation of Henry's law constants (version 4.0) for water as solvent, Atmos. Chem. Phys., 15, 4399–4981, https://doi.org/10.5194/acp-15-4399-2015, 2015.
Sarwar, G., Simon, H., Xing, J., and Mathur, R.: Importance of tropospheric ClNO2 chemistry across the Northern Hemisphere, Geophys. Res. Lett., 41, 4050–4058, https://doi.org/10.1002/2014GL059962, 2014.
Simpson, W. R., Brown, S. S., Saiz-Lopez, A., Thornton, J. A., and Von Glasow, R.: Tropospheric Halogen Chemistry: Sources, Cycling, and Impacts, Chem. Rev., 115, 4035–4062, https://doi.org/10.1021/cr5006638, 2015.
Slusher, D. L., Huey, L. G., Tanner, D. J., Flocke, F. M., and Roberts, J. M.: A thermal dissociation – Chemical ionization mass spectrometry (TD-CIMS) technique for the simultaneous measurement of peroxyacyl nitrates and dinitrogen pentoxide, J. Geophys. Res.-Atmos., 109, 1–13, https://doi.org/10.1029/2004JD004670, 2004.
Sommariva, R., Osthoff, H. D., Brown, S. S., Bates, T. S., Baynard, T., Coffman, D., de Gouw, J. A., Goldan, P. D., Kuster, W. C., Lerner, B. M., Stark, H., Warneke, C., Williams, E. J., Fehsenfeld, F. C., Ravishankara, A. R., and Trainer, M.: Radicals in the marine boundary layer during NEAQS 2004: a model study of day-time and night-time sources and sinks, Atmos. Chem. Phys., 9, 3075–3093, https://doi.org/10.5194/acp-9-3075-2009, 2009.
Stanier, C., Singh, A., Adamski, W., Baek, J., Caughey, M., Carmichael, G., Edgerton, E., Kenski, D., Koerber, M., Oleson, J., Rohlf, T., Lee, S. R., Riemer, N., Shaw, S., Sousan, S., and Spak, S. N.: Overview of the LADCO winter nitrate study: hourly ammonia, nitric acid and PM2.5 composition at an urban and rural site pair during PM2.5 episodes in the US Great Lakes region, Atmos. Chem. Phys., 12, 11037–11056, https://doi.org/10.5194/acp-12-11037-2012, 2012.
Stull, R.: Practical Meteorology: An Algebra-based Survey of Atmospheric Science, 1.02b., Univ. of British Columbia, Vancouver, ISBN 978-0-88865-283-6, 2017.
Stull, R. B.: An Introduction to Boundary Layer Meteorology, Kluwer Academic Publishers, Dordrecht, ISBN 978-90-277-2768-8, 1988.
Tham, Y. J., Wang, Z., Li, Q., Yun, H., Wang, W., Wang, X., Xue, L., Lu, K., Ma, N., Bohn, B., Li, X., Kecorius, S., Größ, J., Shao, M., Wiedensohler, A., Zhang, Y., and Wang, T.: Significant concentrations of nitryl chloride sustained in the morning: investigations of the causes and impacts on ozone production in a polluted region of northern China, Atmos. Chem. Phys., 16, 14959–14977, https://doi.org/10.5194/acp-16-14959-2016, 2016.
Tham, Y. J., Wang, Z., Li, Q., Wang, W., Wang, X., Lu, K., Ma, N., Yan, C., Kecorius, S., Wiedensohler, A., Zhang, Y., and Wang, T.: Heterogeneous N2O5 uptake coefficient and production yield of ClNO2 in polluted northern China: roles of aerosol water content and chemical composition, Atmos. Chem. Phys., 18, 13155–13171, https://doi.org/10.5194/acp-18-13155-2018, 2018.
Thornton, J. A. and Abbatt, J. P. D.: N2O5 Reaction on Submicron Sea Salt Aerosol: Kinetics, Products, and the Effect of Surface Active Organics, J. Phys. Chem. A, 109, 10004–10012, https://doi.org/10.1021/jp054183t, 2005.
Thornton, J. A., Kercher, J. P., Riedel, T. P., Wagner, N. L., Cozic, J., Holloway, J. S., Dubé, W. P., Wolfe, G. M., Quinn, P. K., Middlebrook, A. M., Alexander, B., and Brown, S. S.: A large atomic chlorine source inferred from mid-continental reactive nitrogen chemistry, Nature, 464, 271–274, https://doi.org/10.1038/nature08905, 2010.
Wagner, N. L., Riedel, T. P., Young, C. J., Bahreini, R., Brock, C. A., Dubé, W. P., Kim, S., Middlebrook, A. M., Öztürk, F., Roberts, J. M., Russo, R., Sive, B., Swarthout, R., Thornton, J. A., VandenBoer, T. C., Zhou, Y., and Brown, S. S.: N2O5 uptake coefficients and nocturnal NO2 removal rates determined from ambient wintertime measurements, J. Geophys. Res.-Atmos., 118, 9331–9350, https://doi.org/10.1002/jgrd.50653, 2013.
Wang, S., Ackermann, R., and Stutz, J.: Vertical profiles of O3 and NOx chemistry in the polluted nocturnal boundary layer in Phoenix, AZ: I. Field observations by long-path DOAS, Atmos. Chem. Phys., 6, 2671–2693, https://doi.org/10.5194/acp-6-2671-2006, 2006.
Wang, S., McNamara, S. M., Kolesar, K. R., May, N. W., Fuentes, J. D., Cook, R. D., Gunsch, M. J., Mattson, C. N., Hornbrook, R. S., Apel, E. C., and Pratt, K. A.: Urban Snowpack ClNO2 Production and Fate: A One-Dimensional Modeling Study, ACS Earth Space Chem., 4, 1140–1148, https://doi.org/10.1021/acsearthspacechem.0c00116, 2020.
Wang, X., Wang, H., Xue, L., Wang, T., Wang, L., Gu, R., Wang, W., Tham, Y. J., Wang, Z., Yang, L., Chen, J., and Wang, W.: Observations of N2O5 and ClNO2 at a polluted urban surface site in North China: High N2O5 uptake coefficients and low ClNO2 product yields, Atmos. Environ., 156, 125–134, https://doi.org/10.1016/j.atmosenv.2017.02.035, 2017.
Wood, E. C., Bertram, T. H., Wooldridge, P. J., and Cohen, R. C.: Measurements of N2O5, NO2, and O3 east of the San Francisco Bay, Atmos. Chem. Phys., 5, 483–491, https://doi.org/10.5194/acp-5-483-2005, 2005.
Young, C. J., Washenfelder, R. A., Edwards, P. M., Parrish, D. D., Gilman, J. B., Kuster, W. C., Mielke, L. H., Osthoff, H. D., Tsai, C., Pikelnaya, O., Stutz, J., Veres, P. R., Roberts, J. M., Griffith, S., Dusanter, S., Stevens, P. S., Flynn, J., Grossberg, N., Lefer, B., Holloway, J. S., Peischl, J., Ryerson, T. B., Atlas, E. L., Blake, D. R., and Brown, S. S.: Chlorine as a primary radical: evaluation of methods to understand its role in initiation of oxidative cycles, Atmos. Chem. Phys., 14, 3427–3440, https://doi.org/10.5194/acp-14-3427-2014, 2014.