the Creative Commons Attribution 4.0 License.
the Creative Commons Attribution 4.0 License.
 | 14 Feb 2022
In situ observations of CH2Cl2 and CHCl3 show efficient transport pathways for very short-lived species into the lower stratosphere via the Asian and the North American summer monsoon
Valentin Lauther
Bärbel Vogel
Johannes Wintel
Andrea Rau
Peter Hoor
Vera Bense
Rolf Müller
C. Michael Volk
Efficient transport pathways for ozone-depleting very short-lived substances (VSLSs) from their source regions into the stratosphere are a matter of current scientific debate; however they have yet to be fully identified on an observational basis. Understanding the increasing impact of chlorine-containing VSLSs (Cl-VSLSs) on stratospheric ozone depletion is important in order to validate and improve model simulations and future predictions. We report on a transport study using airborne in situ measurements of the Cl-VSLSs dichloromethane (CH2Cl2) and trichloromethane (chloroform, CHCl3) to derive a detailed description of two transport pathways from (sub)tropical source regions into the extratropical upper troposphere and lower stratosphere (Ex-UTLS) in the Northern Hemisphere (NH) late summer. The Cl-VSLS measurements were obtained in the upper troposphere and lower stratosphere (UTLS) above western Europe and the midlatitude Atlantic Ocean in the frame of the WISE (Wave-driven ISentropic Exchange) aircraft campaign in autumn 2017 and are combined with the results from a three-dimensional simulation of a Lagrangian transport model as well as back-trajectory calculations. Compared to background measurements of similar age we find up to 150 % enhanced CH2Cl2 and up to 100 % enhanced CHCl3 mixing ratios in the extratropical lower stratosphere (Ex-LS). We link the measurements of enhanced CH2Cl2 and CHCl3 mixing ratios to emissions in the region of southern and eastern Asia. Transport from this area to the Ex-LS at potential temperatures in the range of 370–400 K takes about 6–11 weeks via the Asian summer monsoon anticyclone (ASMA). Our measurements suggest anthropogenic sources to be the cause of these strongly elevated Cl-VSLS concentrations observed at the top of the lowermost stratosphere (LMS). A faster transport pathway into the Ex-LS is derived from particularly low CH2Cl2 and CHCl3 mixing ratios in the UTLS. These low mixing ratios reflect weak emissions and a local seasonal minimum of both species in the boundary layer of Central America and the tropical Atlantic. We show that air masses uplifted by hurricanes, the North American monsoon, and general convection above Central America into the tropical tropopause layer to potential temperatures of about 360–370 K are transported isentropically within 5–9 weeks from the boundary layer into the Ex-LS. This transport pathway linked to the North American monsoon mainly impacts the middle and lower part of the LMS with particularly low CH2Cl2 and CHCl3 mixing ratios. In a case study, we specifically analyze air samples directly linked to the uplift by the Category 5 Hurricane Maria that occurred during October 2017 above the Atlantic Ocean. CH2Cl2 and CHCl3 have similar atmospheric sinks and lifetimes, but the fraction of biogenic emissions is clearly higher for CHCl3 than for the mainly anthropogenically emitted CH2Cl2; consequently lower CHCl3 : CH2Cl2 ratios are expected in air parcels showing a higher impact of anthropogenic emissions. The observed CHCl3 : CH2Cl2 ratio suggests clearly stronger anthropogenic emissions in the region of southern and eastern Asia compared to those in the region of Central America and the tropical Atlantic. Overall, the transport of strongly enhanced CH2Cl2 and CHCl3 mixing ratios from southern and eastern Asia via the ASMA is the main factor in increasing the chlorine loading from the analyzed VSLSs in the Ex-LS during the NH late summer. Thus, further increases in Asian CH2Cl2 and CHCl3 emissions, as frequently reported in recent years, will further increase the impact of Cl-VSLSs on stratospheric ozone depletion.
- Article
(11297 KB) - Full-text XML
- BibTeX
- EndNote


Within the last 2 decades emissions of the chlorine-containing very short-lived substances (Cl-VSLSs) dichloromethane (CH2Cl2) and trichloromethane (chloroform, CHCl3) have increased significantly by about 8 % yr−1 (Hossaini et al., 2015) and 3.5 % yr−1 (Fang et al., 2018), respectively. With both Cl-VSLSs not being regulated by the Montreal Protocol on Substances that Deplete the Ozone Layer and its amendments and adjustments, their influence on stratospheric ozone depletion is currently an important topic of investigation. Owing to the sparseness of Cl-VSLS measurements in the stratosphere (e.g., Schauffler et al., 1993, 2003; Laube et al., 2008; Park et al., 2010; Adcock et al., 2021), the impact of changes in Cl-VSLS surface emissions on their distribution in the stratosphere has yet to be fully characterized on an observational basis. Particularly important is the identification of rapid and efficient transport pathways for Cl-VSLSs from their source regions into the stratosphere. In the present study we use airborne in situ measurements of CH2Cl2 and CHCl3 in the extratropical upper troposphere and lower stratosphere (Ex-UTLS) to analyze the impact of different source regions on the stratospheric chemical composition and to identify transport pathways of CH2Cl2 and CHCl3 into the stratosphere.
CH2Cl2 is almost exclusively emitted by anthropogenic sources with only about 10 % of its emission being of natural origin (Engel et al., 2018). Thereby CH2Cl2 mixing ratios in the troposphere at Northern Hemisphere (NH) midlatitudes are a factor of 3 larger than those in the Southern Hemisphere (Hossaini et al., 2017). Global CH2Cl2 emissions in 2017 are estimated to be about 1 Tg Cl yr−1, and almost 90 % of the global CH2Cl2 emission sources are located in Asia (Claxton et al., 2020). Other more localized studies estimate that about 10 % of global CH2Cl2 emissions originate in India (Say et al., 2019) and that 25 %–37 % (Feng et al., 2018) or even 45 % (Oram et al., 2017) of global CH2Cl2 emissions originate in China. Collected air samples from IAGOS-CARIBIC confirm particularly high emissions in the broad region of southern and eastern Asia (Leedham-Elvidge et al., 2015) as similarly shown for the north Indian subcontinent from air sampled during the StratoClim aircraft campaign in summer 2017 (Adcock et al., 2021). European and American CH2Cl2 sources in 2017 were estimated to contribute less than 10 % to global CH2Cl2 emissions (Claxton et al., 2020).
Based on ground-based measurements from the AGAGE network, Engel et al. (2018) estimate the global CHCl3 emissions in 2017 to be about 0.29 Tg Cl yr−1. Compared to CH2Cl2 the distribution of CHCl3 emission sources is rather unclear. On average globally, Engel et al. (2018) estimate CHCl3 emissions from anthropogenic sources to be as high as from biogenic sources. However, emission estimates of anthropogenic CHCl3 sources range between 60 % (Trudinger et al., 2004), 30 % (Worton et al., 2006), and 10 % (McCulloch, 2003) of the total emissions. While CH2Cl2 is believed to have no significant oceanic sources and is only temporarily taken up by the oceans to be re-released to the atmosphere later, a process that is not yet fully understood (Moore, 2004), CHCl3 is estimated to have about 50 % of its biogenic emission sources located in offshore seawater (Laturnus et al., 2002; McCulloch, 2003). The increase in global CHCl3 emissions during the last decade was traced back entirely to an increase in eastern Chinese CHCl3 emissions of most likely anthropogenic origin (Fang et al., 2018). In addition, Chinese CHCl3 emissions amount to almost 90 % of all East Asian CHCl3 emissions (Fang et al., 2018). Nevertheless, on a global scale CHCl3 has a significant fraction of biogenic emission sources in contrast to CH2Cl2, which is almost exclusively emitted by anthropogenic sources.
For CH2Cl2 Hossaini et al. (2019) suggest an average tropospheric lifetime of 168 d (about 6 months), and a stratospheric lifetime of 1–2 years (outside the poles) was estimated by Hossaini et al. (2017). The main atmospheric sink of both CH2Cl2 and CHCl3 is the reaction with hydroxyl radicals (OH) in the troposphere. Both species have similar reaction rates with OH, implying similar photochemical lifetimes for both Cl-VSLSs (Hsu and DeMore, 1994). Time series of background mixing ratios of both species are anticorrelated to the seasonal cycle of OH (Cox et al., 2003). In the NH, seasonal anthropogenic use of products releasing CHCl3 to the atmosphere (e.g., landfill and chlorination of water) has been observed to have a small local impact on the seasonality of CHCl3 (Gentner et al., 2010). In addition, the global distribution of OH shows significant regional differences (Spivakovsky et al., 2000; Hanisco et al., 2001; Lelieveld et al., 2016). Therefore, the photochemical lifetimes of CH2Cl2 and CHCl3 are also regionally different.
In the tropical tropopause layer (TTL) the lifetime of both CH2Cl2 and CHCl3 is estimated to be about 6–10 months, being long enough for both Cl-VSLSs to enter the stratosphere under normal dynamic conditions (Park et al., 2010). For the level of zero radiative heating, Hossaini et al. (2015) simulated an increase in average CH2Cl2 mixing ratios of about 83 % between 2005 and 2013. Hossaini et al. (2019) estimate an increase in total stratospheric chlorine from Cl-VSLSs from about 69 ppt in 2000 to about 111 ppt in 2017, of which >80 % enters the stratosphere as source gases and the rest as product gases of Cl-VSLSs. Hossaini et al. (2019) further state that CH2Cl2 and CHCl3 contribute to this increase with about 68 % and 19 %, respectively. However, due to high Asian emissions and efficient transport into the stratosphere via the Asian summer monsoon (ASM), the estimation of stratospheric chlorine from Cl-VSLSs could even be underestimated by 8 %–26 % (Adcock et al., 2021).
Between June and September the ASM is a widespread convective system located above the Indian subcontinent, East Asia, and Southeast Asia (e.g., Yihui and Chan, 2005). The ASM provides fast vertical transport of surface air into the large-scale ASM anticyclone (ASMA) above, which spans from the upper troposphere at about 360 K potential temperature to the lower stratosphere at about 450 K potential temperature (e.g., Park et al., 2007, 2009; Bergman et al., 2013; Vogel et al., 2019). Within the ASMA air masses are somewhat confined and separated from the surrounding upper troposphere and lower stratosphere (UTLS) air by a strong gradient of potential vorticity (e.g., Ploeger et al., 2015). Several studies have shown that these air masses are transported further vertically into the tropical pipe or break out of the ASMA to enter the extratropical lowermost stratosphere (LMS) quasi-horizontally by Rossby wave breaking events (e.g., Popovic and Plumb, 2001; Garny and Randel, 2016; Vogel et al., 2014, 2016). Thus, the ASM has a strong impact on the chemical composition of the stratosphere in boreal summer (e.g., Randel et al., 2010; Randel and Jensen, 2013; Vogel et al., 2015; Santee et al., 2017).
The most efficient transport pathway for Cl-VSLSs into the stratosphere is suggested to be via the ASMA. This is why Cl-VSLS emissions from the region of continental Asia are suggested to have the highest ozone depletion potential (ODP) compared to emissions from other source regions (Claxton et al., 2019). Projecting different past CH2Cl2 emission rates, Hossaini et al. (2017) predict a possibly significant delay to the recovery date of stratospheric ozone ranging from a few years up to no recovery at all compared to estimations including only long-lived chlorinated species. However, the estimated impact of Cl-VSLSs on stratospheric ozone trends is small compared to that of long-lived chlorinated species or even the impact of meteorology or the 11-year solar cycle (Chipperfield et al., 2018). Nevertheless, with the expected decrease in long-lived chlorinated trace gases during the next decades due to the Montreal Protocol and its amendments and adjustments the relative importance of Cl-VSLSs in stratospheric ozone depletion will further increase.
Observational evidence for Cl-VSLSs being transported into the stratosphere is extremely rare (e.g., Schauffler et al., 1993; Woodbridge et al., 1995; Schauffler et al., 2003; Laube et al., 2008; Park et al., 2010; Adcock et al., 2021). Transport pathways into the stratosphere for VSLSs have been derived from observations of brominated VSLSs (Br-VSLSs; e.g., Sturges et al., 2000; Ashfold et al., 2012; Wales et al., 2018; Filus et al., 2020; Keber et al., 2020; Rotermund et al., 2021) or modeled specifically for Br-VSLS (e.g., Levine et al., 2007; Aschmann et al., 2009; Ashfold et al., 2012; Liang et al., 2014) which have mainly natural emission sources (Engel et al., 2018). However, the only Br-VSLS with a photochemical lifetime comparable to those of CH2Cl2 and CHCl3 is CH2Br2 (150 d; WMO, 2018), which is mostly emitted by the oceans and, consequently, is differently distributed in the troposphere than the mainly anthropogenically (land-based) emitted CH2Cl2 and most Cl-VSLSs (e.g., Engel et al., 2018). Thus, transport studies of Br-VSLSs focus on transport into the stratosphere from likely different source regions than those of Cl-VSLS, and their results might not necessarily be directly applicable to the transport into the stratosphere of CH2Cl2 and CHCl3. In addition, in order to specifically study transport into the stratosphere via the ASM, it is beneficial to observe VSLSs with their strongest sources being located in the core region of the ASM. This is the case for CH2Cl2, while most Asian Br-VSLS sources are located only in adjacent regions of the ASM.
In the present paper we use in situ measurements of CH2Cl2 and CHCl3 to identify two efficient transport pathways from the boundary layer into the extratropical lower stratosphere (Ex-LS). In addition we provide observational evidence for different impacts on the stratospheric chemical composition depending on the transport pathway the two Cl-VSLSs take to enter the Ex-LS in the NH late summer. A study by Rotermund et al. (2021) employed similar methods to identify source regions and the impact on the Ex-LS of Br-VSLS using measurements from the same aircraft campaign as the measurements used in the present paper are taken from and is compared to our results in Sect. 4.
2.1 The WISE campaign 2017
All measurements presented in this study were obtained in the frame of the WISE (Wave-driven ISentropic Exchange) campaign (Riese et al., 2017), which took place in September and October 2017. A total of 15 scientific flights were carried out with the German HALO (High Altitude and Long Range) research aircraft, mainly from Shannon (Ireland) and from Oberpfaffenhofen (Germany), probing a wide area above the Atlantic Ocean and western Europe. Among other goals, the WISE campaign aimed at investigating transport and mixing processes in the extratropical tropopause layer and the Ex-LS, the impact of the Asian monsoon system on the chemical composition of the extratropical LMS, and the role of halogenated VSLSs in ozone depletion and radiative forcing in the UTLS region. In this study we present UTLS measurements between a potential temperature of 315 and 404 K (i.e., 7.4–14.5 km altitude, 388–130 hPa pressure) of the last 10 WISE flights, i.e., from 28 September to 21 October 2017 (Fig. 1). Due to technical issues of the instrument, CH2Cl2 and CHCl3 measurements below the given range and during earlier flights of the WISE campaign were not performed (see Sect. 2.2.1).
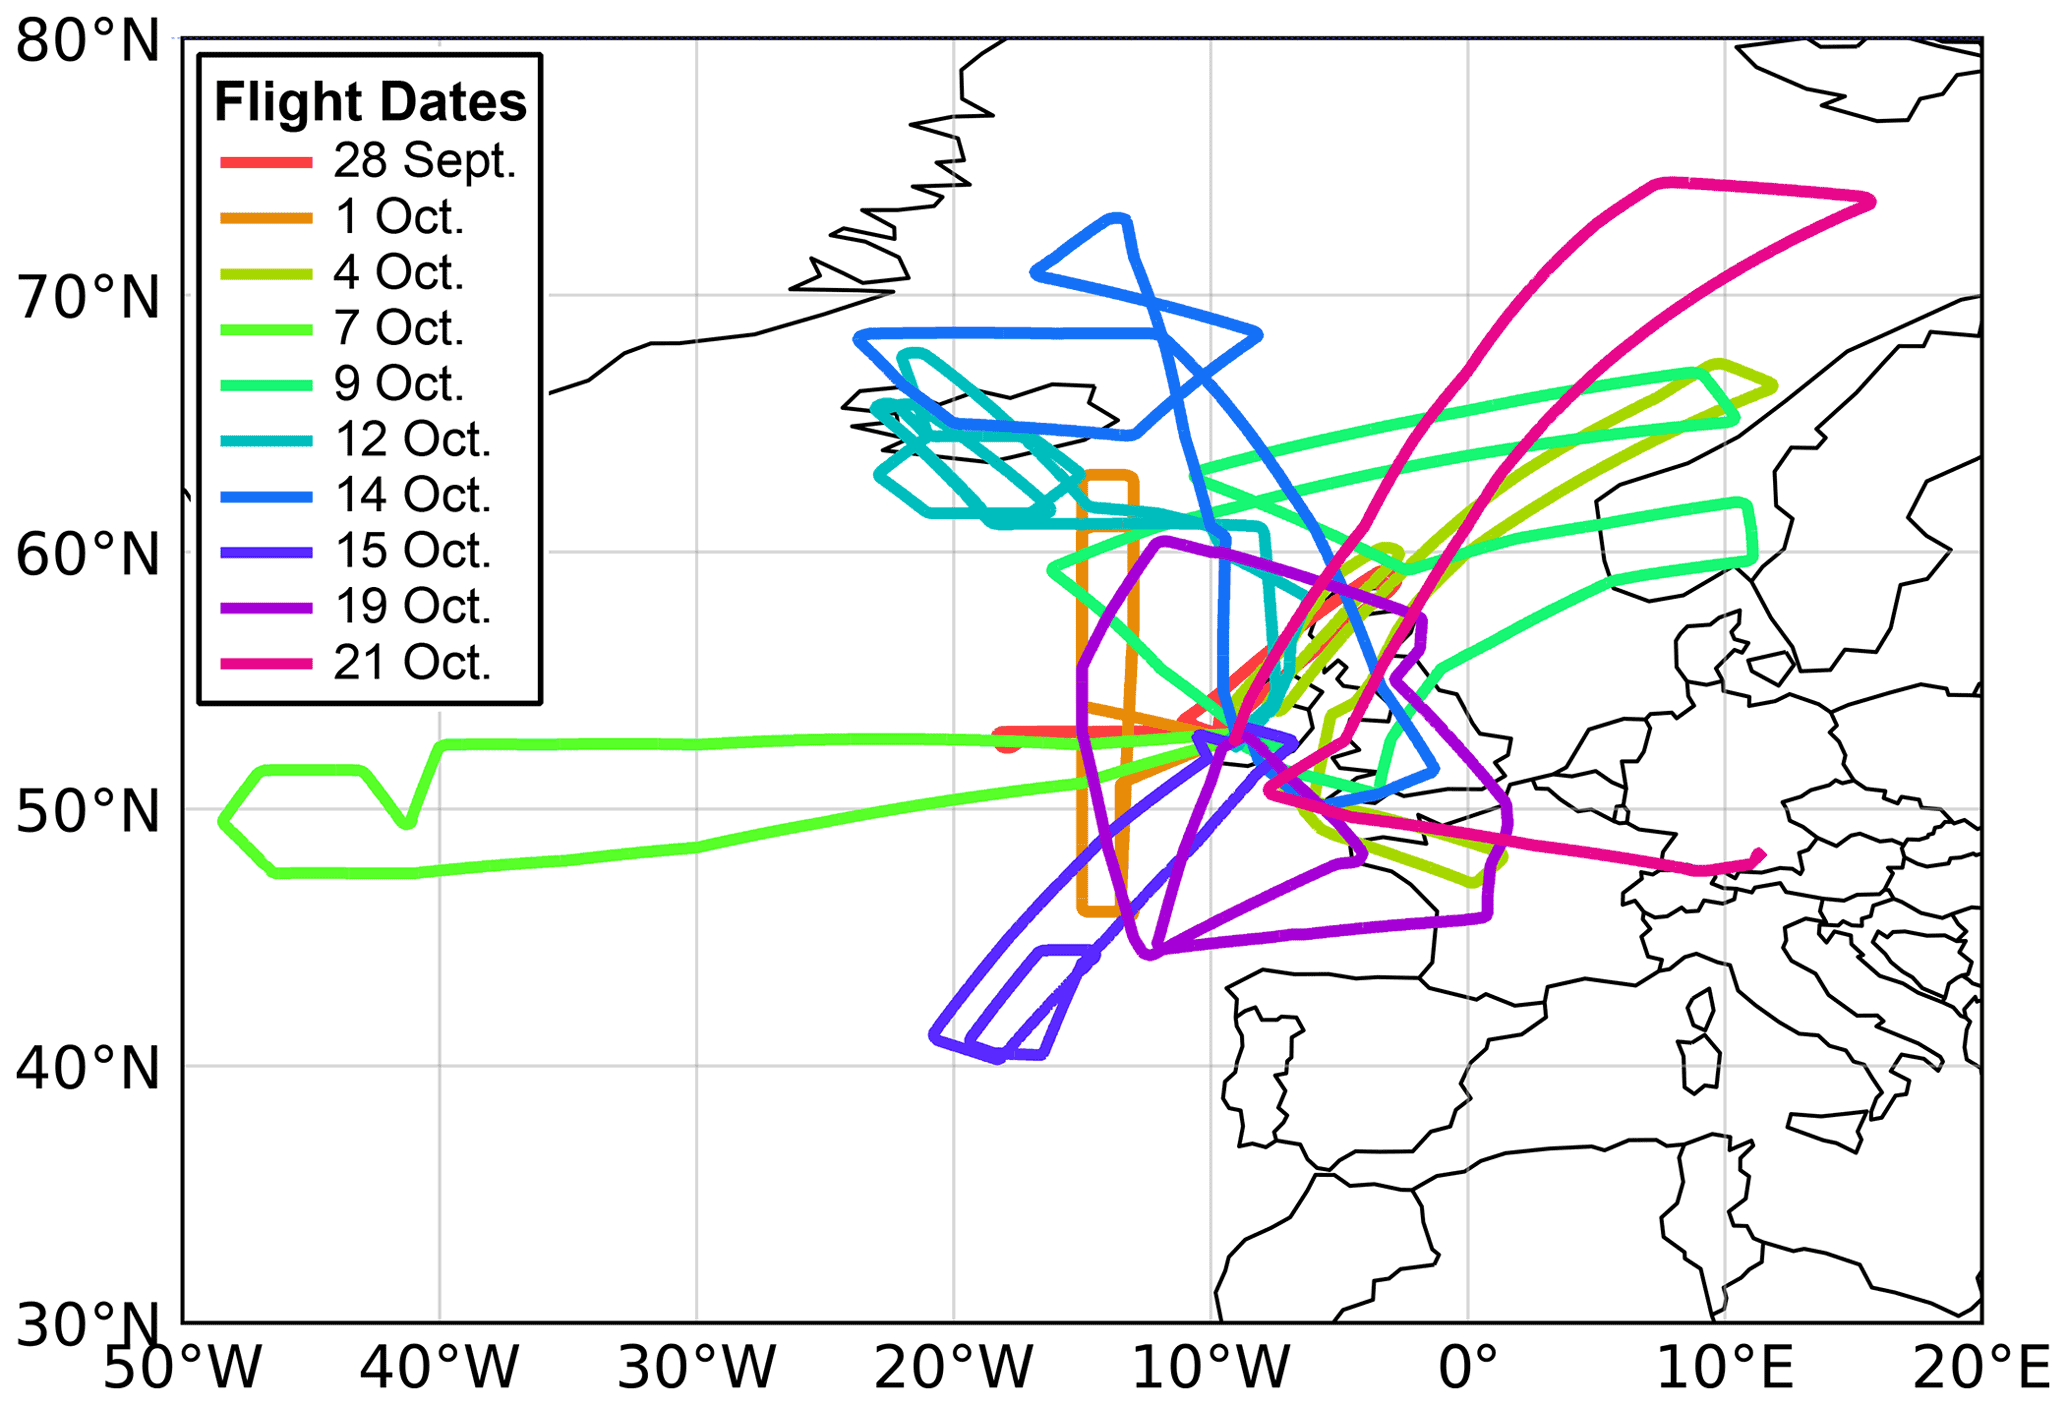
Figure 1Map of 10 flight tracks carried out with the German HALO (High Altitude and Long Range) research aircraft from and to Shannon (Ireland) with one flight from Shannon to Oberpfaffenhofen (Germany). The flights were conducted from 28 September to 21 October in 2017 in the frame of the WISE campaign (for details see text).
2.2 In situ trace gas measurements
Our analysis is mainly based on airborne in situ observations of the trace gas instruments HAGAR-V (CH2Cl2 and CHCl3) and UMAQS (N2O) (as described below). The corresponding avionic data are provided by the Basic HALO Measurement and Sensor System (BAHAMAS) (Krautstrunk and Giez, 2012; Giez et al., 2017). The different measurement frequencies of the instruments were matched to that of HAGAR-V's mass spectrometer (MS) module of Hz. Exceptions are the flights on 28 September and 1 October where the MS measurement frequency is Hz. Each data point is the average of a time interval of 40 s, except for the flights on 28 September, 1 October, and 4 October, where it is 60 s, corresponding to a spatial resolution at maximum cruising speed of 10 and 15 km along the flight path, respectively. The time and location of a data point are given at the respective center of the averaged time interval.
2.2.1 High Altitude Gas AnalyzeR – five-channel version (HAGAR-V)
HAGAR-V is a novel airborne in situ instrument. It is a modernized and largely extended version of the airborne in situ instrument HAGAR (Werner et al., 2010) and is mounted in a HALO standard rack (R-G550SM). Similarly to HAGAR, HAGAR-V comprises a two-channel gas chromatograph (GC) with electron capture detection (ECD) as well as a non-dispersive infrared absorption module for the detection of CO2 (LI-COR LI-7000). In contrast to HAGAR, HAGAR-V additionally comprises a mass spectrometer (MS) coupled to two GC channels by a two-position valve which allows switching between the two channels. This novel MS module can thus be used either for the detection of a wide range of atmospheric trace gases (different target species on each channel) or to double the measurement frequency (same target species on both channels). However, during WISE only one of the two GC–MS channels was used, measuring nine different species (CH2Cl2, CHCl3, CH3Cl, CFC-11, CFC-113, HFC-125, HFC-134a, and iso- and n-pentane). In this study, the focus is on CH2Cl2 and CHCl3 measurements by HAGAR-V's novel MS module; thus the instrumental description is confined only to the GC–MS part of the instrument. A more detailed description of HAGAR-V is given by Lauther (2020).
The general MS sampling process during WISE was as follows: ambient air is drawn from outside the aircraft to the instrument and is further compressed to 3 bar(a) by two diaphragm pumps (KNF 813.5 and 814) connected in series. The sample passes through a preconcentration tube packed with about 70 mg of Carboxen 572 (Supelco) at 20 ∘C to adsorb the target species. At a usual adsorption time of 40 s the preconcentrated sample volume is about 130 mL. Afterwards the sample is desorbed by flash heating the trap to about 270 ∘C and injected onto the separation columns by applying a helium carrier gas flow. The sampled species are separated within two 0.25 mm J&W Scientific Al2O3–Na2SO4 PLOT capillary columns of 4 and 5 m length (pre-column and main column, respectively). Both columns are temperature controlled, changing from an initial 35 ∘C to a final 160 ∘C in 20 s (pre-column) and 35 s (main column) and providing two sample refocusing steps in the process. The sample is detected by a quadrupole MS detector (5975C, Agilent Technologies) using the electron ionization (EI) mode.
Fast GC–MS measurements are essential when operating from aboard an aircraft. To achieve a sample frequency of Hz per MS channel, particularly the heating and cooling rates of the preconcentration traps and the columns were optimized during the MS module development process. Both units are self-built, keeping the design and the application as adaptable as possible.
The cooling of the preconcentration traps is realized by a Stirling cooler (Twinbird, SC-UD08), and each trap is heated by a self-regulating Ni heating wire (which is also used as a temperature sensor) convoluted around the trap tube. To our knowledge, HAGAR-V is the only state-of-the-art airborne GC–MS instrument using indirect trap heating, and our thermodesorption design provides consistent heating and cooling rates of 80 and −25 ∘C s−1 (from 270 ∘C down to 20 ∘C) inside the trap tube. In addition, our thermodesorption concept avoids large variable currents at relatively low voltages (peak current < 7 A at 48 V for < 2 s, then < 2 A) and is thus well suited to being used aboard an aircraft with stringent constraints regarding electromagnetic compatibility.
The self-built separation column ovens are conceptually comparable to the principles of regular modern low-thermal-mass capillary column systems (e.g., Luong et al., 2006). In parallel to the column a heating wire and a temperature sensor wire are coiled to a torus of 7 cm in diameter, acquiring fast and homogenous heat application to the column (up to 20 ∘C s−1) and temperature read-out. Deactivated capillary columns emerge from the torus functioning as connecting lines and particle traps to enhance the measurement stability. The cooling of the columns is realized by fans providing a setback from final to initial temperatures within 60 s.
Following the compression by the inlet pumps, the air sample is usually dehydrated because water vapor can strongly affect the reproducibility of MS measurements. However, during WISE the dehydration system of HAGAR-V was malfunctioning. For the last 10 WISE flights, that system was bypassed and the MS module measured only at low ambient water vapor levels (mainly at H2O <100 ppm; median 5.6 ppm), i.e., in the UTLS region, thus yielding measurements during about 90 % of a typical flight's duration (i.e., about 7.6 h per flight). MS measurements of WISE flights before 28 September could not be used for analysis due to the malfunctioning sample dehydration unit.
HAGAR-V uses two different working standards for in-flight calibration to enhance the accuracy in the case of non-linear system responses. Both working standards consist of compressed clean ambient air; one of them is additionally diluted with about 25 % synthetic air. The main bottles of the working standards were calibrated by Goethe University Frankfurt against a calibration gas that was calibrated in second generation against an AGAGE standard on the SIO-14 (CH2Cl2) and SIO-98 (CHCl3) scale. Every second or third flight the in-flight calibration gas bottles were refilled from the main bottles after a calibration between the main bottles and flight bottles. Considering possible differences between the main bottles and flight bottles, uncertainties in the mixing ratios within the main bottles, and potential influence from HAGAR-V's inlet pump system, the MS relative accuracy was estimated to be 2.0 % and 4.4 % for CH2Cl2 and CHCl3, respectively.
Measurement precision was optimized during data processing, using a strongly adapted version of the Igor Pro analysis package called NOAHChrom, originally developed by NOAA, USA. Exponentially modified Gaussian (EMG) functions were fitted to the MS signal peaks within individual time windows. Thereby peak tailing could be accurately treated, and neighboring peaks were included in the background fit. In addition, the MS data were corrected for small system contamination and an occasional systematic measurement bias of one calibration gas. The measurement precision was derived for each flight from the standard deviation of one of the two in-flight calibration gases relative to its mixing ratio. The median precision values during WISE were 1.7 % (1 ppt) and 2.7 % (0.4 ppt) for CH2Cl2 and CHCl3, respectively.
2.2.2 University of Mainz Airborne Quantum Cascade Laser Spectrometer (UMAQS)
UMAQS simultaneously measures CO and N2O from aboard HALO. The instrument uses the principle of direct absorption spectroscopy of a continuous-wave quantum cascade laser operating at a sweep rate of 2 kHz (Müller et al., 2015). In this study we use UMAQS measurements of N2O with a total drift-corrected uncertainty of 0.18 ppb (Kunkel et al., 2019). Note that for this study the N2O measurements are averaged over 40–60 s to fit the integration times of HAGAR-V's MS module, thereby smoothing out instrumental noise and most likely further improving the N2O precision. The instrument is calibrated regularly in-flight using a secondary standard which is calibrated against a NOAA standard before and after the campaign. The accuracy of the N2O mixing ratios used is 0.39 ppb.
2.3 CLaMS simulations
To support the interpretation of airborne measurements, we use global three-dimensional simulations of the Chemical Lagrangian Model of the Stratosphere (CLaMS; McKenna et al., 2002a, b; Pommrich et al., 2014) as well as CLaMS back-trajectory calculations. CLaMS back-trajectory calculations consider only the advective (reversible) transport, neglecting (irreversible) mixing processes entirely (e.g., Vogel et al., 2019; Hanumanthu et al., 2020). However, in this study back trajectories are useful to trace back the detailed transport pathway and transport time of an air parcel in the UTLS to possible source regions in the boundary layer and therefore provide added value compared to three-dimensional CLaMS simulations including irreversible mixing. Both three-dimensional CLaMS simulations and back-trajectory calculations are driven by ECMWF ERA-Interim reanalysis data with a horizontal resolution of 1∘ × 1∘ (Dee et al., 2011).
In CLaMS, the diabatic approach was applied using the diabatic heating rate as the vertical velocity with contributions from radiative heating including the effects of clouds, latent heat release, mixing, and diffusion (for details, see Ploeger et al., 2010). CLaMS employs a hybrid vertical coordinate (ζ) which, in this study, transforms from a strictly isentropic coordinate (Θ) to a pressure-based orography-following coordinate system (σ coordinates) below a threshold of approximately 300 hPa (Pommrich et al., 2014). In both three-dimensional simulations and trajectory calculations, the upward transport in CLaMS is driven by ERA-Interim reanalysis data in which changes are implemented to improve deep and mid-level convection compared to in previous reanalysis data (Dee et al., 2011). However small-scale rapid uplift in convective cores is not included; therefore small-scale convection is most likely underestimated in CLaMS simulations driven by ERA-Interim. Nevertheless, upward transport in larger convective systems such as tropical cyclones is represented in CLaMS trajectory calculations driven by ERA-Interim (Li et al., 2017, 2020). More detailed information about CLaMS is given by Pommrich et al. (2014) and references therein. Equivalent latitudes and the location of the thermal tropopause (lapse rate, according to WMO) along the flight path were calculated from ERA-Interim reanalysis data.
2.3.1 Artificial tracers of air mass origin
In this study CLaMS simulations of artificial tracers of air mass origin (also referred to as surface origin tracers, Ωi; Vogel et al., 2015, 2016, 2019) are used to identify the location of the origin of air masses whose impact can be seen in the concentration data gathered during WISE. The surface origin tracers are released within 24 defined regions in the boundary layer (ζ=120 K ∼ 2–3 km above ground level (a.g.l.), including orography) as shown in Fig. 2a. The different surface origin tracers are continuously released (every 24 h) at the model boundary and are subsequently transported (advected and mixed) to the free atmosphere during the course of the simulation. Here, the irreversible part of transport was set to discrete mixing steps every 24 h. The simulation was initialized with the meteorological data from 1 May 2017, implying that all air parcels residing in the free troposphere and the stratosphere at this date are not marked with the surface origin tracers. As a consequence, the fraction of all surface origin tracers of an air parcel can be <100 % during the course of the simulation because air masses from before 1 May 2017 can also contribute to the composition of an air parcel. In this study we examine short-lived species measured in October 2017 with the focus on relatively fast transport; therefore a simulation period of approximately 5–6 months is chosen here. The model simulation used is spatially constrained from the surface to Θ=900 K (about 37 km altitude) with a horizontal resolution of 100 km and a maximum vertical resolution of about 400 m (at the tropopause).

Figure 2World map depicting the boundaries of CLaMS's 24 surface origin tracers (a) and three surface origin tracers combining several tracers from regions of significant (> 90 %) impact on the WISE measurements (b). The tracer names corresponding to their abbreviations are listed next to the maps. Also included in the list are the tracers of combined regions (see Sect. 3.1.2).
2.3.2 Back-trajectory calculations
In order to investigate the transport pathways corresponding to the WISE measurements analyzed here, the trajectory module of CLaMS was used to calculate back trajectories. The back trajectories are initialized at the time and location of the center of the respective MS sample integration time window and end at the first contact with the model boundary layer (below 2–3 km a.g.l.). In general, the maximum length of a trajectory is confined to 120 d; however most of the trajectories reach the model boundary layer much earlier.
In general, trajectory calculations have limitations caused by trajectory dispersion increasing with the trajectory length; therefore ensembles of trajectories (of about 100 to 200 trajectories) are used here. The maximum trajectory length of 120 d was chosen to match a large part of the time frame of the three-dimensional CLaMS simulation, but the average length of the back trajectories used is 50 d. We will show (in Sect. 3.1.2 and 3.1.3) that the results of the three-dimensional CLaMS simulation in which mixing of air parcels is included agree very well with the results of the back-trajectory analysis.
3.1 CH2Cl2–N2O relationship during WISE
The analysis presented in this paper is mainly based on the CH2Cl2–N2O relationship observed during WISE (Fig. 3). With a photochemical lifetime of 123 years (Ko et al., 2013), N2O is well mixed in the troposphere and has a much longer lifetime than CH2Cl2, which exhibits strongly varying mixing ratios throughout the boundary layer (e.g., Simmonds et al., 2006). As expected, the CH2Cl2–N2O relationship is relatively compact for data points with low N2O mixing ratios (i.e., N2O <325 ppb, relatively old, mixed, and processed air). Towards younger air masses (N2O >325 ppb) there is a distinct split of the compact relationship into two branches. In the stratosphere, the upper branch of the CH2Cl2–N2O relationship shows up to 150 % enhanced CH2Cl2 mixing ratios compared to data of the lower branch at the same N2O mixing ratios. For N2O >328.5 ppb, data points with low CH2Cl2 mixing ratios even decrease with increasing N2O (Fig. 3, inset). In general, the majority of measurements was obtained in the stratosphere above the thermal tropopause (TP) with an increasing number of observations below the thermal TP for increasing N2O mixing ratios. Thereby mainly air parcels of the lower branch of the CH2Cl2–N2O relationship are from below the thermal TP.
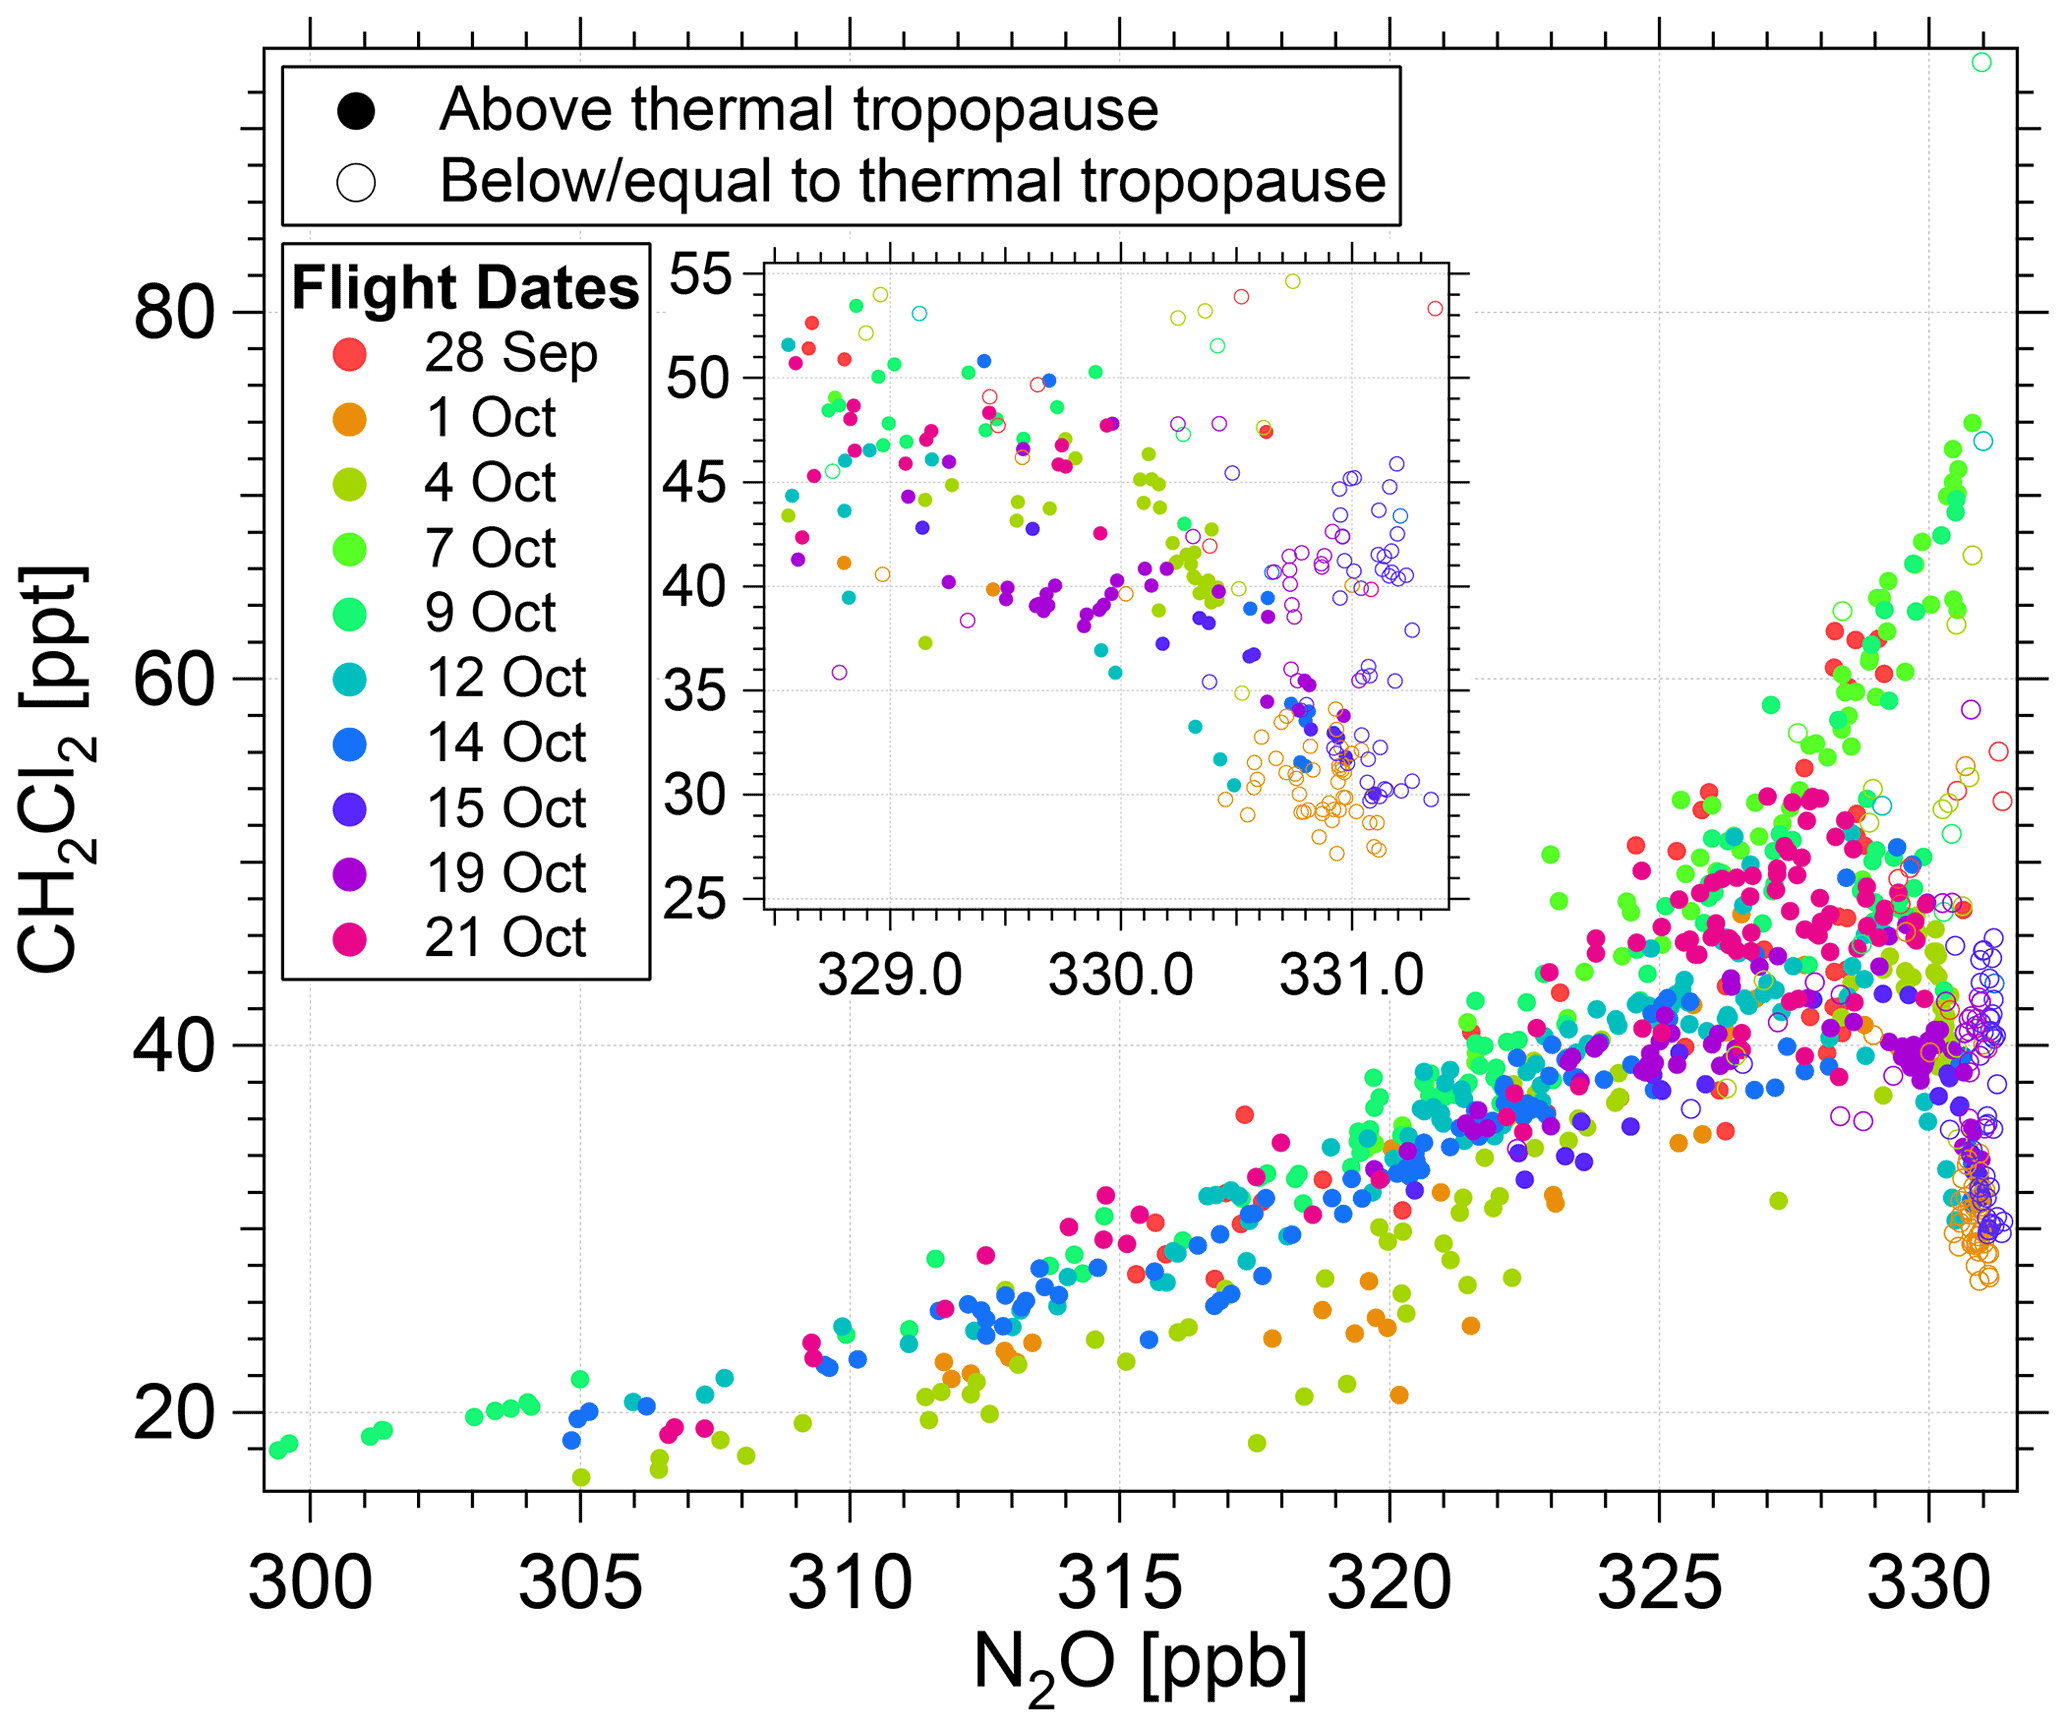
Figure 3CH2Cl2–N2O relationship color coded by flight date. The inset shows a detailed magnification of decreasing CH2Cl2 mixing ratios with increasing N2O within the lower branch of the CH2Cl2–N2O relationship. Air parcels below the thermal tropopause are marked as open circles and air parcels above by closed circles.
The most frequent convection up to potential temperature levels of the order of 360 K is expected to originate in the tropics. Therefore, tropical monthly averaged ground-based measurements of CH2Cl2 from the AGAGE network at Ragged Point, Barbados (Fig. 4; Prinn et al., 2018), were analyzed. These AGAGE observations suggest an explanation for the lower branch of the CH2Cl2–N2O relationship observed during WISE. The mainly OH-induced CH2Cl2 seasonality results in minimum tropical CH2Cl2 surface mixing ratios in September 2017. This September minimum is comparable to WISE data of low CH2Cl2 mixing ratios in the UTLS region in October (Fig. 4, at N2O ≈ 330.9 ppb) assuming a transport time from Earth's surface to the UTLS region of a few weeks. The observed decrease in low CH2Cl2 mixing ratios for increasing N2O mixing ratios (from older to younger air) agrees well with the decreasing tropical monthly averaged CH2Cl2 mixing ratios from about July to September 2017, as observed by AGAGE. Extratropical NH ground-based observations from the AGAGE network yield significantly higher CH2Cl2 mixing ratios than those in the tropics. It is thus very likely that the lower branch of the CH2Cl2–N2O relationship is caused by the tropical Atlantic CH2Cl2 surface seasonality. However, the low CH2Cl2 mixing ratios observed during WISE could also be impacted by air uplifted from regions less influenced by CH2Cl2 sources than the observations from the AGAGE network at Barbados. Ground-based observations of CH2Cl2 surface mixing ratios from the AGAGE and the NOAA network show strong regional differences particularly in the NH tropics. However, it is unclear if these differences are caused by calibration biases or are of a natural origin (Engel et al., 2018).
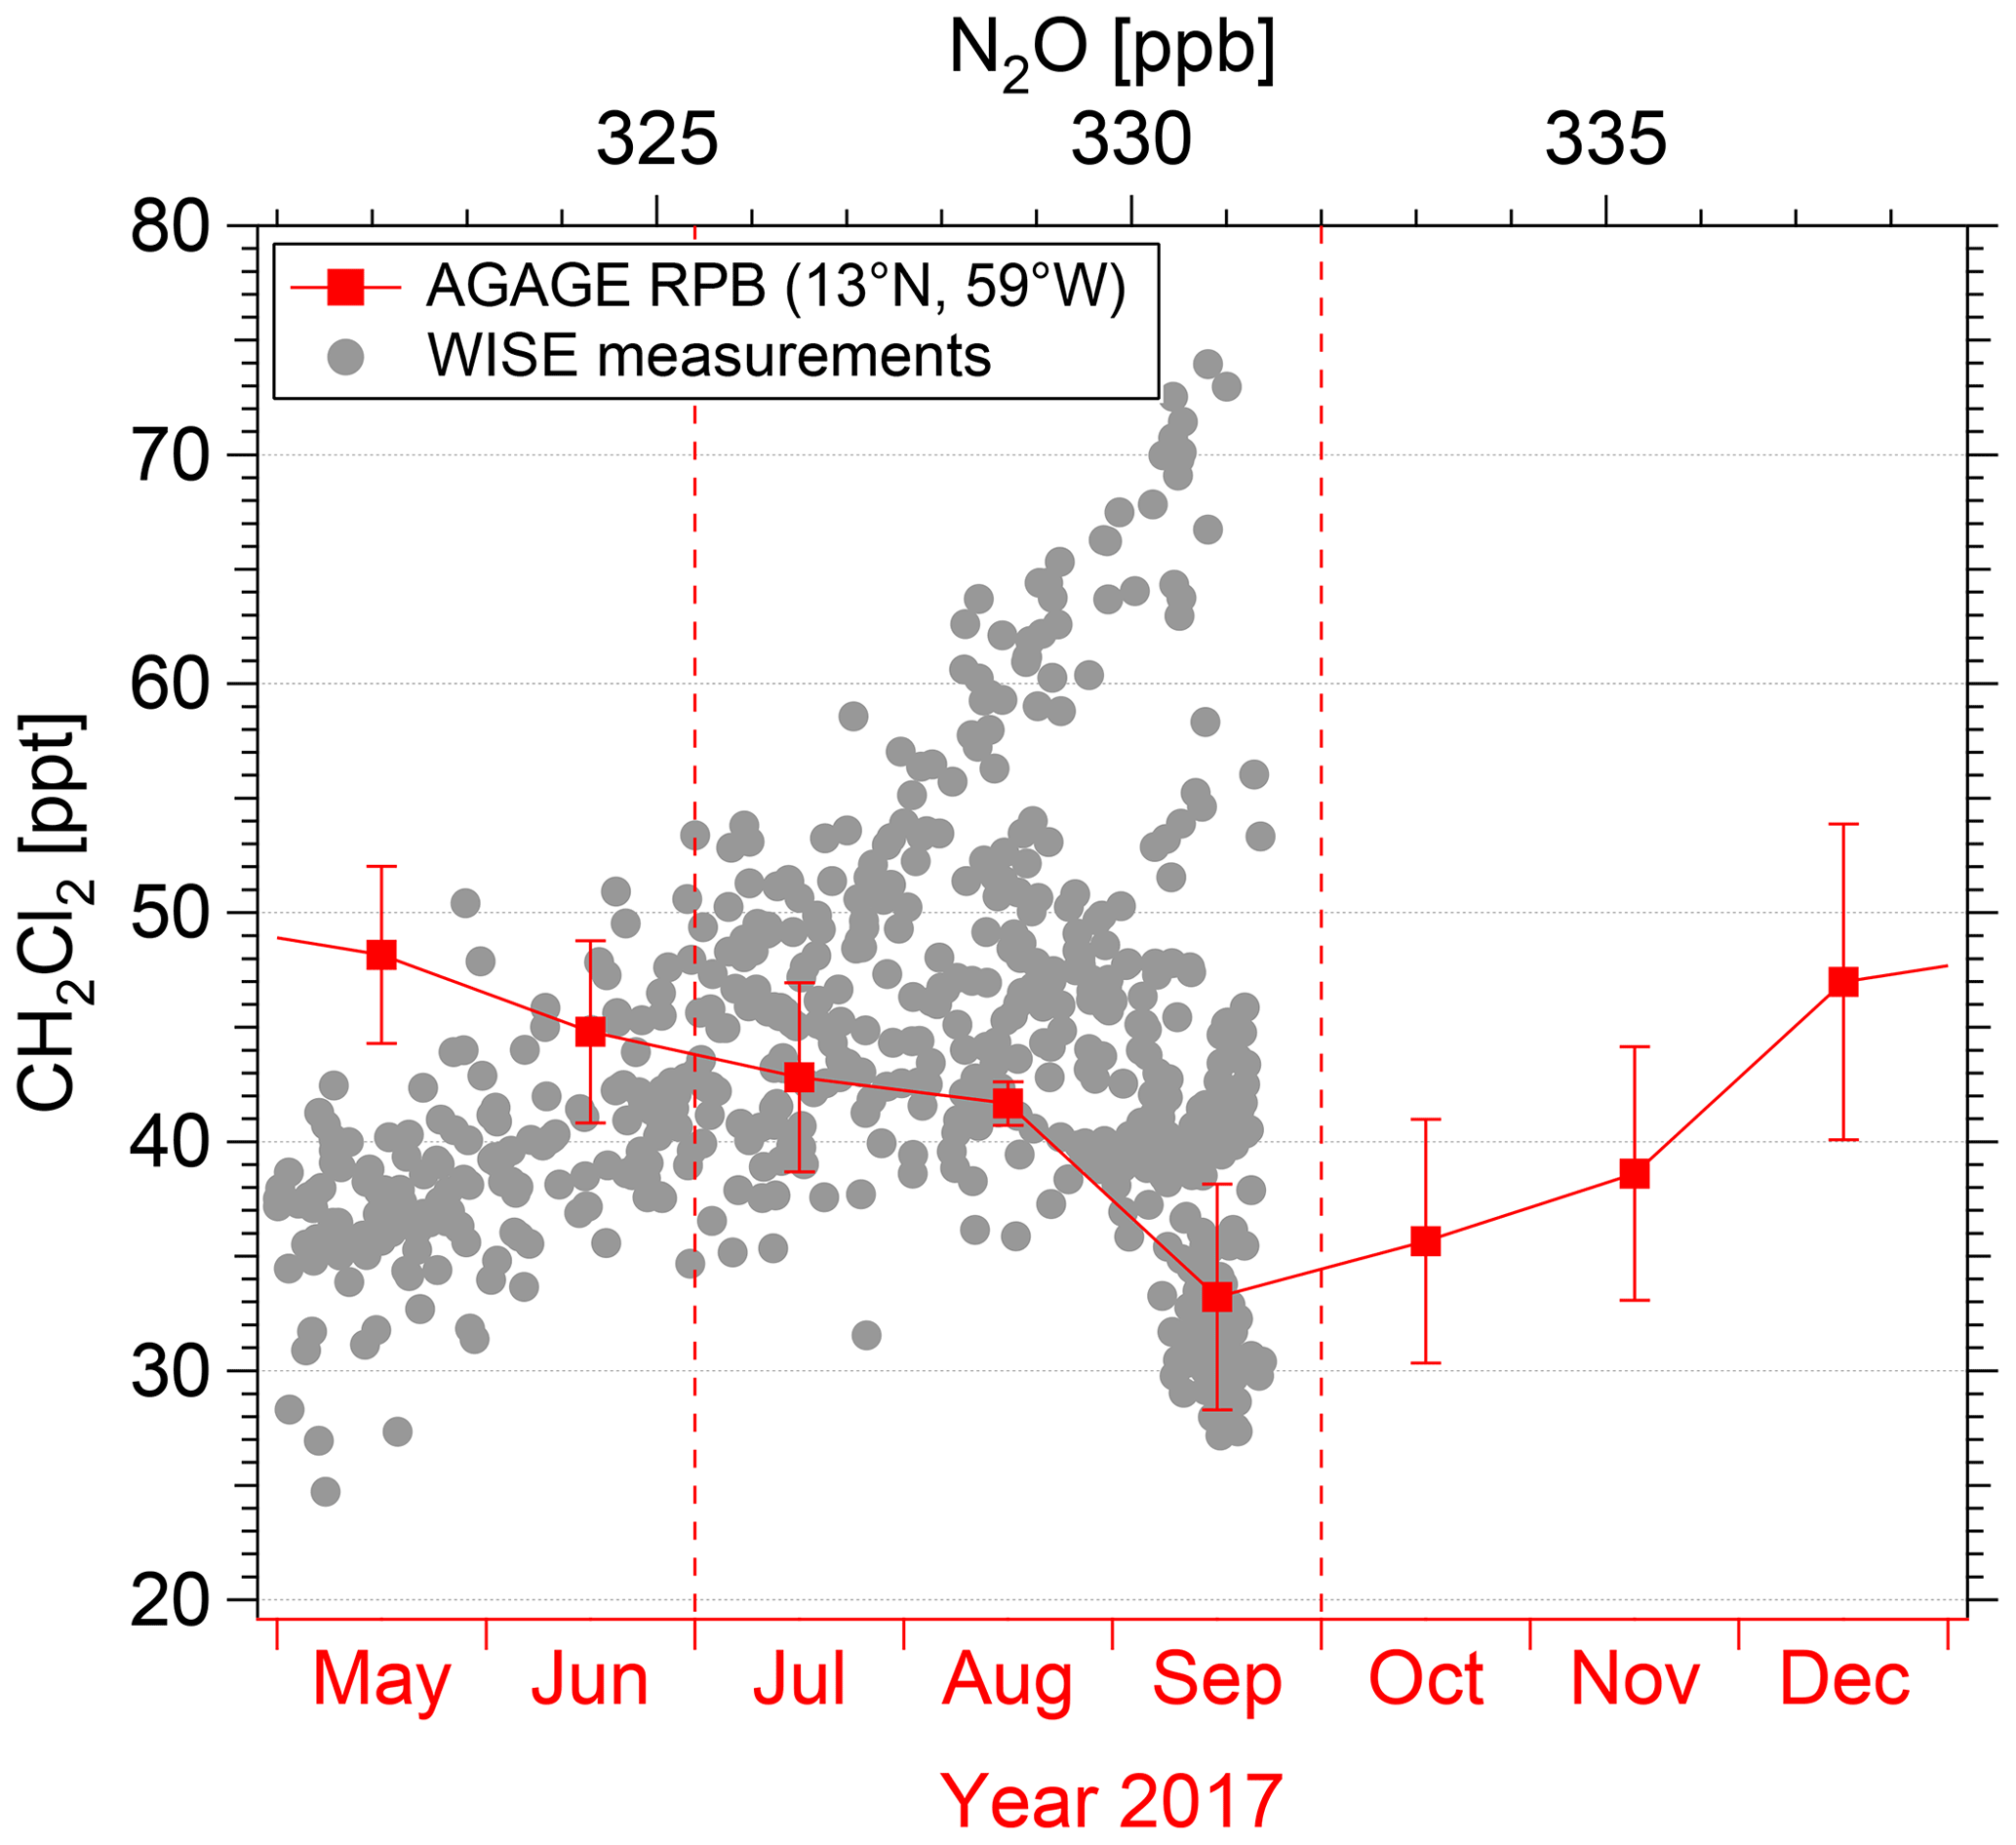
Figure 4Monthly averaged ground-based measurements of CH2Cl2 from the AGAGE network at Ragged Point, Barbados (13∘ N; Prinn et al., 2018), overlaid by a detailed plot of the CH2Cl2–N2O relationship observed during WISE. The AGAGE CH2Cl2 time series (shown in red) shows CH2Cl2's seasonality and is overlaid by the CH2Cl2–N2O relationship such that the CH2Cl2 minimum at N2O ≥325 ppb measured during WISE in October 2017 matches the surface CH2Cl2 minimum at Barbados in September 2017. Further, the axis of the time series is adjusted so that 1 month corresponds to a change of ∼2 ppb N2O, which is the typical N2O change per month of age in the UTLS (Andrews et al., 2001). The gradient of the CH2Cl2–N2O relationship's lower branch (low CH2Cl2 mixing ratios between dashed red lines) qualitatively fits the temporal variation in the ground-based CH2Cl2 measurements. The graph illustrates the congruence of ground-based tropical measurements of CH2Cl2 from the AGAGE network and airborne extratropical measurements of CH2Cl2 from the WISE campaign when assuming that the variation in stratospheric CH2Cl2 with age (here expressed in terms of the N2O mixing ratio) arises from the temporal variation in CH2Cl2 at the ground (“tape recorder effect”). Although this simplified view ignores the impact of mixing processes and chemical reduction in CH2Cl2, it qualitatively explains the lower branch of the CH2Cl2–N2O relationship for air parcels younger than a few months.
3.1.1 Data filter
In order to separately analyze the CH2Cl2–N2O relationship's distinct features, the measurements are filtered relative to a “mean correlation curve”. The mean correlation curve is derived from a quadratic fit applied to the CH2Cl2–N2O relationship for N2O <325 ppb, i.e., where the relationship clearly correlates (Fig. 5a). In order to identify chemically contrasting air masses of potentially different origin, we focus on the most extreme differences in the chemical composition: measurements more than 5 ppt higher than the mean correlation curve are considered CH2Cl2-rich air; measurements more than 10 ppt lower than the mean correlation curve are considered CH2Cl2-poor air. In addition, only measurements with N2O >325 ppb (corresponding to Θ<390 K) are considered. The choice of these filter conditions allows the CH2Cl2-rich and CH2Cl2-poor air masses to be clearly discriminated. It will further be shown below that this filter definition yields a good correspondence with the impact of different air mass origins on the CH2Cl2–N2O relationship.
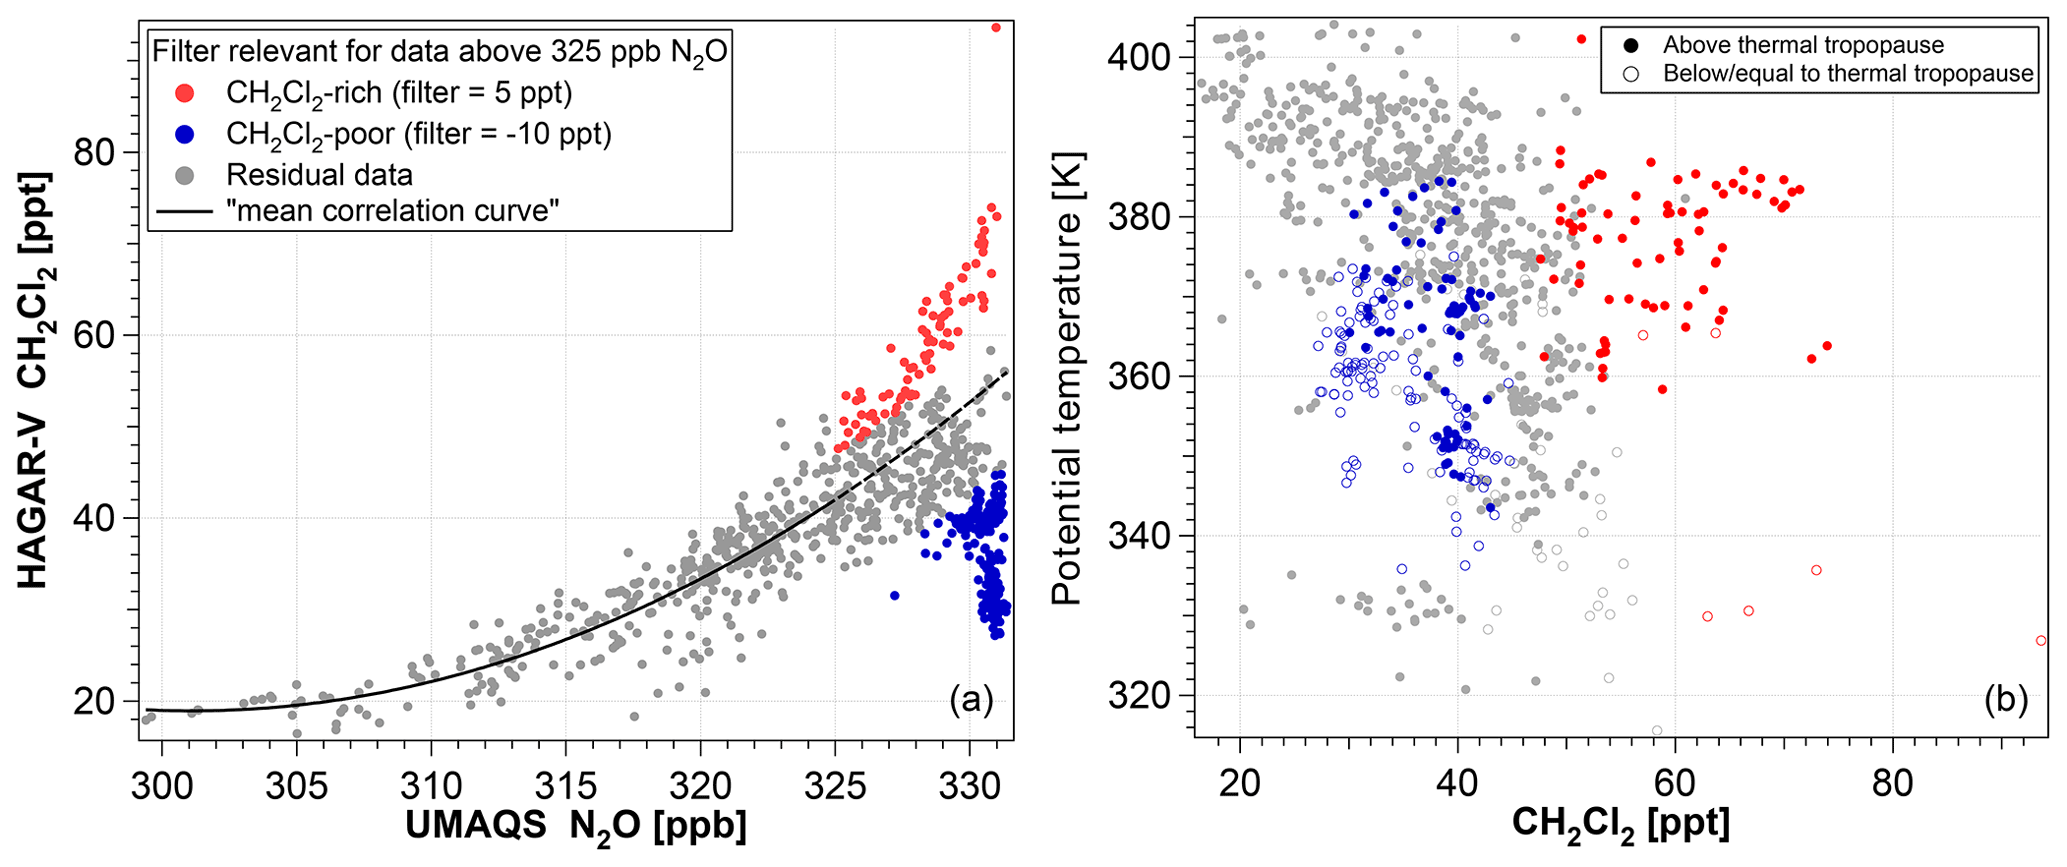
Figure 5(a) CH2Cl2–N2O relationship color coded with the definition of the data filter used. Red data points are measurements considered CH2Cl2-rich air with mixing ratios more than 5 ppt higher than the mean correlation curve and N2O ≥325 ppb. Blue data points are measurements considered CH2Cl2-poor air with mixing ratios more than 10 ppt lower than the mean correlation curve and N2O ≥325 ppb. The mean correlation curve is derived from a quadratic fit to the CH2Cl2–N2O relationship for N2O <325 ppb extrapolated to higher mixing ratios relevant for the data filter (dashed line). (b) Scatterplot of CH2Cl2 as a function of the potential temperature, color coded to highlight CH2Cl2-rich (red) and CH2Cl2-poor (blue) air. On average the CH2Cl2-rich air is found at higher potential temperatures than the CH2Cl2-poor air.
The thus defined measurements of CH2Cl2-rich air contain a median of 64 % higher mixing ratios than those of CH2Cl2-poor air (59 ppt vs. 36 ppt, respectively). In addition, the median potential temperature of measurements of CH2Cl2-rich air is 16.2 K higher than that of CH2Cl2-poor air (377.8 K vs. 361.6 K, respectively). In the Ex-LS, 93 % of CH2Cl2-rich air was observed, which is the case only for 40 % of CH2Cl2-poor air. However, only slightly smaller differences between the two types of air mass are visible in observations above the thermal TP (58 ppt vs. 39 ppt and 378.7 K vs. 368.3 K, respectively). Not only do these findings indicate tropospheric intrusions of air from two different source regions into the stratosphere, but the different levels of potential temperature also suggest two different transport mechanisms. One is transporting CH2Cl2-rich air mainly to the top of the LMS (Θ≈380 K), and the other is transporting CH2Cl2-poor air mainly to the middle and lower part of the LMS (Θ≈360–370 K; Fig. 5b).
3.1.2 Impact of different air mass origins on the extratropical UTLS
In order to investigate the impact of different air mass origins on the WISE trace gas measurements, tracers of air mass origin simulated with CLaMS are analyzed. To focus on fast transport into the LMS in the range of approximately 6 months, reflecting the mean tropospheric lifetime of CH2Cl2 and CHCl3 (see Sect. 1), only the fraction of air parcels released from the boundary layer since 1 May is considered. Therefore, in every air parcel each surface origin tracer fraction (Ωi) is normalized to the sum of all fractions of surface origin tracers in the air parcel, thus neglecting the fraction of air that was in the free atmosphere at the initialization date of the CLaMS simulation on 1 May 2017 (i.e., air older than 6 months). The start time of our simulations on 1 May 2017 is further chosen to be before the onset of the Asian summer monsoon (pre-monsoon) in order to include all transport processes into the lower stratosphere (LS) impacted by the Asian monsoon circulation. In the following, all analyzed surface origin tracers are normalized as described above if not stated otherwise.
Further, to work out differences in air mass origin between CH2Cl2-rich and CH2Cl2-poor air, the median fraction of a surface origin tracer in CH2Cl2-rich air parcels is compared to that in CH2Cl2-poor air parcels. To combine regions of air mass origin with a particularly high relative impact on either CH2Cl2-rich or CH2Cl2-poor air, the ratio of these median surface origin tracer fractions in CH2Cl2-rich and CH2Cl2-poor air is analyzed. Surface origin tracers with particularly high relative median fractions in either CH2Cl2-rich or CH2Cl2-poor air are combined following these two criteria:
-
Only surface origin tracers with median fractions ≥1 % in CH2Cl2-rich or CH2Cl2-poor air parcels are considered.
-
The ratio of a median surface origin tracer fraction (CH2Cl2-rich CH2Cl2-poor air or CH2Cl2-poor CH2Cl2-rich air) must be >1.8.
With this definition, regions of air mass origin – as defined for the model simulation – of significantly enhanced influence on measurements of CH2Cl2-rich (CH2Cl2-poor) air relative to CH2Cl2-poor (CH2Cl2-rich) air are combined. Table 1 lists the median fractions in CH2Cl2-rich and CH2Cl2-poor air of each surface origin tracer fulfilling criterion 1.
Table 1Median fractions of different surface origin tracers from CLaMS in measurements of CH2Cl2-rich and CH2Cl2-poor air parcels and the respective ratios of the median fractions. The last row shows the median fraction of Ω. Ω is the sum of all (non-normalized) surface origin tracers of the respective air parcels (; see Sect. 2.3.1), which is the fraction of an air parcel actually considered in the tracer analysis of CH2Cl2-rich and CH2Cl2-poor air. The fraction (100−Ω) % is the part of an air parcel that was already in the free atmosphere on 1 May 2017. The geographical location of each surface origin tracer is given in Fig. 2.
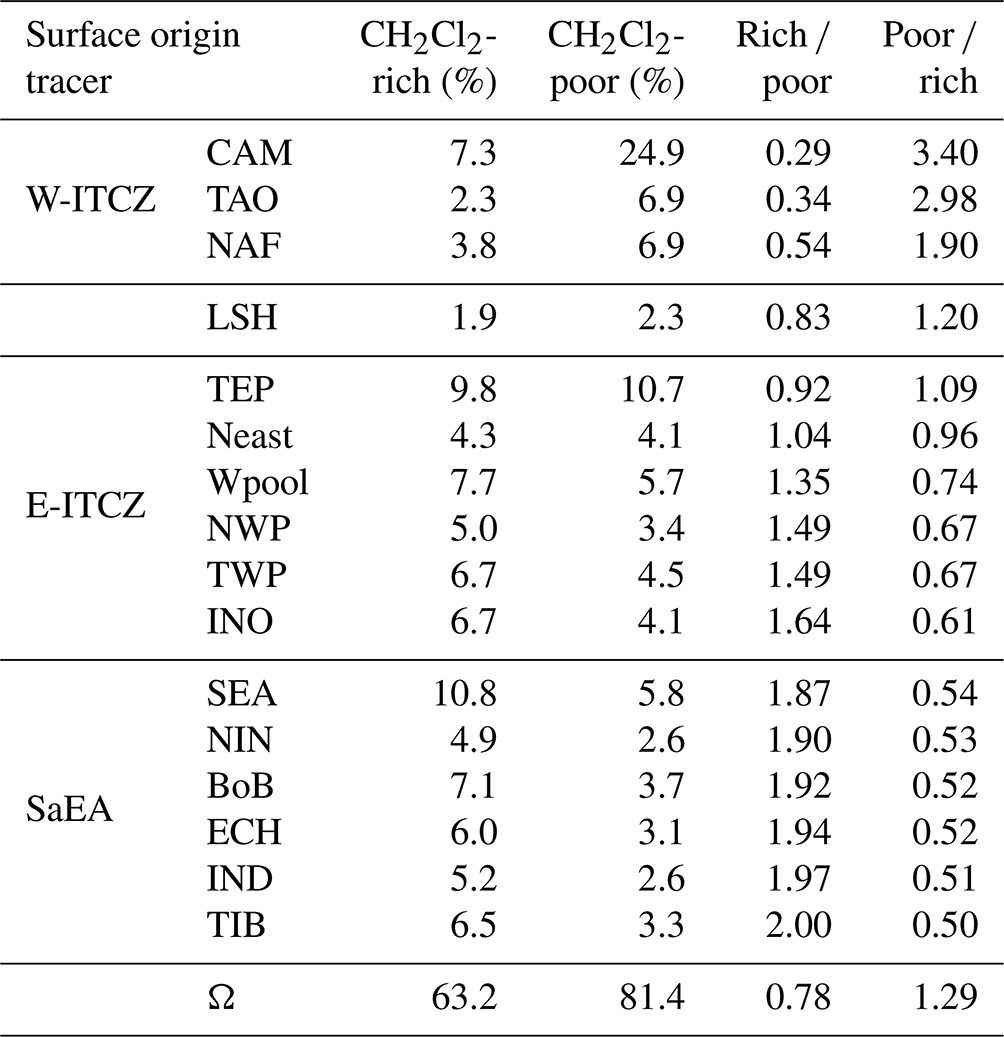
The surface origin tracers also fulfilling criterion 2 for CH2Cl2-rich air are all located in the region of southern and eastern Asia (SaEA) including India, China, and Southeast Asia (see Fig. 2). The source region of this SaEA tracer is mostly land based and located in the core region of the Asian summer monsoon (ASM) from where the highest CH2Cl2 emissions globally are expected (Claxton et al., 2020). The median fraction of the SaEA surface origin tracer in CH2Cl2-rich air is about twice that in CH2Cl2-poor air (41.5 % vs. 20.7 %, respectively).
The surface origin tracers fulfilling criteria 1 and 2 for CH2Cl2-poor air are all located in the tropics along the mostly western part of the Intertropical Convergence Zone (ITCZ) from 120∘ W to about 45∘ E (W-ITCZ; see Fig. 2b). The source region of this W-ITCZ tracer includes a large maritime region and is not known for significant CH2Cl2 emissions. The median fraction of the W-ITCZ surface origin tracer in CH2Cl2-poor air is about 3 times higher than in CH2Cl2-rich air (40.6 % vs. 13.5 %, respectively) with a particularly high contribution from the region of Central America (CAM).
The surface origin tracers fulfilling criterion 1 but not criterion 2 are all geographically connected. To focus on NH regions of air mass origin and because its fraction in both CH2Cl2-rich and CH2Cl2-poor air is very low (<2.5 %), the surface origin tracer for the lower Southern Hemisphere (LSH; Fig. 2a) will not be considered in the following analysis. Without LSH, the third major region of air mass origin significantly influencing the WISE measurements by relatively fast transport mainly includes an extended region of the summertime ITCZ mostly in the Eastern Hemisphere and the Pacific Ocean (E-ITCZ), excluding the regions of W-ITCZ and SaEA. The region of this E-ITCZ tracer combines a vast maritime region and areas adjacent to the core region of the ASM. The fractions of the E-ITCZ surface origin tracer in CH2Cl2-rich and CH2Cl2-poor air parcels do not strongly favor either over the other.
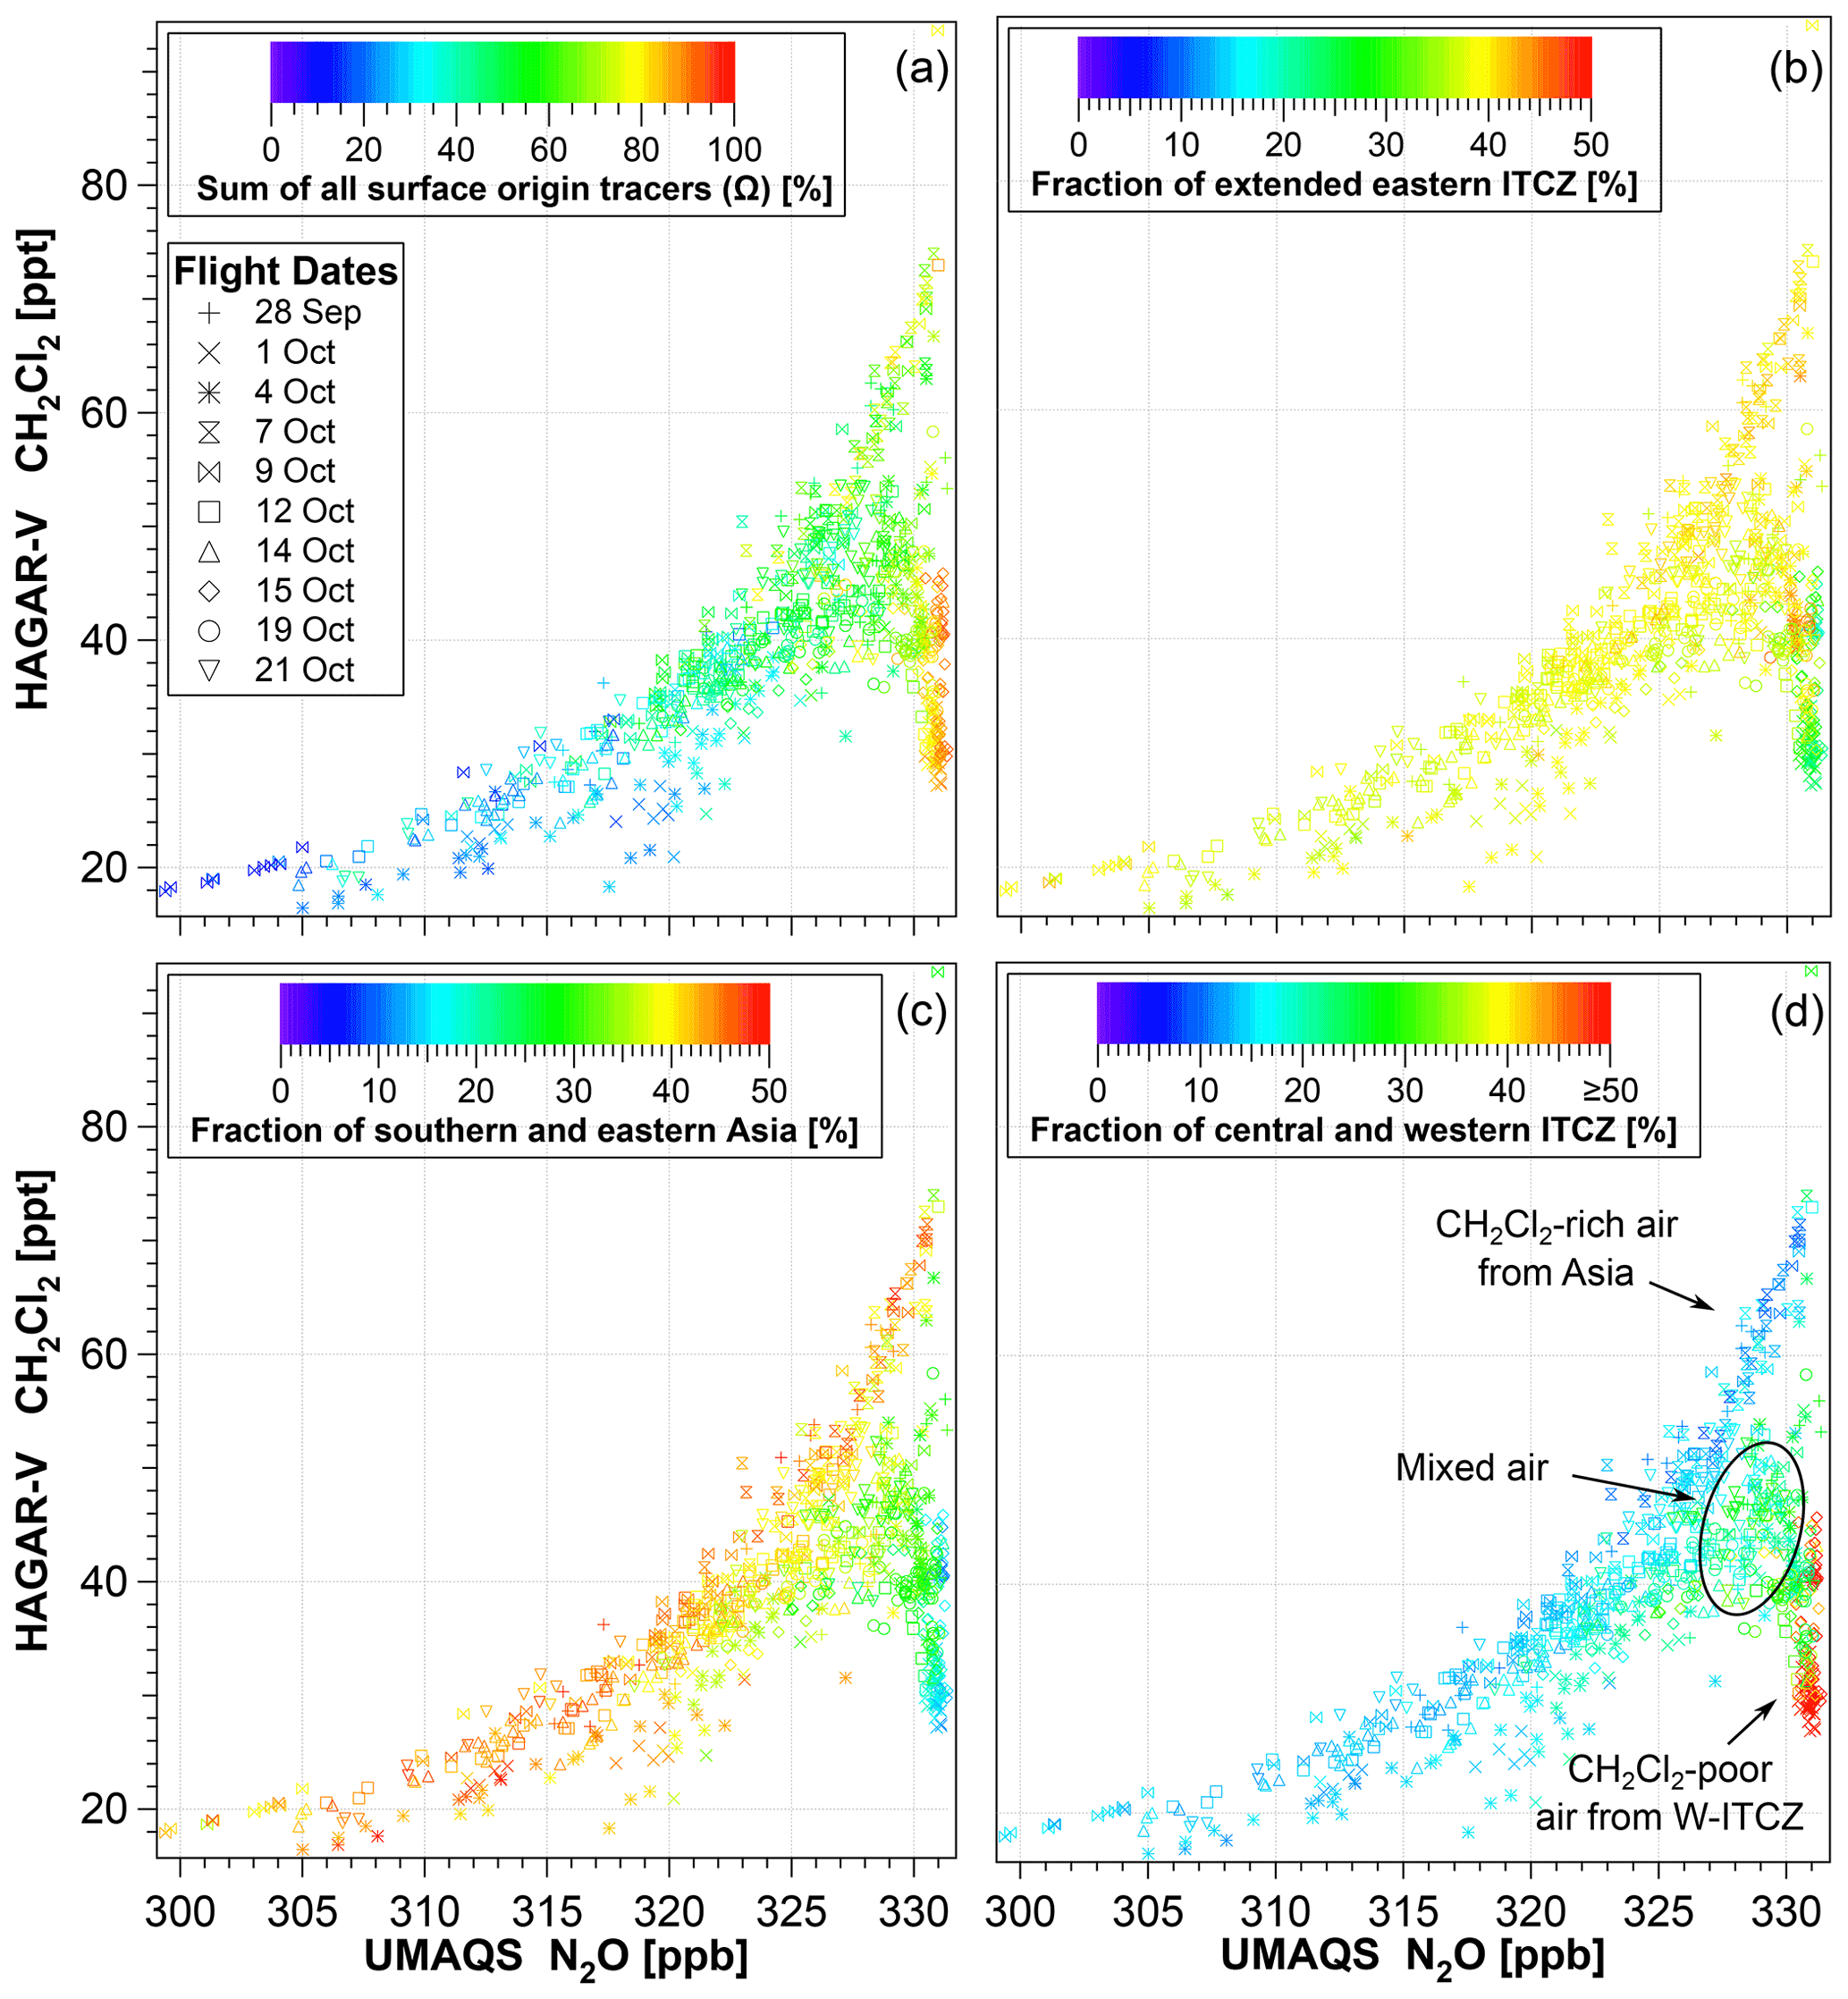
Figure 6CH2Cl2–N2O relationship color coded with the sum of all (non-normalized) surface origin tracers (Ω, a) and the E-ITCZ (b), the SaEA (c), and the W-ITCZ (d) surface origin tracer. The SaEA, W-ITCZ, and E-ITCZ surface origin tracers are each normalized to the sum of all surface origin tracers (i.e., of each air parcel only the fraction of the sum of all surface origin tracers is considered), thereby neglecting the fraction of older air that was above the model boundary layer on the simulation's initialization date (1 May 2017; see Sect. 2.3.1). The CH2Cl2–N2O relationship color coded with the absolute fraction of SaEA and W-ITCZ is shown in Fig. A1 in Appendix A.
With mainly fractions above 40 %, the SaEA tracer dominates the CH2Cl2–N2O relationship both below 325 ppb N2O and in the upper branch above 325 ppb N2O including CH2Cl2-rich air (Fig. 6c). Towards CH2Cl2-poor air, the SaEA tracer gradually decreases while the W-ITCZ tracer increases up to fractions above 50 % (Fig. 6d). In fact, both surface origin tracers, SaEA and W-ITCZ, show significant correlations with all WISE CH2Cl2 measurements at N2O >325 ppb. Thereby Spearman's correlation coefficients rSaEA=0.7 and indicate a significant monotone but not necessarily linear positive and negative correlation, respectively, with fractions of the SaEA tracer ranging from 8.5 % to 48 % and those of the W-ITCZ tracer ranging from 9.3 % to 70.8 %.
On the one hand, of all measured air masses entering the LS in the course of the NH summer, a large fraction originated in southern and eastern Asia. In addition, these air masses are preferably composed of CH2Cl2-rich air and thus strongly contribute to steepening the slope of the CH2Cl2–N2O relationship (upper branch). On the other hand, young air from the region of the central and western part of the ITCZ strongly influences the UTLS with CH2Cl2-poor air (lower branch). Further, measurements in between CH2Cl2-rich and CH2Cl2-poor air in the CH2Cl2–N2O relationship contain moderate fractions (in the range of 20 %–40 %) from both regions of air mass origin.
It has to be noted that the ground-based measurements of CH2Cl2 from the AGAGE network (Sect. 3.1) were obtained in the CAM surface origin tracer region, which is included in the W-ITCZ tracer. The extraordinarily high impact of the CAM tracer (24.9 %) on the measurements of CH2Cl2-poor air strongly supports the comparison made in Sect. 3.1 and underlines our conclusion of CH2Cl2's tropical Atlantic surface seasonality being reflected in the measurements within the UTLS region.
The influence of the E-ITCZ surface origin tracer on the CH2Cl2–N2O relationship is about equal in all air parcels with fractions of around 40 % (Fig. 6b). This region of air mass origin is thus generally important for the composition of young air masses in the LMS without a specifically strong influence on either CH2Cl2-rich or CH2Cl2-poor air.
3.1.3 Results of back-trajectory calculations
The back trajectories calculated for CH2Cl2-rich and CH2Cl2-poor air are analyzed in two steps. First, the location of the maximum rate of change in potential temperature (diabatic ascent rate) along each back trajectory is derived and the transport time from the measurement to this location is calculated. Second, the back trajectories are considered up to the point where they reach the model boundary layer. General transport pathways are derived for measurements of CH2Cl2-rich and CH2Cl2-poor air. Within the maximum of 120 d the model boundary layer is reached by 59 out of 80 back trajectories of CH2Cl2-rich air (74 %) and 170 out of 189 back trajectories of CH2Cl2-poor air (90 %), and only these back trajectories are analyzed in the following. The median time for an air parcel at the boundary layer to reach the location of measurement is 48 d; CH2Cl2-poor air in general shows shorter transport times (43 d) than CH2Cl2-rich air (64 d). The locations of trajectory end points at the model boundary layer color coded with transport time are given in Appendix B (Fig. B1).
Locations of maximum diabatic ascent rate and transport times
The location of maximum change in potential temperature over a time interval of 18 h (max ΔΘ18 h) along each trajectory is used to identify the locations of strong uplift along the trajectories of sampled CH2Cl2-rich and CH2Cl2-poor air. This uplift occurs in the troposphere. Details about the calculation and use of max ΔΘ18 h are given by Hanumanthu et al. (2020).

Figure 7Location of maximum change in potential temperature over a time interval of 18 h (max ΔΘ18 h) along back trajectories, color coded with the transport time from the location of measurement to the location of max ΔΘ18 h. (a) CH2Cl2-poor air; (b) CH2Cl2-rich air. Shown are the locations of max ΔΘ18 h for CH2Cl2-rich and CH2Cl2-poor air from all WISE flights between 28 September and 21 October.
Table 2Median transport times derived from back trajectories calculated for air parcels of CH2Cl2-poor air uplifted above Central America (location of max ΔΘ18 h within 0–35∘ N and 50–120∘ W) labeled as NAM and for air parcels of CH2Cl2-rich air uplifted above southern and eastern Asia (location of max ΔΘ18 h within 0–40∘ N and 60–160∘ E) labeled as ASM. The median transport times are calculated from both the model boundary layer (BL) and the location of max ΔΘ18 h to the location of measurement in the UTLS, only for samples above the thermal TP (lower stratosphere, LS) and only for samples below or equal to the thermal TP (upper troposphere, UT). The medians are given with the range of the 25th and the 75th percentile in parentheses. N is the number of trajectories used to calculate the respective median. Note that the number of CH2Cl2-rich air samples observed in the UT and uplifted above southern and eastern Asia is too small to provide reliable transport times.
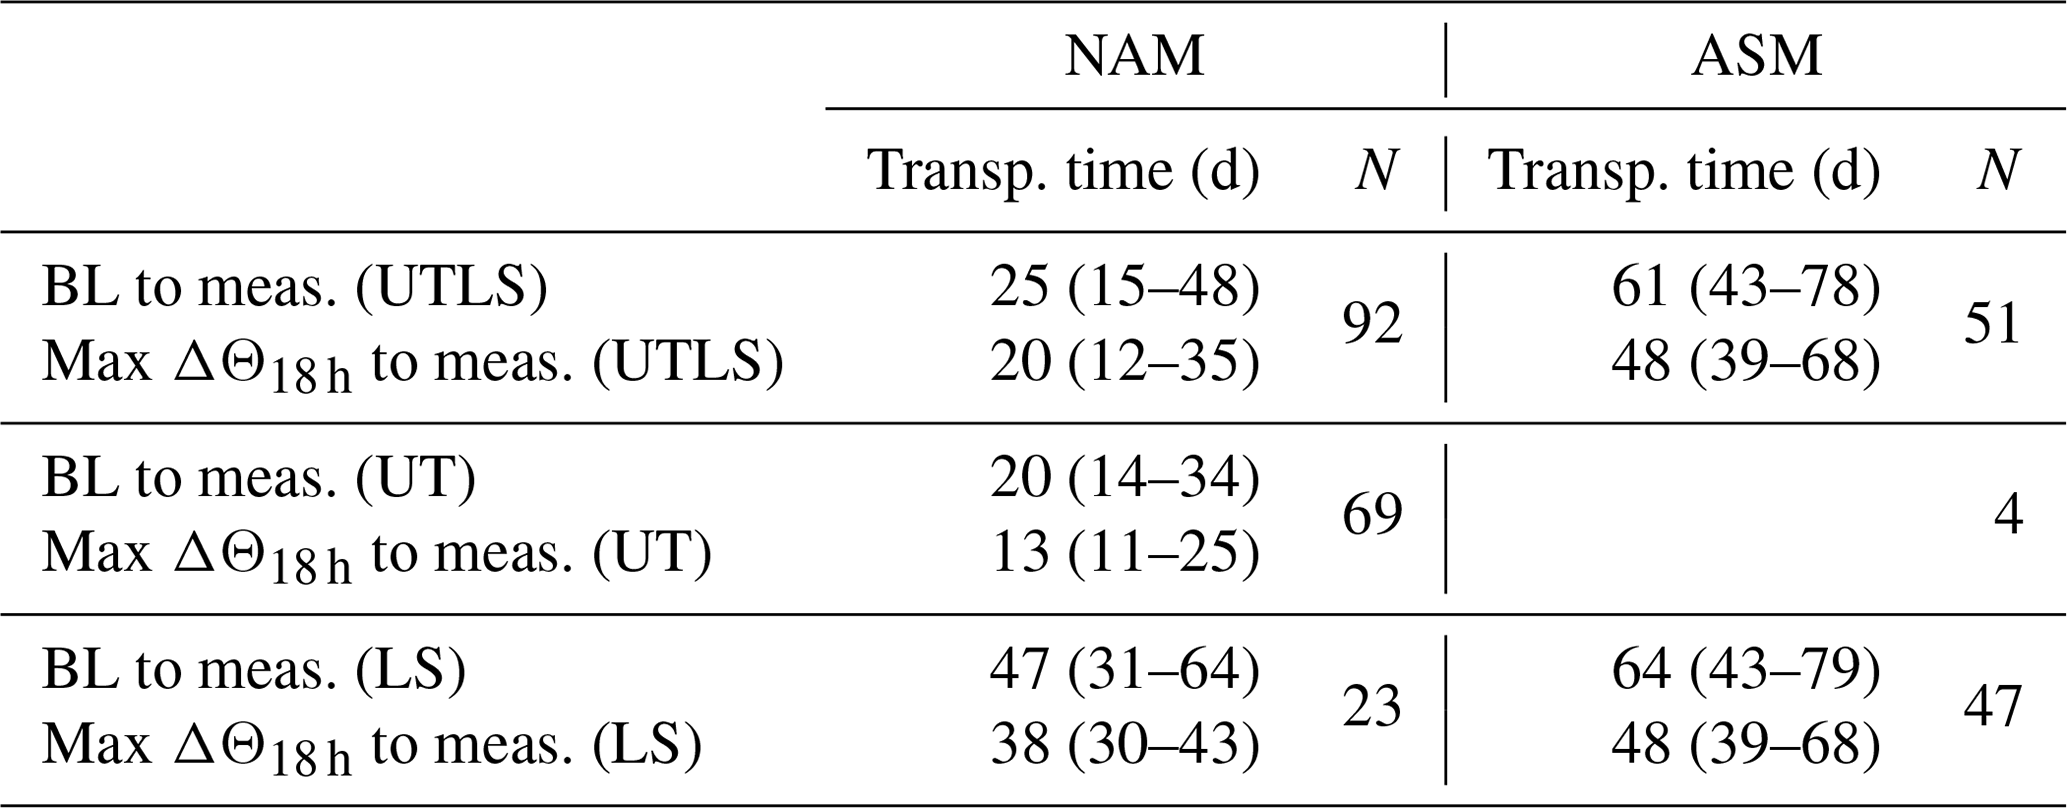
Almost all trajectories of CH2Cl2-rich air show their max ΔΘ18 h above the region of southern and eastern Asia, in particular above the region of the Tibetan Plateau, northern India, China, and Southeast Asia (Fig. 7b). This uplift mostly occurred about 5–10 weeks prior to the measurement (see Table 2), i.e., in July and August, the peak season of the ASM. This strongly suggests that the measurements of CH2Cl2-rich air were almost exclusively uplifted within the ASM. There is a clear overlap between the Asian region of concentrated locations of max ΔΘ18 h and the region of the SaEA surface origin tracer with the highest relative contribution to air parcels of CH2Cl2-rich air (see Sect. 3.1.2), suggesting a consistency between trajectory calculations and the three-dimensional CLaMS simulation.
Of all trajectories related to CH2Cl2-poor air, more than 50 % exhibit the location of max ΔΘ18 h above the region of Central America with the rest being located above southern and eastern Asia and along the ITZC (Fig. 7a). The transport times to the UTLS since the ascent above Central America mainly range between 2–5 weeks (see Table 2). The main uplift of CH2Cl2-poor air above Central America thus falls into the time period of late August and throughout the entire September. With transport times from the boundary layer (BL) being only about 1 week longer (Table 2), this result supports the comparison of CH2Cl2-poor air with the seasonal minimum CH2Cl2 mixing ratios observed by AGAGE at Barbados (see Fig. 4). During the time period of late August and September, the region around Central America is influenced by several convective systems: (1) the North American monsoon; (2) the ITCZ; and (3) tropical cyclones, i.e., hurricanes. It is very likely that all of these convective systems contributed to the fast uplift of CH2Cl2-poor air. The convection systems of the North American monsoon and the ITCZ share many characteristics and overlap geographically, which makes it difficult to distinguish between the two systems (e.g., Siu and Bowman, 2019). The uplift of air parcels by hurricanes can be distinguished and localized more clearly and is analyzed below. The back-trajectory analysis suggests that the most important region for vertical transport of CH2Cl2-poor air is above Central America, which was also identified as the most significant region of air mass origin of CH2Cl2-poor air in the three-dimensional CLaMS simulation (see Sect. 3.1.2).
Analysis of transport pathways
The back trajectories from the location of measurement to the model boundary layer are analyzed to identify the main transport pathways of CH2Cl2-rich and CH2Cl2-poor air into the UTLS. As representative examples, Fig. 8 shows the trajectories of the WISE flights on 1 October (Fig. 8a) and 7 October (Fig. 8b) for CH2Cl2-poor and CH2Cl2-rich air, respectively.
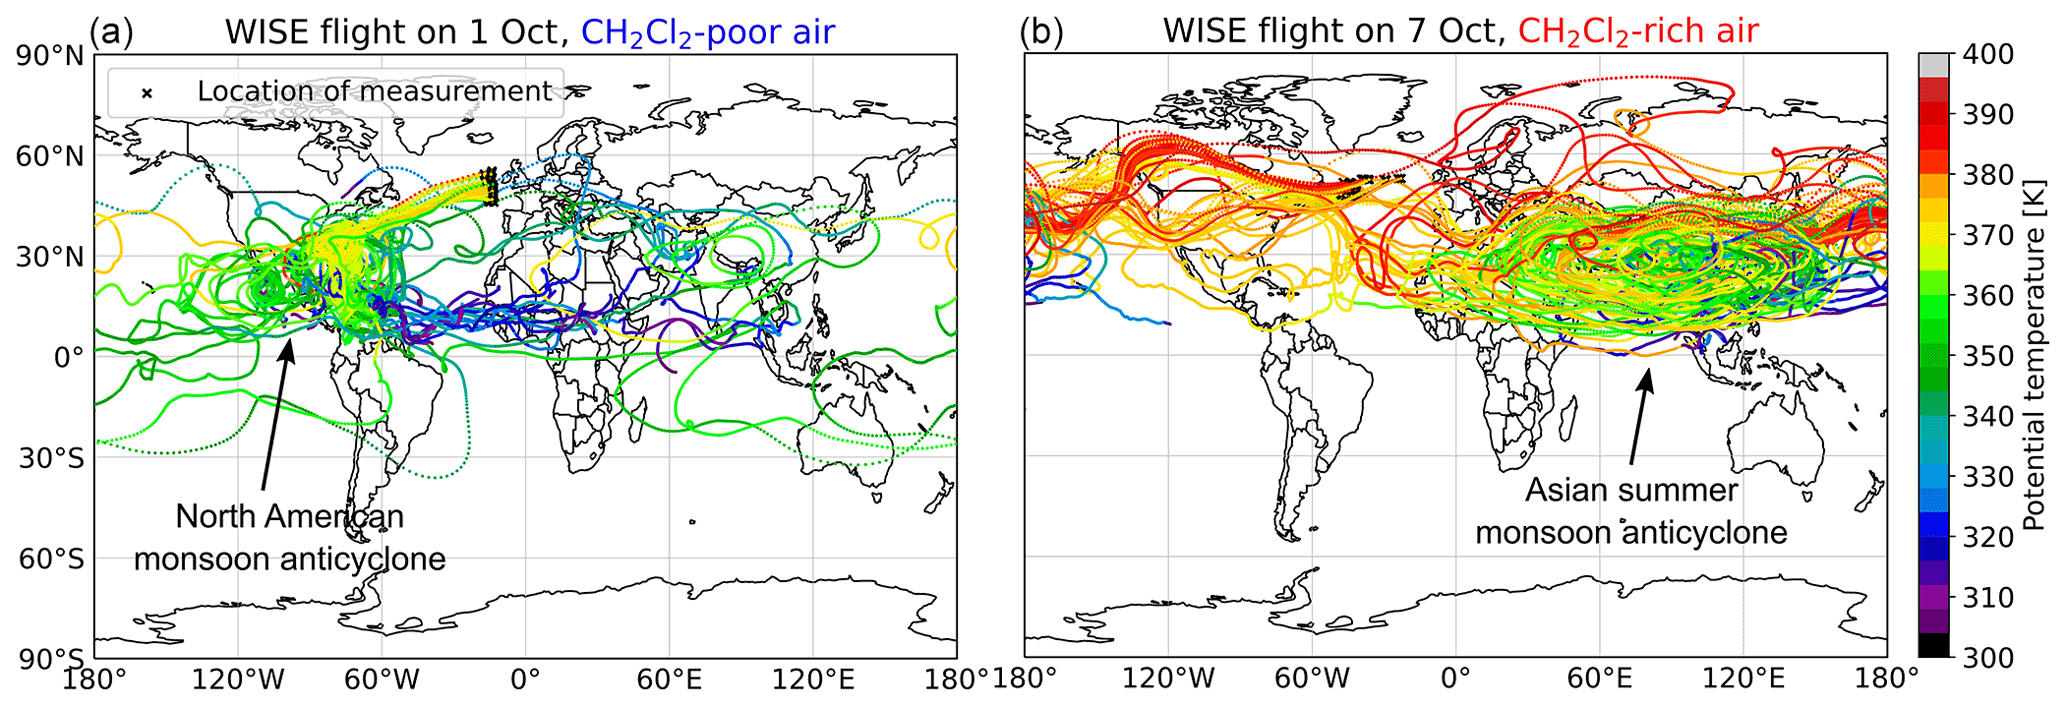
Figure 8Back trajectories from the location of measurement to the model boundary layer for CH2Cl2-poor air sampled on 1 October (a) and for CH2Cl2-rich air sampled on 7 October (b), color coded with the potential temperature of the trajectory. The trajectories of CH2Cl2-poor air show an uplift above Central America to about 365 K, an isentropic northward drag towards an anticyclonic system above North America, an eastward breakout, and a direct and isentropic pathway into the extratropics above the Atlantic Ocean. The trajectories of CH2Cl2-rich air show an uplift above southern and eastern Asia up to about 360 K with further upward transport by the ASMA to about 385 K and a breakout eastwards following the subtropical jet stream until they quasi-isentropically enter the extratropics above the eastern Pacific or western Atlantic Ocean.
Almost all trajectories of CH2Cl2-rich air show the following general pathway: the air parcels are convectively lifted up above southern and eastern Asia to Θ≈360 K. Further ascent of the air parcels occurs in a clockwise upward spiraling motion (Vogel et al., 2019), following the dynamics of the Asian summer monsoon anticyclone (ASMA), mainly to potential temperatures in the range of 370–400 K. Preferably within this potential temperature range, the air parcels break out of the ASMA eastwards (e.g., Honomichl and Pan, 2020), following the subtropical jet stream at about 40∘ N until, eventually, they quasi-isentropically enter the extratropics above the eastern Pacific or western Atlantic Ocean (e.g., Vogel et al., 2014, 2016). All trajectories suggest that the air parcels arrived from the west at the location of measurement, and most trajectories suggest a slight diabatic descent of up to −10 K in the extratropics a few days before the measurement. The transport time from the boundary layer to the location of measurement in the Ex-LS via this pathway ranges between 6–11 weeks (see Table 2).
The majority (>50 %) of trajectories of CH2Cl2-poor air show a strong uplift above the region of Central America up to potential temperatures mainly in the range of 360–370 K. After convection, the trajectories experience a northward drag towards an anticyclonic structure located above North America, and most of these trajectories further directly enter the extratropics above the Atlantic Ocean or the North American east coast, leading to short transport times to the location of measurement. Of all CH2Cl2-poor air parcels transported via this pathway, only 25 % (N=23) were observed in the LS with transport times from the BL to the location of measurement in the LS ranging between 5 and 9 weeks (Table 2).
Some trajectories lifted up above the region of Central America eventually follow the subtropical jet stream eastwards around the globe before entering the extratropics. This significantly increases the transport time of an air parcel by about 3 weeks and has the potential to cause it to descend by up to about −10 K as indicated by the back-trajectory calculations. However, the median transport time from the BL to the location of measurement in the Ex-LS of CH2Cl2-poor air parcels by convection above Central America (max ΔΘ18 h between 0–35∘ N and 50–120∘ W) is still 17 d shorter than for CH2Cl2-rich air parcels lifted up above southern and eastern Asia (max ΔΘ18 h between 0–40∘ N and 60–160∘ E; 47 vs. 64 d, respectively; Table 2), and their median potential temperature differs by 10.7 K (369.7 K vs. 380.4 K, respectively). Below, the transport pathway from Central America to the Ex-LS is discussed in more detail.
The analysis of the entire set of back trajectories shows that for the majority of measurements there are two distinct transport pathways into the Ex-UTLS. CH2Cl2-rich air is transported by the ASMA into the Ex-LS and CH2Cl2-poor air mainly by convection above Central America, which includes the North American monsoon, the ITCZ, and hurricanes, into the Ex-UTLS. In general, air parcels are lifted up to similar potential temperature levels by the convection of the ASM in Asia and the convection above Central America. The key difference yielding the observed higher potential temperatures of CH2Cl2-rich air from Asia compared to those of CH2Cl2-poor air from Central America is the additional uplift by the ASMA following the convection within the ASM (e.g., Müller et al., 2016; Brunamonti et al., 2018; Vogel et al., 2019; von Hobe et al., 2021). The slow upward spiraling dynamics within the ASMA also contributes to the longer transport time from the boundary layer to the location of the measurement of CH2Cl2-rich air compared to that of CH2Cl2-poor air. Another aspect adding to the different transport times is the longer transport pathway from Asia because simulations indicated air masses always reached the location of measurement from the west. Nevertheless, air parcels observed in the Ex-LS are impacted more strongly by air masses transported via the ASMA than via the NAMA (see Figs. 6 and 14).
Case study – convective uplift by Hurricane Maria
In order to investigate the role of tropical cyclones in the transport of Cl-VSLSs into the extratropical UTLS region, the locations of max ΔΘ18 h were compared with the tracks of several tropical cyclones. Significant matches with the Category 5 Hurricane Maria (Pasch et al., 2019) were found for back trajectories of measurements of four WISE flights (on 1, 14, 15, and 19 October). A total of 27 trajectory locations of max ΔΘ18 h agreed within a time window of 0.2 d and a 1∘ radius with the center of Hurricane Maria at some point along its track (Fig. 9). The 1∘ radius of tolerance was chosen because it corresponds to the spatial resolution of the ERA-Interim reanalysis data used for the trajectory calculation, as well as (roughly) to the hurricane's radius from its core. This analysis directly links 27 WISE measurements (5 were observed above the thermal TP) to the convection of Hurricane Maria with transport times from the location of max ΔΘ18 h to the location of observation ranging between 1 week and 1 month.
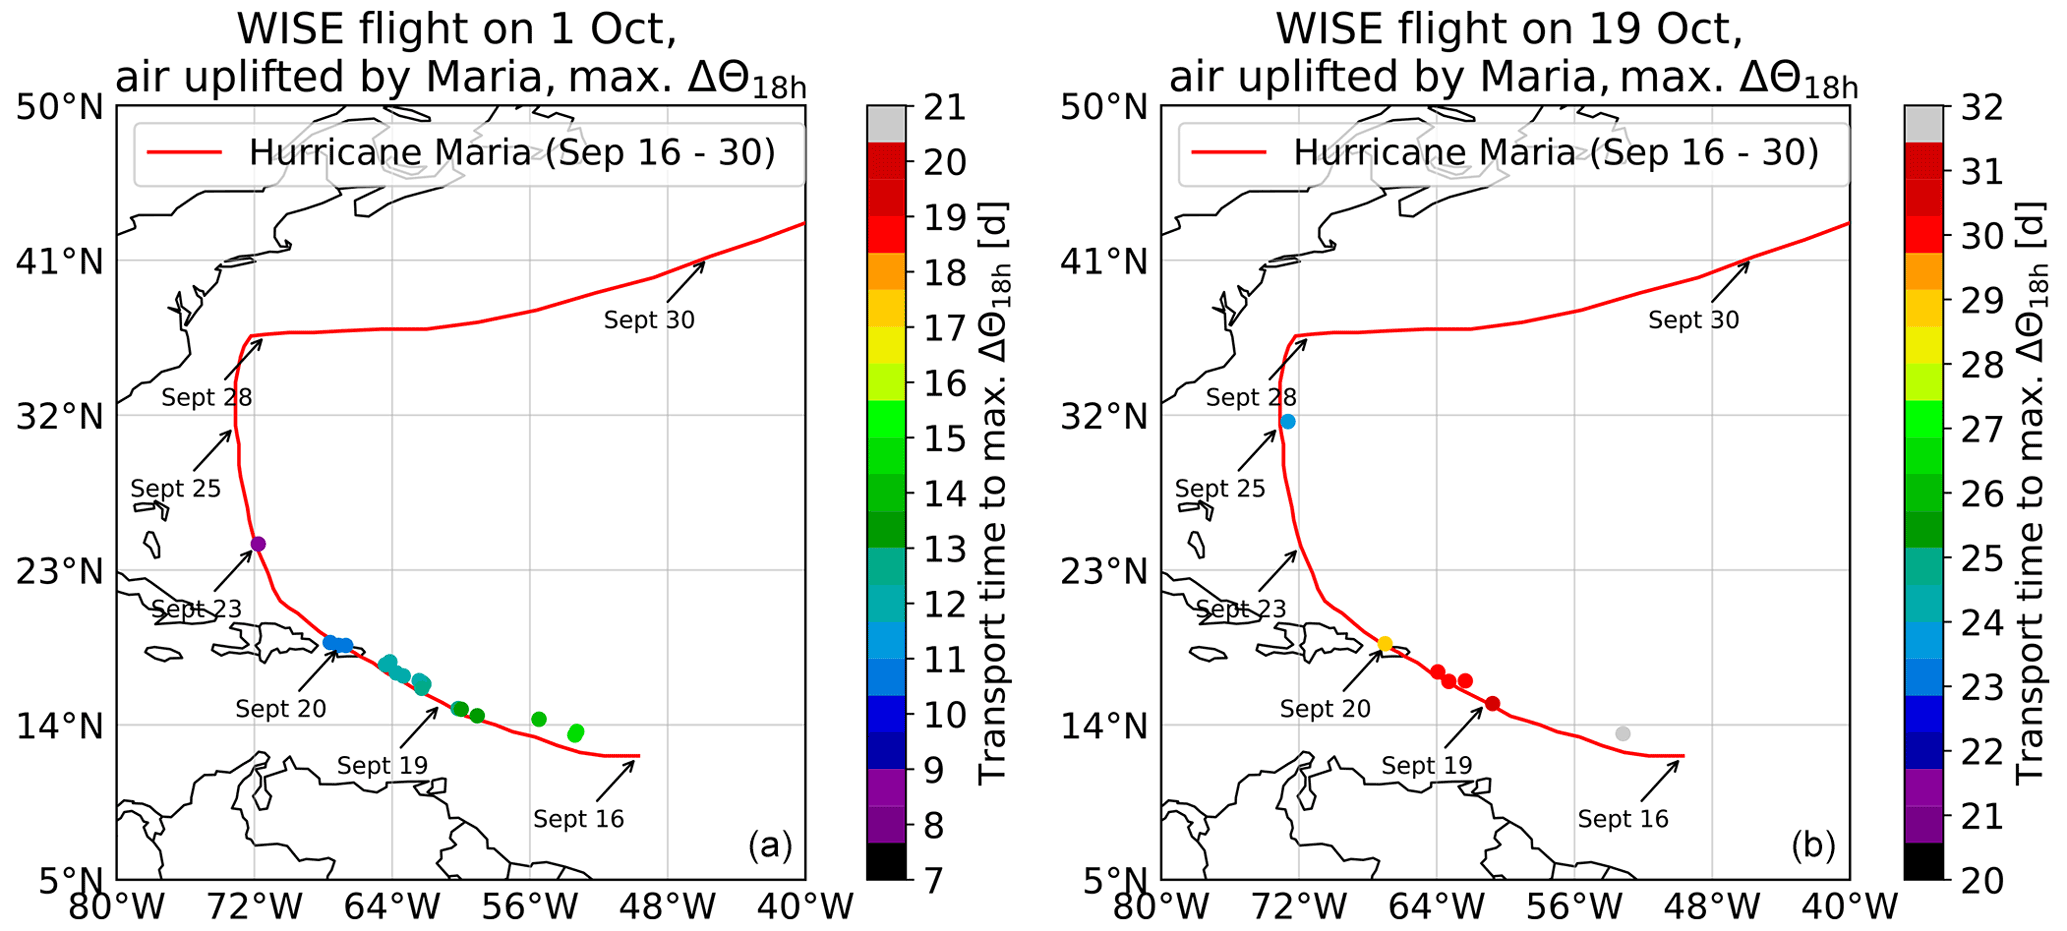
Figure 9Trajectory locations of max ΔΘ18 h color coded with the transport time from the location of measurement to the position of max ΔΘ18 h along the trajectory. The red line indicates the storm track of the center of Hurricane Maria (Pasch et al., 2019) with arrows marking the location at which the hurricane resided on the indicated date. (a) Flight on 1 October; (b) flight on 19 October.
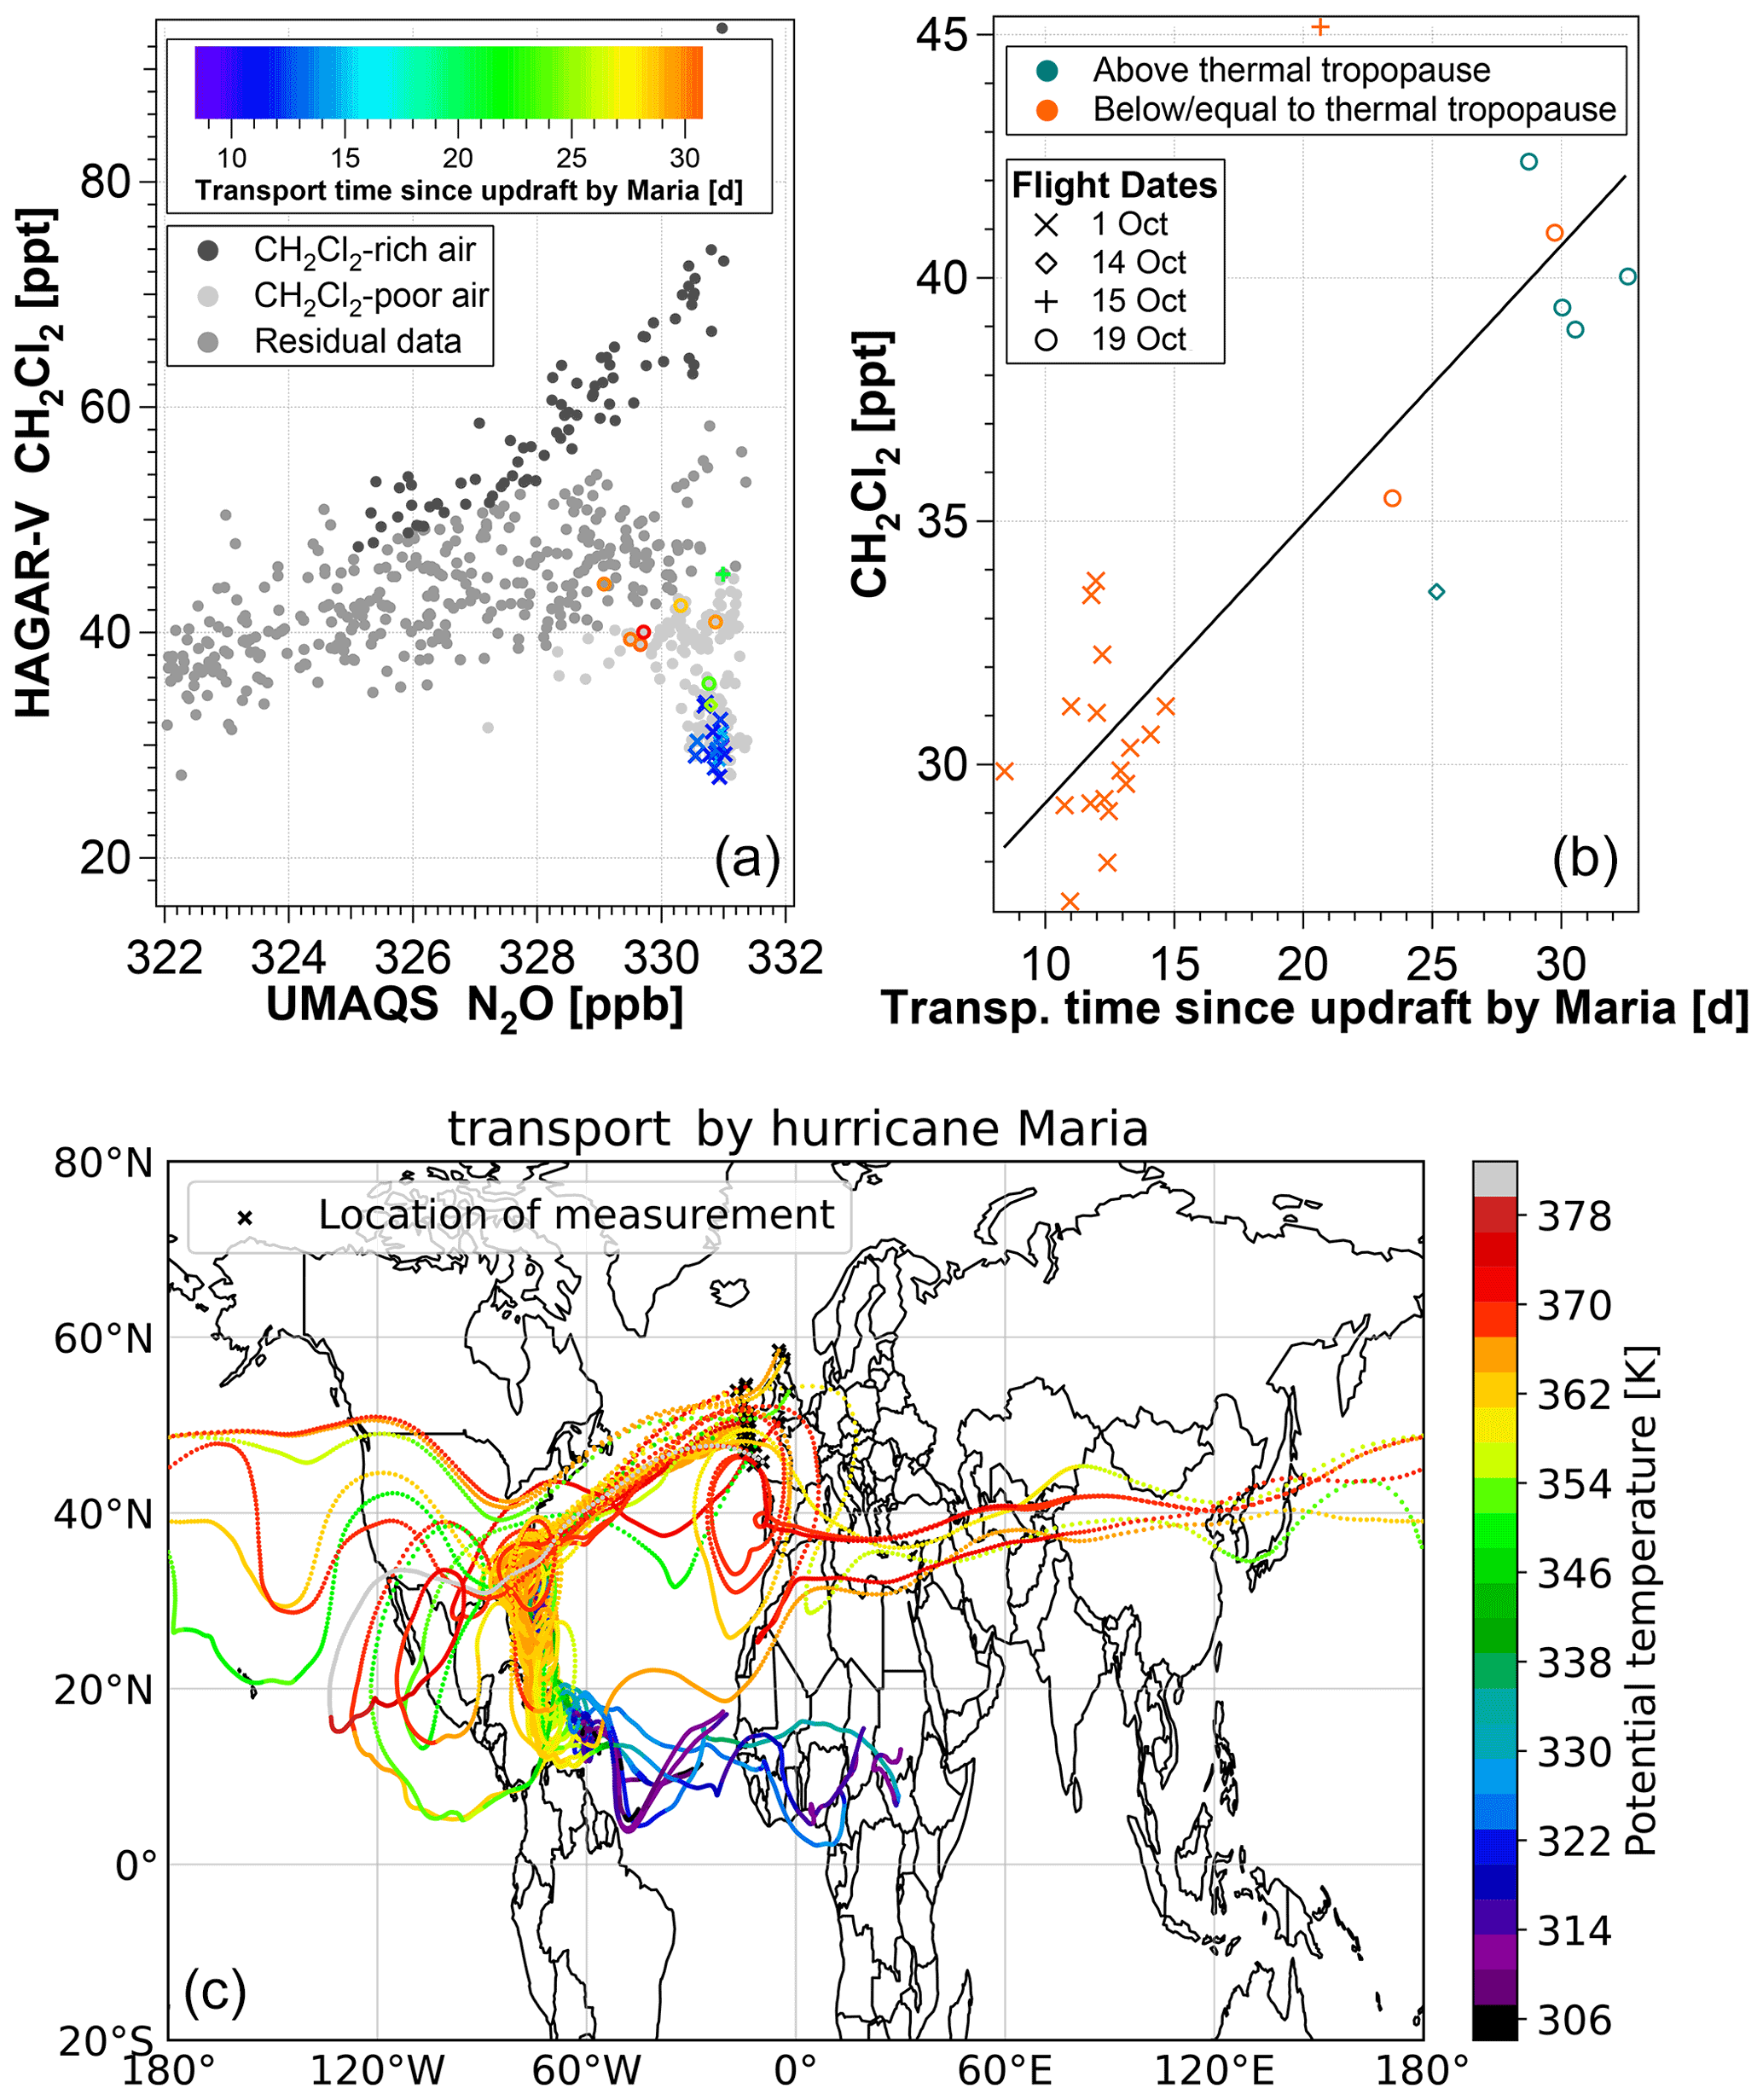
Figure 10(a) Detailed graph of the CH2Cl2–N2O relationship color coded with the transport time since the air parcel uplift by Hurricane Maria. The CH2Cl2–N2O relationship in the background is plotted in different shades of gray, indicating the measurements of CH2Cl2-rich air (dark gray) and CH2Cl2-poor air (light gray). (b) Correlation of CH2Cl2 and the transport time since the air parcel uplift by Hurricane Maria, color coded according to the air parcels' location above (blue-green) or below/equal to the thermal tropopause (orange). (c) Back trajectories from the location of measurement to the model boundary layer of air parcels lifted up by Hurricane Maria, color coded with the potential temperature of the air parcels at the respective trajectory location.
Interestingly, CH2Cl2 mixing ratios of measurements linked to Hurricane Maria positively correlate with transport time since maximum convection (rPearson=0.85; Fig. 10b). (Note that these CH2Cl2 mixing ratios also correlate with transport time since the model BL but with a lower rPearson of 0.64 and transport times between 9 and 48 d. However, here we focus on the transport since convection by Hurricane Maria to derive impacts on the air parcels induced by processes in the UTLS region.) Those air samples related to short transport times contain the lowest CH2Cl2 mixing ratios at N2O >325 ppb measured during WISE (Fig. 10a). According to the back trajectories, most of the air parcels lifted up by Hurricane Maria left the model boundary layer above the tropical Atlantic in September where CH2Cl2 sources are small (Fig. 10c). In addition, in that region the seasonal minimum of CH2Cl2 mixing ratios is found in September (see Sect. 3.1). This implies that when air masses lifted up by Hurricane Maria mix, they can only increase their CH2Cl2 mixing ratio, i.e., mixing with air of a higher CH2Cl2 mixing ratio. Air parcels related to longer transport times did not take a direct path to the extratropics after being lifted up by Hurricane Maria and rather followed the subtropical jet stream eastwards around the globe, thereby enhancing the chances of mixing with air of higher CH2Cl2 mixing ratios.
In general, despite being a significant source of convection, Hurricane Maria did not contribute to the transport of enhanced CH2Cl2 mixing ratios into the stratosphere and rather led to the transport of CH2Cl2-poor air, a consequence of CH2Cl2's tropical Atlantic boundary layer seasonality. This result is consistent with the lack of strong CH2Cl2 sources in the oceanic region of convection. Nevertheless, our analysis shows that large hurricanes can provide a fast transport pathway into the extratropical UTLS.

Figure 11Meteorological situation at noontime (UTC) for the WISE flight on 1 October (a, b) and 4 d later (c, d) using ERA-Interim reanalysis data. The colors indicate the absolute surface origin tracer fraction of the region of Central America (CAM) at 360 K of potential temperature (a, c) and as a vertical cross section at 25∘ W (b) and 20∘ W (d). The flight track (transferred to noontime) is shown as a black line on the isentropic view (a); on the vertical cross sections the black lines indicate zonal wind speed. White dots mark the measurement location of air that has been lifted up by Hurricane Maria. Note that these measurement locations, as well as the flight path shown, are not necessarily located exactly at 360 K (a) or at 25∘ W (b). Black dots indicate the location of the first thermal tropopause (TP); black diamonds indicate the second thermal TP; the white line shows the 4 PVU surface. The plots show the probing of a high TP streamer of air originating in Central America at midlatitudes on 1 October. The streamer became unstable 4 d later, and a large volume of tropical air mixed into the LS above the thermal TP. This figure illustrates the intrusion of tropical air into the LS: air within the streamer has been lifted up by a hurricane into the TTL and further transported to higher latitudes by an upper-level anticyclone above North America (see Fig. 8a) to be finally mixed into the LS by Rossby wave breaking.
Particularly during the WISE flight on 1 October, when we sampled the largest number of air parcels uplifted by Hurricane Maria, the measurements were highly impacted by air originating in the region of Central America (see Fig. 6). With a median transport time from the BL of 18 d, these measurements agree well with the fast transport pathway into the stratosphere described by Wang et al. (2021). However, despite the fact that we observed most of these air masses at latitudes around 50∘ N and potential temperatures in the range of 350–370 K, the majority of measurements were below the thermal TP. Figure 11 shows the meteorological situation of this particular WISE flight on 1 October based on ERA-Interim reanalysis data (Dee et al., 2011). Obviously, the air masses breaking out of the anticyclone above the North American east coast (see Fig. 8a) turned into a streamer carrying a local high TP to higher latitudes. A few days after our observation, this streamer became unstable and mixed into the LS. This implies that tropical air that has been lifted up by hurricanes and other convective systems in the region of Central America can enter the Ex-LS quasi-isentropically during the NH autumn even if the convection in the tropics has not transported the air above the TP. We have thereby shown that tropical surface mixing ratios of VSLSs from the region of Central America and the Atlantic Ocean can be efficiently transported into the Ex-LS during the late North American monsoon season. For instance, this is of particular importance for brominated short-lived substances (e.g., CH2Br2 and CHBr3) that have a high ODP and some of their largest emission sources located in tropical oceans (e.g., Hepach et al., 2015; Rotermund et al., 2021). However, it has to be noted that only 25 % of air parcels transported by this pathway were observed in the Ex-LS and that stratospheric air masses showed relatively low fractions of air originating in the region of central and western ITCZ compared to those originating in southern and eastern Asia (see Fig. 14). Transport and mixing processes in the TP region below the aircraft during the flight on 1 October are analyzed by Schäfler et al. (2021).
3.2 Comparison of CH2Cl2 and CHCl3
In this section the results of the CH2Cl2 analysis are used to investigate CHCl3 data measured during WISE. Figure 12a shows the CHCl3–N2O relationship color coded to highlight air parcels of CH2Cl2-rich (red) and CH2Cl2-poor (blue) air (see Sect. 3.1.1). In general, the CHCl3–N2O relationship reveals similar but less clearly pronounced structures to those observed for the CH2Cl2–N2O relationship. The CHCl3–N2O relationship similarly is less compact for higher N2O mixing ratios. However, a distinct split of the compact relationship, as observed for CH2Cl2, is not clearly visible, but a broad scatter on the CHCl3 axis is visible with mixing ratios in the stratosphere being enhanced by up to 100 % compared to the lowest measurements at similar N2O values. Measurements of CH2Cl2-rich air also show clearly enhanced CHCl3 mixing ratios, and measurements of CH2Cl2-poor air also contain the lowest CHCl3 mixing ratios at given N2O values. Nevertheless, there are a few significant differences which will be analyzed in the following.
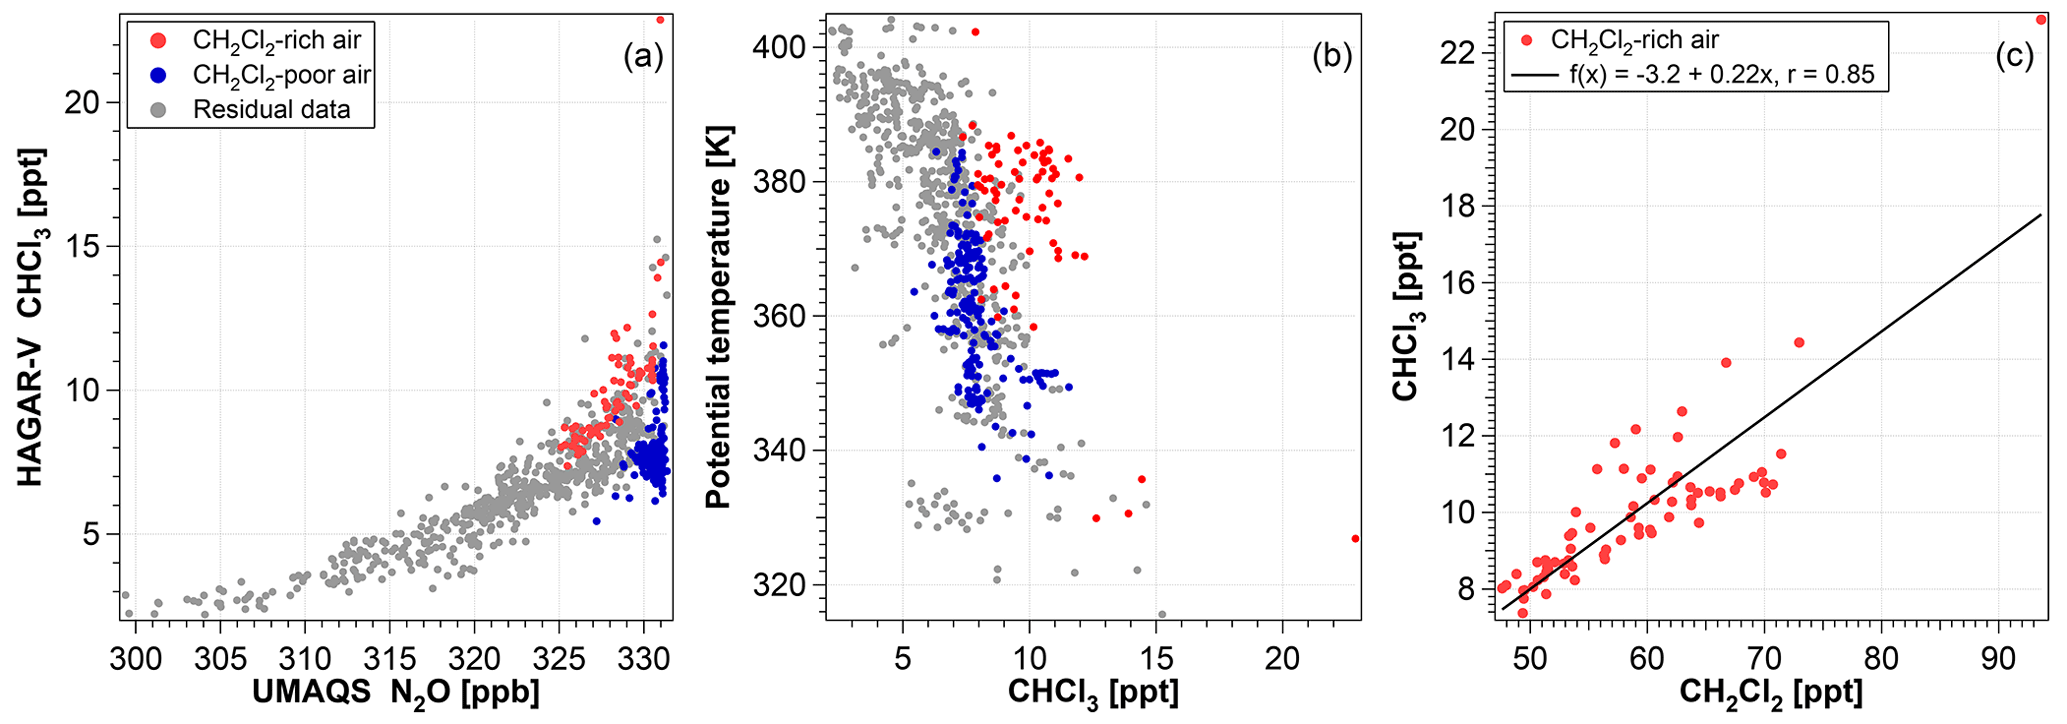
Figure 12CHCl3–N2O relationship (a) and CHCl3 as a function of potential temperature (b) color coded to highlight measurements of CH2Cl2-rich and CH2Cl2-poor air; CHCl3–CH2Cl2 relationship of measurements of only CH2Cl2-rich air (c).
The seasonal cycle of CHCl3 is less pronounced but in phase with that of CH2Cl2 (see Fig. C1 in Appendix C). Based on a comparison with ground-based observations from the AGAGE network, CHCl3 data for measurements of CH2Cl2-poor air between N2O values of 229.5 and 331 ppb reflect CHCl3's tropical surface seasonality as it was similarly observed for CH2Cl2.
In our data, high CH2Cl2 concentrations coincide with high CHCl3 concentrations in many, but not all, cases. There are examples of high CHCl3 concentrations where CH2Cl2 concentrations are relatively low. This suggests that air from regions with stronger CHCl3 than CH2Cl2 sources was measured. However, air masses of CH2Cl2-rich air clearly stand out by their elevated CHCl3 mixing ratios in the region of Θ≈380 K (Fig. 12b). Based on the results of Sect. 3.1.3, we therefore suggest that the ASMA is also the dominant factor for the transport of enhanced CHCl3 mixing ratios to the Ex-LS at Θ≈380 K.
Due to their similar photochemical lifetime, CH2Cl2 and CHCl3 are expected to linearly correlate in the stratosphere; however varying correlation slopes can arise due to different emission ratios in the source regions defining the respective composition of the air parcel. The measurements of CH2Cl2-rich air show a significant positive linear correlation with CHCl3 (Fig. 12c), suggesting sources or source regions with similar emission ratios of these species. Due to the strong evidence for CH2Cl2-rich air being significantly affected by anthropogenic sources, the significant positive correlation with CHCl3 suggests that this also holds for CHCl3. The highest anthropogenic emissions of CHCl3 are expected to originate from China (Fang et al., 2018), which is within the region of sources particularly impacting the air masses of CH2Cl2-rich air analyzed here (Sect. 3.1.2). This suggests a significant anthropogenic impact that clearly enhances CHCl3 concentrations in the upper LMS.
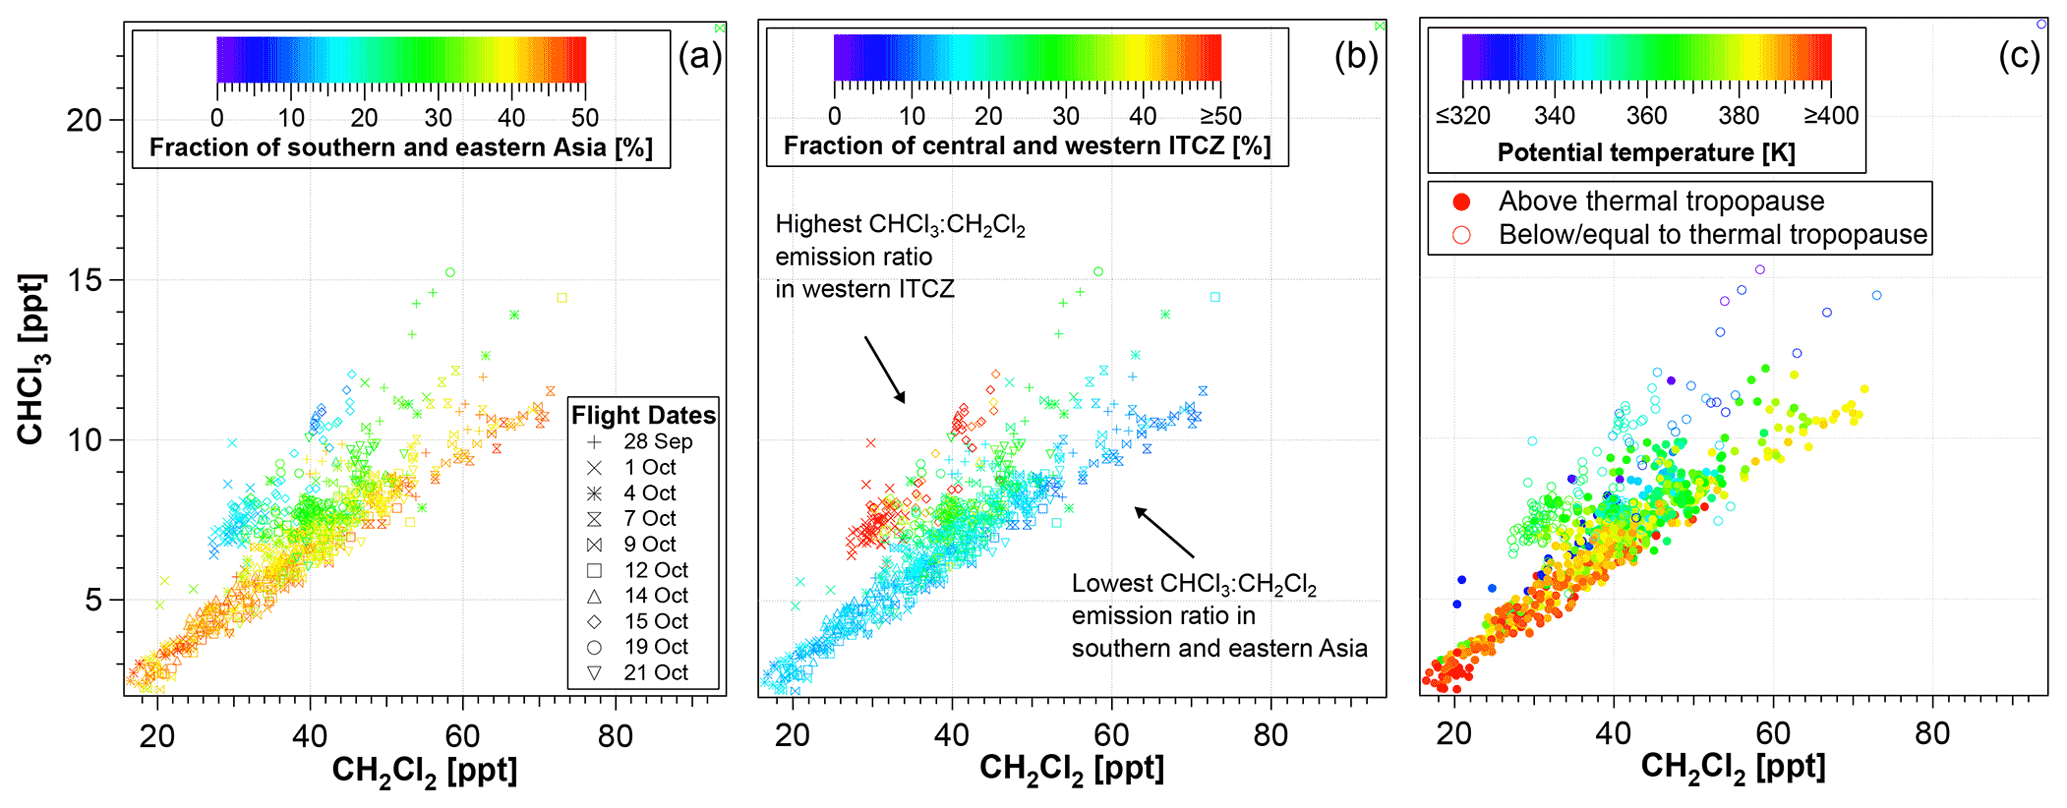
Figure 13CHCl3–CH2Cl2 relationship, color coded with the SaEA (a) and the W-ITCZ (b) surface origin tracer, and the potential temperature (c). The relationship exhibits different correlation slopes clearly depending on the origin of air. A large impact of sources from southern and eastern Asia coincides with a low correlation slope dominating the larger part of the relationship. A large impact of sources from the central and western part of the ITCZ coincides with the steepest correlation slope, implying a larger CHCl3 : CH2Cl2 emission ratio in this region compared to the emission ratio in southern and eastern Asia. The highest CHCl3 mixing ratios and the majority of measurements with the steepest correlation slope were observed in the tropopause region and the upper troposphere.
At a closer look, the CHCl3–CH2Cl2 relationship in Fig. 12c reveals two correlation lines with different slopes. The nature of the different slopes can be better understood when looking at the CHCl3–CH2Cl2 relationship of all WISE measurements color coded with CLaMS's surface origin tracers (Fig. 13a and b). The CHCl3–CH2Cl2 relationship fans out towards higher mixing ratios, giving the impression of several correlation lines with different slopes. The data points forming the steepest correlation slope show the highest W-ITCZ tracer fractions and the lowest SaEA tracer fractions, while for the data points forming the lowest correlation slope the opposite is the case. The CHCl3–CH2Cl2 correlation slope thus flattens with increasing entry of air masses originating from southern and eastern Asia. Knowing that both species have similar sinks and photochemical lifetimes but CHCl3 has a larger fraction of emissions from biogenic sources than CH2Cl2, this suggests larger CHCl3 : CH2Cl2 emission ratios in the region of the central and western ITCZ region (with presumably mostly biogenic sources) than in southern and eastern Asia (where anthropogenic sources likely dominate).
Compared to the lowest correlation line, the wider range of surface origin tracer fractions apparent in the correlation lines with steeper slopes might be due to the different strengths of seasonality of CH2Cl2 and CHCl3, possibly affecting the linear relationship between CHCl3 and CH2Cl2. In addition, the highest mixing ratios pertain to the steeper correlation lines. However, all of those were observed at low potential temperature levels and below the thermal TP (Fig. 13c) where mixing ratios can easily exceed those in the stratosphere above. The evolution of tropospheric air masses at potential temperatures above 350 K as shown by the steeper correlation line was discussed above in Sect. 3.1.3. In summary the analysis suggests clear similarities between CH2Cl2 and CHCl3 when emitted by anthropogenic sources and differences between the two species are mainly due to additional (presumably biogenic) CHCl3 sources.
Figure 14 shows measured and simulated WISE tracers as a function of equivalent latitude and potential temperature. It illustrates the air masses of enhanced CH2Cl2 and CHCl3 that were transported from southern and eastern Asian sources by the ASMA to potential temperatures of around 380 K and to the Ex-LS. At slightly lower potential temperatures and equivalent latitudes, we observed particularly low CH2Cl2 mixing ratios and partly low CHCl3 mixing ratios. The corresponding air masses were sampled at potential temperatures mainly above 360 K but mostly below the thermal tropopause and were uplifted from Central American as well as tropical Atlantic and northern African source regions via convection by hurricanes, by the ITCZ, and by the North American monsoon and transported further towards the location of measurement at higher latitudes; therefore these air masses are characterized by low values of equivalent latitude.
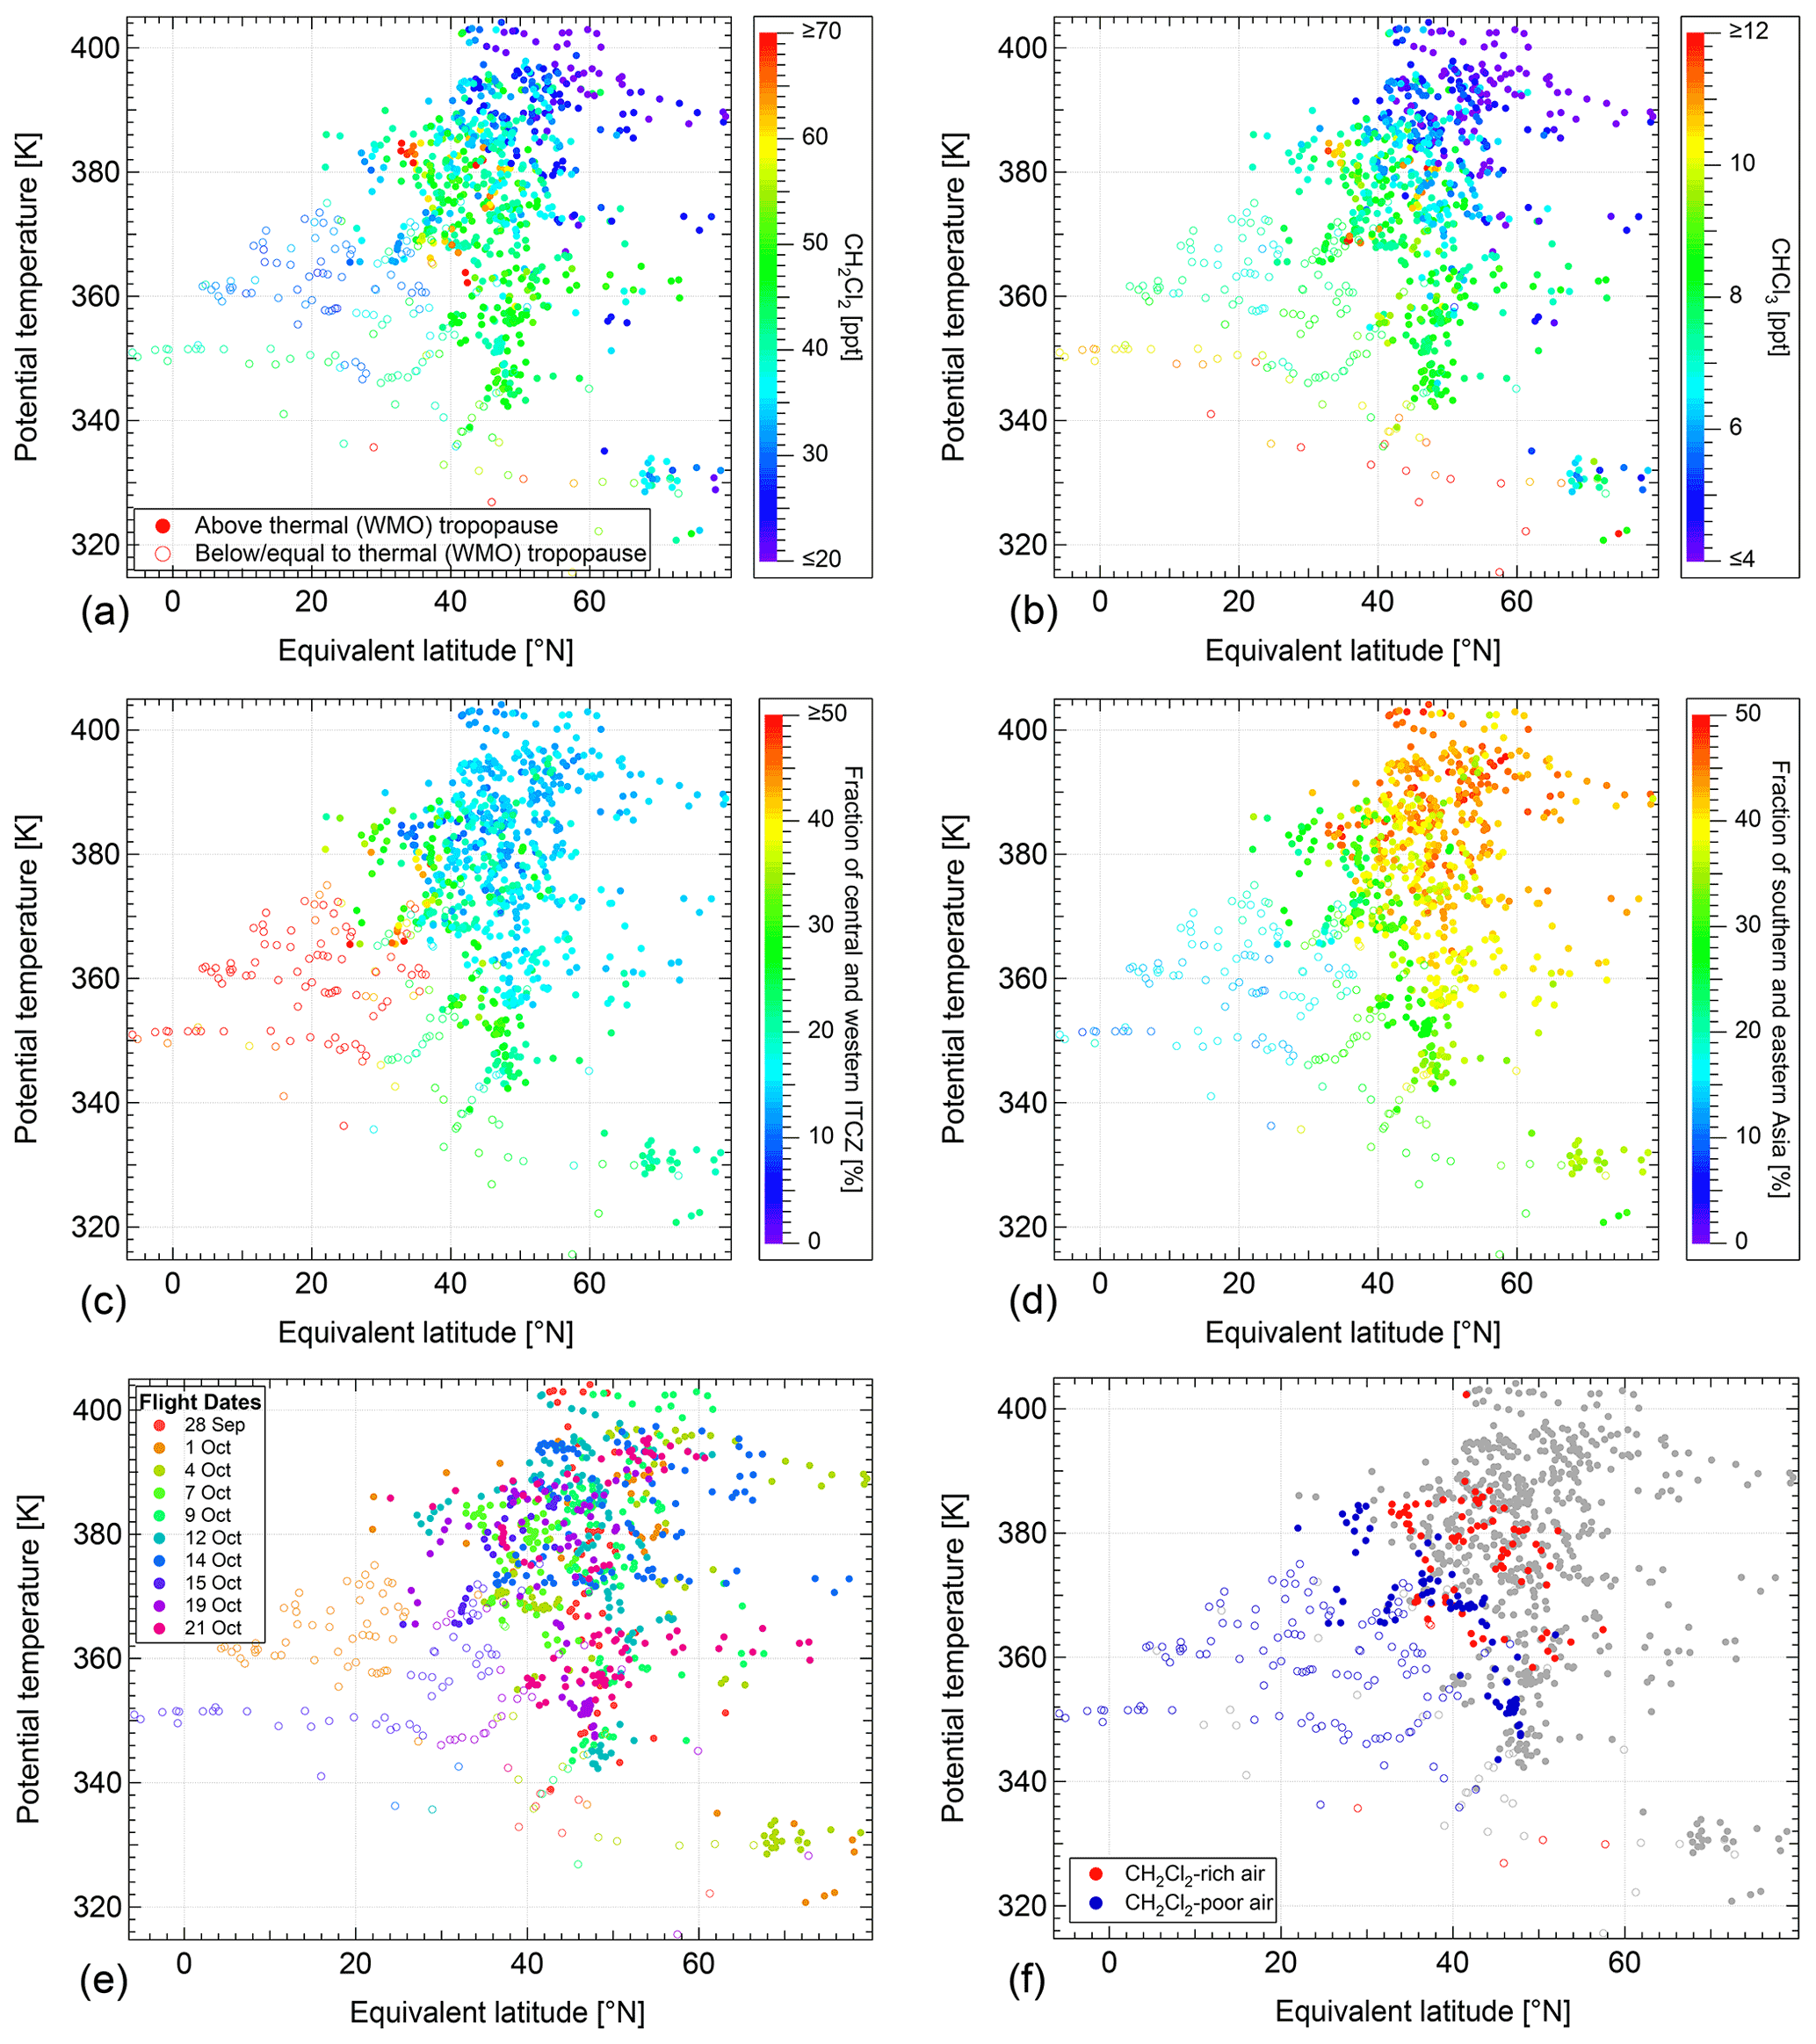
Figure 14Measured (a, b) and simulated (c, d) tracers of the WISE flights (e) from 28 September to 21 October 2017, as a function of equivalent latitude and potential temperature. Note that equivalent latitudes ≤0∘ N are likely calculated artifacts due to a negative bias induced by convection (Pan et al., 2012). The open symbols indicate a measurement location below or equal to the thermal tropopause (TP), and filled symbols mark measurements located above the thermal TP. The coloration of panel (f) corresponds to the lower branch (blue) and to the upper branch (red) of the CH2Cl2–N2O relationship (referred to as CH2Cl2-poor and CH2Cl2-rich air, respectively; see Sect. 3.1.1). CH2Cl2-poor air measured at potential temperatures generally up to 375 K mostly originated from the Central American as well as tropical Atlantic and northern African boundary layer (central and western ITCZ) and has mostly not (yet) entered the lower stratosphere at the time of measurement. CH2Cl2-rich air is strongly influenced by air masses from southern and eastern Asia and was measured almost exclusively in the extratropical lower stratosphere. Note that the fraction of surface origin tracers given in the graphs is not an absolute fraction of the whole air parcels but of the air masses younger than 6 months within the air parcels (see Sect. 3.1.2). The two different transport pathways from the boundary layer into the extratropical UTLS region are described in the text.
The presented distribution of air masses from different source regions in the NH UTLS is in good agreement with a similar study by Rotermund et al. (2021) also based on WISE measurements but using bromine observations. However, the lower stratospheric region of high bromine concentrations from Asian source regions described by Rotermund et al. (2021) is at lower potential temperatures and higher equivalent latitudes than the CH2Cl2-rich air described in the present paper. This could be due to stronger (mostly biogenic) bromine emission sources in the adjacent region of the ASM compared to the mostly anthropogenic CH2Cl2 emission sources mainly located in the core region of the ASM. In addition, in the present paper the first five research flights in September are not analyzed in contrast to the study by Rotermund et al. (2021). Nevertheless, compared to the very short-lived bromine species analyzed by Rotermund et al. (2021), the combination of a longer lifetime, highly significant Asian emission sources, and very low mixing ratios in other regions of strong convection clearly benefits the use of CH2Cl2 observations to derive details about the different transport mechanisms and pathways from the source region into the NH summertime UTLS. In addition, using the CHCl3 : CH2Cl2 ratio to support the analysis of air mass origin is a unique and helpful tool in the analysis of transport pathways.
Further, elevated quantities of peroxyacetyl nitrate (PAN) were measured in the NH LMS during the WISE flight on 13 September 2017 by the GLORIA instrument with the main sources in South Asia and Southeast Asia uplifted by the ASMA (Wetzel et al., 2021). Moreover, the transport pathway into the LS via the ASMA derived from CLaMS simulations identifying the air mass origin in southern and eastern Asia was also observed for other measurements taken in the NH UTLS over Europe and the Atlantic Ocean during the HALO TACTS campaign in August and September 2012 (Vogel et al., 2014, 2016; Müller et al., 2016; Rolf et al., 2018). In the present study, we have directly related this transport pathway to in situ Cl-VSLS measurements in the LS and observed that air masses strongly enhanced in CH2Cl2 and CHCl3 are rather rapidly transported to the top of the NH LMS at about 380 K by this pathway. This finding supports the modeled results of Claxton et al. (2019), who show that Cl-VSLS sources located in tropical Asia have a higher potential for stratospheric ozone depletion than those from any other source region. In addition, CHCl3 has significant biogenic sources (Engel et al., 2018). Our study suggests that not only the enhanced CH2Cl2 mixing ratios but also the enhanced CHCl3 mixing ratios observed at about 380 K are significantly impacted by anthropogenic sources, which are expected to be strongest in the regions of southern and eastern Asia (Claxton et al., 2020) and eastern China (Fang et al., 2018), respectively.
There are several studies analyzing the transport of air into the stratosphere by convection above Central America and North America and its further distribution by the North American monsoon anticyclone (NAMA) (e.g., Gettelman et al., 2004; Ray et al., 2004; Pittman et al., 2007; Weinstock et al., 2007; Herman et al., 2017; Wang et al., 2021; Clapp et al., 2021). Studies based on observational data mostly focus on the equatorward transport of air out of the NAMA (e.g., Gettelman et al., 2004; Ray et al., 2004; Pittman et al., 2007; Weinstock et al., 2007). Mainly model-based simulations (e.g., Li et al., 2005; Ploeger et al., 2013; Nützel et al., 2019) and a study based on satellite observations (Clapp et al., 2021) have addressed north- and northeastward outflow of the NAMA. Here, we have described a transport pathway from the marine boundary layer in Central America and the tropical Atlantic into the NH midlatitude UTLS based on in situ Cl-VSLS observations. The horizontal advection northwards following the convection in the tropics might be related to the NAMA as described in a recent model study by Wang et al. (2021). Further, Clapp et al. (2021) observed the main outflow (68 %) of the NAMA to be in a northeastward direction between 35 and 60∘ N in July and August. In good agreement with both studies, the trajectories of WISE measurements uplifted above Central America show a northward drag towards a location of circular movement resembling the NAMA with a northeastward escape from the circulation (see Fig. 8a).
Many studies have addressed the topic of tropospheric intrusions into the stratosphere above Central America and North America by analyzing direct injections via overshooting convection (e.g., Smith et al., 2017; Anderson et al., 2017; Herman et al., 2017; Cooney et al., 2018; Clapp et al., 2019, 2021). The results of Wang et al. (2021) suggest that for air uplifted in the region of Central America (15 to 20∘ N) overshooting convection is not the main transport pathway into the stratosphere during the NH summer. Above this region of Central America the TP is usually at potential temperatures on the order of 380 K, and most convection in this region does not uplift air higher than that. Drawn towards the NAMA, the uplifted air is further transported horizontally to higher latitudes (Wang et al., 2021) where the TP is 1–2 km higher than usual due to the NAMA (Schoeberl et al., 2020). Further horizontal transport northeastwards out of the anticyclone, as shown in our study, eventually causes the tropical air masses (being at high potential temperatures) to isentropically enter the LS.
Our results further show a regional dependency of the slope of the NH UTLS CHCl3–CH2Cl2 relationship. Observations by Say et al. (2019) in the Indian boundary layer suggest a similarly flat CHCl3–CH2Cl2 correlation slope to that observed during WISE for air masses strongly impacted by Asian sources. However, measurements from the AGAGE network (Prinn et al., 2018) at Barbados in 2017 show seasonally varying CHCl3–CH2Cl2 correlation slopes not necessarily matching the steep slope observed for air masses strongly impacted by Central American source regions during WISE. The here presented regional dependency of the CHCl3–CH2Cl2 correlation slope could thus be a seasonal phenomenon depending on transport efficiency and locally varying emissions. Obviously, more in situ observations of CH2Cl2 and CHCl3 in the UTLS (particularly in different seasons) and ground-based observations (particularly in Asia) are needed to better understand the correlation behavior of CH2Cl2 and CHCl3 in the UTLS.
We have presented a study on transport of Cl-VSLSs into the Ex-UTLS based on tracer–tracer relationships using in situ Cl-VSLS observations. A schematic of the transport pathways we deduced in this study is shown in Fig. 15. Our measurements in the LS above the midlatitude Atlantic Ocean in autumn 2017 revealed up to 150 % enhanced CH2Cl2 and up to 100 % enhanced CHCl3 mixing ratios compared to measurements with similar N2O mixing ratios, i.e., similarly processed air. In the stratosphere, the samples of CH2Cl2-rich air also contained most of the observed CHCl3-rich air and the highest mixing ratios of both species detected in the stratosphere at Θ≈380 K. In contrast to CHCl3, CH2Cl2 is almost exclusively of anthropogenic origin (Engel et al., 2018), and a good correlation of CH2Cl2-rich air with CHCl3-rich air suggests anthropogenic sources also impact the enhanced CHCl3 mixing ratios observed in the region at potential temperature levels of about 380 K. Using a global three-dimensional Lagrangian model simulation, we have shown a particularly strong influence of southern and eastern Asian sources in these air masses of enhanced CH2Cl2 and CHCl3 mixing ratios.
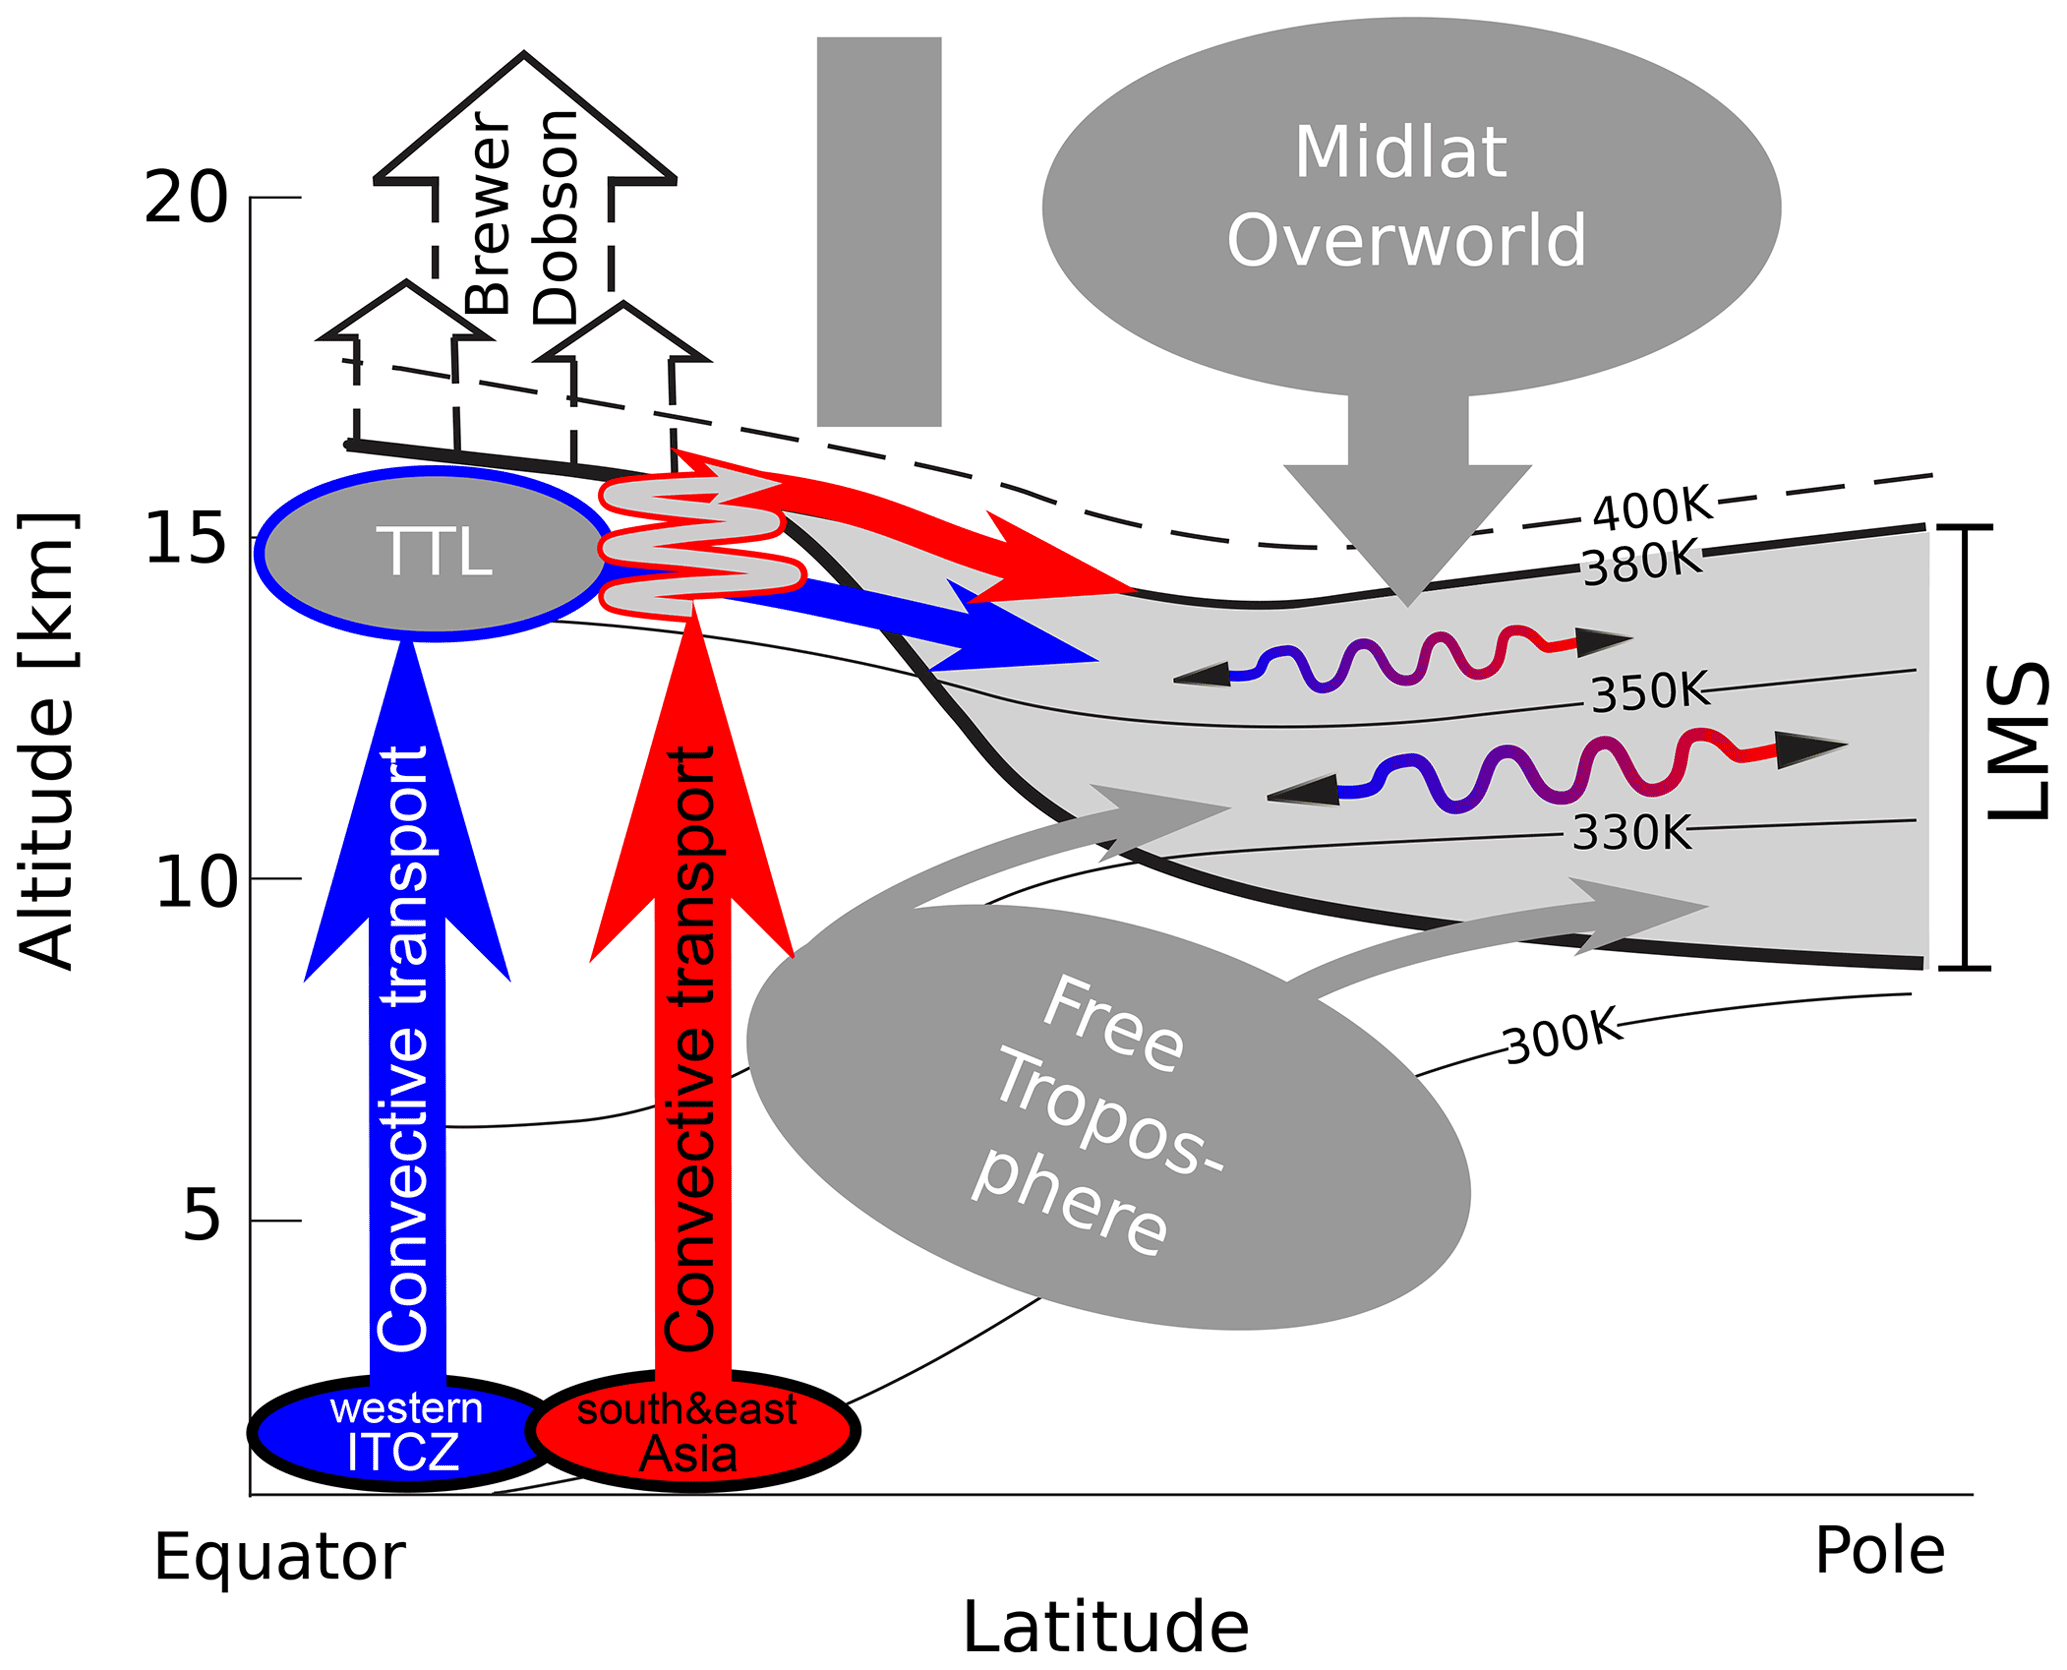
Figure 15Schematic meridional view of the two major transport pathways for CH2Cl2-rich and CHCl3-rich air (red) and CH2Cl2-poor and mainly CHCl3-poor air (blue) from the source region into the NH LMS. The pathway from source regions located mostly in the western part of the ITCZ starts with convection into the tropical tropopause layer (TTL) above Central America by general updraft in the ITCZ, by the North American monsoon, and by hurricanes as shown for Hurricane Maria in Sect. 3.1.3. Quasi-isentropic transport to the north and northeast eventually transports the air into the LMS at Θ≈360 K. Air masses from southern and eastern Asia are uplifted by the Asian summer monsoon (ASM) to Θ≈360 K with subsequent slow upwelling within the monsoon anticyclone to Θ≈380 K. These air masses break out of the anticyclone to follow the subtropical jet stream eastwards before isentropically entering the Ex-LS above the eastern Pacific or western Atlantic Ocean.
Back-trajectory calculations agree well with the global three-dimensional model simulation and reveal a distinct transport pathway via the Asian summer monsoon for the air masses of enhanced CH2Cl2 and CHCl3 mixing ratios. This pathway implies convection over southern and eastern Asia to about 360 K potential temperature in July and August and a slow circular upwelling to 370–400 K in the ASMA. The observed air masses broke out of the anticyclone eastwards, following the subtropical jet stream before entering the extratropics above the eastern Pacific or western Atlantic Ocean (horizontal red arrow in Fig. 15). Air parcels following this pathway were observed in the Ex-LS 6–11 weeks after they left the BL. This transport pathway was also observed during the HALO TACTS campaign in 2012 (Vogel et al., 2014, 2016; Müller et al., 2016; Rolf et al., 2018).
Our results provide observational evidence to support the findings of model studies (e.g., Hossaini et al., 2015, 2019; Claxton et al., 2019) which connect the recent increase in Asian CH2Cl2 and CHCl3 emissions (e.g., Leedham-Elvidge et al., 2015; Oram et al., 2017; Feng et al., 2018; Fang et al., 2018; Adcock et al., 2021) with an increase in the contribution to stratospheric chlorine levels by the two species. Particularly the region at about 380 K potential temperature is dominated by young air masses from southern and eastern Asia, thereby strongly increasing the chlorine loading from VSLSs in this layer in the NH late summer. Our results emphasize that further increases in Asian CHCl3 emissions will inevitably lead to clear signatures of enhanced CHCl3 mixing ratios in the Ex-LS, similar to those we already observe for CH2Cl2.
Another pathway from the (sub)tropical boundary layer into the NH Ex-UTLS was derived from particularly low CH2Cl2 mixing ratios observed in the UTLS region. The CH2Cl2-poor air mainly originated from Central America as well as from the tropical Atlantic Ocean and northern Africa (central and western ITCZ) and was uplifted above Central America during the course of September. Ground-based measurements from the AGAGE network (Prinn et al., 2018) within that region show minimum background mixing ratios of both CH2Cl2 and CHCl3 in September. This seasonal minimum is clearly reflected in our UTLS measurements and allows these air masses to be distinguished from the strongly enhanced mixing ratios transported via the ASMA.
The transport pathway derived from CH2Cl2-poor air follows a general pattern: air masses are convectively uplifted into the TTL above Central America to about 360–370 K potential temperature (vertical blue arrow in Fig. 15). The vertical transport is induced by the general convection in the ITCZ region, by the North American monsoon, and by hurricanes. We could directly link measurements of CH2Cl2-poor air to the uplift by the Category 5 Hurricane Maria (Pasch et al., 2019). After the convection, the air masses were horizontally transported to higher latitudes and drawn towards an anticyclonic structure above North America. Resolved by back trajectories, the anticyclone above North America was much smaller than the ASMA and was located mostly at 35∘ N, 80∘ W above Florida, likely being a remnant of the NAMA, which usually declines in late September (e.g., Vera et al., 2006). Other than those observed for the ASMA, the circulating air parcels above North America did not significantly increase their potential temperature. Further, the air masses broke out of the anticyclone northeastwards, forming a streamer which carried a local high TP into higher latitudes. Eventually, these air masses mixed into the LS by Rossby wave breaking and influenced the chemical composition of the NH Ex-LS 10–20 K below the air masses dominated by transport via the ASMA. However, only 25 % of air parcels transported via this pathway were observed above the thermal TP with transport times from the BL to the location of measurement ranging from 5 to 9 weeks.
Our study shows that air masses lifted by convection in the tropical region of Central America do not need to directly cross the TP or to slowly enter the tropical pipe to be transported into the stratosphere. In the TTL, fast horizontal transport northwards on high potential temperature levels provides an efficient and fast pathway for air lifted up in the tropics above Central America to quasi-isentropically enter the Ex-LS during the NH late summer. Air transported along this pathway was observed to be mostly CH2Cl2-poor and CHCl3-poor air. However, transport along this pathway may cause other ozone-depleting short-lived substances with stronger sources in the region of the central and western ITCZ (such as tropical maritime and coastal sources, e.g., CH2Br2 and CHBr3; Hepach et al., 2015) to be significantly enhanced in the middle and lower part of the LMS (e.g., Rotermund et al., 2021).
Particularly the use of in situ CH2Cl2 measurements as a very short-lived tracer has clearly revealed the differences between the two main transport pathways into the NH Ex-LS described in this study. In addition, we have deduced a higher CHCl3 : CH2Cl2 emission ratio in the central and western ITCZ region compared to southern and eastern Asia. The difference might be due to additional biogenic CHCl3 sources in the ocean-rich central and western ITCZ region, while the emissions in southern and eastern Asia are most likely dominated by anthropogenic continental sources. However, more UTLS observations of CH2Cl2 and CHCl3 in different seasons as well as more ground-based long-term observations of the two species in Asia are needed to complete the understanding of the seasonal and inter-annual variability in the transport pathways identified in our study. Figure 15 shows a schematic drawing of the two reported transport pathways into the NH Ex-LS in late summer. The scheme summarizes the main findings of this paper.
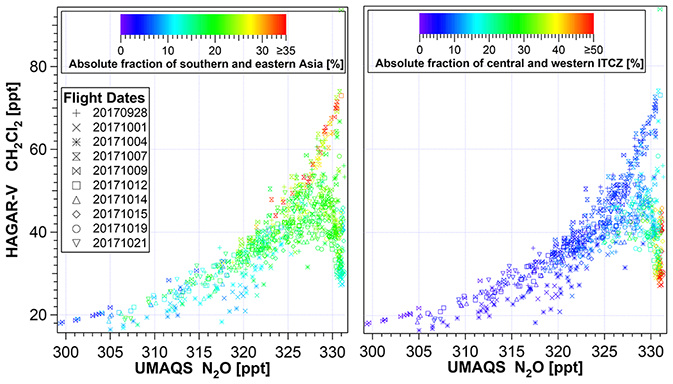
Figure A1CH2Cl2–N2O relationship color coded with different surface origin tracers. The tracer fractions shown are relative to the other surface origin tracers including the fraction of air that had already been above the model boundary layer at the initialization of the model simulation on 1 May 2017.
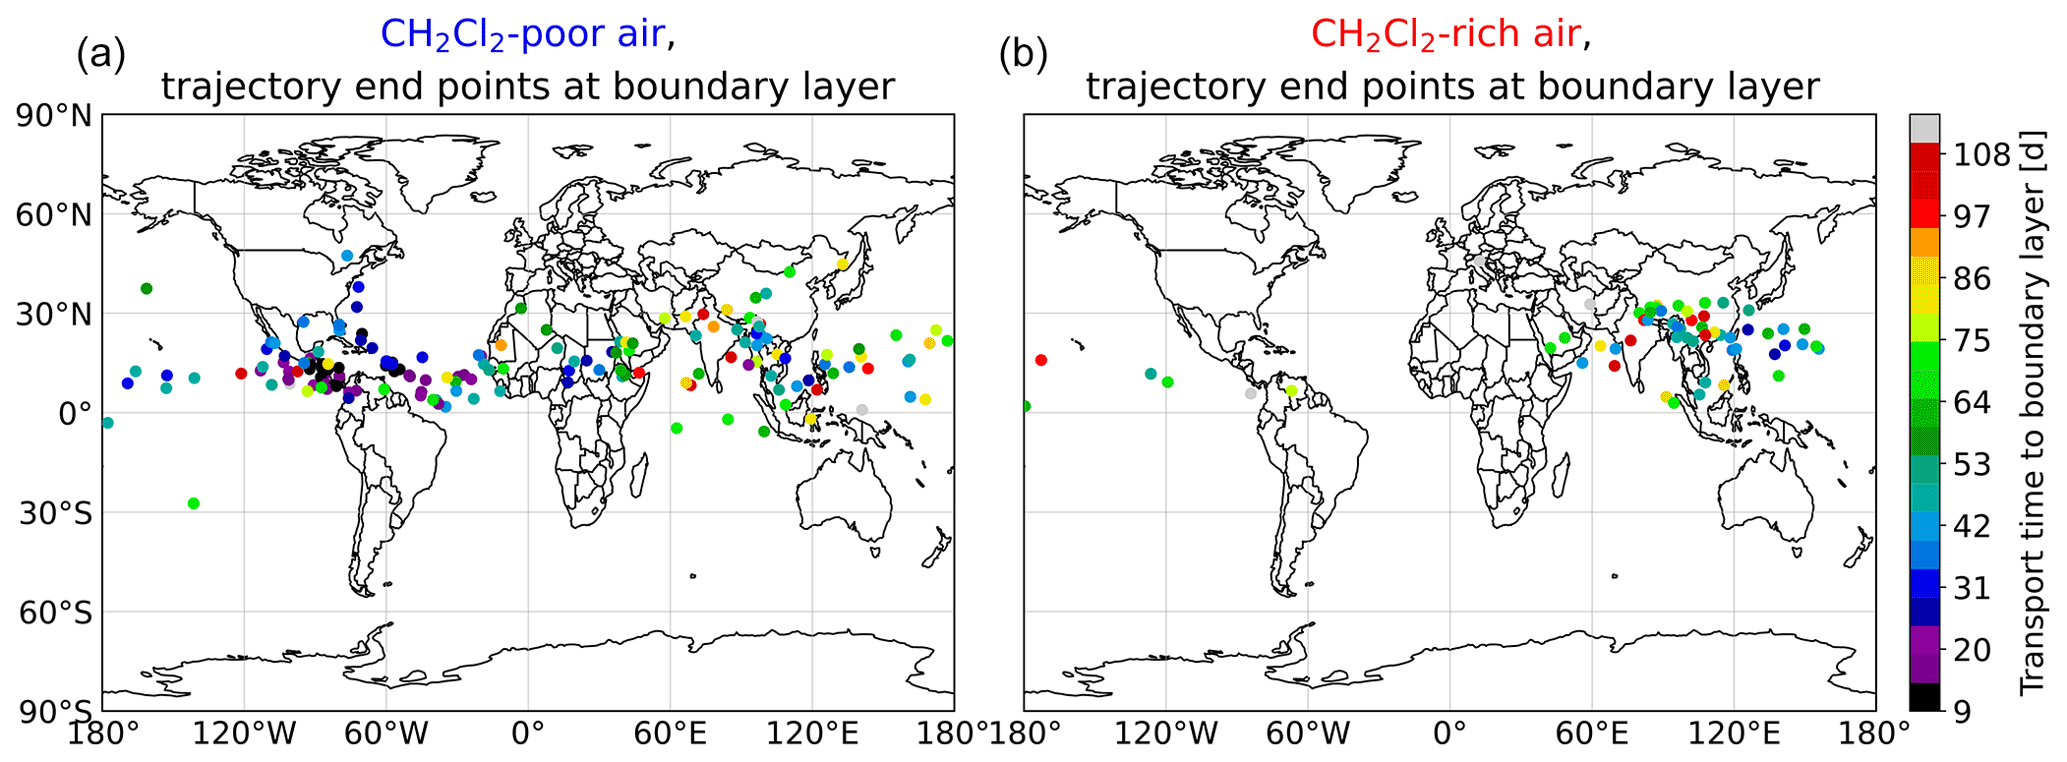
Figure B1Location of back-trajectory end points at the model boundary layer, color coded with the transport time from the location of measurement to the location at the boundary layer. Shown are the locations at the boundary layer for CH2Cl2-poor (a) and CH2Cl2-rich air (b) from all WISE flights between 28 September and 21 October.
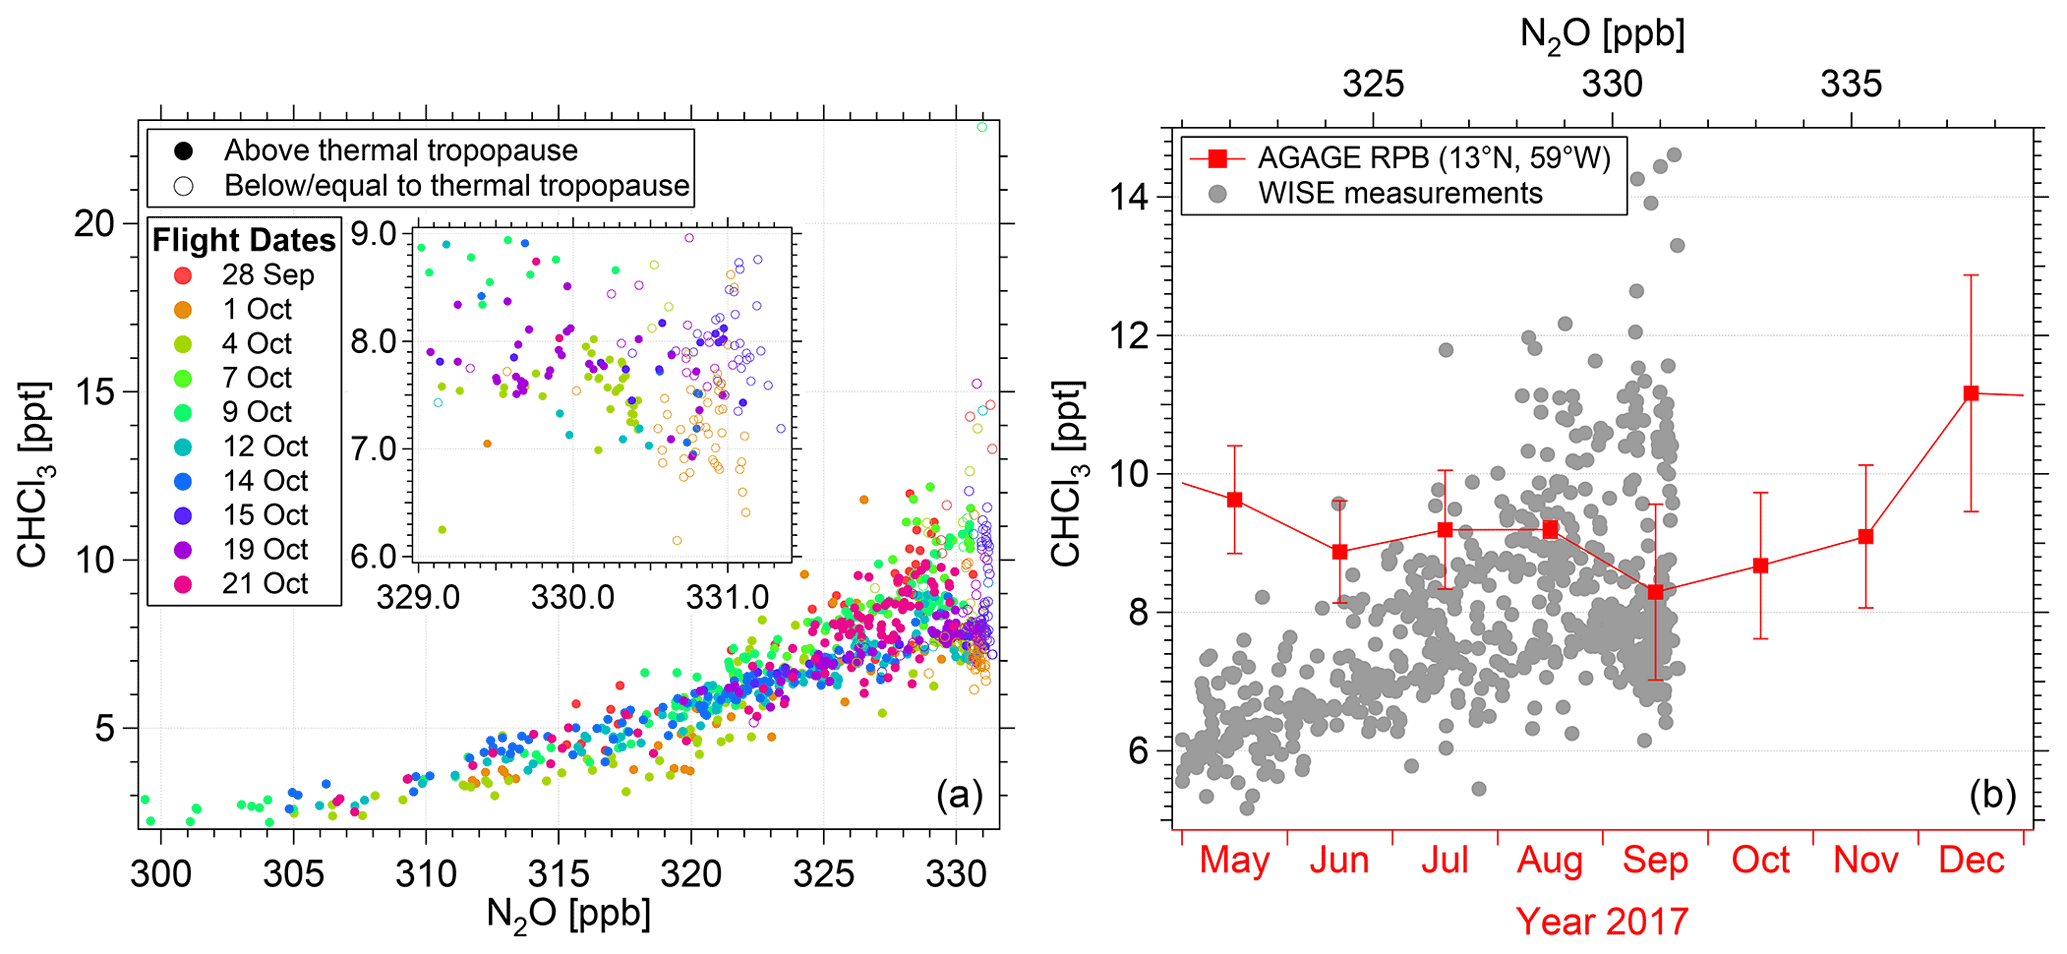
Figure C1CHCl3–N2O relationship color coded by flight date (a) and monthly averaged ground-based measurements of CHCl3 from the AGAGE network at Ragged Point, Barbados (b; Prinn et al., 2018), overlaid by a detailed plot of the CHCl3–N2O relationship. Panel (b) showing the CHCl3 time series of the AGAGE network is similar to Fig. 4 where a detailed description is given.
The following measured and simulated WISE data used in this paper are available at the HALO data depository (https://halo-db.pa.op.dlr.de/mission/96, last access: 8 February 2022; https://doi.org/10.17616/R39Q0T, Gottschaldt and Rapp, 2016): HAGAR-V CH2Cl2 and CHCl3 (datasets #5917–#5926), UMAQS N2O (datasets #5979–#5988), BAHAMAS aircraft data (datasets #5618–#5627), and CLaMS equivalent latitude and tropopause (datasets #5455–#5464). Signing a data protocol is mandatory to access the data from the HALO data depository. The CLaMS surface origin tracers and the back-trajectory calculations are available upon request (b.vogel@fz-juelich.de). The ground-based observations from the AGAGE network and the ECMWF ERA-Interim reanalysis data are available online (https://doi.org/10.3334/CDIAC/ATG.DB1001, Prinn et al., 2008; https://www.ecmwf.int/node/8174, Berrisford et al., 2011).
VL, JW, AR, and CMV carried out the measurements with the HAGAR-V instrument; PH and VB provided the UMAQS N2O data; the CLaMS simulations and the back-trajectory calculations were performed by BV. VL processed the HAGAR-V data and analyzed the measurements and simulations; CMV helped with interpreting the results. The results of the study were discussed by all the co-authors, with particular contributions by BV, RM, and CMV. The paper was written by VL, with supporting comments from BV, RM, CMV, JW, and PH.
At least one of the (co-)authors is a member of the editorial board of Atmospheric Chemistry and Physics. The peer-review process was guided by an independent editor, and the authors also have no other competing interests to declare.
Publisher’s note: Copernicus Publications remains neutral with regard to jurisdictional claims in published maps and institutional affiliations.
This article is part of the special issue “WISE: Wave-driven isentropic exchange in the extratropical upper troposphere and lower stratosphere (ACP/AMT/WCD inter-journal SI)”. It is not associated with a conference.
The authors would like to thank Simon O’Doherty and Dickon Young for the use of the AGAGE network ground-based CH2Cl2 and CHCl3 measurements at Ragged Point obtained from http://agage.mit.edu/data (last access: 8 February 2022). Operation of the AGAGE laboratory at Ragged Point is supported by the National Aeronautics and Space Administration (NASA, grant NNX16AC98G to MIT) and the National Oceanic and Atmospheric Administration (NOAA, contract 1305M319CNRMJ0028 to the University of Bristol). We acknowledge the use of ERA-Interim reanalysis data obtained from the European Centre for Medium-Range Weather Forecasts (ECMWF). We also acknowledge the use of CLaMS calculations regarding the location of the tropopause and the equivalent latitude provided by Jens-Uwe Grooß (Forschungszentrum Jülich). We would gratefully like to acknowledge Tanja Schuck (Goethe University Frankfurt) for the calibration of the HAGAR-V laboratory standards. We warmly thank the whole WISE community, in particular the scientific coordinators of the campaign, the pilots, the management, and ground support team of the Deutsches Zentrum für Luft- und Raumfahrt Flugexperimente (DLR-FX), and the flight planning team for making this campaign a success. We gratefully acknowledge the extended HAGAR-V team supporting the measurements of the WISE mission, particularly Emil Gerhardt (software and field support), Peter Knieling (electronics), and Axel Frohschauer (mechanics). We acknowledge the use of water vapor data from the FISH instrument provided by Christian Rolf and Nicole Spelten (both Forschungszentrum Jülich) as well as the use of avionic data provided by the BAHAMAS team (Mess- und Sensortechnik, DLR-FX). We also want to thank Andreas Petzold (Forschungszentrum Jülich) for helpful remarks on the CHCl3–CH2Cl2 relationship. We gratefully acknowledge the computing time for the CLaMS simulations granted on the supercomputer JURECA at Jülich Supercomputing Centre (JSC) under the VSR project ID JICG11. Our activities were mainly funded by the German Science Foundation (Deutsche Forschungsgemeinschaft, DFG) Priority Program SPP 1294: VO1530/5-1 (HAGAR-V), VO1276/5-1 (CLaMS), and HO4225/7-1 and HO4225/8-1 (UMAQS). Valentin Lauther was partly funded by a HITEC (Helmholtz Interdisciplinary Doctoral Training in Energy and Climate Research) fellowship by the Forschungszentrum Jülich. We acknowledge support from the Open Access Publication Fund of the University of Wuppertal.
This research has been supported by the Deutsche Forschungsgemeinschaft (grant nos. SPP 1294 VO1530/5-1, VO1276/5-1, HO4225/7-1, and HO4225/8-1), a HITEC (Helmholtz Interdisciplinary Doctoral Training in Energy and Climate Research) fellowship by the Forschungszentrum Jülich, and the Open Access Publication Fund of the University of Wuppertal.
This paper was edited by Farahnaz Khosrawi and reviewed by two anonymous referees.
Adcock, K. E., Fraser, P. J., Hall, B. D., Langenfelds, R. L., Lee, G., Montzka, S. A., Oram, D. E., Röckmann, T., Stroh, F., Sturges, W. T., Vogel, B., and Laube, J. C.: Aircraft-Based Observations of Ozone-Depleting Substances in the Upper Troposphere and Lower Stratosphere in and Above the Asian Summer Monsoon, J. Geophys. Res.-Atmos., 126, e2020JD033137, https://doi.org/10.1029/2020jd033137, 2021. a, b, c, d, e
Anderson, J. G., Weisenstein, D. K., Bowman, K. P., Homeyer, C. R., Smith, J. B., Wilmouth, D. M., Sayres, D. S., Klobas, J. E., Leroy, S. S., Dykema, J. A., and Wofsy, S. C.: Stratospheric ozone over the United States in summer linked to observations of convection and temperature via chlorine and bromine catalysis, P. Natl. Acad. Sci., 114, E4905–E4913, https://doi.org/10.1073/pnas.1619318114, 2017. a
Andrews, A. E., Boering, K. A., Daube, B. C., Wofsy, S. C., Loewenstein, M., Jost, H., Podolske, J. R., Webster, C. R., Herman, R. L., Scott, D. C., Flesch, G. J., Moyer, E. J., Elkins, J. W., Dutton, G. S., Hurst, D. F., Moore, F. L., Ray, E. A., Romashkin, P. A., and Strahan, S. E.: Mean ages of stratospheric air derived from in situ observations of CO2, CH4, and N2O, J. Geophys. Res.-Atmos., 106, 32295–32314, https://doi.org/10.1029/2001jd000465, 2001. a
Aschmann, J., Sinnhuber, B.-M., Atlas, E. L., and Schauffler, S. M.: Modeling the transport of very short-lived substances into the tropical upper troposphere and lower stratosphere, Atmos. Chem. Phys., 9, 9237–9247, https://doi.org/10.5194/acp-9-9237-2009, 2009. a
Ashfold, M. J., Harris, N. R. P., Atlas, E. L., Manning, A. J., and Pyle, J. A.: Transport of short-lived species into the Tropical Tropopause Layer, Atmos. Chem. Phys., 12, 6309–6322, https://doi.org/10.5194/acp-12-6309-2012, 2012. a, b
Bergman, J. W., Fierli, F., Jensen, E. J., Honomichl, S., and Pan, L. L.: Boundary layer sources for the Asian anticyclone: Regional contributions to a vertical conduit, J. Geophys. Res.-Atmos., 118, 2560–2575, https://doi.org/10.1002/jgrd.50142, 2013. a
Berrisford, P., Dee, D. P., Poli, P., Brugge, R., Fielding, M., Fuentes, M., Kållberg, P. W., Kobayashi, S., Uppala, S., and Simmons, A.: The ERA-Interim archive Version 2.0, ECMWF, Shinfield Park, Reading [data set], available at: https://www.ecmwf.int/node/8174 (last access: 8 February 2022), 2011. a
Brunamonti, S., Jorge, T., Oelsner, P., Hanumanthu, S., Singh, B. B., Kumar, K. R., Sonbawne, S., Meier, S., Singh, D., Wienhold, F. G., Luo, B. P., Boettcher, M., Poltera, Y., Jauhiainen, H., Kayastha, R., Karmacharya, J., Dirksen, R., Naja, M., Rex, M., Fadnavis, S., and Peter, T.: Balloon-borne measurements of temperature, water vapor, ozone and aerosol backscatter on the southern slopes of the Himalayas during StratoClim 2016–2017, Atmos. Chem. Phys., 18, 15937–15957, https://doi.org/10.5194/acp-18-15937-2018, 2018. a
Chipperfield, M. P., Dhomse, S., Hossaini, R., Feng, W., Santee, M. L., Weber, M., Burrows, J. P., Wild, J. D., Loyola, D., and Coldewey-Egbers, M.: On the Cause of Recent Variations in Lower Stratospheric Ozone, Geophys. Res. Lett., 45, 5718–5726, https://doi.org/10.1029/2018gl078071, 2018. a
Clapp, C. E., Smith, J. B., Bedka, K. M., and Anderson, J. G.: Identifying Source Regions and the Distribution of Cross-Tropopause Convective Outflow Over North America During the Warm Season, J. Geophys. Res.-Atmos., 124, 13750–13762, https://doi.org/10.1029/2019jd031382, 2019. a
Clapp, C. E., Smith, J. B., Bedka, K. M., and Anderson, J. G.: Identifying Outflow Regions of North American Monsoon Anticyclone-Mediated Meridional Transport of Convectively Influenced Air Masses in the Lower Stratosphere, J. Geophys. Res.-Atmos., 126, e2021JD034644, https://doi.org/10.1029/2021jd034644, 2021. a, b, c, d
Claxton, T., Hossaini, R., Wild, O., Chipperfield, M. P., and Wilson, C.: On the Regional and Seasonal Ozone Depletion Potential of Chlorinated Very Short-Lived Substances, Geophys. Res. Lett., 46, 5489–5498, https://doi.org/10.1029/2018gl081455, 2019. a, b, c
Claxton, T., Hossaini, R., Wilson, C., Montzka, S. A., Chipperfield, M. P., Wild, O., Bednarz, E. M., Carpenter, L. J., Andrews, S. J., Hackenberg, S. C., Mühle, J., Oram, D., Park, S., Park, M.-K., Atlas, E., Navarro, M., Schauffler, S., Sherry, D., Vollmer, M., Schuck, T., Engel, A., Krummel, P. B., Maione, M., Arduini, J., Saito, T., Yokouchi, Y., O'Doherty, S., Young, D., and Lunder, C.: A Synthesis Inversion to Constrain Global Emissions of Two Very Short Lived Chlorocarbons: Dichloromethane, and Perchloroethylene, J. Geophys. Res.-Atmos., 125, 5489–5498, https://doi.org/10.1029/2019jd031818, 2020. a, b, c, d
Cooney, J. W., Bowman, K. P., Homeyer, C. R., and Fenske, T. M.: Ten Year Analysis of Tropopause-Overshooting Convection Using GridRad Data, J. Geophys. Res.-Atmos., 123, 329–343, https://doi.org/10.1002/2017jd027718, 2018. a
Cox, M. L., Sturrock, G. A., Fraser, P. J., Siems, S. T., Krummel, P. B., and O'Doherty, S.: Regional Sources of Methyl Chloride, Chloroform and Dichloromethane Identified from AGAGE Observations at Cape Grim, Tasmania, 1998–2000, J. Atmos. Chem., 45, 79–99, https://doi.org/10.1023/a:1024022320985, 2003. a
Dee, D. P., Uppala, S. M., Simmons, A. J., Berrisford, P., Poli, P., Kobayashi, S., Andrae, U., Balmaseda, M. A., Balsamo, G., Bauer, P., Bechtold, P., Beljaars, A. C. M., van de Berg, L., Bidlot, J., Bormann, N., Delsol, C., Dragani, R., Fuentes, M., Geer, A. J., Haimberger, L., Healy, S. B., Hersbach, H., Hólm, E. V., Isaksen, L., Kållberg, P., Köhler, M., Matricardi, M., McNally, A. P., Monge-Sanz, B. M., Morcrette, J.-J., Park, B.-K., Peubey, C., de Rosnay, P., Tavolato, C., Thépaut, J.-N., and Vitart, F.: The ERA-Interim reanalysis: configuration and performance of the data assimilation system, Q. J. Roy. Meteor. Soc., 137, 553–597, https://doi.org/10.1002/qj.828, 2011. a, b, c
Engel, A., Rigby, M., Burkholder, J. B., Fernandez, R. P., Froidevaux, L., Hall, B. D., Hossaini, R., Saito, T., Vollmer, M. K., and Yao, B.: Update on ozone-depleting substances (ODSs) and other gases of interest to the Montreal protocol, Chapter 1, in: Scientific Assessment of Ozone Depletion: 2018, Global Ozone Research and Monitoring Project – Report No. 58, WMO, 1–87, ISBN 978-1-7329317-1-8, 2018. a, b, c, d, e, f, g, h
Fang, X., Park, S., Saito, T., Tunnicliffe, R., Ganesan, A. L., Rigby, M., Li, S., Yokouchi, Y., Fraser, P. J., Harth, C. M., Krummel, P. B., Mühle, J., O'Doherty, S., Salameh, P. K., Simmonds, P. G., Weiss, R. F., Young, D., Lunt, M. F., Manning, A. J., Gressent, A., and Prinn, R. G.: Rapid increase in ozone-depleting chloroform emissions from China, Nat. Geosci., 12, 89–93, https://doi.org/10.1038/s41561-018-0278-2, 2018. a, b, c, d, e, f
Feng, Y., Bie, P., Wang, Z., Wang, L., and Zhang, J.: Bottom-up anthropogenic dichloromethane emission estimates from China for the period 2005–2016 and predictions of future emissions, Atmos. Environ., 186, 241–247, https://doi.org/10.1016/j.atmosenv.2018.05.039, 2018. a, b
Filus, M. T., Atlas, E. L., Navarro, M. A., Meneguz, E., Thomson, D., Ashfold, M. J., Carpenter, L. J., Andrews, S. J., and Harris, N. R. P.: Transport of short-lived halocarbons to the stratosphere over the Pacific Ocean, Atmos. Chem. Phys., 20, 1163–1181, https://doi.org/10.5194/acp-20-1163-2020, 2020. a
Garny, H. and Randel, W. J.: Transport pathways from the Asian monsoon anticyclone to the stratosphere, Atmos. Chem. Phys., 16, 2703–2718, https://doi.org/10.5194/acp-16-2703-2016, 2016. a
Gentner, D. R., Miller, A. M., and Goldstein, A. H.: Seasonal Variability in Anthropogenic Halocarbon Emissions, Environ. Sci. Technol. 44, 5377–5382, https://doi.org/10.1021/es1005362, 2010. a
Gettelman, A., Kinnison, D. E., Dunkerton, T. J., and Brasseur, G. P.: Impact of monsoon circulations on the upper troposphere and lower stratosphere, J. Geophys. Res.-Atmos., 109, D22101, https://doi.org/10.1029/2004jd004878, 2004. a, b
Giez, A., Mallaun, C., Zöger, M., Dörnbrack, A., and Schumann, U.: Static Pressure from Aircraft Trailing-Cone Measurements and Numerical Weather-Prediction Analysis, J. Aircraft, 54, 1728–1737, https://doi.org/10.2514/1.c034084, 2017. a
Gottschaldt, K.-D. and Rapp, M.: HALO database, German Aerospace Center (DLR) [data set], https://doi.org/10.17616/R39Q0T, 2016. a
Hanisco, T. F., Lanzendorf, E. J., Wennberg, P. O., Perkins, K. K., Stimpfle, R. M., Voss, P. B., Anderson, J. G., Cohen, R. C., Fahey, D. W., Gao, R. S., Hintsa, E. J., Salawitch, R. J., Margitan, J. J., McElroy, C. T., and Midwinter, C.: Sources, Sinks, and the Distribution of OH in the Lower Stratosphere, J. Phys. Chem. A, 105, 1543–1553, https://doi.org/10.1021/jp002334g, 2001. a
Hanumanthu, S., Vogel, B., Müller, R., Brunamonti, S., Fadnavis, S., Li, D., Ölsner, P., Naja, M., Singh, B. B., Kumar, K. R., Sonbawne, S., Jauhiainen, H., Vömel, H., Luo, B., Jorge, T., Wienhold, F. G., Dirkson, R., and Peter, T.: Strong day-to-day variability of the Asian Tropopause Aerosol Layer (ATAL) in August 2016 at the Himalayan foothills, Atmos. Chem. Phys., 20, 14273–14302, https://doi.org/10.5194/acp-20-14273-2020, 2020. a, b
Hepach, H., Quack, B., Raimund, S., Fischer, T., Atlas, E. L., and Bracher, A.: Halocarbon emissions and sources in the equatorial Atlantic Cold Tongue, Biogeosciences, 12, 6369–6387, https://doi.org/10.5194/bg-12-6369-2015, 2015. a, b
Herman, R. L., Ray, E. A., Rosenlof, K. H., Bedka, K. M., Schwartz, M. J., Read, W. G., Troy, R. F., Chin, K., Christensen, L. E., Fu, D., Stachnik, R. A., Bui, T. P., and Dean-Day, J. M.: Enhanced stratospheric water vapor over the summertime continental United States and the role of overshooting convection, Atmos. Chem. Phys., 17, 6113–6124, https://doi.org/10.5194/acp-17-6113-2017, 2017. a, b
Honomichl, S. B. and Pan, L. L.: Transport From the Asian Summer Monsoon Anticyclone Over the Western Pacific, J. Geophys. Res.-Atmos., 125, e2019JD032094, https://doi.org/10.1029/2019jd032094, 2020. a
Hossaini, R., Chipperfield, M. P., Saiz-Lopez, A., Harrison, J. J., von Glasow, R., Sommariva, R., Atlas, E., Navarro, M., Montzka, S. A., Feng, W., Dhomse, S., Harth, C., Mühle, J., Lunder, C., O'Doherty, S., Young, D., Reimann, S., Vollmer, M. K., Krummel, P. B., and Bernath, P. F.: Growth in stratospheric chlorine from short-lived chemicals not controlled by the Montreal Protocol, Geophys. Res. Lett., 42, 4573–4580, https://doi.org/10.1002/2015gl063783, 2015. a, b, c
Hossaini, R., Chipperfield, M. P., Montzka, S. A., Leeson, A. A., Dhomse, S. S., and Pyle, J. A.: The increasing threat to stratospheric ozone from dichloromethane, Nat. Commun., 8, 15962, https://doi.org/10.1038/ncomms15962, 2017. a, b, c
Hossaini, R., Atlas, E., Dhomse, S. S., Chipperfield, M. P., Bernath, P. F., Fernando, A. M., Mühle, J., Leeson, A. A., Montzka, S. A., Feng, W., Harrison, J. J., Krummel, P., Vollmer, M. K., Reimann, S., O'Doherty, S., Young, D., Maione, M., Arduini, J., and Lunder, C. R.: Recent Trends in Stratospheric Chlorine From Very Short-Lived Substances, J. Geophys. Res.-Atmos., 124, 2318–2335, https://doi.org/10.1029/2018jd029400, 2019. a, b, c, d
Hsu, K.-J. and DeMore, W. B.: Rate constants for the reactions of OH with CH3Cl, CH2Cl2, CHCl3, and CH3Br, Geophys. Res. Lett., 21, 805–808, https://doi.org/10.1029/94gl00601, 1994. a
Keber, T., Bönisch, H., Hartick, C., Hauck, M., Lefrancois, F., Obersteiner, F., Ringsdorf, A., Schohl, N., Schuck, T., Hossaini, R., Graf, P., Jöckel, P., and Engel, A.: Bromine from short-lived source gases in the extratropical northern hemispheric upper troposphere and lower stratosphere (UTLS), Atmos. Chem. Phys., 20, 4105–4132, https://doi.org/10.5194/acp-20-4105-2020, 2020. a
Ko, M. K. W., Newman, P. A., Reimann, S., and Strahan, S. E.: SPARC Report on Lifetimes of Stratospheric Ozone-Depleting Substances, Their Replacements, and Related Species, Tech. rep., SPARC Office, available at: http://www.sparc-climate.org/publications/sparc-reports/ (last access: 8 February 2022), 2013. a
Krautstrunk, M. and Giez, A.: The Transition From FALCON to HALO Era Airborne Atmospheric Research, in: Atmospheric Physics, Springer Berlin Heidelberg, 609–624, https://doi.org/10.1007/978-3-642-30183-4_37, 2012. a
Kunkel, D., Hoor, P., Kaluza, T., Ungermann, J., Kluschat, B., Giez, A., Lachnitt, H.-C., Kaufmann, M., and Riese, M.: Evidence of small-scale quasi-isentropic mixing in ridges of extratropical baroclinic waves, Atmos. Chem. Phys., 19, 12607–12630, https://doi.org/10.5194/acp-19-12607-2019, 2019. a
Laturnus, F., Haselmann, K. F., Borch, T., and Grøn, C.: Terrestrial natural sources of trichloromethane (chloroform, CHCl3) – An overview, Biogeochemistry, 60, 121–139, https://doi.org/10.1023/a:1019887505651, 2002. a
Laube, J. C., Engel, A., Bönisch, H., Möbius, T., Worton, D. R., Sturges, W. T., Grunow, K., and Schmidt, U.: Contribution of very short-lived organic substances to stratospheric chlorine and bromine in the tropics – a case study, Atmos. Chem. Phys., 8, 7325–7334, https://doi.org/10.5194/acp-8-7325-2008, 2008. a, b
Lauther, V.: Airborne in situ measurements of short-lived chlorocarbons and investigation of their pathways from northern hemispheric source regions into the lowermost stratosphere, PhD thesis, Bergische Universität Wuppertal, https://doi.org/10.25926/KQVQ-HB36, 2020. a
Leedham Elvidge, E. C., Oram, D. E., Laube, J. C., Baker, A. K., Montzka, S. A., Humphrey, S., O'Sullivan, D. A., and Brenninkmeijer, C. A. M.: Increasing concentrations of dichloromethane, CH2Cl2, inferred from CARIBIC air samples collected 1998–2012, Atmos. Chem. Phys., 15, 1939–1958, https://doi.org/10.5194/acp-15-1939-2015, 2015. a, b
Lelieveld, J., Gromov, S., Pozzer, A., and Taraborrelli, D.: Global tropospheric hydroxyl distribution, budget and reactivity, Atmos. Chem. Phys., 16, 12477–12493, https://doi.org/10.5194/acp-16-12477-2016, 2016. a
Levine, J. G., Braesicke, P., Harris, N. R. P., Savage, N. H., and Pyle, J. A.: Pathways and timescales for troposphere-to-stratosphere transport via the tropical tropopause layer and their relevance for very short lived substances, J. Geophys. Res., 112, D04308, https://doi.org/10.1029/2005jd006940, 2007. a
Li, D., Vogel, B., Bian, J., Müller, R., Pan, L. L., Günther, G., Bai, Z., Li, Q., Zhang, J., Fan, Q., and Vömel, H.: Impact of typhoons on the composition of the upper troposphere within the Asian summer monsoon anticyclone: the SWOP campaign in Lhasa 2013, Atmos. Chem. Phys., 17, 4657–4672, https://doi.org/10.5194/acp-17-4657-2017, 2017. a
Li, D., Vogel, B., Müller, R., Bian, J., Günther, G., Ploeger, F., Li, Q., Zhang, J., Bai, Z., Vömel, H., and Riese, M.: Dehydration and low ozone in the tropopause layer over the Asian monsoon caused by tropical cyclones: Lagrangian transport calculations using ERA-Interim and ERA5 reanalysis data, Atmos. Chem. Phys., 20, 4133–4152, https://doi.org/10.5194/acp-20-4133-2020, 2020. a
Li, Q., Jacob, D. J., Park, R., Wang, Y., Heald, C. L., Hudman, R., Yantosca, R. M., Martin, R. V., and Evans, M.: North American pollution outflow and the trapping of convectively lifted pollution by upper-level anticyclone, J. Geophys. Res., 110, D10301, https://doi.org/10.1029/2004jd005039, 2005. a
Liang, Q., Atlas, E., Blake, D., Dorf, M., Pfeilsticker, K., and Schauffler, S.: Convective transport of very short lived bromocarbons to the stratosphere, Atmos. Chem. Phys., 14, 5781–5792, https://doi.org/10.5194/acp-14-5781-2014, 2014. a
Luong, J., Gras, R., Mustacich, R., and Cortes, H.: Low Thermal Mass Gas Chromatography: Principles and Applications, J. Chromatogr. Sci., 44, 253–261, https://doi.org/10.1093/chromsci/44.5.253, 2006. a
McCulloch, A.: Chloroform in the environment: occurrence, sources, sinks and effects, Chemosphere, 50, 1291–1308, https://doi.org/10.1016/s0045-6535(02)00697-5, 2003. a, b
McKenna, D. S., Konopka, P., Grooß, J.-U., Günther, G., Müller, R., Spang, R., Offermann, D., and Orsolini, Y.: A new Chemical Lagrangian Model of the Stratosphere (CLaMS) 1. Formulation of advection and mixing, J. Geophys. Res., 107, 4309, https://doi.org/10.1029/2000jd000114, 2002a. a
McKenna, D. S., Grooß, J.-U., Günther, G., Konopka, P., Müller, R., Carver, G., and Sasano, Y.: A new Chemical Lagrangian Model of the Stratosphere (CLaMS) 2. Formulation of chemistry scheme and initialization, J. Geophys. Res., 107, 4256, https://doi.org/10.1029/2000jd000113, 2002b. a
Moore, R. M.: Dichloromethane in North Atlantic waters, J. Geophys. Res., 109, C09004, https://doi.org/10.1029/2004jc002397, 2004. a
Müller, S., Hoor, P., Berkes, F., Bozem, H., Klingebiel, M., Reutter, P., Smit, H. G. J., Wendisch, M., Spichtinger, P., and Borrmann, S.: In situ detection of stratosphere-troposphere exchange of cirrus particles in the midlatitudes, Geophys. Res. Lett., 42, 949–955, https://doi.org/10.1002/2014gl062556, 2015. a
Müller, S., Hoor, P., Bozem, H., Gute, E., Vogel, B., Zahn, A., Bönisch, H., Keber, T., Krämer, M., Rolf, C., Riese, M., Schlager, H., and Engel, A.: Impact of the Asian monsoon on the extratropical lower stratosphere: trace gas observations during TACTS over Europe 2012, Atmos. Chem. Phys., 16, 10573–10589, https://doi.org/10.5194/acp-16-10573-2016, 2016. a, b, c
Nützel, M., Podglajen, A., Garny, H., and Ploeger, F.: Quantification of water vapour transport from the Asian monsoon to the stratosphere, Atmos. Chem. Phys., 19, 8947–8966, https://doi.org/10.5194/acp-19-8947-2019, 2019. a
Oram, D. E., Ashfold, M. J., Laube, J. C., Gooch, L. J., Humphrey, S., Sturges, W. T., Leedham-Elvidge, E., Forster, G. L., Harris, N. R. P., Mead, M. I., Samah, A. A., Phang, S. M., Ou-Yang, C.-F., Lin, N.-H., Wang, J.-L., Baker, A. K., Brenninkmeijer, C. A. M., and Sherry, D.: A growing threat to the ozone layer from short-lived anthropogenic chlorocarbons, Atmos. Chem. Phys., 17, 11929–11941, https://doi.org/10.5194/acp-17-11929-2017, 2017. a, b
Pan, L. L., Kunz, A., Homeyer, C. R., Munchak, L. A., Kinnison, D. E., and Tilmes, S.: Commentary on using equivalent latitude in the upper troposphere and lower stratosphere, Atmos. Chem. Phys., 12, 9187–9199, https://doi.org/10.5194/acp-12-9187-2012, 2012. a
Park, M., Randel, W. J., Gettelman, A., Massie, S. T., and Jiang, J. H.: Transport above the Asian summer monsoon anticyclone inferred from Aura Microwave Limb Sounder tracers, J. Geophys. Res., 112, D16309, https://doi.org/10.1029/2006jd008294, 2007. a
Park, M., Randel, W. J., Emmons, L. K., and Livesey, N. J.: Transport pathways of carbon monoxide in the Asian summer monsoon diagnosed from Model of Ozone and Related Tracers (MOZART), J. Geophys. Res., 114, D08303, https://doi.org/10.1029/2008jd010621, 2009. a
Park, S., Atlas, E. L., Jiménez, R., Daube, B. C., Gottlieb, E. W., Nan, J., Jones, D. B. A., Pfister, L., Conway, T. J., Bui, T. P., Gao, R.-S., and Wofsy, S. C.: Vertical transport rates and concentrations of OH and Cl radicals in the Tropical Tropopause Layer from observations of CO2 and halocarbons: implications for distributions of long- and short-lived chemical species, Atmos. Chem. Phys., 10, 6669–6684, https://doi.org/10.5194/acp-10-6669-2010, 2010. a, b, c
Pasch, R. J., Penny, A. B., and Berg, R.: Tropical Cyclone Report: Hurricane Maria (AL152017), Tech. rep., NOAA, available at: https://www.nhc.noaa.gov/data/tcr/AL152017_Maria.pdf (last access: 8 February 2022), 2019. a, b, c
Pittman, J. V., Weinstock, E. M., Oglesby, R. J., Sayres, D. S., Smith, J. B., Anderson, J. G., Cooper, O. R., Wofsy, S. C., Xueref, I., Gerbig, C., Daube, B. C., Richard, E. C., Ridley, B. A., Weinheimer, A. J., Loewenstein, M., Jost, H.-J., Lopez, J. P., Mahoney, M. J., Thompson, T. L., Hargrove, W. W., and Hoffman, F. M.: Transport in the subtropical lowermost stratosphere during the Cirrus Regional Study of Tropical Anvils and Cirrus Layers-Florida Area Cirrus Experiment, J. Geophys. Res., 112, D08304, https://doi.org/10.1029/2006jd007851, 2007. a, b
Ploeger, F., Konopka, P., Günther, G., Grooß, J.-U., and Müller, R.: Impact of the vertical velocity scheme on modeling transport in the tropical tropopause layer, J. Geophys. Res., 115, D03301, https://doi.org/10.1029/2009jd012023, 2010. a
Ploeger, F., Günther, G., Konopka, P., Fueglistaler, S., Müller, R., Hoppe, C., Kunz, A., Spang, R., Grooß, J.-U., and Riese, M.: Horizontal water vapor transport in the lower stratosphere from subtropics to high latitudes during boreal summer, J. Geophys. Res.-Atmos., 118, 8111–8127, https://doi.org/10.1002/jgrd.50636, 2013. a
Ploeger, F., Gottschling, C., Griessbach, S., Grooß, J.-U., Guenther, G., Konopka, P., Müller, R., Riese, M., Stroh, F., Tao, M., Ungermann, J., Vogel, B., and von Hobe, M.: A potential vorticity-based determination of the transport barrier in the Asian summer monsoon anticyclone, Atmos. Chem. Phys., 15, 13145–13159, https://doi.org/10.5194/acp-15-13145-2015, 2015. a
Pommrich, R., Müller, R., Grooß, J.-U., Konopka, P., Ploeger, F., Vogel, B., Tao, M., Hoppe, C. M., Günther, G., Spelten, N., Hoffmann, L., Pumphrey, H.-C., Viciani, S., D'Amato, F., Volk, C. M., Hoor, P., Schlager, H., and Riese, M.: Tropical troposphere to stratosphere transport of carbon monoxide and long-lived trace species in the Chemical Lagrangian Model of the Stratosphere (CLaMS), Geosci. Model Dev., 7, 2895–2916, https://doi.org/10.5194/gmd-7-2895-2014, 2014. a, b, c
Popovic, J. M. and Plumb, R. A.: Eddy Shedding from the Upper-Tropospheric Asian Monsoon Anticyclone, J. Atmos. Sci., 58, 93–104, https://doi.org/10.1175/1520-0469(2001)058<0093:esftut>2.0.co;2, 2001. a
Prinn, R., Weiss, R., Krummel, P., O'Doherty, S., and Muhle, J.: The ALE/GAGE/AGAGE Network (DB1001), Environmental System Science Data Infrastructure for a Virtual Ecosystem; Carbon Dioxide Information Analysis Center (CDIAC), Oak Ridge National Laboratory (ORNL), Oak Ridge, TN (USA) [data set], https://doi.org/10.3334/CDIAC/ATG.DB1001, 2008. a
Prinn, R. G., Weiss, R. F., Arduini, J., Arnold, T., DeWitt, H. L., Fraser, P. J., Ganesan, A. L., Gasore, J., Harth, C. M., Hermansen, O., Kim, J., Krummel, P. B., Li, S., Loh, Z. M., Lunder, C. R., Maione, M., Manning, A. J., Miller, B. R., Mitrevski, B., Mühle, J., O'Doherty, S., Park, S., Reimann, S., Rigby, M., Saito, T., Salameh, P. K., Schmidt, R., Simmonds, P. G., Steele, L. P., Vollmer, M. K., Wang, R. H., Yao, B., Yokouchi, Y., Young, D., and Zhou, L.: History of chemically and radiatively important atmospheric gases from the Advanced Global Atmospheric Gases Experiment (AGAGE), Earth Syst. Sci. Data, 10, 985–1018, https://doi.org/10.5194/essd-10-985-2018, 2018. a, b, c, d, e
Randel, W. J. and Jensen, E. J.: Physical processes in the tropical tropopause layer and their roles in a changing climate, Nat. Geosci., 6, 169–176, https://doi.org/10.1038/ngeo1733, 2013. a
Randel, W. J., Park, M., Emmons, L., Kinnison, D., Bernath, P., Walker, K. A., Boone, C., and Pumphrey, H.: Asian Monsoon Transport of Pollution to the Stratosphere, Science, 328, 611–613, https://doi.org/10.1126/science.1182274, 2010. a
Ray, E. A., Rosenlof, K. H., Richard, E. C., Hudson, P. K., Cziczo, D. J., Loewenstein, M., Jost, H.-J., Lopez, J., Ridley, B., Weinheimer, A., Montzka, D., Knapp, D., Wofsy, S. C., Daube, B. C., Gerbig, C., Xueref, I., and Herman, R. L.: Evidence of the effect of summertime midlatitude convection on the subtropical lower stratosphere from CRYSTAL-FACE tracer measurements, J. Geophys. Res., 109, D18304, https://doi.org/10.1029/2004jd004655, 2004. a, b
Riese, M., Kaufmann, M., Kunkel, D., and Hoor, P.: Wave-driven Isentropic Exchange (WISE), Johannes Gutenberg-Universität Mainz, available at: https://www.wise2017.de/ (last access: 10 January 2022), 2017. a
Rolf, C., Vogel, B., Hoor, P., Afchine, A., Günther, G., Krämer, M., Müller, R., Müller, S., Spelten, N., and Riese, M.: Water vapor increase in the lower stratosphere of the Northern Hemisphere due to the Asian monsoon anticyclone observed during the TACTS/ESMVal campaigns, Atmos. Chem. Phys., 18, 2973–2983, https://doi.org/10.5194/acp-18-2973-2018, 2018. a, b
Rotermund, M. K., Bense, V., Chipperfield, M. P., Engel, A., Grooß, J.-U., Hoor, P., Hüneke, T., Keber, T., Kluge, F., Schreiner, B., Schuck, T., Vogel, B., Zahn, A., and Pfeilsticker, K.: Organic and inorganic bromine measurements around the extratropical tropopause and lowermost stratosphere: insights into the transport pathways and total bromine, Atmos. Chem. Phys., 21, 15375–15407, https://doi.org/10.5194/acp-21-15375-2021, 2021. a, b, c, d, e, f, g, h
Santee, M. L., Manney, G. L., Livesey, N. J., Schwartz, M. J., Neu, J. L., and Read, W. G.: A comprehensive overview of the climatological composition of the Asian summer monsoon anticyclone based on 10 years of Aura Microwave Limb Sounder measurements, J. Geophys. Res.-Atmos., 122, 5491–5514, https://doi.org/10.1002/2016jd026408, 2017. a
Say, D., Ganesan, A. L., Lunt, M. F., Rigby, M., O'Doherty, S., Harth, C., Manning, A. J., Krummel, P. B., and Bauguitte, S.: Emissions of halocarbons from India inferred through atmospheric measurements, Atmos. Chem. Phys., 19, 9865–9885, https://doi.org/10.5194/acp-19-9865-2019, 2019. a, b
Schäfler, A., Fix, A., and Wirth, M.: Mixing at the extratropical tropopause as characterized by collocated airborne H2O and O3 lidar observations, Atmos. Chem. Phys., 21, 5217–5234, https://doi.org/10.5194/acp-21-5217-2021, 2021. a
Schauffler, S. M., Heidt, L. E., Pollock, W. H., Gilpin, T. M., Vedder, J. F., Solomon, S., Lueb, R. A., and Atlas, E. L.: Measurements of halogenated organic compounds near the tropical tropopause, Geophys. Res. Lett., 20, 2567–2570, https://doi.org/10.1029/93gl02840, 1993. a, b
Schauffler, S. M., Atlas, E. L., Donnelly, S. G., Andrews, A., Montzka, S. A., Elkins, J. W., Hurst, D. F., Romashkin, P. A., Dutton, G. S., and Stroud, V.: Chlorine budget and partitioning during the Stratospheric Aerosol and Gas Experiment (SAGE) III Ozone Loss and Validation Experiment (SOLVE), J. Geophys. Res.-Atmos., 108, 4173, https://doi.org/10.1029/2001jd002040, 2003. a, b
Schoeberl, M. R., Pfister, L., Wang, T., Kummer, J., Dessler, A. E., and Yu, W.: Erythemal Radiation, Column Ozone, and the North American Monsoon, J. Geophys. Res.-Atmos., 125, e2019JD032283, https://doi.org/10.1029/2019jd032283, 2020. a
Simmonds, P. G., Manning, A. J., Cunnold, D. M., McCulloch, A., O'Doherty, S., Derwent, R. G., Krummel, P. B., Fraser, P. J., Dunse, B., Porter, L. W., Wang, R. H. J., Greally, B. R., Miller, B. R., Salameh, P., Weiss, R. F., and Prinn, R. G.: Global trends, seasonal cycles, and European emissions of dichloromethane, trichloroethene, and tetrachloroethene from the AGAGE observations at Mace Head, Ireland, and Cape Grim, Tasmania, J. Geophys. Res., 111, D18304, https://doi.org/10.1029/2006jd007082, 2006. a
Siu, L. W. and Bowman, K. P.: Forcing of the Upper-Tropospheric Monsoon Anticyclones, J. Atmos. Sci., 76, 1937–1954, https://doi.org/10.1175/jas-d-18-0340.1, 2019. a
Smith, J. B., Wilmouth, D. M., Bedka, K. M., Bowman, K. P., Homeyer, C. R., Dykema, J. A., Sargent, M. R., Clapp, C. E., Leroy, S. S., Sayres, D. S., Dean-Day, J. M., Bui, T. P., and Anderson, J. G.: A case study of convectively sourced water vapor observed in the overworld stratosphere over the United States, J. Geophys. Res.-Atmos., 122, 9529–9554, https://doi.org/10.1002/2017jd026831, 2017. a
Spivakovsky, C. M., Logan, J. A., Montzka, S. A., Balkanski, Y. J., Foreman-Fowler, M., Jones, D. B. A., Horowitz, L. W., Fusco, A. C., Brenninkmeijer, C. A. M., Prather, M. J., Wofsy, S. C., and McElroy, M. B.: Three-dimensional climatological distribution of tropospheric OH: Update and evaluation, J. Geophys. Res.-Atmos., 105, 8931–8980, https://doi.org/10.1029/1999jd901006, 2000. a
Sturges, W. T., Oram, D. E., Carpenter, L. J., Penkett, S. A., and Engel, A.: Bromoform as a source of stratospheric bromine, Geophys. Res. Lett., 27, 2081–2084, https://doi.org/10.1029/2000gl011444, 2000. a
Trudinger, C. M., Etheridge, D. M., Sturrock, G. A., Fraser, P. J., Krummel, P. B., and McCulloch, A.: Atmospheric histories of halocarbons from analysis of Antarctic firn air: Methyl bromide, methyl chloride, chloroform, and dichloromethane, J. Geophys. Res.-Atmos., 109, D22310, https://doi.org/10.1029/2004jd004932, 2004. a
Vera, C., Higgins, W., Amador, J., Ambrizzi, T., Garreaud, R., Gochis, D., Gutzler, D., Lettenmaier, D., Marengo, J., Mechoso, C. R., Nogues-Paegle, J., Dias, P. L. S., and Zhang, C.: Toward a Unified View of the American Monsoon Systems, J. Climate, 19, 4977–5000, https://doi.org/10.1175/jcli3896.1, 2006. a
Vogel, B., Günther, G., Müller, R., Grooß, J.-U., Hoor, P., Krämer, M., Müller, S., Zahn, A., and Riese, M.: Fast transport from Southeast Asia boundary layer sources to northern Europe: rapid uplift in typhoons and eastward eddy shedding of the Asian monsoon anticyclone, Atmos. Chem. Phys., 14, 12745–12762, https://doi.org/10.5194/acp-14-12745-2014, 2014. a, b, c, d
Vogel, B., Günther, G., Müller, R., Grooß, J.-U., and Riese, M.: Impact of different Asian source regions on the composition of the Asian monsoon anticyclone and of the extratropical lowermost stratosphere, Atmos. Chem. Phys., 15, 13699–13716, https://doi.org/10.5194/acp-15-13699-2015, 2015. a, b
Vogel, B., Günther, G., Müller, R., Grooß, J.-U., Afchine, A., Bozem, H., Hoor, P., Krämer, M., Müller, S., Riese, M., Rolf, C., Spelten, N., Stiller, G. P., Ungermann, J., and Zahn, A.: Long-range transport pathways of tropospheric source gases originating in Asia into the northern lower stratosphere during the Asian monsoon season 2012, Atmos. Chem. Phys., 16, 15301–15325, https://doi.org/10.5194/acp-16-15301-2016, 2016. a, b, c, d, e
Vogel, B., Müller, R., Günther, G., Spang, R., Hanumanthu, S., Li, D., Riese, M., and Stiller, G. P.: Lagrangian simulations of the transport of young air masses to the top of the Asian monsoon anticyclone and into the tropical pipe, Atmos. Chem. Phys., 19, 6007–6034, https://doi.org/10.5194/acp-19-6007-2019, 2019. a, b, c, d, e
von Hobe, M., Ploeger, F., Konopka, P., Kloss, C., Ulanowski, A., Yushkov, V., Ravegnani, F., Volk, C. M., Pan, L. L., Honomichl, S. B., Tilmes, S., Kinnison, D. E., Garcia, R. R., and Wright, J. S.: Upward transport into and within the Asian monsoon anticyclone as inferred from StratoClim trace gas observations, Atmos. Chem. Phys., 21, 1267–1285, https://doi.org/10.5194/acp-21-1267-2021, 2021. a
Wales, P. A., Salawitch, R. J., Nicely, J. M., Anderson, D. C., Canty, T. P., Baidar, S., Dix, B., Koenig, T. K., Volkamer, R., Chen, D., Huey, L. G., Tanner, D. J., Cuevas, C. A., Fernandez, R. P., Kinnison, D. E., Lamarque, J.-F., Saiz-Lopez, A., Atlas, E. L., Hall, S. R., Navarro, M. A., Pan, L. L., Schauffler, S. M., Stell, M., Tilmes, S., Ullmann, K., Weinheimer, A. J., Akiyoshi, H., Chipperfield, M. P., Deushi, M., Dhomse, S. S., Feng, W., Graf, P., Hossaini, R., Jöckel, P., Mancini, E., Michou, M., Morgenstern, O., Oman, L. D., Pitari, G., Plummer, D. A., Revell, L. E., Rozanov, E., Saint-Martin, D., Schofield, R., Stenke, A., Stone, K. A., Visioni, D., Yamashita, Y., and Zeng, G.: Stratospheric Injection of Brominated Very Short-Lived Substances: Aircraft Observations in the Western Pacific and Representation in Global Models, J. Geophys. Res.-Atmos., 123, 5690–5719, https://doi.org/10.1029/2017jd027978, 2018. a
Wang, X., Randel, W., and Wu, Y.: Infrequent, Rapid Transport Pathways to the Summer North American Upper Troposphere and Lower Stratosphere, Geophys. Res. Lett., 48, e2020GL089763, https://doi.org/10.1029/2020gl089763, 2021. a, b, c, d, e
Weinstock, E. M., Pittman, J. V., Sayres, D. S., Smith, J. B., Anderson, J. G., Wofsy, S. C., Xueref, I., Gerbig, C., Daube, B. C., Pfister, L., Richard, E. C., Ridley, B. A., Weinheimer, A. J., Jost, H.-J., Lopez, J. P., Loewenstein, M., and Thompson, T. L.: Quantifying the impact of the North American monsoon and deep midlatitude convection on the subtropical lowermost stratosphere using in situ measurements, J. Geophys. Res., 112, D18310, https://doi.org/10.1029/2007jd008554, 2007. a, b
Werner, A., Volk, C. M., Ivanova, E. V., Wetter, T., Schiller, C., Schlager, H., and Konopka, P.: Quantifying transport into the Arctic lowermost stratosphere, Atmos. Chem. Phys., 10, 11623–11639, https://doi.org/10.5194/acp-10-11623-2010, 2010. a
Wetzel, G., Friedl-Vallon, F., Glatthor, N., Grooß, J.-U., Gulde, T., Höpfner, M., Johansson, S., Khosrawi, F., Kirner, O., Kleinert, A., Kretschmer, E., Maucher, G., Nordmeyer, H., Oelhaf, H., Orphal, J., Piesch, C., Sinnhuber, B.-M., Ungermann, J., and Vogel, B.: Pollution trace gases C2H6, C2H2, HCOOH, and PAN in the North Atlantic UTLS: observations and simulations, Atmos. Chem. Phys., 21, 8213–8232, https://doi.org/10.5194/acp-21-8213-2021, 2021. a
WMO: Scientific Assessment of Ozone Depletion: 2018, Global Ozone Research and Monitoring Project-Report No. 56, Tech. rep., WMO, Geneva, Switzerland, ISBN 978-1-7329317-1-8, 2018. a
Woodbridge, E. L., Elkins, J. W., Fahey, D. W., Heidt, L. E., Solomon, S., Baring, T. J., Gilpin, T. M., Pollock, W. H., Schauffler, S. M., Atlas, E. L., Loewenstein, M., Podolske, J. R., Webster, C. R., May, R. D., Gilligan, J. M., Montzka, S. A., Boering, K. A., and Salawitch, R. J.: Estimates of total organic and inorganic chlorine in the lower stratosphere from in situ and flask measurements during AASE II, J. Geophys. Res., 100, 3057, https://doi.org/10.1029/94jd02744, 1995. a
Worton, D. R., Sturges, W. T., Schwander, J., Mulvaney, R., Barnola, J.-M., and Chappellaz, J.: 20th century trends and budget implications of chloroform and related tri-and dihalomethanes inferred from firn air, Atmos. Chem. Phys., 6, 2847–2863, https://doi.org/10.5194/acp-6-2847-2006, 2006. a
Yihui, D. and Chan, J. C. L.: The East Asian summer monsoon: an overview, Meteorol. Atmos. Phys., 89, 117–142, https://doi.org/10.1007/s00703-005-0125-z, 2005. a
- Abstract
- Introduction
- Airborne observations and model simulations
- Results
- Discussion
- Conclusions
- Appendix A: Absolute fractions of surface origin tracers
- Appendix B: Back-trajectory locations at boundary layer
- Appendix C: CHCl3–N2O relationship vs. measurements from the AGAGE network
- Data availability
- Author contributions
- Competing interests
- Disclaimer
- Special issue statement
- Acknowledgements
- Financial support
- Review statement
- References