the Creative Commons Attribution 4.0 License.
the Creative Commons Attribution 4.0 License.
 | 10 Feb 2022
Aerosol radiative impact during the summer 2019 heatwave produced partly by an inter-continental Saharan dust outbreak – Part 2: Long-wave and net dust direct radiative effect
Carmen Córdoba-Jabonero
María-Ángeles López-Cayuela
Albert Ansmann
Adolfo Comerón
María-Paz Zorzano
Alejandro Rodríguez-Gómez
Constantino Muñoz-Porcar
This paper is the companion paper of Córdoba-Jabonero et al. (2021). It deals with the estimation of the long-wave (LW) and net dust direct radiative effect (DRE) during the dust episode that occurred between 23 and 30 June 2019 and was paired with a mega-heatwave. The analysis is performed at two European sites where polarized micro-pulse lidars ran continuously to retrieve the vertical distribution of the dust optical properties: Barcelona, Spain, 23–30 June, and Leipzig, Germany, 29–30 June. The radiative effect is computed with the GAME (global atmospheric model) radiative transfer model separately for the fine- and coarse-mode dust. The instantaneous and daily radiative effect and radiative efficiency (DREff) are provided for the fine-mode, coarse-mode and total dust at the surface, top of the atmosphere (TOA) and in the atmosphere. The fine-mode daily LW DRE is low (< 6 % of the short-wave (SW) component), which makes the coarse-mode LW DRE the main modulator of the total net dust DRE. The coarse-mode LW DRE starts exceeding (in absolute values) the SW component in the middle of the episode, which produces positive coarse-mode net DRE at both the surface and TOA. Such an unusual tendency is attributed to increasing coarse-mode size and surface temperature throughout the episode. This has the effect of reducing the SW cooling in Barcelona up to the point of reaching total net positive dust DRE (+0.9 W m−2) on one occasion at the surface and quasi-neutral (−0.6 W m−2) at TOA. When adding the LW component, the total dust SW radiative efficiency is reduced by a factor of 1.6 at both surface (on average over the episode the total dust net DREff is −54.1 W m−2 τ−1) and TOA (−37.3 W m−2 τ−1). A sensitivity study performed on the surface temperature and the air temperature in the dust layer, both linked to the heatwave and upon which the LW DRE strongly depends, shows that the heatwave contributed to reducing the dust net cooling effect at the surface and that it had nearly no effect at TOA. Its subsequent effect was thus to reduce the heating of the atmosphere produced by the dust particles.
- Article
(5416 KB) - Full-text XML
- Companion paper
- BibTeX
- EndNote


Without doubt, extreme air temperatures impact mortality (Basu and Samet, 2002), as well as mineral dust intrusions (Díaz et al., 2017). Studies of heatwaves and elevated temperatures episodes indicate that the main underlying mechanism leading to death is that stress on the cardiovascular and respiratory systems increases during periods of high air temperature (Kunst et al., 1993). During periods of mineral dust outbreaks, the effect on human health is associated with the biological matter and microorganisms transported by the dust plume that can be harmful to humans (Griffin, 2007) and/or with the increase in the particulate matter load at ground level when dust is present (Tobías et al., 2011). When both atmospheric phenomena (heatwave and mineral dust intrusion) occur simultaneously, their effects may cumulate. A place on Earth with a high population density and a high probability that both phenomena occur at the same time is southern Europe because of its proximity to the North African deserts, the largest source of mineral dust on Earth (Prospero et al., 2002). In addition it has been recently demonstrated that the surface temperature of the European continent has had an increasing trend since 1980 (Landi et al., 2021).
A recent study from Sousa et al. (2019) quantifies the proportion of Saharan dust intrusions over southwestern Europe since 2000 which were actually accompanied by a heatwave. They find that 39 % and 14 % of the Saharan dust intrusions over the western and eastern Iberian Peninsula (IP), respectively, were paired with a heatwave. Although dust outbreaks are more frequent in the eastern (868 cases) than in the western IP (295 cases), their transport towards the eastern IP is often characterized by an accentuated southwest–northeast tilt in the mean position of the 580 dam geopotential height thickness, which favors heatwaves in the central Mediterranean, with little incidence in the eastern IP. In their introduction Sousa et al. (2019) stress “an incomplete description of the relationship between such air masses [Saharan dust] originated in the desertic region of northwestern Africa and heatwave episodes” in the IP.
A recent event of heatwave accompanied by a Saharan dust intrusion occurred in June 2019. The event was outstanding in the sense that temperature records were broken in several places in Europe. The month of June 2019 is still the hottest June ever recorded at the European level (Copernicus, 2021). Average temperatures were more than 2 ∘C above normal, and if we consider the 5 d period 25–29 June, the temperatures were 6 to 10 ∘C above normal, with local differences even higher in northeastern Spain, France and the United Kingdom according to a detailed article issued by the Spanish state meteorological agency (AEMET) on the “June 2019 heatwave in the context of the climate crisis” (AEMET, 2021). Although quite recent, the heatwave of 25–29 June 2019, classified as a mega-heatwave by Sousa et al. (2019) and Xu et al. (2021), has already been the subject of several studies. P. Xu et al. (2020, 2021) quantified the role of dynamical and thermodynamical processes in triggering this extreme event and investigated how changes in these processes observed over the last decades may have affected the occurrence probability of such extreme events. Ma et al. (2020) and Vautard et al. (2020) used climate models to quantify the role of human contribution through the anthropogenic climate change. Sousa et al. (2019) studied the relationship between heatwaves and Saharan warm air intrusions in the IP in the long-term context. Finally Córdoba-Jabonero et al. (2021) studied the short-wave (SW) dust direct radiative effect during 23–30 June 2019 at two sites in Barcelona (BCN), Spain, and Leipzig (LPZ), Germany.
The present paper is the companion paper of Córdoba-Jabonero et al. (2021). It deals with the estimation of the long-wave and net dust direct radiative effect during 23–30 June 2019. This second part of the study is motivated by the high temperatures caused by the heatwave paired with the dust event. Indeed, high temperature, clear skies and high insolation imply high land surface temperature and thus strong long-wave radiation emission. The paper is organized as follows: the description and discussion of the dust microphysical and optical properties in the long-wave spectral range are exposed in Sect. 2 (instruments, methodology and radiative effects in the short-wave spectral range can be found in the companion paper); Sect. 3.1 includes the results in terms of long-wave and net dust direct radiative effect and radiative efficiency, and Sect. 3.2 presents a sensitivity study on the relationship between heatwave (by means of surface temperature and air temperature in the dust layer) and coarse-mode long-wave and total dust radiative effects. Conclusions are given in Sect. 4.
The long-wave (LW) module of the GAME (global atmospheric model) radiative transfer model (Dubuisson et al., 1996, 2004, 2005) has been used in a recently increasing number of studies (Sicard et al., 2014a, b; Barragan et al., 2016, 2017, 2020; Granados-Muñoz et al., 2019a, b). GAME calculates spectrally integrated upward and downward radiative fluxes in 40 plane and homogeneous layers from 0 to 100 km with a 1 km resolution from 0 to 25 km and a coarser resolution above. Spectral limits were set in terms of wavenumber from 200 to 2500 cm−1 (wavelength: 4–50 µm) at a fixed resolution of 20 cm−1 (115 points). GAME accounts for thermal emission, absorption and scattering, as well as their interactions, using the discrete ordinates method (DISORT) (Stamnes et al., 1988). Gaseous absorption (H2O, CO2, O3, N2O, CO, CH4 and N2) is treated from the correlated k distribution (Lacis and Oinas, 1991). More details of the long-wave module of GAME can be found in Sicard et al. (2014a). GAME presents the advantage of the complete representation of the long-wave aerosol scattering, in addition to their absorption. The moderate spectral resolution of GAME makes it possible to account for the spectral variations in aerosol properties, especially in the infrared window. The spectral optical properties of aerosols are defined for each atmospheric layer where dust is present: the single scattering albedo (SSA) and the asymmetry factor (asyF) are assumed to be constant vertically; the extinction coefficient (α) varies with altitude. GAME outgoing (i.e., leaving the terrestrial atmosphere) long-wave radiation (OLR) was validated through comparison with CERES (Clouds and the Earth's Radiant Energy System) OLR measurements in 11 cases of dust intrusion in Barcelona (Sicard et al., 2014a). Their results indicate a bias between simulated and measured OLR of −0.8 W m−2 and a root mean square error of 2.52 W m−2.
The convention followed for the definition of the dust direct radiative effect (DRE) at either the surface (SRF) or the top of the atmosphere (TOA) is the one of Eq. (9) of Córdoba-Jabonero et al. (2021). The atmospheric (ATM) DRE is the difference between the TOA DRE and the SRF DRE. To simplify abbreviations the short-wave, long-wave and net (short-wave + long-wave) DREs are noted DRESW, DRELW and DRENET, respectively.
GAME is used to calculate the instantaneous long-wave radiative effect on an hourly basis over the 8 d of the event in Barcelona (23–30 June) and over 2 d in Leipzig (29 June, Episode 1, and 30 June, Episode 2; see Córdoba-Jabonero et al., 2021). In the rest of this section the dust microphysical and radiative properties are sometimes averaged over the whole event. For Barcelona this means from 23 to 30 June or from 24 to 29 June in order to avoid the beginning and the end of the dust intrusion when abrupt changes in the microphysics and radiative properties are expected. In Leipzig the dust microphysical and radiative properties are averaged over the afternoons of 29 and 30 June (when the dust was present; see Figs. 5 and 6 of Córdoba-Jabonero et al., 2021), respectively noted 29J-pm and 30J-pm, corresponding to the two dust episodes described in the former reference. In all cases the averaging period is always indicated.
2.1 Dust microphysics
The dust radiative properties in the long-wave spectral range were computed using a Mie code in the range 4–50 µm. Our Mie code needs as input parameters the geometric median radius, rg, and its standard deviation, σg, of the lognormal distribution, the particle number, and the spectrally resolved refractive index. The code computes the extinction coefficient normalized to that at 532 nm (the wavelength of the lidar system used in this study) spectrally resolved in the range 4–50 µm, , the single scattering albedo and the asymmetry factor. Although the particle number is provided as input, it has no effect on our calculations since SSA and asyF are intensive parameters and the extinction is normalized to that at 532 nm; thus the dependence on the particle number is removed. We distinguish between the dust coarse-mode (Dc) and the dust fine-mode (Df). The total dust (DD) is the sum of both Dc and Df components.
The spectral refractive index (real and imaginary part) is the same as in Sicard et al. (2014a) and comes from measurements of long-range transport mineral dust taken in Meppen in western Germany (Volz, 1983). The table giving the refractive index as a function of the wavelength was found in Krekov (1993). The spectral variation in both real and imaginary parts of the refractive index can be seen in Fig. 1 of Sicard et al. (2014a).
For each of the coarse and fine modes, the geometric median radius and the standard deviation were estimated from column-integrated AERONET retrievals. AERONET provides volume median radius, rV, and its standard deviation, σV. The geometric median radius and standard deviation were calculated as follows:
AERONET V3L2.0 data were used at both sites. A total of 36 retrievals are available in BCN over the period 23–30 June, and 13 retrievals are available in LPZ for both days of 29 and 30 June. To have an hourly estimation of both rg and σg both parameters were interpolated. Both retrievals and hourly interpolated values for rV, σV and rg are represented as a function of time in Fig. 1 at both sites and for both size modes. In BCN, the mean (over 23–30 June) Dc and Df geometric median radii (and standard deviation) are 1.262 (0.652) and 0.063 (0.600) µm, respectively; in LPZ we find the following for the mean of 29J-pm and 30J-pm: rg(Dc)=1.399 µm (σg(Dc)=0.680) and rg(Df)=0.032 µm (σg(Df)=0.505). Interestingly, the mean large dust particles in LPZ are larger than in BCN, and their sizes are distributed over a larger scatter interval; rg(Dc) in LPZ on 29J-pm and 30J-pm (∼ 1.4 µm) is similar to rg(Dc) in BCN on 29 and 30 June, possibly indicating a conservation of the coarse-mode size distribution during transport between both sites. The small dust particles in LPZ are on average much smaller than in BCN (Fig. 1b). It is known that dust aging encompasses many processes that can alter the dust chemical composition, shape and size. In particular, when the transport of mineral dust occurs over polluted regions anthropogenic inorganic acids can be absorbed by the dust surface forming hygroscopic salt compounds that coat the dust particles (Abdelkader et al., 2015; Athanasopoulou et al., 2016). Dust also favors the formation of secondary pollutants (Querol et al., 2019; W. Xu et al., 2020). Both processes (acid absorption and secondary aerosol formation) can lead to dust particle growth in different size ranges.
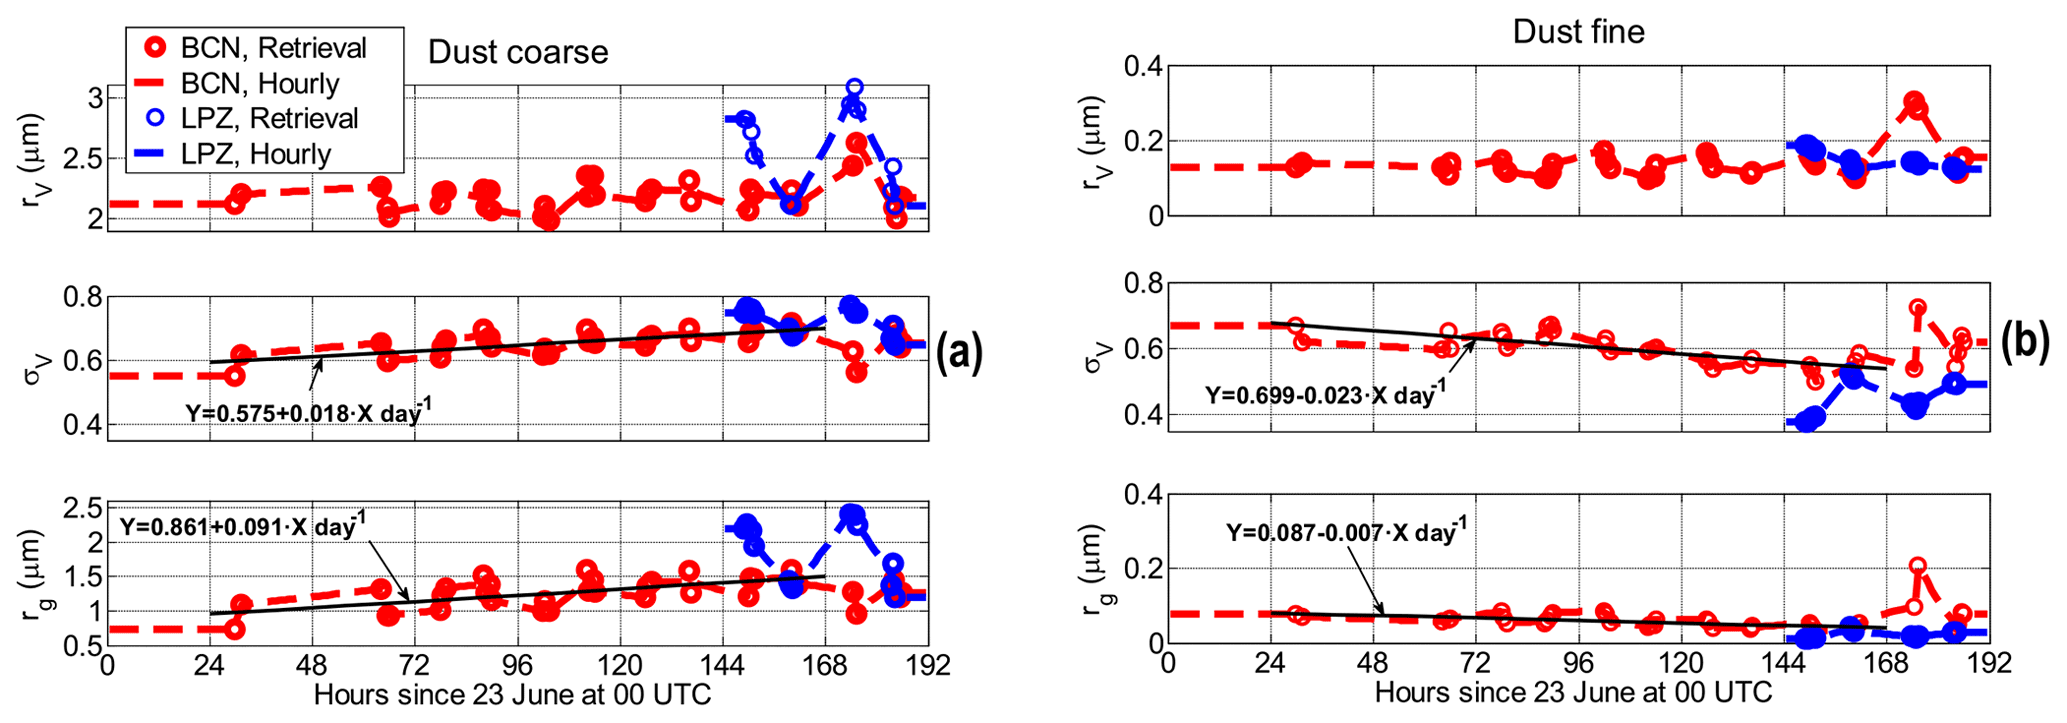
Figure 1AERONET volume median radius and standard deviation and corresponding geometric median radius in BCN (red) and LPZ (blue) for (a) the coarse mode and (b) the fine mode. Circles indicate retrievals, and the dashed lines represent the hourly interpolated data. The legend in the first plot applies to all plots. The black lines are a linear fit of the retrievals in BCN over the period 24–29 June.
Secondary aerosol formation is enhanced in stagnant (low winds) and high-humidity conditions (W. Xu et al., 2020). NCEP (National Centers for Environmental Prediction) reanalysis horizontal wind in BCN (not shown) reveals strong winds (∼ 18 m s−1) at the beginning of the episode and much more stagnant conditions (<5 m s−1) towards the end of the episode. All in all, such conditions might have favored the transfer of small dust particles to larger sizes and the growth of coarse-mode particles throughout the transport. A linear fit (black lines in Fig. 1) has been applied to the BCN retrievals of rg and σg over the period 24–29 June in order to avoid the beginning and the end of the dust intrusion when abrupt changes in the microphysics are expected. Coarse and fine modes have opposite tendencies: rg(Dc) increases at a rate of almost +10 % d−1, and its scatter interval (σg) also increases (∼ +2 % d−1); rg(Df) slightly decreases (at a rate of ∼ −1 % d−1) and its scatter interval (σg) also decreases (∼ −2 % d−1). The coarse-mode radius increase and widening reflect the possible size growth mentioned earlier that might have occurred during the dust transport. This fact is also nicely illustrated in Fig. 2 in which both daily Dc and Df normalized size distributions are represented on a day-by-day basis. One sees clearly how the Dc radii increase between 24 and 29 June, while the Df radii decrease during the same period. Although the decreasing rate of the Df radius throughout the event is small (<1 % d−1), its representation in a logarithmic scale (x axis) in Fig. 2 shows clearly that it is noteworthy.
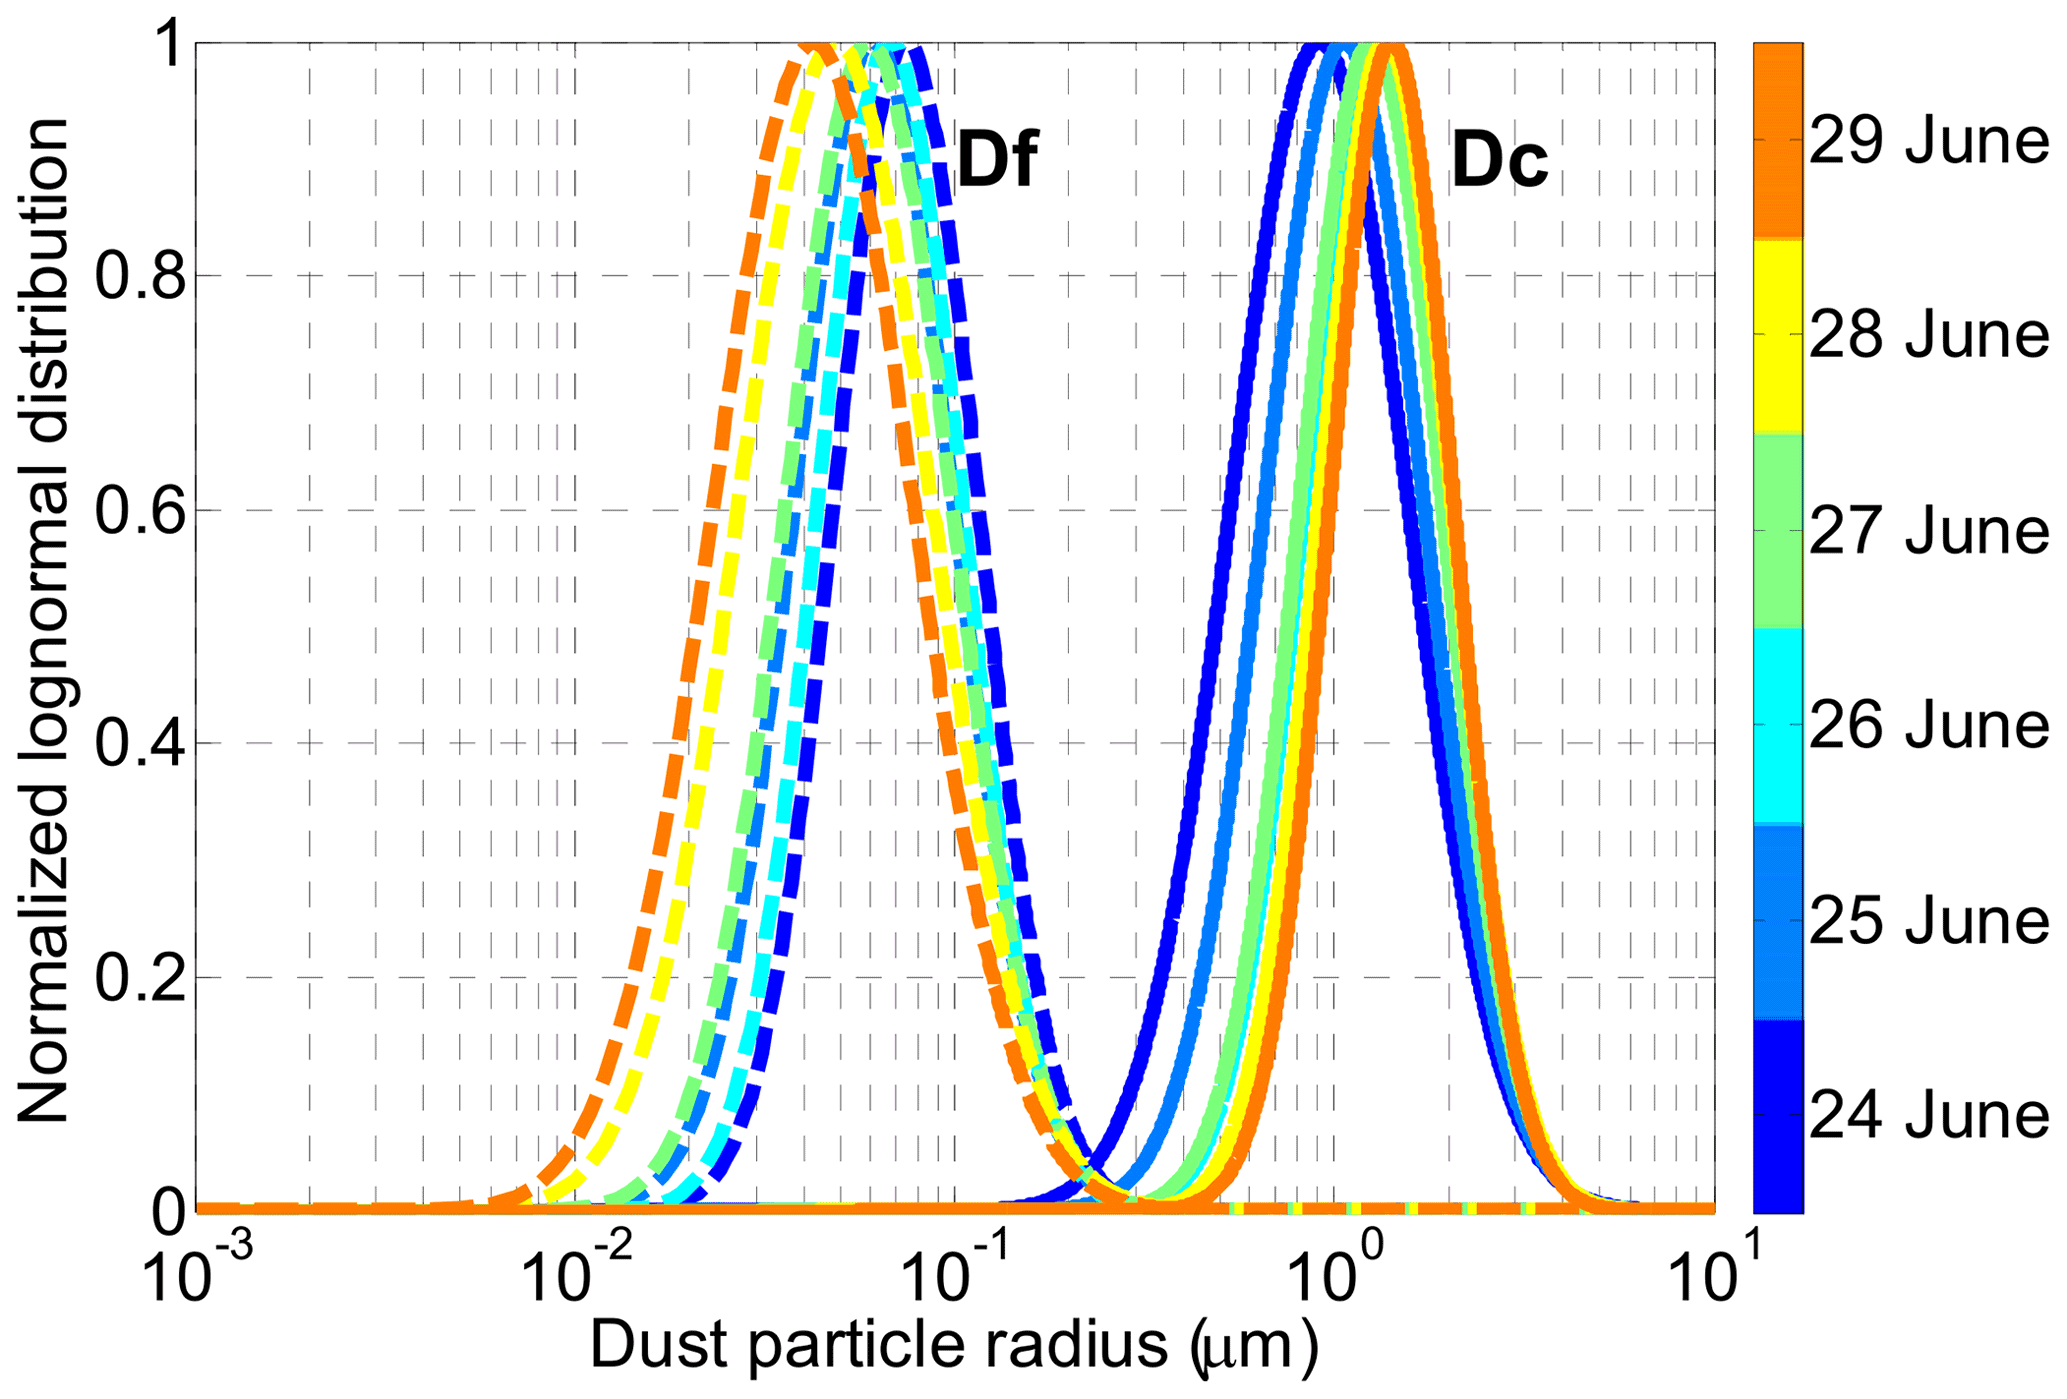
Figure 2Day-by-day evolution of the daily mean normalized lognormal distributions in Barcelona between 24 and 29 June calculated with the daily mean (rg, σg) of Dc (solid lines) and Df (dashed lines).
2.2 Dust radiative properties in the long-wave spectral range
With the microphysics defined in the previous section, spectral dust radiative properties (α, SSA and asyF) in the long-wave spectral range are calculated with the Mie code on an hourly basis at both sites. Results are presented in Fig. 3 separately at BCN and LPZ and for Dc and Df. In BCN a color code is used for each curve corresponding to the number of hours past since the beginning of the period considered: 23 June at 00:00 UTC. In LPZ the average of 29J-pm (Episode 1) and 30J-pm (Episode 2) is shown. The effect of the increasing rg(Dc) throughout the dust event in BCN is visible on the Dc extinction plot (Fig. 3a, top subpanel): is smaller at the beginning of the event (blue-green curves below the mean) than at the end (red-brown curves above the mean). The main differences between Dc and Df are as follows: the Df extinction is at least 3 orders of magnitude smaller than the Dc one (in LPZ it is even smaller); Df SSA converges rapidly towards 0 with increasing wavelengths and so does Df asyF. Differences between BCN and LPZ are essentially due to the differences in the dust radii at each site: the mean Dc extinction in BCN is slightly lower than in LPZ (rg(Dc) is smaller in BCN than in LPZ), and the mean Df extinction in BCN is larger than in LPZ (rg(Df) is twice as large in BCN than in LPZ). SSA and asyF are similar at both sites.

Figure 3Spectral normalized extinction, , SSA and asyF in BCN for (a) Dc and (b) Df and in LPZ for (c) Dc and (d) Df. In BCN all hourly calculations are represented: 192 (8 d). In LPZ the average of 29J-pm (Episode 1) and 30J-pm (Episode 2) is represented. In the BCN plots the thick black line represents the mean over the whole period (23–30 June).
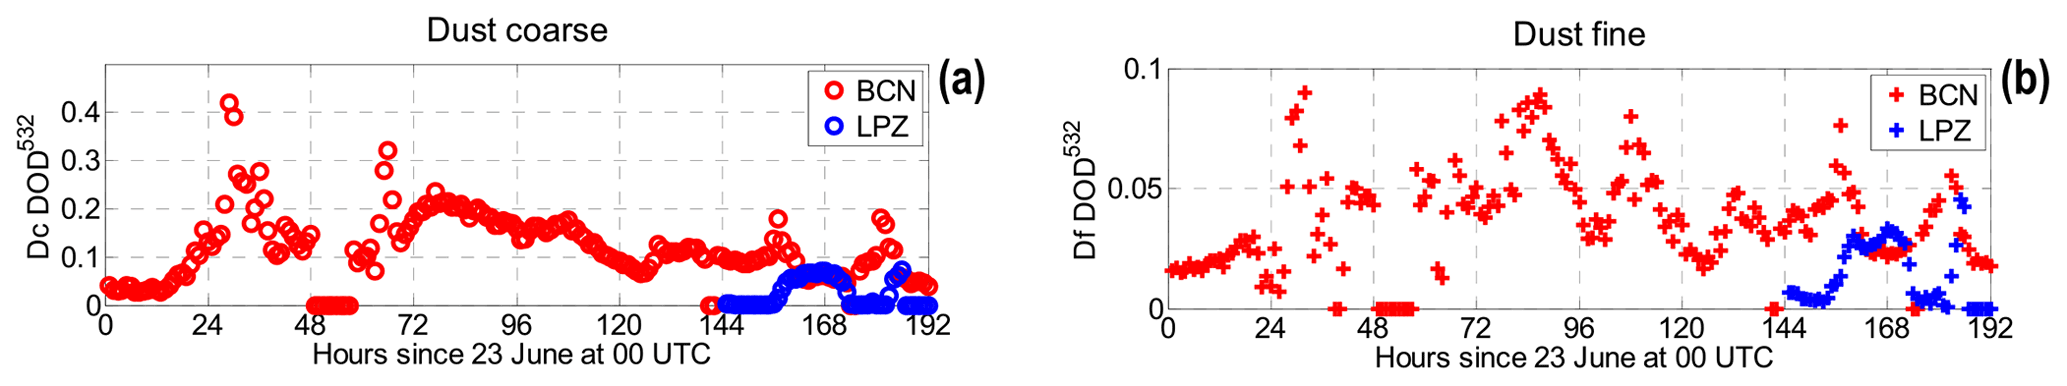
Figure 4Hourly dust optical depth calculated from the extinction profiles for (a) the coarse mode and (b) the fine mode obtained using the POLIPHON algorithm in BCN (red) and LPZ (blue).
The profiles of extinction coefficients at 532 nm for both coarse and fine modes were taken from the POLIPHON inversion performed by Córdoba-Jabonero et al. (2021); α532(Dc) and α532(Df) are averaged in 1 km layer mean values from 0 to 10 km and then input in GAME. In each layer GAME calculates the LW spectral extinction by multiplying the measured α532 by the calculated normalized extinction, . Figure 4 represents the Dc and Df dust optical depth (DOD) at 532 nm at both sites. In BCN Dc and Df DOD peak at 0.420 and 0.090, respectively. In LPZ both episodes are much more moderate (DOD(Dc) peaks at 0.072 and DOD(Df) at 0.045). Except on 24 and 25 June, the Dc DOD variations in BCN are smooth; for the fine mode, DOD swings up and down. In LPZ, DOD outside the dust episodes is very small (<0.006).
To get an idea of the dust stratification, we plot in Fig. 5 the dust layer center of mass (CoM) of both size modes and at both sites. A striking feature is the shape similarity in BCN between Dc DOD (Fig. 4a) and Dc CoM (Fig. 5a). Such similarity is usually not expected and probably reflects the homogeneous vertical mixing of the dust plume arriving in BCN all throughout the intrusion. In BCN the Dc and Df CoM values are quite similar. A peak at ∼ 4 km is observed at the beginning of the event, and next a general temporal decreasing tendency is observed. Towards the end of the intrusion CoM is ∼ 2 km. In LPZ the centers of mass of the Dc layer are similar to those in BCN at the beginning of the event (23–24 June). Dc CoM of Episode 1 (3.7–4.5 km) is higher than that of Episode 2 (3.3–3.6 km) as noted by Córdoba-Jabonero et al. (2021). It is noteworthy to mention that the dust CoM in BCN falls within the climatological dust bottom and top heights, 1.5 and 3.5 km, respectively, estimated by Papayannis et al. (2008) from lidar measurements in BCN.
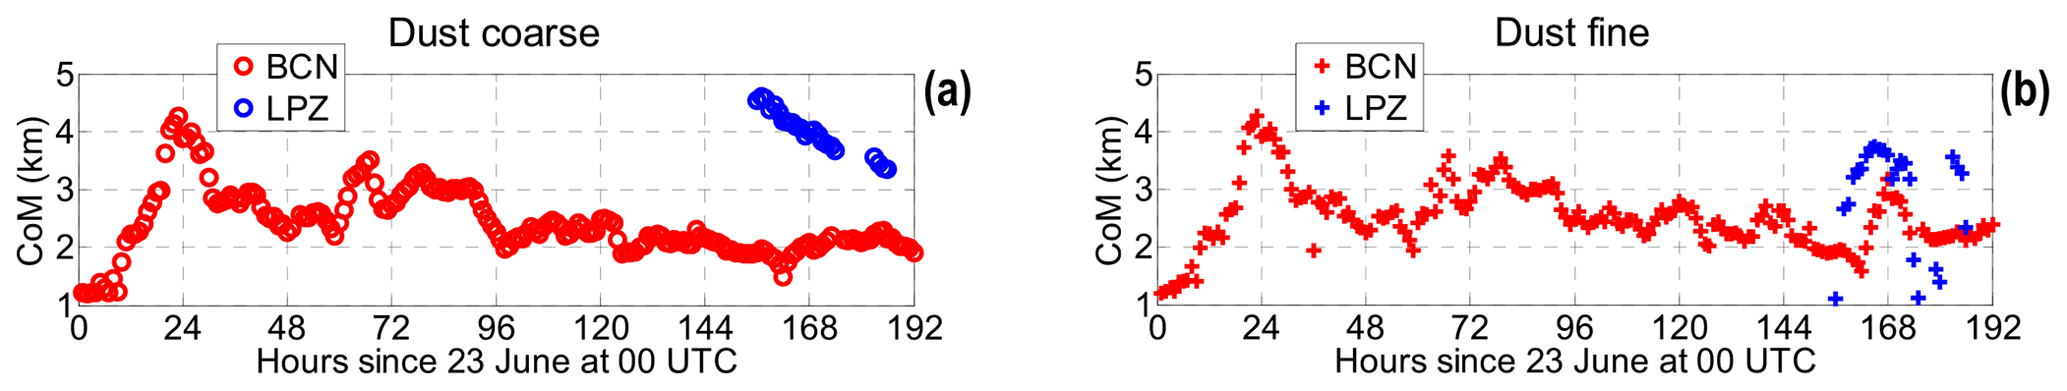
Figure 5Hourly dust layer center of mass (CoM) for (a) the coarse mode and (b) the fine mode in BCN (red) and LPZ (blue).
2.3 GAME parametrization
Finally the rest of input in GAME are the atmospheric profiles and the Earth surface properties. The gas absorption is parameterized from profiles of pressure, temperature and relative humidity. In BCN, radiosoundings launched twice a day (at 00:00 and 12:00 UTC) by the University of Barcelona in collaboration with the Servei Meteorològic de Catalunya, the Catalonia meteorological agency, were used. No radiosoundings are available in LPZ; thus the 6 h profiles from the Global Data Assimilation System (GDAS) provided by the National Oceanic and Atmospheric Administration (NOAA) were used instead.
The Earth surface is assumed Lambertian in GAME, and its albedo in the long-wave spectral range was set to a constant value of 0.017. This value corresponds to the climatological value found by Sicard et al. (2014a) in Barcelona from CERES measurements in the spectral window 8.1–11.8 µm and averaged over spring and summer seasons in the period June 2007–May 2012. The same value was used at both sites, and the explanation behind this is that the long-wave surface albedo is quite stable over the whole European continent as shown by Zhou et al. (2013).
We used the hourly land surface temperature (LST) V2 product provided globally at 5 km resolution by the Copernicus Global Land Service (https://land.copernicus.eu/global/products/lst, last access: 7 February 2022). The LST V2 datasets are estimated from TOA brightness temperatures from the infrared spectral channels of a constellation of geostationary satellites, Meteosat Second Generation being the one covering Europe. Its estimation further depends on the albedo, the vegetation cover and the soil moisture. Further details about the temperature retrieval can be found in Freitas et al. (2013). The LST V2 product user manual and validation reports can be found at https://land.copernicus.eu/global/products/lst?qt-lst_characteristics=5#qt-lst_characteristics (last access: 7 February 2022). Figure 6 shows the hourly LST in Barcelona (23–30 June) and Leipzig (29–30 June). The diurnal cycle is nicely visible at both sites on all days. In Barcelona the temperature steadily increases between 23 and 28 June. On 29 June the LST starts its decrease. A maximum LST of 45.22 ∘C is reached in the afternoon of 28 June. In Leipzig the LST increase is even more pronounced than in Barcelona. The maximum night/day LST difference is 32.2 ∘C on 29 June and the maximum LST (46.2 ∘C) is reached in the afternoon of 30 June.
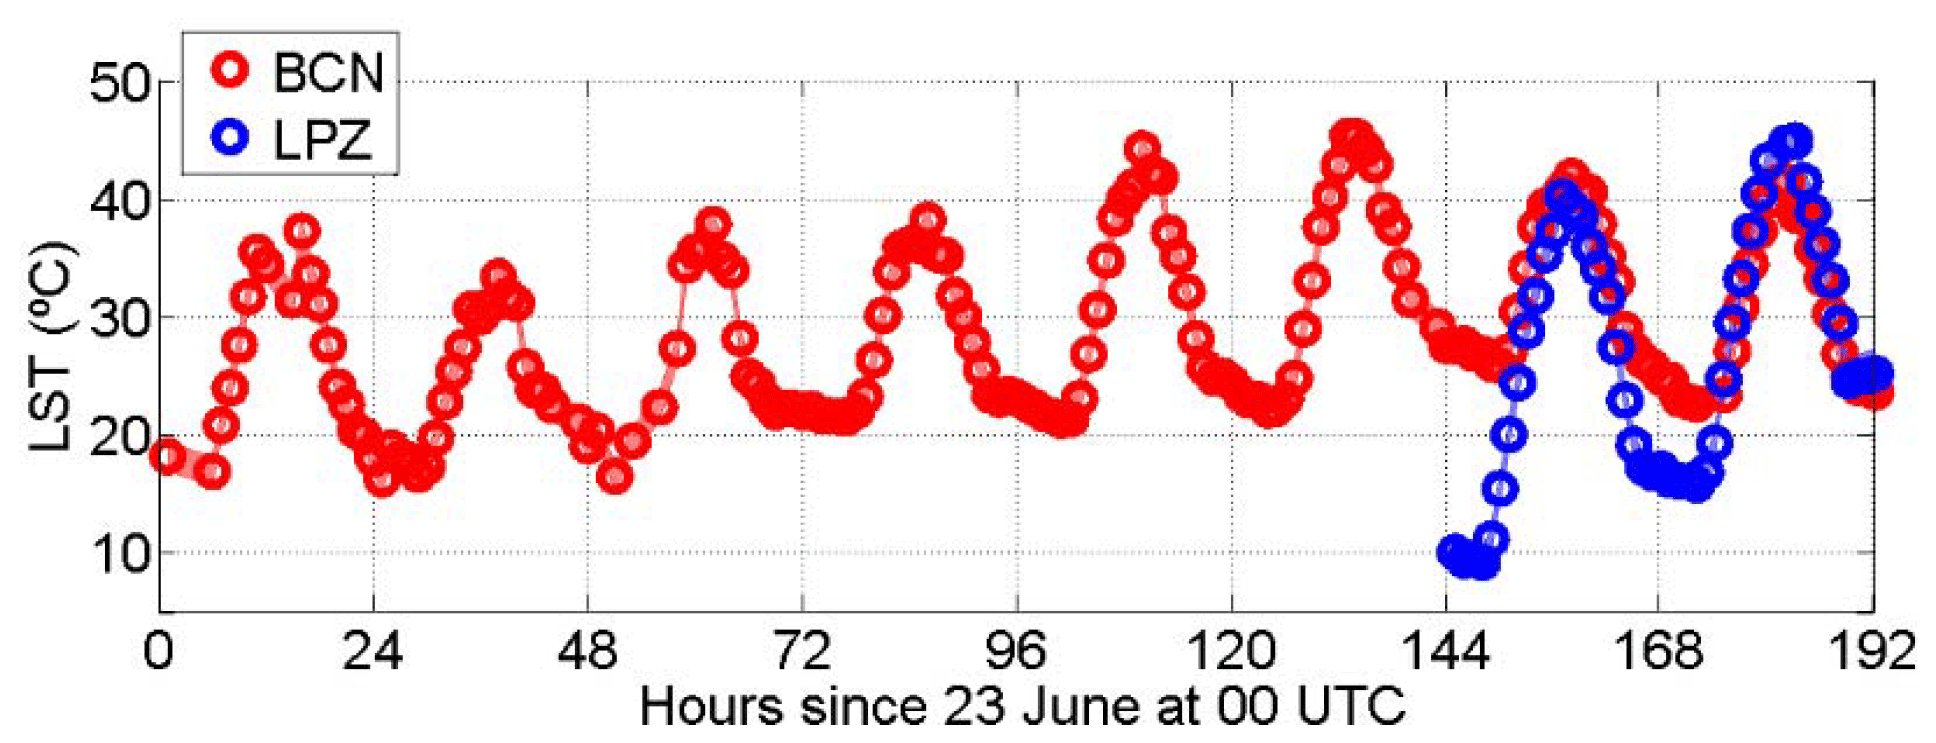
Figure 6Hourly LST in BCN (red) and LPZ (blue). The associated uncertainty is added as a shaded area, although it is so small that it is almost imperceptible.
The results are first discussed for the long-wave spectral range and for the whole spectral range (net effect = short-wave + long-wave) in terms of dust direct radiative effect (Sect. 3.1.1) and then in terms of radiative efficiency (Sect. 3.1.2), and a deeper analysis is performed at the BCN site (Sect. 3.2). All short-wave magnitudes were taken from the Part 1 paper by Córdoba-Jabonero et al. (2021). Instantaneous and daily averages are presented. Instantaneous values are calculated from 05:00 to 19:00 UTC because GAME calculates short-wave and long-wave fluxes only during the hours of sunshine (daytime) as it computes both components of the sun. Daily averages in the short-wave are calculated as the mean (over 24 h) of the 15 instantaneous daytime values. The assumption is made here that short-wave fluxes during nighttime are zero. Daily averages in the long-wave are more difficult to estimate because long-wave fluxes during nighttime are not zero unlike in the short-wave. They were calculated as the mean (over 15 h) of the 15 instantaneous daytime values. The assumption behind this calculation is that the nighttime long-wave fluxes are equal to the mean of the daytime fluxes. A similar assumption has been made by Di Sarra et al. (2011) who averaged instantaneous DRELW obtained every 6 h and by Meloni et al. (2015) who assumed their instantaneous DRELW retrieval constant throughout the 24 h.
3.1 Long-wave and net dust direct radiative effect
3.1.1 Dust direct radiative effect
The calculations of the instantaneous dust DRELW are presented as a function of time in both BCN and LPZ in Fig. 7 separately for Dc, Df and DD and at SRF, TOA and in the atmosphere. At BCN site we also plot the temporal evolution of the Df DD DRELW ratio throughout the 8 d of the event. Daily values of Dc, Df and DD DRELW are reported at SRF in Table 1 and at TOA in Table 2. Both size modes produce a positive radiative effect at both SRF and TOA. Except on a couple of occasions on 25 June, DRELW at SRF is always larger than at TOA, resulting in a negative atmospheric DRELW, an indicator of a cooling effect of the atmosphere.

Figure 7Long-wave instantaneous dust direct radiative effect (DRELW) at SRF, TOA and in the atmosphere (ATM) in (a) BCN and (b) LPZ. (c) Df DD DRE ratio of the instantaneous DRELW at the SRF and TOA in BCN; the mean values and best linear fits have been calculated between 24 and 30 June. The absolute decrease in Df DD DRELW ratio at the SRF (TOA) is −0.2 (−0.1) % d−1.
Independently of the atmospheric level where it is estimated, the Df DRELW is small: it is in general more than 1 order of magnitude smaller than Dc DRELW, and it is smaller at TOA than at SRF. In BCN LW Df instantaneous values do not exceed +0.6 W m−2 (at SRF; Fig. 7), and the daily values are smaller than +0.42 W m−2 (Table 1). Instantaneous Df DRELW values are in the range of values that Sicard et al. (2014b) also estimated for the dust fine mode: [+0.4; +0.7 W m−2] and [+0.1; +0.3 W m−2] at SRF and TOA, respectively. In LPZ instantaneous (daily) Df DRELW values are smaller than +0.2 (+0.08) W m−2. In BCN the contribution of Df DRELW to the total dust DRELW is smaller than 5 %–6 % (Fig. 7c). On average over the period 24–30 June (23 June is discarded because it is the day the dust arrived in BCN) it is 3.6 % and 2.5 % at SRF and TOA, respectively, and it seems to slightly decrease with time throughout the event (negative slope of the fittings in Fig. 7c). Hence Df DRELW is expected to have a very little effect on DRENET with respect to Dc DRELW. This is also true with respect to Df DRESW as nicely illustrated in Fig. 8 which shows for Dc, Df and DD the daily LW SW DRE ratio in absolute value at SRF, TOA and ATM. In the middle plot (Df) the LW SW DRE ratio is not higher than 10.0 % and 5.2 % at SRF and TOA, respectively. The average over the whole event is 6.7 % and 3.7 % at SRF and TOA, respectively. Note that the decrease in the Df-to-DD DRELW ratio with respect to time (opposite of what was observed for DRESW; see Córdoba-Jabonero et al., 2021) is due to a combination of various factors such as rg(Dc) (increases), rg(Df) (decreases), Dc DOD (decreases) and Df DOD (constant).
Unlike the Df component, Dc DRELW is quite significant. It is also smaller at TOA than at SRF. In BCN Dc instantaneous values reach +11.4 W m−2 (at SRF), and the daily values are as high as +9.8 W m−2. In LPZ the instantaneous and daily values (at SRF) do not exceed +3.3 and +1.3 W m−2, respectively. For comparison, Sicard et al. (2014b) found instantaneous Dc DRELW values in the range [+2.7; +10.2] and [+0.5; +4.7 W m−2] at SRF and TOA, respectively. As far as the daily LW SW Dc DRE ratio is concerned (Fig. 8), one sees that at both SRF and TOA it increases with time throughout the event. It is ∼ 80 % (at both SRF and TOA) on the first day of the event, and it reaches 170 % at SRF (on 28 June) and 183 % at TOA (on 30 June). On the last 4 d of the event, the daily LW SW Dc DRE ratio is higher than 119 %, indicating that Dc DRESW is going to be fully compensated by Dc DRELW and that, on the daily time scale, the sign of Dc DRENET will be that of the long-wave component, i.e., a positive (warming) DRE. This result is further explored in Sect. 3.2.
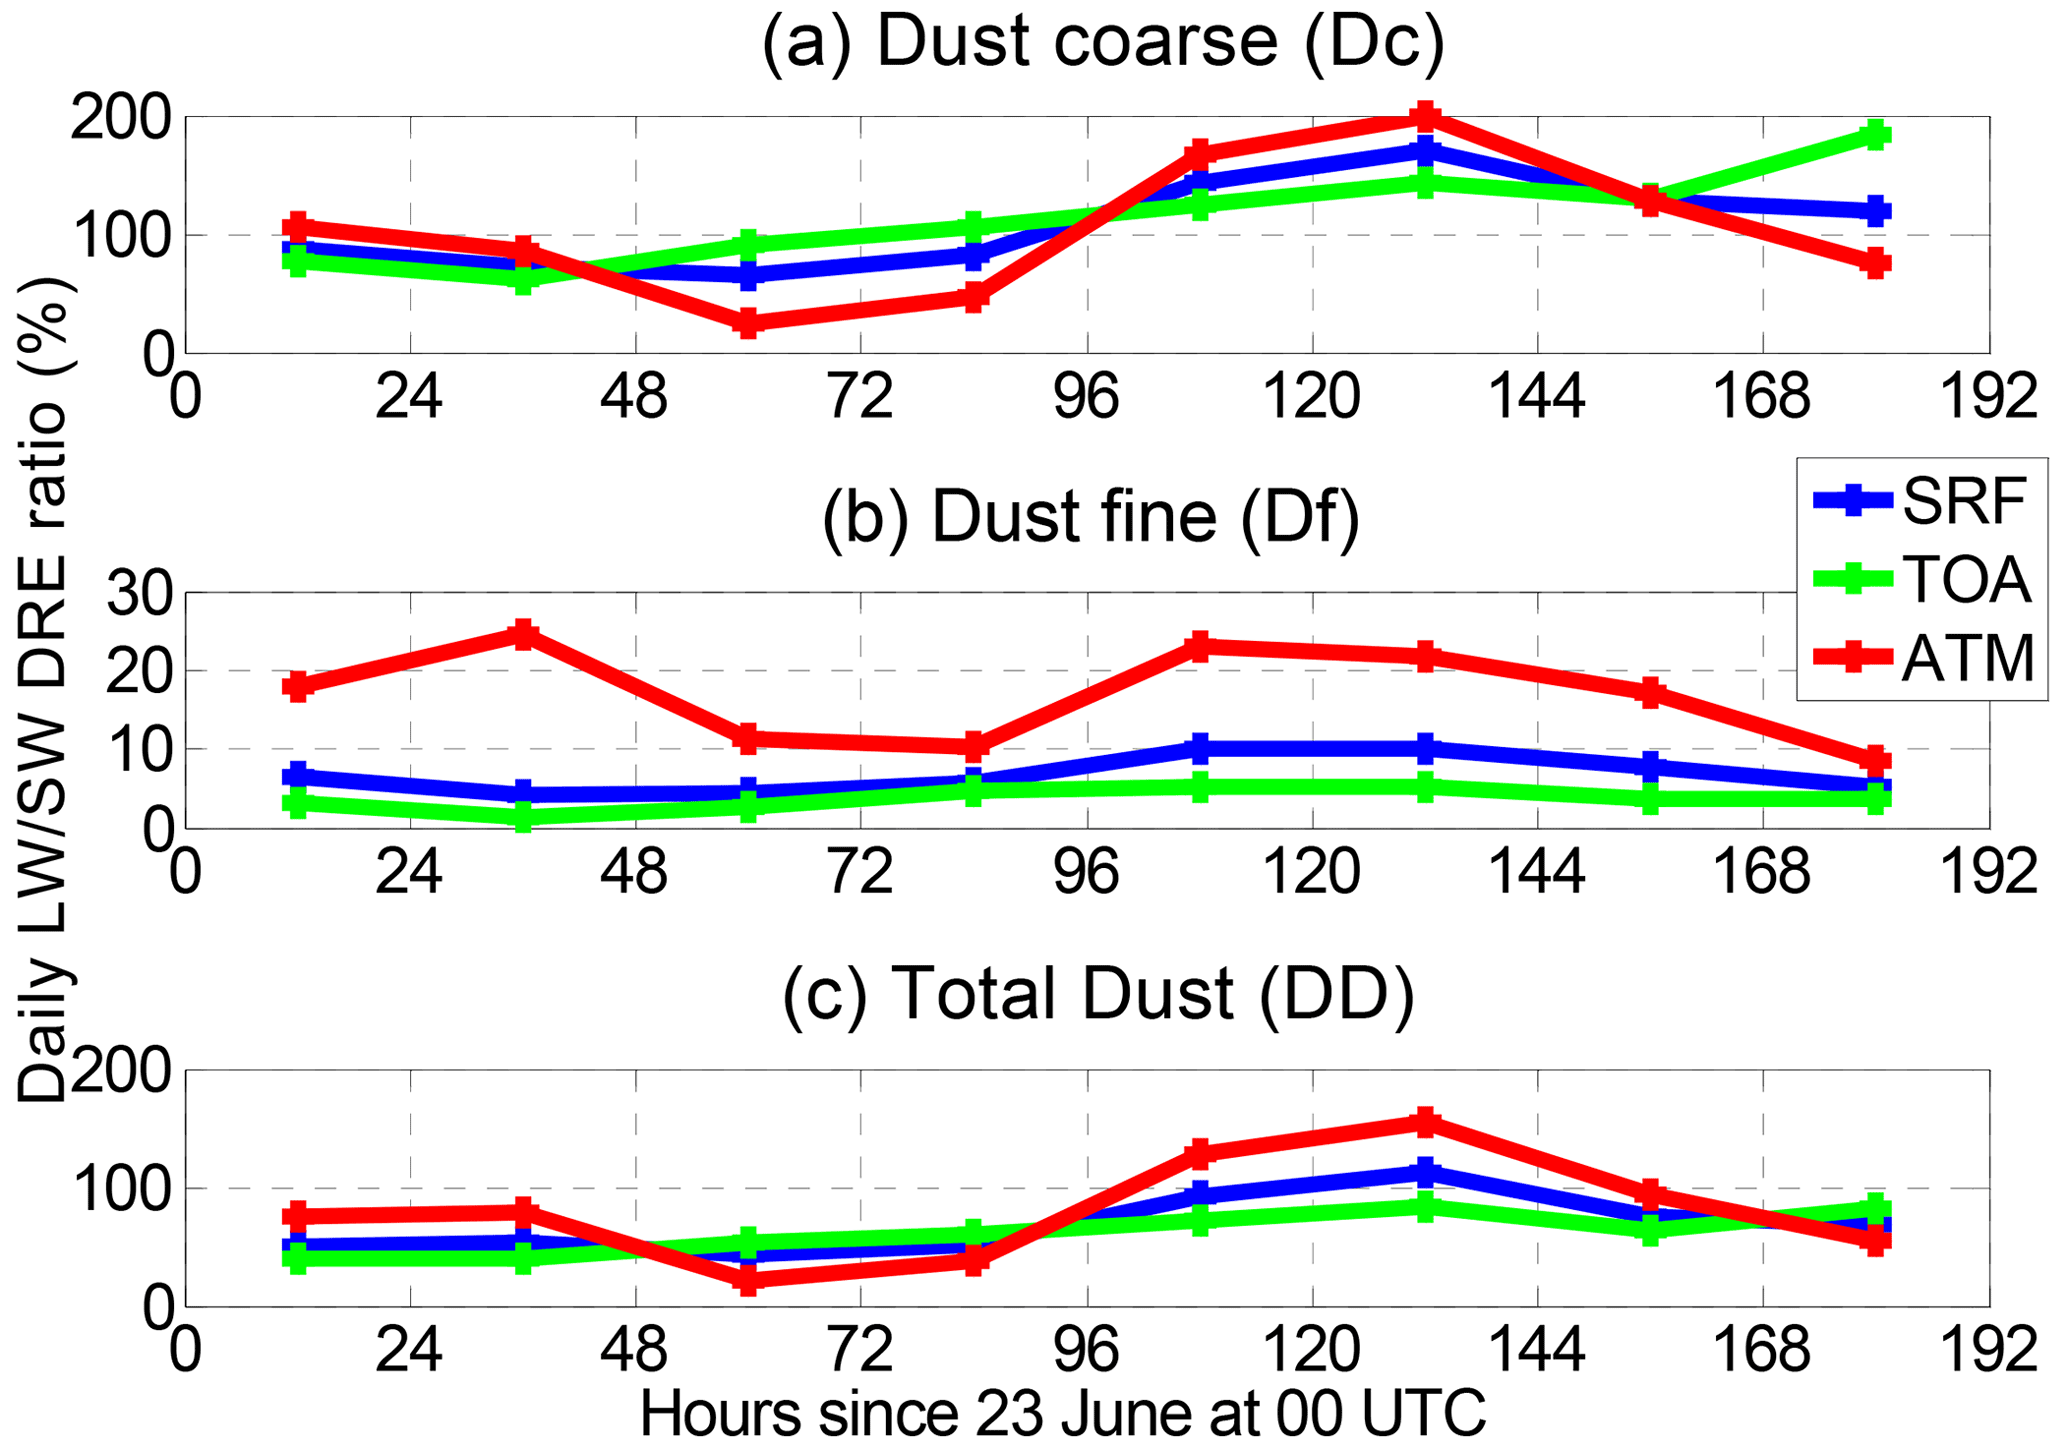
Figure 8Daily LW SW DRE ratio in BCN at the SRF, TOA and in the atmosphere (ATM) for (a) Dc, (b) Df and (c) DD.
Because Df DRELW is small compared to Dc DRELW, the total dust DRELW is similar to that of the coarse mode. In BCN instantaneous values do not exceed +12.1 W m−2 at SRF and +7.9 W m−2 at TOA. The averages over the whole event of the daily values are +6.12 W m−2 at SRF and +3.50 W m−2 at TOA resulting in a LW SW DD DRE ratio of 67 % and 60 %, respectively. The fraction of the LW component compared to the SW one is thus similar at both SRF and TOA, and it is higher than other estimations from the literature. Di Sarra et al. (2011) found daily LW SW ratios of 49 % and 35 % at SRF and TOA, respectively, and Meloni et al. (2015) of 52 % and 26 %. Both works deal with desert dust measurements in the Mediterranean, i.e., above the sea. The explanation of why our daily LW SW ratios are higher than those reported in the literature probably lies in the surface temperature. Indeed the LST at solar noon used here is over +15 ∘C higher than the sea surface temperature considered in Di Sarra et al. (2011) and Meloni et al. (2015), which contributes to enhance DRELW. In LPZ instantaneous values do not exceed +3.3 W m−2 at SRF and +3.4 W m−2 at TOA. The average over the period 29–30 June of the daily values are +0.96 W m−2 at SRF and +1.04 W m−2 at TOA. It is interesting to observe that in LPZ DRELW is higher at TOA than at SRF (in BCN the reverse occurs). As shown by Dufresne et al. (2002) and Sicard et al. (2014a) DRELW is highly dependent on the dust layer height, and its variations with the latter at SRF and TOA are opposite (DRELW decreases at SRF with increasing height, while it increases at TOA). The height of the coarse dust layer is much higher in LPZ than in BCN (Fig. 5a), which enhances DRELW at TOA with respect to the surface. The DD DRELW does not follow systematically a constant diurnal cycle like the SW one does. During the first 3 d no pattern is identified probably because of the strong variations in the DOD (see Fig. 4). On 26 June DD DRELW is rather flat, while on the last 4 d of the event both SRF and TOA DRELW have a clear diurnal cycle with the shape of a semi-cosine curve (28 June) or an inverted V (27, 29 and 30 June) showing an increase in the morning, a maximum reach at 12:00 or 13:00 UTC, and a decrease afterward. This pattern of the total dust DRELW is mostly due to the coarse mode since the fine-mode DRELW is much smaller than the coarse one. The diurnal cycle of DD (or Dc) DRELW is more pronounced at TOA than at SRF. It is well known that the OLR has a marked diurnal cycle (Slingo et al., 1987) and that it is highly correlated to the surface heating and cooling due to the diurnal cycle of insolation (Chung et al., 2009). For DRELW these statements are less straightforward. When holding all parameters constant except the surface temperature, Osborne et al. (2011) showed with Saharan dust measurements performed in Mauritania and Niger in June 2007 that the shape of the diurnal cycle of DRELW mimicked that of the surface temperature. In our analysis the surface temperature is also the only variable with a diurnal cycle with the shape of a cosine curve, so we believe that the cosine or inverted V shape of DD DRELW observed on the last 4 d of the dust event is related to the diurnal cycle of the surface temperature.
The instantaneous dust DRENET (DRESW+ DRELW) is presented as a function of time in both BCN and LPZ in Fig. 9 separately for Dc, Df and DD and at SRF, TOA and in the atmosphere. Daily values of Dc, Df and DD DRENET are reported at SRF in Table 1 and at TOA in Table 2. The fine-mode DRENET is similar to DRESW since DRELW ≪ DRESW. It produces a negative net radiative effect at both SRF and TOA. The daily mean values (averaged over the whole event) are −3.2 (BCN) and −1.15 W m−2 (LPZ) at SRF and −2.5 (BCN) and −0.85 W m−2 (LPZ) at TOA. Dc and DD instantaneous DRENET at SRF and TOA are similar to their corresponding DRESW values but shifted towards positive values (Fig. 9). At SRF daily Dc DRENET is negative in the first half period of the event in BCN and in LPZ. In BCN the average over the whole event is +0.2 W m−2; i.e., at SRF the LW component wins over the short-wave one at the event scale. At TOA daily Dc DRENET is essentially positive in BCN (except on the first 3 d of the event) and in LPZ. In BCN (LPZ) the average over the whole event is +0.2 (+0.5) W m−2; i.e., at TOA the LW component wins over the short-wave one at the event scale and at both sites. There is no doubt that for this particular dust episode and for the coarse-mode dust particles the long-wave DRE is as important as the short-wave one. Not having it taken into account would have led to large errors in the final estimation of the total dust DRE and to an overestimation of the dust cooling effect. Because Dc DRESW and DRELW are nearly compensated for, the dust coarse-mode net contribution to the total dust DRENET is overall small (Dc|DRENET|<0.5 W m−2), independently of the atmospheric level. Finally, as far as DD DRENET is concerned, most of the DD DRENET instantaneous values at SRF and TOA are negative and remain lower than 20 W m−2 in absolute value. The daily means are −3.0 (BCN) and −1.40 W m−2 (LPZ) at SRF and −2.3 (BCN) and −0.35 W m−2 (LPZ) at TOA. At SRF the highest daily DD DRENET are −7.4 and −1.5 W m−2 in BCN and LPZ, respectively. In one occasion in BCN (on 28 June) the daily DD DRENET at SRF takes a positive value +0.9 W m−2, meaning that on a daily basis the dust radiative effect produces a net warming at SRF. This is quite an unusual results. Our values are significantly smaller (in absolute value) than the limited number of daily dust DRENET values that can be found in the literature. For instance, Di Sarra et al. (2011) found daily DD DRENET of −43.7 (SRF) and −37.6 W m−2 (TOA); Meloni et al. (2015) of −14.7 (SRF) and −15.5 W m−2 (TOA); and Valenzuela et al. (2017) of [−64; −37 W m−2] (SRF) and [−31; −18 W m−2] (TOA). As said earlier, the most probable explanation why our values are smaller than the literature lies in the surface temperature which is much higher in our work.
Table 1Daily DRELW and DRENET (W m−2) and DREff (W m−2 τ−1) at SRF produced by Dc, Df and DD particles in BCN and LPZ. indicates daily averages. The daily DOD at 532 nm, DOD532, is also included. Df and DD DRELW and the 29–30 June mean DRE in LPZ are given with a precision of two digits.
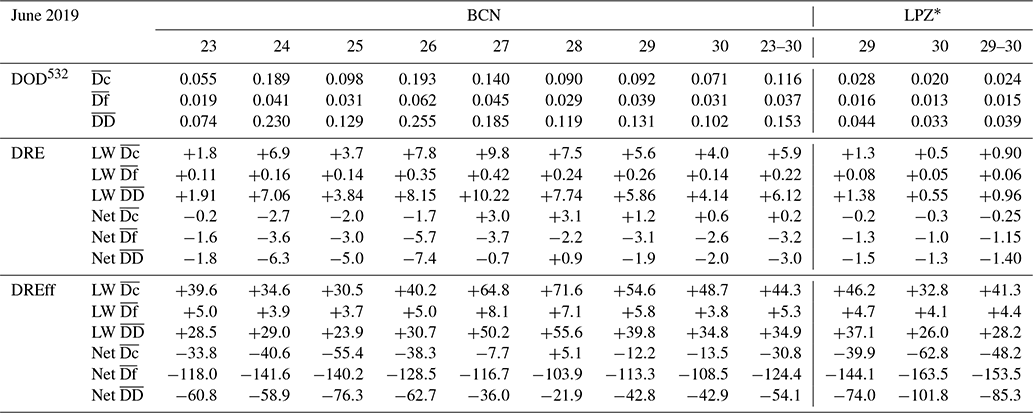
* 29 and 30 June represent dust Episode 1 and Episode 2, respectively, as observed in LPZ.
Table 2Same as Table 1 but at the TOA. DOD532 values are shown in Table 1.
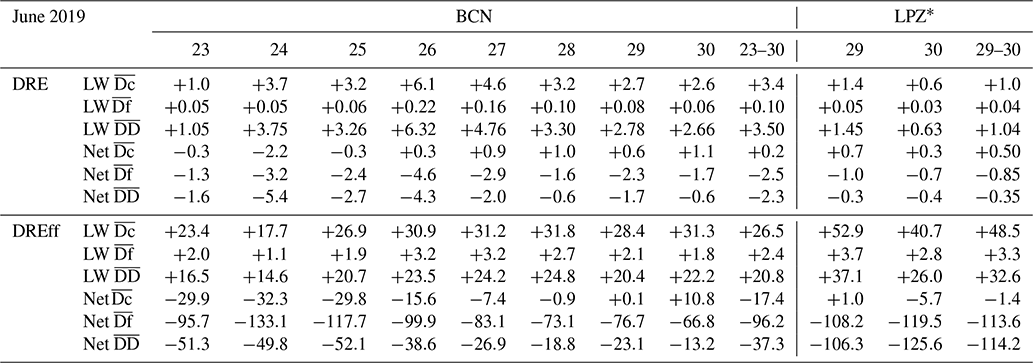
* 29 and 30 June represent dust Episode 1 and Episode 2, respectively, as observed in LPZ.
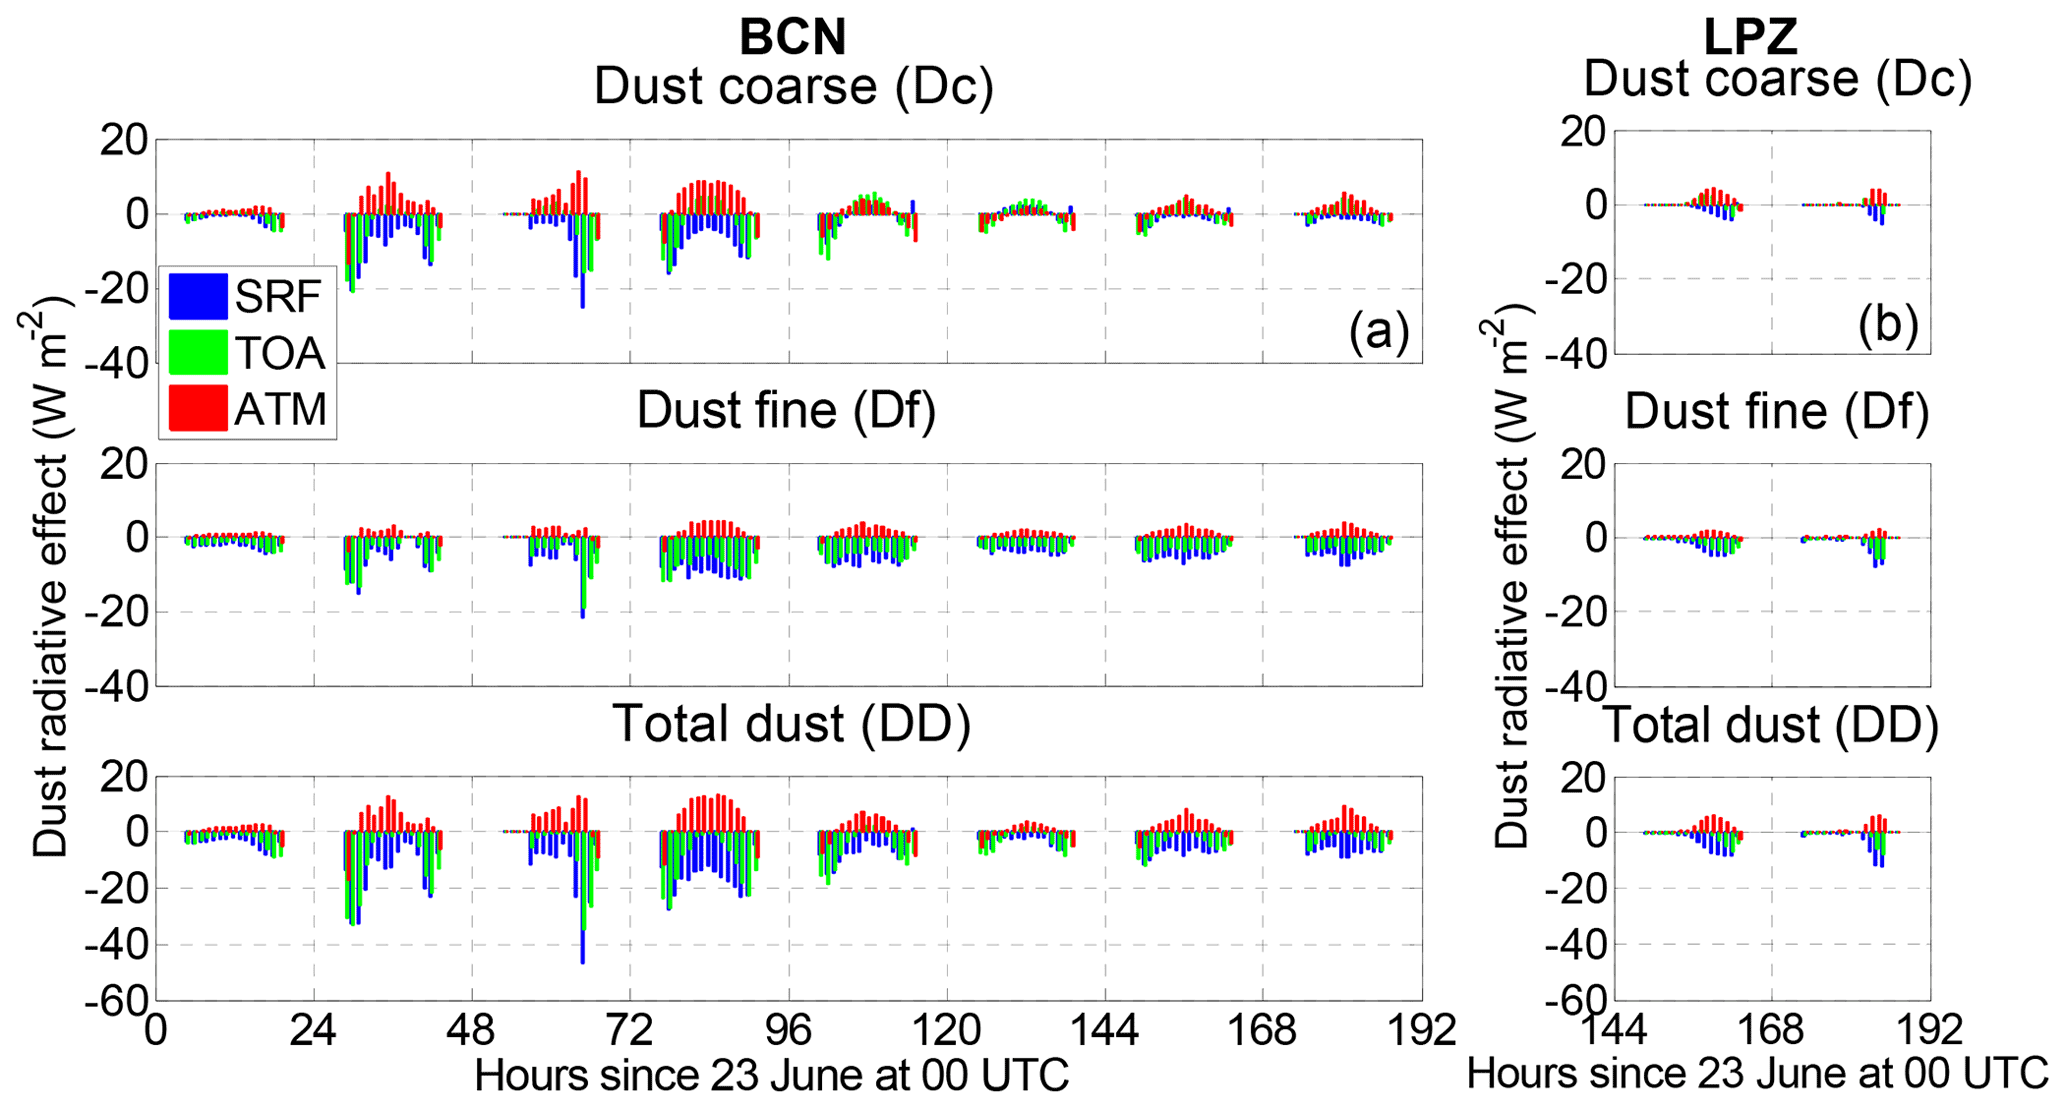
Figure 9Net instantaneous dust direct radiative effect (DRENET) at SRF, TOA and in the atmosphere (ATM) in (a) BCN and (b) LPZ.
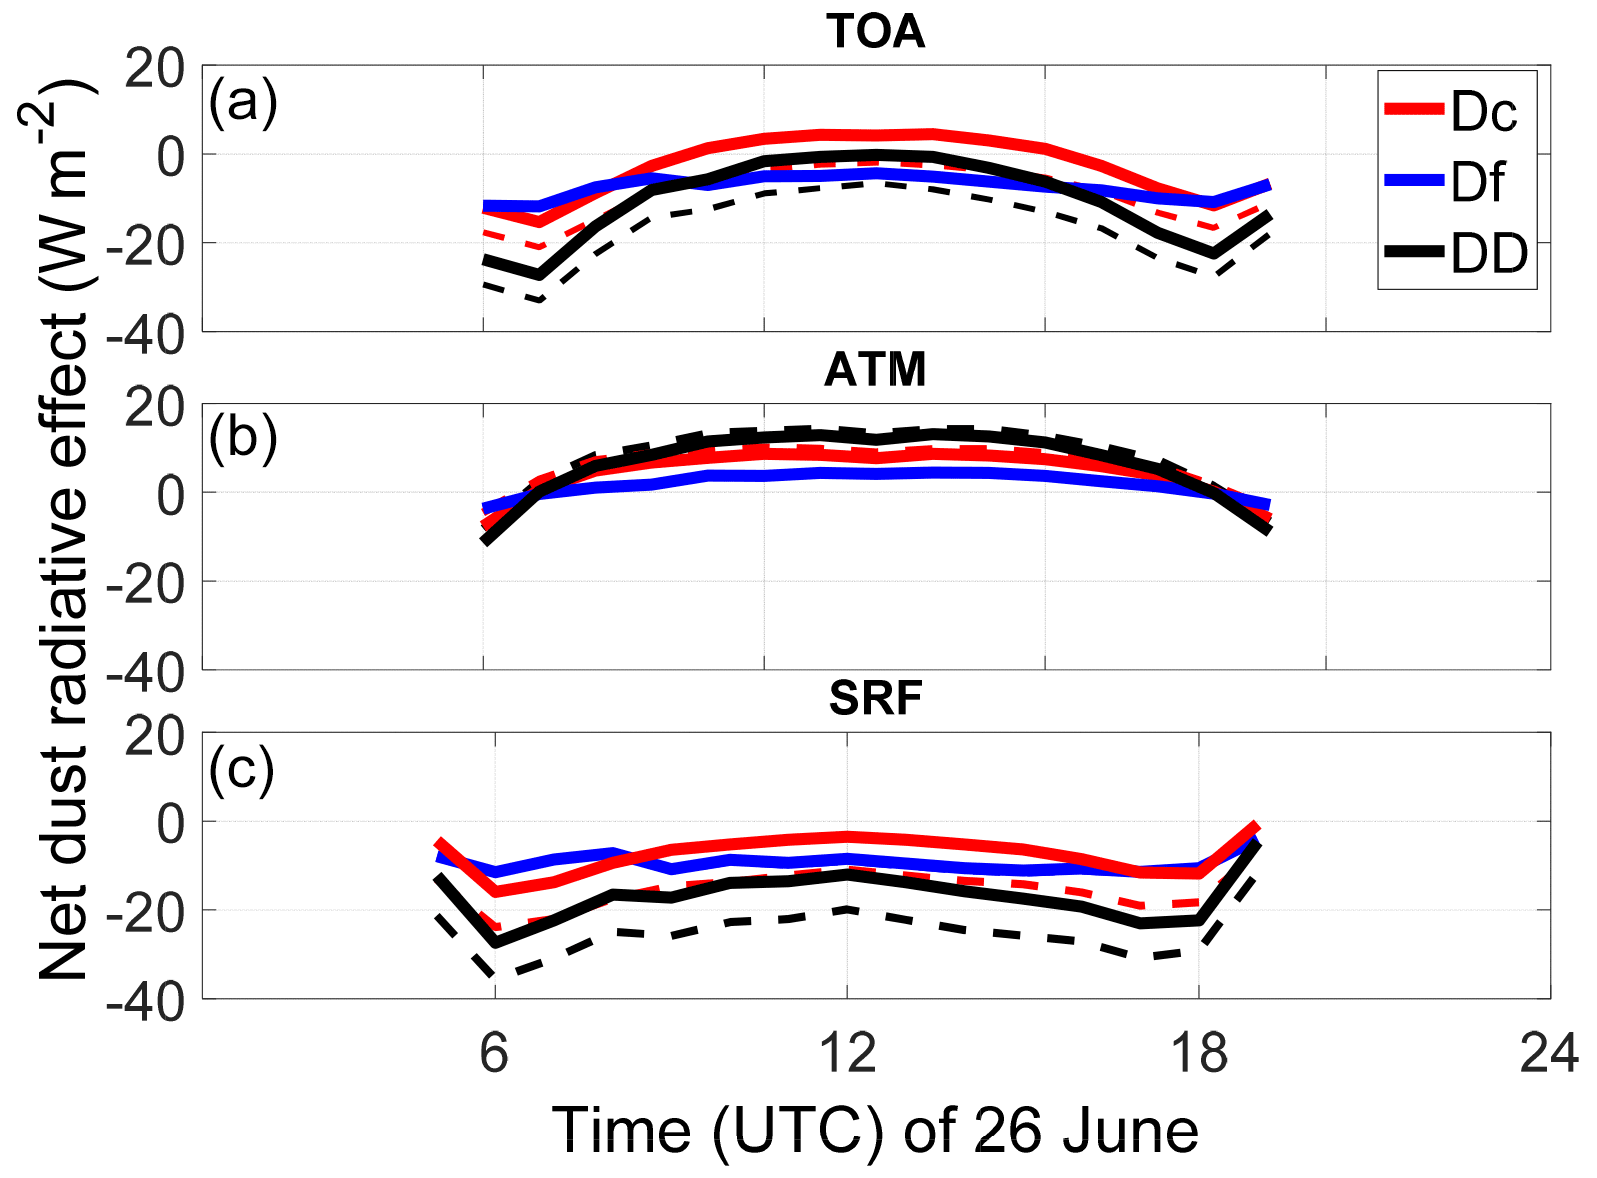
Figure 10Diurnal cycle on 26 June in BCN of the net dust radiative effect (DRENET) for Dc, Df and DD (c) at SRF, (b) in the atmosphere, and (a) at TOA. For Dc (red) and DD (black) the diurnal cycle of DRESW is also reported by dashed lines. Df DRESW is not represented since it would overlap with Df DRENET.
The objective of this last paragraph is to complete for the net radiative effect the discussion about the diurnal cycle of DRESW made in the companion paper by Córdoba-Jabonero et al. (2021). Figure 10 shows the diurnal cycle of DRENET for Dc, Df and DD at SRF, TOA and in the atmosphere for 26 June. Dc and DD DRESW are also reproduced. Df DRESW is not reproduced since it is nearly equal to Df DRENET (Df DRELW is small). We find again that the diurnal cycle of the Dc and DD DRENET is singular at SRF and TOA with the shape of a W, showing two minima, one in the morning (around 06:00 UTC) and one in the afternoon (17:00–18:00 UTC), and a maximum during the middle hours of the day. This shape is the one of the diurnal cycle of DRESW (the diurnal cycle of DRELW is rather flat on 26 June) which is due to a combination of solar geometry and dust anisotropic scattering (Osborne et al., 2011; Osipov et al., 2015). We refer to Córdoba-Jabonero et al. (2021) for a detailed explanation of the “W” shape of the diurnal cycle of DRESW. At SRF and TOA both Dc and DD DRENET are similar to DRESW shifted towards positive values (because of the Dc LW offset). The cooling effect produced during the day by DRESW is thus partly counterbalanced by DRELW. At TOA during the middle hours of the day (11:00–13:00 UTC), when Dc DRESW reaches its minimum, DD even produces a quasi-neutral effect (−0.7 < DD DRENET < −0.2 W m−2). At SRF, the instantaneous DD DRENET is negative, and it is larger (in absolute value) than 12 W m−2; the daily DD DRENET (Table 1) is equal to −7.4 W m−2. As expected, when considering a complete daily cycle (24 h) instead of instantaneous values, the LW DRE plays a larger role with respect to the SW DRE because the latter is zero during the night hours. The diurnal DRE variations at TOA are larger than at SRF. As a consequence, DRENET in the atmosphere shows the shape of an inverted U for both Dc and DD. The dust (all modes) produces a heating of the atmosphere during most of the hours of the day (DRENET at TOA > DRENET at SRF) and a slight cooling at dawn/dusk. The effect of DRELW on the atmospheric DRENET is rather small: the difference for Dc and DD between the atmospheric DRESW and DRENET is not greater than 2 W m−2.
3.1.2 Dust direct radiative efficiency
The dust direct radiative efficiency (DREff) is assessed on a daily basis (and at the event scale) by calculating the best linear fit forced to 0 of the scatterplot of instantaneous values of one full day (and of the whole dust episode) of DRE vs. DOD532. First the long-wave dust direct radiative efficiency is discussed at SRF and TOA: see Fig. 11 showing all instantaneous DRELW vs. DOD532 at SRF and TOA separately for Dc Df and BCN LPZ, as well as Tables 1 and 2 reporting the daily LW DREff values; and then the net direct radiative efficiency is discussed compared to the SW and LW components separately for Dc, Df and DD and at SRF, TOA and in the atmosphere: see Fig. 12 showing only the linear fits (for the sake of clarity) of SW, LW and net DRE components vs. DOD532, as well as Tables 1 and 2 reporting the daily net DREff values. As expected Df LW DREff is small at SRF and TOA and at both sites (Df LW DREff < +5.3 W m−2 τ−1). At the event scale at SRF Dc LW DREff in BCN (+44.3 W m−2 τ−1) and in LPZ (+41.3 W m−2 τ−1) are similar, while at TOA they differ significantly (+26.5 and +48.5 W m−2 τ−1, respectively). There are two reasons for that difference: (1) on average the dust coarse particles are larger in LPZ than in BCN (see Sect. 2.1 and Fig. 1), inducing larger extinction coefficients in the long-wave spectral range (Fig. 3a and c), and (2) the center of mass of the dust plume is much higher in LPZ than in BCN (Fig. 5), which produces higher LW DRE at TOA (Dufresne et al., 2002; Sicard et al., 2014a). According to Sicard et al. (2014a), when maintaining the aerosol optical depth constant, Dc DRELW does not vary much for rg(Dc) > 1 µm. This result lets us think that the main reason why Dc LW DREff at TOA in LPZ is higher than in BCN is related to the height of the dust plume. When Df and Dc are considered together, DD LW DREff drops down (with respect to the Dc value) to +34.9 (BCN) and +28.2 W m−2 τ−1 (LPZ) at SRF and to +20.8 (BCN) and +32.6 W m−2 τ−1 (LPZ) at TOA.
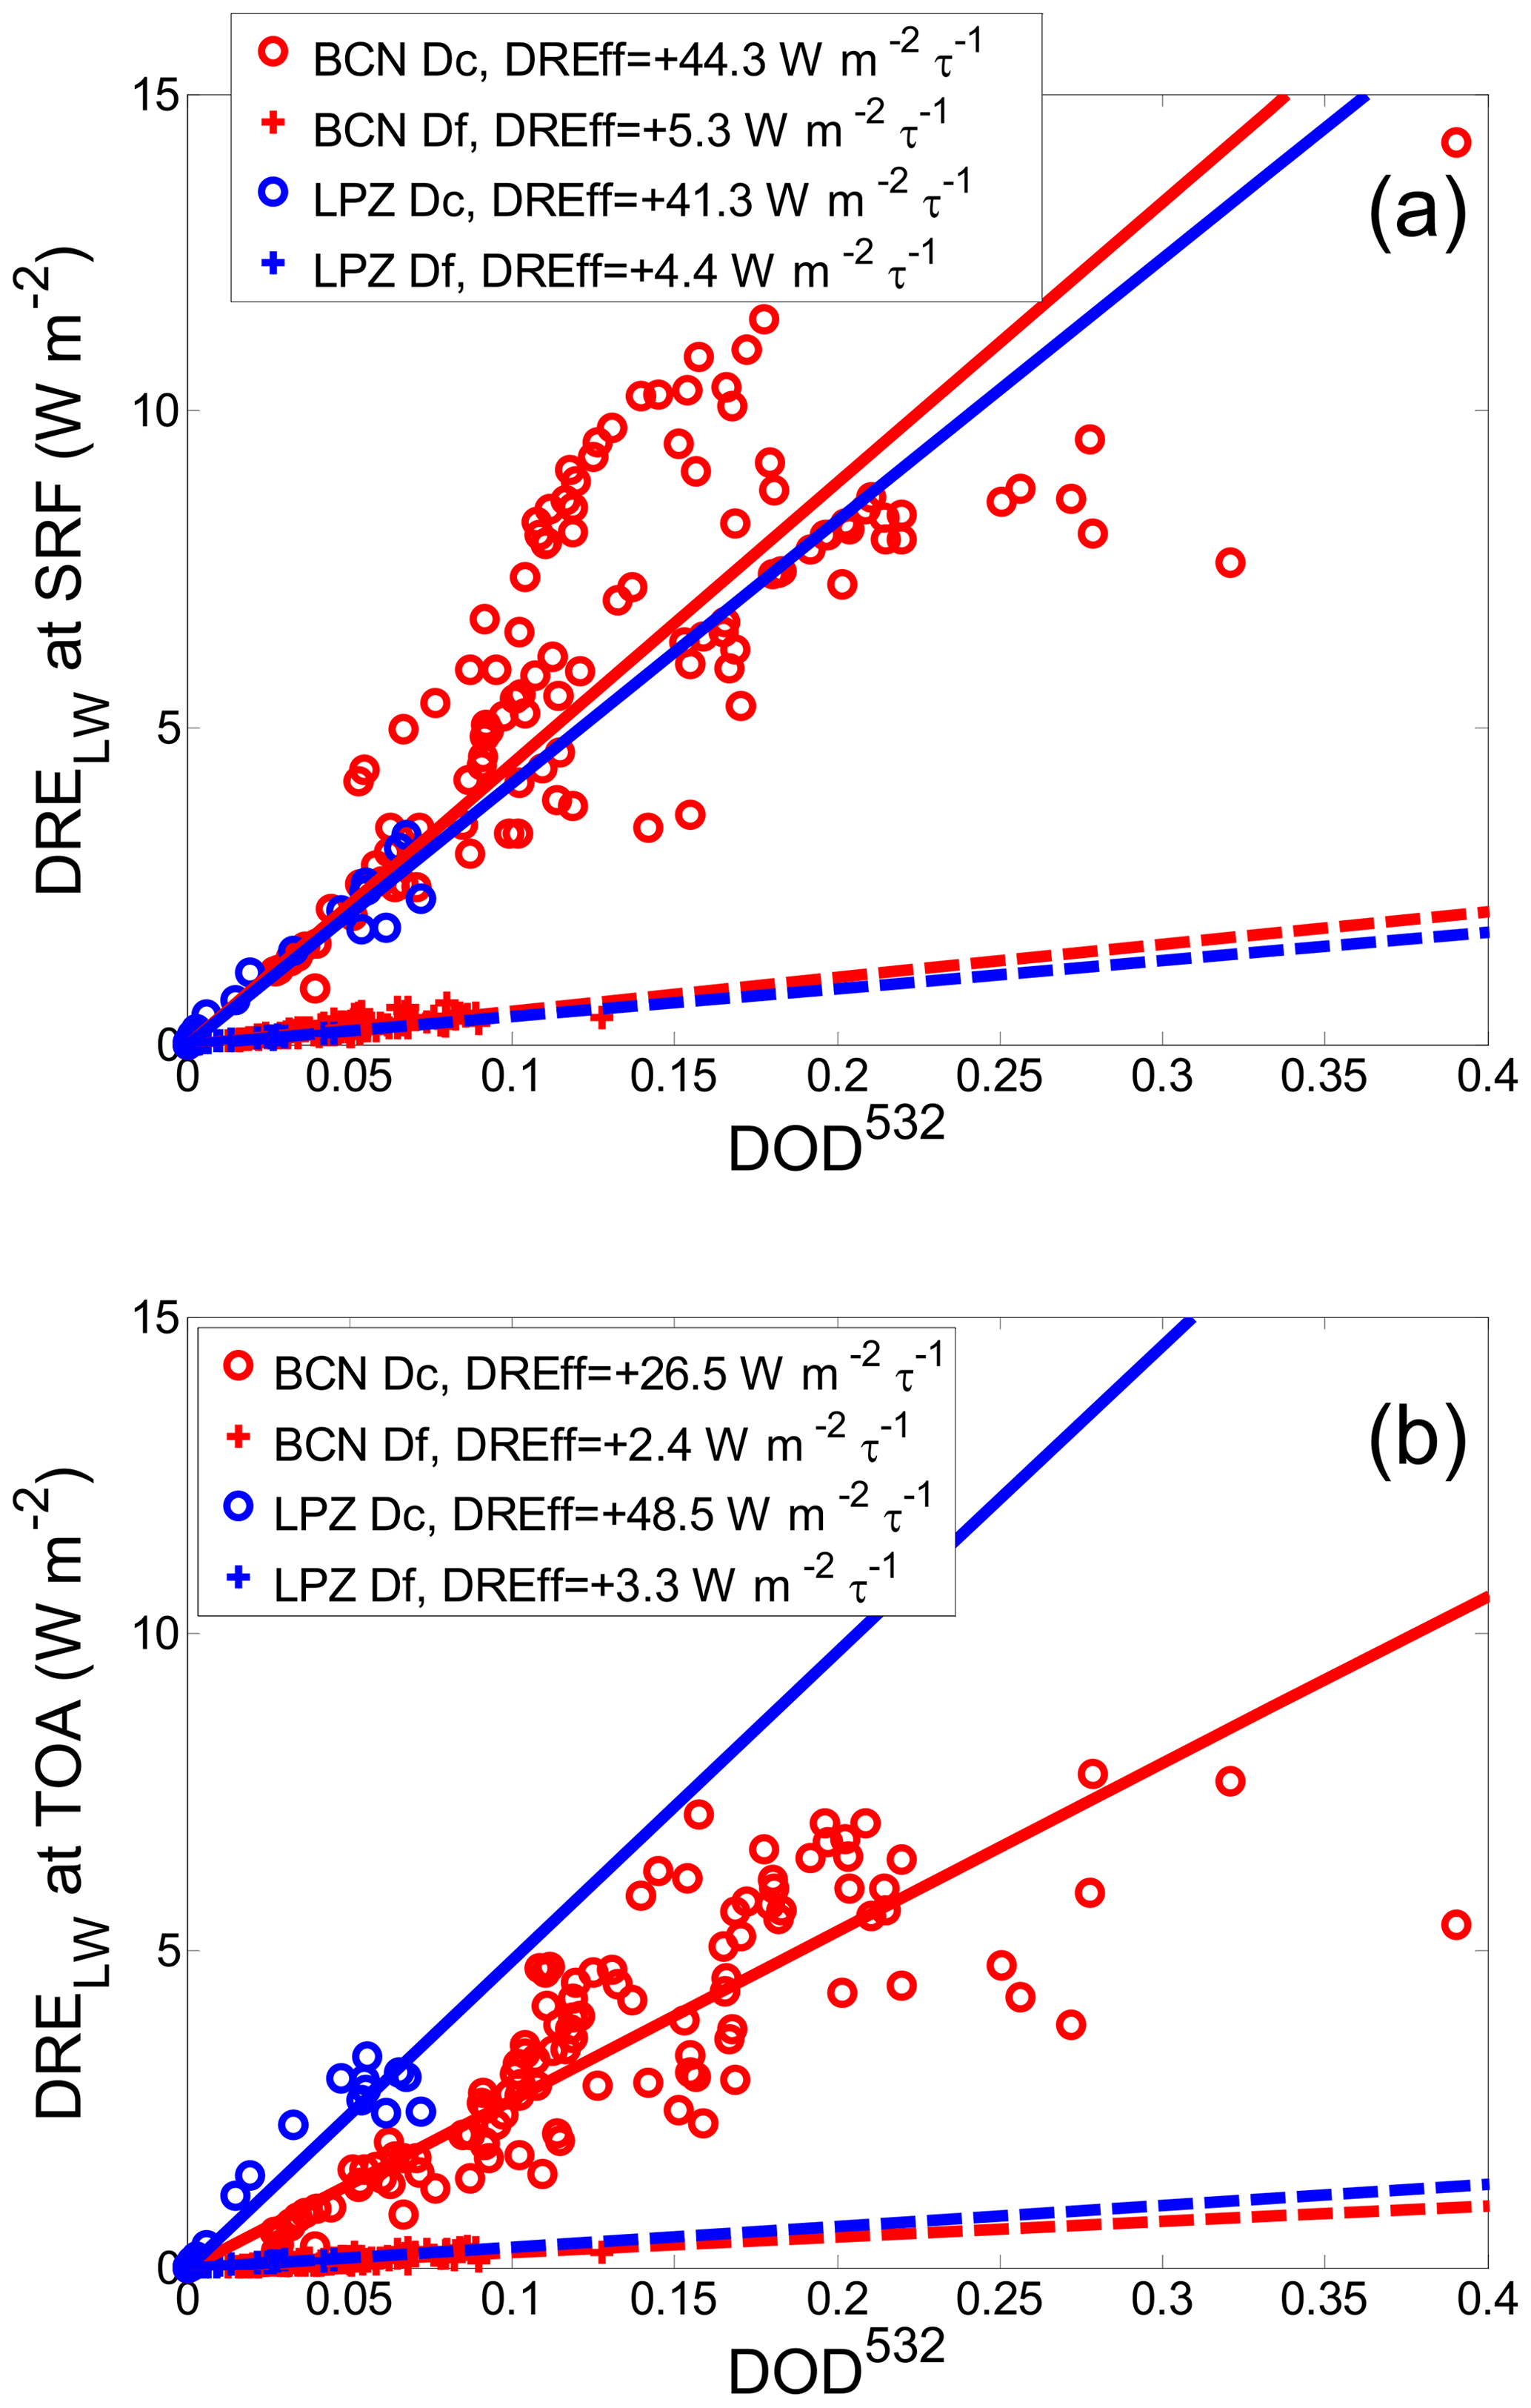
Figure 11Dust long-wave direct radiative effect (DRELW) at (a) SRF and (b) TOA as a function of DOD532, as shown separately for Dc (circles) and Df (crosses) at BCN (23–30 June) and LPZ (29–30 June). Corresponding DREff values (slope of the linear fitting of DRELW vs. DOD532) are included in the legend (solid and dashed lines, respectively, for Dc and Df particles).
To study the effects of each particle size mode (Dc and Df) and spectral components (SW and LW) we now look at Fig. 12 which has been produced with the data from BCN for the whole event (23–30 June). The central plots show DRE vs. DOD532 for the dust fine mode. Df LW DREff is small at all atmospheric levels which leads to similar values of Df SW and net DREff (black and red lines almost overlap in Fig. 12b, e and h). This allows us to conclude that the dust Df net DREff is driven basically by the SW component. Things are different for the dust coarse mode (left plots in Fig. 12) for which the LW component offsets significantly the SW one. Indeed, at SRF and TOA, we observe a decrease in the net Dc radiative efficiency with respect to the SW one by a factor of 2.5: −30.8 (net) vs. −75.2 W m−2 τ−1 (SW) at SRF and −17.4 (net) vs. −43.9 W m−2 τ−1 (SW) at TOA. In the atmosphere (Fig. 12g), the inclusion of the LW component reduces the Dc net DREff by a factor of 1.6 with respect to the SW one. When both size modes are added together (DD, right plots of Fig. 12), a reduction in the SW radiative efficiency is also observed when the LW component is taken into account. At SRF and TOA, we observe a decrease in the net DD radiative efficiency with respect to the SW one by a factor of 1.6: −54.1 (net) vs. −88.9 W m−2 τ−1 (SW) at SRF and −37.3 (net) vs. −58.0 W m−2 τ−1 (SW) at TOA. Interestingly, the ratio of the total dust SW-to-net radiative efficiency is the same (1.6) at both SRF and TOA. It is a value significantly larger than 1 which highlights again the importance of considering the long-wave component in studies focused on dust radiative effects. Finally, in the atmosphere (Fig. 12i), the inclusion of the LW component reduces the DD net DREff by a factor of 1.8 with respect to the SW one.
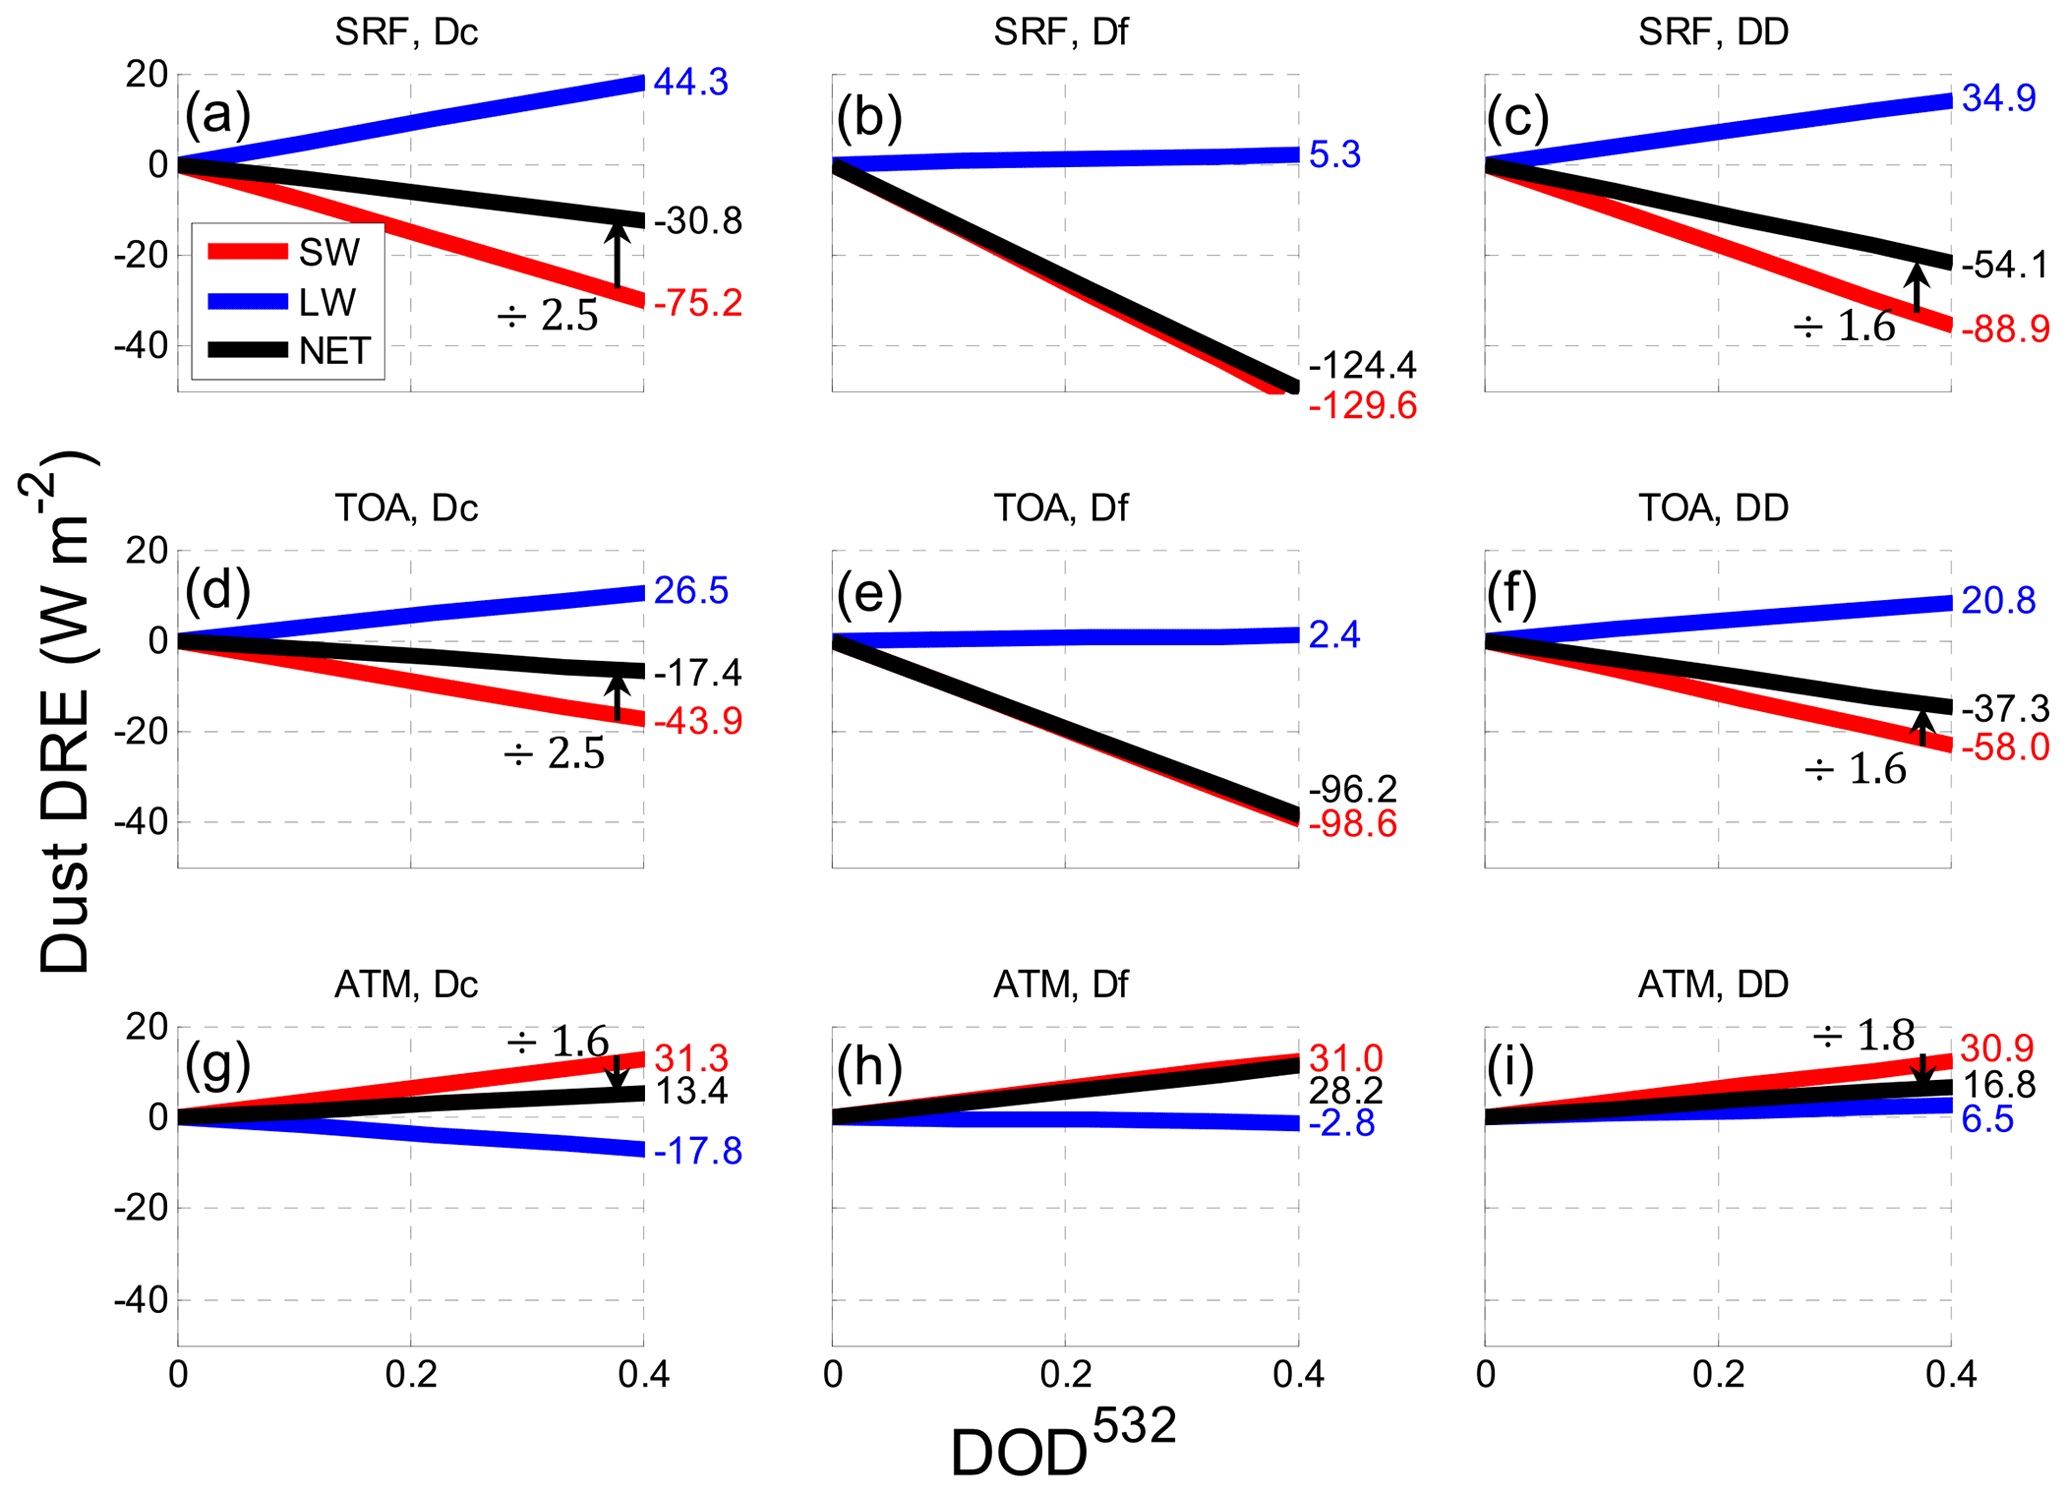
Figure 12Linear fitting of the dust direct radiative effect (SW, LW and net) as a function of DOD532 at SRF for (a) Dc, (b) Df and (c) DD; at TOA for (d) Dc, (e) Df and (f) DD; and in the atmosphere for (g) Dc, (h) Df and (i) DD in BCN (23–30 June). Corresponding DREff values (slope of the linear fitting of DRE vs. DOD532) are included next to the right axis (DREff units are W m−2 τ−1). In Dc and DD plots the arrows and number indicate the SW net ratio. The legend in (a) applies to all plots.
3.2 Heatwave and dust cooling/warming effect of the Earth–atmosphere system
How is the net direct radiative effect of mineral dust modified when the dust intrusion occurs simultaneously with a heatwave? This question is the motivation of this section which focuses on the results in BCN. We will start with some features of the June 2019 heatwave. Data provided by the Copernicus Climate Change Service show that the European average temperature for June 2019 was higher than for any other month of June on record (Copernicus, 2021). Average temperatures were more than 2 ∘C above normal, and if we consider the 5 d period of 25–29 June, the temperatures were 6 to 10 ∘C above normal, with local differences even higher (up to 18 ∘C) in northeastern Spain, France and the United Kingdom according to a detailed article issued by the Spanish state meteorological agency (AEMET) on the “June 2019 heatwave in the context of the climate crisis” (AEMET, 2021). In June 2019, the synoptic conditions were marked by the presence of an anomalous long-lasting anticyclone in the upper troposphere which advected warm air from the Sahel and Mediterranean region and enhanced incoming solar radiation and surface turbulent fluxes. According to P. Xu et al. (2020) this situation is at the origin of three heatwaves over Europe, and it is during the last one, from 25 to 29 June, that the highest temperatures were reached. Towards the end of June, this anticyclone merged with a high-pressure system located over northeastern Europe that had previously produced extreme temperatures and extended towards the northeast as a strong subtropical ridge intensified by a low-pressure system located over the eastern Atlantic. This subtropical ridge injected very warm air and mineral dust from the Sahara region towards western Europe, and this air overheated during its transport while traveling over previously warmed land (Sousa et al., 2019; P. Xu et al., 2020). Sousa et al. (2019) classified the heatwave of 25–29 June 2019 as a mega-heatwave (Barriopedro et al., 2011) because of its outstanding duration, intensity and spatial extent. Other climate studies involving multi-model methodologies have come to the conclusion that the June 2019 heatwave had been most probably triggered by anthropogenic climate change and that such heatwaves could become more widespread, long-lasting and severe over Europe in the future (Ma et al., 2020; Vautard et al., 2020).
As seen in the previous section, the total dust net radiative effect is modulated by the dust coarse-mode LW radiative effect. Figure 13a shows on the same plot the daily Dc LW SW DRE ratio and the daily Df and DD DRENET at SRF for the BCN site and for the period 23–30 June; Fig. 13b shows the same magnitudes at TOA. In Fig. 13c the daily LST is reported. A clear correlation exists between the LST and the Dc LW SW DRE ratio at both SRF and TOA. In the same way a clear correlation exists between Dc LW SW DRE ratio and DD DRENET at SRF and also at TOA. The date of 26 June is a pivotal moment of the episode in terms of dust radiative effect: during that day the TOA (first) and SRF (second) Dc LW SW DRE ratios cross the 100 % threshold (Dc|DRESW|=Dc|DRELW|). This affects directly DD DRENET with respect to Df DRENET: DD|DRENET|>Df|DRENET| before 26 June (Dc DRENET amplifies the dust fine-mode cooling effect) and DD|DRENET|<Df|DRENET| after 26 June (Dc DRENET reduces the dust fine-mode cooling effect). As expected the difference between Df and DD DRENET is larger at SRF than TOA, which reflects that the contribution of Dc DRENET is more significant at SRF, where most of the LW radiation comes from, than at TOA. When the Dc LW SW DRE ratio reaches values above 150 % at SRF, DD DRENET has values close to zero (−0.7 and +0.9 W m−2 on 27 and 28 June, respectively); i.e., the total dust net radiative effect is quasi-neutral at this moment of the episode.
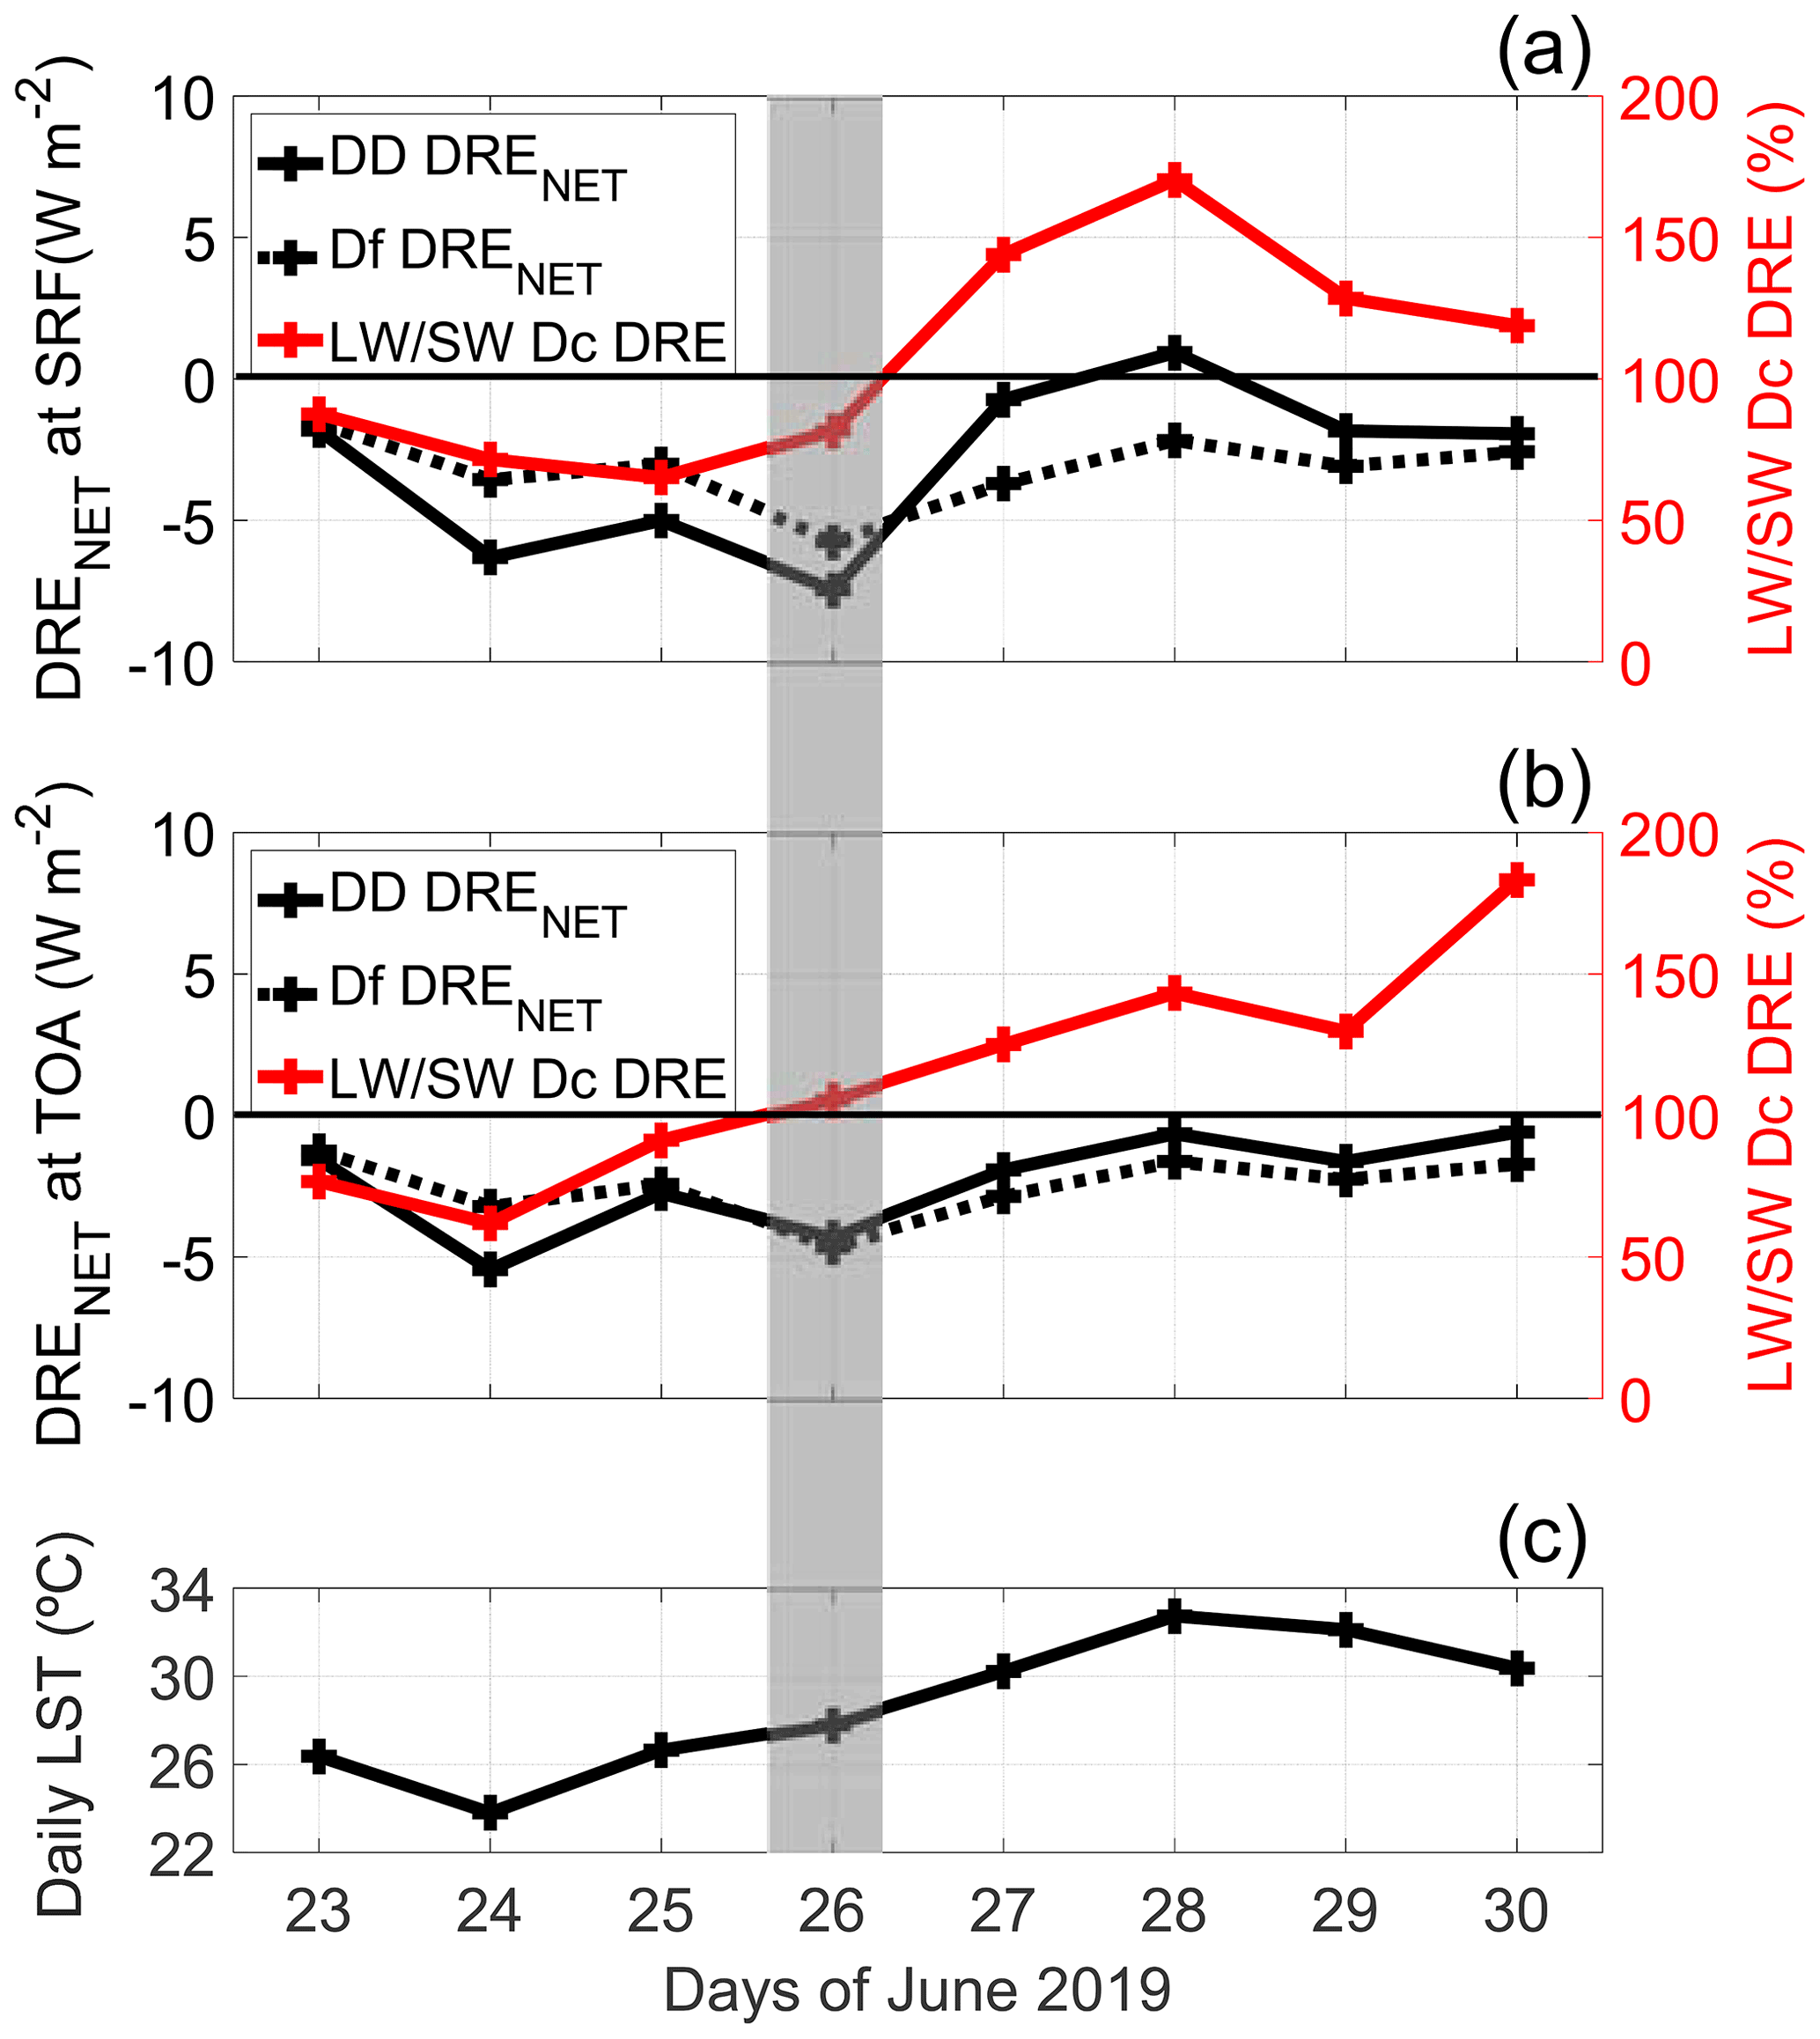
Figure 13(a) Daily Df and DD DRENET (left axis) and daily Dc LW SW DRE ratio (right axis) at SRF; (b) daily Df and DD DRENET (left axis) and daily Dc LW SW DRE ratio (right axis) at TOA; (c) daily mean LST. Site: BCN; time period: 23–30 June. The shaded area represents the period during which both SRF and TOA Dc LW SW DRE ratios cross the 100 % threshold.
The aim of this last paragraph is to estimate the impact of the heatwave on the dust net radiative effect. For that, two parameters directly related to the heatwave and needed for the computation of the LW radiative effect are considered: the surface temperature and the profile of the air temperature. In the following we calculate Dc DRELW (the variations produced on Df DRELW are neglected since Df DRELW is small) in a controlled way assuming the following three scenarios:
-
heatwave 1 (HW1): this study with a climatological LST from the 8 years 2011–2018;
-
heatwave 2 (HW2): this study with an air temperature profile in the dust layer equal to the actual one minus 6 ∘C;
-
heatwave 3 (HW3): this study with a climatological LST from the 8 years (2011–2018) and an air temperature profile in the dust layer equal to the actual one minus 6 ∘C (equivalent to a combination of HW1 + HW2 scenarios).
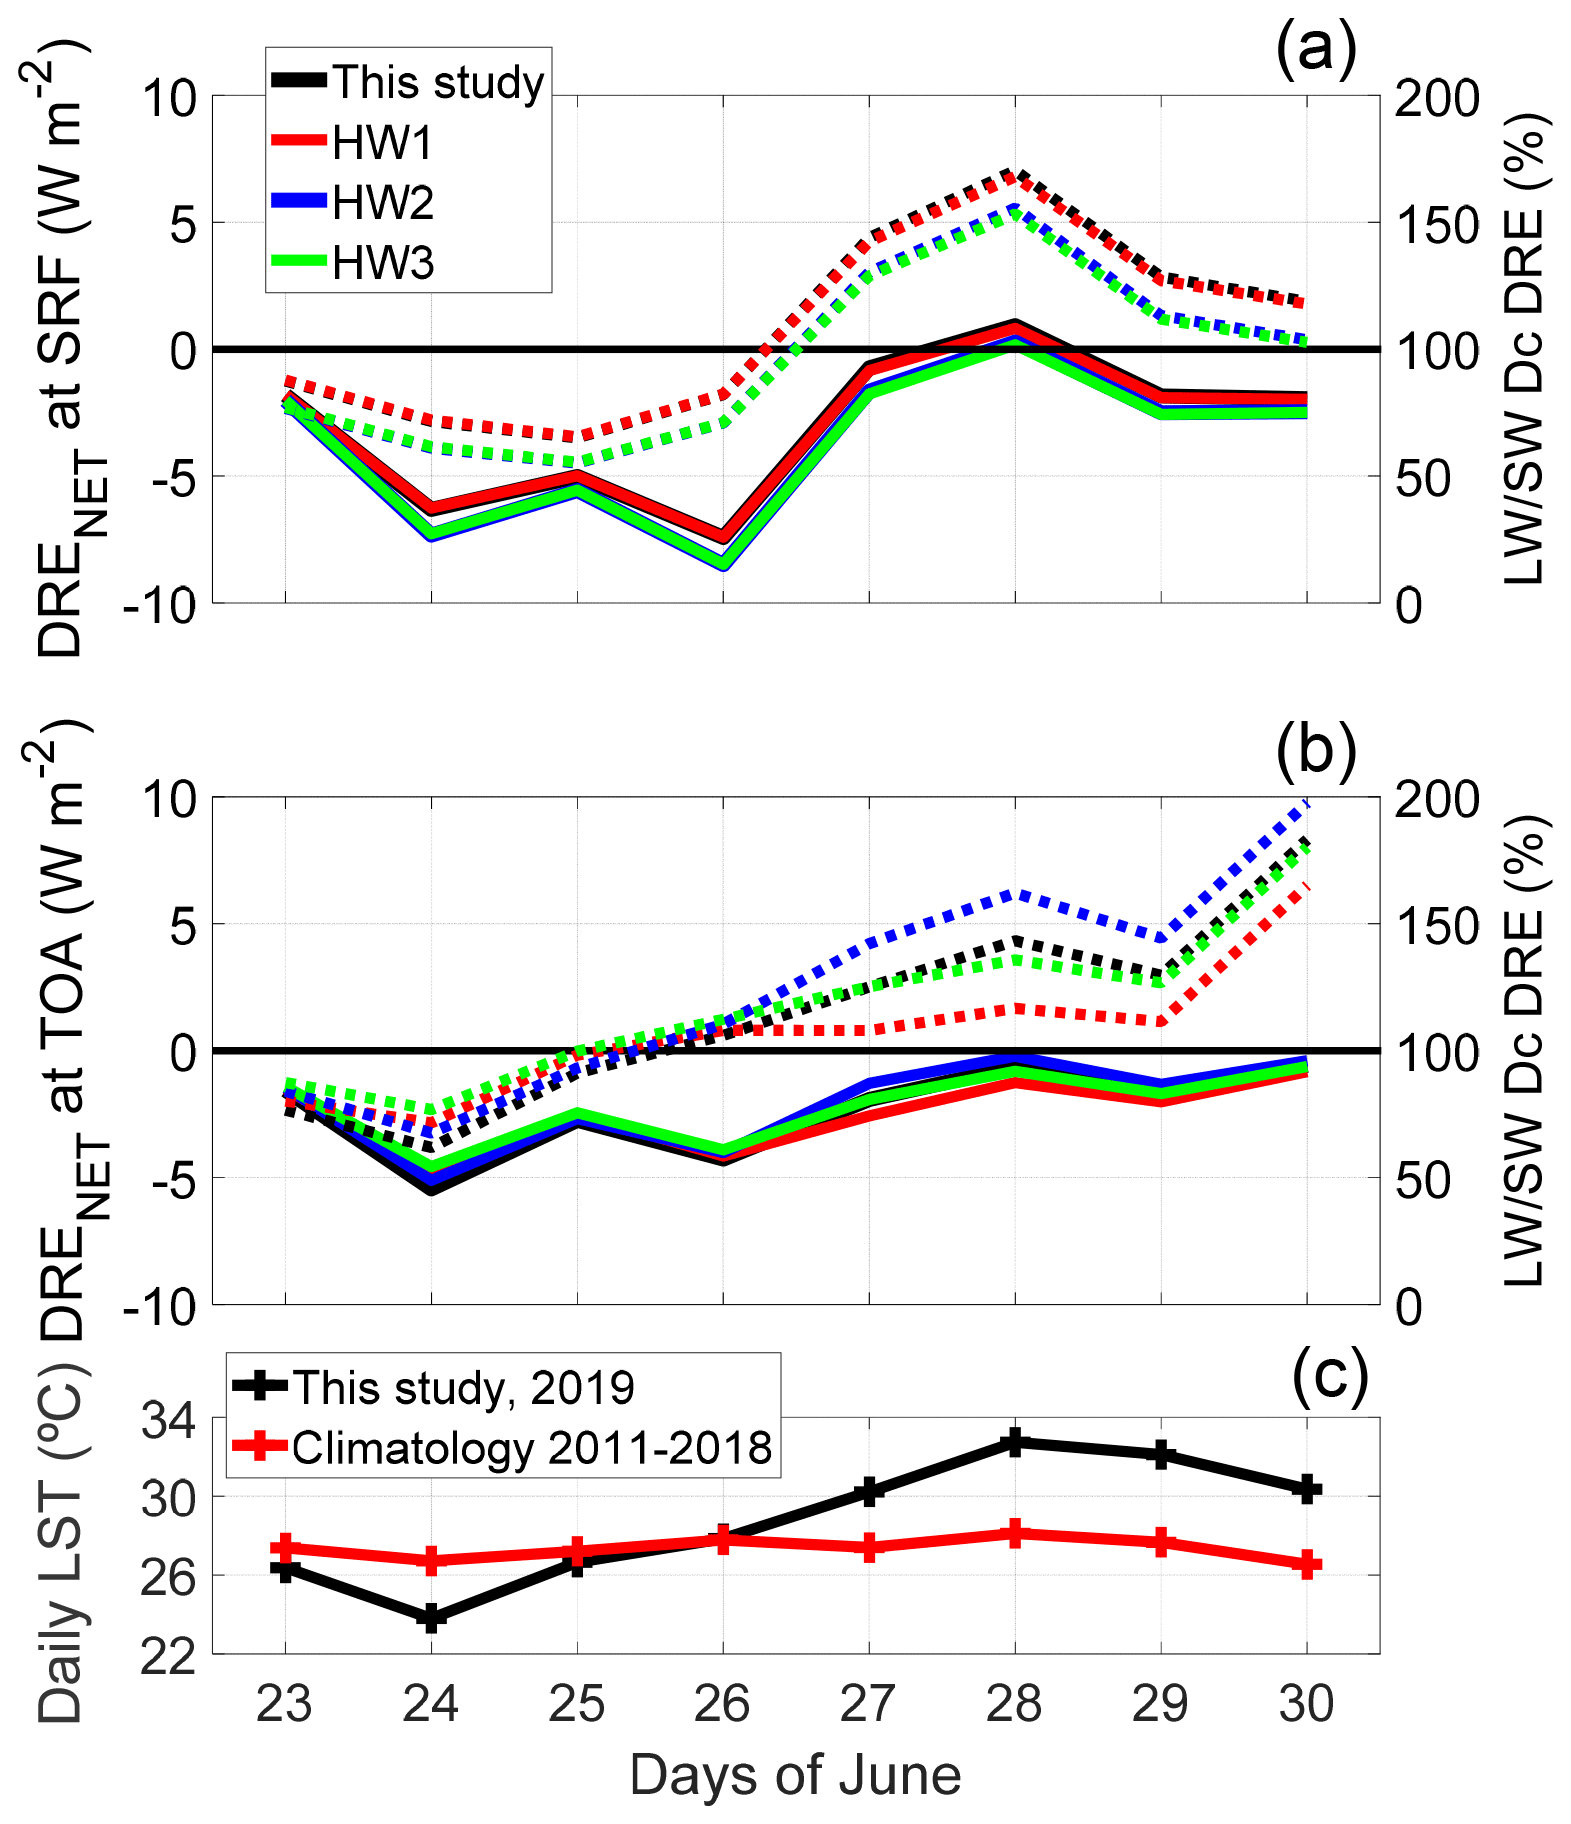
Figure 14Daily DD DRENET (solid lines, left axis) and daily Dc LW SW DRE ratio (dotted lines, right axis) at (a) SRF and (b) TOA; (c) daily mean LST. Site: BCN; time period: 23–30 June. HW1: climatological LST; HW2: air temperature minus 6 ∘C in the dust layer; HW3: climatological LST and air temperature minus 6 ∘C in the dust layer. In the LST plot, the climatological surface temperature is also plotted.
The climatological LST was calculated as the average over the 8 years preceding 2019 (2011–2018). The data were provided by the Copernicus Global Land Service in the same way as the hourly LST of 23–30 June 2019 (see Sect. 2.3). Although the analysis was originally planned for a 10-year climatology, Copernicus data of the LST are available only back to 2011. In HW1 and HW3 the LST has been replaced by the 8-year climatological value. According to AEMET (2021), the temperature anomaly at 850 hPa on 28 June 2019 in the region of Barcelona was on the order of +12 ∘C. This is probably the maximum of the episode (see Figs. 6 and 13c). As a rule of thumb the mean anomaly over the episode is estimated to be +6 ∘C. For comparison the difference between the maximum daily LST (32.7 ∘C reached on 28 June; Fig. 6) and the mean over the episode (28.8 ∘C) is 3.9 ∘C. In HW2 and HW3 6 ∘C has been subtracted from the temperature profiles in the dust layer. The different scenarios allow us to estimate how the dust radiative effect would have been modified: HW1, if the surface temperature had not been so high; HW2, if the air had not been so warm; and HW3, if the dust episode had not been accompanied by a heatwave (“normal” surface and air temperature). Figure 14a and b show the daily DD DRENET and the daily Dc LW SW DRE ratio at SRF and TOA, respectively, for the three scenarios, as well as in the heatwave conditions (this study). Figure 14c shows the daily LST (2019) and the climatological LST (2011–2018) for comparison. From the latter figure, one sees that at the beginning of the episode (23 and 24 June) the 2019 daily LST is indeed lower than the climatological one. From 24 June onwards it increases strongly. On the last 3 d of the episode (28, 29 and 30 June) the 2019 daily LST is approximately 4.0–4.5 ∘C above the climatological LST. In HW1 (red lines in Fig. 14a and b) the use of the climatological LST has no impact on the Dc LW SW DRE ratio at SRF (and thus on the DD DRENET either). Contrarily the impact at the TOA is quite noticeable: towards the end of the episode, the reduction in LST in HW1 yields logically a reduction in Dc DRELW, thus a reduction in the Dc LW SW DRE ratio and thus an amplification of the dust cooling effect at TOA. Said in a different way, the effect of a high LST during the heatwave is the increase in the amount of radiation which escapes to space. Since the radiation budget at SRF is nearly unchanged, the effect in the atmosphere is to reduce the heating of the atmosphere. In HW2 (blue lines in Fig. 14a and b) the use of a decreased air temperature in the dust layer has an impact at both SRF and TOA and of opposite sign. The decrease in the air temperature has a direct impact on the gaseous transmittance. According to Dubuisson et al. (2004) and following the correlated k distribution (Lacis and Oinas, 1991) used in GAME, a decrease in air temperature yields a decrease in the absorption coefficient. This will result in more LW radiation propagating upward in the atmosphere and thus in a reduction in the dust Dc DRELW in the dust layers and consequently at SRF (Fig. 14a) and in an increase in the LW radiation reaching TOA (Fig. 14b). Consequently, when the air temperature in the dust layer is reduced by 6 ∘C, DD DRENET is shifted towards negative values at SRF and towards positive values at TOA. Seen from the heatwave perspective, the effect of high temperatures in the dust layer during the heatwave is to reduce the dust net cooling effect at SRF and to amplify it at TOA (decrease in the amount of radiation which escapes to space). These opposite variations will have the effect of reducing the atmospheric heating provoked by the dust particles. Finally, when both HW1 and HW2 scenarios are considered simultaneously (HW3), their effect on the daily DD DRENET and the daily Dc LW SW DRE ratio combine (green lines in Fig. 14a and b). At SRF DD DRENET is shifted towards negative values like in HW2 (in HW1 DD DRENET was nearly unchanged). At TOA HW1 and HW2 have opposite effects on DD DRENET in the second half of the episode when the 2019 LST is larger than the climatological LST; consequently their effects are compensated for, and DD DRENET in HW3 is practically unchanged with respect to the results of this study. Interestingly, in the first half of the episode when the 2019 LST is smaller than the climatological LST, both HW1 and HW2 produce a shift in DD DRENET at TOA towards positive values, which results in a reduction in the dust net cooling effect in HW3. From the heatwave perspective, we conclude that the higher LST and the higher air temperature due to the heatwave that accompanied the dust episode (1) provoked a reduction in the dust net cooling effect at the surface, (2) left unchanged the dust net cooling effect at TOA and (3) consequently reduced the dust net heating of the atmosphere.
This companion paper to Córdoba-Jabonero et al. (2021) estimates the temporal variation in the instantaneous and daily dust long-wave and net direct radiative effects during an intense dust episode that occurred between 23 and 30 June 2019 and was paired with a mega-heatwave. It also investigates the effect of the heatwave on the dust radiative effect. The radiative effect was calculated with the GAME radiative transfer model separately for the fine- and coarse-mode dust. The dust radiative properties in the long-wave spectral range were calculated with a Mie code and particle microphysics from AERONET. The dust fine- and coarse-mode vertical distribution and the short-wave DRE were taken from the companion paper. Two sites are considered – Barcelona, Spain (23–30 June), and Leipzig, Germany (29–30 June) – to estimate the impact of the dust transport on its DRE.
Independently of the atmospheric level where it is estimated, the instantaneous Df DRELW values are low and do not exceed +0.6 W m−2 in BCN and +0.2 W m−2 in LPZ. The respective daily values do not exceed +0.42 and +0.08 W m−2. On average over the whole event the contribution of Df daily DRELW to the total dust DRELW is not higher than 4 %. Most of the dust DRELW is thus produced by the coarse-mode particles. Instantaneous Dc DRELW at SRF in BCN reaches a maximum of +11.4 W m−2 and the daily values a maximum of +9.8 W m−2. In LPZ the instantaneous and daily values reach maxima at +3.3 and +1.3 W m−2, respectively. Dc DRELW at TOA is smaller than at SRF, which produces a negative (cooling) effect in the atmosphere. Df DRELW in BCN represents 6.7 (3.7) % at SRF (TOA) of its SW counterpart. The Dc LW SW DRE ratio in BCN increases from ∼ 80 % at the beginning of the episode up to 170 % towards the end of it. Such an unusual tendency is attributed to increasing coarse-mode size and surface temperature throughout the episode. In the last 4 d of the episode Dc DRELW is larger than Dc DRESW (Dc LW SW DRE ratio >100 %) at both SRF and TOA. This is a singular result of this study which has the effect of reducing considerably the SW cooling.
The results of the dust net DRE are discussed in terms of daily values which are the magnitude that matters for assessing the effect of aerosols on the Earth–atmospheric radiative budget. The fine-mode DRENET is similar to DRESW since |DRELW|≪|DRESW|. In BCN Dc DRENET at SRF is negative at the beginning of the event and positive afterwards (peak at +3.1 W m−2). In LPZ Dc DRENET is slightly negative (mean of −0.25 W m−2). At TOA the same tendency is observed in BCN (peak at +3.1 W m−2), but in LPZ Dc DRENET is also positive at TOA (mean of +0.50 W m−2). This stronger effect of the dust DRELW at TOA (vs. SRF) in LPZ is related to the quite high dust plume in LPZ (>3.3 km). Overall, the total dust net DRE is small: −3.0 (−2.3) W m−2 at SRF (TOA) in BCN and −1.40 (−0.35) W m−2 in LPZ. On one occasion at SRF in BCN DD DRENET is even positive (+0.9 W m−2 on 28 June) indicating a total dust net warming at the surface, which contrasts with the “traditional” dust cooling effect usually observed in clear sky conditions.
As far as dust direct radiative efficiency is concerned, Df LW DREff is small so that Df net DREff is nearly equal to Df SW DREff. Dc LW DREff is positive, which contributes to the significant decrease in the net DREff with respect to the SW one. Overall, the total dust net DREff is −54.1 (−37.3) W m−2 τ−1 at SRF (TOA) in BCN and −85.3 (−114.2) W m−2 τ−1 in LPZ. The higher dust direct radiative efficiency in LPZ (vs. BCN) is due to the SW component, already discussed in the companion paper. At TOA the difference between DD net DREff at both sites is caused by the larger compensation of the LW component in BCN (vs. LPZ). Finally it should be noted that, in BCN at the event scale and for the total dust, the inclusion of the LW DRE in the calculation of the total net DREff reduces by a factor of 1.6 the SW DREff at SRF and BOA and by a factor of 1.8 in the atmosphere. These reduction factors significantly larger than 1 highlight the importance of considering the long-wave component in studies focused on mineral dust radiative effects.
In order to evaluate the impact of the heatwave that accompanied the dust intrusion on the dust radiative effect, we perform a sensitivity study on the surface temperature and the air temperature in the dust layer, both linked to the heatwave and upon which the LW DRE strongly depends. Three scenarios are considered: (1) the LST is set to climatological values, (2) the air temperature in the dust layer is reduced by 6 ∘C, and (3) a combination of the first two scenarios. Our findings show that the increase in LST and air temperature in the dust layer caused by the heatwave (1) provoked a reduction in the dust net cooling effect at the surface, (2) left unchanged the dust net cooling effect at TOA and (3) consequently reduced the dust net heating of the atmosphere. The situation at the surface is a vicious circle: the heatwave reduces the dust cooling effect which, in turn, may increase some critical variables associated with the heatwave (e.g., LST and air temperature). Since recent studies have warned that mega-heatwaves such as the one studied in this work might become more frequent in the future, the novel results presented in this paper call for more research on the subject.
Part of the data used in this publication were obtained as part of the AERONET network (https://aeronet.gsfc.nasa.gov/new_web/aerosols.html, NASA, 2022) and are publicly available. MPL data are available on request. For additional data or information please contact the authors.
MS and CCJ designed the study and wrote the original draft paper. CCJ, MS and AA provided data. CCJ, MS and MALC performed data analysis with contributions from AA, AC, MPZ, ARG and CMP. All authors reviewed and edited the final version of the manuscript. All the authors agreed to the final version of the paper.
The contact author has declared that neither they nor their co-authors have any competing interests.
Publisher’s note: Copernicus Publications remains neutral with regard to jurisdictional claims in published maps and institutional affiliations.
The MPLNET project is funded by the NASA Radiation Sciences Program and Earth Observing System. The MPLNET staff at NASA GSFC is warmly acknowledged for the continuous help in keeping the P-MPL systems and the data analysis up to date. We particularly thank Ellsworth Judd Welton for providing the P-MPL unit in place at the Barcelona site.
This research was funded by the Spanish Ministry of Science, Innovation and Universities (CGL2017-90884-REDT and PRX18/00137 “Salvador de Madariaga” program), the Spanish Ministry of Science and Innovation (PID2019-104205GB-C21 and PID2019-103886RB-I00), the H2020 program from the European Union (GA nos. 654109, 778349, 871115 and 101008004), and both Units of Excellence “María de Maeztu” (MDM-2016-0600 and MDM-2017-0737) financed by the Spanish State Research Agency (AEI). MALC is supported by the INTA predoctoral contract programme.
This paper was edited by Eduardo Landulfo and reviewed by two anonymous referees.
Abdelkader, M., Metzger, S., Mamouri, R. E., Astitha, M., Barrie, L., Levin, Z., and Lelieveld, J.: Dust–air pollution dynamics over the eastern Mediterranean, Atmos. Chem. Phys., 15, 9173–9189, https://doi.org/10.5194/acp-15-9173-2015, 2015.
AEMET: June 2019 heatwave in the context of the climate crisis, AEMET blog, available at: https://aemetblog.es/2019/07/02/analisis-de-la-ola-de-calor-de-junio-de-2019-en-un-contexto-de-crisis-climatica/, last access: 27 April 2021.
Athanasopoulou, E., Protonotariou, V., Papangelis, G., Tombrou, M., Mihalopoulos, N., and Gerasopoulos, E.: Long-range transport of Saharan dust and chemical transformations over the Eastern Mediterranean, Atmos. Environ., 140, 592–604, https://doi.org/10.1016/j.atmosenv.2016.06.041, 2016.
Barragan, R., Romano, S., Sicard, M., Burlizzi, P., Perrone, M. R., and Comeron, A.: Estimation of mineral dust direct radiative forcing at the European Aerosol Research Lidar NETwork site of Lecce, Italy, during the ChArMEx/ADRIMED summer 2013 campaign: Impact of radiative transfer model spectral resolutions, J. Geophys. Res.-Atmos., 121, 10237–10261, https://doi.org/10.1002/2016JD025016, 2016.
Barragan, R., Sicard, M., Totems, J., Léon, J. F., Dulac, F., Mallet, M., Pelon, J., Alados-Arboledas, L., Amodeo, A., Augustin, P., Boselli, A., Bravo-Aranda, J. A., Burlizzi, P., Chazette, P., Comerón, A., D'Amico, G., Dubuisson, P., Granados-Muñoz, M. J., Leto, G., Guerrero-Rascado, J. L., Madonna, F., Mona, L., Muñoz-Porcar, C., Pappalardo, G.,. Perrone, M. R , Pont, V., Rocadenbosch, F., Rodriguez-Gomez, A., Scollo, S., Spinelli, N., Titos, G., Wang, X., Zanmar Sanchez, R.: Spatio-temporal monitoring by ground-based and air- and space-borne lidars of a moderate Saharan dust event affecting southern Europe in June 2013 in the framework of the ADRIMED/ChArMEx campaign, Air Qual. Atmos. Hlth., 10, 261–285, https://doi.org/10.1007/s11869-016-0447-7, 2017.
Barragan, R., Molero, F., Granados-Muñoz, M. J., Salvador, P., Pujadas, M., and Artíñano, B.: Feasibility of Ceilometers Data to Estimate Radiative Forcing Values: Application to Different Conditions around the COVID-19 Lockdown Period, Remote Sens., 12, 3699, https://doi.org/10.3390/rs12223699, 2020.
Barriopedro, D., Fisher, E., Luterbacher, J., Trigo, R. M., and García-Herrera, R.: The hot summer of 2010: redrawing the temperature record map of Europe, Science, 322, 220–224, https://doi.org/10.1126/science.1201224, 2011.
Basu, R. and Samet, J. M.: Relation between elevated ambient temperature and mortality: a review of the epidemiologic evidence, Epidemiol. Rev., 24, 190–202, 2002.
Chung, E.-S., Sohn, B.-J., and Schmetz, J.: Diurnal variation of outgoing longwave radiation associated with high cloud and UTH changes from Meteosat-5 measurements, Meteorol. Atmos. Phys., 105, 109–119, https://doi.org/10.1007/s00703-009-0041-8, 2009.
Copernicus: Climate Change Service, available at: https://climate.copernicus.eu/record-breaking-temperatures-june, last access: 27 April 2021.
Córdoba-Jabonero, C., Sicard, M., López-Cayuela, M.-Á., Ansmann, A., Comerón, A., Zorzano, M.-P., Rodríguez-Gómez, A., and Muñoz-Porcar, C.: Aerosol radiative impact during the summer 2019 heatwave produced partly by an inter-continental Saharan dust outbreak – Part 1: Short-wave dust direct radiative effect, Atmos. Chem. Phys., 21, 6455–6479, https://doi.org/10.5194/acp-21-6455-2021, 2021.
Díaz, J., Linares, C., Carmona, R., Russo, A., Ortiz, C., Salvador, P., and Machado Trigo, R.: Saharan dust intrusions in Spain: Health impacts and associated synoptic conditions, Environ. Res., 156, 455–467, 2017.
di Sarra, A., Di Biagio, C., Meloni, D., Monteleone, F., Pace, G., Pugnaghi, S., and Sferlazzo, D.: Shortwave and longwave radiative effects of the intense Saharan dust event of 25–26 March, 2010, at Lampedusa (Mediterranean sea), J. Geophys. Res., 116, D23209, https://doi.org/10.1029/2011JD016238, 2011.
Dubuisson, P., Buriez, J. C., and Fouquart, Y.: High Spectral Resolution Solar Radiative Transfer in Absorbing and Scattering Media: Application to the Satellite Simulation, J. Quant. Spectrosc. Ra., 55, 103–126, https://doi.org/10.1016/0022-4073(95)00134-4, 1996.
Dubuisson, P., Dessailly, D., Vesperini, M., and Frouin, R.: Water Vapor Retrieval Over Ocean using Near-infrared Radiometry, J. Geophys. Res.-Atmos., 109, D19106, https://doi.org/10.1029/2004JD004516, 2004.
Dubuisson, P., Roger, J., Mallet, M., and Dubovik, O.: A Code to Compute the Direct Solar Radiative Forcing: Application to Anthropogenic Aerosols during the Escompte Experiment, in: Proc. International Radiation Symposium (IRS 2004) on Current Problems in Atmospheric Radiation, 23–28 August 2004, Busan, Korea, edited by: Fischer, H., Sohn, B.-J., and Deepak, A., Hampton, 127–130, 23–28 August 2004, Busan, Korea, 2006.
Dufresne, J., Gautier, C., and Ricchiazzi, P.: Longwave scattering effects of mineral aerosols, J. Atmos. Sci. 59, 1959–1966, 2002.
Freitas, S. C., Trigo, I., Macedo, J., Barroso, C., Silva, R., and Perdigao, R.: Land Surface Temperature from multiple geostationary satellites, Int. J. Remote Sens., 34, 3051–3068, 2013.
Granados-Muñoz, M. J., Sicard, M., Román, R., Benavent-Oltra, J. A., Barragán, R., Brogniez, G., Denjean, C., Mallet, M., Formenti, P., Torres, B., and Alados-Arboledas, L.: Impact of mineral dust on shortwave and longwave radiation: evaluation of different vertically resolved parameterizations in 1-D radiative transfer computations , Atmos. Chem. Phys., 19, 523–542, https://doi.org/10.5194/acp-19-523-2019, 2019a.
Granados-Muñoz, M. J., Sicard, M., Papagiannopoulos, N., Barragán, R., Bravo-Aranda, J. A., and Nicolae, D.: Two-dimensional mineral dust radiative effect calculations from CALIPSO observations over Europe, Atmos. Chem. Phys., 19, 13157–13173, https://doi.org/10.5194/acp-19-13157-2019, 2019b.
Griffin, D. W.: Atmospheric movement of microorganisms in clouds of desert dust and implications for human health, Clin. Microbiol. Rev., 20, 459–477, 2007.
Krekov, G. M.: Models of atmospheric aerosols, edited by: Jennings, S. G., Aerosol Effects on Climate, University of Arizona Press, Tucson, AZ, 9–72, 1993.
Kunst, A. E., Looman C. W., and Mackenbach, J. P.: Outdoor air temperature and mortality in the Netherlands: a time-series analysis, Am. J. Epidemiol., 137, 331–341, 1993.
Lacis, A. A. and Oinas, V.: A Description of the Correlated K Distribution Method for Modeling Nongray Gaseous Absorption, Thermal Emission, and Multiple Scattering in Vertically Inhomogeneous Atmospheres, J. Geophys. Res.-Atmos., 96, 9027–9063, https://doi.org/10.1029/90JD01945, 1991.
Landi, T. C., Bonasoni, P., Brunetti, M., Campbell, J. R., Marquis, J. W., Di Girolamo, P., and Lolli, S.: Aerosol Direct Radiative Effects under Cloud-Free Conditions over Highly-Polluted Areas in Europe and Mediterranean: A Ten-Years Analysis (2007–2016), Remote Sens., 13, 2933, https://doi.org/10.3390/rs13152933, 2021.
Ma, F., Yuan, X., Jiao, Y., and Ji, P.: Unprecedented Europe heat in June–July 2019: Risk in the historical and future context, Geophys. Res. Lett., 47, e2020GL087809, https://doi.org/10.1029/2020GL087809, 2020.
Meloni, D., Junkermann, W., Di Sarra, A., Cacciani, M., De Silvestri, L., Di Iorio, T., Estellés, V., Gómez-Amo, J. L., Pace, G., and Sferlazzo, D. M.: Altitude-resolved Shortwave and Longwave Radiative Effects of Desert Dust in the Mediterranean during the GAMARF Campaign: Indications of a Net Daily Cooling in the Dust Layer, J. Geophys. Res.-Atmos., 120, 3386–3407, https://doi.org/10.1002/2014JD022312, 2015.
NASA: AERONET network, https://aeronet.gsfc.nasa.gov/new_web/aerosols.html, last access: 7 February 2022.
Osborne, S. R., Baran, A. J., Johnson, B. T., Haywood, J. M., Hesse, E., and Newman, S.: Short-wave and Long-wave Radiative Properties of Saharan Dust Aerosol, Q. J. Roy. Meteor. Soc., 137, 1149–1167, https://doi.org/10.1002/qj.771, 2011.
Osipov, S., Stenchikov, G., Brindley, H., and Banks, J.: Diurnal cycle of the dust instantaneous direct radiative forcing over the Arabian Peninsula, Atmos. Chem. Phys., 15, 9537–9553, https://doi.org/10.5194/acp-15-9537-2015, 2015
Papayannis, A., Amiridis, V., Mona, L., Tsaknakis, G., Balis, D., Bösenberg, J., Chaikovski, A., De Tomasi, F., Grigorov, I., Mattis, I., Mitev, V., Müller, D., Nickovic, S., Pérez, C., Pietruczuk, A., Pisani, G., Ravetta, F., Rizi, V., Sicard, M., Trickl, T., Wiegner, M., Gerding, M., Mamouri, R. E., D'Amico, G., and Pappalardo, G.: Systematic lidar observations of Saharan dust over Europe in the frame of EARLINET (2000–2002), J. Geophys. Res., 113, D10204, https://doi.org/10.1029/2007JD009028, 2008.
Prospero, J. M., Ginoux, P., Torres, O., Nicholson, S. E., and Grill, T. E.: Environmental characterization of global sources of atmospheric soil dust identified with the Nimbus 7 Total Ozone Mapping Spectrometer (TOMS) absorbing aerosol product, Rev. Geophys., 40, 1002, https://doi.org/10.1029/2000RG000095, 2002.
Querol, X., Pérez, N., Reche, C., Ealo, M., Ripoll, A., Tur, J., Pandolfi, M., Pey, J., Salvador, P., Moreno, T., and Alastuey, A.: African dust and air quality over Spain: Is it only dust that matters?, Sci Total Environ., 10, 737–752, https://doi.org/10.1016/j.scitotenv.2019.05.349, 2019.
Sicard, M., Bertolín, S., Mallet, M., Dubuisson, P., and Comerón, A.: Estimation of mineral dust long-wave radiative forcing: sensitivity study to particle properties and application to real cases in the region of Barcelona, Atmos. Chem. Phys., 14, 9213–9231, https://doi.org/10.5194/acp-14-9213-2014, 2014a.
Sicard, M., Bertolín, S., Muñoz, C., Rodríguez, A., Rocadenbosch, F., and Comerõn, A.: Separation of aerosol fine- and coarse mode radiative properties: Effect on the mineral dust longwave, direct radiative forcing, Geophys. Res. Lett., 41, 6978–6985, https://doi.org/10.1002/2014GL060946, 2014b.
Slingo, A., Wilderspin, R. C., and Brentnall, S. J.: Simulation of the diurnal cycle of outgoing longwave radiation with an atmospheric GCM, Mon. Weather Rev., 115, 1451–1457, 1987.
Sousa, P. M., Barriopedro, D., Ramos, A. M., García-Herrera, R., Espírito-Santo, F., and Trigo, R. M.: Saharan air intrusions as a relevant mechanism for Iberian heatwaves: The record breaking events of August 2018 and June 2019, Weather and Climate Extremes, 26, 100224, https://doi.org/10.1016/j.wace.2019.100224, 2019.
Stamnes, K., Tsay, S., Wiscombe, W., and Jayaweera, K.: Numerically Stable Algorithm for Discrete-Ordinate-Method Radiative Transfer in Multiple Scattering and Emitting Layered Media, Appl. Optics, 27, 2502–2509, https://doi.org/10.1364/AO.27.002502, 1988.
Tobías, A., Pérez, L., Díaz, J., Linares, C., Pey, J., Alastruey, A., and Querol, X.: Shortterm effects of particulate matter on total mortality during Saharan dust outbreaks: a Case-Crossover analysis in Madrid (Spain), Sci. Total. Environ., 412–413, 386–389, 2011.
Valenzuela, A., Costa, M. J., Guerrero-Rascado, J. L., Bortoli, D., and Olmo, J. L.: Solar and thermal radiative effects during the 2011 extreme desert dust episode over Portugal, Atmos. Environ., 148, 16–29, 2017.
Vautard, R., van Aalst, M., Boucher, O., Drouin, A., Haustein, K., Kreienkamp, F., van Oldenborgh, G. J., Otto, F. E. L., Ribes, A., Robin, Y., Schneider, M., Soubeyroux, J.-M., Stott, P., Seneviratne, S. I., Vogel, M. M., and Wehner, M.: Human contribution to the record-breaking June and July 2019 heatwaves in Western Europe, Environ. Res. Lett., 15, 094077, https://doi.org/10.1088/1748-9326/aba3d4, 2020.
Volz, F.: Infrared optical constants of aerosols at some locations, Appl. Optics, 22, 23, 3690–3700, 1983.
Xu, P., Wang, L., Liu, Y., Chen, W., and Huang, P.: The record-breaking heat wave of June 2019 in Central Europe, Atmos. Sci. Lett., 21, e964, https://doi.org/10.1002/asl.964, 2020.
Xu, P., Wang, L., Huang, P., and Chen, W.: Disentangling dynamical and thermodynamical contributions to the record-breaking heatwave over Central Europe in June 2019, Atmos. Res., 252, 105446, https://doi.org/10.1016/j.atmosres.2020.105446, 2021.
Xu, W., Kuang, Y., Liang, L., He, Y., Cheng, H., Bian, Y., Tao, J., Zhang, G., Zhao, P., Ma, N., Zhao, H., Zhou, G., Su, H., Cheng, Y., Xu, X., Shao, M., and Sun, Y.: Dust-Dominated Coarse Particles as a Medium for Rapid Secondary Organic and Inorganic Aerosol Formation in Highly Polluted Air, Environ. Sci. Technol., 54, 15710–15721, https://doi.org/10.1021/acs.est.0c07243, 2020.
Zhou, D. K., Larar, A. M., and Liu, X.: MetOp-A/IASI Observed Continental Thermal IR Emissivity Variations, IEEE J. Sel. Top. Appl., 6, 1156–1162, https://doi.org/10.1109/JSTARS.2013.2238892, 2013.