the Creative Commons Attribution 4.0 License.
the Creative Commons Attribution 4.0 License.
 | 05 Jan 2022
Case study of a moisture intrusion over the Arctic with the ICOsahedral Non-hydrostatic (ICON) model: resolution dependence of its representation
Hélène Bresson
Mario Mech
Daniel Reinert
Vera Schemann
Kerstin Ebell
Marion Maturilli
Carolina Viceto
Irina Gorodetskaya
Susanne Crewell
The Arctic is warming faster than the global average and any other region of a similar size. One important factor in this is the poleward atmospheric transport of heat and moisture, which contributes directly to the surface and air warming. In this case study, the atmospheric circulation and spatio-temporal structure of a moisture intrusion event is assessed, which occurred from 5 to 7 June 2017 over the Nordic seas during an intensive measurement campaign over Svalbard. This analysis focuses on high-spatial-resolution simulations with the ICON (ICOsahedral Non-hydrostatic) model which is put in context with coarser-resolution runs as well the ERA5 reanalysis. A variety of observations including passive microwave satellite measurements is used for evaluation. The global operational ICON forecasts from the Deutscher Wetterdienst (DWD) at 13 km horizontal resolution are used to drive high-resolution Limited-Area Mode (LAM) ICON simulations over the Arctic with 6 and 3 km horizontal resolutions. The results show the skilful capacity of the ICON-LAM model to represent the observed spatio-temporal structure of the selected moisture intrusion event and its signature in the temperature, humidity and wind profiles, and surface radiation. In several aspects, the high-resolution simulations offer a higher accuracy than the global simulations and the ERA5 reanalysis when evaluated against observations. One feature where the high-resolution simulations demonstrated an advanced skill is the representation of the changing vertical structure of specific humidity and wind associated with the moisture intrusion passing Ny-Ålesund (western Svalbard); the humidity increase at 1–2 km height topped by a dry layer and the development of a low-level wind jet are best represented by the 3 km simulation. The study also demonstrates that such moisture intrusions can have a strong impact on the radiative and turbulent heat fluxes at the surface. A drastic decrease in downward shortwave radiation by ca. 500 W m−2 as well as an increase in downward longwave radiation by ca. 100 W m−2 within 3 h have been determined. These results highlight the importance of both moisture and clouds associated with this event for the surface energy budget.
- Article
(26342 KB) - Full-text XML
- BibTeX
- EndNote


Several processes and feedback mechanisms contribute to the Arctic amplification (Serreze and Barry, 2011; Wendisch et al., 2017). One is the retreating snow and sea-ice cover and associated upward heat fluxes (Serreze et al., 2009; Screen and Simmonds, 2010). Another relevant factor is the atmospheric poleward transport of heat and moisture (Naakka et al., 2018; Rydsaa et al., 2021), which contributes to the warming directly due to increased downward longwave radiation and indirectly due to cloud radiative effects and increased surface heat fluxes via associated sea-ice reduction (Ghatak and Miller, 2013; Boisvert et al., 2016; Woods and Caballero, 2016; Nygård et al., 2019). Intense moisture intrusion events, some of them identified as atmospheric rivers (ARs) – river-style narrow filaments of high amounts of vertically integrated moisture – account for a significant part of the poleward moisture transport into the Arctic (Woods et al., 2013; Liu and Barnes, 2015). AR events can trigger surface ice melt and bring heavy snow accumulation in the polar regions (Gorodetskaya et al., 2014; Woods et al., 2017; Martin et al., 2018; Nash et al., 2018; Wille et al., 2019; Mattingly et al., 2020). Thus, it is critical that climate models represent them realistically in order to correctly simulate the Arctic climate and thus improve our understanding of the processes responsible for the Arctic warming amplification. However, many models show biases in the representation of the vertical atmospheric thermodynamic structure, clouds, and surface heat fluxes in the Arctic (Sedlar et al., 2020; Inoue et al., 2021). This is due to an incomplete understanding and uncertainty in parameterizations of small-scale physical processes, such as mixed-phase low-level clouds and their interaction with boundary layer processes (Vihma et al., 2014) as well as coarse vertical and horizontal resolutions in current regional (ca. 5–50 km) and global (ca. 15–150 km) climate models. Added value of using higher horizontal resolutions has been reported e.g. for wind (Moore et al., 2015), moisture transport (Guan et al., 2018), and precipitation (Prein et al., 2015) simulations in Arctic environments. Furthermore, models and reanalyses have difficulty in capturing ARs, particularly in the polar regions (Martin et al., 2018; Gorodetskaya et al., 2020). Hence, case studies exploring different resolutions like the one presented here are important for better understanding of the processes and for improving parameterizations in both climate and weather prediction models.
The aim of this study is to provide a comprehensive evaluation of the spatio-temporal structure of an AR event in a suite of ICON (ICOsahedral Non-hydrostatic; Zängl et al., 2015) simulations. The model is used in a limited-area mode (LAM), referred to as ICON-LAM, over a circum-Arctic domain with two different horizontal resolutions (6 and 3 km) driven by 13 km global ICON forecasts. We investigate a moisture intrusion event, which occurred during the Arctic CLoud Observations Using airborne measurements during polar Day (ACLOUD) campaign over the Arctic Ocean and the sea ice north-west of Svalbard (Ehrlich et al., 2019; Wendisch et al., 2019). An analysis of the meteorological conditions during the campaign period May–June 2017 showed distinct air mass changes over the campaign months (Knudsen et al., 2018), including events of intense advection of warm and moist air. One of these, occurring from 5 to 7 June 2017, has been identified as an AR (Viceto et al., 2021) by the AR algorithm from Gorodetskaya et al. (2014, 2020). It originated from western Siberia and travelled over the Barents Sea and reached Svalbard. This AR is the focus of our case study.
Given the general lack of observations in the Arctic, the ICON-LAM simulations of the spatio-temporal evolution of this AR will be mainly compared with reanalysis data and measurements from the AWIPEV research base in Ny-Ålesund, Svalbard, and the research station in Shoyna (hereafter called Shojna, from the IGRA network station name), northern Russia. In addition, the skill of humidity simulations will be quantified in a two-way approach. The classical observation-to-model method, where model variables are directly compared with observations, will be complemented by the model-to-observation approach using forward-simulated and directly measured brightness temperatures (TB). For this, synthetic TB are derived for ICON-LAM simulations with the Passive and Active Microwave radiative TRAnsfer operator (PAMTRA; Mech et al., 2020).
The research questions addressed by this AR case study are the following.
-
Can ICON-LAM represent the spatio-temporal structure of the AR reasonably? For this, the observed AR characteristics are studied in detail and the model evaluation results will provide us with insights into where a model skill is lacking.
-
What is the effect of the model horizontal resolution on the representation of the AR? The comparison will show us whether an increased resolution results in an apparent added value in the simulations.
Section 2 of this paper describes the evaluation data and the applied model. The presented assessment of the selected AR event, in Sect. 3, includes its spatio-temporal structure (Sect. 3.1), signature at observational stations (Sect. 3.2), and impact on surface radiative and heat fluxes (Sect. 3.3). Finally, a summary and conclusions are presented in Sect. 4.
2.1 Observational datasets
2.1.1 Data from Ny-Ålesund/Svalbard during the ACLOUD campaign
In Ny-Ålesund (78.55∘ N, 11.55∘ E; see Fig. 1), Svalbard, the atmospheric column is observed by a variety of instruments operated at the AWIPEV research base (operated by the German Alfred Wegener Institute Helmholtz Centre for Polar and Marine Research, AWI, and the French Polar Institute Paul Emile Victor, IPEV). In this study, we use data obtained from ground-based remote-sensing and balloon-borne radiosondes. During the ACLOUD campaign, four radiosonde launches per day were performed at 05:00, 11:00, 17:00, and 23:00 UTC (i.e. 1 h prior to WMO standard synoptic hours, in order to reach the level of 100 hPa at an average ascent of 5 m s−1), providing vertical profiles of temperature, pressure, relative humidity, as well as wind speed and direction (Maturilli, 2017) and allowing the analysis of the vertical profile of the atmosphere. Specific humidity was retrieved for the entire column, allowing the calculation of integrated water vapour (IWV). Moreover, IWV was derived based on the zenith path delay of Global Navigation Satellite System (GNSS) ground station data (Dick et al., 2001; Gendt et al., 2004) with a temporal resolution of 15 min and an accuracy of 1–2 kg m−2. Ground-based remote sensing with a HATPRO microwave radiometer enables the retrieval of IWV over Ny-Ålesund every 2 s (Nomokonova et al., 2019a), with an uncertainty of about 0.5 kg m−2 (Crewell et al., 2021) as shown in comparisons to radiosonde measurements. Note that HATPRO provides the water vapour column directly above the station, while GNSS measurements are taken between ground and several GNSS satellites, leading to a footprint of about 30 km (Steinke et al., 2015). In addition, the Ny-Ålesund surface radiation budget components observed in the framework of the Baseline Surface Radiation Network (BSRN) (Maturilli, 2018) are used in this study.
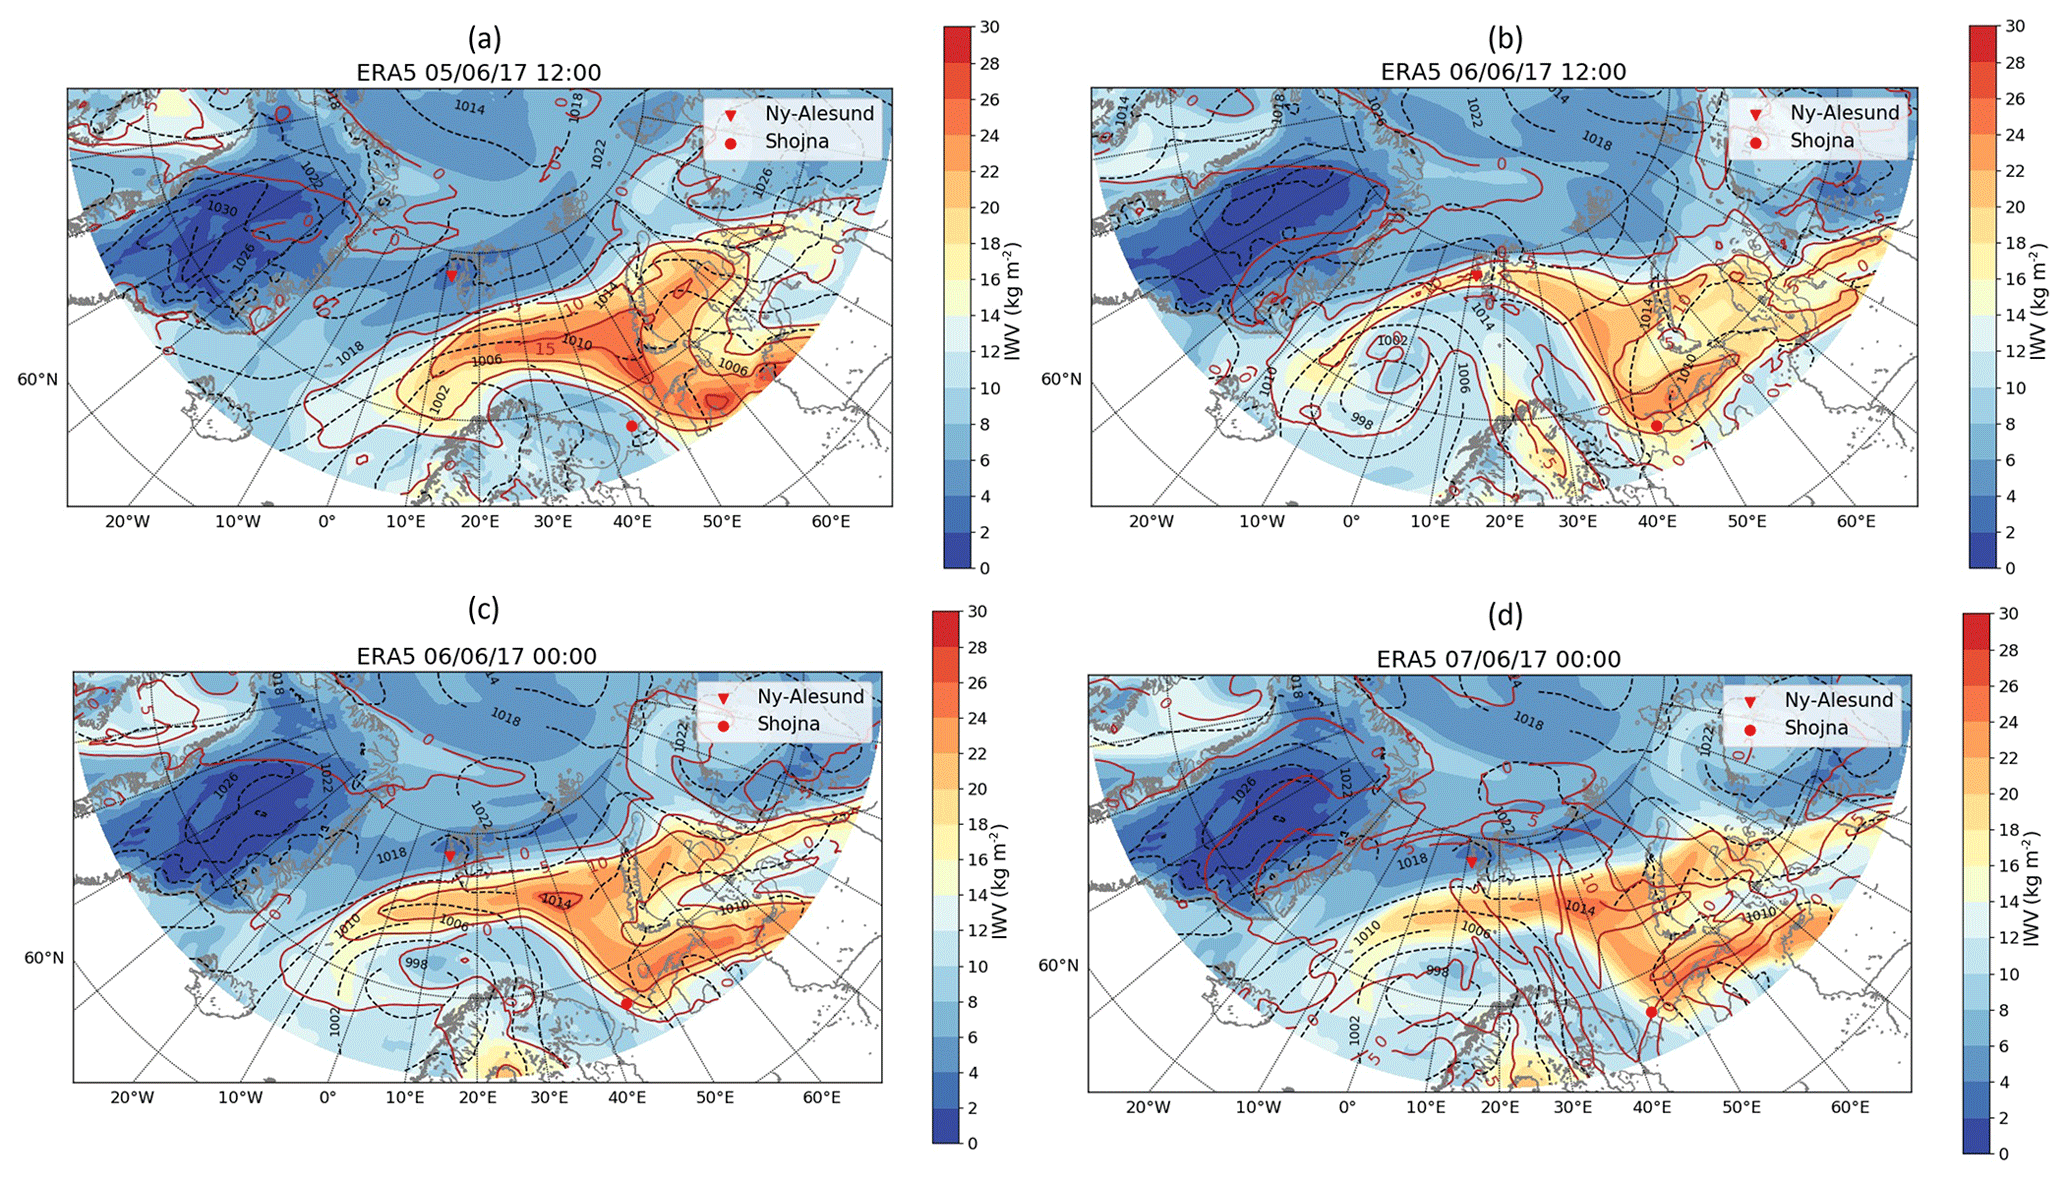
Figure 1Integrated water vapour (IWV, kg m−2, colour shading) and mean sea level pressure (MSLP, hPa, black isolines) from ERA5 over the Atlantic sector of the Arctic on 5 June 2017 12:00 UTC (a), 6 June 2017 00:00 UTC (b), 6 June 2017 12:00 UTC (c), and 7 June 2017 00:00 UTC (d). The brown isolines represent the IWV anomaly (contours each 5 kg m−2) at those dates compared to the mean from 1979–2020 climatology. The red symbols show the locations of the Ny-Ålesund (78.55∘ N, 11.55∘ E) and Shojna (67.88∘ N, 44.17∘ E) stations.
2.1.2 Radiosonde data from the Russian station Shojna
As the selected AR has its origin in the north-west of Russia, radiosonde data at different Russian research stations from the Integrated Global Radiosonde Archive (IGRA, Durre et al., 2006) network have been explored. Vertical profiles during the AR development were captured by radiosonde measurements at the Shojna research station (official WMO station name: Shoyna), located in the Russian Arctic, at the western Kanin Peninsula, between the White and Barents seas (67.88∘ N, 44.17∘ E; see Fig. 1). Accordingly, its radiosonde data for specific humidity, air temperature, and wind speed on 5 and 6 June (at 12:00 UTC for both days) are included in our analysis.
2.1.3 Satellite-based observations by a passive remote-sensing instrument
Passive microwave instruments on polar-orbiting satellites are well suited to providing observations at higher latitudes. By their wide swaths (1920 km), a good spatial coverage can be achieved. With the operation on multiple platforms, several overpasses over the same geographic location during one day are possible. ARs, as features governed by water vapour structures and associated clouds and precipitation, can be well observed with instruments measuring the brightness temperature TB along the wings of water vapour absorption bands. The Microwave Humidity Sounder (MHS; Barker et al., 2012) instrument operated on the MetOp-A satellite utilizes three water-vapour-sensitive channels at the H2O line around 183.31 GHz (183.31 ± 1, 183.31 ± 3, and 190.31 GHz) along with two window frequencies at 89 and 157 GHz. At nadir the footprint size is about 16 km and increases towards the edges of the 1920 km-wide swath. An advantage of higher frequencies in the absorption bands is the reduced influence of the surface due to a higher atmospheric opacity and therefore a signal that can be related to mid- and upper-tropospheric water vapour concentrations. The observations in the atmospheric windows are strongly influenced by the surface (open ocean, sea ice, and land) but on the other hand give information on the hydrometeor contents like liquid water path, precipitation, and snow water path through emission and scattering signals.
2.2 PAMTRA forward simulator
Comparing atmospheric models to observations can be done in observational or modelling space. For studies in the modelling space, retrieval algorithms are required to derive modelled quantities from the observations (observation to model). To compare measurements and models in the observational space (model to observation), appropriate forward operators for the observation wavelengths are needed. Here we make use of the PAMTRA tool (Mech et al., 2020), a software package suited for the simulation of passive and active observations in the microwave frequency region based on atmospheric model output. PAMTRA has been applied to the ICON-LAM simulation output to derive the TB for the AR event for the MHS frequencies with model output at 3 and 6 km horizontal resolutions and for ERA5 on a 0.25∘ grid for 6 June 2017 12:00 UTC, the date of the distinct AR pattern. For the purpose of this study, several assumptions have to be made. Depending on the surface type (ocean/land) of a grid point, different models, such as TESSEM (Prigent et al., 2017) and TELSEM (Aires et al., 2011), and data (sea surface temperature (SST), wind speed, sea-ice cover) are employed to derive the surface emissivity (see Mech et al., 2020, for more details). To model the effect of clouds and precipitation, the scattering properties of liquid hydrometeors are calculated by Mie theory (Mie, 1908) from the ICON hydrometeor mixing ratios taking into account the microphysical assumptions of the model. For cloud ice and snow, which are assumed to be non-spherical, the self-similar Rayleigh–Gans approximation has been used (Hogan et al., 2017). Absorption coefficients for atmospheric gases relevant in the microwave frequency range, in particular water vapour, are calculated with a modified version of the Rosenkranz 98 model (Rosenkranz, 2015). The TB fields have been convoluted to match the footprint of satellite observations over the simulation area. Only observations from satellite overpasses within 1 h before and after the simulation time have been taken into account.
2.3 ERA5 reanalysis
ERA5 (Copernicus Climate Change Service, 2017) is the fifth generation of the European Centre for Medium-Range Weather Forecasts (ECMWF) global climate and weather reanalysis (Hersbach et al., 2020). ERA5 provides hourly estimates of a large range of environmental variables. ERA5 has a horizontal latitude–longitude grid resolution of about 31 km (native grid of 0.25∘ × 0.25∘), has 137 vertical model levels up to a height of 80 km (from 1000 to 1 hPa, with 40 levels below 5 km and the lowest level at 10 m), and covers a period from 1979 onward. This state-of-the-art reanalysis has been chosen for its high spatio-temporal resolution as well as its higher performances compared to ERA-Interim (Dee et al., 2011) for the ARs in the polar regions (Gorodetskaya et al., 2020). Further, it has been shown that ERA5 presents a high-quality reanalysis for the Arctic region (Graham et al., 2019; Mayer et al., 2019).
2.4 ICON model
This study makes use of the ICON model (Zängl et al., 2015). ICON allows simulations to be performed with various spatio-temporal resolutions, from long-term global climate simulations (Giorgetta et al., 2018) to very high-resolution large eddy simulations (Dipankar et al., 2015). One particular aspect of the ICON model is its icosahedral triangular grid, which allows a nearly homogeneous coverage of the globe, preventing numerical stability issues due to the so-called “pole problem” on traditional latitude–longitude grids. In this study, the ICON-NWP model (version 2.6.1) is set up in LAM over the Arctic region. Simulations are performed for the pan-Arctic, covering the domain north of 65∘ N (Fig. A1 from the Appendix) at horizontal grid resolutions of 6.58 and 3.29 km (respectively R3B08 and R3B09 following ICON's grid terminology). For both LAM grid resolutions, 70 vertical model levels are used, extending from the surface to the top height of 23 km (with 38 levels below 5 km and the lowest (full) level at 10 m). The vertical resolution gradually increases with height from 20 m near the surface to 2571 m at the model top.
The LAM simulations are initialized from global ICON analysis at 13.15 km horizontal grid spacing (R03B07, hereafter ICON-GLOBAL) and 90 vertical model levels up to 75 km (Deutscher Wetterdienst, 2020). The LAM simulations are forced at the lateral boundaries by 3-hourly ICON global forecast data (i.e. output data from operational DWD forecasts) and also include sea ice and SST updates (from the global forecast runs). Furthermore, no additional forcing is applied (i.e. the model evolves freely in the inner part of the domain up to the model top). The model is run over the selected AR period (from 5 to 7 June 2017) in the so-called forecast mode to force the model to stay close to the observed weather situation; i.e. the simulations are re-initialized every 30 h from the ICON-GLOBAL run. Thus, the model is initialized on 4 June 2017 18:00 UTC (Day I) and runs for 30 h until 5 June 2017 23:59 UTC (Day II). The second model run is initialized at 18:00 UTC of Day II and runs until 23:59 UTC of Day III, etc. The first 6 h of each model run are discarded afterwards in order to give the model a spin-up time (i.e. only output of Day II from 00:00 to 23:59 UTC for the first run are retained for our analysis). These simulations make use of the single-moment microphysics scheme (Seifert, 2008), which predicts the specific mass content of four hydrometeor categories such as cloud water, rainwater, cloud ice, and snow. This scheme is suitable for mesh sizes of 3 km and coarser and recommended for LAM simulations (Prill et al., 2020). The Rapid Radiation Transfer Model (RRTM; Mlawer et al., 1997) is used to derive the radiative fluxes, and the Tiedtke–Bechtold convection scheme (Tiedtke, 1989; Bechtold et al., 2008) is applied to parameterize shallow convection at the fine 3–6 km horizontal scales of this study. The ICON-LAM simulations make use of ICON's sea-ice model (Mironov et al., 2012), which simulates sea-ice thermodynamics (i.e. growing and melting of sea ice as well as sea-ice albedo) but does not consider sea-ice dynamics (the sea-ice coverage is determined by the ice-fraction analysis). More information on the ICON model and its LAM set-up can be found in Prill et al. (2020).
3.1 Spatio-temporal structure of the atmospheric river
To illustrate the selected AR event, Fig. 1 shows ERA5-based spatial maps of IWV and mean sea level pressure (MSLP) evolution over the North Atlantic Ocean sector of the Arctic region from 5 June 2017 12:00 UTC to 7 June 2017 00:00 UTC. The locations of the Ny-Ålesund and Shojna research stations are also shown.
On 5 June 2017 12:00 UTC (Fig. 1a), a pronounced moist air intrusion can be seen arriving from the north-western Russian coasts and moving over the Kara and Barents seas into the Norwegian Sea. This moist air has IWV values of up to 30 kg m−2, while the rest of the region presents values lower than 10 kg m−2. From this time on, this moist air intrusion starts elongating and narrowing further south of Svalbard (Fig. 1b). On 6 June 2017 12:00 UTC, a thin and long path of moist air spreads from the Barents Sea to Iceland while passing over Ny-Ålesund and extending into the Greenland Sea, driven by the low-pressure system over the southern part of the Norwegian Sea (Fig. 1c). This moisture intrusion was detected as an AR in Viceto et al. (2021) using the AR detection algorithm from Gorodetskaya et al. (2020). Twelve hours later (Fig. 1d), the AR has dissipated, but some moisture is still present and mixed with dryer air from the surroundings. These IWV patterns are similar to those observed in other ARs occurring over polar regions (Wille et al., 2019; Gorodetskaya et al., 2020). Figure 1 also shows the ERA5-based IWV anomaly with respect to the 1979–2020 climatological mean. For the AR, a positive IWV anomaly as large as 15 kg m−2 is found. Such high IWV anomaly values are similar to those observed during strong moisture intrusions into the mid latitudes (Nash et al., 2018; Vázquez et al., 2018) and Siberian Arctic (Komatsu et al., 2018).
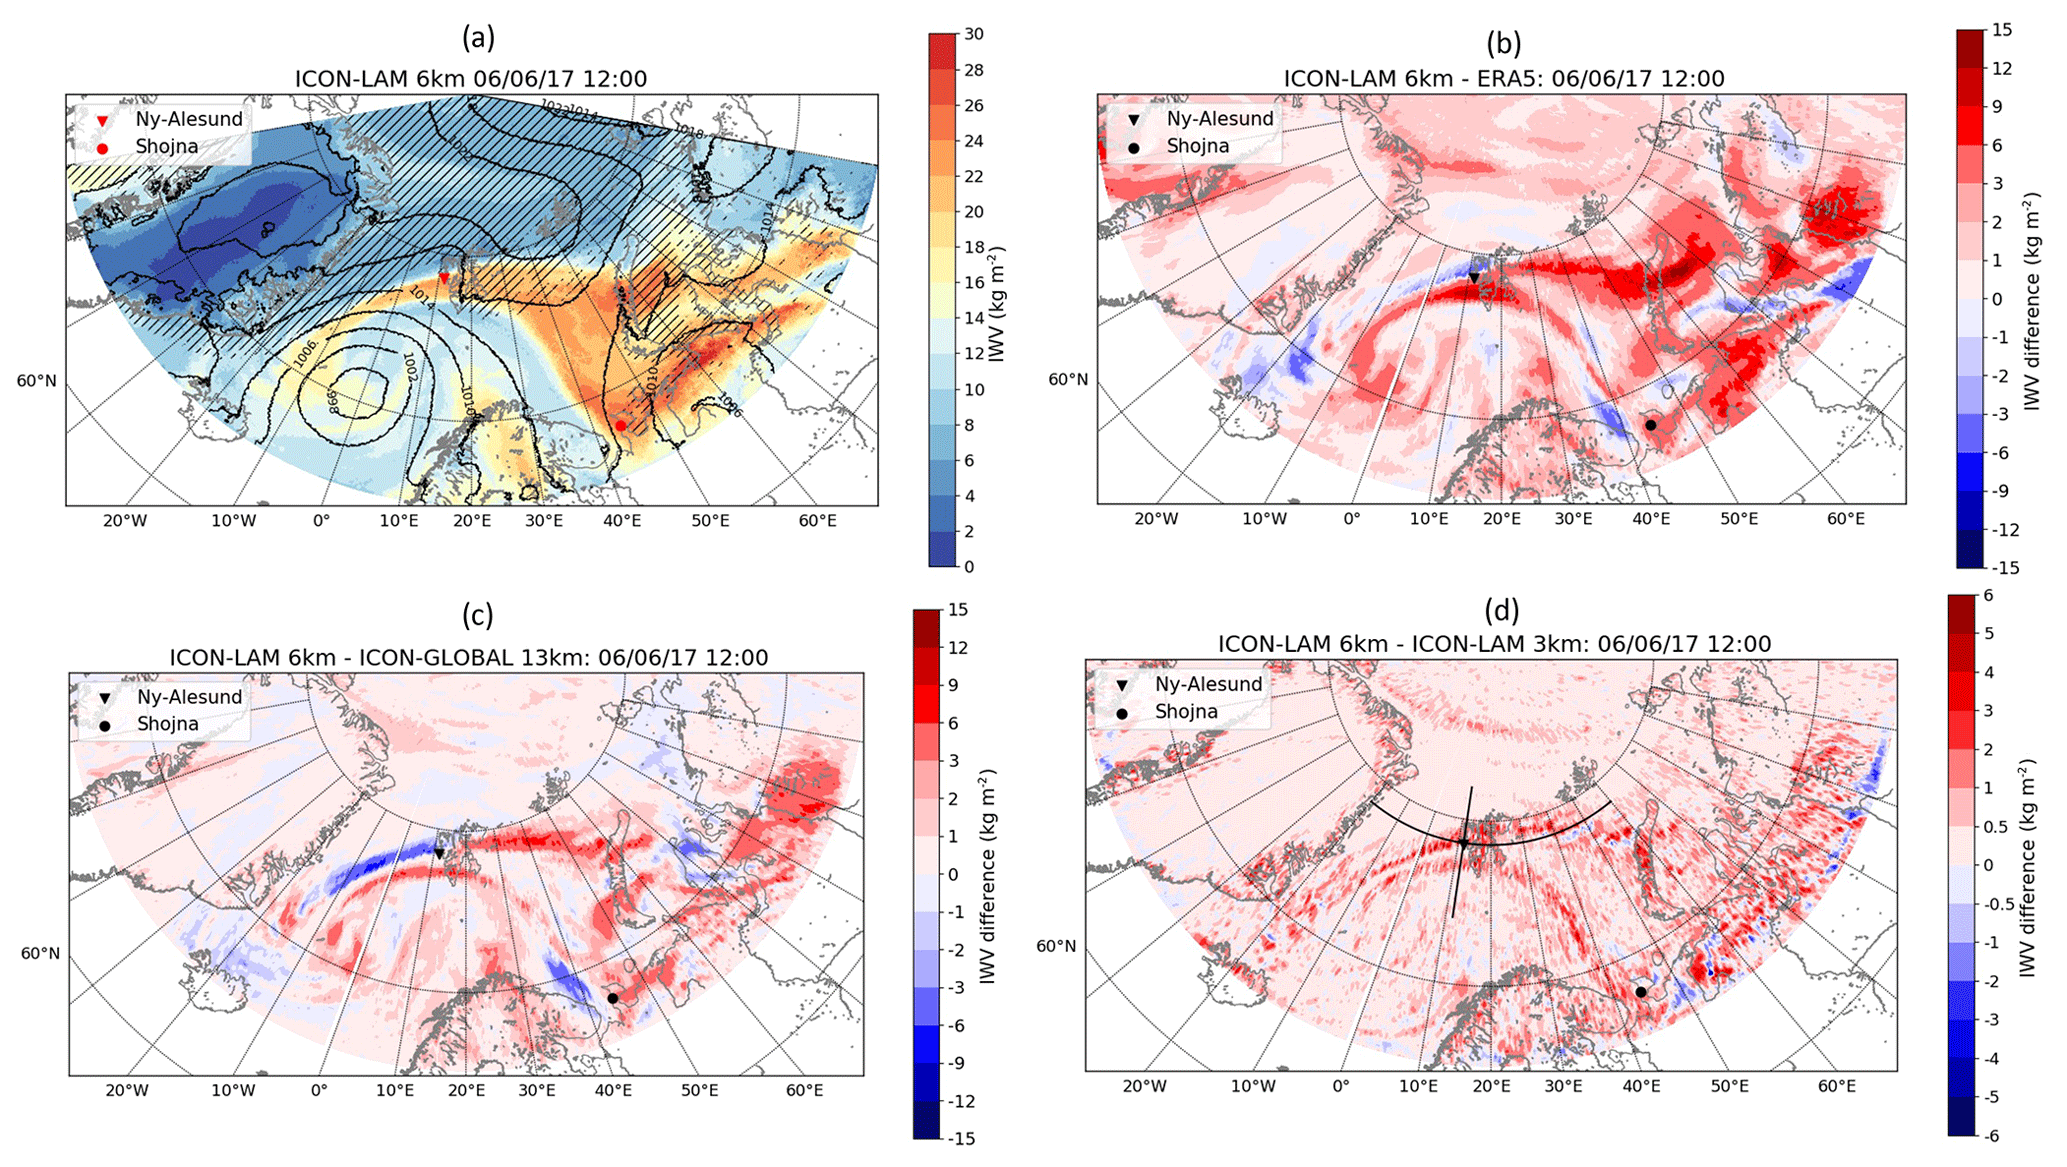
Figure 2(a) IWV (kg m−2, colour shading), MSLP (hPa, black isolines), and sea ice (black hatches for sea-ice fraction > 0.15) from ICON-LAM 6 km. (b–d) Differences of IWV between ICON-LAM 6 km and ERA5 (ICON-LAM6 − ERA5, b), ICON-GLOBAL 13 km (ICON-LAM6 − ICON-GLOBAL, c), and ICON-LAM 3 km (ICON-LAM6 − ICON-LAM3, d; note the different scale) on 6 June 2017 12:00 UTC. All IWV fields have been remapped onto the ERA5 (0.25 × 0.25 regular latitude–longitude) grid to calculate the differences. The black lines (d) are the reference lines for the presented cross sections in Fig. 4. The locations of the Ny-Ålesund and Shojna research stations are also shown.
As seen in Fig. 2, the general structure of the ICON-LAM6-simulated AR on 6 June 2017 12:00 UTC is in agreement with the one from ERA5. The IWV spatial pattern (“AR shape”) is well reproduced in comparison to the one of ERA5, with a pattern correlation of 0.91 (i.e. Pearson product-moment coefficient, calculated after the remapping of the IWV field from ICON-LAM6 onto the ERA5 regular Gaussian latitude–longitude grid). The IWV difference “ICON-LAM6 minus ERA5” (Fig. 2b) shows large positive differences (ca. 12 kg m−2) near the southern boundaries of the AR along the moisture location over the northern Barents and Kara seas. This indicates that ICON-LAM6 shows higher humidity compared to ERA5 at the AR location. The IWV differences “ICON-LAM6 minus ICON-GLOBAL” (Fig. 2c) and “ICON-GLOBAL minus ERA5” (see Fig. A2 from the Appendix) show that this high moisture level seen in ICON-LAM6 might be inherited from ICON-GLOBAL, as higher humidity values are seen in ICON-GLOBAL compared to ERA5 at the AR location. One possible explanation for the higher moisture level in ICON-GLOBAL might come from a higher moisture level (or bias) in the ICON-GLOBAL analysis. This moisture bias in the ICON-GLOBAL analysis is an issue known by the DWD and will hopefully be reduced in the latest ICON data assimilation system. Furthermore, pronounced filament-like anomalies (i.e. positive/negative IWV differences) occur over the northern Norwegian Sea in ICON-LAM6 compared to ERA5 and ICON-GLOBAL. These differences are within ±15 kg m−2 and indicate a southward shift of the AR in ICON-LAM6 compared to ERA5 and ICON-GLOBAL, with the AR wrapping up more closely around the low-pressure system in ICON-LAM6. These differences and shift might be related to the difference in horizontal resolution of the datasets. The IWV difference between ICON-LAM6 and ICON-LAM3 (Fig. 2d) is found to be of a much smaller range (of the order of +6 kg m−2) and occurs mainly along the edges of the intrusion location. This indicates a slightly narrower AR in ICON-LAM3, likely due to its higher horizontal resolution.
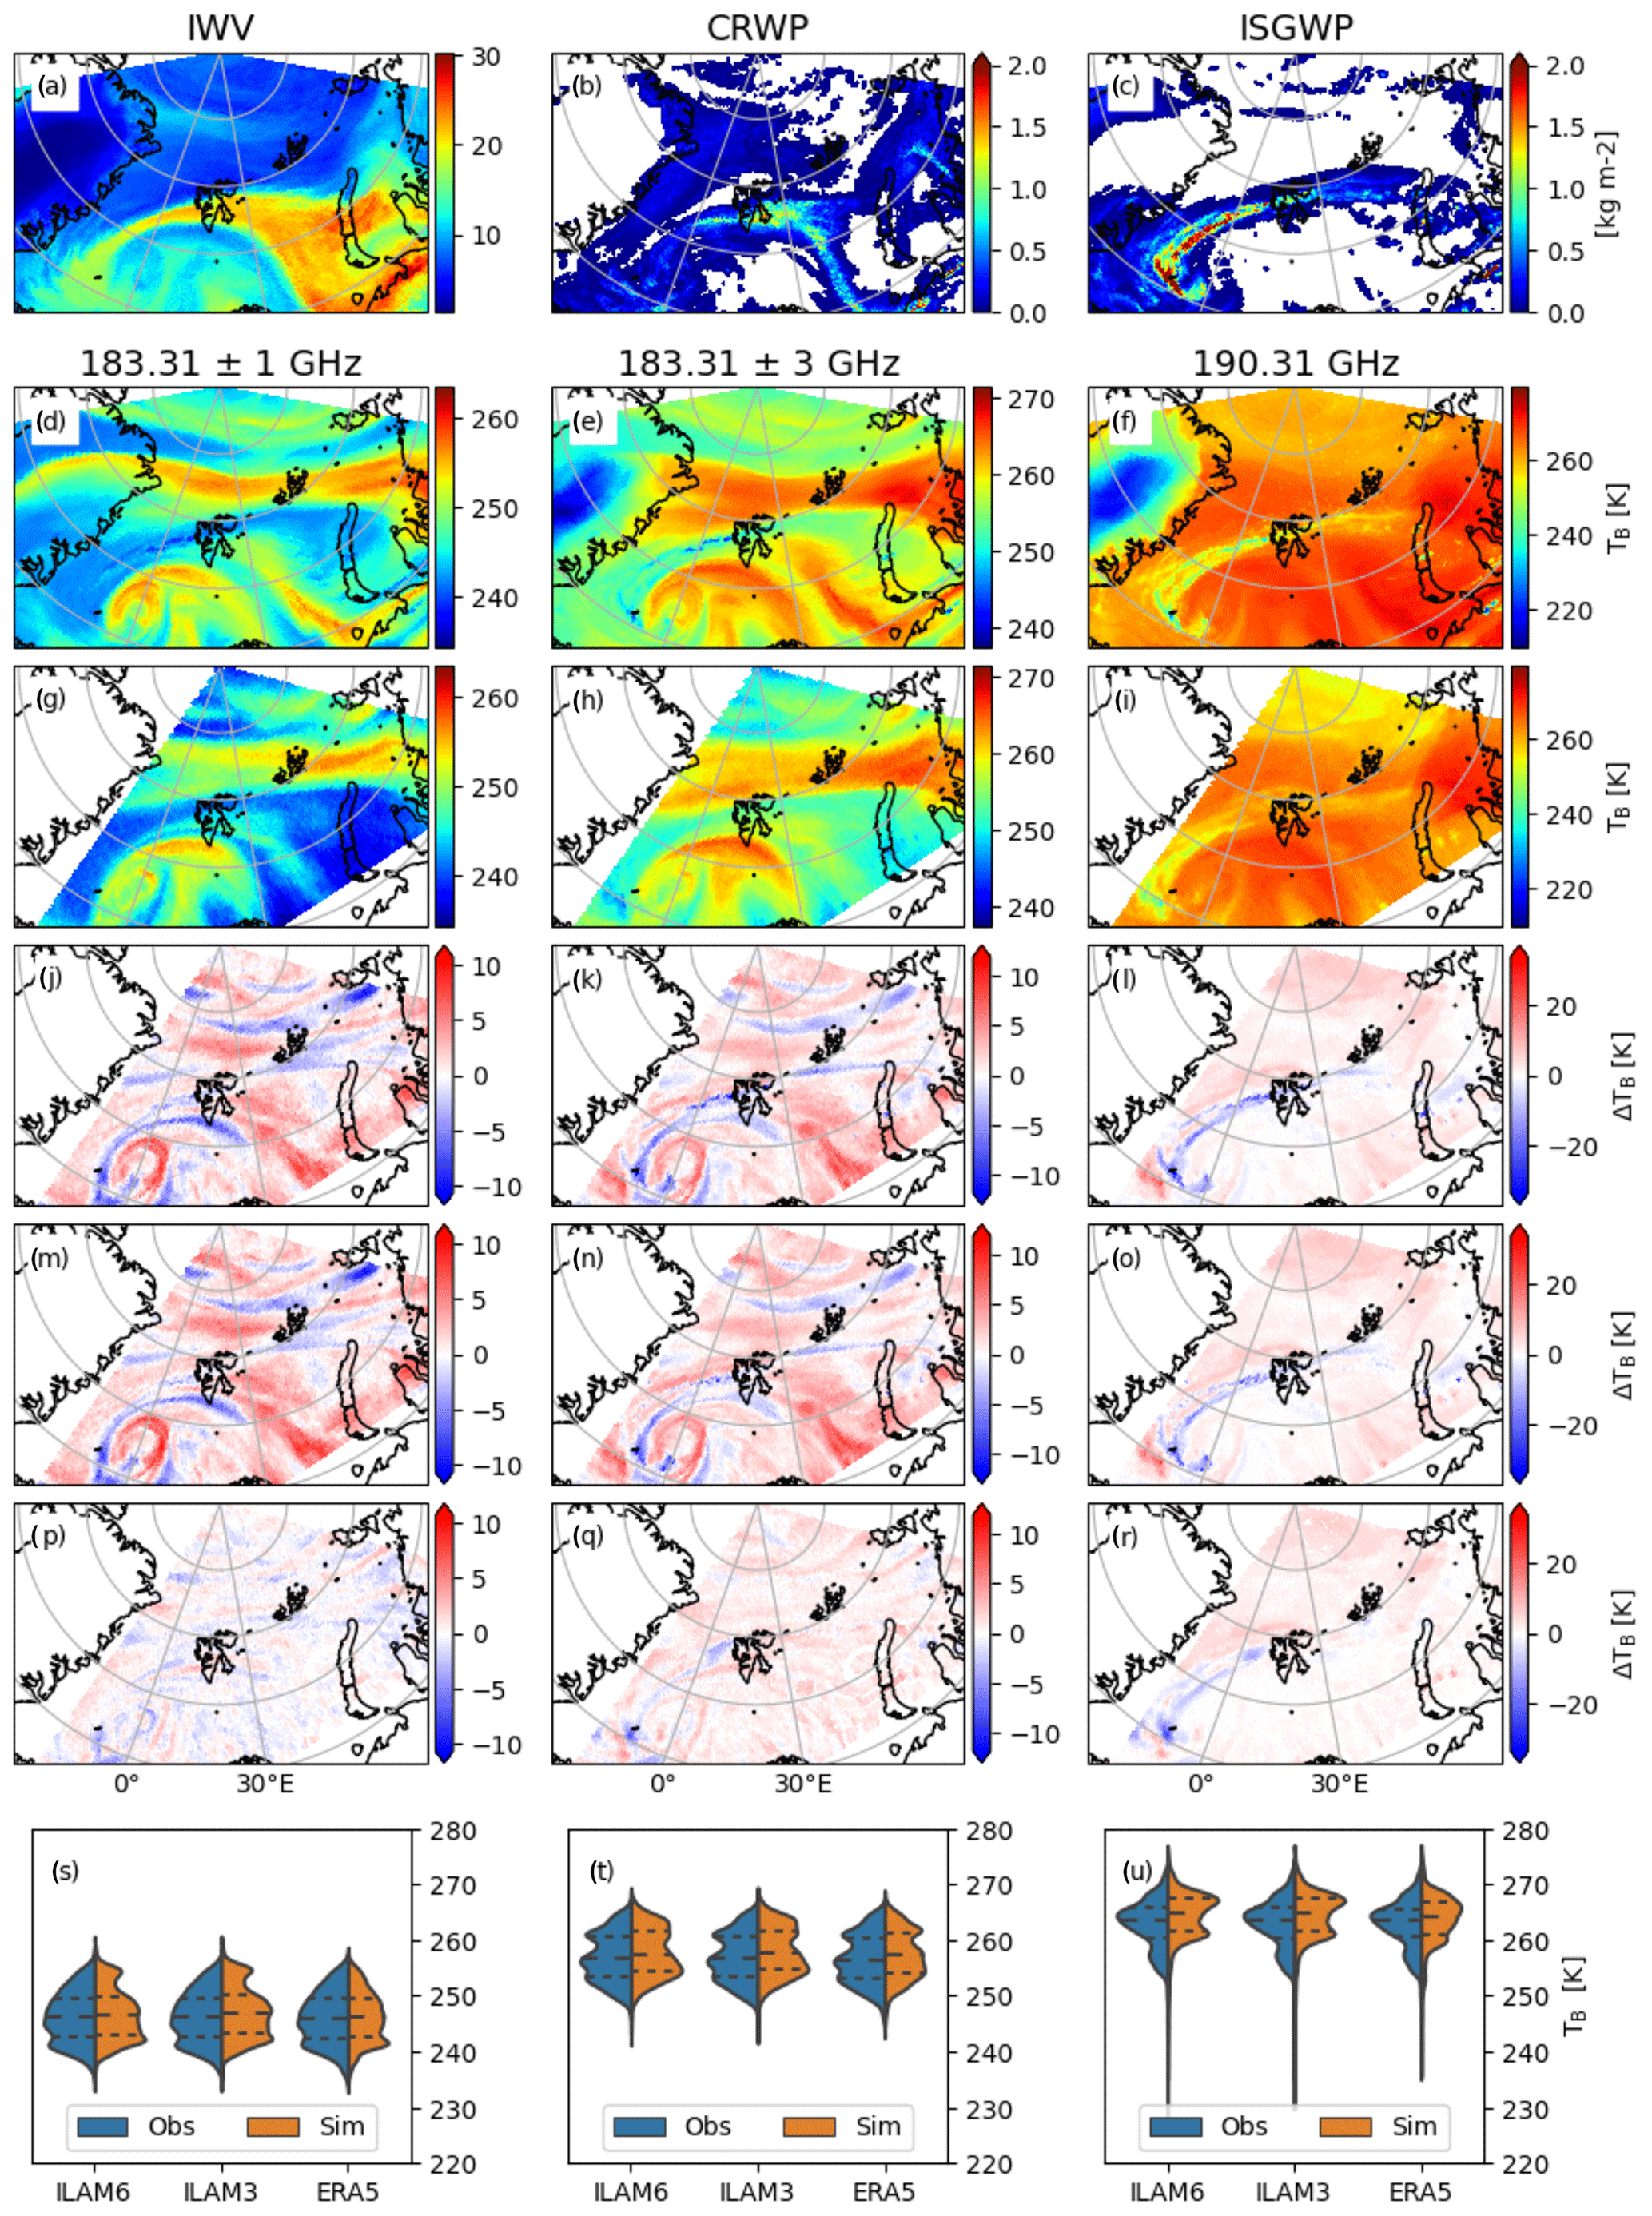
Figure 3The top row shows the IWV (a) and liquid (CRWP, b) and solid hydrometeor content (ISGWP, c) from the 6 km ICON-LAM simulation for 6 June 2017 12:00 UTC. For the same simulation, in panels (d)–(f) the forward-simulated TB at 183.31 ± 1, 183.31 ± 3, and 190.31 GHz based on ICON-LAM at the 6 km resolution are shown. Panels (g) to (i) show the observations from MHS for an overpass between 11:00 and 13:00 UTC. The differences between simulation and observation for 6 and 3 km ICON LAM simulations and ERA5 reanalysis (rows) are shown in panels (j) to (r). The bottom panels (s–u) present, through kernel density plots, the observations of each corresponding simulation.
In order to evaluate model performance with satellite observations, a model-to-observation evaluation of the simulations with respect to the brightness temperatures TB (Fig. 3) is carried out with the PAMTRA model (see Sect. 2.3). The forward approach (Fig. 3) confirms the results from the ERA5-based comparison of IWV (Fig. 2). Figure 3 presents the TB comparison between observations from the MHS instrument on the MetOp-A satellite at different frequencies and the corresponding ICON-LAM6 (Fig. 3m–o) and ICON-LAM3 (Fig. 3j–l) simulations and the ERA5 reanalysis (Fig. 3p–r) for one overpass between 11:00 and 13:00 UTC of 6 June 2017. For the channels with strong surface influence (i.e. 89 and 157 GHz, not shown) locations where TB is difficult to estimate, especially over sea ice and ice-covered land (Greenland), have been left out. In general, the simulations and the observations are in good agreement, with differences that can be attributed to small time and space displacements. The AR event can be seen quite well in the observations as well as in the simulations for the channels most sensitive to emission by water vapour (183.31 ± 1 and 183.31 ± 3 GHz). The closer the channel is to the water vapour line at 183.31 GHz and the higher the mid- and upper-level water vapour content, the less deep these channels can sound the atmosphere and therefore the lower the TB is. This also shows that the AR extends throughout the troposphere. For 190.31 GHz, higher TB can be seen that corresponds to a mixture of clouds, precipitation, and water vapour in lower atmospheric layers. This channel also shows TB depressions due to scattering in regions with higher contents of frozen hydrometeors. Due to its coarser resolution, around twice the order of the footprint size of the satellite observations, ERA5 therefore shows fewer details compared to the MHS microwave satellite products (Fig. 3p–r). On the other hand, the high resolution of the ICON-LAM simulations (Fig. 3m–l) results in a better comparison to the coarse satellite observations.
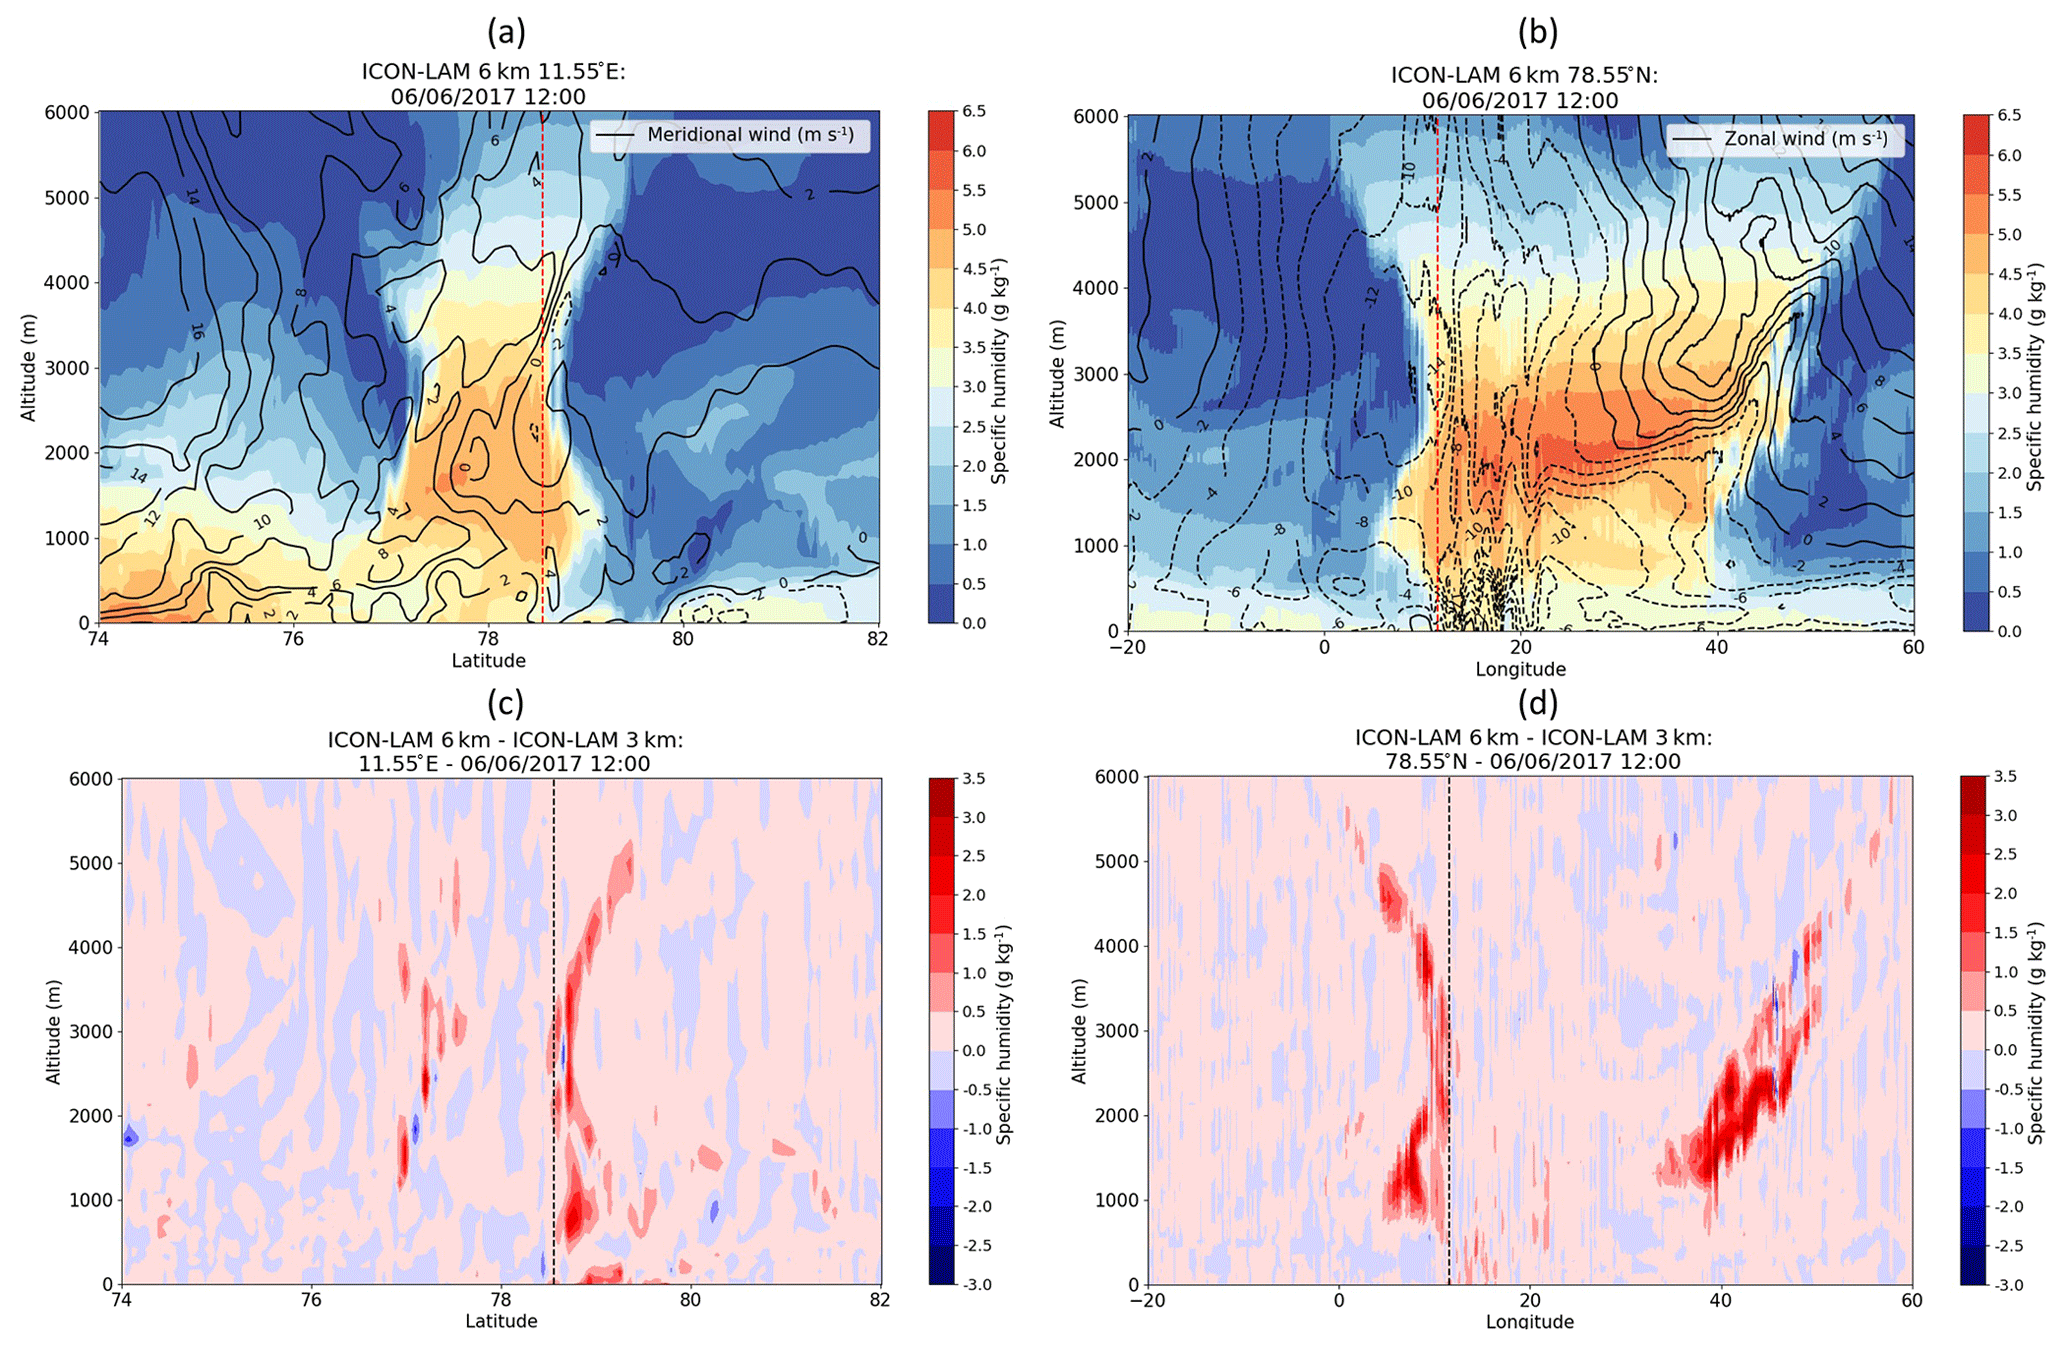
Figure 4Altitude–latitude/longitude cross sections of specific humidity (g kg−1, colour shading) and wind speed (m s−1, black isolines) from ICON-LAM6 (a, b) and of specific humidity difference between ICON-LAM6 and ICON-LAM3 (c, d) along latitude at 11.55∘ E (a, c) and along longitude at 78.55∘ N (b, d) on 6 June 2017 12:00 UTC. Red/black vertical lines: column above the Ny-Ålesund location.
The three-dimensional (3D) structure of the AR is well seen in the specific humidity pattern (Fig. 4). In the altitude–latitude cross section (Fig. 4a), the AR is associated with a vertically elongated but horizontally narrow pattern of increased moisture of ca. 2∘ (or ca. 200 km) width. On the other hand, as seen in the altitude–longitude cross section (Fig. 4b), the AR elongates horizontally, with a length of thousands of kilometres. These are typical scales of the mid-latitude ARs (Rutz et al., 2019). The figure confirms the passage of the intrusion over the Ny-Ålesund research station. Figure 4 further indicates that the AR-related moisture increase covers almost the entire troposphere. However, the maximum moisture content of the AR (of about 6.5 g kg−1) is found, co-located with the maximum wind speed, at an altitude of about 2 km. Such a structure and humidity content are in agreement with other AR cases in the polar region as discussed in Komatsu et al. (2018), Gorodetskaya et al. (2020), and Terpstra et al. (2021). The presented 3D analysis confirms the above finding that ICON-LAM6 shifts the AR slightly southward compared to the coarser-resolution data of ERA5 and ICON-GLOBAL (Fig. A3 from the Appendix) and that the high-resolution ICON-LAM3 simulates a slightly narrower (by ca. 0.5∘ or ca. 40 km) structure of the AR compared to ICON-LAM6 (Fig. 4c and d).
3.2 Atmospheric river signature at station locations
3.2.1 Ny-Ålesund/Svalbard
As previously presented, the AR reached Ny-Ålesund on 6 June 2017 by extending from north-western Siberia. The broad suite of atmospheric instruments at the AWIPEV research base at Ny-Ålesund allows the ICON-simulated event to be compared with observations.
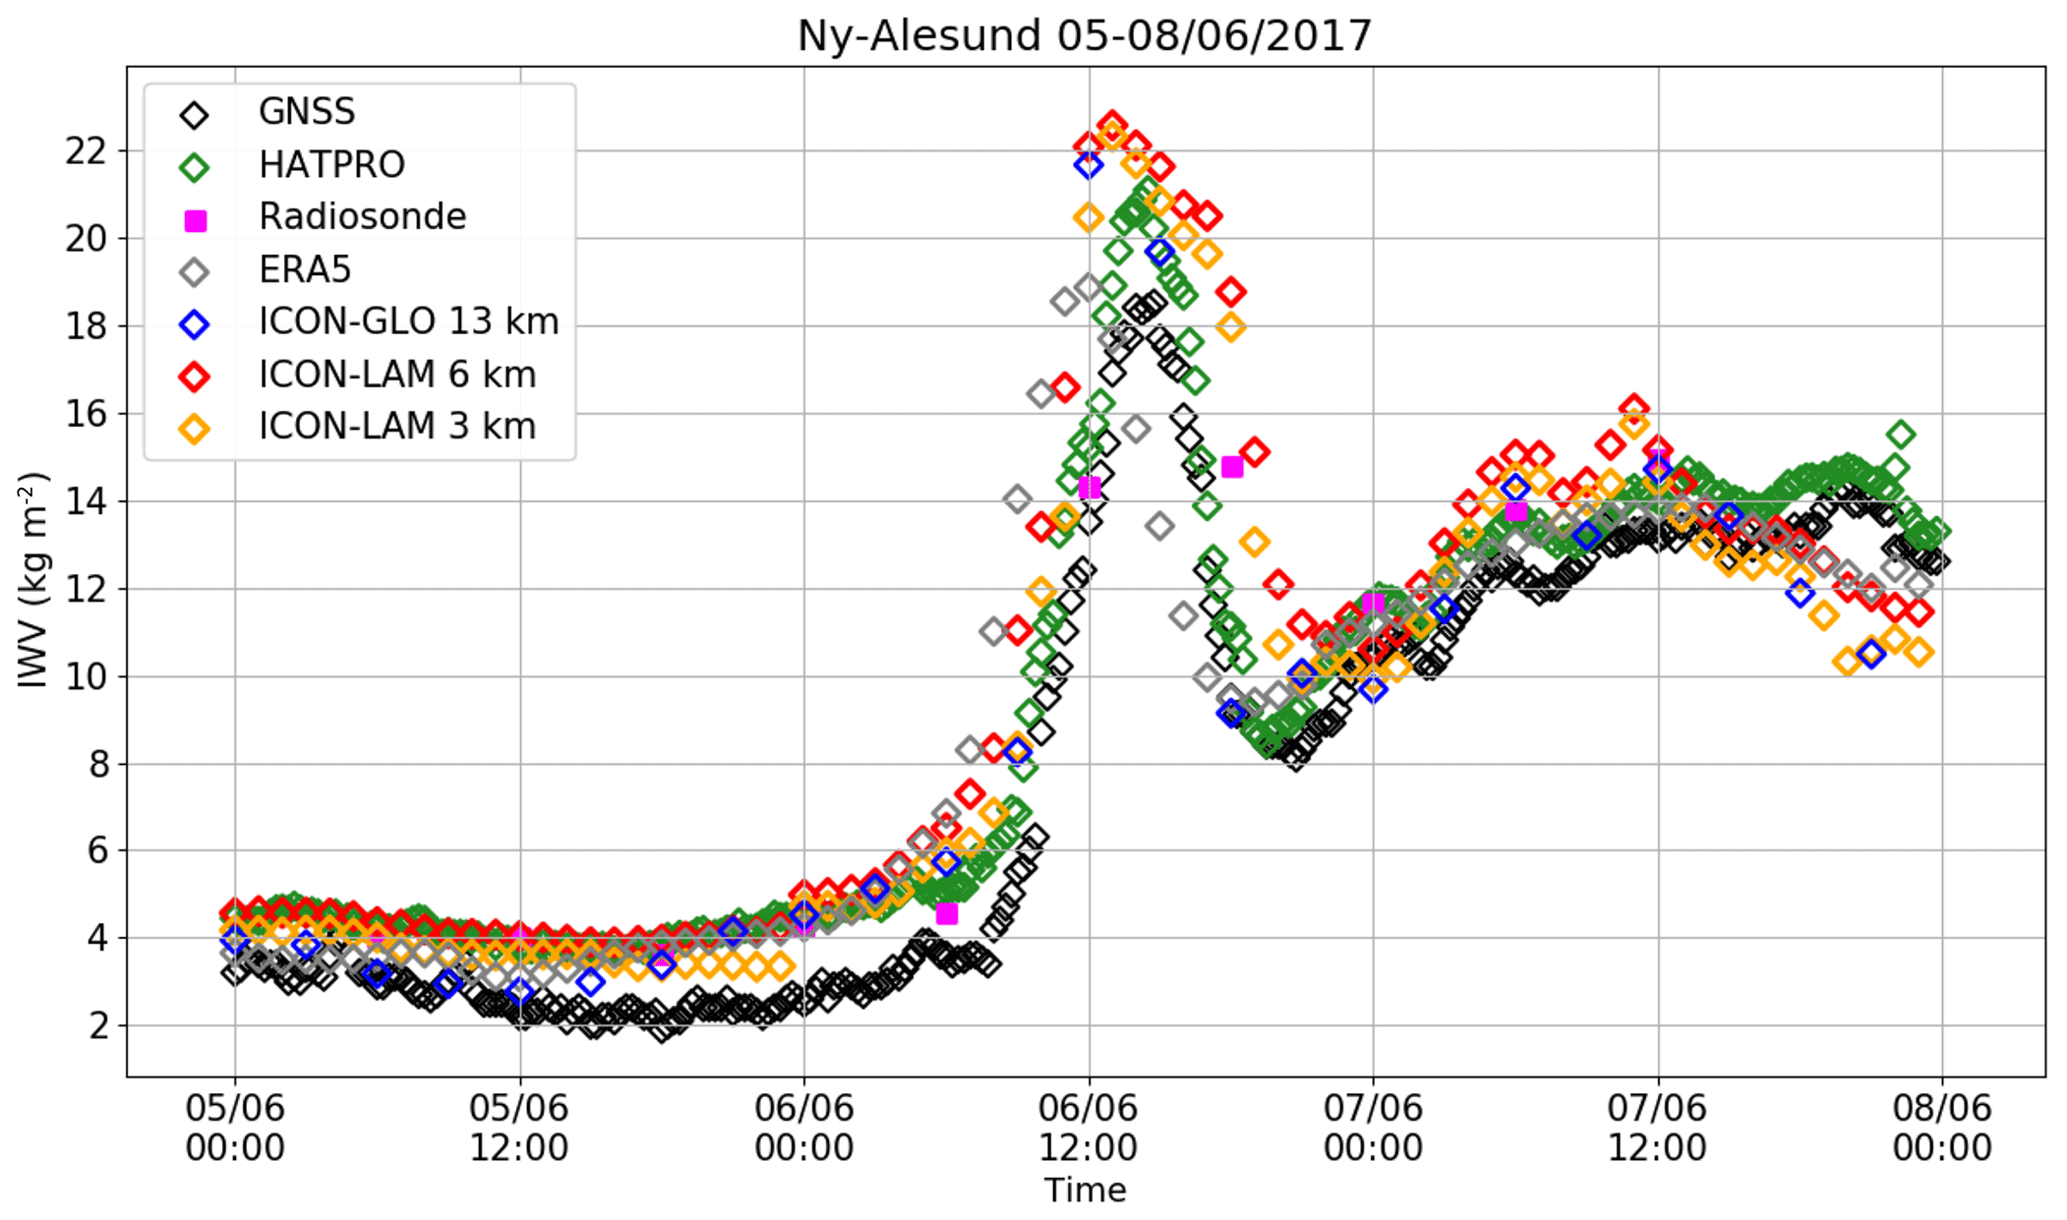
Figure 5Time series of IWV (kg m−2) at Ny-Ålesund from the radiosonde, GNSS, and HATPRO data, from ERA5, ICON-GLOBAL, ICON-LAM6, and ICON-LAM3, from 5 June 2017 00:00 UTC to 8 June 2017 00:00 UTC. The model and ERA5 results are based on the station nearest the grid point.
Figure 5 presents the time series of IWV at Ny-Ålesund, with ICON-LAM6, ICON-LAM3, and ICON-GLOBAL simulations, ERA5 reanalysis, and GNSS, HATPRO, and radiosonde observations from 5 June 2017 00:00 UTC to 8 June 2017 00:00 UTC. Low background IWV values between 2 and 4 kg m−2, which are representative of Arctic air masses, are seen on 5 June 2017 before the AR event reached Ny-Ålesund. Starting from 6 June 2017 00:00 UTC, the HATPRO observations indicate a large increase in IWV, reaching its maximum of 21 kg m−2 at about 14:00 UTC. Afterwards, when the AR passed, the IWV values steeply decrease to reach a minimum of about 10 kg m−2 at 21:00 UTC on 6 June 2017. Then, on 7 June 2017, some moisture still stays around Ny-Ålesund, with IWV fluctuations between 8 and 14 kg m−2, indicating that the background IWV state (i.e. pre-AR state of low IWV) has not been reached yet. The GNSS dataset shows a relatively similar evolution, with however lower IWV values during the 3 d period as well as a smaller maximum, around 19 kg m−2, during the passage of the AR on 6 June 2017. Although only 6-hourly, the radiosonde results also show a similar IWV evolution with a large increase in IWV values during the AR passage. A slight 1–2 h advance of the maximum IWV appears in the simulations compared to the observations; i.e. the maximum IWV occurs at 12:00 UTC in ERA5 and at 13:00 UTC in the ICON simulations, while it was observed at about 14:00 UTC. Nonetheless, a relatively realistic representation of this temporal evolution of IWV is seen in the ICON-LAM simulations as well as in ICON-GLOBAL and ERA5. Similarities are found in the simulated IWV maximum values compared to the observations, with values ranging from 18 to 22 kg m−2.
Table 1Statistics (minimum, maximum, mean, standard deviation) of IWV (kg m−2) at Ny-Ålesund, with ICON-LAM6, ICON-LAM3, ICON-GLOBAL, ERA5, and the GNSS and HATPRO data, for 5, 6, and 7 June 2017. All the datasets have different spatio-temporal resolutions (see Sect. 2). The root mean square error (RMSE) and mean absolute error (MAE) are calculated based on 3-hourly data and are relative to the HATPRO observational data. These statistics are based on all values available within the 24 h of the specific day.
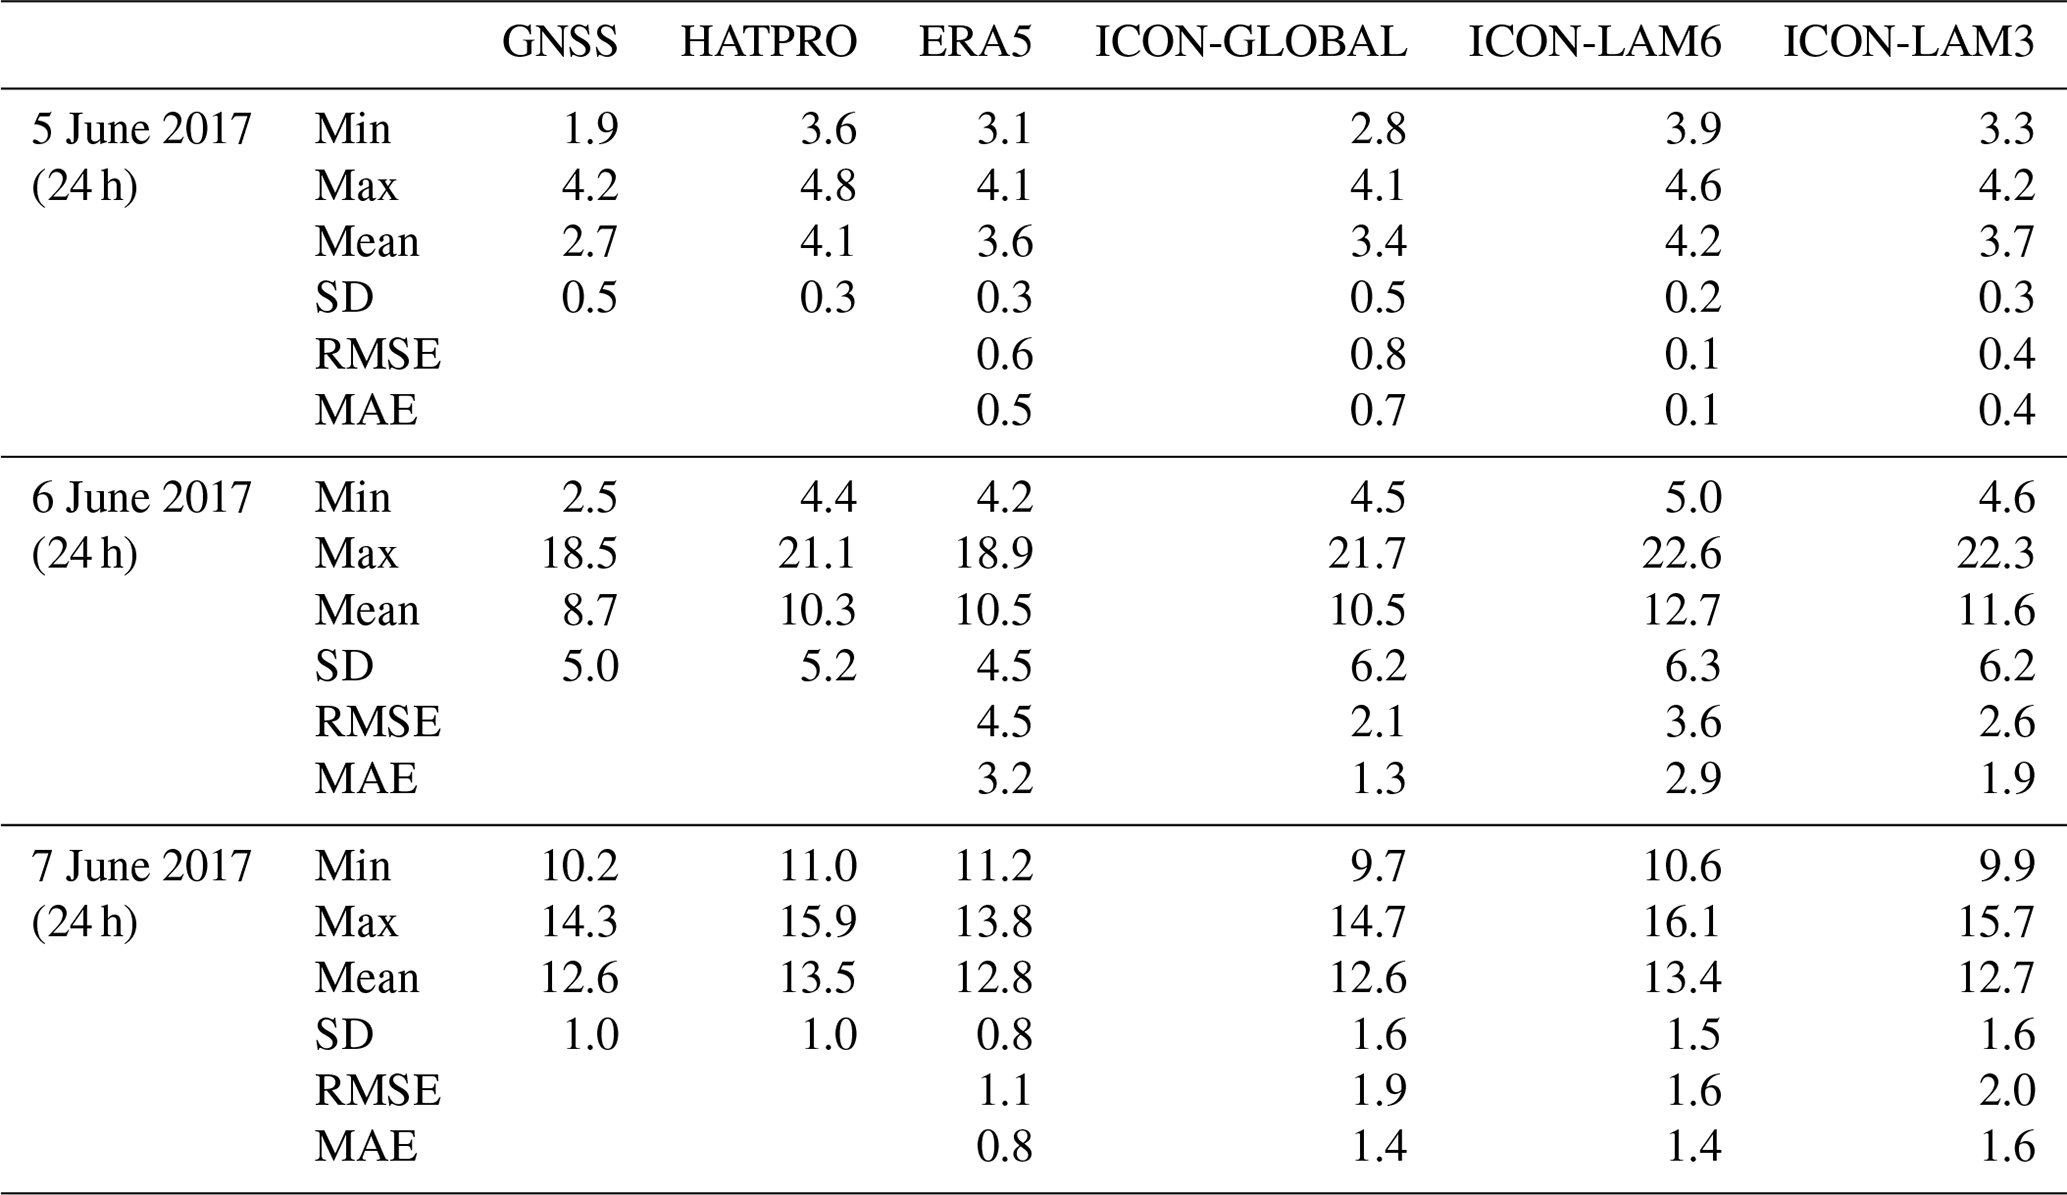
The realistic representation of the AR passage over Ny-Ålesund from the ICON-LAM simulations is also indicated from the statistics. Table 1 shows the minimum, maximum, mean, and standard deviation (based on all values available within the 24 h of the specific day) of IWV at Ny-Ålesund from ICON-LAM6, ICON-LAM3, ICON-GLOBAL, ERA5, and the GNSS and HATPRO data for the IWV evolution from 5 to 7 June 2017. Table 1 also presents the root mean square error (RMSE) and mean absolute error (MAE) calculated for ERA5, ICON-GLOBAL, ICON-LAM6, and ICON-LAM3, with the HATPRO dataset as a reference. As expected and seen in Fig. 5, larger variabilities in IWV values are found during the AR passage (6 June 2017) compared to the pre- and post-event periods. The differences found in GNSS and HATPRO have also been shown by Crewell et al. (2021), with the latter being closer to radiosonde measurements within a long-term assessment. These differences, between the statistics from the observations and the reanalysis and model datasets, are also reflected in the RMSE and MAE values being higher during the AR passage over Ny-Ålesund, indicating the difficulty for the reanalysis and model simulations to represent the accurate amount of humidity in the atmospheric column during the AR passage at Ny-Ålesund. Nonetheless, the evolution of the IWV during the 3 d period is rather well captured by the reanalysis and model datasets.
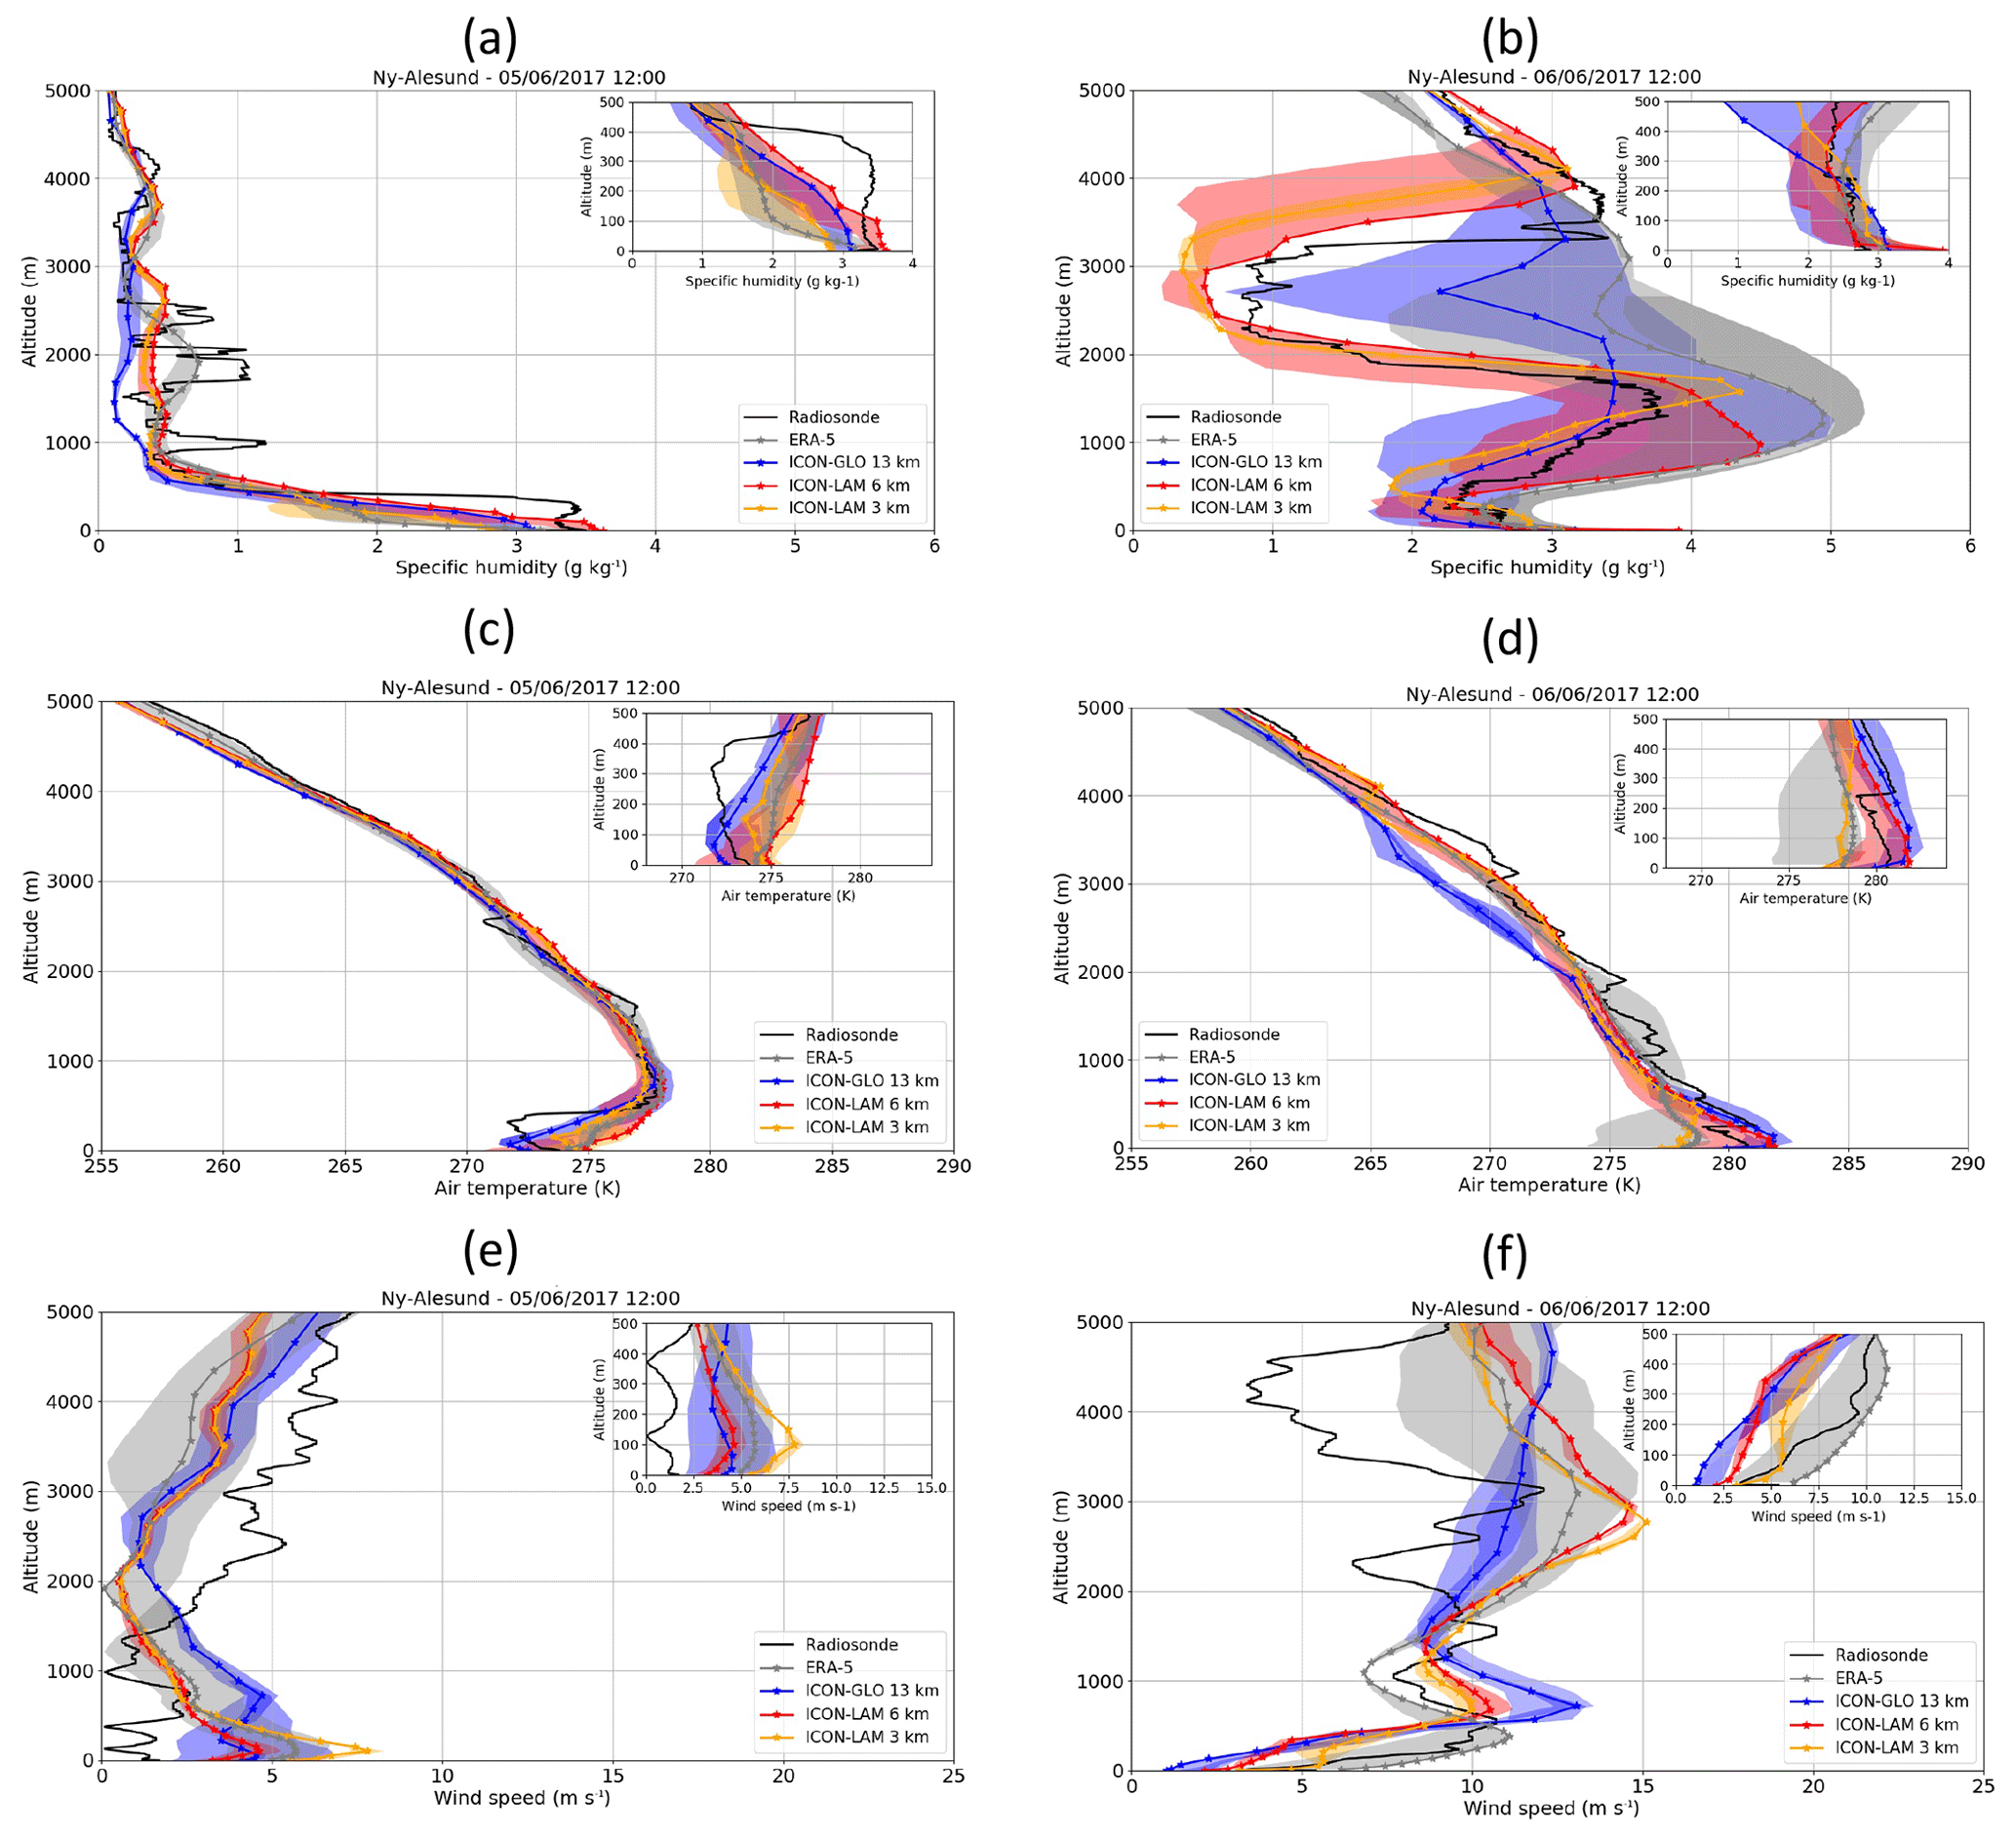
Figure 6Vertical profiles of specific humidity (g kg−1) (a, b), air temperature (K) (c, d), and wind speed (m s−1) (e, f) at Ny-Ålesund from the radiosonde data (black), ERA5 (grey), and ICON simulations (ICON-GLOBAL: blue, ICON-LAM6: red, ICON-LAM3: orange) on 5 June 2017 12:00 UTC (a, c, e) and 6 June 2017 12:00 UTC (b, d, f). For ERA5 and ICON simulations, the solid line presents the value for Ny-Ålesund's nearest grid point, while the shading presents the range (maximum–minimum) across the four station-surrounding grid points. A zoom of the profiles in the lowest 500 m is included in the upper right corner of each panel.
Figure 6 compares the simulated vertical profiles of specific humidity, air temperature, and wind speed at Ny-Ålesund with the radiosonde data on 5 June 2017 12:00 UTC and 6 June 2017 12:00 UTC. During the pre-AR conditions on 5 June 2017 12:00 UTC, the atmosphere is dry with typical values smaller than 1 g kg−1, and a low-level humidity inversion at ca. 100–400 m is observed (Fig. 6a). This is a common feature in the Arctic boundary layer (Nygård et al., 2014) and can contribute to the formation and maintenance of clouds (Sedlar, 2014). This inversion is not well captured by the models and the reanalysis (Fig. 6a). This can be associated with different processes insufficiently represented in the model, including surface cooling, condensation at higher levels, and moisture advection. Earlier work also showed that reanalyses underestimate the amplitude and frequency of humidity inversions in the Arctic (Naakka et al., 2018). Apart from this, the simulated humidity profiles agree with the radiosonde. During the AR event on 6 June 2017 12:00 UTC, a large moisture increase by ca. 4 g kg−1 is observed between 1 and 2 km altitude (Fig. 6b). This increase in low-level humidity is driven by the passage of the AR over Ny-Ålesund, and this AR moistening signature is well reproduced in the simulations. The ICON-LAM simulations show closer humidity profiles to observations than the ones from ERA5 and ICON-GLOBAL. This includes not only the realistic simulation of the low-level confined moisture increase, but also of the dry layer above the intrusion levels between 2 and 3 km. Such dry layers are observed frequently and represent a coherent layer of air descending from near-tropopause level (Browning, 1997). Neither ICON-GLOBAL nor ERA5 can accurately reproduce this. Furthermore, a smaller spread across the four closest grid points around Ny-Ålesund is seen in both ICON-LAM simulations compared to those in ERA5 and ICON-GLOBAL. This clearly indicates an increase in the accuracy of the AR representation with the increase in horizontal resolution of the model as well as a reduced variability over the four surrounding grid points. Warmer near-surface air temperature accompanies the AR, as shown by the 5 K temperature increase within the lowest first kilometre from 5 to 6 June 2017 (Fig. 6c and d). Comparable increase in temperature has previously been reported during other ARs in the polar regions (Komatsu et al., 2018; Wille et al., 2019; Francis et al., 2020). It is interesting to note that the temperature increase associated with the AR passage is seen confined between the surface and the humidity maximum from the AR at higher levels. This temperature increase dissolves the previously occurring low-level temperature inversion, as seen in Fig. 6c and d embedded plots (i.e. zoom on the first 500 m of the atmosphere). This characteristic is an AR signature, which is relatively well reproduced in the ICON-LAM simulations. Associated with the increase in humidity and temperature, a relatively large increase in wind speed (of about 6 m s−1) in the lowest kilometre, establishing a strong low-level jet between ca. 500 and 900 m, is seen on 6 June 2017 (Fig. 6e and f). Also, this AR-related prominent increase in lower-tropospheric wind speed and occurrence of a low-level jet, as was shown by earlier studies in Antarctica (Gorodetskaya et al., 2020), is well reproduced by the ICON-LAM simulations and ERA5, although the simulated maximum wind peak is slightly raised in its altitude. By contrast, ICON-GLOBAL significantly overestimates the maximum wind speed (Fig. 6e and f).

Figure 7Time series of specific humidity (g kg−1, colour shading), air temperature (K, black isolines), and wind speed (m s−1, magenta isolines) profiles at Ny-Ålesund from ICON-LAM6 (a) and specific humidity difference between ICON-LAM6 and ICON-LAM3 (b) from 5 June 2017 00:00 UTC to 8 June 2017 00:00 UTC (ICON-LAM3 was remapped onto the ICON-LAM6 grid resolution).
The time series of ICON-LAM6 specific humidity profiles support the understanding of the temporal development of the AR structure as seen at Ny-Ålesund on 6 June 2017 (Fig. 7a). While the near-surface atmosphere is relatively moist (ca. 3 g kg−1) on 5 June 2017, the rest of the column is extremely dry (< 0.5 g kg−1). When the AR arrives at Ny-Ålesund on 5 June 2017 18:00 UTC, the moisture increase starts expanding in the lowest 2 km of the atmosphere, accompanied by the increase in temperature. On 6 June 2017 12:00 UTC, the moisture increase is seen over the entire column, with establishing values of ca. 5.5 g kg−1 between 1 and 2.5 km of altitude. This well-pronounced increase in humidity indicates the passage of the AR over the research station for about 10 h. From 7 June 2017 on, the upper air dries out, but some moisture (about 3 g kg−1) stays within the lowest 3 km height above Ny-Ålesund. Such a long-lasting (up to a few days) lower-level moistening after the actual AR passage is not uncommon (Ramos et al., 2015) and was also found in Antarctica (Wille et al., 2019). Figure 7 also presents the time series of the specific humidity difference between both ICON-LAM simulations (Fig. 7b). The differences are generally very small, except for the time of the arrival of the AR over Ny-Ålesund, when ICON-LAM6 shows up to 3.75 g kg−1 higher humidity content compared to ICON-LAM3. This indicates that the AR arrives over the station in ICON-LAM6 slightly (ca. 2 h) earlier than in ICON-LAM3 due to the coarser model resolution. This advance of ICON-LAM6 is also visible in the IWV time series in Fig. 5 during the onset of the AR event during the morning of 6 June 2017. Probably mainly due to their coarser resolutions, ERA5 and ICON-GLOBAL show a smaller and weaker humidity core of AR during its passage over Ny-Ålesund (see Fig. A4 from the Appendix).
3.2.2 Shojna (Russia)
The Shojna research station has been chosen for this study as it is located on the path of the analysed AR. As for the Ny-Ålesund station, radiosonde data are available for both 5 and 6 June 2017, allowing the analysis of both humidity and wind speed at this location.

Figure 8Time series of IWV (kg m−2) at Shojna from radiosonde, ERA5, ICON-GLOBAL, ICON-LAM6, and ICON-LAM3 from 5 June 2017 00:00 UTC to 8 June 2017 00:00 UTC. The model and ERA5 results are based on the station's nearest grid point.
Similarly to Ny-Ålesund, the temporal evolution of IWV at Shojna (Fig. 8) shows an increase in moisture content over the station from 5 June 2017 to a peak on the day of the AR event and then a relatively small decrease in IWV on 7 June 2017. The passage of the AR over Shojna, which is about 10∘ further south than Ny-Ålesund, is well captured by all simulations as observed by the radiosondes, with a maximum IWV of 20 kg m−2 with the radiosonde data (although the radiosondes might not capture the maximum IWV value due to their low 6-hourly temporal resolution), 22 kg m−2 in ERA5, and 24 kg m−2 in ICON-LAM simulations during the afternoon of 6 June 2017. As expected from the atmospheric circulation (Fig. 1), the AR passes over Shojna before Ny-Ålesund. Accordingly, the moisture content at Shojna increases almost 24 h earlier than the one at Ny-Ålesund, and the AR-related elevated moisture stays longer over Shojna than over Ny-Ålesund. Furthermore, the comparison of Figs. 5 and 8 shows that, while the AR maximum is rather similar for both locations, the evolution of the IWV value at Shojna before (i.e. before 5 June 2017 12:00 UTC) and after (i.e. after 7 June 2017 00:00 UTC) the AR passage is higher, likely due to its more southern location compared to Ny-Ålesund.
Table 2Statistics (minimum, maximum, mean, standard deviation) of IWV (kg m−2) at Shojna, with ICON-LAM6, ICON-LAM3, ICON-GLOBAL, and ERA5, for 5, 6, and 7 June 2017. These statistics are based on all values available within the 24 h of the specific day. Note: all the datasets have different spatio-temporal resolutions (see Sect. 2).
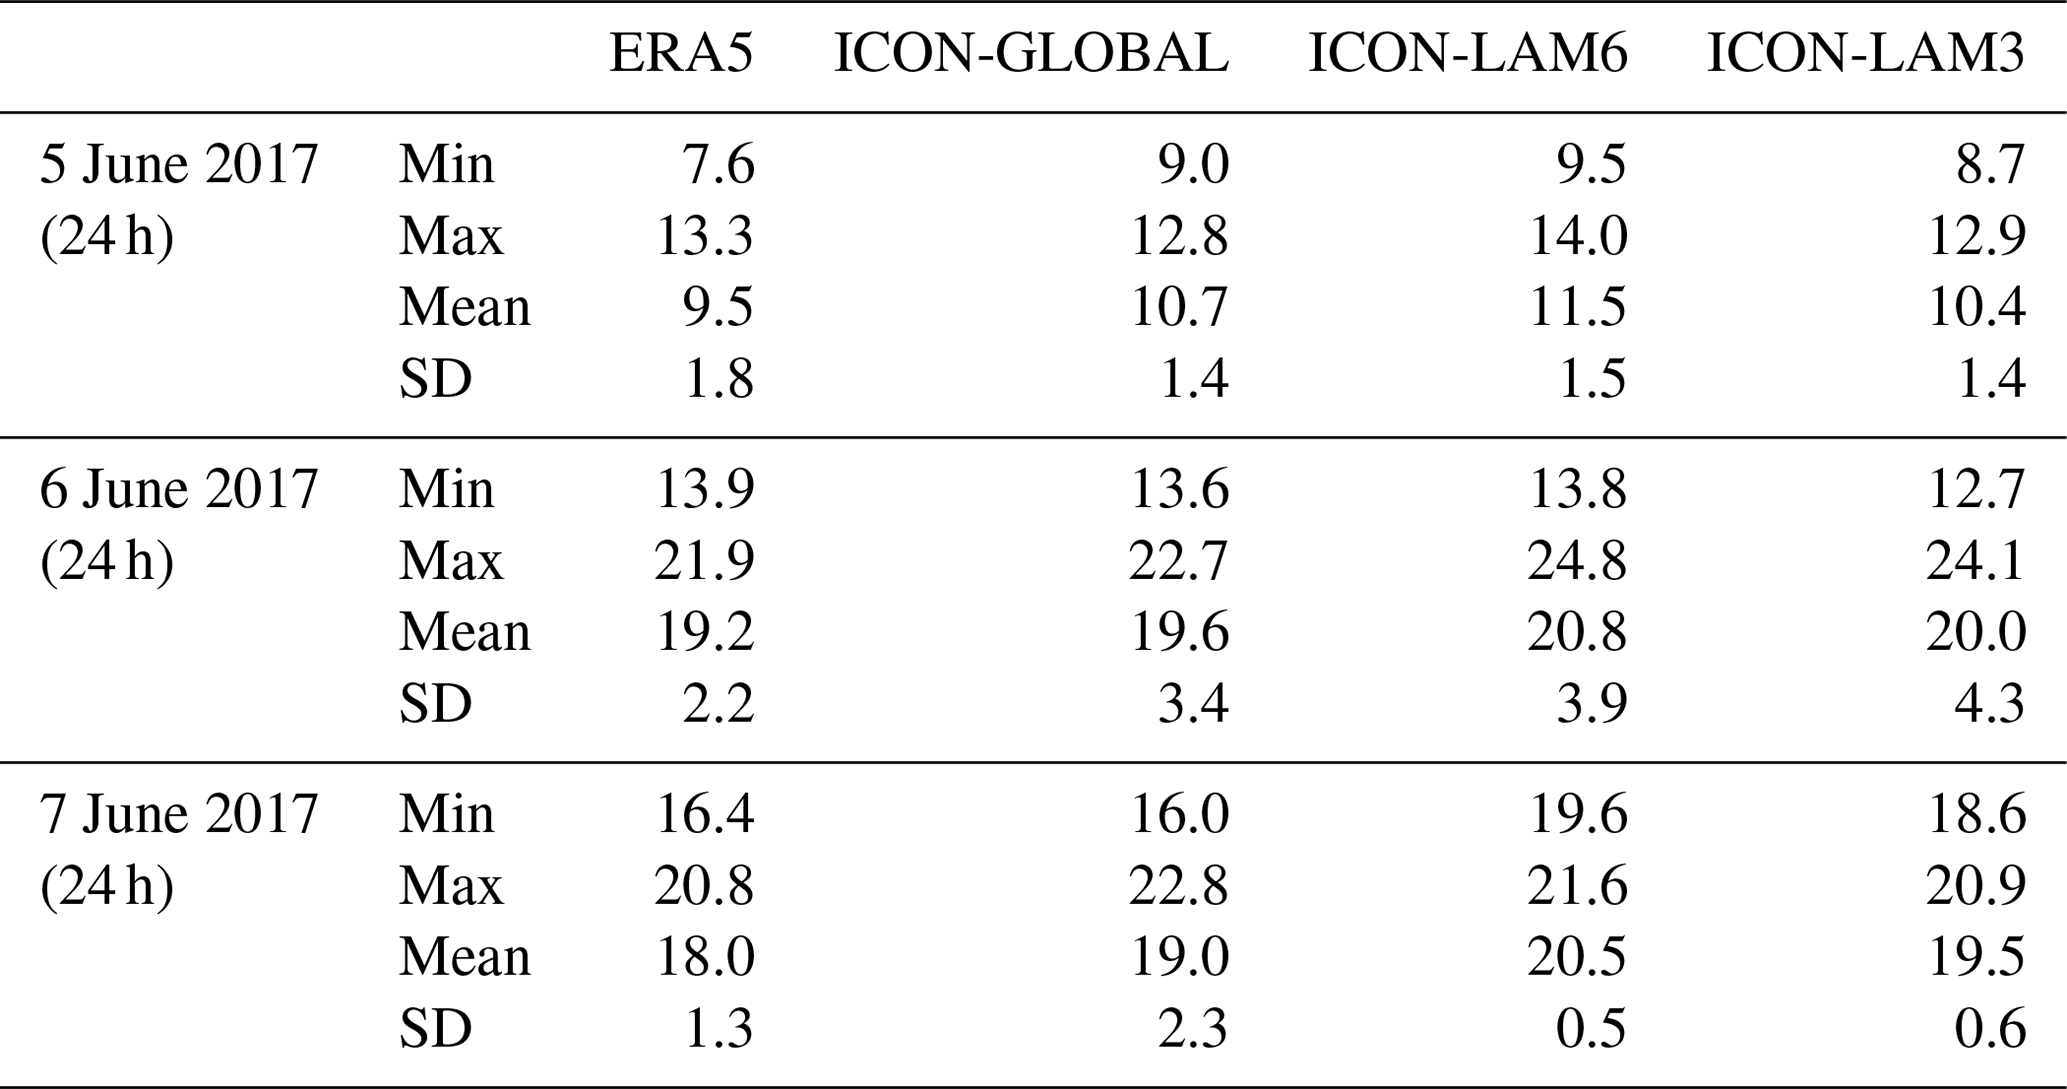
On 5 June 2017, the background pre-AR IWV values are about 10 kg m−2 at Shojna but only 4 kg m−2 at Ny-Ålesund. However, during the peak of the AR event (i.e. the IWV maximum), the IWV values are relatively similar at the Shojna and Ny-Ålesund stations. All ICON simulations show a comparable IWV evolution to the 6-hourly radiosonde data and to ERA5 although with a consistently slightly higher IWV magnitude (by ca. 2 kg m−2). Some of this relatively good agreement of ERA5 IWV time series with the radiosonde values might come from the assimilation of observations. However, Crewell et al. (2021) showed that Russian radiosonde stations may often be too dry compared to satellite data (e.g. IASI, MIRS). Hence, the higher IWV values found with the ICON simulations may represent more accurately the evolution of the humidity at the Shojna station. Nonetheless, the relatively good agreement between the radiosonde data and the reanalysis and model datasets is also seen in Table 2, which summarizes the statistics (minimum, maximum, mean, and standard deviation, based on all values available within the 24 h of the specific day) of IWV at Shojna, with ICON-LAM6, ICON-LAM3, ICON-GLOBAL, and ERA5 for 5, 6, and 7 June 2017. Smaller differences are seen in the statistics of the IWV evolution at Shojna compared to Ny-Ålesund, indicating a higher accuracy of the representation of the IWV values during the AR passage over Shojna. These differences are likely to be due to the different scale of the AR structure at both research stations (i.e. large humidity pattern at Shojna but thin filament at Ny-Ålesund).

Figure 9Vertical profiles of specific humidity (g kg−1) (a, b), air temperature (K) (c, d), and wind speed (m s−1) (e, f) at Shojna from the IGRA radiosonde (black), ERA5 (grey), and ICON simulations (ICON-GLOBAL: blue, ICON-LAM6: red, ICON-LAM3: orange) on 5 June 2017 12:00 UTC (a, c) and 6 June 2017 12:00 UTC (b, d). For ERA5 and ICON simulations, the solid line presents the value at the Shojna nearest grid point, while the shading presents the range (maximum–minimum) across the four station-surrounding grid points. A zoom of the profiles in the lowest 500 m is included in the upper right corner of each panel.
The change in the vertical profiles of specific humidity and wind speed shows a similar AR signature (Fig. 9) as detected at Ny-Ålesund. With the AR arrival (Fig. 9b), the low-level specific humidity increases by a factor of 4 compared to the pre-AR conditions (Fig. 9a). This means that on 6 June 2017, a large increase in humidity occurs between 1 and 2 km of altitude and reaches values of almost 7 g kg−1. However, compared to Ny-Ålesund (Fig. 6a and b), the maximum humidity at Shojna (Fig. 9a and b) appears at a slightly lower altitude (at ca. 1 km), indicating that the AR moves to slightly higher (by ca. 500 m) altitude while elongating over the ocean. This phenomenon has been previously reported by Komatsu et al. (2018) for another AR event from the Siberian coasts towards the Arctic Ocean, suggesting an “upward and poleward upgliding of the humid air parcels” over sea ice into the Arctic, because the cold air dome (built by the cold boundary layer capped by strong temperature inversion) blocks the intrusion. Similarly to Ny-Ålesund, an increase in the surface air temperature (Fig. 9c and d) is seen with the AR passage. It is interesting to note that the increase in temperature at Shojna is collocated with the increase in moisture, while at Ny-Ålesund the temperature increase is seen near the surface and the moisture maximum is at higher altitudes than before. Again, a low-level wind jet is associated with the AR (Fig. 9e and f). Although the ICON-LAM simulations fail to reproduce the relatively dry layer above 1500 m on 6 June 2017 (Fig. 9b), the ICON simulations capture the AR signatures in the humidity, temperature, and wind profiles relatively well. However, in this case, ERA5 represents more accurately the specific humidity profiles at Shojna as well as the dry layer above the AR. It is interesting to note that the across-grid-point scatter in the simulations is much smaller at Shojna, located on the relatively flat Kanin Peninsula, compared to Ny-Ålesund. This is an implication of the latter station's location on the complex orography of Svalbard and the nearby fjord and demonstrates the difficulty in comparing models and observations of different resolution, especially in complex orography as elucidated in more detail by Steinke et al. (2015). Furthermore, Dobler et al. (2019) demonstrated that convection-permitting simulations for Svalbard show differences from observations as the simulated values derived for the 2.5 km × 2.5 km grid box centre closest to the station do not exactly match the station location.

Figure 10Time series of specific humidity (g kg−1) (colour shading), air temperature (K) (black isolines), and wind speed (m s−1) (magenta isolines) profiles at Shojna from ICON-LAM6 (a) and specific humidity difference between ICON-LAM6 and ICON-LAM3 (b) from 5 June 2017 00:00 UTC to 8 June 2017 00:00 UTC (ICON-LAM3 was remapped onto the ICON-LAM6 grid resolution).
Figure 10 shows the temporal evolution of the vertical profiles of specific humidity and air temperature from ICON-LAM6 at Shojna for the 3 d period of interest. During the pre-AR conditions on 5 June 2017, increased humidity of about 4 g kg−1 is seen within the lowest first kilometre of the atmosphere topped by a very dry atmosphere above. Starting from 6 June 2017 00:00 UTC, the AR passage over the Shojna station is identified by an increase in specific humidity within the lowest 3 km of altitude, with a peak of up to 8.5 g kg−1 in the afternoon. As seen at Ny-Ålesund (Fig. 7) and reported by previous studies (Francis et al., 2020; Gorodetskaya et al., 2020), some moisture persists within the atmosphere after the AR passage, with still relatively high humidity values at the surface. One noticeable difference between Shojna and Ny-Ålesund humidity evolution lies in Shojna showing a clear moisture core near the surface during the AR passage, coinciding with the low-level jet (with wind speed around 9 m s−1) and the maximum air temperature (282 K), while at Ny-Ålesund the moisture flux ascends and spreads over high altitudes (i.e. decoupling from the low-level jet). A similar vertical structure was shown by Terpstra et al. (2021) for the Antarctic AR case: the humidity and wind speed maximum are collocated within the AR at its lower latitude extent, while they are decoupled when AR arrives over Antarctica. The displayed difference between ICON-LAM6 and ICON-LAM3 indicates an earlier increase in IWV and thus an earlier arrival of the AR at the Shojna grid point in the coarser-resolution ICON-LAM6 simulation compared to the finer-resolution ICON-LAM3, which is consistent with the finding for the Ny-Ålesund station.
3.3 Atmospheric river impact on surface energy fluxes
AR events are associated with increased IWV and also linked to changes in cloud occurrences and phases, energy fluxes at the surface, and precipitation (Lavers and Villarini, 2015; Ramos et al., 2015; Nash et al., 2018; Wille et al., 2019; Whan et al., 2020). We focus here initially on the AR-related impact on the surface radiative fluxes at Ny-Ålesund.
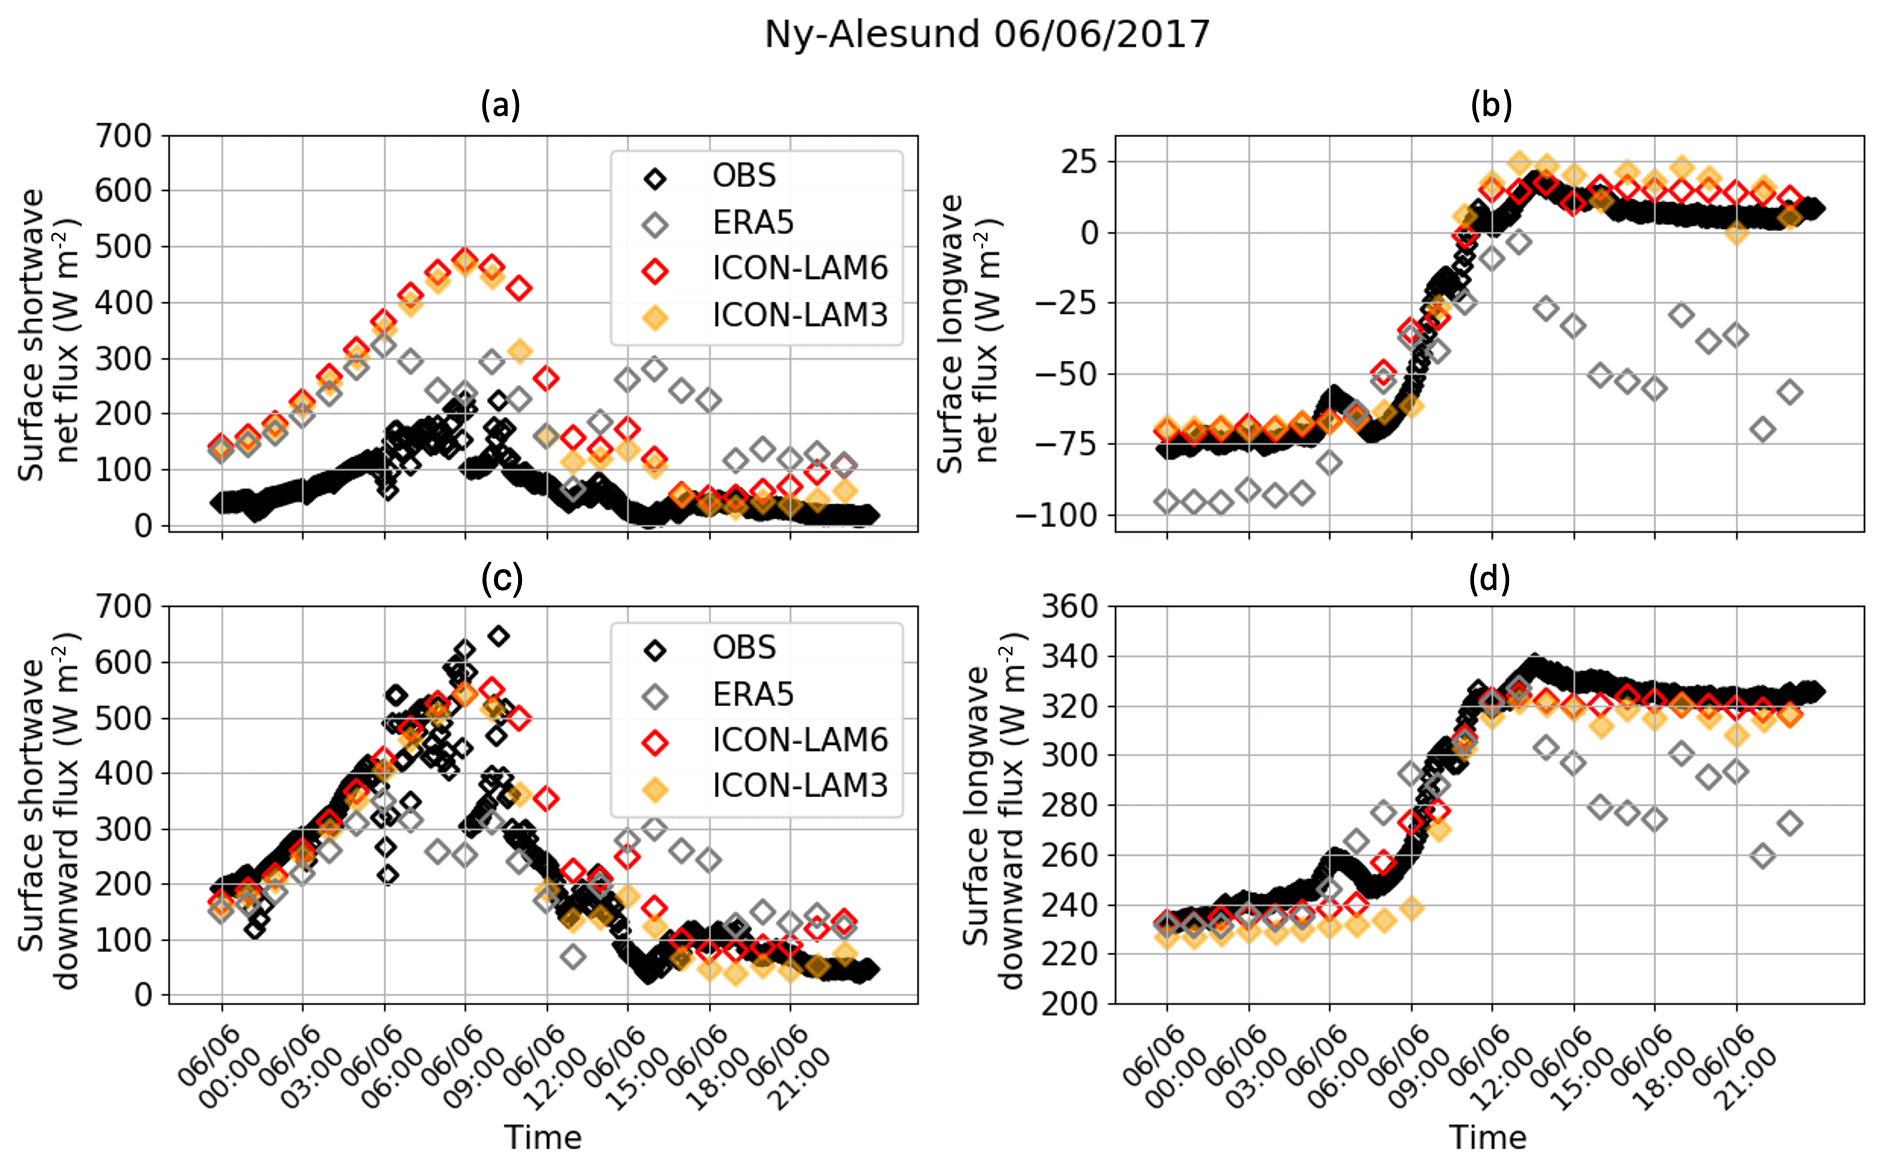
Figure 11Time series of the surface shortwave net flux (a), surface longwave net flux (b), surface shortwave downward flux (c), and surface longwave downward flux (d) (W m−2) from ERA5, ICON-LAM6, ICON-LAM3, and observations at Ny-Ålesund on 6 June 2017. The fluxes are positive downward.
For this, Fig. 11 shows the time series of the surface shortwave and longwave downward and net radiation (fluxes are positive downward) at Ny-Ålesund on 6 June 2017. When the AR arrives over Ny-Ålesund at 09:00 UTC, the shortwave downward radiation at the surface gets strongly attenuated, with a decrease from 600 to about 100 W m−2 within 3 h. The radiation signature of the AR is also found in an enhanced surface longwave downward radiation, by an increase of about 100 W m−2, replacing surface cooling with warming. The maximum longwave downward radiation of about 340 W m−2 relates to the peak of the AR-related IWV at 12:00 UTC (Fig. 5). The calculated radiation impact of our AR case is of larger magnitude than for an Antarctic AR case reported by Wille et al. (2019). We find that the surface longwave net flux changes from ca. −80 W m−2 before the AR arrival to ca. 10 W m−2 after the AR passing (Fig. 11b), indicating a warming contribution from the AR. This change turns the longwave net radiation towards the positive sign and shows that the increase in the downward radiation clearly dominates over the AR-initiated temperature increase of ca. 5 K at the surface (Figs. 6d and 9d) and the related longwave upward radiation increase (not shown). The longwave downward radiation stays elevated, during and after the AR passage, due to the sustained enhanced water vapour level. While ERA5 fails to capture the radiation evolution at Ny-Ålesund realistically, both ICON-LAM simulations represent the effect of the AR on the surface radiation, in agreement with the station observations. However, higher net surface shortwave radiation can be seen in ICON-LAM simulations compared to the observations, and ERA5 may come from the surface albedo representation in the model. For future studies, further insight into the impact of ARs on the surface albedo would help in improving the understanding of ARs' impact on their surroundings. Unfortunately, no data from ICON-GLOBAL were available for this comparison. The factors influencing the radiation are both the AR-related enhanced moisture (Figs. 5 and 6) and the cloud radiative effects. Indeed, a first inspection of both the HATPRO-derived retrieval of cloud liquid water path (LWP) and the 94 GHz cloud-radar-derived reflectivity at Ny-Ålesund on 6 June 2017 indicates a related formation and ca. 6 h-long occurrence of liquid-containing clouds (not shown). A detailed analysis of potential AR-related cloud effects is beyond the scope of this paper but is planned in future after the quality-checked observational data from those instruments become fully available.
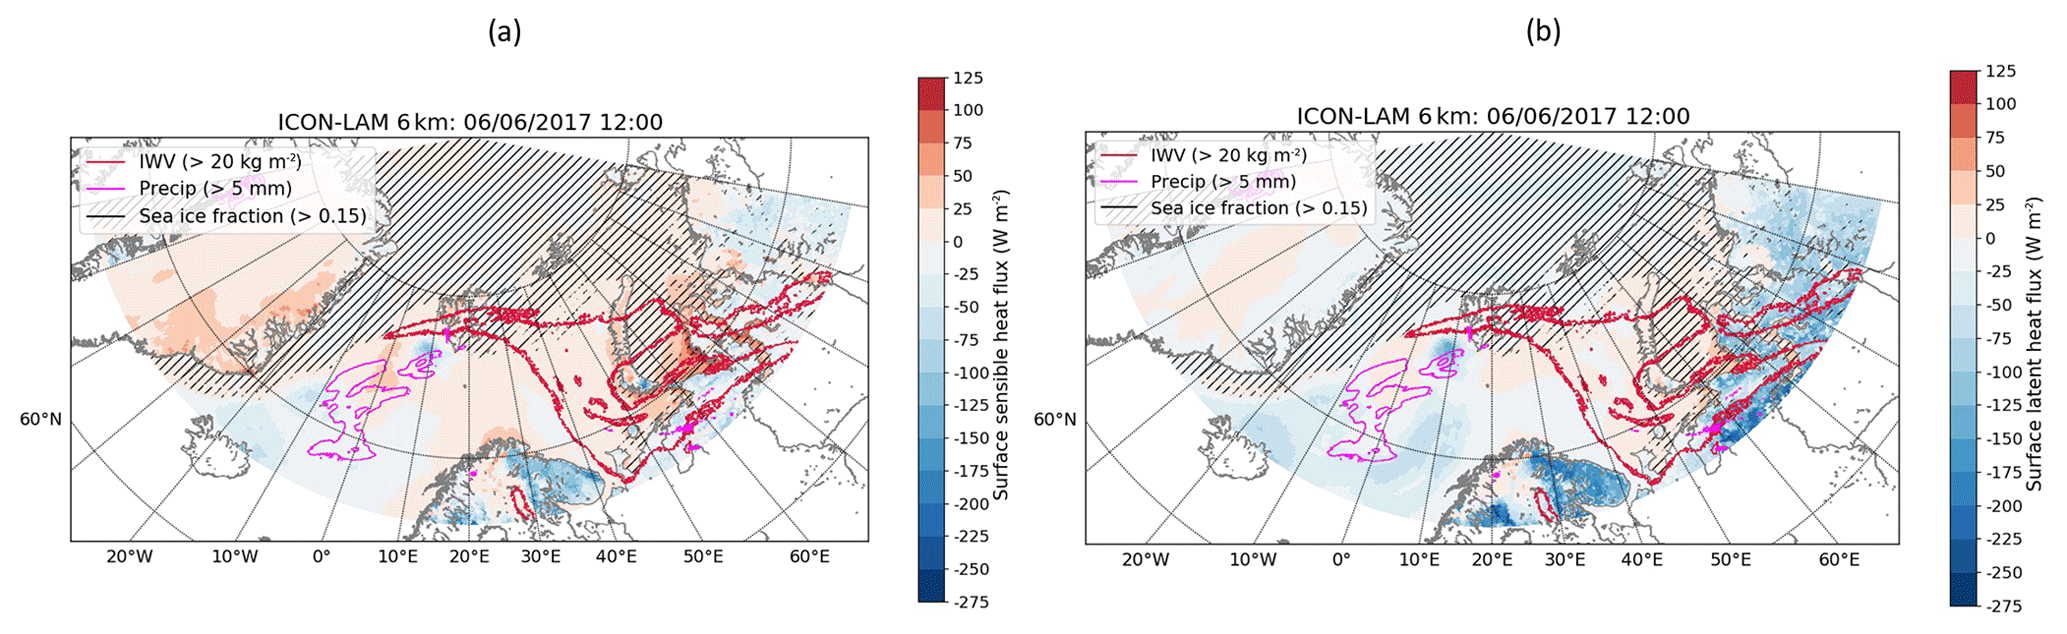
Figure 12Surface map of sensible (a) and latent (b) heat fluxes (W m−2, colour shading) from ICON-LAM 6 km on 6 June 2017 12:00 UTC. Positive/negative signs indicate a downward/upward flux to/from the surface. Regions of IWV > 20 kg m−2 (red line), precipitation > 5 mm (pink line), and sea-ice fraction > 0.15 (black hatching) are included.
Surface turbulent heat fluxes may also be affected by the passage of the AR, as Fig. 12 illustrates. The presented spatial distribution of surface sensible and latent turbulent heat fluxes from ICON-LAM6 on 6 June 2017 12:00 UTC shows that those can be linked to the location of the AR. The figure indicates that, south of the AR, the negative latent heat fluxes (evaporation) dominate at the same location as the low-pressure system over the northern North Atlantic Ocean (Fig. 1). Within the core of the AR (defined here, by the red line, as the region where the IWV is higher than 20 kg m−2), both sensible and latent heat fluxes seem of a relatively similar order of magnitude, with however slightly higher downward sensible heat fluxes (i.e. both positive and negative latent heat fluxes but only positive sensible heat fluxes within the AR location). This may indicate that the surface evaporation is somehow suppressed due to the warm air at the surface associated with the AR passage. Such moisture flux patterns may be a characteristic of AR events (Komatsu et al., 2018; Wille et al., 2019; Terpstra et al., 2021). Furthermore, the high evaporation at the southern extent of the AR indicates the moisture sources over north-western Siberia. Hence both the high evaporation in the south and suppressed evaporation along the AR extent show that the moisture source arises from Siberia. The differences in the turbulent heat fluxes between ICON-LAM6 and ICON-LAM3 are small and statistically not significant (not shown). Although this study only modestly explores the effect of the AR on the surface energy budget, the initial results show a clear impact of the AR on the surface energy fluxes. Future work on this topic would be needed to fully estimate and understand the contribution of AR events to the surface energy budget in the polar regions.
For the first time this study analyses, with high-resolution simulations, a moisture intrusion event which was identified as an AR during the ACLOUD campaign from 5 to 7 June 2017 over the Nordic seas. The AR reached Ny-Ålesund and the Norwegian Sea by elongating from the north-western coast of Siberia and over the Kara Sea and the Arctic Ocean. With the help of observational datasets (HATPRO, GNSS, radiosondes, and satellite-borne measurements) and a reanalysis product (ERA5), the spatio-temporal structure of the AR was assessed, and its representation in the ICON-LAM at 6 and 3 km horizontal resolution was evaluated.
A large moisture anomaly, as large as 15 kg m−2 compared to the climatological mean, was observed at the location of the AR, with actual IWV values greater than 25 kg m−2. Comparable IWV patterns were previously reported from other ARs in the Arctic (Komatsu et al., 2018) and over Antarctica (Wille et al., 2019; Gorodetskaya et al., 2020). The study presented the long and narrow filament-like AR structure extending over the entire Nordic seas and showing a vertical structure with the maximum moisture at 1–2 km height. The analysis showed that the passage of the AR affects the entire atmospheric column as well as the surface, and those effects can last for several hours (at least 24 h) after the AR event.
Comparing the IWV spatial structure of the model with the ERA5 reanalysis, the representation of the AR was found to be well captured by the ICON-LAM simulations. However, a southward shift of the AR was found in the simulation compared with ERA5 and ICON-GLOBAL, probably due to its higher horizontal resolution. The capability of the ICON-LAM simulations to capture the AR spatial IWV structure was confirmed by the additional model-to-observation evaluation using brightness temperature comparison. Furthermore, the observed AR signatures in the temperature, humidity, and wind profiles at the two stations Ny-Ålesund (Svalbard) and Shojna (north-western Russian coast), which the AR passed over, are represented in the ICON-LAM simulations: an increase in near-surface air temperature by ca. 5 K and corresponding dissolved temperature inversion, an increase in specific humidity by ca. 4 g kg−1 in the lower troposphere and in IWV by ca. 15 kg m−2, and the establishment of a low-level wind jet. The AR-related upper-tropospheric dry layer is also realistically represented in both ICON-LAM simulations at Ny-Ålesund, while at Shojna improvements would be needed.
The results from this study showed that the ICON-LAM model is able to represent the spatio-temporal structure of the selected AR and for specific features with a higher accuracy than the driving global ICON model and the ERA5 reanalysis. This was demonstrated in the more accurate representation of the AR’s impact on the temperature, wind, and humidity profile changes at Ny-Ålesund. The models and reanalysis differ in both the horizontal and vertical resolution, and assessment of this overall implication is complex. Although ERA5 has a similar number of levels in the lowermost 5 km to ICON-LAM, it does not show an advanced skill in the AR signature in the vertical profiles of temperature, humidity, and wind at Ny-Ålesund, where the simulations with the ICON high horizontal resolutions show a better skill. This indicates that a certain horizontal model resolution is of particular importance for an effective comparison with station observations near coastal and/or complex topography. However, an advanced skill for all aspects of the AR cannot be concluded. The 3 km simulation also shows a slightly narrower AR with a slightly later arrival at Ny-Ålesund compared with the 6 km model, but its added value is hard to evaluate.
An initial analysis of the impact of the AR event on the surface radiation and turbulent heat fluxes at Ny-Ålesund was performed. The results showed the significant surface radiation signature of the AR when it passed the station by the drastically decreased downward shortwave radiation (by more than 300 W m−2) and increased downward longwave radiation (by ca. 100 W m−2) within 3 h, shifting the cooling at the surface to a surface warming. The surface heat fluxes are also affected at the AR location (decrease in the heat fluxes) and in its vicinity (higher latent heat fluxes associated with precipitation). The strong impact of the AR on the energy fluxes at the surface and its realistic representation in the ICON-LAM simulations was demonstrated. Although this study mainly focuses on one AR case, those initial results clearly show the impact of the AR on the surface energy fluxes. However, more in-depth analyses of this would be required to fully understand the effect of the AR passage on its surroundings and in particular the role of the water vapour and the cloud radiative effects. For this, the Multidisciplinary drifting Observatory for the Study of Arctic Climate (MOSAiC) will provide the necessary and unique in situ datasets to study this for other AR cases during that expedition.
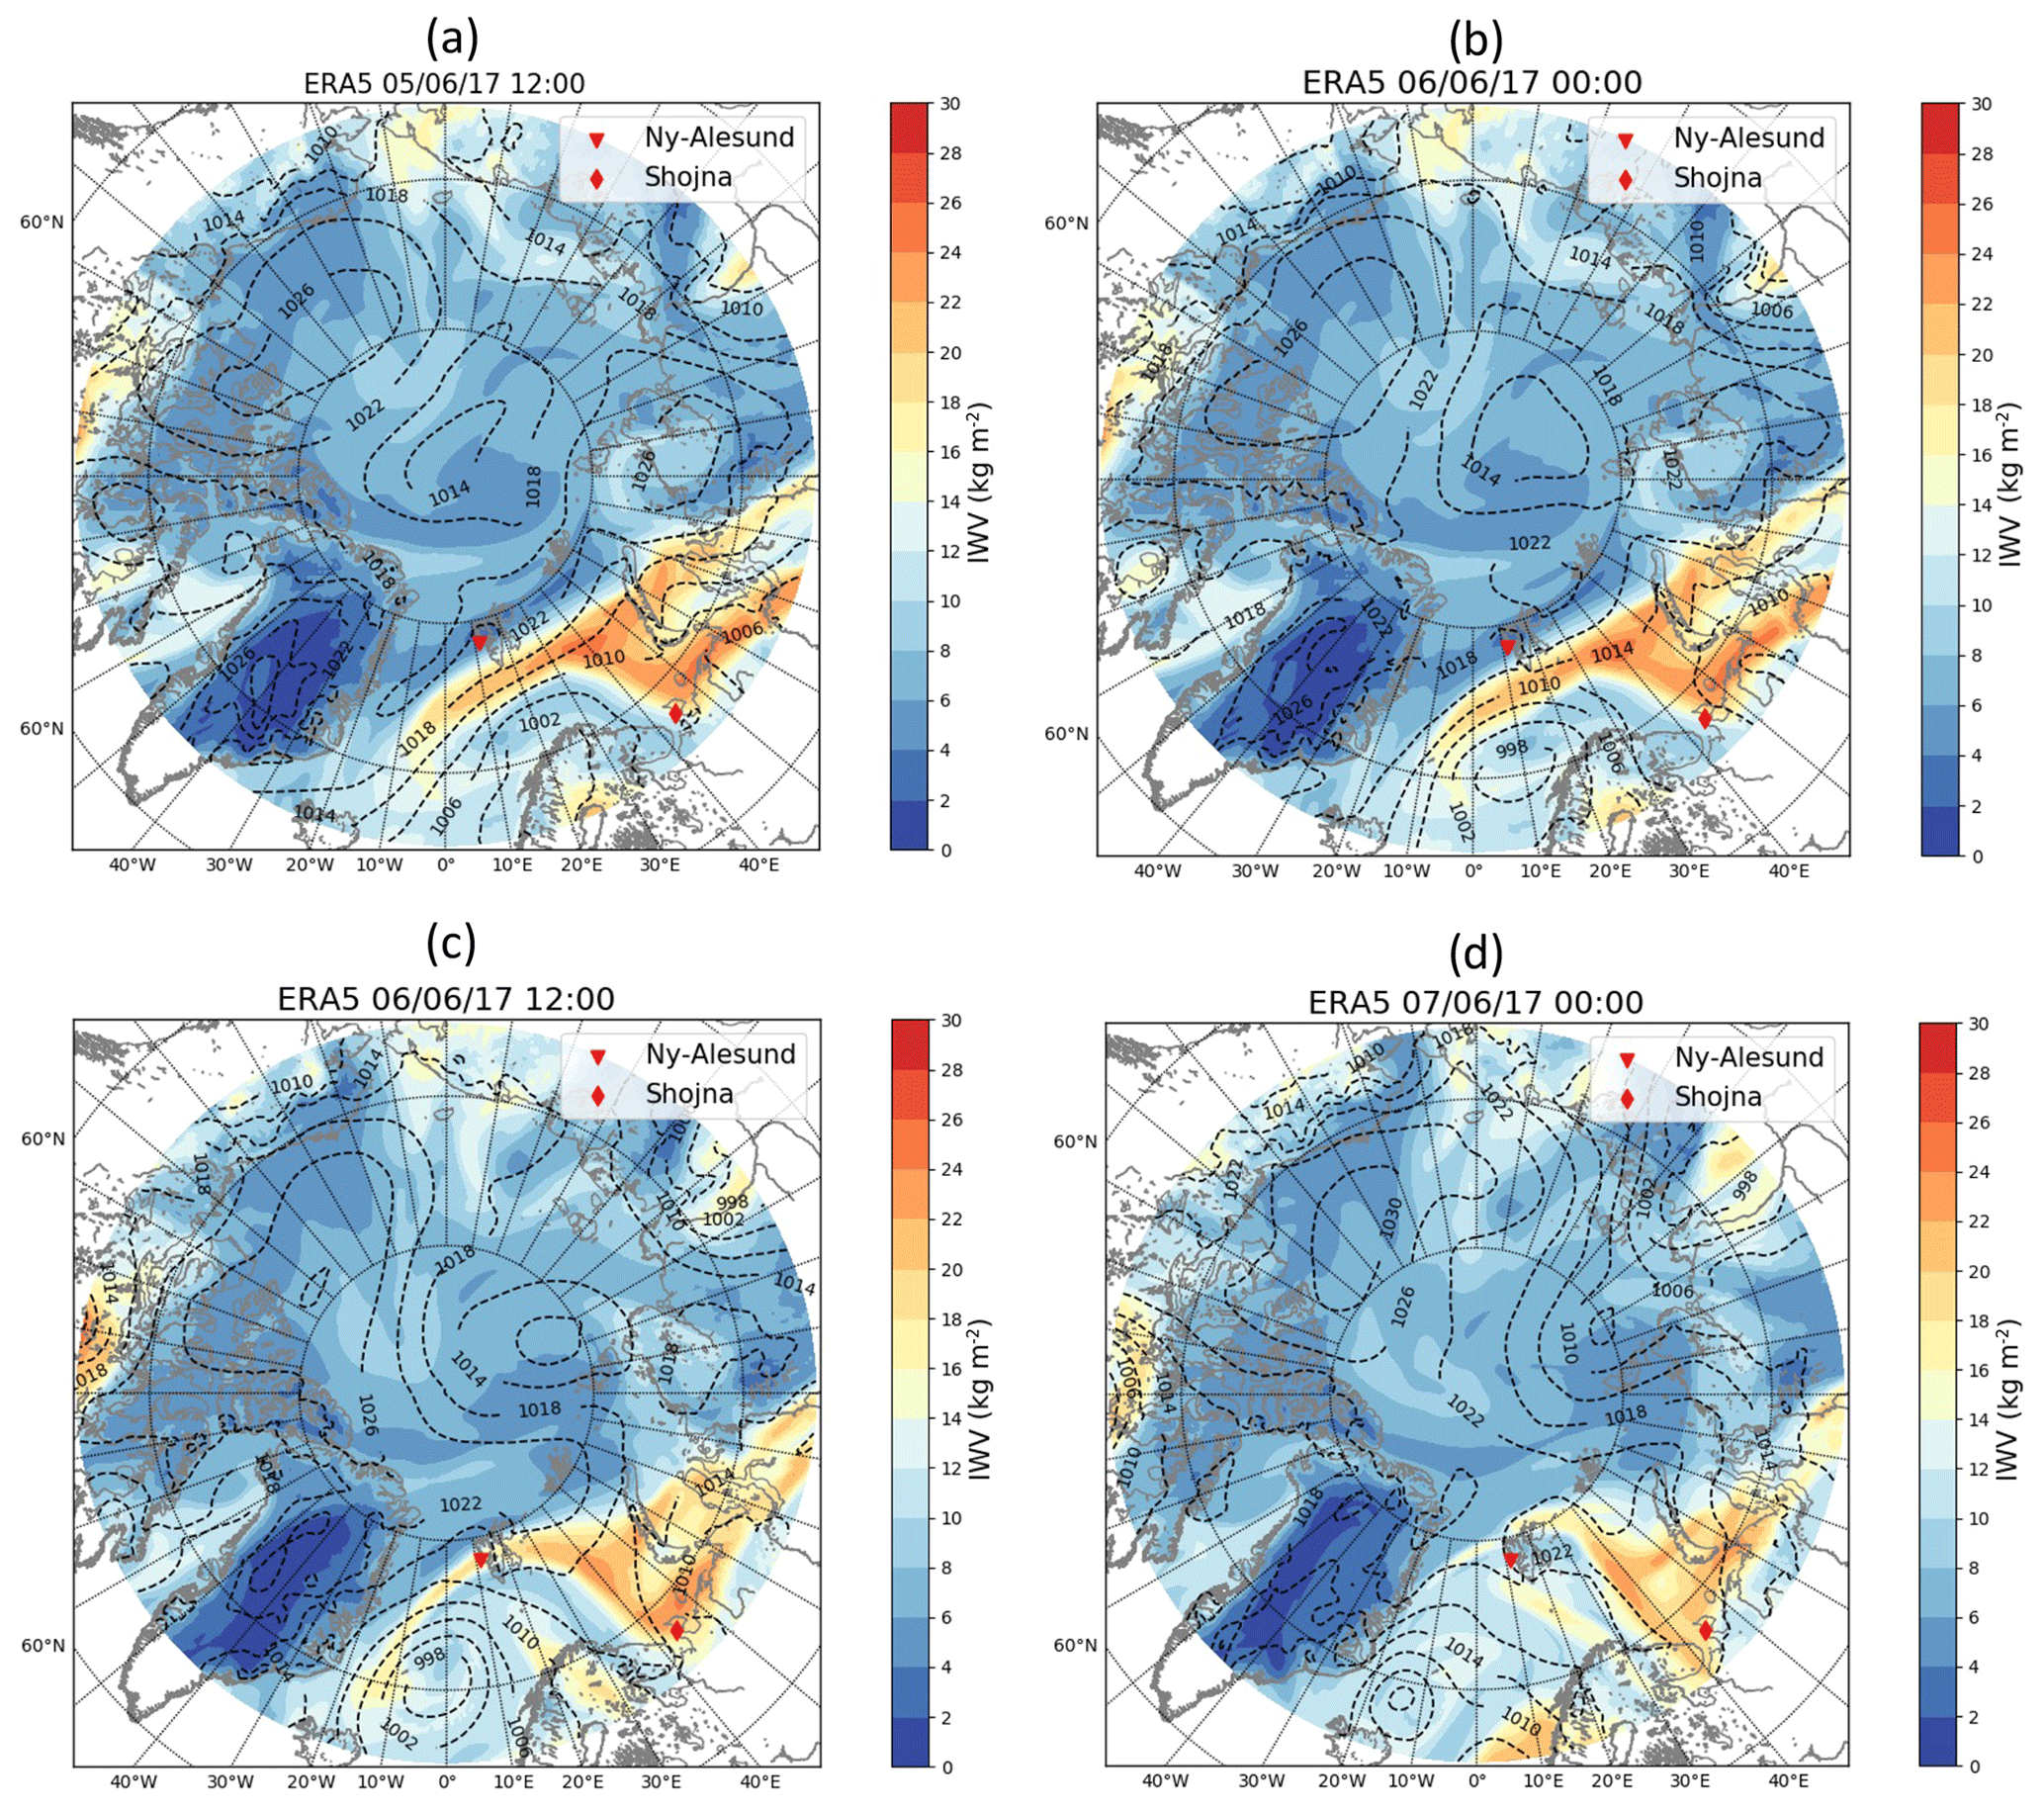
Figure A1Pan-Arctic ICON-LAM domain and representation of the integrated water vapour (IWV, kg m−2, colour shading) and mean sea level pressure (MSLP, hPa, black dotted isolines) from ERA5 from 5 June 2017 12:00 UTC to 7 June 2017 00:00 UTC. The locations of the Ny-Ålesund and Shojna research stations are included as red symbols.
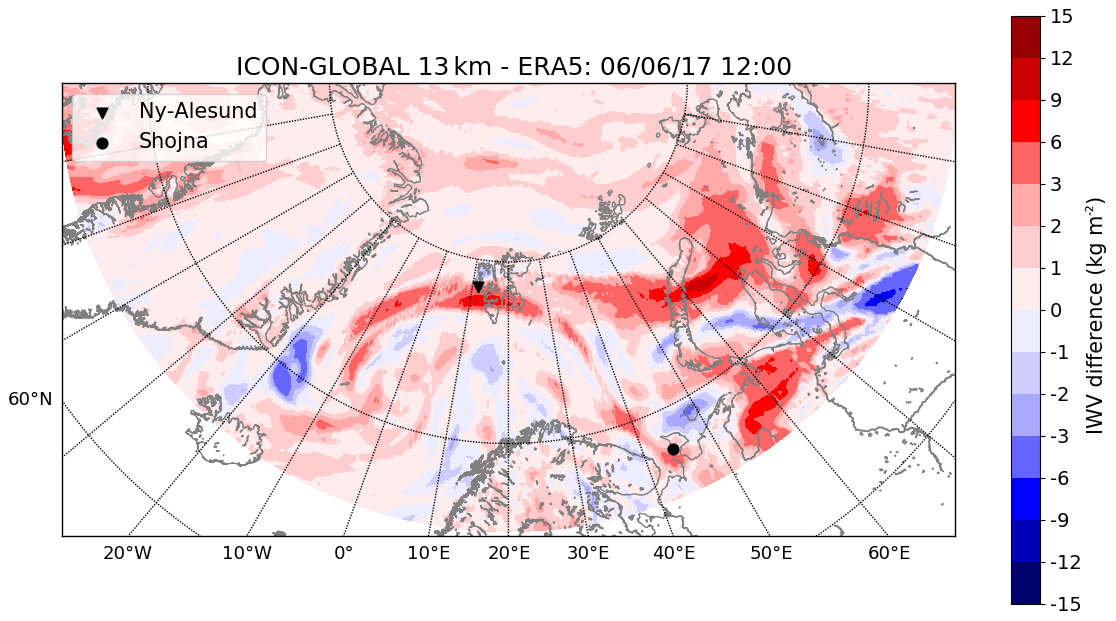
Figure A2Differences in IWV (kg m−2) between ICON-GLOBAL 13 km and ERA5 on 6 June 2017 12:00 UTC. The IWV field has been remapped onto the ERA5 (0.25 × 0.25 regular latitude–longitude) grid to calculate the difference.
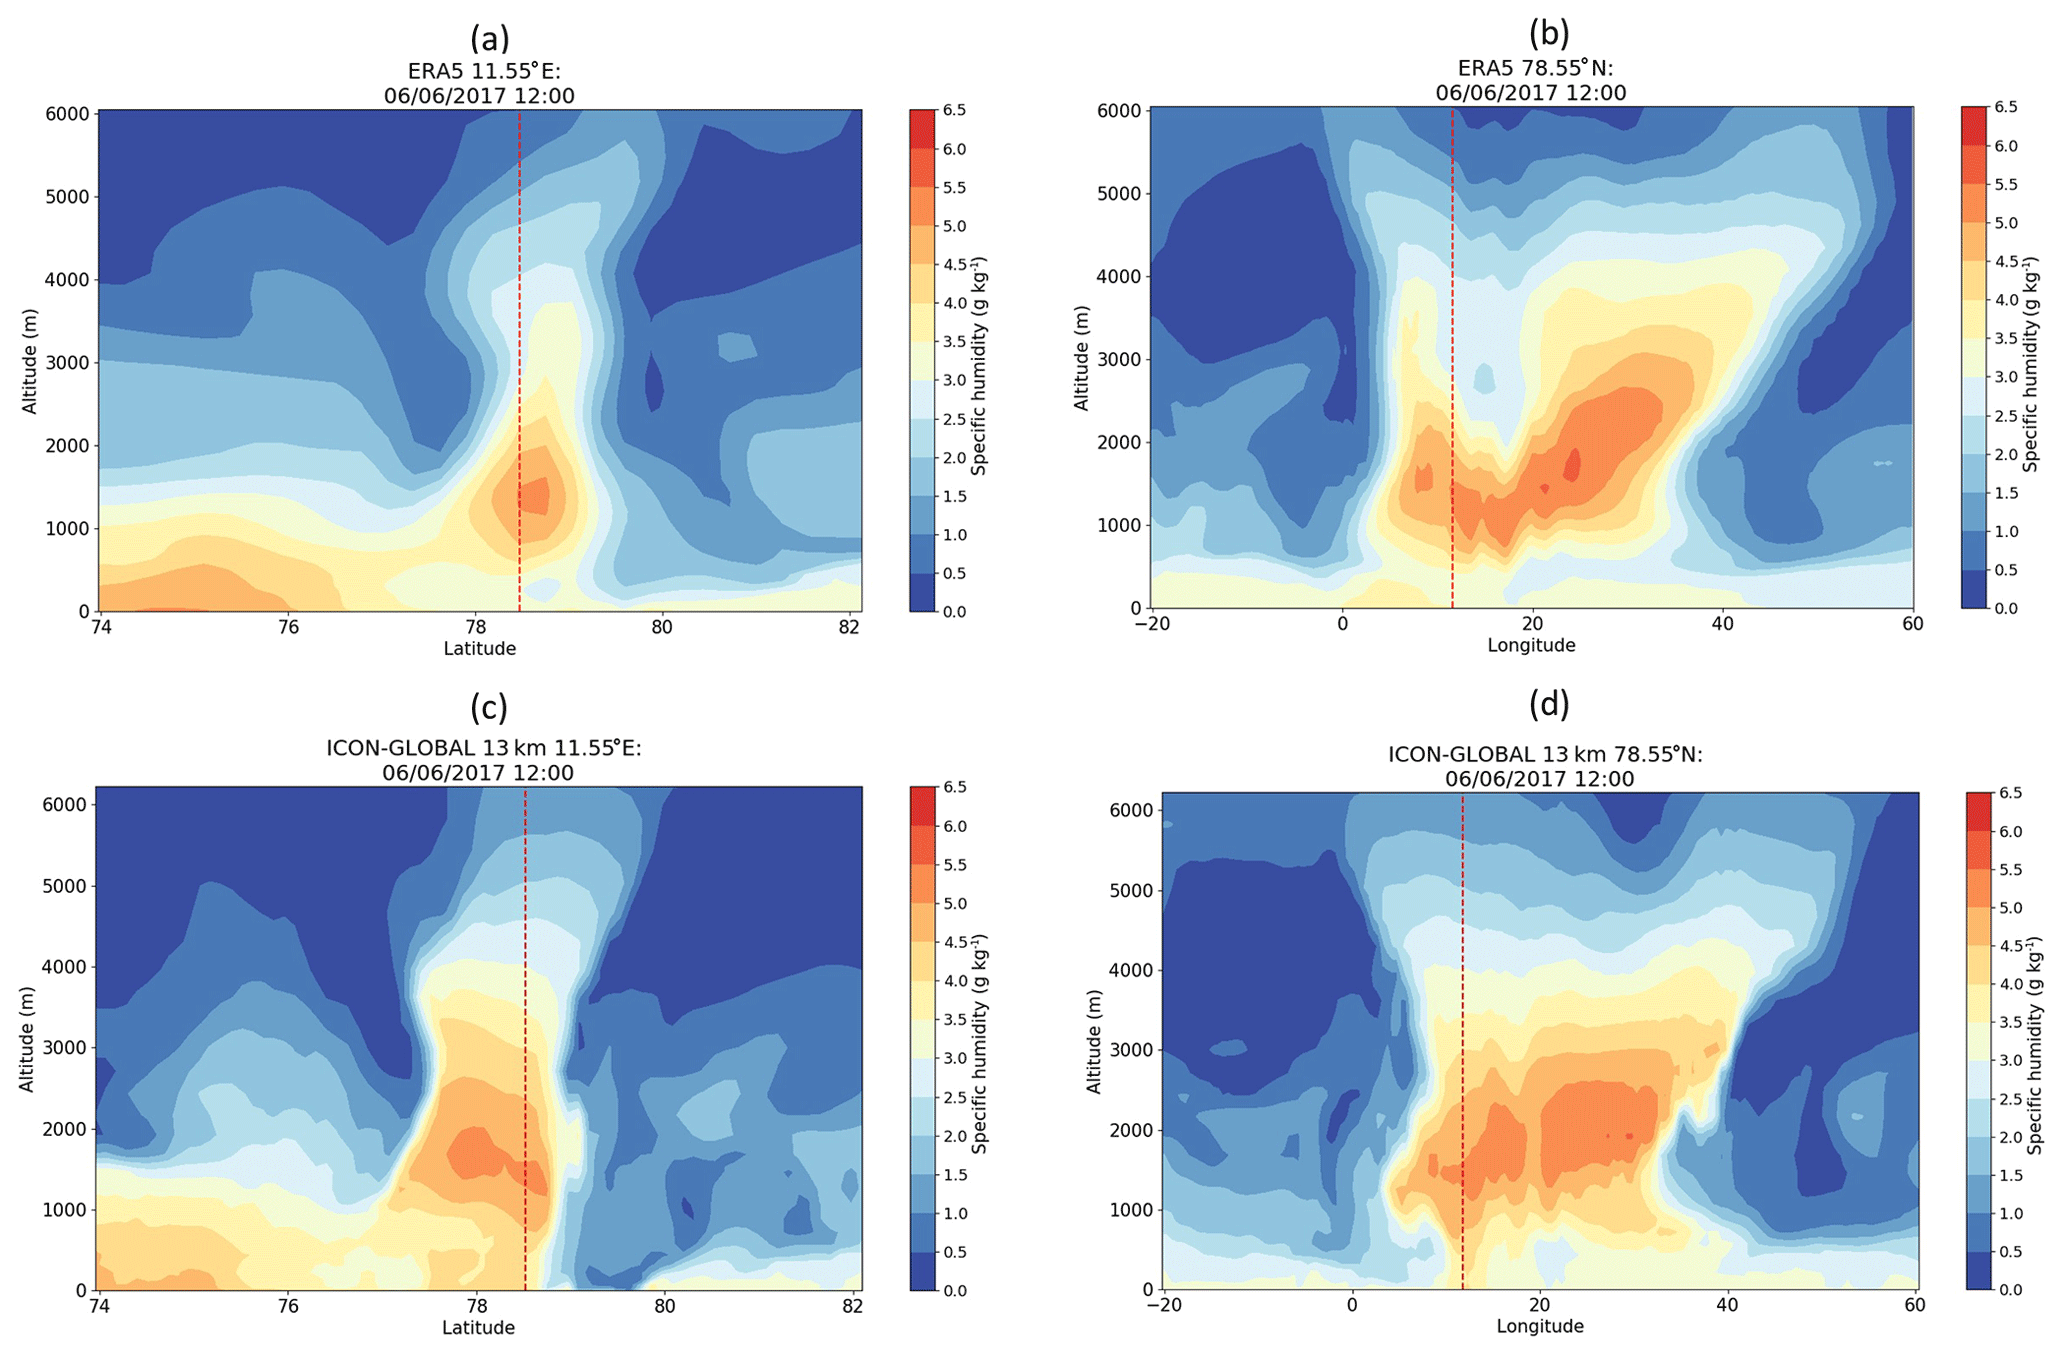
Figure A3Altitude–latitude/longitude cross sections of specific humidity (g kg−1, colour shading) from ERA5 (a, b) and ICON-GLOBAL (c, d) along latitude at 11.55∘ E (a, c) and along longitude at 78.55∘ N (b, d) on 6 June 2017 12:00 UTC. Black and red dotted lines: Ny-Ålesund location. The locations of the cross sections are indicated in Fig. 2d.
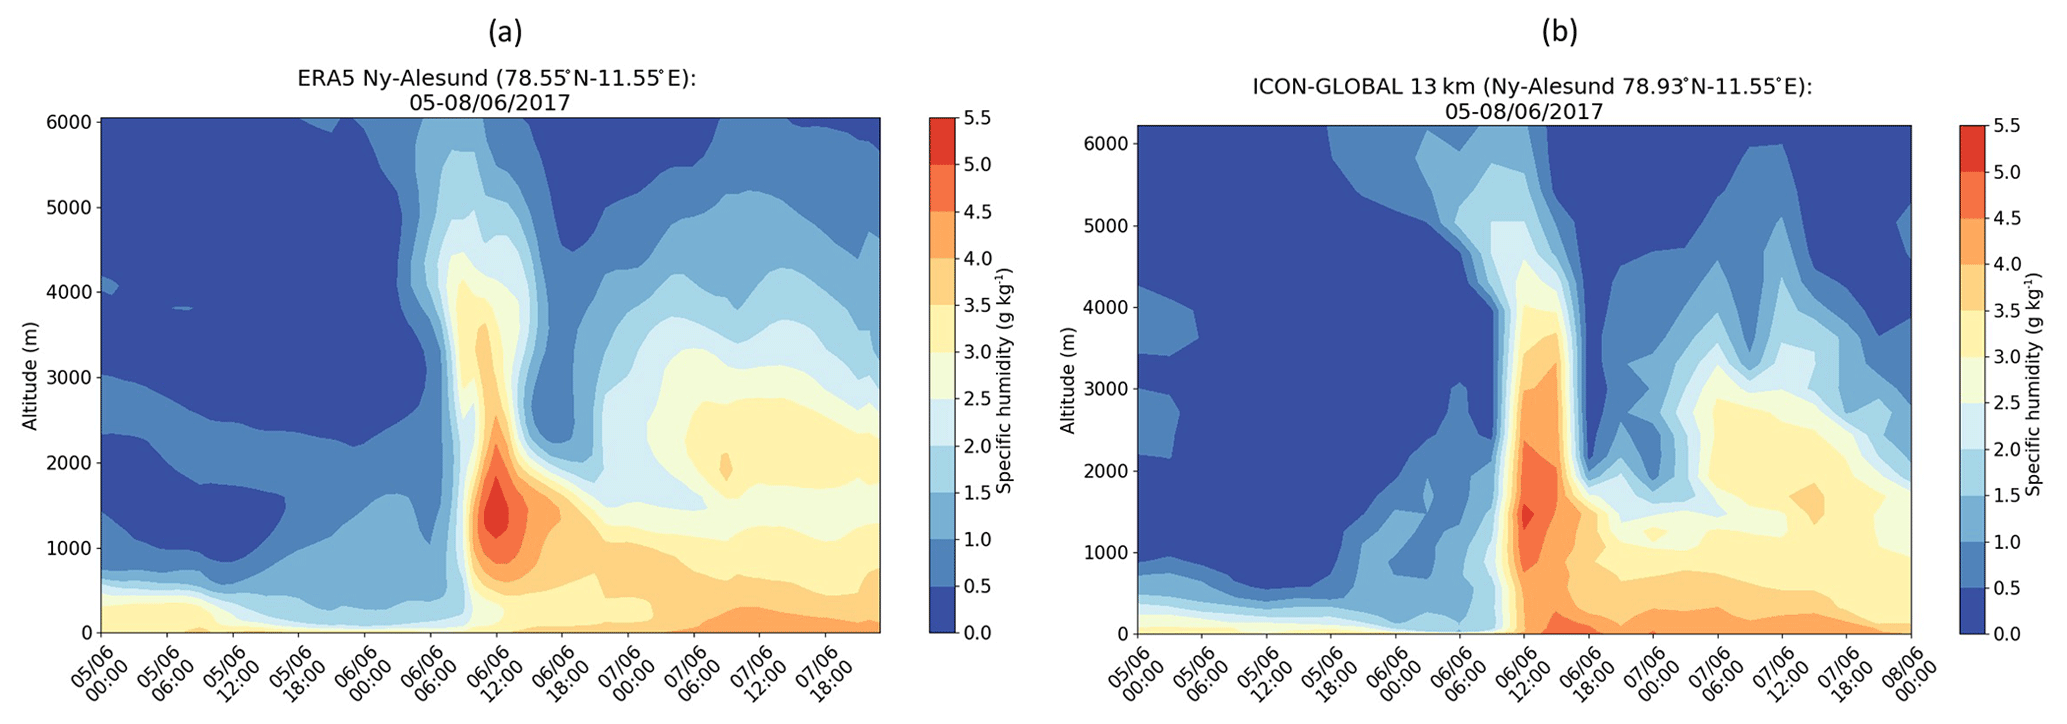
Figure A4Time series of specific humidity (g kg−1, colour shading) profiles at Ny-Ålesund from ERA5 (a) and ICON-GLOBAL (b) from 5 June 2017 00:00 UTC to 8 June 2017 00:00 UTC.
The ICON model code is distributed under a licence by the Deutscher Wetterdienst (DWD). More information can be found on a MPI-M webpage (https://code.mpimet.mpg.de/projects/iconpublic/wiki/How_to_obtain_the_model_code, Deutscher Wetterdienst, 2021) and on the DWD website. The PAMTRA model code is available in a GitHub repository distributed under an GPLv3.0 licence found at https://github.com/igmk/pamtra (https://doi.org/10.5281/zenodo.3582992, Mech et al., 2019).
The ICON-GLOBAL, ICON-LAM, and PAMTRA (input and output) model data are stored at the AWI computing centre and are available upon request from the corresponding author. The ERA5 data can be found at https://www.ecmwf.int/en/forecasts/dataset/ecmwf-reanalysis-v5 (Copernicus Climate Change Service, 2021). The observational data from Ny-Ålesund are available at the PANGAEA data repository for radiosondes (https://doi.org/10.1594/PANGAEA.879822, Maturilli, 2017), HATPRO (https://doi.org/10.1594/PANGAEA.902142, Nomokonova et al., 2019b), and surface radiation measurements (https://doi.org/10.1594/PANGAEA.887502, Maturilli, 2018). The radiosonde data for the Shojna station from the IGRA network (https://www.ncdc.noaa.gov/data-access/weather-balloon/integrated-global-radiosonde-archive, last access: 8 June 2021) are available at https://www1.ncdc.noaa.gov/pub/data/igra/ (Durre, 2020). The MHS satellite data can be found at https://www.avl.class.noaa.gov/saa/products/welcome (NOAA, 2021).
HB and AR led the coordination and design of the study and the results interpretation. DR and VS helped with the ICON-LAM simulation set-up over the Arctic domain. MMe did the set-up of PAMTRA for the ICON input and performed the PAMTRA simulations. CV, MMa, and KE provided and helped with the observational dataset for the Ny-Ålesund research station. HB processed the data, plotted the figures, and drafted the manuscript. IG and SC helped with AR physics interpretation and with the shape of the study and revision of the manuscript. All the authors contributed to the shape of the study and to the revision of the manuscript.
The contact author has declared that neither they nor their co-authors have any competing interests.
Publisher’s note: Copernicus Publications remains neutral with regard to jurisdictional claims in published maps and institutional affiliations.
We are thankful for the support by the Deutsche Forschungsgemeinschaft (DFG, German Research Foundation) within the Transregional Collaborative Research Center “ArctiC Amplification: Climate Relevant Atmospheric and SurfaCe Processes, and Feedback Mechanisms (AC)3”. The authors thank the Alfred Wegener Institute (AWI) and the German Climate Computing Centre (DKRZ) for the use of the computer time and storage. We are grateful for the Deutscher Wetterdienst (DWD) for their help with the ICON model set-up and for the ICON-GLOBAL dataset. The authors would like to thank Christoph Ritter (from AWI), Tiina Nygård (from the Finnish Meteorological Institute), and Melanie Lauer (from the Institute of Geophysics and Meteorology of the University of Cologne) for their help with the Ny-Ålesund, IGRA, and MHS datasets respectively. Finally, we thank Rune Graversen and an anonymous reviewer for their constructive comments that helped to improve this paper.
This research has been supported by the Deutsche Forschungsgemeinschaft (DFG, German Research Foundation, TRR172-AC3 project, grant no. 268020496), the Helmholtz Climate Initiative REKLIM, the German Federal Ministry of Education and Research (BMBF, QUARCCS project, grant no. 03F0832A), and the Portuguese Fundação para a Ciência e Tecnologia (FCT, grant nos. UIDP/50017/2020 and UIDB/50017/2020). Carolina Viceto was supported by the FCT PhD grant no. SFRH/BD/129154/2017).
The article processing charges for this open-access publication were covered by the Alfred Wegener Institute, Helmholtz Centre for Polar and Marine Research (AWI).
This paper was edited by Farahnaz Khosrawi and reviewed by Rune Grand Graversen and one anonymous referee.
Aires, F., Prigent, C., Bernardo, F., Jiménez, C., Saunders, R., and Brunel, P.: A Tool to Estimate Land-Surface Emissivities at Microwave frequencies (TELSEM) for use in numerical weather prediction, Q. J. Roy. Meteor. Soc., 137, 690–699, 2011. a
Barker, D., Huang, X. Y., Liu, Z., Auligné, T., Zhang, X., Rugg, S., Ajjaji, R., Bourgeois, A., Bray, J., Chen, Y., Demirtas, M., Guo, Y., Henderson, T., Huang, W., Lin, H., Michalakes, J., Rizvi, S., and Zhang, X.: The weather research and forecasting model's community variational/ensemble data assimilation system: WRFDA, B. Am. Meteorol. Soc., 93, 831–843, 2012. a
Bechtold, P., Koehler, M., Jung, T., Doblas-Reyes, F., Leutbecher, M., Rodwell, M. J., Vitart, F., and Balsamo, G.: Advances in simulating atmospheric variability with the ECMWF model: From synoptic to decadal time-scales, Q. J. Roy. Meteor. Soc., 134, 1337–1351, 2008. a
Boisvert, L. N., Petty, A. A., and Stroeve, J. C.: The impact of the extreme winter 2015/16 Arctic cyclone on the Barents–Kara Seas, Mon. Weather Rev., 144, 4279–4287, 2016. a
Browning, K.: The dry intrusion perspective of extra-tropical cyclone development, Meteorol. Appl., 4, 317–324, 1997. a
Copernicus Climate Change Service (C3S): ERA5: Fifth generation of ECMWF atmospheric reanalyses of the global climate, https://doi.org/10.24381/cds.bd0915c6, 2017. a
Copernicus Climate Change Service: ECMWF ERA5, Copernicus Climate Change Service [data set], available at: https://www.ecmwf.int/en/forecasts/dataset/ecmwf-reanalysis-v5, last access: 19 October 2021. a
Crewell, S., Ebell, K., Konjari, P., Mech, M., Nomokonova, T., Radovan, A., Strack, D., Triana-Gómez, A. M., Noël, S., Scarlat, R., Spreen, G., Maturilli, M., Rinke, A., Gorodetskaya, I., Viceto, C., August, T., and Schröder, M.: A systematic assessment of water vapor products in the Arctic: from instantaneous measurements to monthly means, Atmos. Meas. Tech., 14, 4829–4856, https://doi.org/10.5194/amt-14-4829-2021, 2021. a, b, c
Dee, D. P., Uppala, S. M, Simmons, A. J., Berrisford, P., Poli, P., Kobayashi, S., Andrae, U. , Balmaseda, M. A., Balsamo, G., Bauer, P., Bechtold, P., Beljaars, A. C. M., van de Berg, L. , Bidlot, J., Bormann, N., Delsol, C., Dragani, R., Fuentes, M. , Geer, A. J., Haimberger, L., Healy, S. B., Hersbach, H., Hólm, E. V., Isaksen, L. , Kållberg, P. K, Köhler, M., Matricardi, M., McNally, A. P., Monge-Sanz, B. M., Morcrette, J.-J., Park, B.-K., Peubey, C., de Rosnay, P., Tavolato, C., Thépaut, J.-N., and Vitart, F.: The ERA-Interim reanalysis: Configuration and performance of the data assimilation system, Q. J. Roy. Meteor. Soc., 137, 553–597, 2011. a
Deutscher Wetterdienst: PArallel MOdel data REtrieve from Oracle databases (PAMORE), available at: https://www.dwd.de/DE/leistungen/pamore/pamore.html, last access: 18 January 2020. a
Deutscher Wetterdienst: ICON Institutional License, Deutscher Wetterdienst, available at: https://code.mpimet.mpg.de/projects/iconpublic/wiki/How_to_obtain_the_model_code, last access: 19 April 2021. a
Dick, G., Gendt, G., and Reigber, C.: First experience with near real-time water vapor estimation in a German GPS network, J. Atmos. Sol.-Terr. Phy., 63, 1295–1304, 2001. a
Dipankar, A., Stevens, B., Heinze, R., Moseley, C., Zängl, G., Giorgetta, M., and Brdar, S.: Large eddy simulation using the general circulation model ICON, J. Adv. Model. Earth Syst., 7, 963–986, 2015. a
Dobler, A., Førland, E., and Isaksen, K.: Present and future heavy rainfall statistics for Svalbard–Background-report for Climate in Svalbard 2100, Norwegian Center for Climate Services (NCCS) report no. 3/2019, ISSN 2387-3027, available at: https://klimaservicesenter.no/kss/rapporter/klima-pa-svalbard-2100 (last access: 17 February 2021), 2019. a
Durre, I.: Integrated Global Radiosonde Archive (IGRA) Version 2, National Oceanic and Atmospheric Administration (NOAA) [data set], available at: https://www1.ncdc.noaa.gov/pub/data/igra/ (last access: 8 June 2021), 2020. a
Durre, I., Vose, R. S., and Wuertz, D. B.: Overview of the integrated global radiosonde archive, J. Climate, 19, 53–68, 2006. a
Ehrlich, A., Wendisch, M., Lüpkes, C., Buschmann, M., Bozem, H., Chechin, D., Clemen, H.-C., Dupuy, R., Eppers, O., Hartmann, J., Herber, A., Jäkel, E., Järvinen, E., Jourdan, O., Kästner, U., Kliesch, L.-L., Köllner, F., Mech, M., Mertes, S., Neuber, R., Ruiz-Donoso, E., Schnaiter, M., Schneider, J., Stapf, J., and Zanatta, M.: A comprehensive in situ and remote sensing data set from the Arctic CLoud Observations Using airborne measurements during polar Day (ACLOUD) campaign, Earth Syst. Sci. Data, 11, 1853–1881, https://doi.org/10.5194/essd-11-1853-2019, 2019. a
Francis, D., Mattingly, K. S., Temimi, M., Massom, R., and Heil, P.: On the crucial role of atmospheric rivers in the two major Weddell Polynya events in 1973 and 2017 in Antarctica, Sci. Adv., 6, eabc2695, https://doi.org/10.1126/sciadv.abc2695, 2020. a, b
Gendt, G., Dick, G., Reigber, C., Tomassini, M., Liu, Y., and Ramatschi, M.: Near real time GPS water vapor monitoring for numerical weather prediction in Germany, J. Meteorol. Soc. Jpn. Ser. II, 82, 361–370, 2004. a
Ghatak, D. and Miller, J.: Implications for Arctic amplification of changes in the strength of the water vapor feedback, J. Geophys. Res.-Atmos., 118, 7569–7578, 2013. a
Giorgetta, M. A., Brokopf, R., Crueger, T., Esch, M., Fiedler, S., Helmert, J., Hohenegger, C., Kornblueh, L., Köhler, M., Manzini, E., Mauritsen, T., Nam, C., Raddatz, T., Rast, S., Reinert, D., Sakradzija, M., Schmidt, H., Schneck, R., Schnur, R., Silvers, L., Wan, H., Zängl, G., and Stevens, B.: ICON-A, the atmosphere component of the ICON Earth System Model: I. Model description, J. Adv. Model. Earth Syst., 10, 1613–1637, 2018. a
Gorodetskaya, I. V., Tsukernik, M., Claes, K., Ralph, M. F., Neff, W. D., and Van Lipzig, N. P.: The role of atmospheric rivers in anomalous snow accumulation in East Antarctica, Geophys. Res. Lett., 41, 6199–6206, https://doi.org/10.1002/2014GL060881, 2014. a, b
Gorodetskaya, I. V., Silva, T., Schmithüsen, H., and Hirasawa, N.: Atmospheric River Signatures in Radiosonde Profiles and Reanalyses at the Dronning Maud Land Coast, East Antarctica, Adv. Atmos. Sci., 37, 455–476, https://doi.org/10.1007/s00376-020-9221-8, 2020. a, b, c, d, e, f, g, h, i
Graham, R. M., Cohen, L., Ritzhaupt, N., Segger, B., Graversen, R. G., Rinke, A., Walden, V. P., Granskog, M. A., and Hudson, S. R.: Evaluation of Six Atmospheric Reanalyses over Arctic Sea Ice from Winter to Early Summer, J. Climate, 32, 4121–4143, https://doi.org/10.1175/JCLI-D-18-0643.1, 2019. a
Guan, B., Waliser, D. E., and Ralph, F. M.: An intercomparison between reanalysis and dropsonde observations of the total water vapor transport in individual atmospheric rivers, J. Hydrometeorol., 19, 321–337, 2018. a
Hersbach, H., Bell, B., Berrisford, P., Hirahara, S., Horányi, A., Muñoz-Sabater, J., Nicolas, J., Peubey, C., Radu, R., Schepers, D., Simmons, A., Soci, C., Abdalla, S., Abellan, X., Balsamo, G., Bechtold, P., Biavati, G., Bidlot, J., Bonavita, M., De Chiara, G., Dahlgren, P., Dee, D., Diamantakis, M., Dragani, R., Flemming, J., Forbes, R., Fuentes, M., Geer, A., Haimberger, L., Healy, S., Hogan, R. J., Hólm, E., Janisková, M., Keeley, S., Laloyaux, P., Lopez, P., Lupu, C., Radnoti, G., de Rosnay, P., Rozum, I., Vamborg, F., Villaume, S., and Thépaut, J.-N.: The ERA5 global reanalysis, Q. J. Roy. Meteor. Soc., 146, 1999–2049, 2020. a
Hogan, R. J., Honeyager, R., Tyynelä, J., and Kneifel, S.: Calculating the millimetre-wave scattering phase function of snowflakes using the self-similar Rayleigh–Gans Approximation, Q. J. Roy. Meteor. Soc., 143, 834–844, https://doi.org/10.1002/qj.2968, 2017. a
Inoue, J., Sato, K., Rinke, A., Cassano, J. J., Fettweis, X., Heinemann, G., Matthes, H., Orr, A., Phillips, T., Seefeldt, M., Solomon, A., and Webster, S.: Clouds and Radiation Processes in Regional Climate Models Evaluated Using Observations Over the Ice-free Arctic Ocean, J. Geophys. Res.-Atmos., 126, e2020JD033904, https://doi.org/10.1029/2020JD033904, 2021. a
Knudsen, E. M., Heinold, B., Dahlke, S., Bozem, H., Crewell, S., Gorodetskaya, I. V., Heygster, G., Kunkel, D., Maturilli, M., Mech, M., Viceto, C., Rinke, A., Schmithüsen, H., Ehrlich, A., Macke, A., Lüpkes, C., and Wendisch, M.: Meteorological conditions during the ACLOUD/PASCAL field campaign near Svalbard in early summer 2017, Atmos. Chem. Phys., 18, 17995–18022, https://doi.org/10.5194/acp-18-17995-2018, 2018. a
Komatsu, K. K., Alexeev, V. A., Repina, I. A., and Tachibana, Y.: Poleward upgliding Siberian atmospheric rivers over sea ice heat up Arctic upper air, Sci. Rep., 8, 1–15, https://doi.org/10.1038/s41598-018-21159-6, 2018. a, b, c, d, e, f
Lavers, D. A. and Villarini, G.: The contribution of atmospheric rivers to precipitation in Europe and the United States, J. Hydrol., 522, 382–390, 2015. a
Liu, C. and Barnes, E. A.: Extreme moisture transport into the Arctic linked to Rossby wave breaking, J. Geophys. Res.-Atmos., 120, 3774–3788, 2015. a
Martin, A., Ralph, F. M., Demirdjian, R., DeHaan, L., Weihs, R., Helly, J., Reynolds, D., and Iacobellis, S.: Evaluation of atmospheric river predictions by the WRF Model using aircraft and regional mesonet observations of orographic precipitation and its forcing, J. Hydrometeorol., 19, 1097–1113, 2018. a, b
Mattingly, K. S., Mote, T. L., Fettweis, X., van As, D., Van Tricht, K., Lhermitte, S., Pettersen, C., and Fausto, R. S.: Strong summer atmospheric rivers trigger Greenland Ice Sheet melt through spatially varying surface energy balance and cloud regimes, J. Climate, 33, 6809–6832, 2020. a
Maturilli, M.: High resolution radiosonde measurements from station Ny-Ålesund (2017-06), Alfred Wegener Institute – Research Unit Potsdam, PANGAEA [data set], https://doi.org/10.1594/PANGAEA.879822, 2017. a, b
Maturilli, M.: Basic and other measurements of radiation at station Ny-Ålesund (2017-06), Alfred Wegener Institute – Research Unit Potsdam, PANGAEA [data set], https://doi.org/10.1594/PANGAEA.887502, 2018. a, b
Mayer, M., Tietsche, S., Haimberger, L., Tsubouchi, T., Mayer, J., and Zuo, H.: An Improved Estimate of the Coupled Arctic Energy Budget, J. Climate, 32, 7915–7934, https://doi.org/10.1175/JCLI-D-19-0233.1, 2019. a
Mech, M., Maahn, M., Ori, D., and Orlandi, E.: PAMTRA: Passive and Active Microwave TRAnsfer tool v1.0 (v1.0.0), Zenodo [code], https://doi.org/10.5281/zenodo.3582992, 2019. a
Mech, M., Maahn, M., Kneifel, S., Ori, D., Orlandi, E., Kollias, P., Schemann, V., and Crewell, S.: PAMTRA 1.0: the Passive and Active Microwave radiative TRAnsfer tool for simulating radiometer and radar measurements of the cloudy atmosphere, Geosci. Model Dev., 13, 4229–4251, https://doi.org/10.5194/gmd-13-4229-2020, 2020. a, b, c
Mie, G.: Beiträge zur Optik trüber Medien, speziell kolloidaler Metallösungen, Ann. Phys.-Berlin, 330, 377–445, https://doi.org/10.1002/andp.19083300302, 1908. a
Mironov, D., Ritter, B., Schulz, J.-P., Buchhold, M., Lange, M., and MacHulskaya, E.: Parameterisation of sea and lake ice in numerical weather prediction models of the German Weather Service, Tellus A, 64, 17330, https://doi.org/10.3402/tellusa.v64i0.17330, 2012. a
Mlawer, E. J., Taubman, S. J., Brown, P. D., Iacono, M. J., and Clough, S. A.: Radiative transfer for inhomogeneous atmospheres: RRTM, a validated correlated-k model for the longwave, J. Geophys. Res.-Atmos., 102, 16663–16682, https://doi.org/10.1029/97JD00237, 1997. a
Moore, G., Renfrew, I., Harden, B., and Mernild, S.: The impact of resolution on the representation of southeast Greenland barrier winds and katabatic flows, Geophys. Res. Lett., 42, 3011–3018, 2015. a
Naakka, T., Nygård, T., and Vihma, T.: Arctic humidity inversions: Climatology and processes, J. Climate, 31, 3765–3787, 2018. a, b
Nash, D., Waliser, D., Guan, B., Ye, H., and Ralph, F. M.: The Role of Atmospheric Rivers in Extratropical and Polar Hydroclimate, J. Geophys. Res.-Atmos., 123, 6804–6821, https://doi.org/10.1029/2017JD028130, 2018. a, b, c
NOAA: MHS dataset, Comprehensive Large Array-Data Stewardship System (CLASS) Website, available at: https://www.avl.class.noaa.gov/saa/products/welcome, last access: 7 April 2021. a
Nomokonova, T., Ritter, C., and Ebell, K.: HATPRO microwave radiometer measurements at AWIPEV, Ny-Ålesund (2016–2018), PANGAEA [data set], https://doi.org/10.1594/PANGAEA.902183, 2019a. a
Nomokonova, T., Ritter, C., and Ebell, K.: Integrated water vapor of HATPRO microwave radiometer at AWIPEV, Ny-Ålesund (2017), PANGAEA [data set], https://doi.org/10.1594/PANGAEA.902142, 2019b. a
Nygård, T., Valkonen, T., and Vihma, T.: Characteristics of Arctic low-tropospheric humidity inversions based on radio soundings, Atmos. Chem. Phys., 14, 1959–1971, https://doi.org/10.5194/acp-14-1959-2014, 2014. a
Nygård, T., Graversen, R. G., Uotila, P., Naakka, T., and Vihma, T.: Strong dependence of wintertime Arctic moisture and cloud distributions on atmospheric large-scale circulation, J. Climate, 32, 8771–8790, 2019. a
Prein, A. F., Langhans, W., Fosser, G., Ferrone, A., Ban, N., Goergen, K., Keller, M., Tölle, M., Gutjahr, O., Feser, F., Brisson, E., Kollet, S., Schmidli, J., van Lipzig, N. P. M., and Leung, R.: A review on regional convection-permitting climate modeling: Demonstrations, prospects, and challenges, Rev. Geophys., 53, 323–361, 2015. a
Prigent, C., Aires, F., Wang, D., Fox, S., and Harlow, C.: Sea-surface emissivity parametrization from microwaves to millimetre waves, Q. J. Roy. Meteor. Soc., 143, 596–605, 2017. a
Prill, F., Reinert, D., Rieger, D., and Zängl, G.: Working with the ICON Model, Deutscher Wetterdienst (DWD), available at: https://www.dwd.de/EN/ourservices/nwv_icon_tutorial/pdf_volume/icon_tutorial2020_en.pdf?__blob=publicationFile&v=3, last access: 3 December 2020. a, b
Ramos, A. M., Trigo, R. M., Liberato, M. L., and Tomé, R.: Daily precipitation extreme events in the Iberian Peninsula and its association with atmospheric rivers, J. Hydrometeorol., 16, 579–597, https://doi.org/10.1175/JHM-D-14-0103.1, 2015. a, b
Rosenkranz, P. W.: A model for the complex dielectric constant of supercooled liquid water at microwave frequencies, IEEE T. Geosci. Remote, 53, 1387–1393, https://doi.org/10.1109/TGRS.2014.2339015, 2015. a
Rutz, J. J., Shields, C. A., Lora, J. M., Payne, A. E., Guan, B., Ullrich, P., O'Brien, T., Leung, L. R., Ralph, F. M., Wehner, M., Brands, S., Collow, A., Goldenson, N., Gorodetskaya, I., Griffith, H., Kashinath, K., Kawzenuk, B., Krishnan, H., Kurlin, V., Lavers, D., Magnusdottir, G., Mahoney, K., McClenny, E., Muszynski, G., Nguyen, P. D., Prabhat, Mr., Qian, Y., Ramos, A. M., Sarangi, C., Sellars, S., Shulgina, T., Tome, R., Waliser, D., Walton, D., Wick, G., Wilson, A. M., and Viale, M.: The atmospheric river tracking method intercomparison project (ARTMIP): quantifying uncertainties in atmospheric river climatology, J. Geophys. Res.-Atmos., 124, 13777–13802, 2019. a
Rydsaa, J. H., Graversen, R., Heiskanen, T. I. H., and Stoll, P.: Changes in atmospheric latent energy transport into the Arctic: Planetary versus synoptic scales, Q. J. Roy. Meteorol. Soc., 147, 2281–2292, https://doi.org/10.1002/qj.4022, 2021. a
Screen, J. A. and Simmonds, I.: The central role of diminishing sea ice in recent Arctic temperature amplification, Nature, 464, 1334–1337, https://doi.org/10.1038/nature09051, 2010. a
Sedlar, J.: Implications of limited liquid water path on static mixing within Arctic low-level clouds, J. Appl. Meteorol. Clim., 53, 2775–2789, 2014. a
Sedlar, J., Tjernström, M., Rinke, A., Orr, A., Cassano, J., Fettweis, X., Heinemann, G., Seefeldt, M., Solomon, A., Matthes, H., Phillips, T., and Webster, S.: Confronting Arctic troposphere, clouds, and surface energy budget representations in regional climate models with observations, J. Geophys. Res.-Atmos., 125, e2019JD031783, https://doi.org/10.1029/2019JD031783, 2020. a
Seifert, A.: A revised cloud microphysical parameterization for COSMO-LME, COSMO Newsletter, 7, 25–28, 2008. a
Serreze, M. C. and Barry, R. G.: Processes and impacts of Arctic amplification: A research synthesis, Glob. Planet. Change, 77, 85–96, https://doi.org/10.1016/j.gloplacha.2011.03.004, 2011. a
Serreze, M. C., Barrett, A. P., Stroeve, J. C., Kindig, D. N., and Holland, M. M.: The emergence of surface-based Arctic amplification, The Cryosphere, 3, 11–19, https://doi.org/10.5194/tc-3-11-2009, 2009. a
Steinke, S., Eikenberg, S., Löhnert, U., Dick, G., Klocke, D., Di Girolamo, P., and Crewell, S.: Assessment of small-scale integrated water vapour variability during HOPE, Atmos. Chem. Phys., 15, 2675–2692, https://doi.org/10.5194/acp-15-2675-2015, 2015. a, b
Terpstra, A., Gorodetskaya, I. V., and Sodemann, H.: Linking sub-tropical evaporation and extreme precipitation over East Antarctica: an atmospheric river case study, J. Geophys. Res.-Atmos., 126, e2020JD033617, https://doi.org/10.1029/2020JD033617, 2021. a, b, c
Tiedtke, M.: A comprehensive mass flux scheme for cumulus parameterization in large-scale models, Mon. Weather Rev., 117, 1779–1800, 1989. a
Vázquez, M., Algarra, I., Eiras-Barca, J., Ramos, A. M., Nieto, R., and Gimeno, L.: Atmospheric rivers over the Arctic: Lagrangian characterisation of their moisture sources, Water, 11, 1–14, https://doi.org/10.3390/w11010041, 2018. a
Viceto, C., Gorodetskaya, I. V., Rinke, A., Maturilli, M., Rocha, A., and Crewell, S.: Atmospheric rivers and associated precipitation patterns during the ACLOUD/PASCAL campaigns near Svalbard (May–June 2017): case studies using observations, reanalyses, and a regional climate model, Atmos. Chem. Phys. Discuss. [preprint], https://doi.org/10.5194/acp-2021-609, in review, 2021. a, b
Vihma, T., Pirazzini, R., Fer, I., Renfrew, I. A., Sedlar, J., Tjernström, M., Lüpkes, C., Nygård, T., Notz, D., Weiss, J., Marsan, D., Cheng, B., Birnbaum, G., Gerland, S., Chechin, D., and Gascard, J. C.: Advances in understanding and parameterization of small-scale physical processes in the marine Arctic climate system: a review, Atmos. Chem. Phys., 14, 9403–9450, https://doi.org/10.5194/acp-14-9403-2014, 2014. a
Wendisch, M., Brückner, M., Burrows, J. P., Crewell, S., Dethloff, K., Ebell, K., Lüpkes, C., Macke, A., Notholt, J., Quaas, J., Rinke, A., and Tegen, I.: Understanding causes and effects of rapid warming in the Arctic, Eos, 98, https://doi.org/10.1029/2017EO064803, 2017. a
Wendisch, M., Macke, A., Ehrlich, A., Lüpkes, C., Mech, M., Chechin, D., Dethloff, K., Velasco, C. B., Bozem, H., Brückner, M., Clemen, H., Crewell, S., Donth, T., Dupuy, R., Ebell, K., Egerer, U., Engelmann, R., Engler, C., Eppers, O., Gehrmann, M., Gong, X., Gottschalk, M., Gourbeyre, C., Griesche, H., Hartmann, J., Hartmann, M., Heinold, B., Herber, A., Herrmann, H., Heygster, G., Hoor, P., Jafariserajehlou, S., Jäkel, E., Järvinen, E., Jourdan, O., Kästner, U., Kecorius, S., Knudsen, E. M., Köllner, F., Kretzschmar, J., Lelli, L., Leroy, D., Maturilli, M., Mei, L., Mertes, S., Mioche, G., Neuber, R., Nicolaus, M., Nomokonova, T., Notholt, J., Palm, M., van Pinxteren, M., Quaas, J., Richter, P., Ruiz-Donoso, E., Schäfer, M., Schmieder, K., Schnaiter, M., Schneider, J., Schwarzenböck, A., Seifert, P., Shupe, M. D., Siebert, H., Spreen, G., Stapf, J., Stratmann, F., Vogl, T., Welti, A., Wex, H., Wiedensohler, A., Zanatta, M., and Zeppenfeld, S.: The Arctic cloud puzzle: Using ACLOUD/PASCAL multiplatform observations to unravel the role of clouds and aerosol particles in arctic amplification, B. Am. Meteorol. Soc., 100, 841–871, 2019. a
Whan, K., Sillmann, J., Schaller, N., and Haarsma, R.: Future changes in atmospheric rivers and extreme precipitation in Norway, Clim. Dynam., 54, 2071–2084, 2020. a
Wille, J. D., Favier, V., Dufour, A., Gorodetskaya, I. V., Turner, J., Agosta, C., and Codron, F.: West Antarctic surface melt triggered by atmospheric rivers, Nat. Geosci., 12, 911–916, 2019. a, b, c, d, e, f, g, h
Woods, C. and Caballero, R.: The role of moist intrusions in winter Arctic warming and sea ice decline, J. Climate, 29, 4473–4485, 2016. a
Woods, C., Caballero, R., and Svensson, G.: Large-scale circulation associated with moisture intrusions into the Arctic during winter, Geophys. Res. Lett., 40, 4717–4721, 2013. a
Woods, C., Caballero, R., and Svensson, G.: Representation of Arctic moist intrusions in CMIP5 models and implications for winter climate biases, J. Climate, 30, 4083–4102, 2017. a
Zängl, G., Reinert, D., Rípodas, P., and Baldauf, M.: The ICON (ICOsahedral Non-hydrostatic) modelling framework of DWD and MPI-M: Description of the non-hydrostatic dynamical core, Q. J. Roy. Meteor. Soc., 141, 563–579, 2015. a, b