the Creative Commons Attribution 4.0 License.
the Creative Commons Attribution 4.0 License.
 | 03 Feb 2022
Simulation of the effects of low-volatility organic compounds on aerosol number concentrations in Europe
David Patoulias
Spyros N. Pandis
PMCAMx-UF, a three-dimensional chemical transport model focusing on the simulation of the ultrafine particle size distribution and composition has been extended with the addition of reactions of chemical aging of semivolatile anthropogenic organic vapors, the emissions and chemical aging of intermediate-volatility organic compounds (IVOCs), and the production of extremely low-volatility organic compounds (ELVOCs) by monoterpenes. The model is applied in Europe to quantify the effect of these processes on particle number concentrations. The model predictions are evaluated against both ground measurements collected during the PEGASOS 2012 summer campaign across many stations in Europe and airborne observations by a zeppelin measuring above Po Valley, Italy. PMCAMx-UF reproduces the ground level daily average concentrations of particles with a diameter larger than 100 nm (N100) with normalized mean error (NME) of 45 % and normalized mean bias (NMB) close to 10 %. For the same simulation, PMCAMx-UF tends to overestimate the concentration of particles with a diameter larger than 10 nm (N10) with a daily NMB of 23 % and a daily NME of 63 %. The model was able to reproduce more than 75 % of the N10 and N100 airborne observations (zeppelin) within a factor of 2.
According to the PMCAMx-UF predictions, the ELVOC production by monoterpenes leads to surprisingly small changes of the average number concentrations over Europe. The total number concentration decreased due to the ELVOC formation by 0.2 %, N10 decreased by 1.1 %, N50 (particles with a diameter larger than 50 nm) increased by 3 %, and N100 increased by 4 % due to this new secondary organic aerosol (SOA) source. This small change is due to the nonlinearity of the system, with increases predicted in some areas and decreases in others, but also the cancelation of the effects of the various processes like accelerated growth and accelerated coagulation. Locally, the effects can be significant. For example, an increase in N100 by 20 %–50 % is predicted over Scandinavia and significant increases (10 %–20 %) are predicted over some parts of central Europe. The ELVOCs contributed on average around 0.5 µg m−3 and accounted for 10 %–15 % of the PM2.5 OA. The addition of IVOC emissions and their aging reactions led to a surprising reduction of the total number of particles (Ntot) and N10 by 10 %–15 % and 5 %–10 %, respectively, and to an increase in the concentration of N100 by 5 %–10 %. These were due to the accelerated coagulation and reduced nucleation rates.
- Article
(13082 KB) - Full-text XML
-
Supplement
(1600 KB) - BibTeX
- EndNote


Two major processes are responsible for the introduction of new particles in the atmosphere: direct emission from numerous sources and nucleation from low-volatility vapors. New particles formed by nucleation can either grow by condensation of vapors (e.g., sulfuric acid, ammonia, nitric acid, and organics) to larger sizes, becoming cloud condensation nuclei (CCN) and thereby increasing the cloud droplet number concentration (CDNC), or can coagulate with pre-existing larger particles and be lost (Adams and Seinfeld, 2002). Globally, according to large-scale model simulations, atmospheric new particle formation (NPF) and subsequent particle growth represent the most significant sources of atmospheric aerosol particles, at least in terms of their total number concentration (Kulmala et al., 2004; Makkonen et al., 2009; Merikanto et al., 2009; Pierce and Adams, 2009; Wang and Penner, 2009; Yu and Luo, 2009). An increase in the number concentration of particles that may act as CCN results in higher CDNC and brighter clouds with longer lifetimes.
Globally, organic particulate matter makes up more than 50 % of the sub-micrometer mass concentration of ambient aerosols in locations throughout the world (Kanakidou et al., 2005; Seinfeld and Pandis, 2006; Zhang et al., 2007). Nearly 70 % of this material is thought to be secondary organic aerosol (SOA) formed from the oxidation of volatile organic compounds (VOCs) (Hallquist et al., 2009; Schulze et al., 2017). Many of the relevant precursor VOCs are biogenic in origin, such as monoterpenes (C10H16) and isoprene (C5H8).
Several recent field studies have shown that SOA in polluted areas cannot be explained by the simulation of only the first generation of reactions of “traditional” SOA precursors: biogenic compounds (monoterpenes, sesquiterpenes, and isoprene) and anthropogenic compounds (aromatics, olefins, and large alkanes) (de Gouw et al., 2005; Volkamer et al., 2006; Kleinman et al., 2008; Docherty et al., 2008; Matsui et al., 2009; Dzepina et al., 2009). At the same time, it has become clear that organic vapors are responsible for most of the new particle growth in environments with low sulfur dioxide levels (Olenius et al., 2018; Yli-Juuti et al., 2020).
Traditional treatment of SOA formation considers only VOCs as the precursors and only semivolatile products (Odum et al., 1996). Robinson et al. (2007) suggested that intermediate-volatility organic compounds (IVOCs) either emitted directly or resulting from the evaporation of particles may be an important and previously neglected pool of precursors for SOA formation. In addition, later generations of reactions of the products of VOCs, IVOCs, and semivolatile organic compounds (SVOCs) can lead to products of even lower volatility and formation of SOA (Donahue et al., 2006). These chemical reactions can lead to continued SOA production after complete precursor consumption as products undergo further oxidation (Kroll et al., 2006; Ng et al., 2006).
Secondary extremely low-volatility organic compounds (ELVOCs) have been detected in both the ambient atmosphere and laboratory studies (Donahue et al., 2011). These compounds promote new particle growth and CCN production in the atmosphere (Jokinen et al., 2015; Kirkby et al., 2016). ELVOCs can be produced rapidly in the gas phase during monoterpene oxidation (Ehn et al., 2014) and can enhance atmospheric new particle formation and growth (Jokinen et al., 2015). Due to their exceptionally low volatility, ELVOCs condense essentially irreversibly onto growing particles at a rate controlled by the Fuchs-adjusted particle surface area (Shrivastava et al., 2017). The production of ELVOCs can increase the effective biogenic SOA yields, becoming an additional source of SOA, especially significant at low OA levels. At the same time, the addition of this extra material results in a change in the volatility distribution of the predicted SOA.
Fanourgakis et al. (2019) evaluated 16 global chemistry transport models during a 4-year period and compared their prediction to the near-surface observed number concentration of aerosol particles across Europe and Japan. All models tended to underestimate the number concentrations of particles with a diameter larger than 50 nm (N50). The normalized mean bias (NMB) was −51 %, and normalized mean error (NME) was 55 % for all stations. Sengupta et al. (2021) used the GLOMAP (Global Model of Aerosol Processes; Spracklen et al., 2005) modal aerosol microphysics model (Mann et al., 2010) simulating the production of six surrogate SOA species from the oxidation of anthropogenic VOCs, monoterpenes, and isoprene. It was assumed that ELVOCs derive only from biogenic sources and can nucleate to form new particles (Gordon et al., 2016). Different values of the ELVOC yield were used, and the model predictions were compared to observations of OA mass concentration as well as to the N3 (particles with a diameter larger than 3 nm) and N50 number concentrations. Concentrations of N3 and N50 were consistently underestimated, while the best model performance (based on the Taylor model skill score) was achieved when the ELVOC yield from precursor VOCs was around 13 %. These studies suggest that the role of organics and especially ELVOCs in particle formation and growth is still not well understood.
In this study we extend the three-dimensional regional chemical transport model (CTM), PMCAMx-UF (Jung et al., 2010), with detailed aerosol microphysics (Gaydos et al., 2007; Karydis et al., 2007) that has been used and evaluated for simulations over the US and Europe (Fountoukis et al., 2012). The number concentrations of particles with a diameter larger than 10 nm (N10) and 100 nm (N100) were used for the analysis of the model predictions of Fountoukis et al. (2012), whereas Gordon et al. (2016) relied on N3 and N50. N3 and N10 are connected to some extent, but usually there are more reliable measurements available at more sites for N10. The same applies for the N50 and N100 pair, but N100 is often closer to the CCN sizes at moderate cloud supersaturations. N10 and N100 were chosen as the metrics in this study for continuity, given that they have been used in previous PMCAMx-UF evaluations.
Originally PMCAMx-UF assumed that growth of new particles was exclusively due to sulfuric acid and ammonia condensation while the semivolatile secondary organics condensed only in the accumulation mode, thus contributing to the condensation and coagulation sinks. This initial model version was found to reproduce more than 70 % of the hourly number concentrations of N10 within a factor of 2 (Fountoukis et al., 2012). However, the concentration of N100 as a proxy for the number of particles that can act as CCN was systematically underpredicted. The growth rates were also underpredicted, with smaller errors at sites where the sulfate-to-organics mass ratio was high. These problems were caused mainly by insufficient organic vapor condensation (Fountoukis et al., 2012) on ultrafine particles. Patoulias et al. (2018) developed an extended version of PMCAMx-UF in which the SOA components were modeled as semivolatile first-generation products of the oxidation of VOCs. The model predictions were compared against size distribution measurements from 16 stations in Europe during a photochemically active period. Including SOA condensation on ultrafine particles in PMCAMx-UF improved its ability to reproduce the N10 and N100 concentration at ground level. The inclusion of SOA decreased the daily normalized mean bias (NMB) of N10 from 85 % to 75 % and the daily NMB of N100 from 40 % to 20 %. However, the results suggested that there is a need for additional improvements.
The primary goal of this study is to examine the effect of IVOCs and ELVOCs on particle number concentrations in Europe. PMCAMx-UF is extended to simulate the multiple generations of IVOC gas-phase oxidation and the production of ELVOCs by monoterpenes. This extended version is used for the base case simulations in this study. The model predictions are compared with measurements from 26 sites during the intensive field campaign that took place in Europe, as part of the Pan-European-Gas-AeroSol-climate interaction Study (PEGASOS) project, from 5 June–8 July 2012. The airborne data obtained by a zeppelin measuring above Po Valley during the same campaign are also used. An analysis of the zeppelin measurement can be found in Lampilahti et al. (2021a). Additional simulations are performed neglecting certain processes (e.g., production of ELVOCs) to quantify their role in the model predictions.
PMCAMx-UF is a three-dimensional chemical transport model (CTM) that simulates the aerosol number size distribution in addition to the mass and composition size distribution (Jung et al., 2010; Fountoukis et al., 2012) and is described in detail in Patoulias et al. (2018). PMCAMx-UF is based on the framework of PMCAMx (Gaydos et al., 2007; Karydis et al., 2007), describing the processes of horizontal and vertical advection, emissions, horizontal and vertical dispersion, wet and dry deposition, aqueous and aerosol phase chemistry, and aerosol dynamics and thermodynamics.
For the simulation of aerosol microphysics, PMCAMx-UF uses the updated version of DMANx, which simulates the processes of coagulation, condensation/evaporation, and nucleation (Patoulias et al., 2015) with the two-moment aerosol sectional (TOMAS) algorithm (Adams and Seinfeld, 2002; Jung et al., 2006). A key feature of TOMAS is its ability to independently track two moments of the aerosol size distribution for each size bin: the aerosol number and mass concentration.
The aerosol size distribution is discretized into 41 sections covering the diameter range from approximately 0.8 nm to 10 µm. The lowest boundary is at 3.75 × 10⁻²⁵ kg of dry aerosol mass per particle. Each successive boundary has twice the mass of the previous one. The particle components modeled include sulfate, ammonium, nitrate, sodium, chloride, crustal material, water, elemental carbon, primary organic aerosol (POA), and eight surrogate SOA components.
In this work, the nucleation rate is calculated using a scaled ternary parameterization based on the original expressions of Napari et al. (2002) with a scaling factor of 10−6 following the suggestions of Fountoukis et al. (2012). The binary parameterization of Vehkamäki et al. (2002) is employed if the NH3 concentration is below a threshold value of 0.01 ppt.
Coagulation of particles in the atmosphere is an important sink of aerosol number but is also a mechanism by which freshly nucleated particles grow to larger sizes. Following Adams and Seinfeld (2002), TOMAS assumes that the aerosol particles coagulate via Brownian diffusion and that the effects of gravitational settling and turbulence on coagulation are negligible. The calculation of the coagulation coefficients is based on the wet diameters of the particles. These wet diameters are calculated following the approach of Gaydos et al. (2005). For small particles (<100 nm), we use the expression of Dahneke et al. (1983) to correct for non-continuum effects. The coagulation algorithm uses an adaptive time step. The time step is limited so that the aerosol number or mass concentration in any size category does not increase by more than an order of magnitude or decrease by more than 25 % in each step.
The extended SAPRC (Statewide Air Pollution Research Center) chemical mechanism (Carter, 2000; Environ, 2003), which includes 219 reactions of 64 gases and 18 free radicals, is used for the gas phase chemistry mechanism in PMCAMx-UF. The SAPRC version used for this work includes five lumped alkanes (ALK1–5), two lumped olefins (OLE1 and OLE2), two lumped aromatics (ARO1 and ARO2), isoprene (ISOP), a lumped monoterpene (TERP), and a lumped sesquiterpene species (SESQ).
Condensation of gas-phase species to existing aerosol particles is an important source of aerosol mass and a means by which small particles grow to CCN sizes. Sulfuric acid is assumed to be in pseudo-steady state in PMCAMx-UF. This pseudo-steady-state approximation (PSSA) for sulfuric acid proposed by Pierce and Adams (2009) increases the computational speed with a small loss in accuracy. Jung et al. (2010) evaluated the performance of PSSA for sulfuric acid in DMAN against a fourth-order Runge–Kutta algorithm and showed that PSSA was accurate and computationally efficient. Condensation of ammonia is simulated following the approach described by Jung et al. (2006). Ammonia condensation on the ultrafine particles ends when sulfate is fully neutralized to ammonium sulfate.
Nitric and hydrochloric acids partition to particles (as nitrate and chloride, respectively) in the accumulation mode range in PMCAMx-UF, assuming that the system is always in equilibrium. The amounts of nitric acid and hydrochloric acid transferred at each time step between the gas and aerosol phases are determined by applying the aerosol thermodynamic model ISORROPIA (Nenes et al., 1998). This amount is then distributed over the aerosol size sections by using weighting factors based on their effective surface area (Pandis et al., 1993).
PMCAMx-UF assumes that organics and inorganics are in different phases in the same particles. Therefore, the condensation of one affects the size distribution of the particles and therefore the condensation rate of the other. The inorganic aerosol thermodynamics including the sulfate–bisulfate split and the water uptake by all inorganic aerosol components are simulated by ISORROPIA. The water content of the organic aerosol is neglected in this version of PMCAMx-UF, and the aerosol water is dominated by the inorganic aerosol components. Additional information can be found in previous publications describing the evolution of PMCAMx-UF (Jung et al., 2010; Fountoukis et al., 2012; Patoulias et al., 2018).
2.1 Secondary organic aerosol formation
Gas-phase oxidation of VOCs produces semivolatile and low-volatility products that can then condense to the particle phase. The volatility-basis set (VBS) framework used in PMCAMx-UF (Donahue et al., 2006) describes the volatility distribution of the OA compounds. SOA is formed from anthropogenic (aSOA) and biogenic (bSOA) precursors. Each of these types is simulated with five volatility bins with saturation concentrations of 10−5, 1, 10, 100, and 1000 µg m−3. The 10−5 µg m−3 bin was added in this work to describe the ELVOCs. We assumed an average molecular weight of 200 g mol−1 for SOA and an effective enthalpy of vaporization of 30 kJ mol−1 (Pathak et al., 2007; Stanier et al., 2007). The SOA yields used in this version of PMCAMx-UF for the semivolatile components are the NOx-dependent stoichiometric yields of Murphy and Pandis (2009).
Chemical reactions that change the volatility of the organics in the gas phase will change the OA mass by influencing their partitioning. In PMCAMx-UF all secondary species are treated as chemically reactive. Further gas-phase oxidation of OA vapors (chemical aging) is modeled using a second-order reaction with hydroxyl radicals and a rate constant equal to (Atkinson and Arey, 2003). Each reaction is assumed to reduce the volatility of the vapor material by 1 order of magnitude (i.e., shifting material from a C∗ of 100 to 10 µg m−3), with a small increase in mass (7.5 %) to account for the added oxygen (Lane et al., 2008; Shrivastava et al., 2008). IVOCs were not included in the original emission inventory and therefore have been added to the emissions. The IVOC emission rate is estimated based on the non-volatile POA emissions included in the inventory and is assumed to be 1.5 times the non-volatile POA emissions. IVOCs are distributed in the 103, 104, 105, and 106 µg m−3 saturation concentration bins, and their emission rates are assumed to be equal to 0.3, 0.4, 0.5, and 0.8 times the original non-volatile POA emission rate, for the 103–106 bins, respectively (Robinson et al., 2007).
ELVOCs were assumed to be produced by the oxidation of monoterpenes with a molar yield of 5 %. For comparison, ELVOC yields for the α-pinene ozonolysis in Jokinen et al. (2015) were 3.4 ± 1.7 %, 7 ± 4 % in Ehn et al. (2014), and 4.5 ± 3.8 % in Rissanen et al. (2014). An average molecular weight of 200 g mol−1 for ELVOCs was assumed in this work.
The partitioning of OA between the gas and particulate phases is simulated dynamically in PMCAMx-UF without assuming equilibrium (Patoulias et al., 2015). The driving force for condensation of a vapor to an aerosol particle is the difference between its ambient vapor partial pressure and the equilibrium vapor pressure over the particles, with the latter including the Kelvin effect, which is due to the curvature of the particles. The Kelvin effect is larger for the smaller particles and acts as a barrier for the condensation of organic vapors on these particles. In this simulation a surface tension of σ = 0.025 N m−1 is assumed for all SOA components (Pierce et al., 2011; Patoulias et al., 2015).
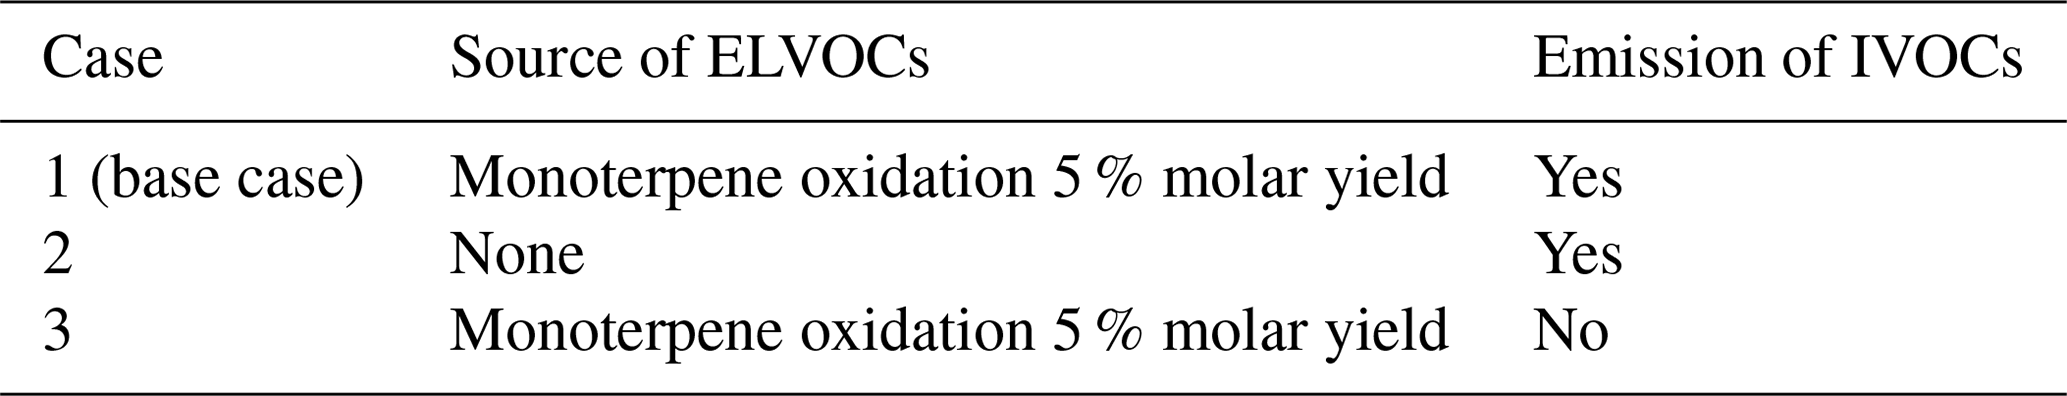
Three different chemical schemes are used in this work (Table 1). The first scheme (case 1 or base case) includes (i) the aging of SOA components from anthropogenic sources, using a rate constant k (298 K) (anthropogenic SOA aging), (ii) the aging of IVOCs using a rate constant k (298 K) , and (iii) production of ELVOCs with saturation concentration of 10−5 µg m−3 from the oxidation of monoterpenes with a yield of 5 %. The aSOA aging rate constant is based on OH oxidation of the products of aromatic VOC oxidation (Atkinson, 2000, 2003). No biogenic SOA aging was simulated in this case, an assumption based on laboratory studies (Presto et al., 2006; Ng et al., 2006) and the results of Lane et al. (2008). In the second simulation (case 2), the ELVOC yield was set to zero, thus neglecting their formation. The rest of the parameters were the same as in the base case. Finally, in the third simulation the emissions of IVOCs and the chemical aging reactions of all VOCs were neglected while the production of the ELVOCs was simulated similarly to the base case.
2.2 Model application and measurements
The PMCAMx-UF modeling domain in this application covers a 5400 km × 5832 km region in Europe, with a 36 km × 36 km grid resolution and 14 vertical layers extending up to approximately 7.2 km. The modeling period covers 34 d, from 5 June to 8 July 2012, corresponding to the PEGASOS 2012 intensive period. PMCAMx-UF was set to perform simulations on a rotated polar stereographic map projection. The first 2 d of each simulation were excluded from the analysis to minimize the effect of the initial conditions on the results. For the boundary conditions, constant and relatively low values have been used (Table S1 in the Supplement) so that the predicted particle number concentrations over central Europe are determined for all practical purposes by the emissions and corresponding processes simulated by the model. The boundary conditions are identical to those used in Patoulias et al. (2018). The effect of these boundary conditions on the predicted number concentrations is discussed in Patoulias et al. (2018).
Meteorological inputs to PMCAMx-UF include horizontal wind components, vertical diffusivity, temperature, pressure, water vapor, clouds, and rainfall. The Weather Research and Forecasting (WRF) model (Skamarock et al., 2005) was used to generate the above inputs. WRF was driven by geographical and dynamic meteorological data generated by the Global Forecast System (GFSv15) of the National Oceanic and Atmospheric Administration/National Centers for Environmental Prediction. Each layer of PMCAMx-UF was aligned with the layers used in WRF. The WRF simulation was periodically re-initialized every 3 d with observed conditions to ensure accuracy in the corresponding fields used as inputs in PMCAMx-UF. The measurements were pre-processed by the WPS (WRF Preprocessing System) package, which provides each atmospheric and static field with fidelity appropriate to the chosen grid resolution of the model. The performance of WRF for Europe against observed meteorological variables has been the topic of several studies (Jimenez-Guerrero et al., 2008; de Meij et al., 2009; Im et al., 2010; Argueso et al., 2011; Garcia-Diez et al., 2012), demonstrating good performance.
The particle emissions were based on the pan-European anthropogenic particle number emission inventory (Denier van der Gon et al., 2009; Kulmala et al., 2011) and the carbonaceous aerosol inventory (Kulmala et al., 2011) developed during the EUCAARI (European Integrated project on Aerosol, Cloud, Climate, and Air Quality Interactions) project. The resulting number/mass inventories include both number emissions and consistent size-resolved composition for particles over the size range of approximately 10 nm to 10 µm. Hourly gridded anthropogenic and biogenic emissions included both gases and primary particulate matter. The natural emissions include both particulate matter and gases and combine three different datasets: emissions from ecosystems based on the Model of Emissions of Gases and Aerosols from Nature (MEGAN; Guenther et al., 2006), marine emissions based on the model of O'Dowd et al. (2008) as sea surface covers a considerable area of the domain, and wildfire emissions (Sofiev et al., 2008a, b). MEGAN uses as inputs the plant functional type, the leaf area index, various chemical species emission factors, and weather data provided by the WRF. Wind speed fields from WRF and chlorophyll a concentrations were used as inputs of the marine aerosol model. VOCs were speciated based on the approach proposed by Visschedijk et al. (2007). Anthropogenic gas emissions included land emissions from the GEMS (global and regional Earth-system monitoring using satellite and in situ data) dataset (Visschedijk et al., 2007). The international shipping, industrial, domestic, agricultural, and traffic aerosol emission sources were included in the anthropogenic inventory (Denier van der Gon et al., 2009; Kulmala et al., 2011).
The model results were compared against measurements at 26 ground sites, which are available at the European Supersites for the Atmospheric Aerosol Research (EUSAAR) and EBAS databases (https://ebas.nilu.no, last access: 11 January 2022) and the Aerosols, Clouds and Trace gases Research Infrastructure (ACTRIS) (https://actris.nilu.no, last access: 11 January 2022). Particle size distribution measurements at all sites were made using either a differential mobility particle sizer (DMPS) or a scanning mobility particle sizer (SMPS). Information about all stations can be found in Table S2.
An intensive field campaign took place in Europe, as part of the Pan-European-Gas-AeroSol-climate interaction Study (PEGASOS) project, from 5 June–8 July 2012. Measurements of aerosol mass concentration PM1 (particulate matter particles with a diameter of less than 1 µm) from the PEGASOS project are also available for the same period for Patras (Greece), Finokalia (Greece), San Pietro Capofiume (Italy), and Bologna (Italy) (Table S3a) and filter PM2.5 (particulate matter particles with a diameter of less than 2.5 µm) measurements from six additional stations in Europe (Table S3b). The organic aerosol mass concentration was estimated from the organic carbon measurements assuming an organic mass-to-carbon ratio equal to 1.8 (Kostenidou et al., 2015).
The measurement of organic carbon and therefore the estimated OA using filters is characterized by two main artifacts: a positive one involving adsorption of organic vapors on the quartz filters used for the sampling and a negative one related to the evaporation of some of the semivolatile material (Turpin et al., 2000; Mikuška et al., 2012). There is a rich literature on the magnitude of these artifacts and on ways to minimize them or correct for them (involving denuders for removal of organic vapors and after-filters). In this work, we use the reported measurements for the model evaluation, keeping in mind their uncertainty.
The airborne measurements by the PEGASOS zeppelin were acquired during the simulation period over the Po Valley. The Po Valley region is situated between the Alps in the north and the Apennines in the south-southwest. The mountains surround the valley on three sides, and high levels of pollutants are often observed in the region due to the industrial, agricultural, and other anthropogenic emissions. In addition, emissions from ship traffic on the Adriatic Sea (Hamed et al., 2007) and long-range transport from central-eastern Europe also contribute pollutants to the region (Sogacheva et al., 2007). A SMPS was used to measure the number size distribution of particles in the size range of 10 to 430 nm. Details of the relevant PEGASOS zeppelin measurements can be found in Lampilahti et al. (2021a).
3.1 Base case
The average predicted ground level average number concentrations for the total number of particles (Ntot) and for particles with diameters above 10 nm (N10), 50 nm (N50), and 100 nm (N100) from 5 June–8 July 2012 are shown in Fig. 1. The N50 and N100 concentrations are often used as proxies for CCN number concentrations (Fountoukis et al., 2012). On a domain average basis, for the ground level the model predicted 4780 cm−3 for Ntot, 3630 cm−3 for N10, 1990 cm−3 for N50, and 820 cm−3 for N100 during the simulated period. The highest Ntot average concentrations (more than 15 000 cm−3) were predicted over Bulgaria, southern Romania, Turkey, Poland, the Netherlands, Portugal, northern Spain, the eastern UK, and Russia. On the other hand, the highest N50 and N100 are predicted over the Mediterranean, mainly in areas near southern Spain, southern Italy, and the Balkans. Ntot and N10 are high in areas of frequent nucleation events and areas with high particle number emissions, whereas the N50 and N100 levels are affected significantly by secondary particulate matter production. The high photochemical activity over the eastern Mediterranean leads to the corresponding high levels of N50 and N100 during this period.
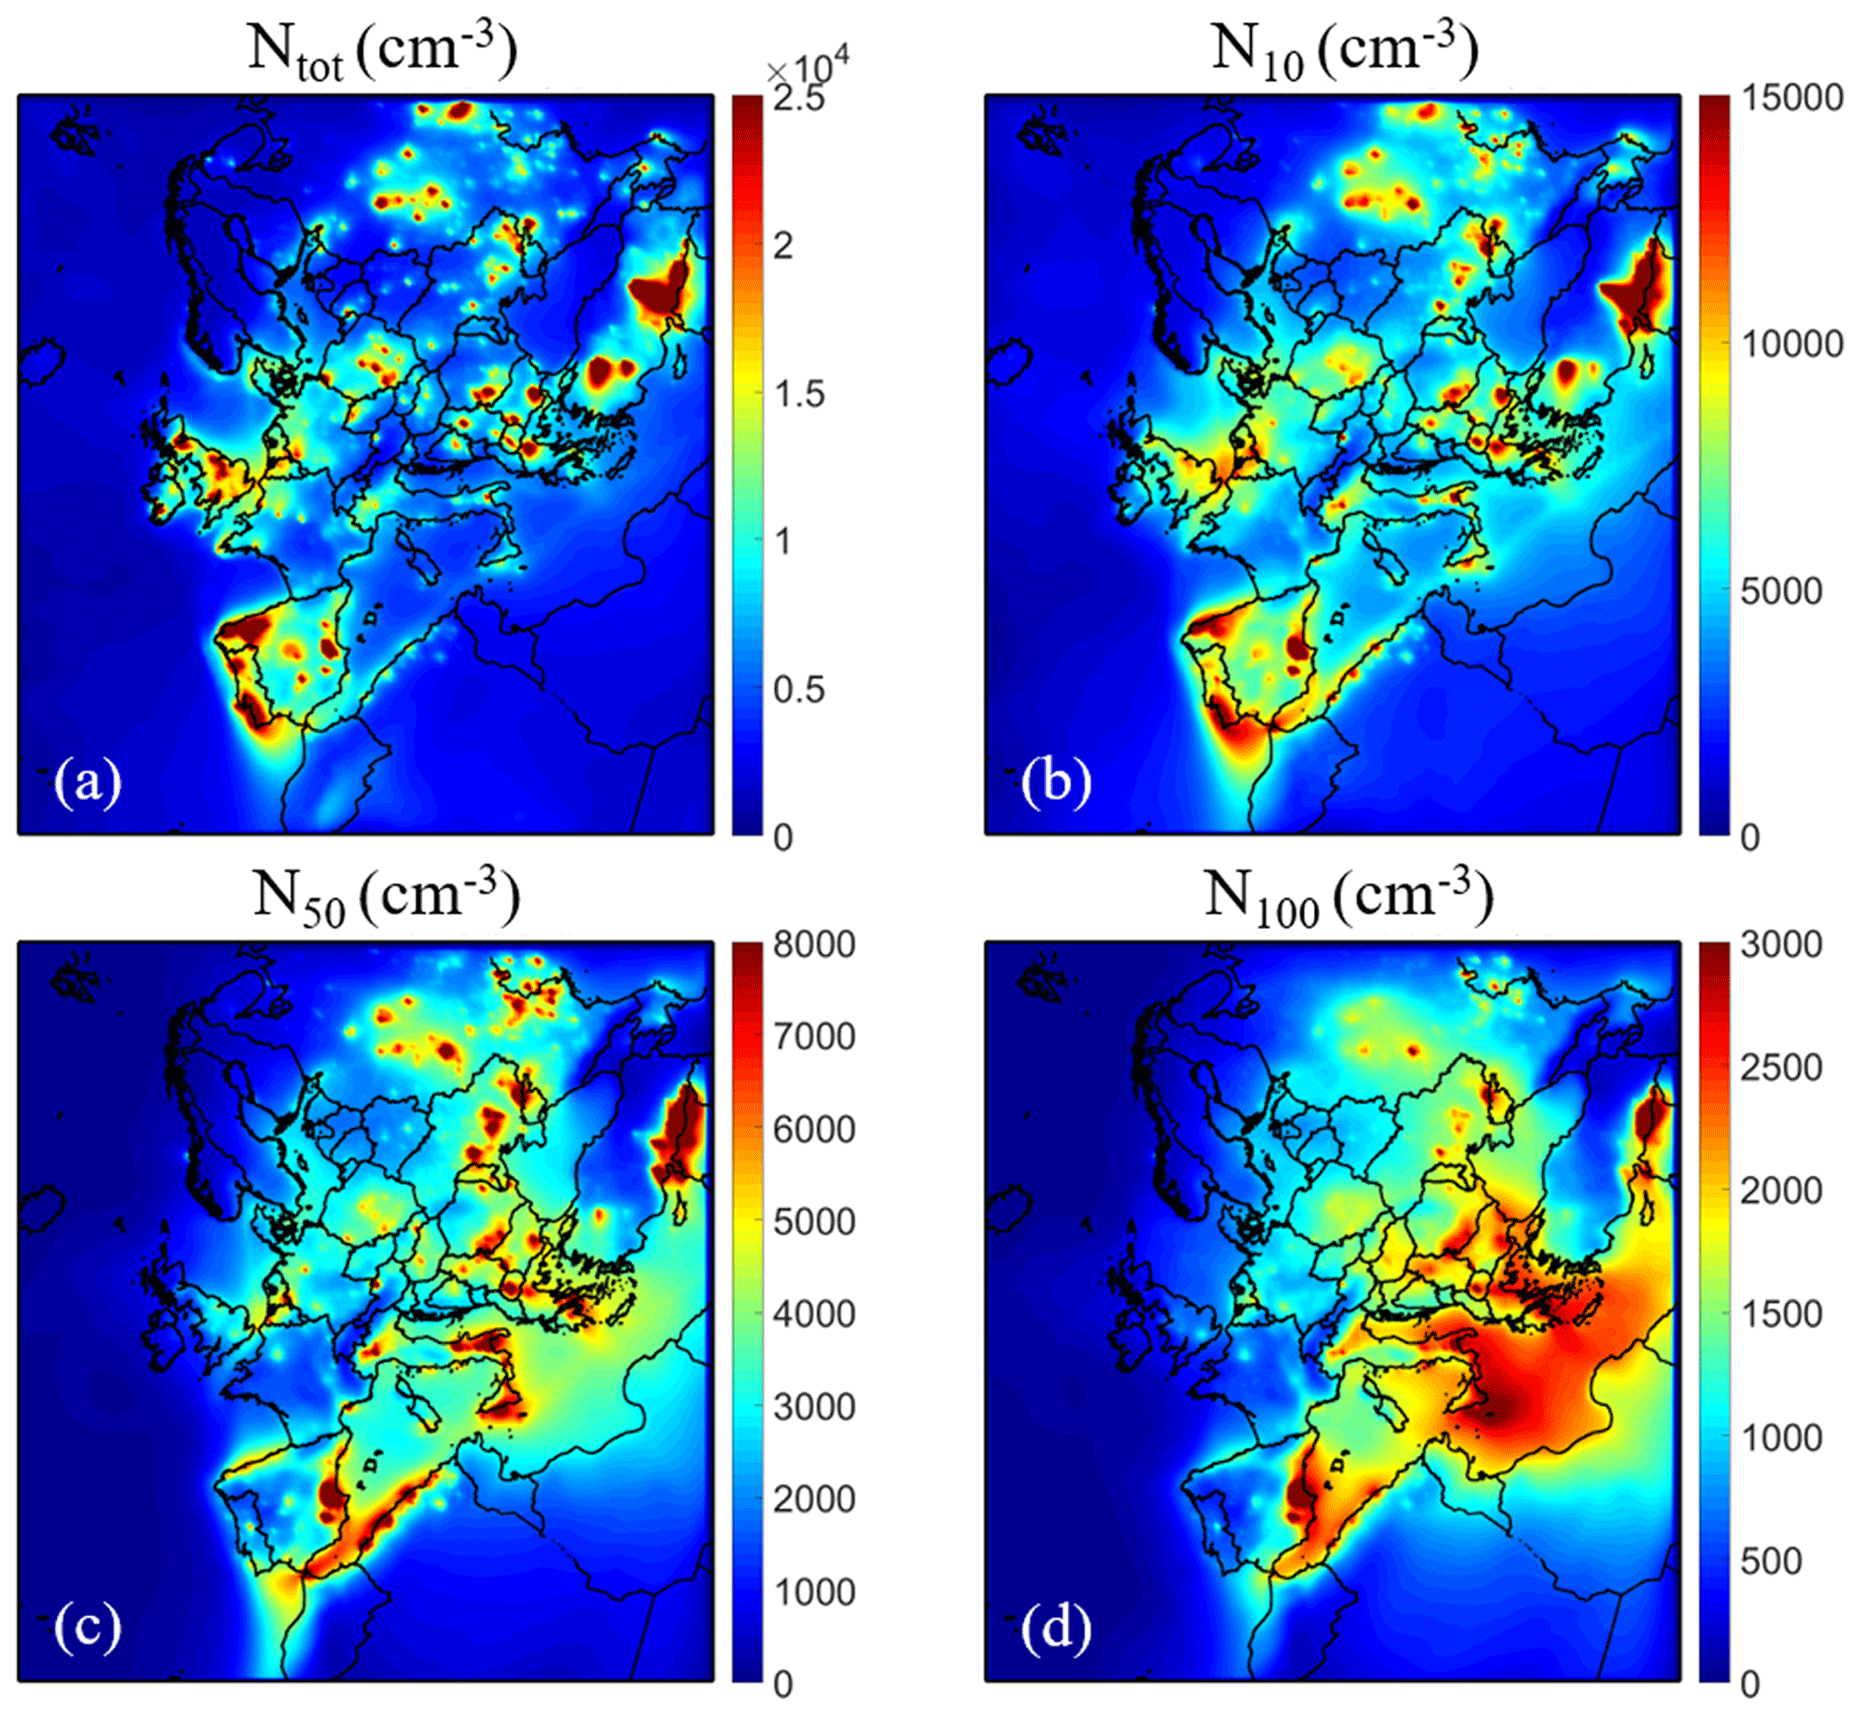
Figure 1Average ground level number concentrations (in cm−3) for the base case simulation from 5 June–8 July 2012 for (a) all particles (Ntot) and particles above (b) 10 nm (N10), (c) 50 nm (N50), and (d) 100 nm (N100). Different scales are used.
3.2 Evaluation of PMCAMx-UF predictions
3.2.1 Comparison of PMCAMx-UF predictions to ground aerosol number observations
The prediction skill metrics of PMCAMx-UF, for the daily average ground measurements from the 26 stations, are summarized in Tables 2 and 3 for both the base case and the case in which the ELVOCs are neglected.
Table 2Prediction skill metrics of PMCAMx-UF against daily ground measurements of particle number concentration above 10 nm (N10) from 5 June–8 July 2012.
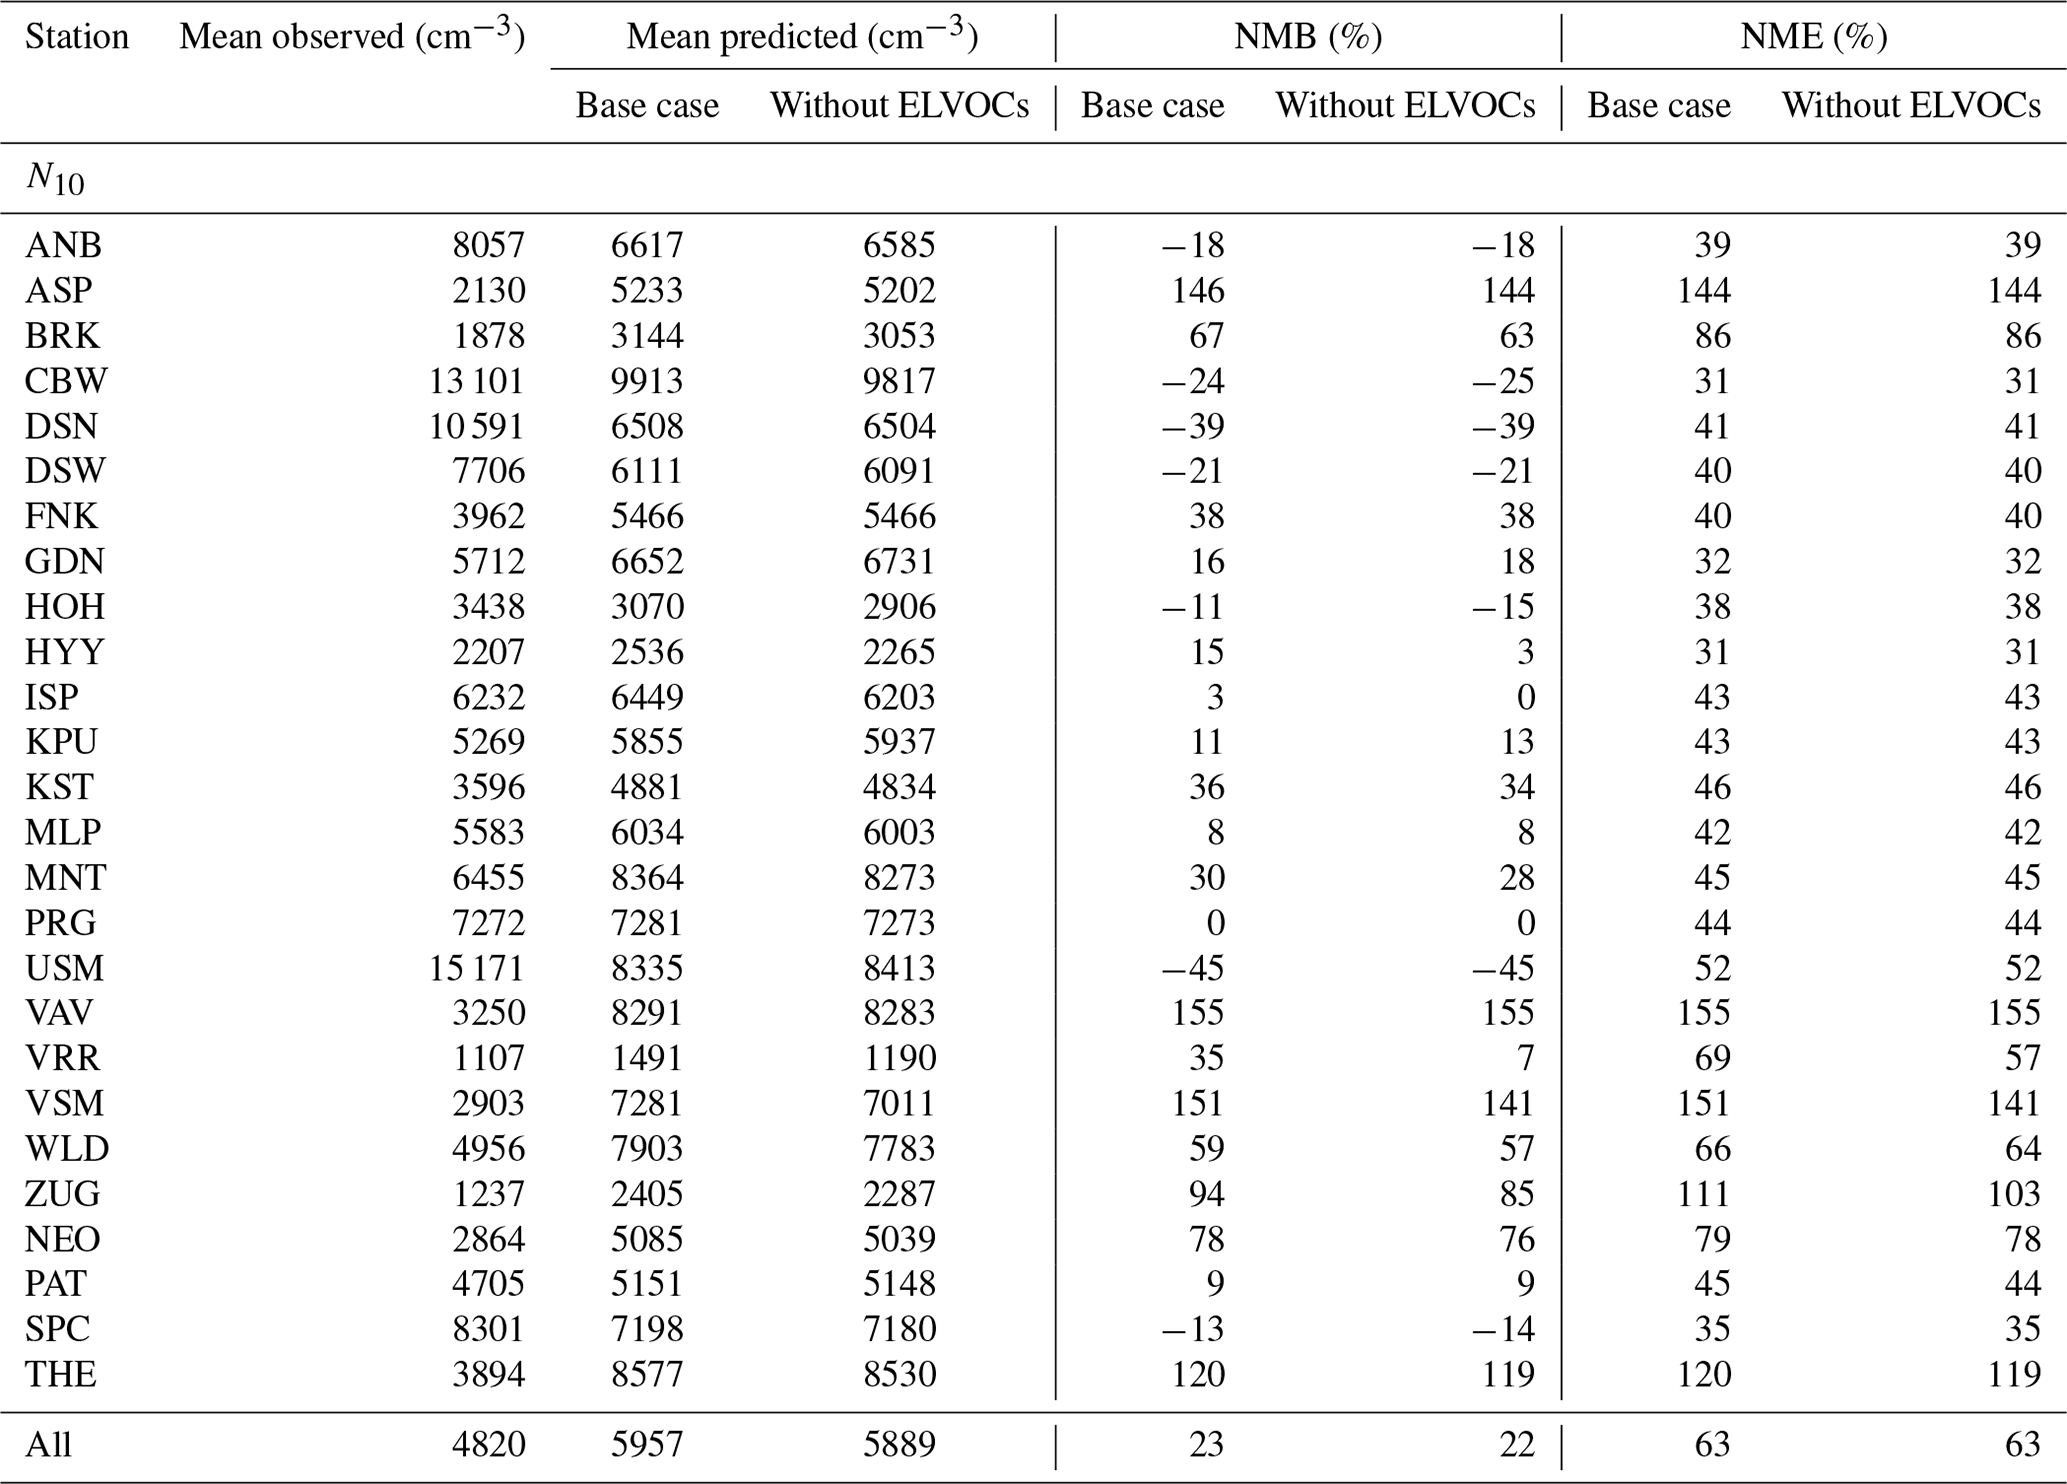
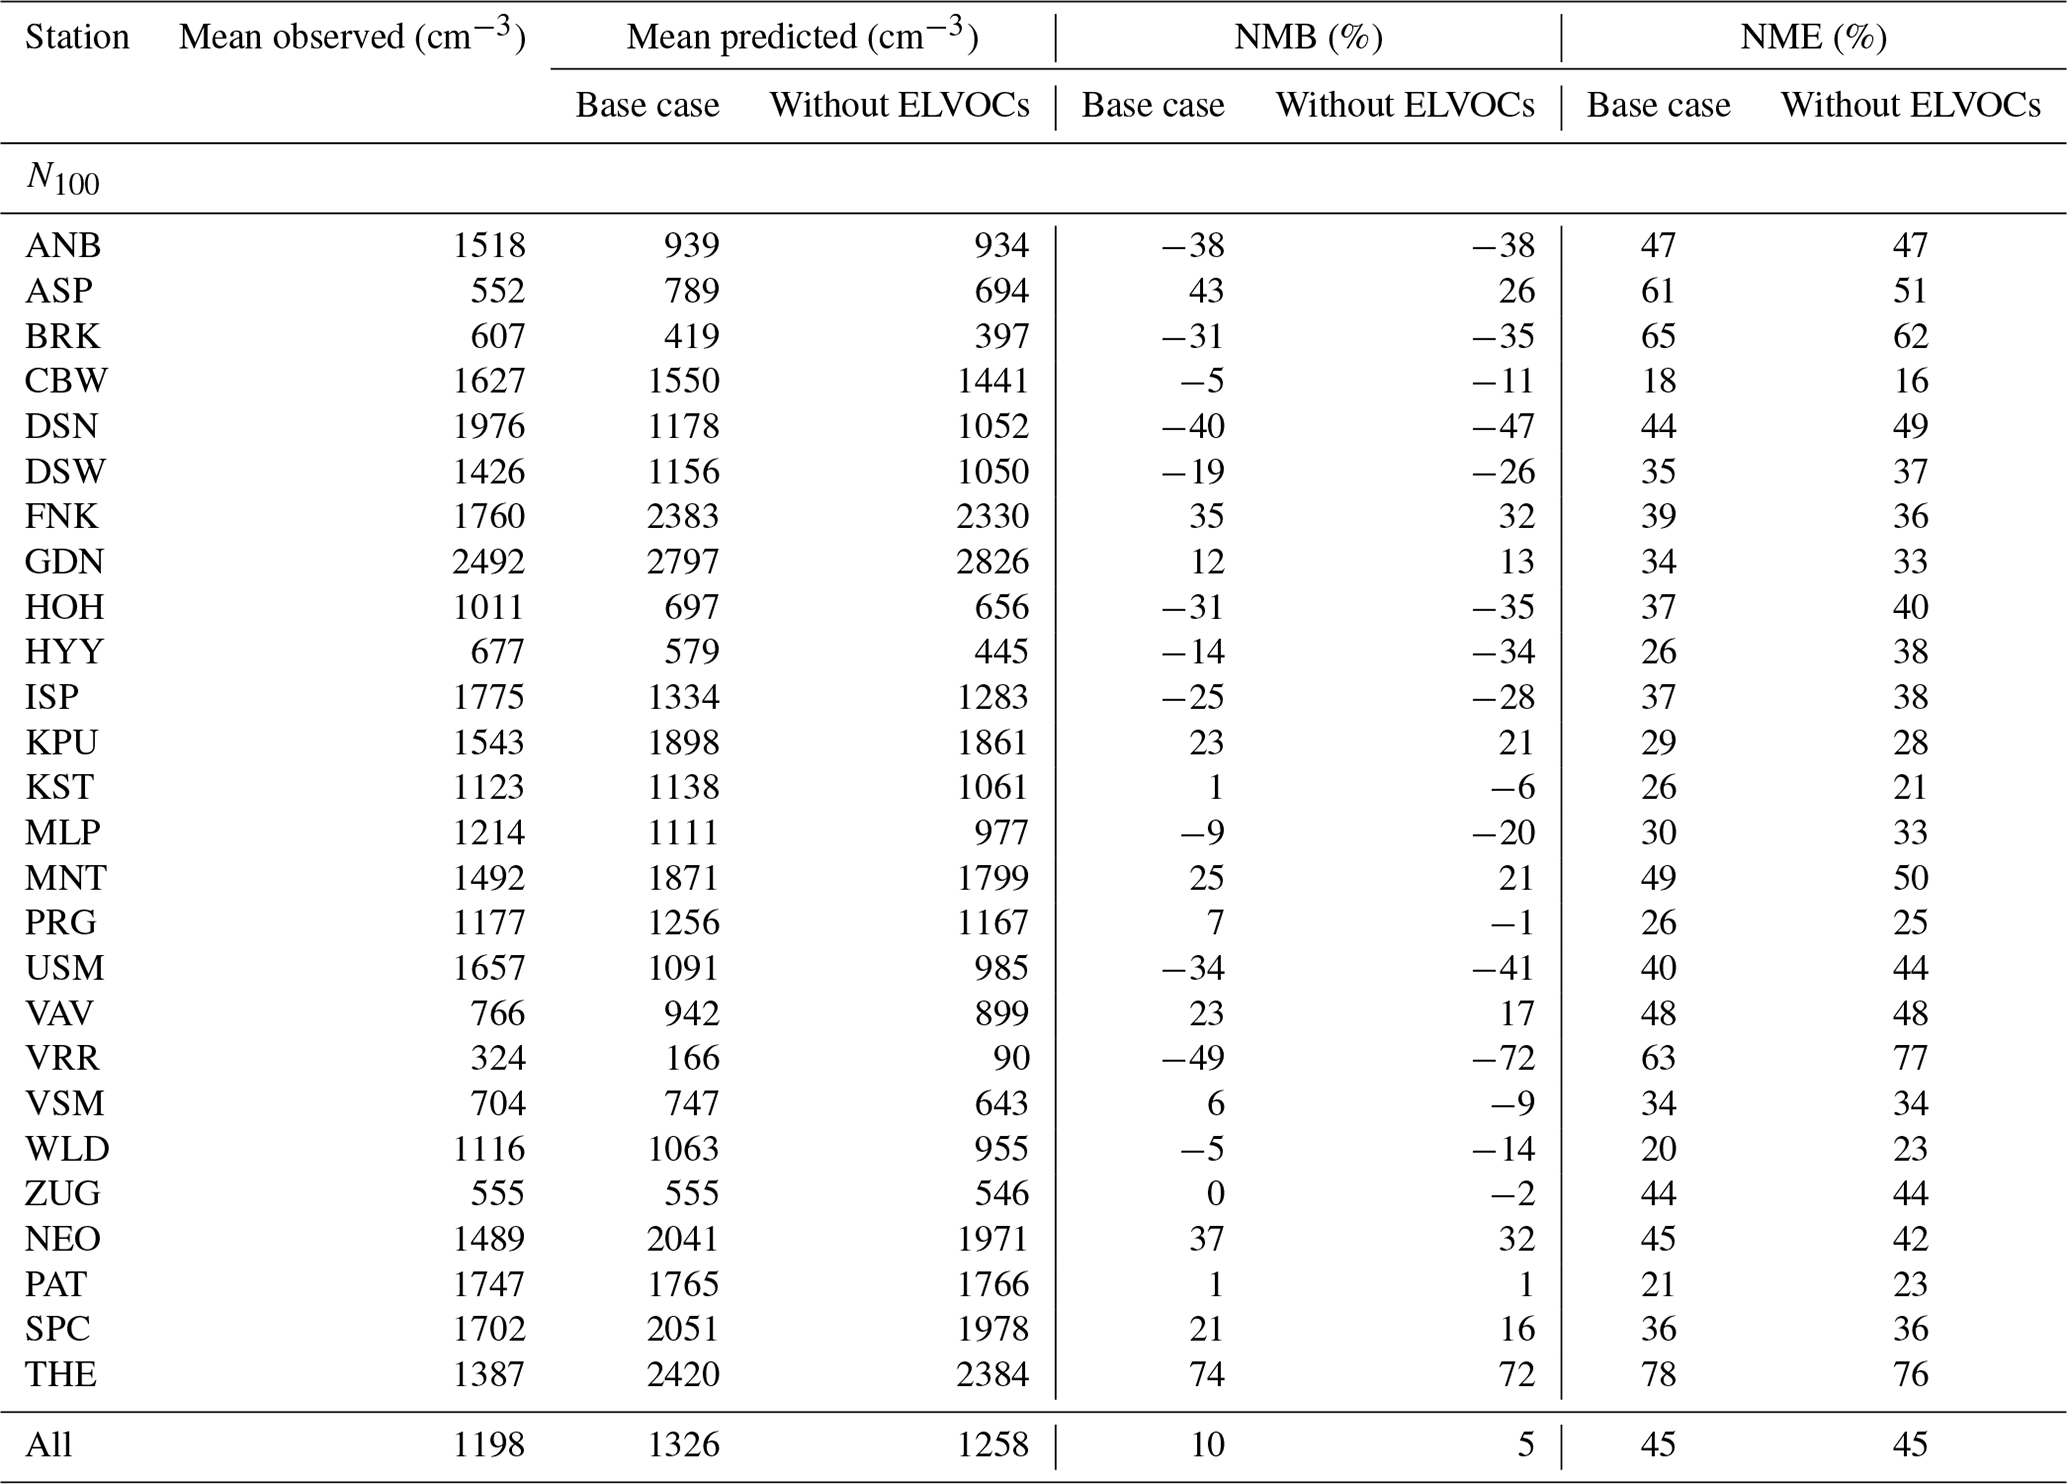
Table 3Prediction skill metrics of PMCAMx-UF against daily ground measurements of particle number concentration above 100 nm (N100) from 5 June–8 July 2012.
For the base case simulation, the model has a tendency to overestimate the N10 levels. The normalized mean bias (NMB) for the daily average concentrations is 23 %, and the normalized mean error (NME) is 63 %. The N10 was overpredicted at 18 sites and underpredicted at 7, and there was practically zero bias (less than 0.1 %) at the last station. The NMB at eight sites (Prague-Suchdol, Ispra, Melpitz, Patras, K-Puszta, Hohenpeissenberg, Hyytiälä, and San Pietro Capofiume) was less than ± 15 %, and for another eight stations it was between ± 15 % and ± 40 % (Annaberg-Buchholz, Cabauw, Dresden Nord and Winckelmannstrasse, Finokalia, Giordan Lighthouse, Kosetice, Montseny, and Varrio). The highest discrepancies with the measurements of N10 were found in Aspvreten, Birkness II, Usti n.L.-mesto, Vavihill, Vielsalm, Zugspitze-Schneefernerhaus, Waldhof, Costa Navarino, and Thessaloniki with a NMB higher than ± 40 %.
The model performed better for N100. There was little bias in the corresponding predictions on average (the NMB was −10 %), and the NME was 45 %. The NMB for 10 sites (Cabauw, Giordan Lighthouse, Hyytiälä, Kosetice, Melpitz, Patras, Prague-Suchdol, Vielsalm, Waldhof, and Zugspitze) was less than ± 15 %, and for another 12 (Annaberg-Buchholz, Birkenes II, Dresden Nord and Winckelmannstrasse, Finokalia, Hohenpeissenberg, Ispra, K-Puszta, Montseny, Costa Navarino, San Pietro Capofiume, Usti n.L-mesto., and Vavihill) it was between ± 15 % and ± 40 % (Table 3). The absolute NMB for N100 exceeded 40 % only in Aspvreten, Varrio, and Thessaloniki.
3.2.2 Evaluation of aerosol composition predictions
The PMCAMx-UF predictions can be evaluated during that period using available PM1 measurements from aerosol mass spectrometers at four stations (Bologna and San Pietro Capofiume in Italy and Finokalia and Patras in Greece) that were part of the PEGASOS campaign.
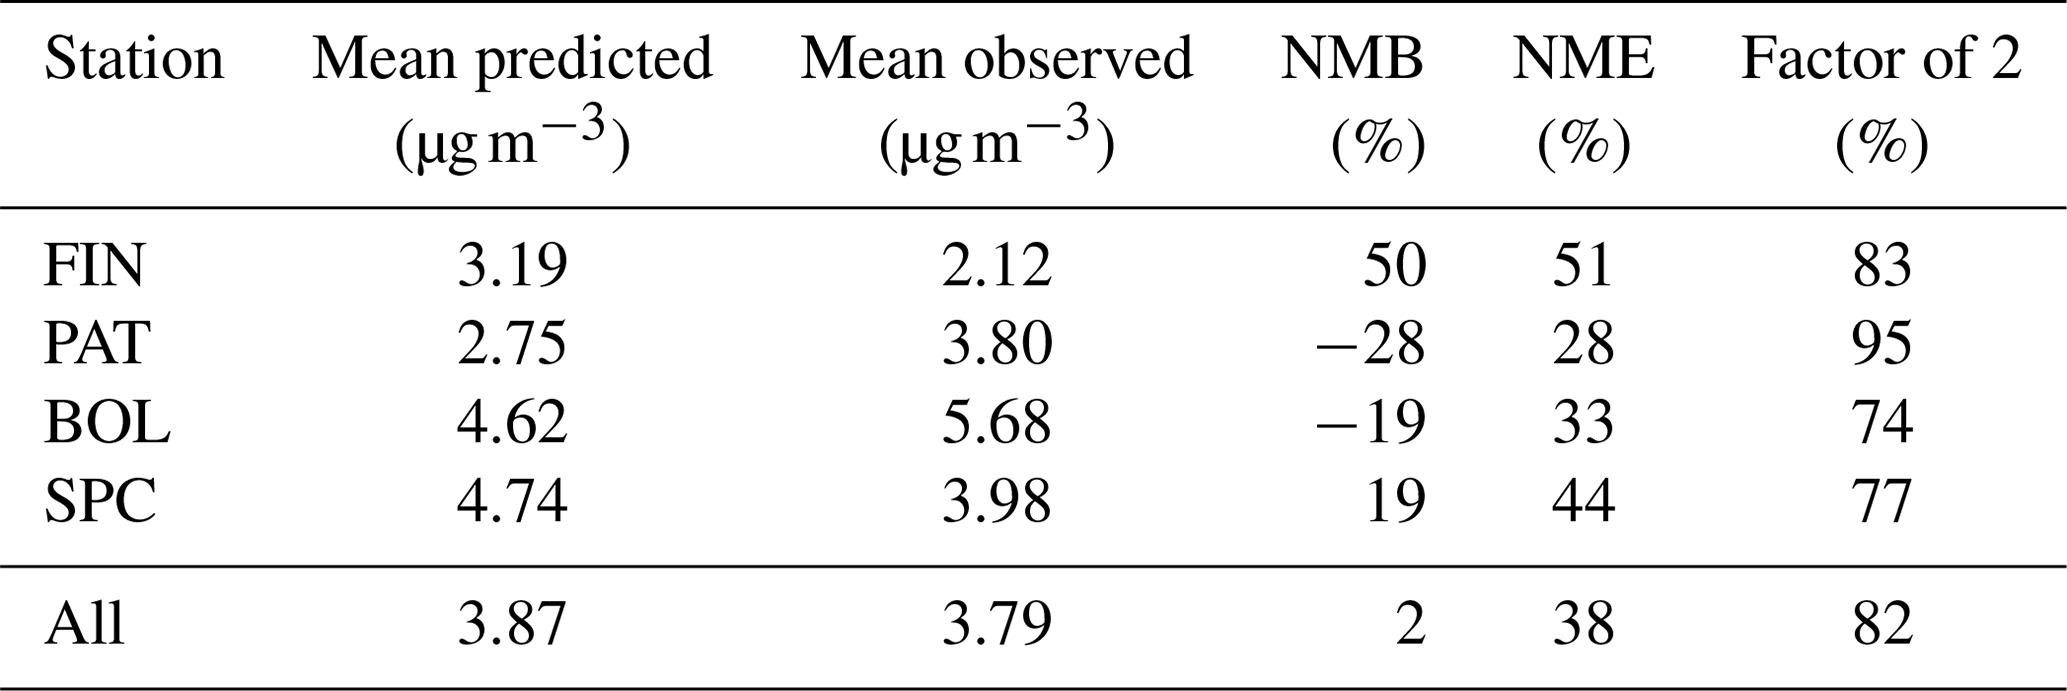
In Italy and Greece, the model reproduces the observations of the PM1 concentrations of the major inorganic aerosol components (sulfate, ammonium, nitrate) reasonably well (Table 4). The model tends to underpredict the organic aerosol concentrations in Patras and Bologna, while it overpredicts the OA in Finokalia and San Pietro Capofiume (Table 5). The OA NMB is −2 % and the NME is 38 %, with the Finokalia site presenting the higher NMB value (50 %) and San Pietro Capofiume and Bologna the lower (± 20 %) (Table 5).
Table 4Predicted (PMCAMx-UF) and observed (AMS) average PM1 concentrations of sulfate, ammonium, and nitrate in different locations for base case simulation.
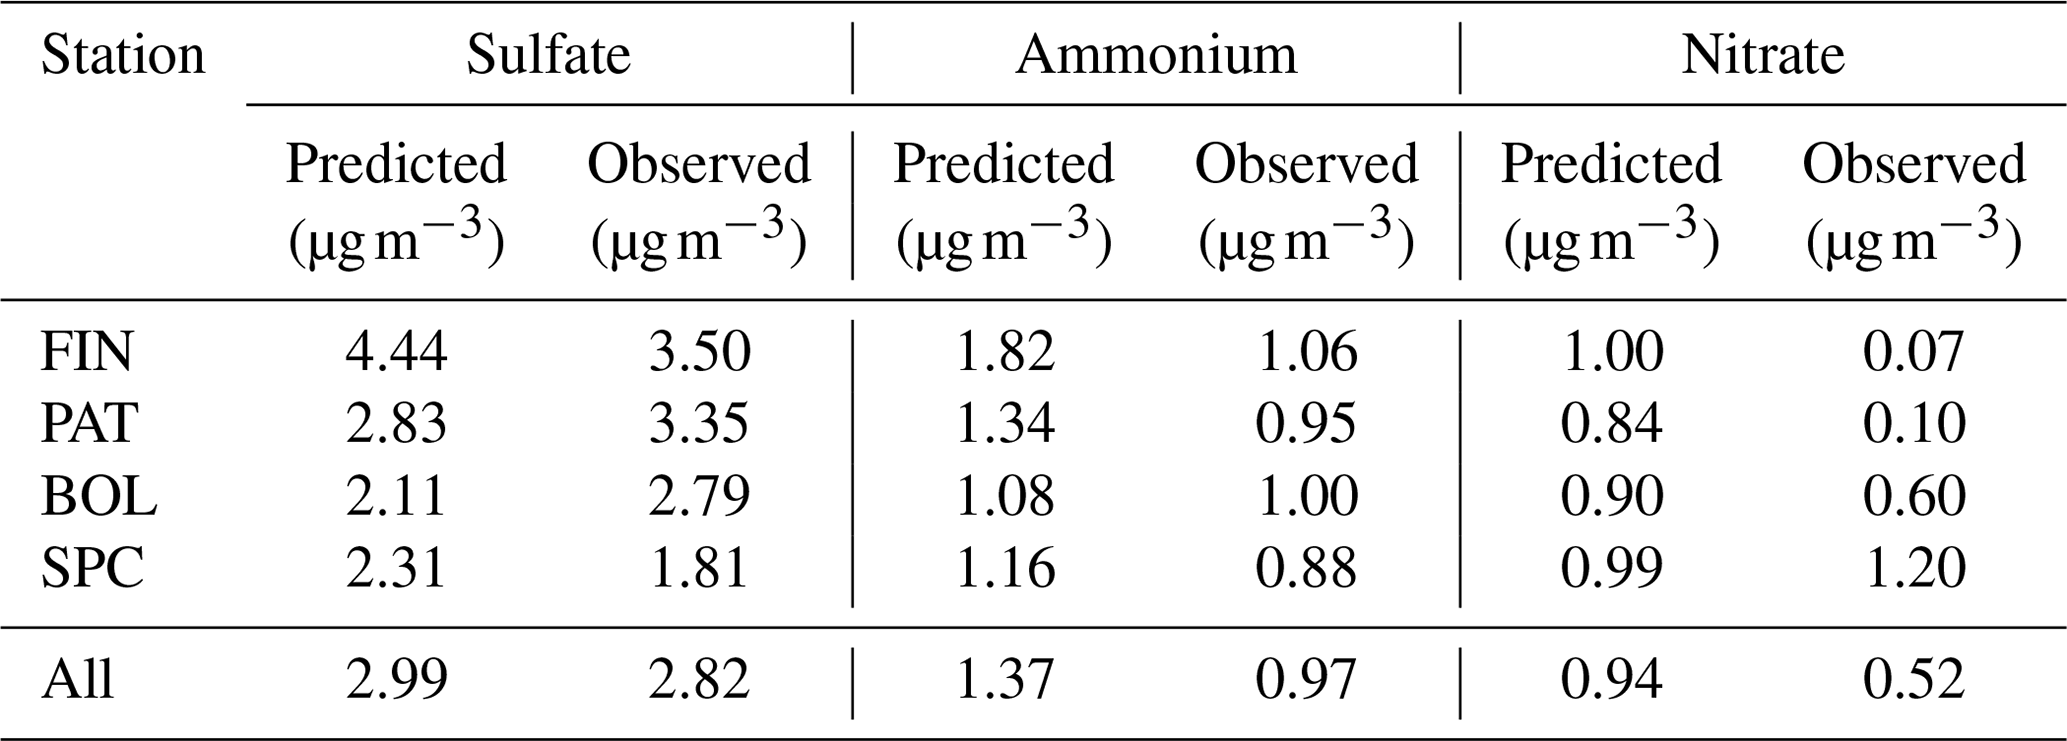
Table 5Prediction skill metrics of PMCAMx-UF base case simulation against daily PM1 OA measurements.
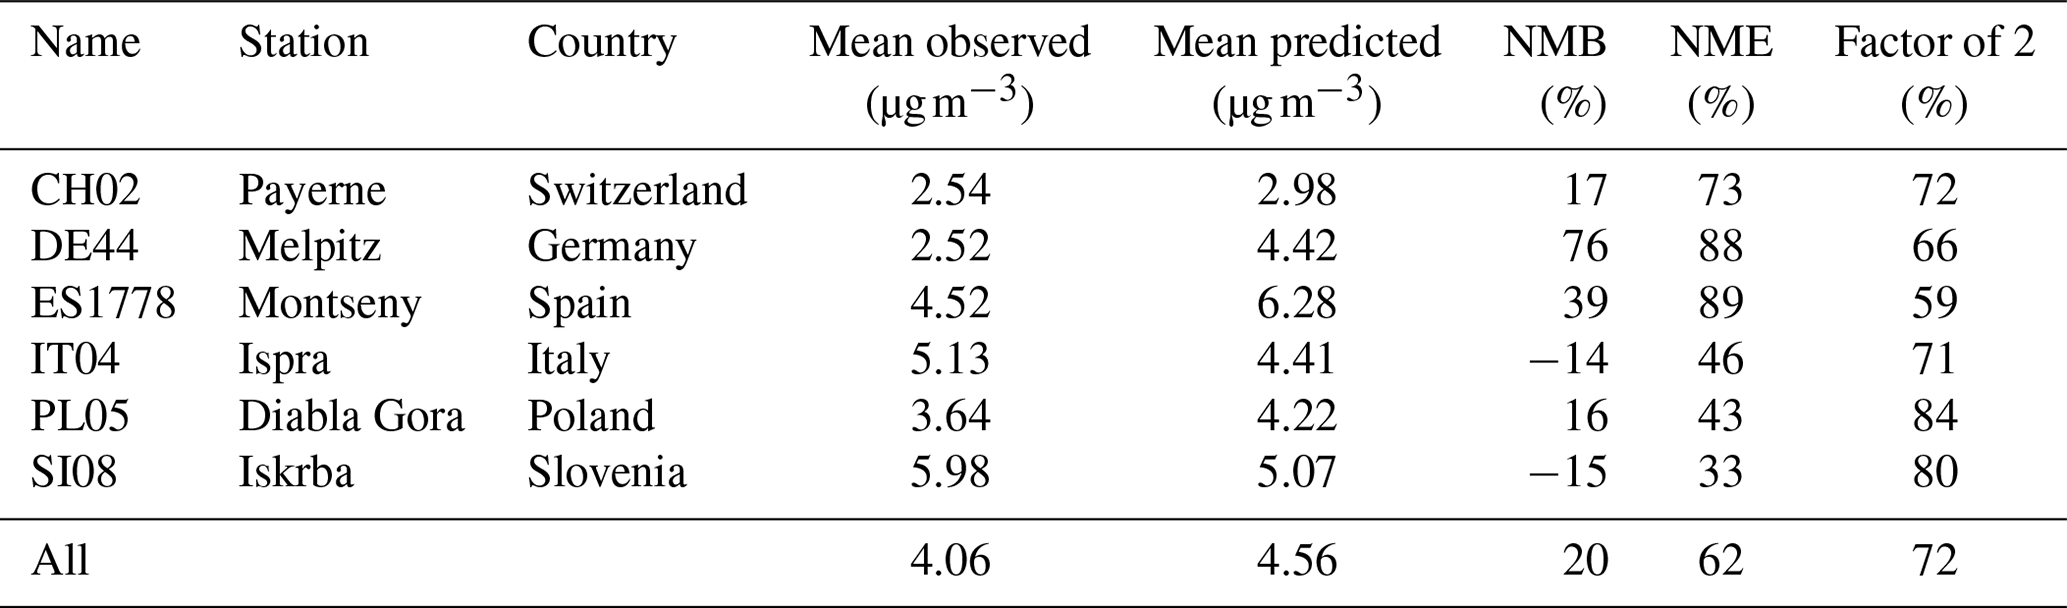
For the rest of Europe, PM2.5 filter measurements have been used, available in the European Supersites for Atmospheric Aerosol Research (EUSAAR) and EBAS databases (http://ebas.nilu.no/, last access: 11 January 2022) for stations that had available data for more than 15 d during the simulated period (six additional stations in Europe: Payerne, Melpitz, Montseny, Ispra, Diabla Gora, and Iskrba; Table 6). For the calculation of OA mass concentration, we assumed OA:OC = 1.8 (Kostenidou et al., 2015). For these sites, the model has a tendency towards overestimating the PM2.5 OA concentration for four out of six stations, presenting an average NMB of 20 % and NME of 62 % (Table 6).
Table 6Prediction skill metrics of PMCAMx-UF against daily PM2.5 OA measurements.
3.2.3 Comparison of PMCAMx-UF predictions to zeppelin measurements
One of the challenges of the PMCAMx-UF evaluation using airborne measurements is that the model predictions are available every 15 min while the corresponding measurements by the zeppelin were taken every 3 min at different heights. For comparison purposes, the model output was interpolated to the times of the zeppelin measurement periods. PMCAMx-UF reproduced more than 75 % of the 2000 3 min N10 and N100 measurements by the zeppelin within a factor of 2 (Fig. S1 in the Supplement). The vertical profiles shown in Fig. 2 are averages of different flights that collected data in different days and different altitudes each time. The number of samples at different altitudes changed for each flight, creating additional variability in the measured profiles.
To facilitate the comparison between measurements and predictions the corresponding average profiles (matched in space and time) were calculated using 80 m altitude bins for all the PEGASOS flights. On average PMCAMx-UF reproduced the N10 measurements over Po Valley at lower than 160 m and above 400 m but underestimated the higher N10 levels measured in the residual layer at heights between 160–400 m during several of the flights that started several hours before sunrise (Fig. 2a). The average measured N10 at all heights was 6000 cm−3, while the predicted concentration was equal to 4700 cm−3. PMCAMx-UF reproduced the N100 concentration at all heights (Fig. 2b). The model also reproduced 80 % of the 3 min N100 zeppelin measurements within a factor of 2. The measured average N100 at all heights was 1500 cm−3, and the average predicted by PMCAMx-UF was 1800 cm−3. The ability of the revised model to reproduce the high-time resolution (3 min) zeppelin measurements at multiple altitudes and locations reasonably well is encouraging. The predictions of PMCAMx-UF for the aerosol mass concentration were compared to the zeppelin PM1 composition measurements obtained by an AMS (each 3 min, nine flights, ∼ 1300 data points). The average vertical profiles of organics, sulfate, ammonium, and nitrate are shown in Fig. S2. Overall, the model performance aloft was quite similar to that at the ground level. For example, for the nine zeppelin flights the OA normalized mean bias was −4 %, and the normalized mean error was equal to 40 % (Table S4). The measured and predicted OA mean values are 4.6 and 4.4 µg m−3, respectively.
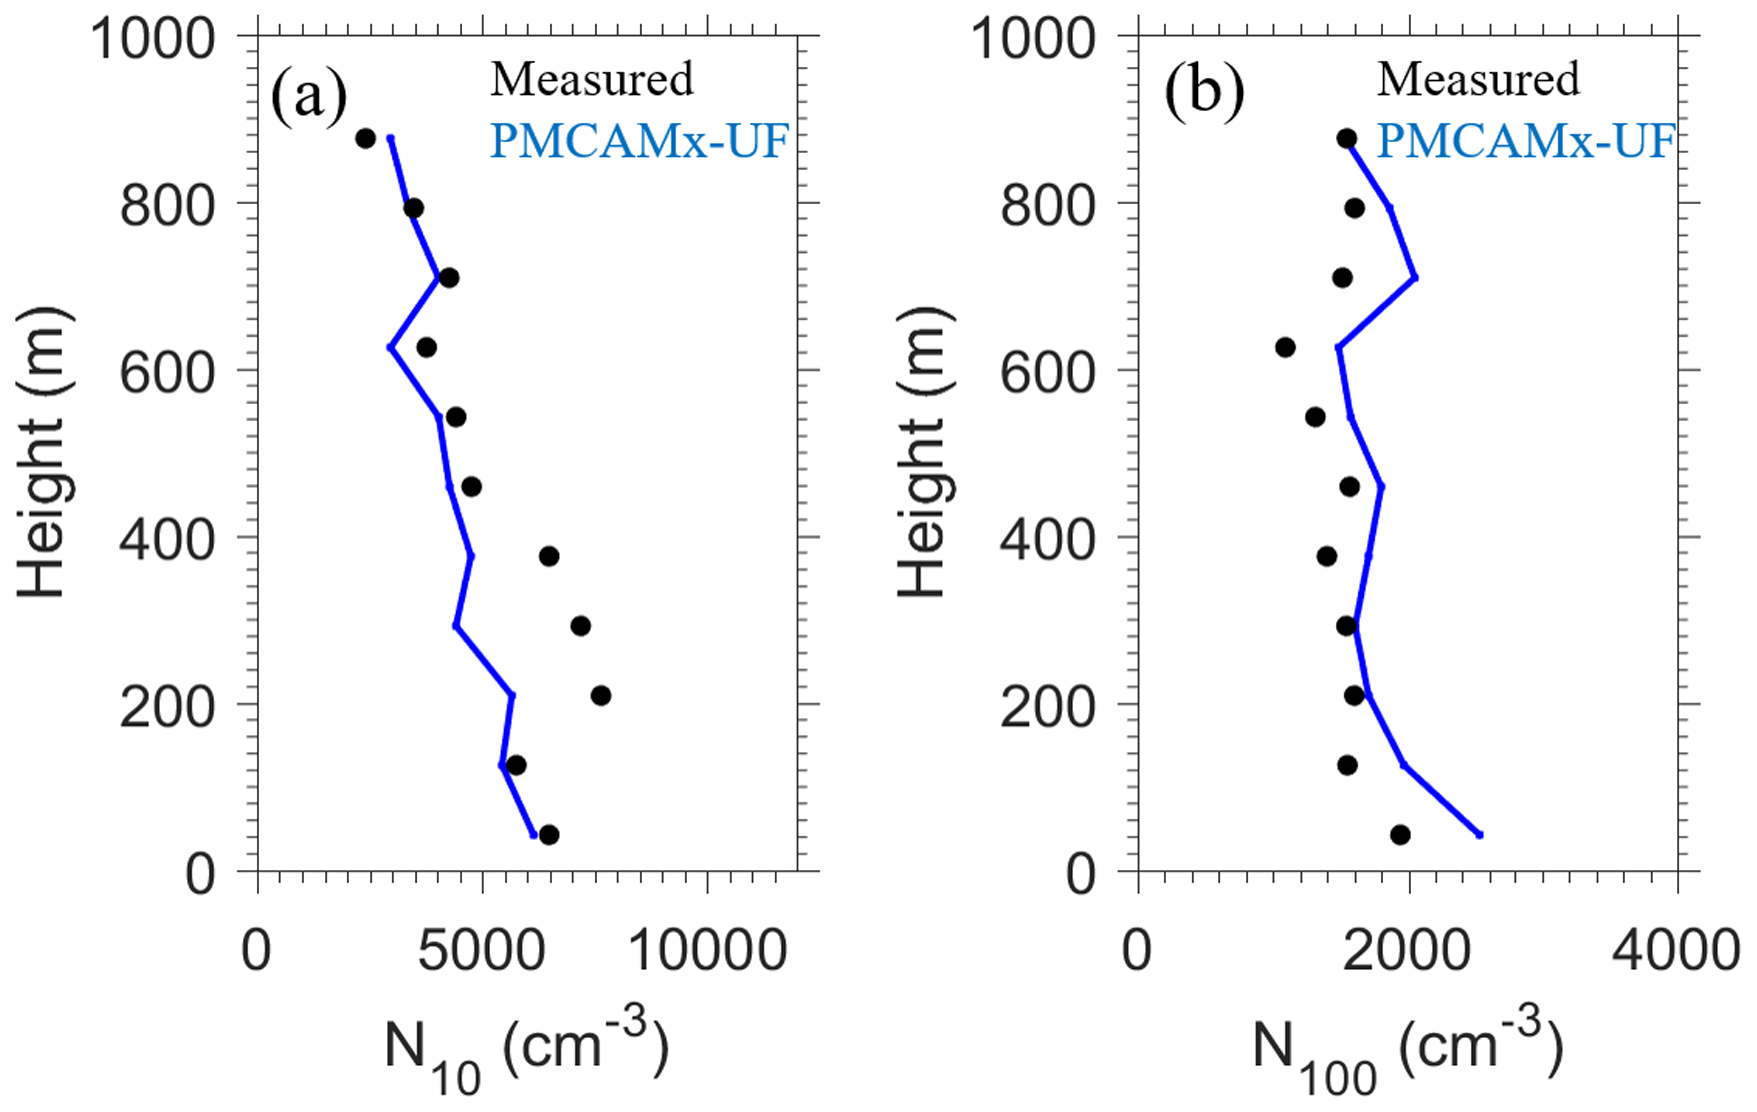
Figure 2Comparison of predicted PMCAMx-UF (blue line) vs. observed (black dots) vertical profiles of averaged particle number concentrations for (a) N10 and (b) N100 of 25 flights over the Po Valley during the PEGASOS campaign.
3.3 Effect of ELVOC production on particle number and OA concentrations
An additional simulation was performed neglecting the production of ELVOCs from terpenes (case 2). The addition of ELVOCs increased the PM2.5 OA mass by approximately as much as 0.5 µg m−3 in central-eastern Europe and Russia, accounting for approximately 10 %–15 % of the OA (Fig. 3). In these areas a combination of high terpene emissions and high photochemical reaction rates existed during the simulated period. The highest relative predicted increase in OA was 15 %–25 % in northern Europe. In central Europe the ELVOC formation increased average OA by approximately 10 %.
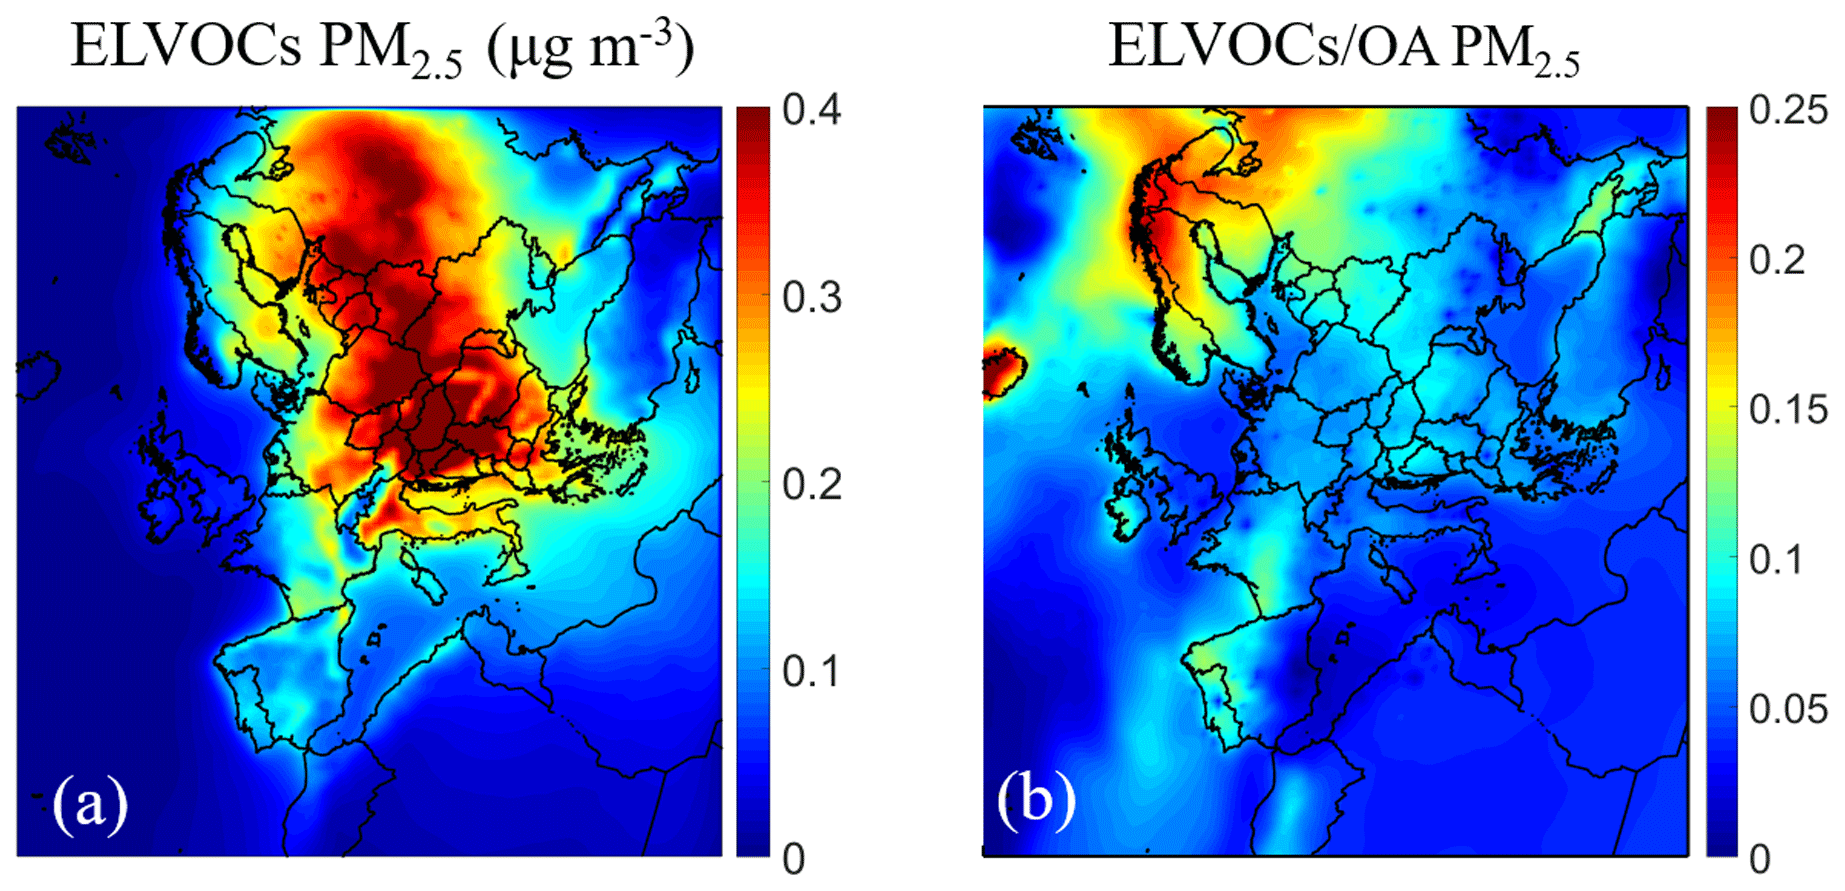
Figure 3Average ground level (a) PM2.5 ELVOCs mass concentration (in µg m−3) and (b) the ratio of the PM2.5 mass of ELVOCs to OA during the simulation. Different scales are used.
The average fractional increase in Nx, due to the production of ELVOCs, is calculated as
where x is 10, 50, 100 nm, or zero (total number). Rather surprisingly, the average fractional change for all number concentrations (Ntot, N10, N50, and N100) is small, ranging between 1 % and −4 % (Fig. 4) (Ntot: −8 cm−3 or −0.14 %; N10: 40 cm−3 or −1.14 %; N50: 60 cm−3 or 3 %; N100: 35 cm−3 or 4 %). One reason for the small average change is that both increases and decreases are predicted for different areas in Europe. These mixed results are due to the fact that the ELVOC condensation accelerates the growth of new and preexisting particles to larger sizes, but at the same time accelerates their losses due to the increase in the coagulation sink and decreases the nucleation rate due to the increase in the condensation sink.
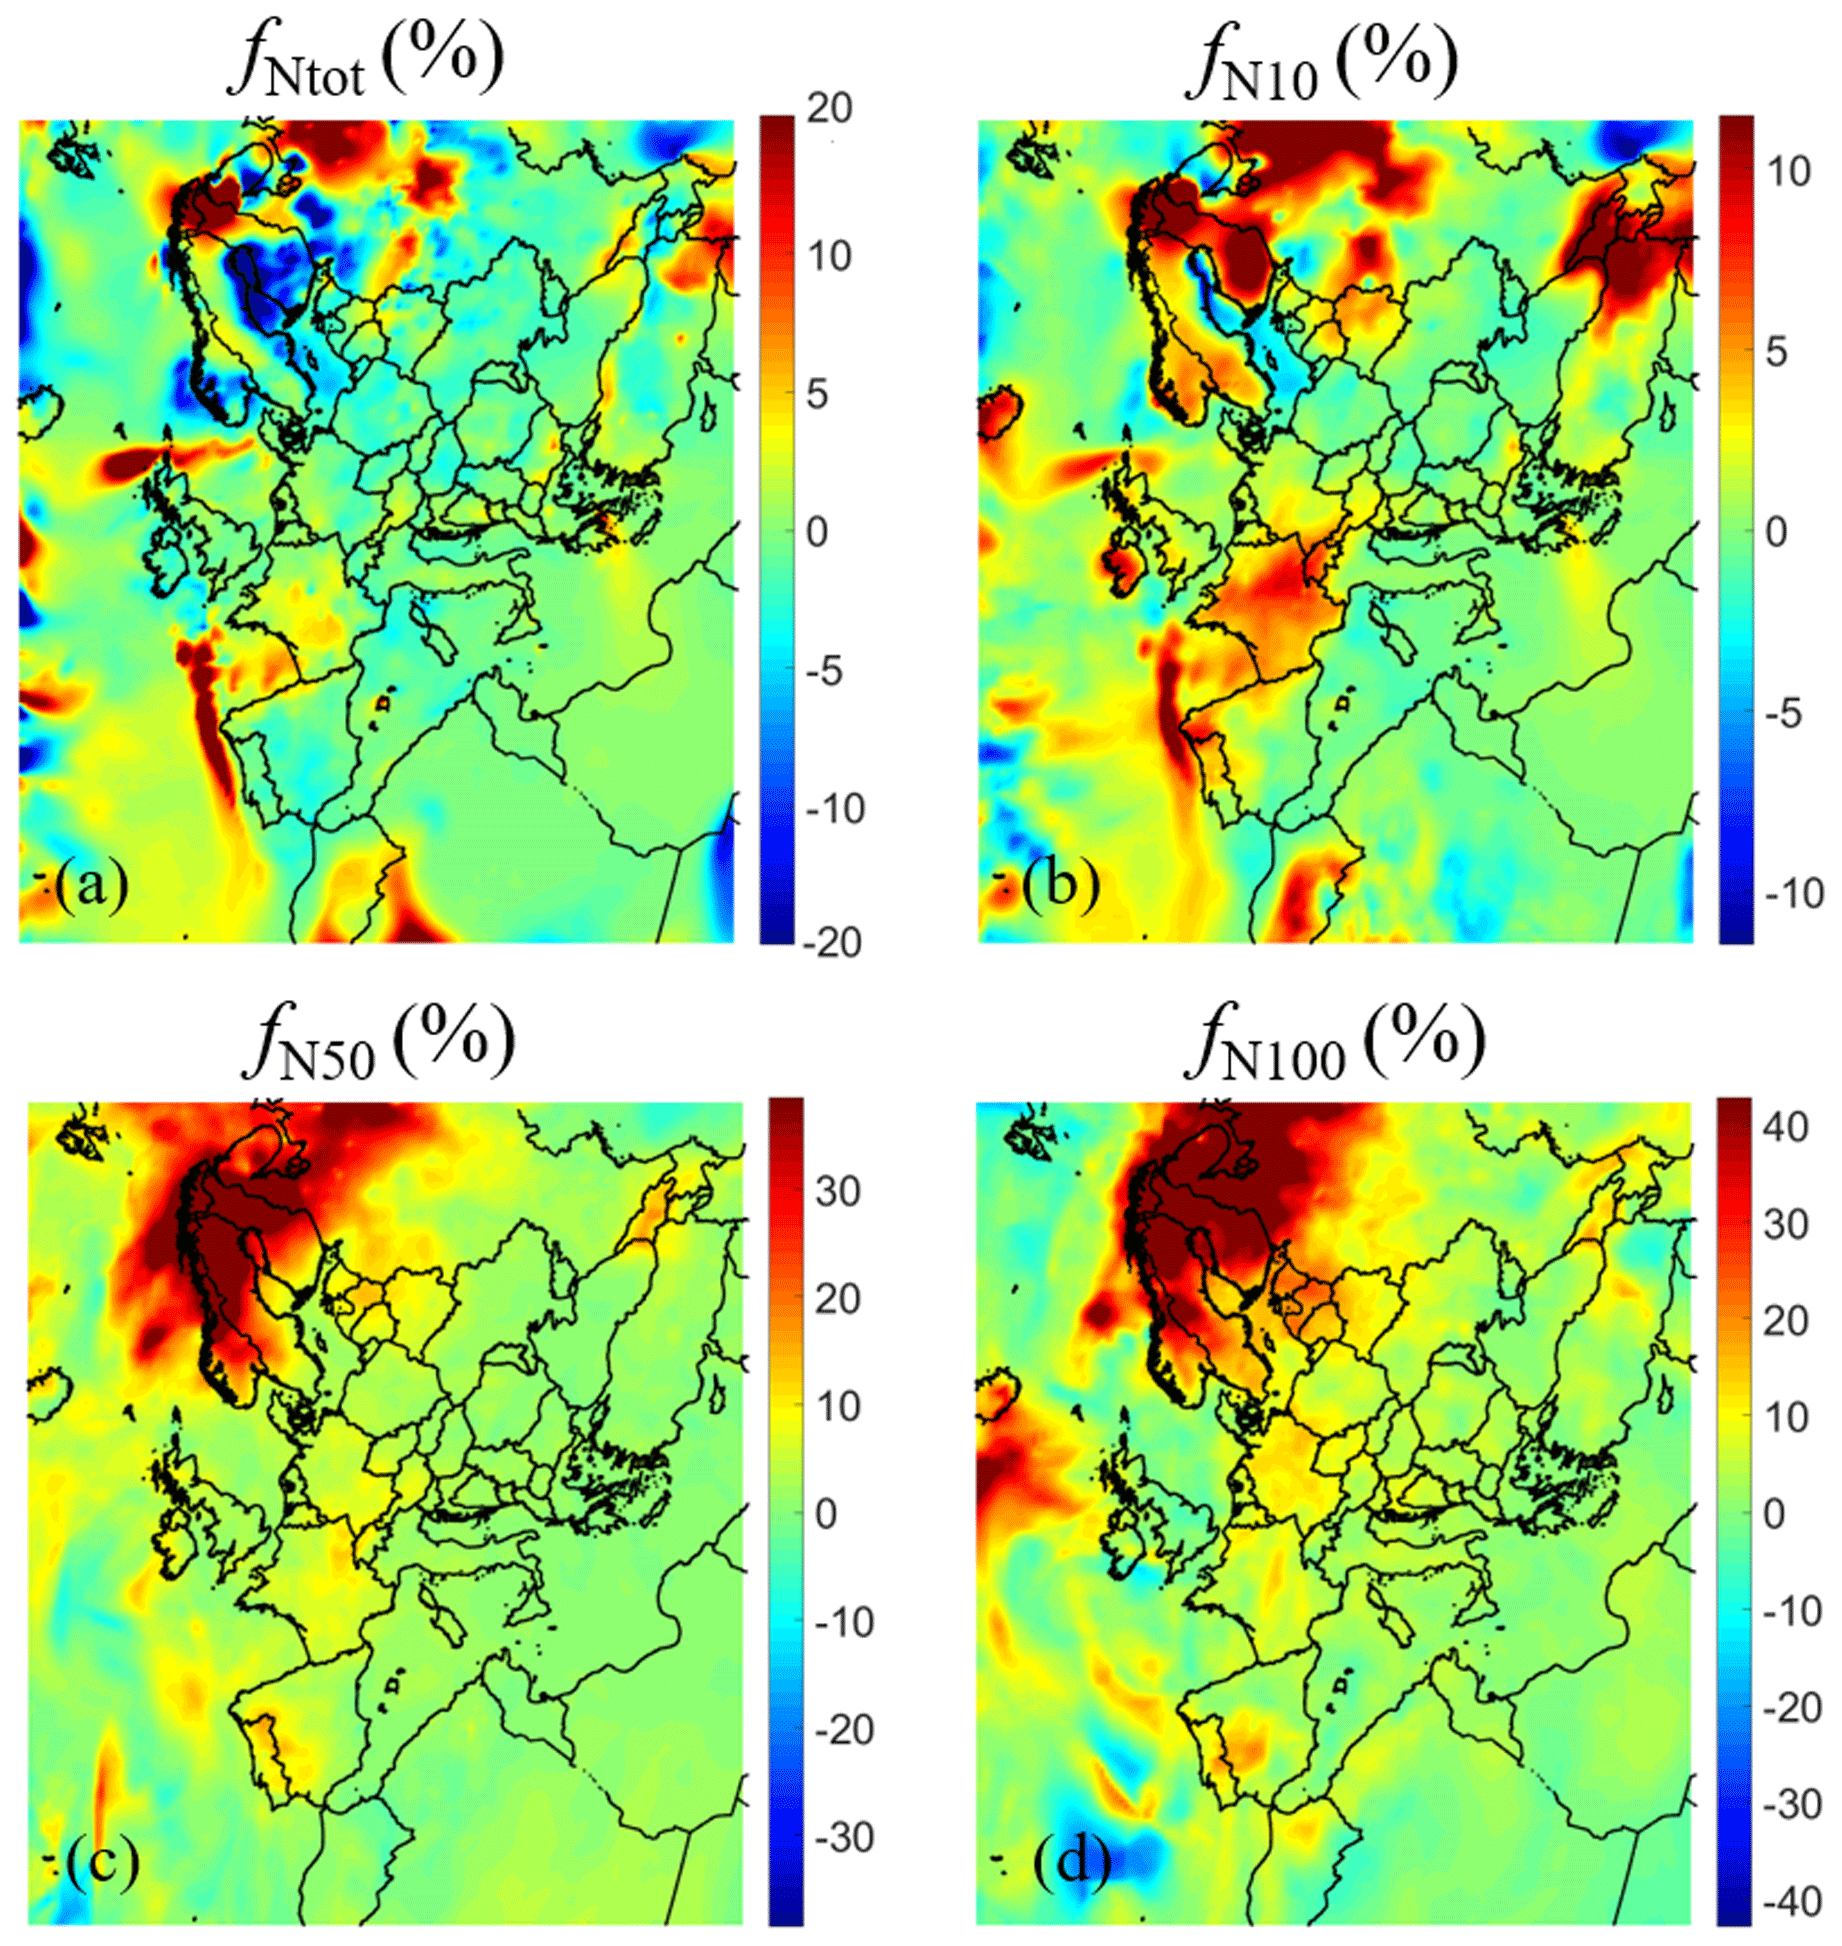
Figure 4Average ground level fractional increase () of number concentration due to the condensation of ELVOCs for (a) all particles (), (b) particles above 10 nm (), (c) particles above 50 nm (), and (d) particles above 100 nm (). Different scales are used.
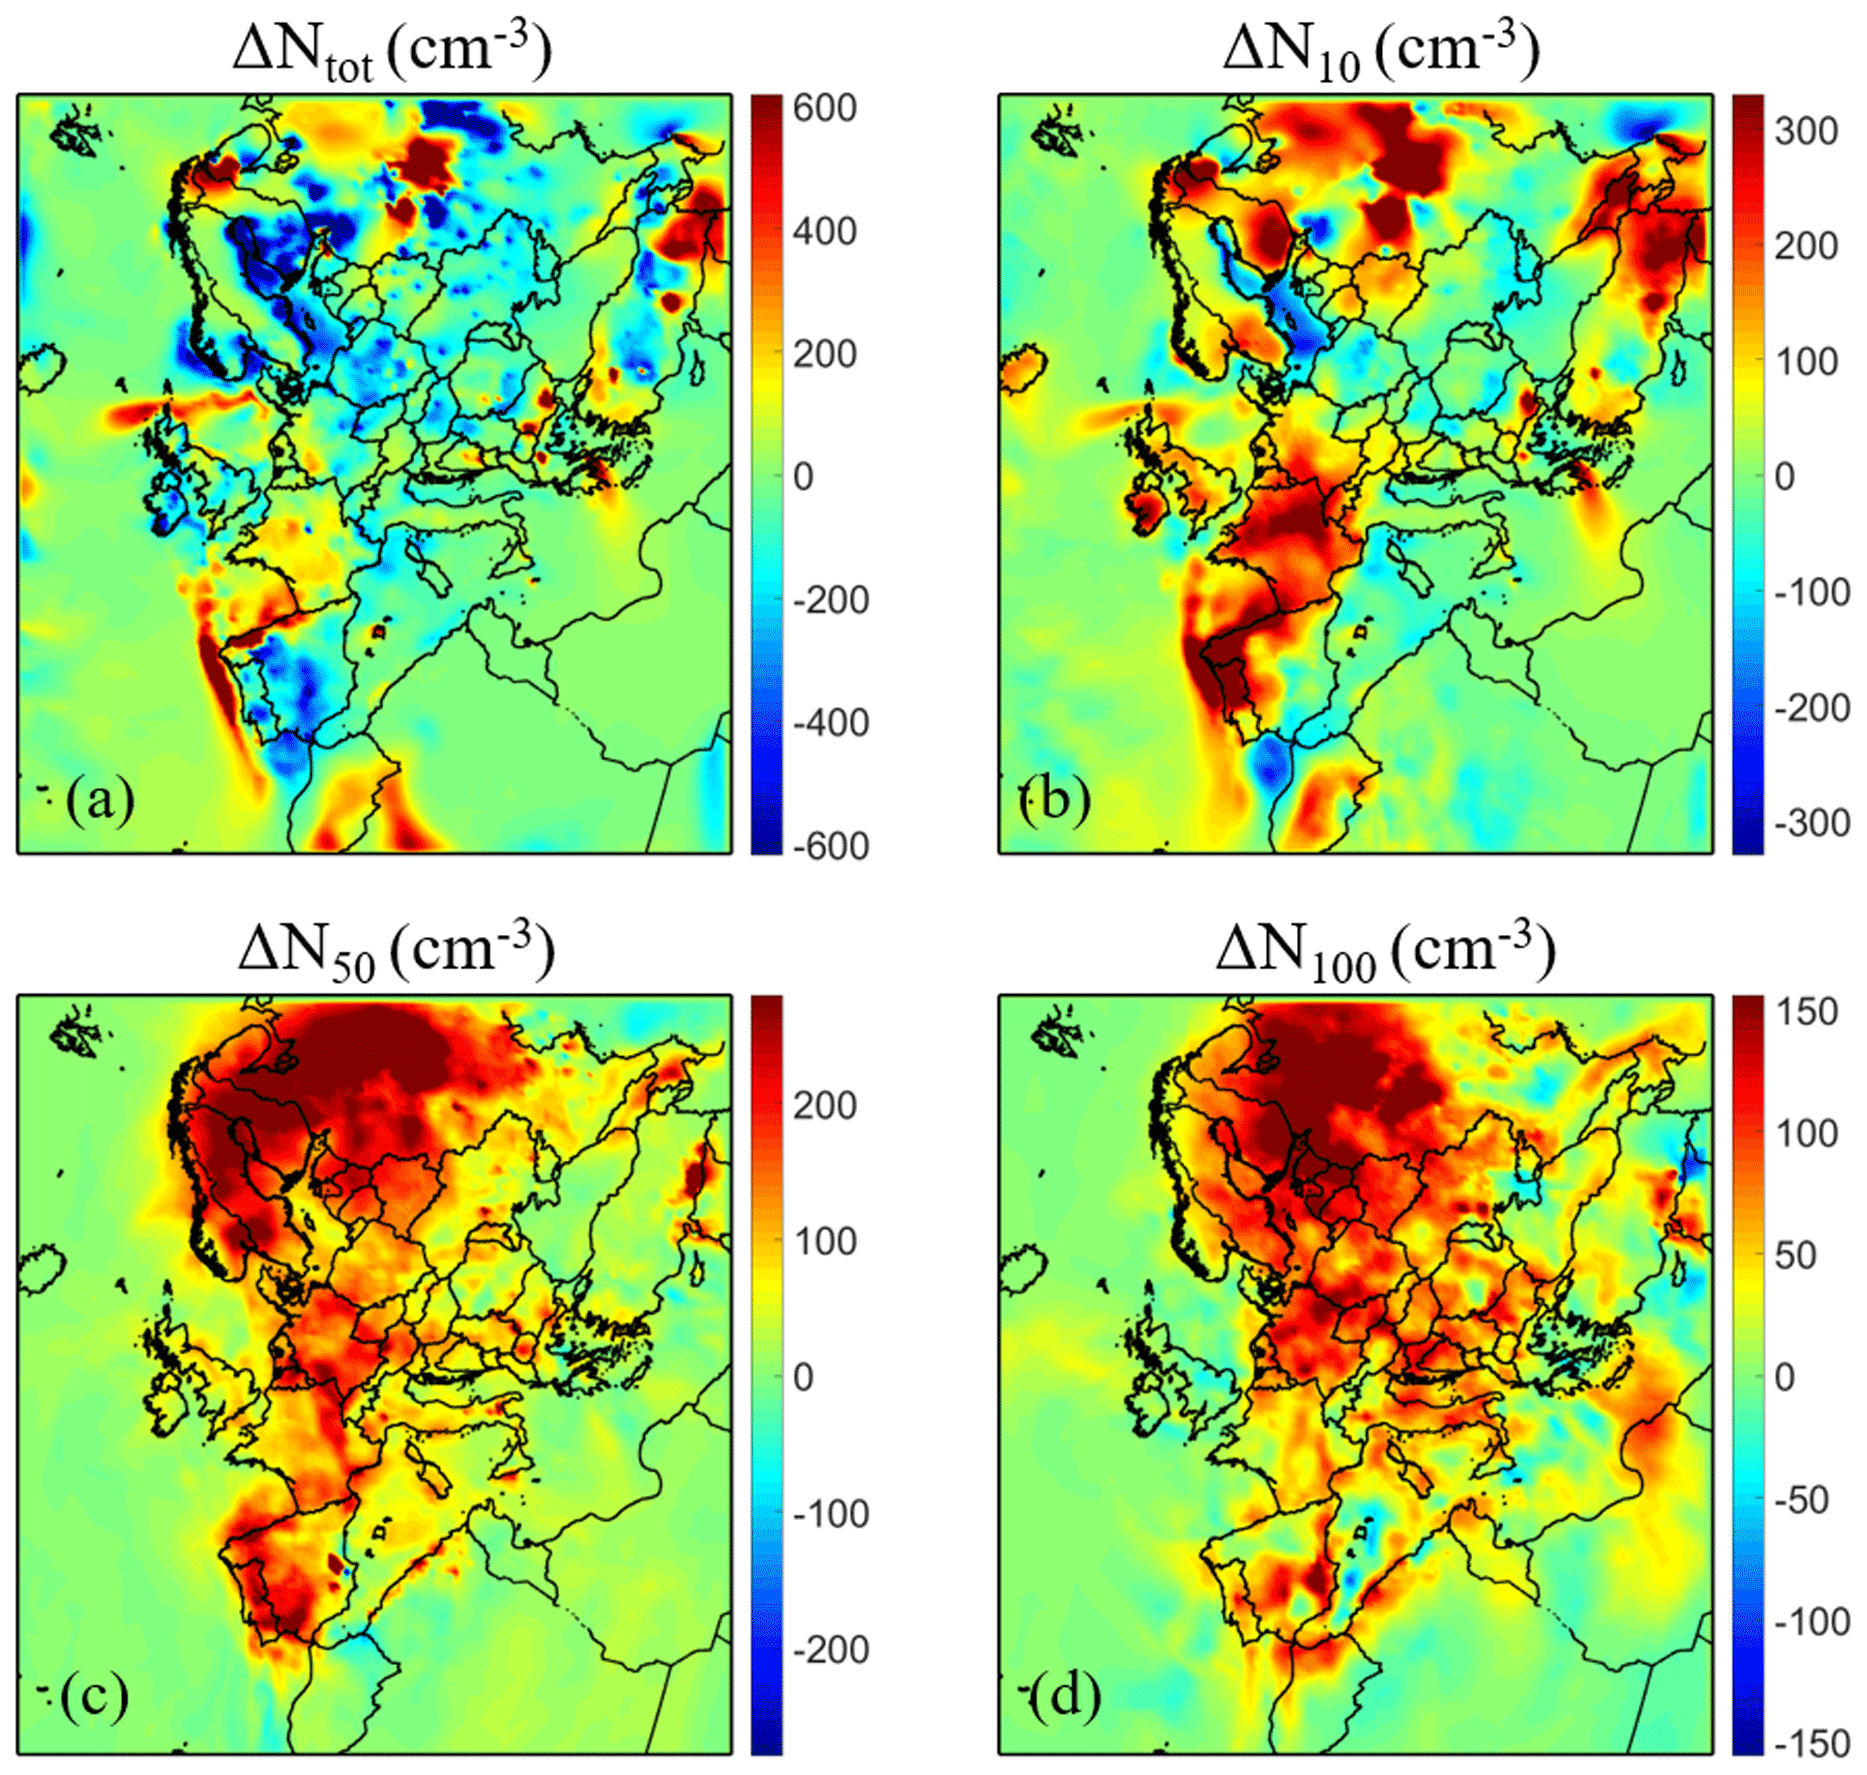
Figure 5Average ground level increase in number concentration (in cm−3) due to the condensation of ELVOCs for (a) all particles (ΔNtot), particles above (b) 10 nm (ΔN10), (c) 50 nm (ΔN50), and (d) 100 nm (ΔN100). Different scales are used.
The formation of ELVOCs resulted in a predicted decrease in Ntot by 20 % (300–600 cm−3) in parts of the Nordic countries and by 5 % in central Europe (Fig. 4). The decreases are predicted for most of Europe, with the exception of a few areas in which increases are predicted (northern Iberian Peninsula, parts of France, areas in the Balkans with high sulfur dioxide levels, etc.) (Fig. 5). The predicted N10 increased by 5 %–15 % (150–400 cm−3) over Finland, northwestern Russia, France, Ireland, and northern Portugal. At the same time there were small decreases of a few percent over several areas in Europe, especially in the south and in the east as well over the Baltic Sea. N50 increased over almost all of Europe by 50 to 300 cm−3. This N50 increase corresponds to 20 %–40 % over Scandinavia and northwestern Russia and 10 % for central Europe. Finally, the ELVOCs caused an increase in N100 of 20 %–50 % over Scandinavia and 10 %–20 % over central Europe. The absolute corresponding N100 changes in these areas are 100–200 cm−3.
The corresponding changes of the number concentrations for particles with diameters between 1 and 10 nm (N1–10), 10 and 50 nm (N10–50), and 50 and 100 nm (N50–100) are summarized in Fig. S3. These figures illustrate the complex effect of the ELVOCs on different parts of the aerosol number distribution. Decreases in the concentrations of the 1–10 nm particles (decreasing nucleation rate due to increased condensation sink, increasing coagulation with larger particles), increases in the concentrations of the particles with a diameter larger than 100 nm (due to accelerated growth of the sub-100 nm particles to larger sizes), and both increases and decreases in the 10–50 nm size range depend on the magnitude of the different competing processes in each area. The effect of the ELVOCs in this PMCAMx simulation is clearly a lot more complex than a uniform increase in particle number concentrations.
The spatial variability of the fractional change in the number concentration of N1–10 (reflecting nucleation rates), sulfuric acid concentration, condensational sink (CS), and coagulation sink due to the ELVOCs is depicted in Fig. S4. In areas such as the Scandinavian Peninsula the production of ELVOCs is predicted to lead to a 20 %–30 % average increase in the coagulation and condensational sinks and a corresponding decrease in sulfuric acid levels and N1–10. Similar changes are predicted for several other areas (e.g., central Europe) but are less pronounced.
The results at the Hyytiälä station in Finland were examined in more detail because the predicted number concentrations in Finland are quite sensitive, according to PMCAMx-UF, to the addition of the ELVOCs. The predicted N3, N10, N50, and N100 concentrations for the base case are in reasonable agreement with the field measurements in this area (Fig. S5), with a tendency of the model to overpredict the N3 levels during a few nucleation events. For all concentrations the simulation with the ELVOCs (base case) reproduces the measurements better than the simulation in which they are neglected. The condensation sink for Hyytiälä increases by a few percent due to the additional mass of the ELVOCs (Fig. S5). The average measured and predicted number size distributions in Hyytiälä are shown in Fig. S6. The addition of the ELVOCs leads to increased levels in the part of the size distribution above 50 nm. A decrease in the concentration of particles with a diameter below 7 nm is predicted due to the addition of the ELVOCs because of both increased coagulation losses and lower nucleation rates. The difference in the predictions of the two simulations (with and without ELVOCs) in Hyytiälä is modest. The discrepancy between model predictions and measurements is due to both weaknesses of the measurements (particles smaller than 3 nm were not measured) and a tendency of the model to overpredict nucleation event intensity in this area.
The ELVOC addition played a minor role in the overall performance of PMCAMx-UF. The NMB for N10 decreased (in absolute terms) by 1 %; it increased by 5 % for N100 due to the addition of the ELVOCs in the simulation (Tables 2 and 3). The addition of the ELVOCs mainly affects the PMCAMx-UF predictions in northern Europe and especially Finland, where the predictions of N100 significantly improve. In Hyytiälä the NMB decreases from −34 % to −14 %, and in Varrio it drops from −72 % to −49 % (Table 3). The corresponding normalized mean errors changed by 1 %–2 %. The small changes in the performance metrics are consistent with the small overall changes caused by the ELVOC addition.
The small change in the OA mass concentration due to the addition of the ELVOCs has a modest impact on the performance of PMCAMx-UF for OA (Tables S5 and S6). For example, the PM1 OA bias improves from −6 % to 2 % while the PM2.5 OA bias increases from 15 % to 20 %. The changes in normalized error are 1 % or less.
3.4 Effect of IVOCs on particle number concentrations
The emissions of IVOCs ( 10−3 µg m−3) were set to zero in a sensitivity test (case 3) to quantify their effect on the predicted particle number concentration and size distribution. The SOA formed by the IVOCs (SOA-iv) exceeds 1 µg m3 in southern Europe, over the Mediterranean Sea, but also in large areas over central and eastern Europe (Fig. 6). The high SOA-iv levels over the Mediterranean are due to the oxidation of IVOCs emitted from large wildfires that occurred during the simulation period. The corresponding SOA-iv is 10 %–25 % of the total OA over continental Europe and even higher (about 60 %) over parts of the marine atmosphere. The average fractional increase in Nx due to emission and aging of IVOCs is calculated as
where x is 10, 50, 100 nm, or zero (total number).
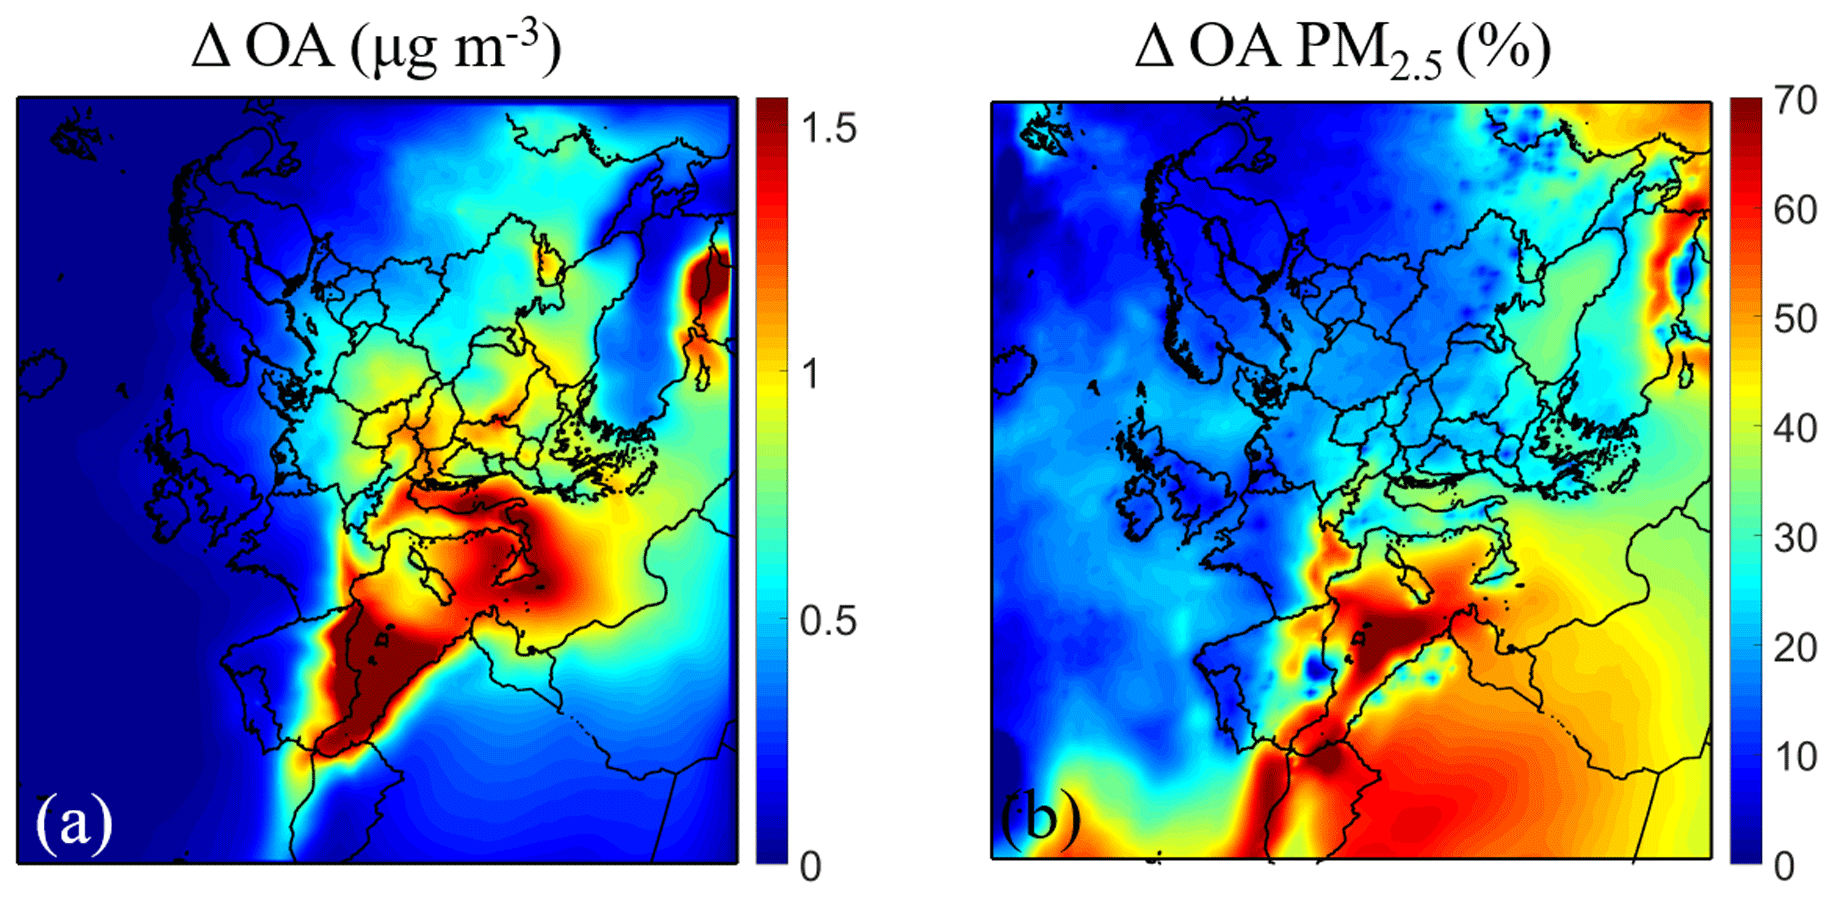
Figure 6Ground level average (a) increase in PM2.5 mass concentration of organics aerosol (in µg m−3) and (b) fractional increase in PM2.5 mass concentration of organics aerosol (%) due to the addition of IVOCs emissions of semivolatile organic aging, predicted from 5 June–8 July. Different scales are used.
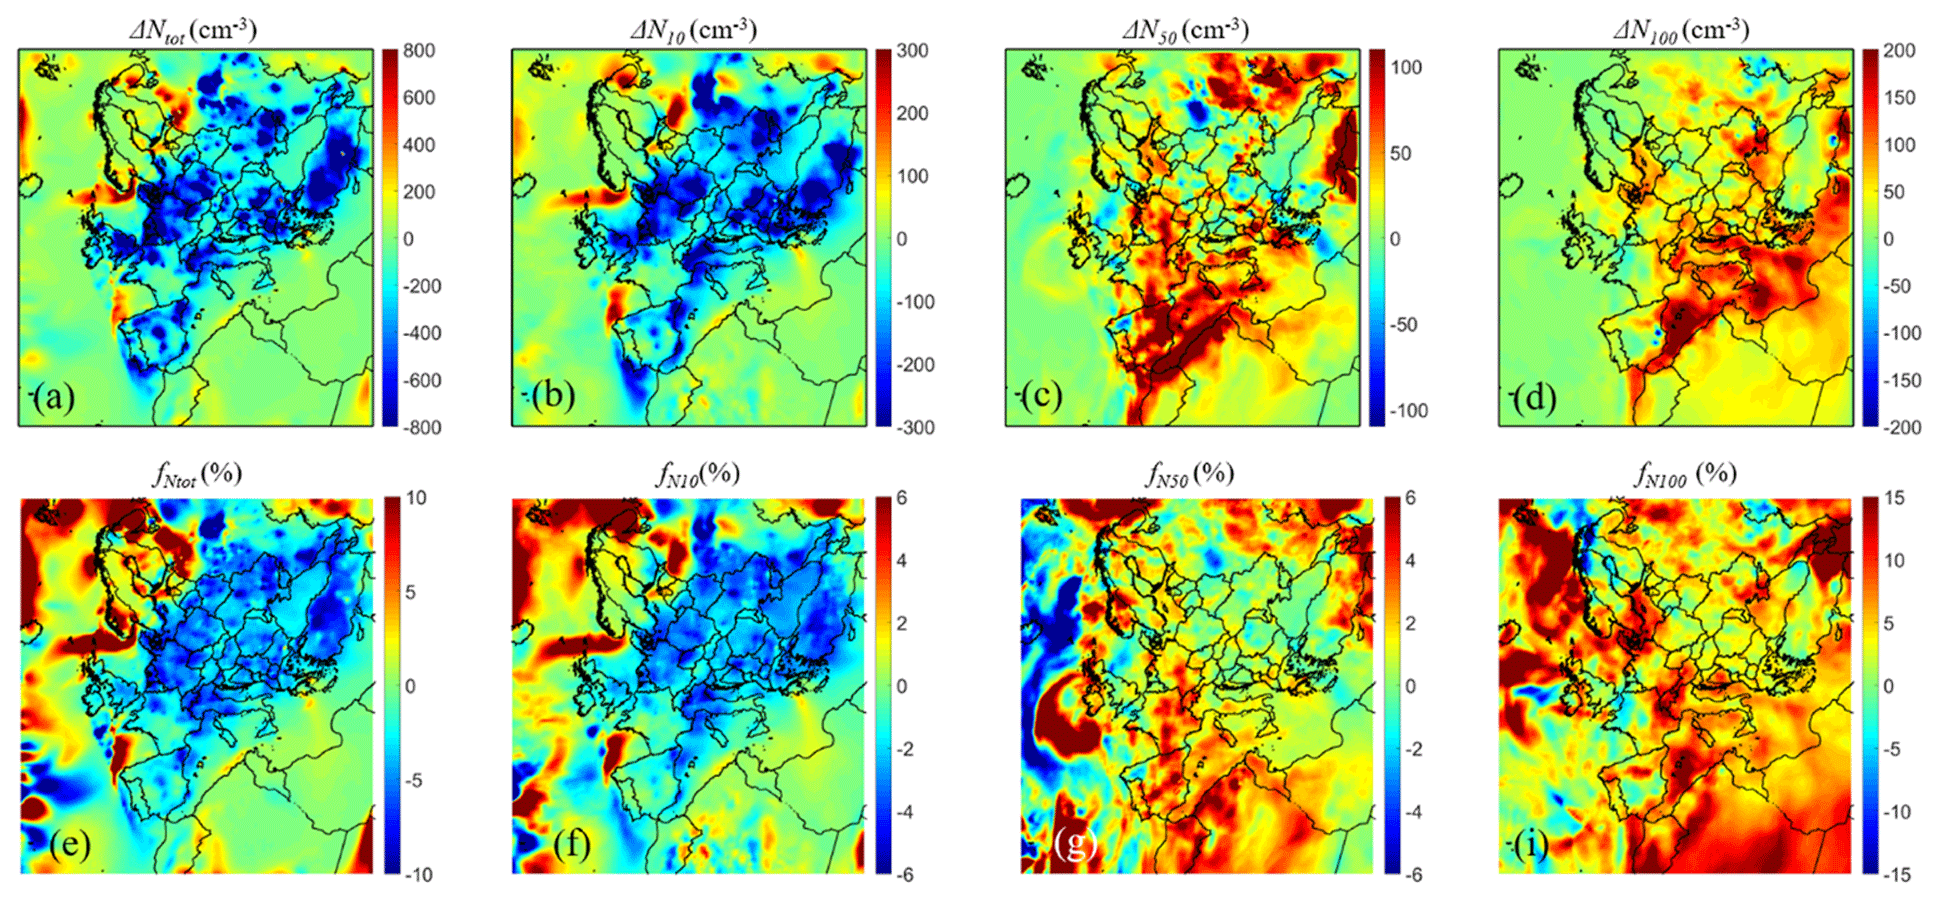
Figure 7Ground level increase in number concentration (in cm−3) (a–d) and fractional increase () in number concentration (e–i) due to the addition of IVOC emissions and aging reactions, predicted from 5 June–8 July 2012 for (a, e) all particles (Ntot) and particles above (b, f) 10 nm (N10), (c, g) 50 nm (N50), and (d, i) 100 nm (N100). Different scales are used.
According to PMCAMx-UF the addition of the emissions of IVOCs and their aging reactions lead to a reduction of Ntot by 5 %–10 % and N10 by 5 % (Fig. 7) for continental Europe. On the other hand, this addition of IVOCs leads to an increase in N50 by 5 % and N100 by 5 %–10 % mainly in central Europe and the Mediterranean Sea (Fig. 7). The corresponding changes of the number concentrations for the various size ranges N1–10, N10–50, and N50–100 are summarized in Fig. 8. The predicted N1–10 decreases approximately 15 %–20 % for most of Europe except for the Scandinavian peninsula due to the IVOCs. N10–50 decreases 10 %–15 % mainly in southern Europe, and N50–100 changes less than ± 5 % or ± 100 cm−3 in the simulated domain.
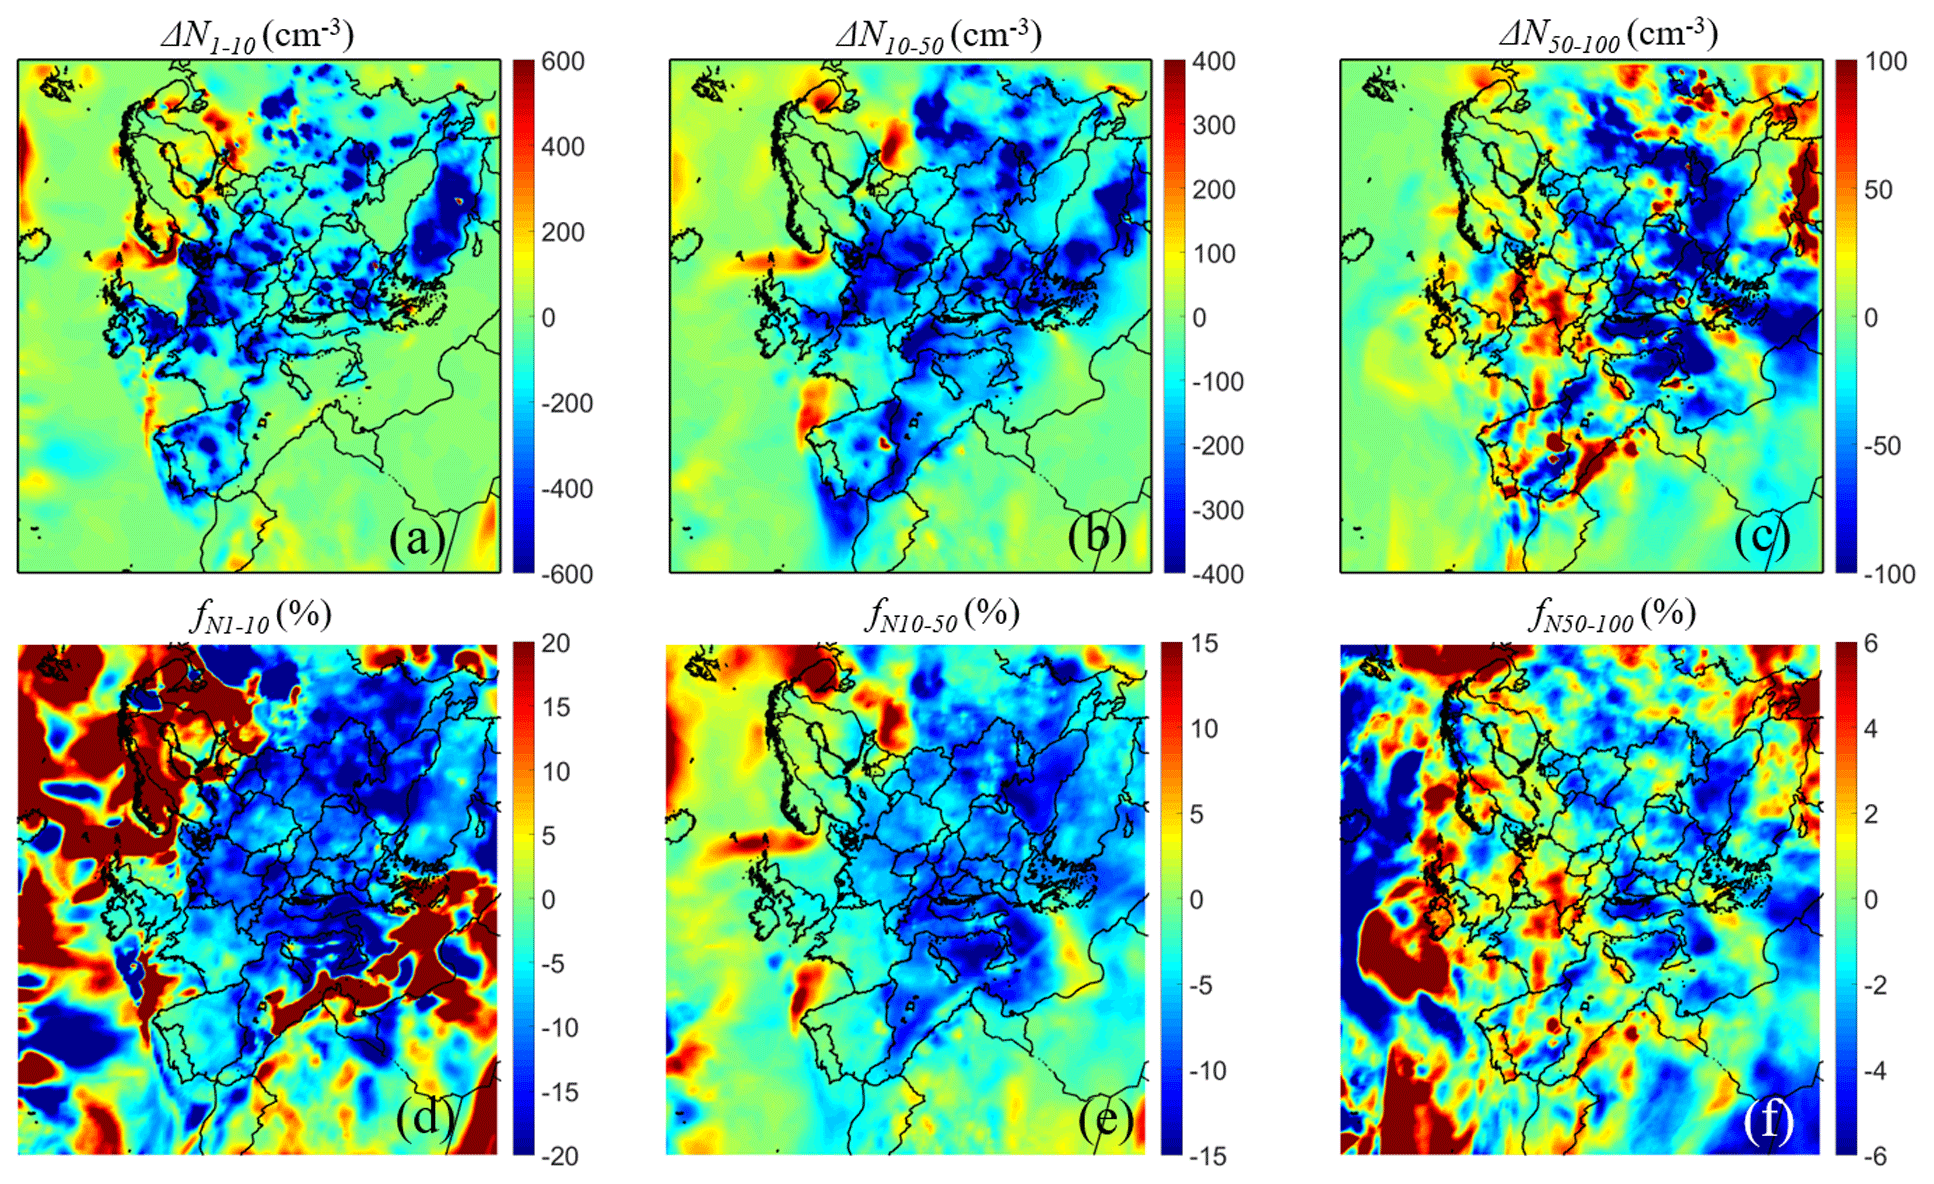
Figure 8Ground level average increase in number concentration (in cm−3) (a–c) and fractional increase () in number concentration (d–f) due to the addition of IVOC emissions predicted from 5 June–8 July 2012 for (a, d) particles between 0.8 and 10 nm (N1–10), (b, e) particles between 10 and 50 nm (N10–50), and (c, f) particles between 50 and 100 nm (N50–100). Different scales are used.
The atmospheric oxidation of the emitted IVOCs produces semivolatile organic compounds, which condense preferentially on particles in the accumulation mode and not so much on the smallest particles due to the Kelvin effect. This results in an increase in both the condensation and coagulation sinks, which then lead to a decrease in the nucleation rate and to an increase of the coagulation loss rate of the smaller particles.
The effect of the addition of the IVOCs on the performance of PMCAMx-UF is modest and mixed. The NMB for N10 increased by 4 % (from 23 % to 27 %) and decreased by 5 % for N100 (from 10 % to 5 %) (Table S7). The corresponding NME for both N10 and N100 changed slightly (approximately 1 %). The modest overall changes in the number distribution of the ultrafine particles caused by the addition of IVOCs and the corresponding aging reactions are consistent with the small changes in the PMCAMx-UF performance metrics.
The addition of the IVOCs and the resulting SOA-iv from their oxidation also had mixed results in the PMCAMx-UF performance for OA in Europe. This added SOA removed the underprediction of OA against the AMS measurements in Italy and Greece; the NMB changed from −18 % when IVOCs were neglected to 2 % when IVOCs were included (Table S8). The NME decreased a little (from 38 % to 35 %) with the IVOC addition. The performance against the OA measurements in the other European sites became a little worse when IVOCs were included in the model (Table S9). The small underprediction (NMB = −8 %) in OA became a larger overprediction (NMB = 20 %), and the NME increased from 50 % to 62 %. These results are characteristic of the uncertainties in primary OA emissions but also SOA production from the various VOCs and IVOCs emitted by anthropogenic and biogenic sources.
A new version of PMCAMx-UF was developed with the ability to simulate the formation and dynamic condensation of ELVOCs during the oxidation of the monoterpenes and the emissions and multi-generational chemistry of IVOCs. The model was applied to the PEGASOS summer intensive period campaign during the summer of 2012. The available measurements included both ground stations across Europe and airborne measurements from a zeppelin over the Po Valley.
The number concentration predictions of PMCAMx-UF are compared against ground measurements from 26 stations in Europe. The model tends to overestimate daily average N10 with a normalized bias of 23 % and an average error of 63 %. PMCAMx-UF performed well for N100 with a low bias (10 %) and an error of 45 %. The performance of the model in the lowest 1 km of the atmosphere above Po Valley for both N10 and N100 was even better than its average performance over Europe. The model's predicted PM1 and PM2.5 concentrations and composition had a NMB of 20 % and errors less than 60 % depending on the PM component. These results suggest that PMCAMx-UF does a reasonable job reproducing the aerosol mass and number concentrations over Europe during the simulated period.
The ELVOCs produced by the monoterpene oxidation contributed, according to the PMCAMx-UF predictions, on average around 0.5 µg m−3 and accounted for 10 %–15 % of the PM2.5 OA. The highest relative predicted increase in OA was 15 %–25 % in northern Europe, while the ELVOC formation increased average OA by approximately 10 % in central Europe.
The ELVOC production by monoterpenes led to surprisingly small changes of the average number concentrations over Europe. The total number concentration decreased by 0.2 %, the N10 decreased by 1.1 %, and N50 increased by 3 % and N100 by 4 % due to this new SOA source. One of the reasons for these small average increases is the nonlinearity of the system, leading to both increases and decreases in different parts of Europe. Even if ELVOCs accelerate the growth of the newly formed particles to larger sizes, in this way increasing their lifetime, at the same time they increase the aerosol mass and surface area as they mostly condense in the accumulation mode. Therefore, they increase the condensation sink, decreasing the sulfuric acid supersaturation and the corresponding nucleation rate. They also increase the coagulation sink and thus accelerate the removal of all nanoparticles.
Locally the effects of the ELVOC production could be higher. For example, it is estimated that the ELVOC productions leads to a decrease in the total particle concentration Ntot by 20 % in parts of the Nordic countries and by 5 % in central Europe. At the same time, the predicted N10 increased by 5 %–15 % (150–400 cm−3) over Finland, northwestern Russia, France, Ireland, and northern Portugal due to these secondary organic compounds. The predicted N50 increased almost everywhere in continental Europe by 50–300 cm−3. This is a 10 % increase in N50 over central Europe and a 20 %–40 % increase over Scandinavia and northwestern Russia.
The addition of IVOC emissions and their aging reactions led to a surprising reduction of the total number of particles (Ntot) and N10 by 10 %–15 % and 5 %–10 %, respectively, and to an increase in the concentration of N100 by 5 %–10 %. In this case semivolatile organic mass is produced, which condenses preferentially on particles in the accumulation mode, increasing the condensation and coagulation sinks and leading to a decrease in the concentration of the sub-10 nm particles.
Field measurement data are available at https://ebas.nilu.no/ (last access: 11 January 2022; EBAS, 2022) and https://actris.nilu.no/ (last access: 11 January 2022; ACTRIS). The zeppelin-relevant San Pietro Capofiume and Bologna data are available at https://doi.org/10.5281/zenodo.4660145 (Lampilahti et al., 2021b). The field datasets for Patras, Thessaloniki, and Costa Navarino can be obtained after request to the authors. The PMCAMx-UF is available from the authors (spyros@chemeng.upatras.gr).
The supplement related to this article is available online at: https://doi.org/10.5194/acp-22-1689-2022-supplement.
DP wrote the code, conducted the simulations, analyzed the results, and wrote the paper. SNP was responsible for the design of the study and the synthesis of the results and contributed to the writing of the paper.
The contact author has declared that neither they nor their co-author has any competing interests.
Publisher's note: Copernicus Publications remains neutral with regard to jurisdictional claims in published maps and institutional affiliations.
The authors would like to thank the PEGASOS team and the members and personnel of the ACTRIS measurement sites. The ACTRIS project has received funding from the European Union Seventh Framework Programme (ACTRIS, FP7/2007-2013, grant agreement no. 262254), and the ACTRIS-2 project has received funding from the European Union's Horizon 2020 research and innovation program under grant agreement no. 654109. We would like to especially thank Pasi Aalto, Andres Alastuey, Benjamin Bergmans, Wolfram Birmili, Miroslav Bitter, Raymond Ellul, Markus Fiebig, Harald Flentje, Spiridon Bezantakos, George Biskos, Evangelos Gerasopoulos, Johannes Groess, Bas Henzing, Nikos Kalivitis, Hans Karlsson, Evangelia Kostenidou, Giorgos Kouvarakis, Markku Kulmala, Fabian Lenartz, Gunter Loeschau, Chris Lunder, Nikos Mihalopoulos, Marcel Moerman, David Munao, Colin O'Dowd, Noemi Perez, Helena Placha, Jean-Philippe Putaud, Alexander Schladitz, Franz Rohrer, Erik Swietlicki, Ralf Tillmann, Thomas Tuch, Kay Weinhold, Alfred Wiedensohler, Vladimir Zdimal, Hans-Christen Hansson, Peter Tunved, and Radovan Krejci for the results of the field measurements.
This work was supported by the project FORCeS funded from the European Union's Horizon 2020 research and innovation program under grant agreement no. 821205. This work was also supported by the Greek PERAN project MIS 5002358.
This paper was edited by Veli-Matti Kerminen and reviewed by two anonymous referees.
Adams, P. J. and Seinfeld, J. H.: Predicting global aerosol size distributions in general circulation models, J. Geophys. Res., 107, 4370, https://doi.org/10.1029/2001JD001010, 2002.
ACTRIS: Database with atmospheric measurement data, ACTRIS [data set], https://actris.nilu.no/, last access: 11 January 2022.
Argueso, D., Hidalgo-Munoz, J. M., Gamiz-Fortis, S. R., and Esteban-Parra, M. J.: Evaluation of WRF parameterizations for climate studies over Southern Spain using a multistep regionalization, J. Climate, 24, 5633–5651, 2011.
Atkinson, R.: Atmospheric chemistry of VOCs and NOx, Atmos. Environ., 34, 2063–2101, 2000.
Atkinson, R. and Arey, J.: Atmospheric degradation of volatile organic compounds, Chem. Rev., 103, 4605–4638, https://doi.org/10.1021/cr0206420, 2003.
Carter, W. P. L.: Documentation of the SAPRC-99 Chemical Mechanism for VOC Reactivity Assessment, Report to California Air Resources Board, https://intra.engr.ucr.edu/~carter/pubs/s99txt.pdf (last access: 11 January 2022), 2000.
Dahneke, B.: Simple Kinetic Theory of Brownian Diffusion in Vapors and Aerosols, in: Theory of Dispersed Multiphase Flow, edited by: Meyer, R. E., Academic Press, New York, 97–133, 1983.
de Gouw, J. A., Middlebrook, A. M., Warneke, C., Goldan, P. D., Kuster, W. C., Roberts, J. M., Fehsenfeld, F. C., Worsnop, D. R., Canagaratna, M. R., Pszenny, A. A. P., Keene, W. C., Marchewka, M., Bertman, S. B., and Bates, T. S.: Budget of organic carbon in a polluted atmosphere: Results from the New England Air Quality Study in 2002, J. Geophys. Res., 110, D16305, https://doi.org/10.1029/2004JD005623, 2005.
de Meij, A., Gzella, A., Cuvelier, C., Thunis, P., Bessagnet, B., Vinuesa, J. F., Menut, L., and Kelder, H. M.: The impact of MM5 and WRF meteorology over complex terrain on CHIMERE model calculations, Atmos. Chem. Phys., 9, 6611–6632, https://doi.org/10.5194/acp-9-6611-2009, 2009.
Denier van der Gon, H. A. C., Visschedijk, A. J. H., Johansson, C., Hedberg Larsson, E., Harrison, R., and Beddows, D.: Size resolved pan European anthropogenic particle number inventory, EUCAARI Deliverable report D141 (available on request from EUCAARI project office), TNO, the Netherlands, 2009.
Docherty, K. S. Stone, E. A., Ulbrich, I. M., DeCarlo, P. F., Snyder, D. C., Schauer, J. J., Peltier, R. E., Weber, R. J., Murphy, S. M., Seinfeld, J. H., Grover, B. D., Eatough, D. J., and Jimenez, J. L.: Apportionment of Primary and Secondary Organic Aerosols in Southern California during the 2005 Study of Organic Aerosols in Riverside (SOAR-1), Environ. Sci. Technol., 42, 7655–7662, 2008.
Donahue, N. M., Robinson, A. L., Stanier, C. O., and Pandis, S. N.: Coupled partitioning, dilution, and chemical aging of semivolatile organics, Environ. Sci. Technol., 40, 2635–2643, 2006.
Donahue, N. M., Epstein, S. A., Pandis, S. N., and Robinson, A. L.: A two-dimensional volatility basis set: 1. organic-aerosol mixing thermodynamics, Atmos. Chem. Phys., 11, 3303–3318, https://doi.org/10.5194/acp-11-3303-2011, 2011.
Dzepina, K., Volkamer, R. M., Madronich, S., Tulet, P., Ulbrich, I. M., Zhang, Q., Cappa, C. D., Ziemann, P. J., and Jimenez, J. L.: Evaluation of recently-proposed secondary organic aerosol models for a case study in Mexico City, Atmos. Chem. Phys., 9, 5681–5709, https://doi.org/10.5194/acp-9-5681-2009, 2009.
EBAS: Database with atmospheric measurement data, EBAS [data set], http://ebas-data.nilu.no, last access: 11 January 2022.
Ehn, M., Thornton, J. A., Kleist, E., Sipilä, M., Junninen, H., Pullinen, I., Springer, M., Rubach, F., Tillmann, R., Lee, B., Lopez-Hilfiker, F., Andres, S., Acir, I. H., Rissanen, M., Jokinen, T., Schobesberger, S., Kangasluoma, J., Kontkanen, J., Nieminen, T., Kurtén, T., Nielsen, L. B., Jørgensen, S., Kjaergaard, H. G., Canagaratna, M., Dal Maso, M., Berndt, T., Petäjä, T., Wahner, A., Kerminen, V. M., Kulmala, M.,Worsnop, D. R., Wildt, J., and Mentel, T. F.: A large source of low-volatility secondary organic aerosol, Nature, 506, 476–479, 2014.
Environ: User's guide to the comprehensive air quality model with extensions (CAMx), version 4.02, report, ENVIRON Int. Corp., Novato, CA 2003.
Fanourgakis, G. S., Kanakidou, M., Nenes, A., Bauer, S. E., Bergman, T., Carslaw, K. S., Grini, A., Hamilton, D. S., Johnson, J. S., Karydis, V. A., Kirkevåg, A., Kodros, J. K., Lohmann, U., Luo, G., Makkonen, R., Matsui, H., Neubauer, D., Pierce, J. R., Schmale, J., Stier, P., Tsigaridis, K., van Noije, T., Wang, H., Watson-Parris, D., Westervelt, D. M., Yang, Y., Yoshioka, M., Daskalakis, N., Decesari, S., Gysel-Beer, M., Kalivitis, N., Liu, X., Mahowald, N. M., Myriokefalitakis, S., Schrödner, R., Sfakianaki, M., Tsimpidi, A. P., Wu, M., and Yu, F.: Evaluation of global simulations of aerosol particle and cloud condensation nuclei number, with implications for cloud droplet formation, Atmos. Chem. Phys., 19, 8591–8617, https://doi.org/10.5194/acp-19-8591-2019, 2019.
Fountoukis, C., Riipinen, I., Denier van der Gon, H. A. C., Charalampidis, P. E., Pilinis, C., Wiedensohler, A., O'Dowd, C., Putaud, J. P., Moerman, M., and Pandis, S. N.: Simulating ultrafine particle formation in Europe using a regional CTM: contribution of primary emissions versus secondary formation to aerosol number concentrations, Atmos. Chem. Phys., 12, 8663–8677, https://doi.org/10.5194/acp-12-8663-2012, 2012.
Garcia-Diez, M., Fernandez, J., Fita, L., and Yague, C.: Seasonal dependence of WRF model biases and sensitivity to PBL schemes over Europe, Q. J. Roy. Meteor. Soc., 139, 501–514, 2012.
Gaydos, T., Pinder, R., Koo, B., Fahey, K., Yarwood, G., and Pandis, S. N.: Development and application of a three-dimensional Chemical Transport Model, PMCAMx, Atmos. Environ., 41, 2594–2611, 2007.
Gaydos, T. M., Stainer, C. O., and Pandis, S. N.: Modeling of in-situ ultrafine atmospheric particle formation in the eastern United State, J. Geophys. Res., 110, D07S12, https://doi.org/10.1029/2004JD004683, 2005.
Gordon, H., Sengupta, K., Rap, A., Duplissy, J., Frege, C., Williamson, C., Heinritzi, M., Simon, M., Yan, C., Almeida, J., Tröstl, J., Nieminen, T., Ortega, I. K., Wagner, R., Dunne, E. M., Adamov, A., Amorim, A., Bernhammer, A.-K., Bianchi, F., Breitenlechner, M., Brilke, S., Chen, X., Craven, J. S., Dias, A., Ehrhart, S., Fischer, L., Flagan, R. C., Franchin, A., Fuchs, C., Guida, R., Hakala, J., Hoyle, C. R., Jokinen, T., Junninen, H., Kangasluoma, J., Kim, J., Kirkby, J., Krapf, M., Kürten, A., Laaksonen, A., Lehtipalo, K., Makhmutov, V., Mathot, S., Molteni, U., Monks, S. A., Onnela, A., Peräkylä, O., Piel, F., Petäjä, T., Praplan, A. P., Pringle, K. J., Richards, N. A. D., Rissanen, M. P., Rondo, L., Sarnela, N., Schobesberger, S., Scott, C. E., Seinfeld, J. H., Sharma, S., Sipilä, M., Steiner, G., Stozhkov, Y., Stratmann, F., Tomé, A., Virtanen, A., Vogel, A. L., Wagner, A. C., Wagner, P. E., Weingartner, E., Wimmer, D., Winkler, P. M., Ye, P., Zhang, X., Hansel, A., Dommen, J., Donahue, N. M., Worsnop, D. R., Baltensperger, U., Kulmala, M., Curtius, J., and Carslaw, K. S.: Reduced anthropogenic aerosol radiative forcing caused by biogenic new particle formation, P. Natl. Acad. Sci. USA, 113, 12053–12058, 2016.
Guenther, A., Karl, T., Harley, P., Wiedinmyer, C., Palmer, P. I., and Geron, C.: Estimates of global terrestrial isoprene emissions using MEGAN (Model of Emissions of Gases and Aerosols from Nature), Atmos. Chem. Phys., 6, 3181–3210, https://doi.org/10.5194/acp-6-3181-2006, 2006.
Hallquist, M., Wenger, J. C., Baltensperger, U., Rudich, Y., Simpson, D., Claeys, M., Dommen, J., Donahue, N. M., George, C., Goldstein, A. H., Hamilton, J. F., Herrmann, H., Hoffmann, T., Iinuma, Y., Jang, M., Jenkin, M. E., Jimenez, J. L., Kiendler-Scharr, A., Maenhaut, W., McFiggans, G., Mentel, Th. F., Monod, A., Prévôt, A. S. H., Seinfeld, J. H., Surratt, J. D., Szmigielski, R., and Wildt, J.: The formation, properties and impact of secondary organic aerosol: current and emerging issues, Atmos. Chem. Phys., 9, 5155–5236, https://doi.org/10.5194/acp-9-5155-2009, 2009.
Hamed, A., Joutsensaari, J., Mikkonen, S., Sogacheva, L., Dal Maso, M., Kulmala, M., Cavalli, F., Fuzzi, S., Facchini, M. C., Decesari, S., Mircea, M., Lehtinen, K. E. J., and Laaksonen, A.: Nucleation and growth of new particles in Po Valley, Italy, Atmos. Chem. Phys., 7, 355–376, https://doi.org/10.5194/acp-7-355-2007, 2007.
Im, U., Markakis, K., Unal, A., Kindap, T., Poupkou, A., Incecik, S., Yenigun, O., Melas, D., Theodosi, C., and Mihalopoulos, N.: Study of a winter PM episode in Istanbul using the high resolution WRF/CMAQ modeling system, Atmos. Environ., 44, 3085–3094, 2010.
Jimenez-Guerrero, P., Jorba, O., Baldasano, J. M., and Gasso, S.: The use of a modelling system as a tool for air quality management: Annual high-resolution simulations and evaluation, Sci. Total Environ., 390, 323–340, 2008.
Jokinen, T., Berndt, T., Makkonen, R., Kerminen, V.-M., Junninen, H., Paasonen, P., Stratmann, F., Herrmann, H., Guenther, A. B., Worsnop, D. R., Kulmala, M., Ehn, M., and Sipilä, M.: Production of extremely low volatile organic compounds from biogenic emissions: Measured yields and atmospheric implications, P. Natl. Acad. Sci. USA, 112, 7123–7128, 2015.
Jung, J., Adams, P. J., and Pandis, S. N.: Simulating the size distribution and chemical composition of ultrafine particles during nucleation events, Atmos. Environ., 40, 2248–2259, 2006.
Jung, J. G., Fountoukis, C., Adams, P. J. and Pandis, S. N.: Simulation of in situ ultrafine particle formation in the eastern United States using PMCAMx-UF, J. Geophys. Res., 115, D03203, https://doi.org/10.1029/2009jd012313, 2010.
Kanakidou, M., Seinfeld, J. H., Pandis, S. N., Barnes, I., Dentener, F. J., Facchini, M. C., Van Dingenen, R., Ervens, B., Nenes, A., Nielsen, C. J., Swietlicki, E., Putaud, J. P., Balkanski, Y., Fuzzi, S., Horth, J., Moortgat, G. K., Winterhalter, R., Myhre, C. E. L., Tsigaridis, K., Vignati, E., Stephanou, E. G., and Wilson, J.: Organic aerosol and global climate modelling: a review, Atmos. Chem. Phys., 5, 1053–1123, https://doi.org/10.5194/acp-5-1053-2005, 2005.
Karydis, V. A., Tsimpidi, A. P., and Pandis, S. N.: Evaluation of a three-dimensional chemical transport model (PMCAMx) in the eastern United States for all four seasons, J. Geophys. Res., 112, D14211, https://doi.org/10.1029/2006JD007890, 2007.
Kirkby, J., Duplissy, J., Sengupta, K., Frege, C., Gordon, H., Williamson, C., Heinritzi, M., Simon, M., Yan, C., Almeida, J., Tröstl, J., Nieminen, T., Ortega, I. K., Wagner, R., Adamov, A., Amorim, A., Bernhammer, A.-K., Bianchi, F., Breitenlechner, M., Brilke, S., Chen, X., Craven, J., Dias, A., Ehrhart, S., Flagan, R. C., Franchin, A., Fuchs, C., Guida, R., Hakala, J., Hoyle, C. R., Jokinen, T., Junninen, H., Kangasluoma, J., Kim, J., Krapf, M., Kürten, A., Laaksonen, A., Lehtipalo, K., Makhmutov, V., Mathot, S., Molteni, U., Onnela, A., Peräkylä, O., Piel, F., Petäjä, T., Praplan, A. P., Pringle, K., Rap, A., Richards, N. A. D., Riipinen, I., Rissanen, M. P., Rondo, L., Sarnela, N., Schobesberger, S., Scott, C. E., Seinfeld, J. H., Sipilä, M., Steiner, G., Stozhkov, Y., Stratmann, F., Tomé, A., Virtanen, A., Vogel, A. L., Wagner, A. C., Wagner, P. E., Weingartner, E., Wimmer, D., Winkler, P. M., Ye, P., Zhang, X., Hansel, A., Dommen, J., Donahue, N. M., Worsnop, D. R., Baltensperger, U., Kulmala, M., Carslaw, K. S., and Curtius, J.: Ion-induced nucleation of pure biogenic particles, Nature, 533, 521–526, https://doi.org/10.1038/nature17953, 2016.
Kleinman, L. I., Springston, S. R., Daum, P. H., Lee, Y.-N., Nunnermacker, L. J., Senum, G. I., Wang, J., Weinstein-Lloyd, J., Alexander, M. L., Hubbe, J., Ortega, J., Canagaratna, M. R., and Jayne, J.: The time evolution of aerosol composition over the Mexico City plateau, Atmos. Chem. Phys., 8, 1559–1575, https://doi.org/10.5194/acp-8-1559-2008, 2008.
Kostenidou, E., Florou, K., Kaltsonoudis, C., Tsiflikiotou, M., Vratolis, S., Eleftheriadis, K., and Pandis, S. N.: Sources and chemical characterization of organic aerosol during the summer in the eastern Mediterranean, Atmos. Chem. Phys., 15, 11355–11371, https://doi.org/10.5194/acp-15-11355-2015, 2015.
Kroll, J. H., Ng, N. L., Murphy, S. M., Flagan, R. C., and Seinfeld, J. H.: Secondary organic aerosol formation from isoprene photooxidation, Environ. Sci. Technol., 40, 155–162, 2006.
Kulmala, M., Vehkamaki, H., Petaja, T., Dal Maso, M., Lauri, A., Kerminen, V.-M., Birmili, W., and McMurry, P. H.: Formation and growth of ultrafine atmospheric particles: A review of observations, J. Aerosol Sci., 35, 143–176, 2004.
Kulmala, M., Asmi, A., Lappalainen, H. K., Baltensperger, U., Brenguier, J.-L., Facchini, M. C., Hansson, H.-C., Hov, Ø., O'Dowd, C. D., Pöschl, U., Wiedensohler, A., Boers, R., Boucher, O., de Leeuw, G., Denier van der Gon, H. A. C., Feichter, J., Krejci, R., Laj, P., Lihavainen, H., Lohmann, U., McFiggans, G., Mentel, T., Pilinis, C., Riipinen, I., Schulz, M., Stohl, A., Swietlicki, E., Vignati, E., Alves, C., Amann, M., Ammann, M., Arabas, S., Artaxo, P., Baars, H., Beddows, D. C. S., Bergström, R., Beukes, J. P., Bilde, M., Burkhart, J. F., Canonaco, F., Clegg, S. L., Coe, H., Crumeyrolle, S., D'Anna, B., Decesari, S., Gilardoni, S., Fischer, M., Fjaeraa, A. M., Fountoukis, C., George, C., Gomes, L., Halloran, P., Hamburger, T., Harrison, R. M., Herrmann, H., Hoffmann, T., Hoose, C., Hu, M., Hyvärinen, A., Hõrrak, U., Iinuma, Y., Iversen, T., Josipovic, M., Kanakidou, M., Kiendler-Scharr, A., Kirkevåg, A., Kiss, G., Klimont, Z., Kolmonen, P., Komppula, M., Kristjánsson, J.-E., Laakso, L., Laaksonen, A., Labonnote, L., Lanz, V. A., Lehtinen, K. E. J., Rizzo, L. V., Makkonen, R., Manninen, H. E., McMeeking, G., Merikanto, J., Minikin, A., Mirme, S., Morgan, W. T., Nemitz, E., O'Donnell, D., Panwar, T. S., Pawlowska, H., Petzold, A., Pienaar, J. J., Pio, C., Plass-Duelmer, C., Prévôt, A. S. H., Pryor, S., Reddington, C. L., Roberts, G., Rosenfeld, D., Schwarz, J., Seland, Ø., Sellegri, K., Shen, X. J., Shiraiwa, M., Siebert, H., Sierau, B., Simpson, D., Sun, J. Y., Topping, D., Tunved, P., Vaattovaara, P., Vakkari, V., Veefkind, J. P., Visschedijk, A., Vuollekoski, H., Vuolo, R., Wehner, B., Wildt, J., Woodward, S., Worsnop, D. R., van Zadelhoff, G.-J., Zardini, A. A., Zhang, K., van Zyl, P. G., Kerminen, V.-M., S Carslaw, K., and Pandis, S. N.: General overview: European Integrated project on Aerosol Cloud Climate and Air Quality interactions (EUCAARI) – integrating aerosol research from nano to global scales, Atmos. Chem. Phys., 11, 13061–13143, https://doi.org/10.5194/acp-11-13061-2011, 2011.
Lampilahti, J., Manninen, H. E., Nieminen, T., Mirme, S., Ehn, M., Pullinen, I., Leino, K., Schobesberger, S., Kangasluoma, J., Kontkanen, J., Järvinen, E., Väänänen, R., Yli-Juuti, T., Krejci, R., Lehtipalo, K., Levula, J., Mirme, A., Decesari, S., Tillmann, R., Worsnop, D. R., Rohrer, F., Kiendler-Scharr, A., Petäjä, T., Kerminen, V.-M., Mentel, T. F., and Kulmala, M.: Zeppelin-led study on the onset of new particle formation in the planetary boundary layer, Atmos. Chem. Phys., 21, 12649–12663, https://doi.org/10.5194/acp-21-12649-2021, 2021a.
Lampilahti, J., Manninen, H. E., Nieminen, T., Mirme, S., Ehn, M., Pullinen, I., Leino, K., Schobesberger, S., Kangasluoma, J., Kontkanen, J., Järvinen, E., Väänänen, R., Yli-Juuti, T., Krecji, R., Lehtipalo, K., Levula, J., Mirme, A., Decesari, S., Tillmann, R., Worsnop, D. R., Rohrer, F., Petäjä, T., Kerminen, V.-M., Mentel, T. F., and Kulmala, M.: Zeppelin-led study on the onset of new particle formation in the planetary boundary layer: dataset, Version 1.0.0, Zenodo [data set], https://doi.org/10.5281/zenodo.4660145, 2021b.
Lane, T. E., Donahue, N. M., and Pandis, S. N.: Simulating secondary organic aerosol formation using the volatility basis-set approach in a chemical transport model, Atmos. Environ., 42, 7439–7451, 2008.
Makkonen, R., Asmi, A., Korhonen, H., Kokkola, H., Järvenoja, S., Räisänen, P., Lehtinen, K. E. J., Laaksonen, A., Kerminen, V.-M., Järvinen, H., Lohmann, U., Bennartz, R., Feichter, J., and Kulmala, M.: Sensitivity of aerosol concentrations and cloud properties to nucleation and secondary organic distribution in ECHAM5-HAM global circulation model, Atmos. Chem. Phys., 9, 1747–1766, https://doi.org/10.5194/acp-9-1747-2009, 2009.
Mann, G. W., Carslaw, K. S., Spracklen, D. V., Ridley, D. A., Manktelow, P. T., Chipperfield, M. P., Pickering, S. J., and Johnson, C. E.: Description and evaluation of GLOMAP-mode: a modal global aerosol microphysics model for the UKCA composition-climate model, Geosci. Model Dev., 3, 519–551, https://doi.org/10.5194/gmd-3-519-2010, 2010.
Matsui, H., Koike, M., Takegawa, N., Kondo, Y., Griffin, R. J., Miyazaki, Y., Yokouchi, Y., and Ohara, T.: Secondary organic aerosol formation in urban air: Temporal variations and possible contributions from unidentified hydrocarbons, J. Geophys. Res., 114, D04201, https://doi.org/10.1029/2008JD010164, 2009.
Merikanto, J., Spracklen, D. V., Mann, G. W., Pickering, S. J., and Carslaw, K. S.: Impact of nucleation on global CCN, Atmos. Chem. Phys., 9, 8601–8616, https://doi.org/10.5194/acp-9-8601-2009, 2009.
Mikuška, P., Večeřa, Z., Bartošíková, A., and Maenhaut, W.: Annular diffusion denuder for simultaneous removal of gaseous organic compounds and air oxidants during sampling of carbonaceous aerosols, Anal. Chim. Acta, 714, 68–75, 2012.
Murphy, B. N. and Pandis, S. N.: Simulating the formation of semivolatile primary and secondary organic aerosol in a regional chemical transport model gas-phase chemistry of OA species, Environ. Sci. Technol., 43, 4722–4728, 2009.
Napari, I., Noppel, M., Vehkamaki, H., and Kulmala, M.: Parameterization of ternary nucleation rates for H2SO4-NH3-https://doi.org/H_{2}O vapors, J. Geophys. Res., 107, 4381, https://doi.org/10.1029/2002JD002132, 2002.
Nenes, A., Pandis, S. N., and Pilinis, C.: ISORROPIA: a new thermodynamic equilibrium model for multiphase multicomponent inorganic aerosols, Aquat. Geochem., 4, 123–152, 1998.
Ng, N. L., Kroll, J. H., Keywood, M. D., Bahreini, R., Varutbangkul, V., Flagan, R. C., and Seinfeld, J. H.: Contribution of first-versus second-generation products to secondary organic aerosols formed in the oxidation of biogenic hydrocarbons, Environ. Sci. Technol., 40, 2283–2297, 2006.
Odum, J. R., Hoffmann, T., Bowman, F. A., Collins, D., Flagan, R. C., and Seinfeld, J. H.: Gas/particle partitioning and secondary organic aerosol yields, Environ. Sci. Technol., 30, 2580–2585, 1996.
O'Dowd, C. D., Langmann, B., Varghese, S., Scannell, C., Ceburnis, D., and Facchini, M. C.: A combined organic-inorganic sea-spray source function, Geophys. Res. Lett., 35, L01801, https://doi.org/10.1029/2007GL030331, 2008.
Olenius, T., Yli-Juuti, T., Elm, J, Kontkanen, J., and Riipinen, I.: New particle formation and growth: creating a new atmospheric phase interface, in: Physical Chemistry of Gas-Liquid Interfaces, edited by: Faust, J. A. and House, J. E., Elsevier, 315–352, 2018.
Pandis, S. N., Wexler, A. S., and Seinfeld, J. H.: Secondary organic aerosol formation and transport. 2. Predicting the ambient secondary organic aerosol size distribution, Atmos. Environ., 27A, 2403–2416, 1993.
Pathak, R. K., Presto, A. A., Lane, T. E., Stanier, C. O., Donahue, N. M., and Pandis, S. N.: Ozonolysis of α-pinene: parameterization of secondary organic aerosol mass fraction, Atmos. Chem. Phys., 7, 3811–3821, https://doi.org/10.5194/acp-7-3811-2007, 2007.
Patoulias, D., Fountoukis, C., Riipinen, I., and Pandis, S. N.: The role of organic condensation on ultrafine particle growth during nucleation events, Atmos. Chem. Phys., 15, 6337–6350, https://doi.org/10.5194/acp-15-6337-2015, 2015.
Patoulias, D., Fountoukis, C., Riipinen, I., Asmi, A., Kulmala, M., and Pandis, S. N.: Simulation of the size-composition distribution of atmospheric nanoparticles over Europe, Atmos. Chem. Phys., 18, 13639–13654, https://doi.org/10.5194/acp-18-13639-2018, 2018.
Pierce, J. R. and Adams, P. J.: A computationally efficient aerosol nucleation/condensation method: Pseudo-steady state sulfuric acid, Aerosol Sci. Tech., 43, 216–226, 2009.
Pierce, J. R., Riipinen, I., Kulmala, M., Ehn, M., Petäjä, T., Junninen, H., Worsnop, D. R., and Donahue, N. M.: Quantification of the volatility of secondary organic compounds in ultrafine particles during nucleation events, Atmos. Chem. Phys., 11, 9019–9036, https://doi.org/10.5194/acp-11-9019-2011, 2011.
Presto, A. A. and Donahue, N. M.: Investigation of a-pinene+ozone secondary organic aerosol formation at low total aerosol mass, Environ. Sci. Technol., 40, 3536–3543, 2006.
Rissanen, M. P., Kurtén, T., Sipilä, M., Thornton, J. A., Kangasluoma, J., Sarnela, N., Junninen, H., Jørgensen, S., Schallhart, S., Kajos, M. K., Taipale, R., Springer, M., Mentel, T. F., Ruuskanen, T., Petäjä, T., Worsnop, D. R., Kjaergaard, H. G., and Ehn, M.: The formation of highly oxidized multifunctional products in the ozonolysis of cyclohexene, J. Am. Chem. Soc., 136, 15596–15606, 2014.
Robinson, A. L., Donahue, N. M., Shrivastava, M. K., Weitkamp, E. A., Sage, A. M., Grieshop, A. P., Lane, T. E., Pandis, S. N., and Pierce, J. R.: Rethinking organic aerosols: semivolatile emissions and photochemical aging, Science, 315, 1259–1262, 2007.
Schulze, B. C., Wallace, H. W., Flynn, J. H., Lefer, B. L., Erickson, M. H., Jobson, B. T., Dusanter, S., Griffith, S. M., Hansen, R. F., Stevens, P. S., VanReken, T., and Griffin, R. J.: Differences in BVOC oxidation and SOA formation above and below the forest canopy, Atmos. Chem. Phys., 17, 1805–1828, https://doi.org/10.5194/acp-17-1805-2017, 2017.
Seinfeld, J. H. and Pandis, S. N.: Atmospheric Chemistry and Physics: From Air Pollution to Climate Change, 2nd edn., John Wiley and Sons, Hoboken, NJ, 2006.
Sengupta, K., Pringle, K., Johnson, J. S., Reddington, C., Browse, J., Scott, C. E., and Carslaw, K.: A global model perturbed parameter ensemble study of secondary organic aerosol formation, Atmos. Chem. Phys., 21, 2693–2723, https://doi.org/10.5194/acp-21-2693-2021, 2021.
Shrivastava, M. K., Lane, T. E., Donahue, N. M., Pandis, S. N., and Robinson, A. L.: Effects of gas-particle partitioning and aging of primary emissions on urban and regional organic aerosol concentrations, J. Geophys. Res., 113, D18301, https://doi.org/10.1029/2007JD009735, 2008.
Shrivastava, M., Thornton, J., Cappa, C., Fan, J., Goldstein, A., Guenther, A., Jimenez, J. L., Kuang, C., Laskin, A., Martin, S., Ng, N. L., Petaja, T., Pierce, J., Rasch, P., Roldin, P., Seinfeld, J., Shilling, J., Smith, J., Volkamer, R., Wang, J., Worsnop, D., Zaveri, R., Zelenyuk, A., and Zhang, Q.: Recent advances in understanding secondary organic aerosols: implications for global climate forcing, Rev. Geophys., 55, 509–559, 2017.
Skamarock, W. C., Klemp, J. B., Dudhia, J., Gill, D. O., Barker, D. M., Wang, W., and Powers, J. G.: A Description of the Advanced Research WRF Version 2, NCAR Technical Note, University Corporation for Atmospheric Research, https://doi.org/10.5065/D6DZ069T, 2005.
Sofiev, M., Vankevich, R., Lanne, M., Koskinen, J., and Kukkonen, J.: On integration of a Fire Assimilation System and a chemical transport model for near-real-time monitoring of the impact of wild-land fires on atmospheric composition and air quality, Modelling, Monitoring and Management of Forest Fires, WIT Trans. Ecol. Envir., 119, 343–351, 2008a.
Sofiev, M., Lanne, M., Vankevich, R., Prank, M., Karppinen, A., and Kukkonen, J.: Impact of wild-land fires on European air quality in 2006–2008, Modelling, Monitoring and Management of Forest Fires, WIT Trans. Ecol. Envir., 119, 353–361, 2008b.
Sogacheva, L., Hamed, A., Facchini, M. C., Kulmala, M., and Laaksonen, A.: Relation of air mass history to nucleation events in Po Valley, Italy, using back trajectories analysis, Atmos. Chem. Phys., 7, 839–853, https://doi.org/10.5194/acp-7-839-2007, 2007.
Spracklen, D. V., Pringle, K. J., Carslaw, K. S., Chipperfield, M. P., and Mann, G. W.: A global off-line model of size-resolved aerosol microphysics: I. Model development and prediction of aerosol properties, Atmos. Chem. Phys., 5, 2227–2252, https://doi.org/10.5194/acp-5-2227-2005, 2005.
Stanier, C. O., Pathak, R. K., and Pandis, S. N.: Measurements of the volatility of aerosols from a-pinene ozonolysis, Environ. Sci. Technol., 41, 2756–2763, 2007.
Turpin, B. J., Saxena, P., and Andrews, E.: Measuring and simulating particulate organics in the atmosphere: problems and prospects, Atmos. Environ., 34, 2983–3013, 2000.
Vehkamäki, H., Kulmala, M., Napari, I., Lehtinen, K. E. J., Timmreck, C., Noppel, M., and Laaksonen, A.: An improved parameterization for sulfuric acid-water nucleation rates for tropospheric and stratospheric conditions, J. Geophys. Res., 107, 4622–4632, 2002.
Visschedijk, A. J. H., Zandveld, P., and Denier van der Gon, H. A. C.: TNO Report 2007 A-R0233/B: A high resolution gridded European emission database for the EU integrated project GEMS, Organization for Applied Scientific Research, the Netherlands, 2007.
Volkamer, R., Jimenez, J. L., San Martini, F., Dzepina, K., Zhang, Q., Salcedo, D., Molina, L. T., Worsnop, D. R., and Molina, M. J.: Secondary organic aerosol formation from anthropogenic air pollution: Rapid and higher than expected, Geophys. Res. Lett., 33, L17811, https://doi.org/10.1029/2006GL026899, 2006.
Wang, M. and Penner, J. E.: Aerosol indirect forcing in a global model with particle nucleation, Atmos. Chem. Phys., 9, 239–260, https://doi.org/10.5194/acp-9-239-2009, 2009.
Yli-Juuti, T., Mohr, C., and Riipinen, I.: Open questions on atmospheric nanoparticle growth, Commun. Chem., 3, 106, https://doi.org/10.1038/s42004-020-00339-4, 2020.
Yu, F. and Luo, G.: Simulation of particle size distribution with a global aerosol model: contribution of nucleation to aerosol and CCN number concentrations, Atmos. Chem. Phys., 9, 7691–7710, https://doi.org/10.5194/acp-9-7691-2009, 2009.
Zhang, Q., Jimenez, J. L., Canagaratna, M. R., Allan, J. D., Coe, H., Ulbrich, I., Alfarra, M. R., Takami, A., Middlebrook, A. M., Sun, Y. L., Dzepina, K., Dunlea, E., Docherty, K., DeCarlo, P. F., Salcedo, D., Onasch, T., Jayne, J. T., Miyoshi, T., Shimono, A., Hatakeyama, S., Takegawa, N., Kondo, Y., Schneider, J., Drewnick, F., Borrmann, S., Weimer, S., Demerjian, K., Williams, P., Bower, K., Bahreini, R., Cottrell, L., Griffin, R. J., Rautiainen, J., Sun, J. Y., Zhang, Y. M., and Worsnop, D. R.: Ubiquity and dominance of oxygenated species in organic aerosols in anthropogenically-influenced Northern Hemisphere midlatitudes, Geophys. Res. Lett., 34, L13801, https://doi.org/10.1029/2007GL029979, 2007.