the Creative Commons Attribution 4.0 License.
the Creative Commons Attribution 4.0 License.
 | 22 Dec 2022
An evaluation of biomass burning aerosol mass, extinction, and size distribution in GEOS using observations from CAMP2Ex
Allison B. Marquardt Collow
Virginie Buchard
Peter R. Colarco
Arlindo M. da Silva
Ravi Govindaraju
Edward P. Nowottnick
Sharon Burton
Richard Ferrare
Chris Hostetler
Luke Ziemba
Biomass burning aerosol impacts aspects of the atmosphere and Earth system through direct and semi-direct effects, as well as influencing air quality. Despite its importance, the representation of biomass burning aerosol is not always accurate in numerical weather prediction and climate models or reanalysis products. Using observations collected as part of the Cloud, Aerosol and Monsoon Processes Philippines Experiment (CAMP2Ex) in August through October of 2019, aerosol concentration and optical properties are evaluated within the Goddard Earth Observing System (GEOS) and its underlying aerosol module, GOCART. In the operational configuration, GEOS assimilates aerosol optical depth observations at 550 nm from AERONET and MODIS to constrain aerosol fields. Particularly for biomass burning aerosol, without the assimilation of aerosol optical depth, aerosol extinction is underestimated compared to observations collected in the Philippines region during the CAMP2Ex campaign. The assimilation process adds excessive amounts of carbon to account for the underestimated extinction, resulting in positive biases in the mass of black and organic carbon, especially within the boundary layer, relative to in situ observations from the Langley Aerosol Research Group Experiment. Counteracting this, GEOS is deficient in sulfate and nitrate aerosol just above the boundary layer. Aerosol extinction within GEOS is a function of the mass of different aerosol species, the ambient relative humidity, the assumed spectral optical properties, and particle size distribution per species. The relationship between dry and ambient extinction in GEOS reveals that hygroscopic growth is too high within the model for biomass burning aerosol. An additional concern lies in the assumed particle size distribution for GEOS, which has a single mode radius that is too small for organic carbon. Variability in the observed particle size distribution for biomass burning aerosol within a single flight also illuminates the fact that a single assumed particle size distribution is not sufficient and that for a proper representation, a more advanced aerosol module within GEOS may be necessary.
- Article
(2867 KB) - Full-text XML
-
Supplement
(1442 KB) - BibTeX
- EndNote


Aerosols are an important component of the Earth system due to their role in direct and semi-direct effects and impact on air quality. It is therefore essential to be able to accurately capture their optical properties, transport, and overall life cycle in Earth system models. Field campaigns provide valuable data that can be used to evaluate models. One such field campaign, the Cloud, Aerosol and Monsoon Processes Philippines Experiment (CAMP2Ex) in 2019, was based out of the Philippines and had the opportunistic timing of being able to collect observations focused on the interaction of clouds, aerosols, and radiation before, during, and after the transition of the southwest monsoon of the South China Sea. Boreal summer in the Philippines region is characterized by winds out of the southwest (Wang et al., 2009) that transport biomass burning aerosol into the Sulu Sea and Philippine Sea (Xian et al., 2013). The Maritime Continent, particularly Borneo and Sumatra, is susceptible to peatland fires during this time of year, which are exacerbated by drought and El Niño conditions (Reid et al., 2012; Yin, 2020). Depending on the large-scale circulation, smoke can be the primary pollutant. Otherwise, the relatively clean marine air mass can be polluted by plumes of urban aerosols, either locally from the Philippines or transported from Asia. Heating due to biomass burning aerosol has been shown to feed back onto dynamics within the atmosphere, altering vertical motion and therefore vertical profiles of gases such as water vapor and carbon monoxide (Ott et al., 2010). Aside from the direct radiative effect on radiation (e.g., Chang et al., 2021), smoke can have a semi-direct effect in which the frequency of clouds is altered (Mallet et al., 2020; Ding et al., 2021). Additionally, properties of biomass burning aerosols play a role in cloud condensation nuclei concentration, their activation, and droplet formation (Chen et al., 2019; Li, 2019; Kacarab et al., 2020; Zheng et al., 2020).
A common issue with climate models with respect to biomass burning aerosol is that it tends to be too absorbing (Brown et al., 2021). However, variability exists in single-scattering albedo (SSA), or the fraction of radiation that is scattered as opposed to absorbed, among models due to assumptions for aerosol size distributions, mixing state, and refractive indices (Shinozuka et al., 2020; Brown et al., 2021). An additional source of uncertainty within models is the emission of biomass burning aerosols (Pan et al., 2020; Gliß et al., 2021). Emissions may even be tuned to achieve desirable values for total aerosol optical depth (Petrenko et al., 2017). Varying complexities of parameterizations for secondary organic aerosol (SOA) and the aging of organic aerosol result in a spread of organic aerosol loadings and lifetimes within models (Tsigaridis, 2014). Aging characteristics of carbon have been found to be particularly important for modeling the direct aerosol forcing of black carbon (Wang et al., 2018). Carbonaceous aerosols can have a wide array of characteristics depending on their source. Carbon emitted through the combustion of wood can have a much lower water uptake than other fuels such as diesel (Wang et al., 2020), and absorption properties are dependent on the chemical composition of the fuel type (Tang et al., 2020). It is therefore important to distinguish between organic carbon that is emitted from fires as opposed to other emission sources and use appropriate optical properties for each type of carbon.
One Earth system model that is subject to these uncertainties is the Goddard Earth Observing System (GEOS), with the underlying Goddard Chemistry Aerosol Radiation and Transport (GOCART) model (Chin et al., 2002, 2004; Colarco et al., 2010). A recent development aimed at improving the representation of biomass burning aerosol in GOCART is the introduction of a brown carbon species (Colarco et al., 2017). Amid ongoing development in the physical parameterizations within GEOS, it is important to evaluate changes that are made to GOCART as aerosols feed back into the Earth system through clouds and radiation. Although two-moment cloud microphysics are not used in the operational version of GEOS at this time, providing accurate representations of aerosol mass is a necessity for experimental GEOS simulations with two-moment microphysics (Barahona et al., 2014). Using the wealth of observational data collected during CAMP2Ex, an assessment is made of the GEOS modeled aerosol mass, vertical distribution, extinction, and particle size distribution. Section 2 discusses the in situ and remote sensing instruments aboard the aircraft during CAMP2Ex that are crucial for detailing aerosol characteristics as well as the model simulations performed using GEOS. Results are presented in Sect. 3: from the perspective of the entire field campaign in Sect. 3.1 and for a case study using a flight transect through aged biomass burning aerosol in Sect. 3.2. Conclusions are given in Sect. 4 as are recommendations for development within GEOS and GOCART to improve future simulations of biomass burning aerosol.
2.1 Observations
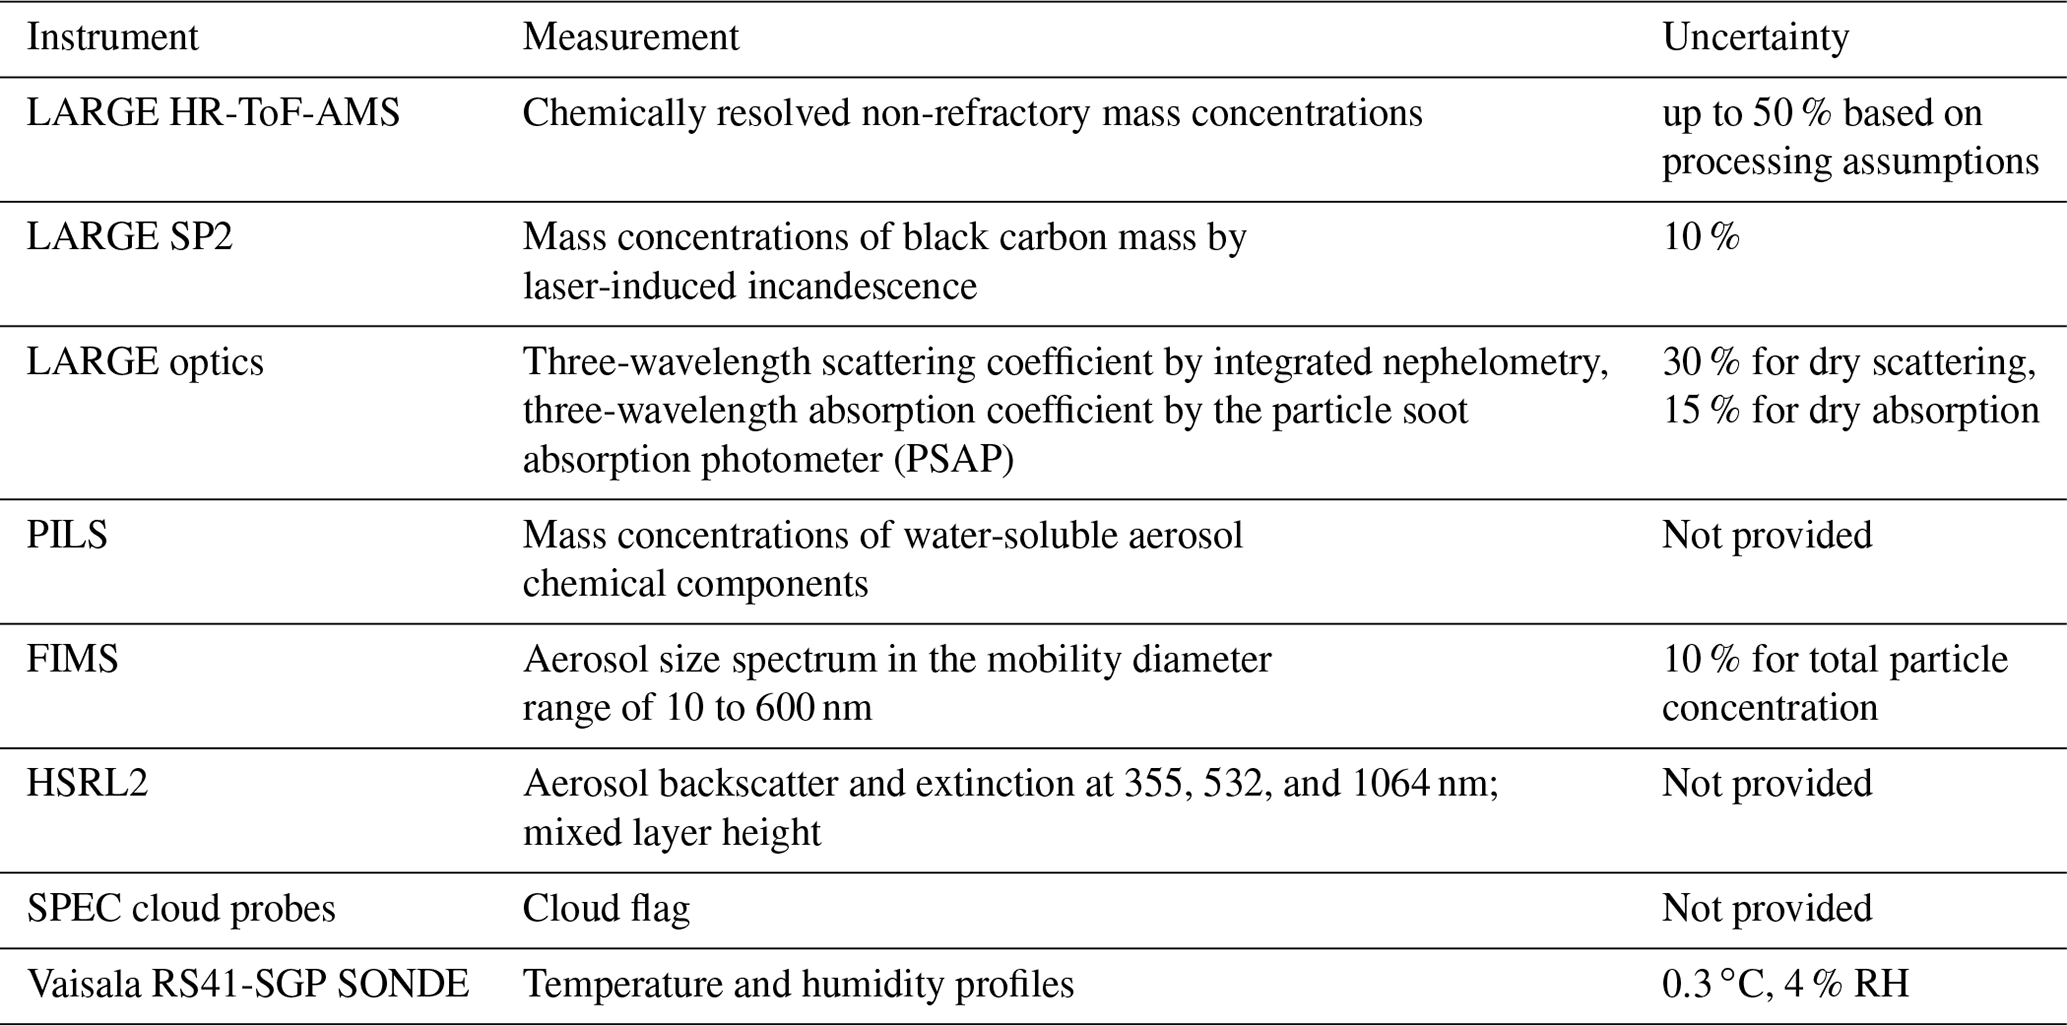
Based out of Luzon, Philippines, the NASA P3 aircraft completed 19 research flights throughout the period of 25 August 2019 through 5 October 2019. Flight tracks focused on two main regions, with the first half of the campaign concentrated near Luzon and southward into the Sulu Sea, while the second half included numerous flights to the north and east over the Philippine Sea. The P3 payload incorporated in situ and remote sensing instruments ideal for characterizing aerosols in addition to instrumentation for meteorology, clouds, precipitation, trace gases, and radiation (NASA ASDC, 2020). Here, we make use of the NASA Langley Aerosol Research Group Experiment (LARGE) suite of instruments, particle size distribution from a fast integrated mobility spectrometer (FIMS; Kulkarni and Wang, 2006; Wang et al., 2017), and aerosol scattering profiles from the second-generation High Spectral Resolution Lidar (HSRL2) (Burton et al., 2018) as summarized in Table 1. Additional details including spatial and temporal resolution of the observations can be found in Edwards et al. (2022). Chemical composition of the non-refractory submicron aerosol was provided by the LARGE high-resolution time-of-flight aerosol mass spectrometer (HR-ToF-AMS, Aerodyne Research, Inc.), while the optics array included nephelometers (TSI Inc., model 3563) and a particle soot absorption photometer (PSAP, Radiance Research) that provided scattering and absorption coefficients at three wavelengths, respectively. Ambient scattering was computed using the observed dry scattering, the growth factor fRH, and the ambient relative humidity. The mass concentration of black carbon was measured separately using the LARGE single-particle soot photometer (SP2, Droplet Measurement Technologies). Due to aerodynamic limitations of the sampling inlet, observations from the LARGE suite were only representative of particles smaller than 5 µm in aerodynamic diameter (McNaughton et al., 2006). There is high uncertainty of up to 50 % in the aerosol mass concentrations observed by the AMS. Uncertainty for AMS-derived mass concentrations is driven by variability in the instrument collection efficiency (CE), which is a scalar term with typical values from 0.5 to 1.0 for the standard conical tungsten vaporizer, depending on particle composition and phase (Hu et al., 2018). For CAMP2Ex analysis, mass concentrations are derived using a constant value of 1.0 based on comparison with independent measurements from a particle-into-liquid sampler (PILS). Still, a conservative value of 50 % uncertainty is used to account for the unknown CE and is generally consistent with other aircraft AMS measurements (Bahreini et al., 2009). In addition, inconsistencies between measured mass concentrations and optical properties suggest the presence of significant submicron refractory mass (for which the HR-ToF-AMS is insensitive) or the potential for particle losses within the tubing of the instrumentation leading to underestimates in aerosol mass. For these reasons, we have not used this dataset to quantitatively relate aerosol mass to radiative extinction through the mass extinction efficiency. Sea salt was assumed to be 3.27 times the mass concentration of sodium (Bian et al., 2019), as measured by PILS. To avoid contamination due to clouds, observations collected by LARGE were filtered using a cloud flag provided by SPEC (Stratton Park Engineering Company) cloud probes. Following both passive and active drying, the aerosol size distribution was observed by FIMS at a temporal resolution of 1 Hz for diameters ranging from 10 to 600 nm. The HSRL2 provided aerosol backscatter and extinction at 355, 532, and 1064 nm. Mixed layer height was derived from the HSRL2 backscatter (Scarino et al., 2014). A chemical influence flag, derived from the observed ratio of methane and carbon monoxide (https://doi.org/10.5067/Airborne/CAMP2Ex_TraceGas_AircraftInSitu_P3_Data_1; NASA/LARC/SD/ASDC, 2020), was used to determine the presence of biomass burning aerosol for the analysis of particle size distribution. 1 min averages were used for all observational data, apart from the HSRL2 aerosol backscatter observations, which have a temporal resolution of 10 s.
Table 1Observational data used in this study along with their uncertainty.
CAMP2Ex was accompanied by the Propagation of Intraseasonal Oscillations (PISTON) field campaign, which consisted of a suite of observations collected aboard the R/V Sally Ride (Chudler and Rutledge, 2021). The Sally Ride was positioned in international waters to the northeast of the Philippines coincident with the time period of CAMP2Ex flights. Here we make use of the radiosonde launches from the cruise to classify the thermodynamic environment of the lower troposphere.
2.2 Model simulations
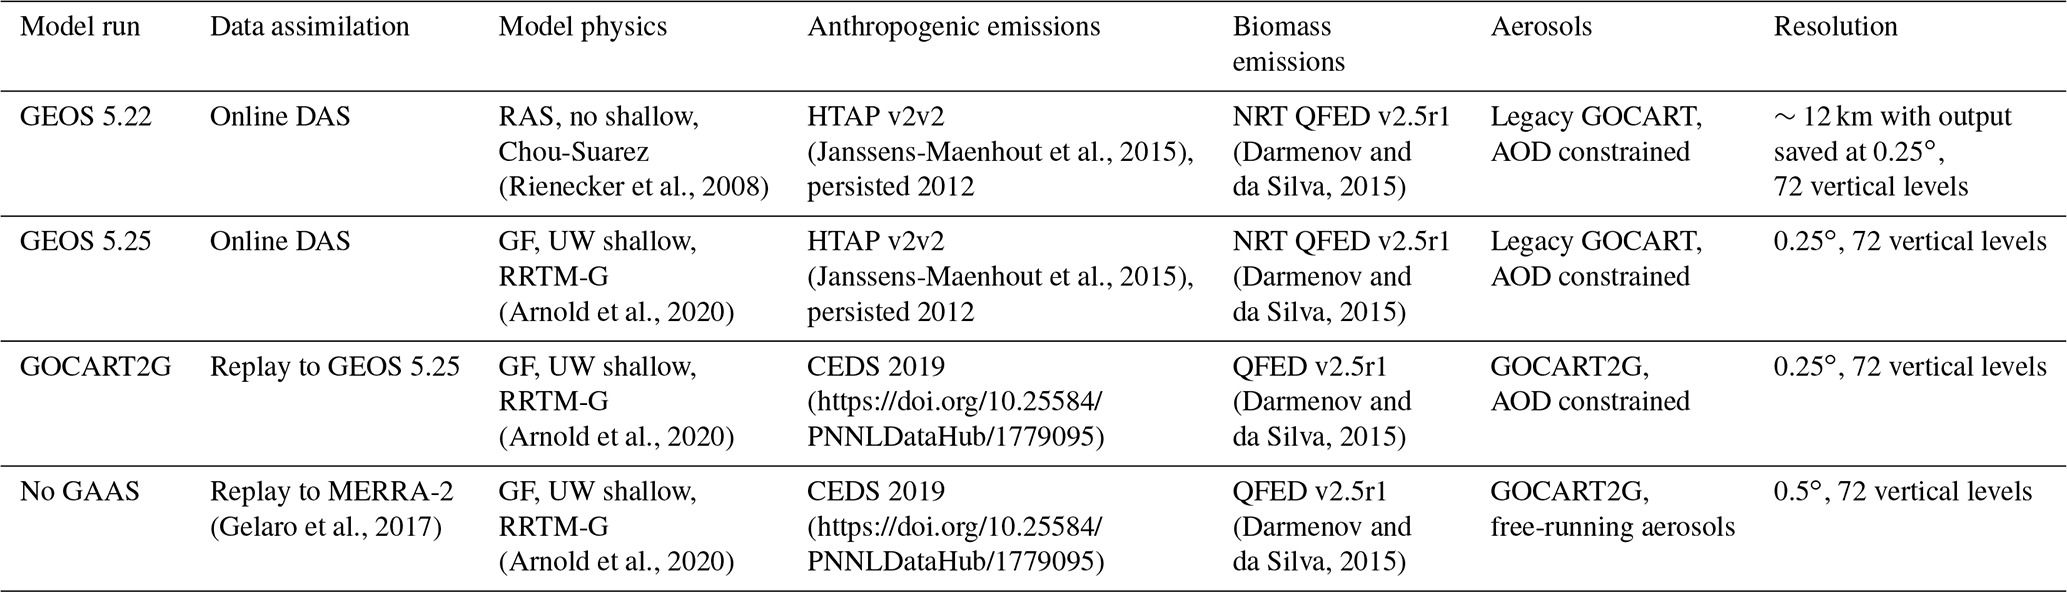
During the CAMP2Ex campaign, analyses and forecasts of meteorology and aerosols were provided by the GEOS Forward Processing (FP) system version 5.22. Since the campaign, numerous updates have been incorporated into GEOS pertaining to the model physics, data assimilation, and the aerosol module. We have implemented these updates incrementally, as summarized in Table 2, to determine the impact of each component on the simulation of aerosols during CAMP2Ex. For comparison to the observations, GEOS was properly sampled along the flight track using the 1 min average observational files (Collow et al., 2020).
Within GEOS, aerosols are governed by the GOCART module (Chin et al., 2002, 2004; Colarco et al., 2010). This module simulates the transport and optical properties of externally mixed hydrophobic and hydrophilic organic and black carbon, sulfate, three size bins for nitrate (implemented in the same manner as Bian et al., 2017), five size bins for sea salt, and five size bins for dust. To implement updates and allow for future development, the (legacy) GOCART module code was refactored and termed “GOCART2G”. GOCART2G now includes brown carbon as a new radiatively interactive species. Following Colarco et al. (2017), biomass burning emissions of organic aerosol are assigned to the brown carbon species, while other anthropogenic and biogenic sources are assigned to the legacy organic carbon tracer. A new mechanism for secondary production of both brown and organic carbon is adopted based on oxidation of volatile organic compound (VOCs) scaled to carbon monoxide emissions following Hodzic and Jimenez (2011). Brown carbon is treated chemically the same as organic carbon in GOCART2G but is assigned optical properties that have spectrally varying absorption in the shortwave, consistent with observations from the space-based Ozone Monitoring Instrument (Colarco et al., 2017). Other aerosol species' optical properties are primarily based on the Optical Properties of Aerosols and Clouds (OPAC) database described by Hess et al. (1998), except dust, which is based on Colarco et al. (2014). Details pertaining to the optics lookup tables can be found in Table S4 in the Supplement. Sulfate, black carbon, brown carbon, and organic carbon are assumed to have a lognormal size distribution with number mode radii for dry particles of 0.0695, 0.0188, 0.0212, and 0.0212 µm, respectively, and a geometric standard deviation of 2.03, 2, 2.2, and 2.2, respectively. Aerosol optical depth (AOD) at 550 nm is constrained using the Goddard Aerosol Assimilation System (GAAS) (Buchard et al., 2015; Randles et al., 2017). Bias-corrected AOD observations at 550 nm from the Moderate Resolution Imaging Spectroradiometer (MODIS) aboard Terra and Aqua are assimilated in all the models of Table 1 except “No GAAS”. GEOS 5.22 also assimilates AOD from the Aerosol Robotic Network (AERONET) (Holben et al., 1998). Methodology for aerosol assimilation in GEOS is described in Sect. 3 of Randles et al. (2017). In brief, an analysis splitting technique is used to obtain increments for the AOD, and the prognostic speciated aerosol mass is adjusted accordingly.
The underlying meteorology from GEOS is used for horizontal and vertical transport as well as deposition of all the aerosol species, in addition to wind-driven emissions of dust and sea salt. Significant changes were made to the model physics beginning with GEOS 5.25 (Table 2) that have direct impacts on aerosols (Arnold et al., 2020). The Chou–Suarez radiation scheme was replaced with the Rapid Radiation Transfer Model for general circulation model applications (RRTMG), which increased the number of spectral bands from 19 to 30 (Norris et al., 2020). With regards to convection, a shallow convection scheme was introduced, and deep convection previously handled by the relaxed Arakawa and Schubert (RAS) scheme was replaced by the Grell–Freitas (GF) parameterization (Freitas et al., 2020). Additionally, convective-scale wet removal and transport of aerosol are now handled within the convective parameterizations instead of inside GOCART (Arnold et al., 2020). The changes in convection have the potential to alter the vertical transport of aerosols as well as relative humidity, which is passed to the optics lookup table to determine aerosol scattering and extinction. The meteorology was constrained in two manners. GEOS 5.22 and GEOS 5.25 used an online data assimilation system (DAS) that ran at the same time as the general circulation model to produce an analysis. For the GOCART2G and No GAAS simulations, the analysis produced from a previous simulation was used to nudge the meteorology without the computational burden, often referred to as a “replay”.
Table 2Model simulations performed with GEOS. Aerosol optical lookup tables are the same for all simulations.
3.1 Campaign-wide
3.1.1 Lower troposphere meteorology
As discussed in Sect. 2.2, upgrades were made to the model physics, particularly the convection, that impact the vertical transport of aerosols, wet deposition, and their extinction through changes in the relative humidity. Lower tropospheric temperature and humidity before and after the changes were implemented are compared to the PISTON sondes in Fig. 1. A cool bias is present in both GEOS 5.22 and GEOS 5.25 in the lowest 4 km. While some improvement in the bias can be seen between 2 and 4 km in GEOS 5.25, it is evident that there is a degradation in temperature below 2 km with the updated model physics (Fig. 1a). The same is true for the vertical profile of specific humidity. A dry bias was greatly improved above 1 km in GEOS 5.25; however, the dry bias became exacerbated near the surface (Fig. 1b).
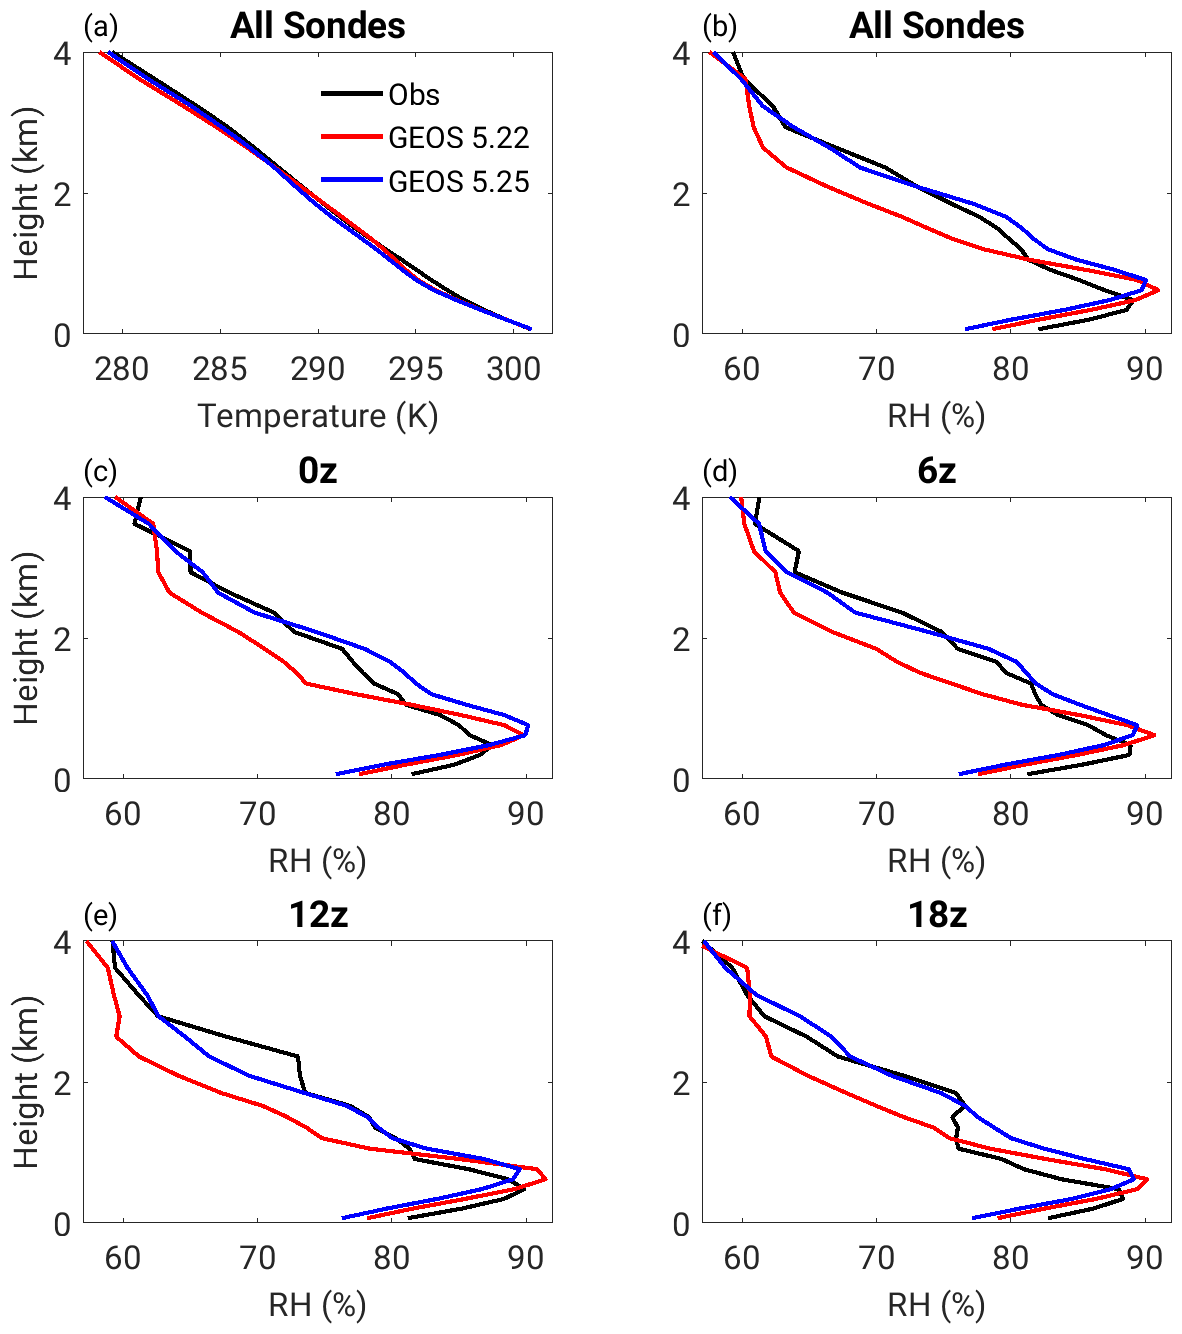
Figure 1Vertical profile of (a) temperature and (b) relative humidity biases with respect to all PISTON sonde relative humidities at (c) 00:00Z (0z), (d) 06:00Z (6z), (e) 12:00Z (12z), and (f) 18:00Z (18z) from the PISTON sondes GEOS 5.22 and GEOS 5.25.
The diurnal cycle of the planetary boundary layer (PBL) and lower troposphere is evaluated in panels (c) through (f) of Fig. 1 using relative humidity. Relative humidity was selected for this evaluation since it is used in the optics lookup tables for the modeled aerosols. The Philippines are 8 h ahead of coordinated universal time such that 0z (Fig. 1c) represents a morning profile, while 12z (Fig. 1e) represents an evening profile. GEOS 5.25 has difficulty capturing the inversion that develops during the daytime hours of 12:00Z (12z) and 18:00Z (18z). While there is a hint of an inversion in GEOS 5.22, it is located too high. This is likely due to deficiencies in the turbulence parameterizations in GEOS as well as the coarse vertical resolution.
3.1.2 Aerosols
The temporal evolution of aerosols in the Philippines region is evaluated using observations of daily mean AOD from two AERONET stations in the area in Fig. 2. Located on the island of Luzon, Manila served as the base of operations for the campaign, while Tai Ping is an island within the South China Sea. Both stations reported AOD at 500 nm. The Ångström exponent for 440 and 675 nm was used to convert to the AOD at 550 nm for comparison to GEOS. Routine observation of AOD in the region is a challenge due to frequent cloudiness, and this resulted in a lack of observations in Manila prior to late September. It is possible that the larger values of AOD plotted for Manila are biased high due to cloud contamination or due to localized urban emissions not in the CEDS emissions dataset.
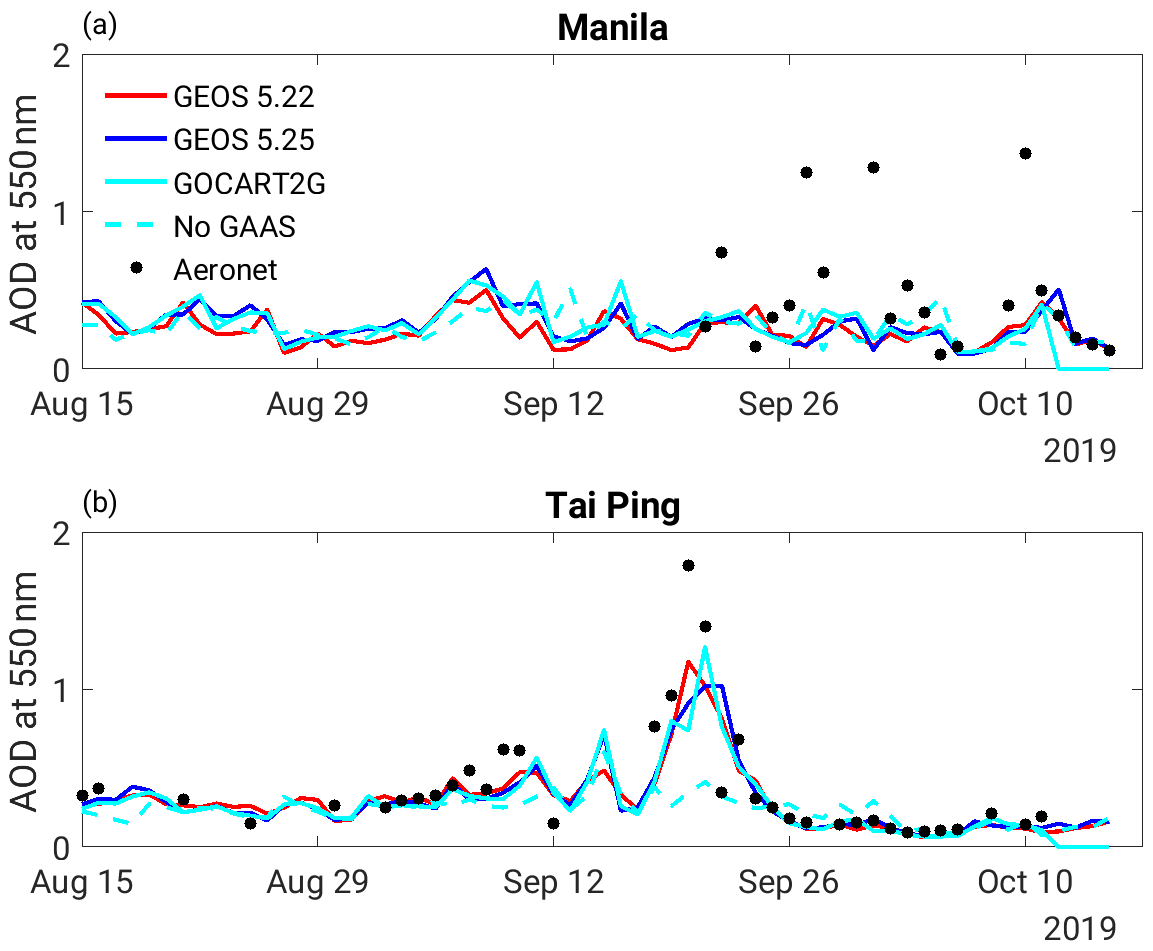
Figure 2Time series of aerosol optical depth at 550 nm from AERONET sites in (a) Manila (Philippines) and (b) Tai Ping Island as well as the corresponding time series from GEOS 5.22, GEOS 5.25, GOCART2G, and GOCART2G without GAAS.
Profiles of aerosol backscatter below the aircraft were collected along the flight paths by the HSRL2 at three wavelengths: 355, 532, and 1064 nm. For reference, mixed layer height (MLH) from the HSRL2 and PBL height from GEOS have been added to Fig. 3 due to the importance of the height of the boundary layer for the vertical profile of aerosol mass and extinction. The native terminology for the data products, MLH and PBLH, has been retained to reinforce the fact that these quantities are not computed in the same manner. The height of the PBL is too high in GEOS as confirmed by the profiles of relative humidity in Fig. 1 and the height of maximum backscatter in Fig. 3. The three versions of GEOS with AOD assimilation are nearly indistinguishable (Fig. S2 in the Supplement), and for this reason, only the final GOCART2G simulation is shown in Fig. 3. GEOS suffers from a negative bias in aerosol backscatter above the boundary layer between 1 and 2 km and a positive bias at the top of the boundary layer. This trend is consistent at all three wavelengths but most apparent at 355 nm (Fig. 3a). Within the boundary layer itself, the agreement between GEOS and the observations is wavelength-dependent. The model does not have enough backscatter at 355 nm, yet there is too much backscatter at 1064 nm. This indicates that there is either an underlying error in the aerosol speciation or within the GOCART optics tables. However, the wavelength-dependent bias likely points to the particle size distribution as the underlying discrepancy since coarser aerosol particles have an increased scattering efficiency at larger wavelengths. Subtle differences in the backscatter are present between the GEOS versions. While the differences may not be statistically significant, the combination of physics and aerosol updates made in GEOS 5.25 and GOCART2G resulted in a slight improvement in backscatter within the PBL at 355 and 1064 nm (Fig. S2).
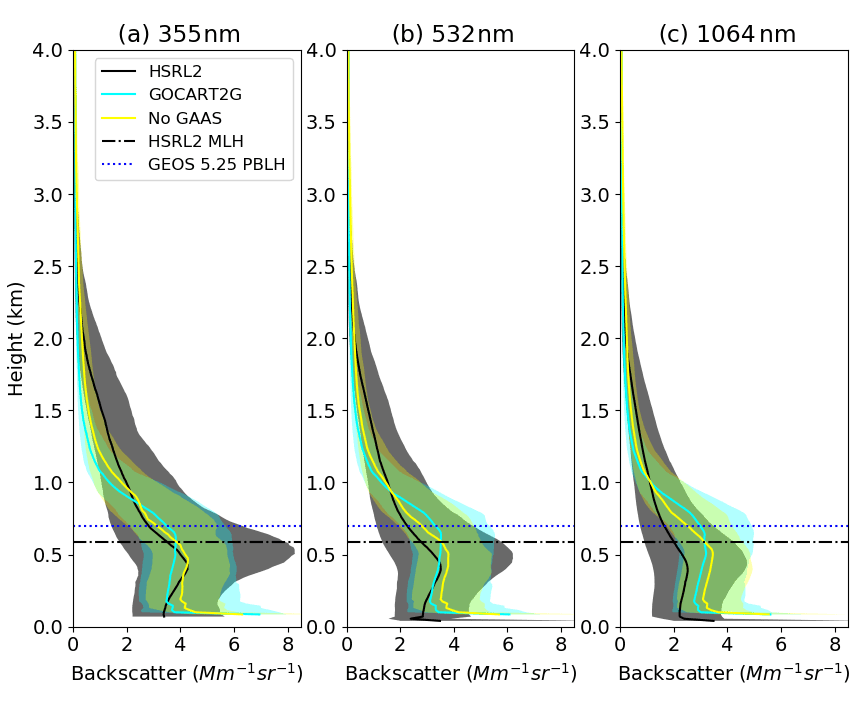
Figure 3Median backscatter at (a) 355 nm, (b) 532nm, and 1064 nm during all research flights from the HSRL2, GOCART2G, and GOCART2G without aerosol assimilation (No GAAS). Profiles are shaded between the 25th and 75th percentiles. Mixed layer height (MLH) from the HSRL2 and planetary boundary layer (PBL) height in GEOS are added for reference as dashed lines. Note that PBL height for GOCART2G is the same as GEOS 5.25. An analogous figure with all model simulations can be found in the Supplement.
Aerosol extinction was derived from the molecular channel signal as described by Hair et al. (2008). Although the results in Fig. 4 are qualitatively similar to the backscatter shown in Fig. 3, additional information can be gained by analyzing extinction. With respect to extinction at the two shorter wavelengths, there is a larger impact of the change in relative humidity between GEOS 5.22 and GEOS 5.25 than the aerosol updates implemented in GOCART2G. At 355 and 532 nm (Fig. 4a and b), the magnitude of the maximum extinction within the column at the 75th percentile for GOCART2G compares well to the 75th percentile for the HSRL2, although the peak extinction is located too high due to the height of the boundary layer in the model. Although the median is overestimated, there is some benefit of the updates made in GOCART with respect to aerosol extinction. It is also evident that the lidar ratio, or the ratio of the extinction to backscatter coefficient, differs with and without the assimilation of AOD, indicating there is some impact of the AOD assimilation on the aerosol speciation.
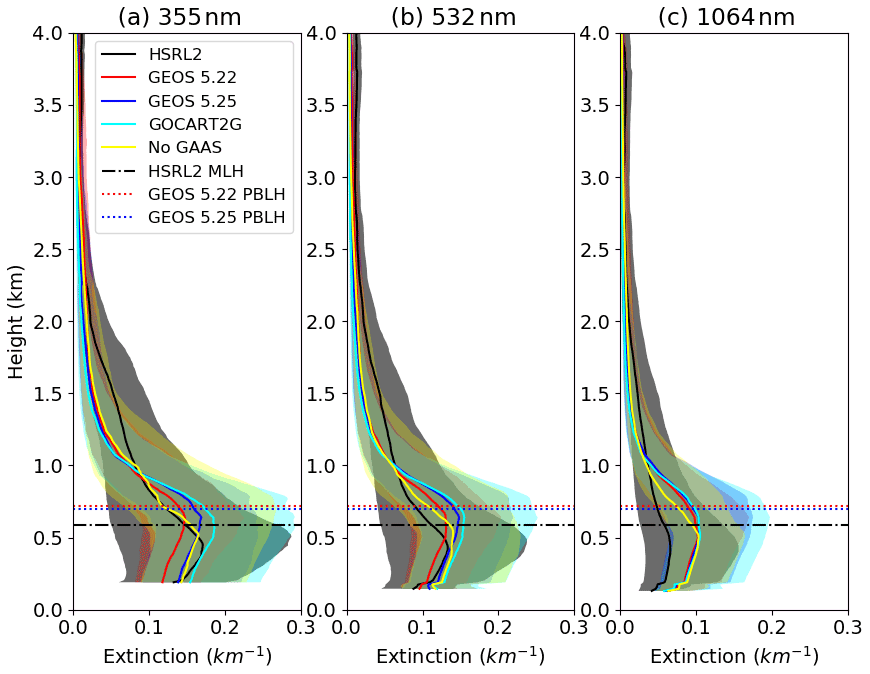
Figure 4Median extinction at (a) 355 nm, (b) 532 nm, and 1064 nm during all research flights from the HSRL2, GEOS 5.22, GEOS 5.25, GOCART2G, and GOCART2G without aerosol assimilation (No GAAS). Profiles are shaded between the 25th and 75th percentiles. Mixed layer height (MLH) from the HSRL2 and planetary boundary layer (PBL) height in GEOS are added for reference as dashed lines. Note that PBL height for GOCART2G is the same as GEOS 5.25.
A more in-depth assessment of aerosol extinction can be made by filtering the 532 nm extinction by the HSRL2-derived aerosol type (Burton et al., 2012). Five aerosol types are considered here based on aerosol types typically present in the Philippines region: marine, polluted marine, smoke, fresh smoke, and urban pollution. The sample size for each aerosol type can be found in the Supplement, as can the GEOS aerosol speciation for each HSRL2-derived aerosol type. Due to the limited sample size above 2 km (Fig. S3), only the bottom 2 km is shown in Fig. 5. We focus on the GOCART2G and No GAAS simulations due to the previously noted similarities among the GEOS runs. Unsurprisingly, smoke stands out as having the largest extinction (Fig. 5e); however, this could also be related to the fact that it has the smallest sample size of the aerosol types. Smoke is also responsible for a negative bias in GEOS and the largest difference between the runs with and without the assimilation of AOD through GAAS. This could indicate deficiencies in the model's smoke optical properties and transport (i.e., the smoke plume is not in the correct location without the data assimilation) or uncertainties in the biomass burning emissions. The vertical profiles in extinction for fresh smoke and urban pollution are similar perhaps since the HSRL2 can have difficulty distinguishing between the two aerosol types (Fig. 5c and d; Burton et al., 2012). This could be the case between smoke and urban pollution as well, as indicated by the consistent model biases between the two aerosol types with a slight underestimation of extinction within the boundary layer. Given that there is a slight positive bias in GEOS when all aerosol types are considered, it is worth further investigating the cancellation of errors from marine, biomass burning, and urban aerosols.
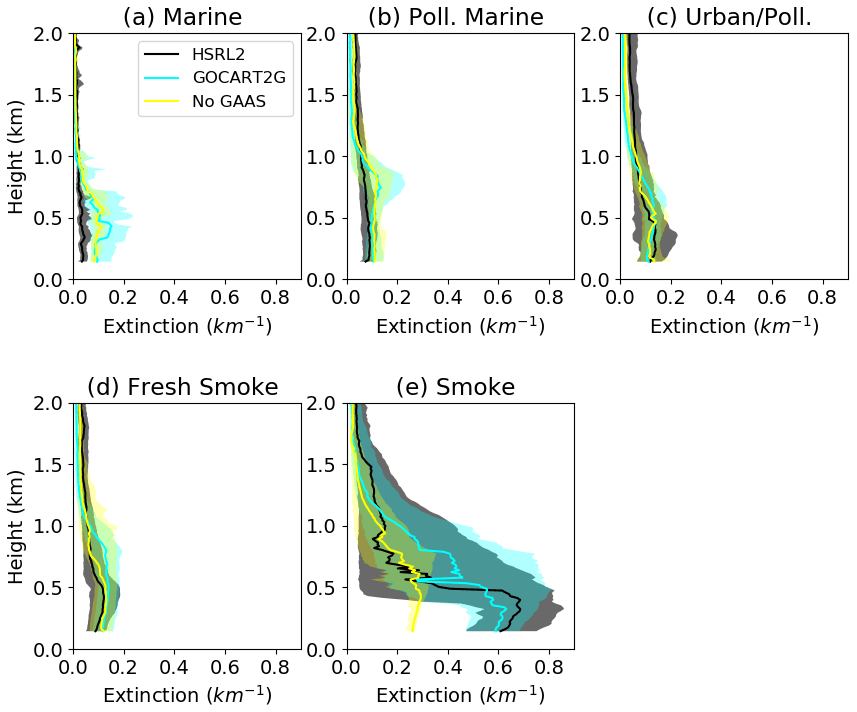
Figure 5Median extinction at 532 nm during all research flights from the HSRL2, GOCART2G, and GOCART2G without aerosol assimilation (No GAAS) filtered based on the HSRL2 aerosol ID for (a) marine, (b) polluted marine, (c) urban pollution, (d) fresh smoke, and (e) smoke aerosols. Profiles are shaded between the 25th and 75th percentiles. An analogous figure with all GEOS simulations can be found in the Supplement.
Unlike the remote sensing capabilities of the HSRL2, the LARGE optical suite of instruments is in situ and can provide a direct comparison between extinction and aerosol composition. This comes at the cost of a much smaller data sample that is only representative of fine particles that are efficiently sampled by the inlet. The modeled aerosols were subsampled such that only particles with an aerodynamic diameter less than 5 µm were included in the extinction and scattering calculations for comparison to LARGE. As a result of the smaller sample size, the campaign-wide vertical profile for median 532 nm extinction is not as smooth and extinction within the boundary layer is noticeably smaller (Fig. 6a). An evaluation of individual flights demonstrated that agreement between the in situ and remotely sensed extinction was better on flights that captured biomass burning aerosol, likely because the composition was dominated by fine particles as opposed to coarser nitrate, sea salt, and dust (not shown). Results for the LARGE in situ extinction are consistent with the HSRL2 comparison. All GEOS versions underestimate extinction around 2 km and overestimate extinction at the top of the boundary layer; however, this overestimation extends down to the surface.
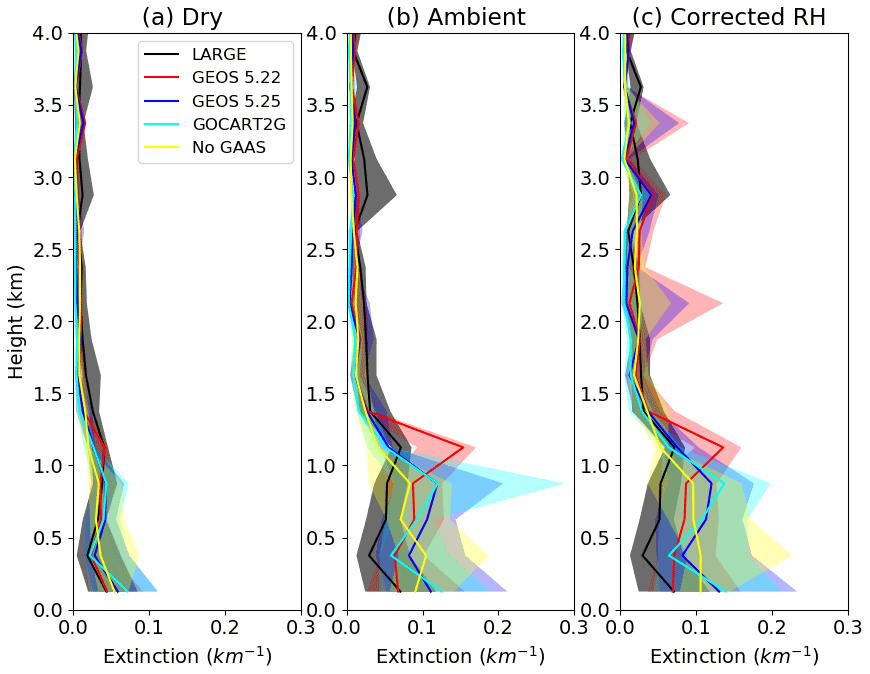
Figure 6Median extinction at 532 nm for all research flights from LARGE and GOCART2G for (a) ambient, (b) dry, and (c) observation-corrected relative humidity. Profiles are shaded between the 25th and 75th percentiles.
The contribution of relative humidity to the overestimation of extinction in the boundary layer can be assessed through the dry extinction in which the aerosols are dried to at least 40 % relative humidity before being passed to the optical instrument. Dry extinction in GEOS 5.22 is in excellent agreement with the observations, though GEOS 5.25 and GOCART2G also perform well (Fig. 6a). On the contrary, GEOS overestimates 532 nm extinction under ambient conditions (Fig. 6b). Another way to investigate the role of relative humidity in GEOS is to bias-correct the relative humidity by running the GOCART optics code using the model's aerosol mass concentration but replacing the relative humidity with what was observed by the aircraft (Fig. 6c). Except for a decrease in the extinction at the top of the PBL in GEOS 5.22 and a small increase in extinction in all GEOS runs, there is little change in the representation of extinction through correcting the relative humidity. This is not limited to GEOS as minimal improvement occurred through correcting RH biases in the Navy Aerosol Analysis and Prediction System Reanalysis (NAAPS-RA) (Edwards et al., 2022). These results suggest that the discrepancy in ambient extinction is a result of model treatment of particle hygroscopicity and less dependent on aerosol concentration (i.e., loading) or relative humidity.
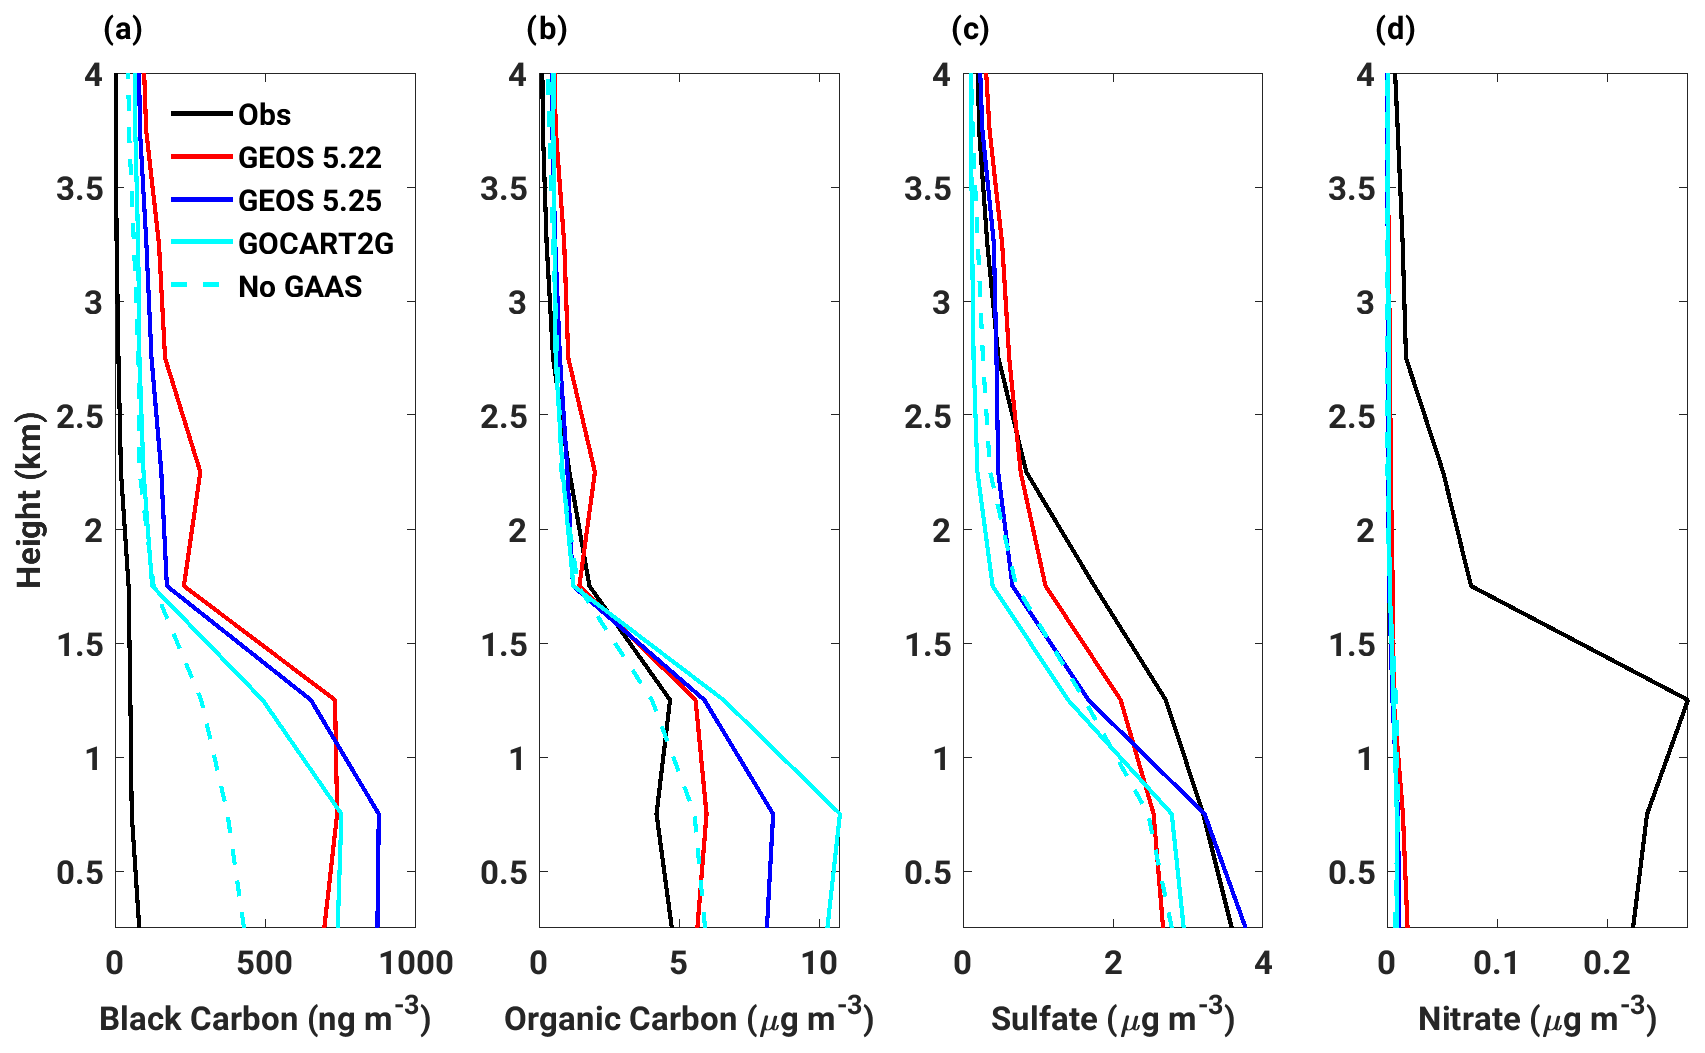
Figure 7Mean vertical profile of aerosol mass concentration from the LARGE observations, GEOS 5.22, GEOS 5.25, GOCART2G, and GOCART2G without GAAS for (a) black carbon, (b) organic carbon, (c) sulfate, and (d) nitrate.
Not only is the aerosol mass concentration overestimated in GEOS, but the speciation also disagrees with the LARGE observations (Fig. 7). GEOS greatly overestimates black carbon in the lowest 4 km (Fig. 7a). While the mass concentration of black carbon was reduced above the boundary layer by instituting the convection updates in GEOS 5.25, it led to an additional build-up of black carbon in the boundary layer. A beneficial reduction in black carbon occurred with the GOCART2G updates, which is a direct result of a lower scaling factor for the biomass burning emissions. The impact of the assimilation of AOD can be seen by comparing the lines for GOCART2G and No GAAS. Above the boundary layer, the two runs are essentially the same. Without GAAS turned on, the black carbon is already excessive, yet the AOD for the column is too low. The assimilation of aerosol optical depth results in an increase in black carbon mass and a doubling of the positive bias in the mass concentration within the boundary layer. A similar deficiency, with the same explanation, is shown for organic aerosol (Fig. 7b). Though denoted as organic carbon, GEOS represents this as organic matter by using a multiplicative factor of 1.8. Unlike black carbon, GEOS performs well in terms of the amount of organic carbon above the PBL. A notable increase in organic carbon is present in the boundary layer in GOCART2G. Since brown carbon was emitted as organic carbon prior to GOCART2G, it is included as organic carbon in the figure.
Sulfate and nitrate suffer from the opposite problem (Fig. 7c and d). In general, these two species are underestimated in the model. A comparison of the observed profiles for organic carbon, sulfate, and nitrate suggests multiple sources and air masses containing the aerosols throughout the CAMP2Ex campaign. The boundary layer tends to be influenced by biomass burning aerosol, particularly during the first half of the campaign prior to the monsoon transition, while the lower free troposphere contains anthropogenic aerosol transported from East Asia (Hilario et al., 2021). It is evident that the improvement in sulfate near the surface in GEOS 5.25 was matched by a degradation just above the top of the boundary layer due to a change in the vertical transport. Unfortunately, the same reduction in biomass burning emissions that assisted with the mass of carbon in GEOS with GOCART2G also led to a reduction in sulfate. There is an underestimation in fine-mode nitrate within the entire profile shown in Fig. 7d. While deficiencies in other processes are possible, one explanation could be that the model is skewing more towards coarse-mode nitrate, consistent with the biases in 1064 nm extinction in Fig. 3. To match the inlet size, only the smallest size bin is included here. There is also the potential that sulfate and nitrate produced over mainland Asia are excessively scavenged prior to reaching the Philippines region, or deficiencies in precursor species like ammonium are present.
3.2 Case study along a smoky transect
For a more detailed look at a biomass burning plume, a segment with roughly constant altitude from research flight (RF) 9 was selected as indicated by the flight map in Fig. 8. The PSAP data are prone to uncertainty when the aircraft performs vertical profiling maneuvers, making the consistent altitude ideal for absorption data. During the central part of the segment, the aircraft was well within the boundary layer (Fig. S6). Data points just before and after this portion were also included to investigate deviations in aerosol extinction due to relative humidity. For this section, only the final model run, GOCART2G, including all model updates and the assimilation of AOD is considered. Since the main goal of this section is to evaluate the aerosol intensive properties, it is irrelevant which model simulation is used as the optics lookup tables are unchanged. While the aerosol mass concentration and relative humidity have the potential to differ in each of the model simulations, the relationship between the two and the optical properties are the same among the model simulations.
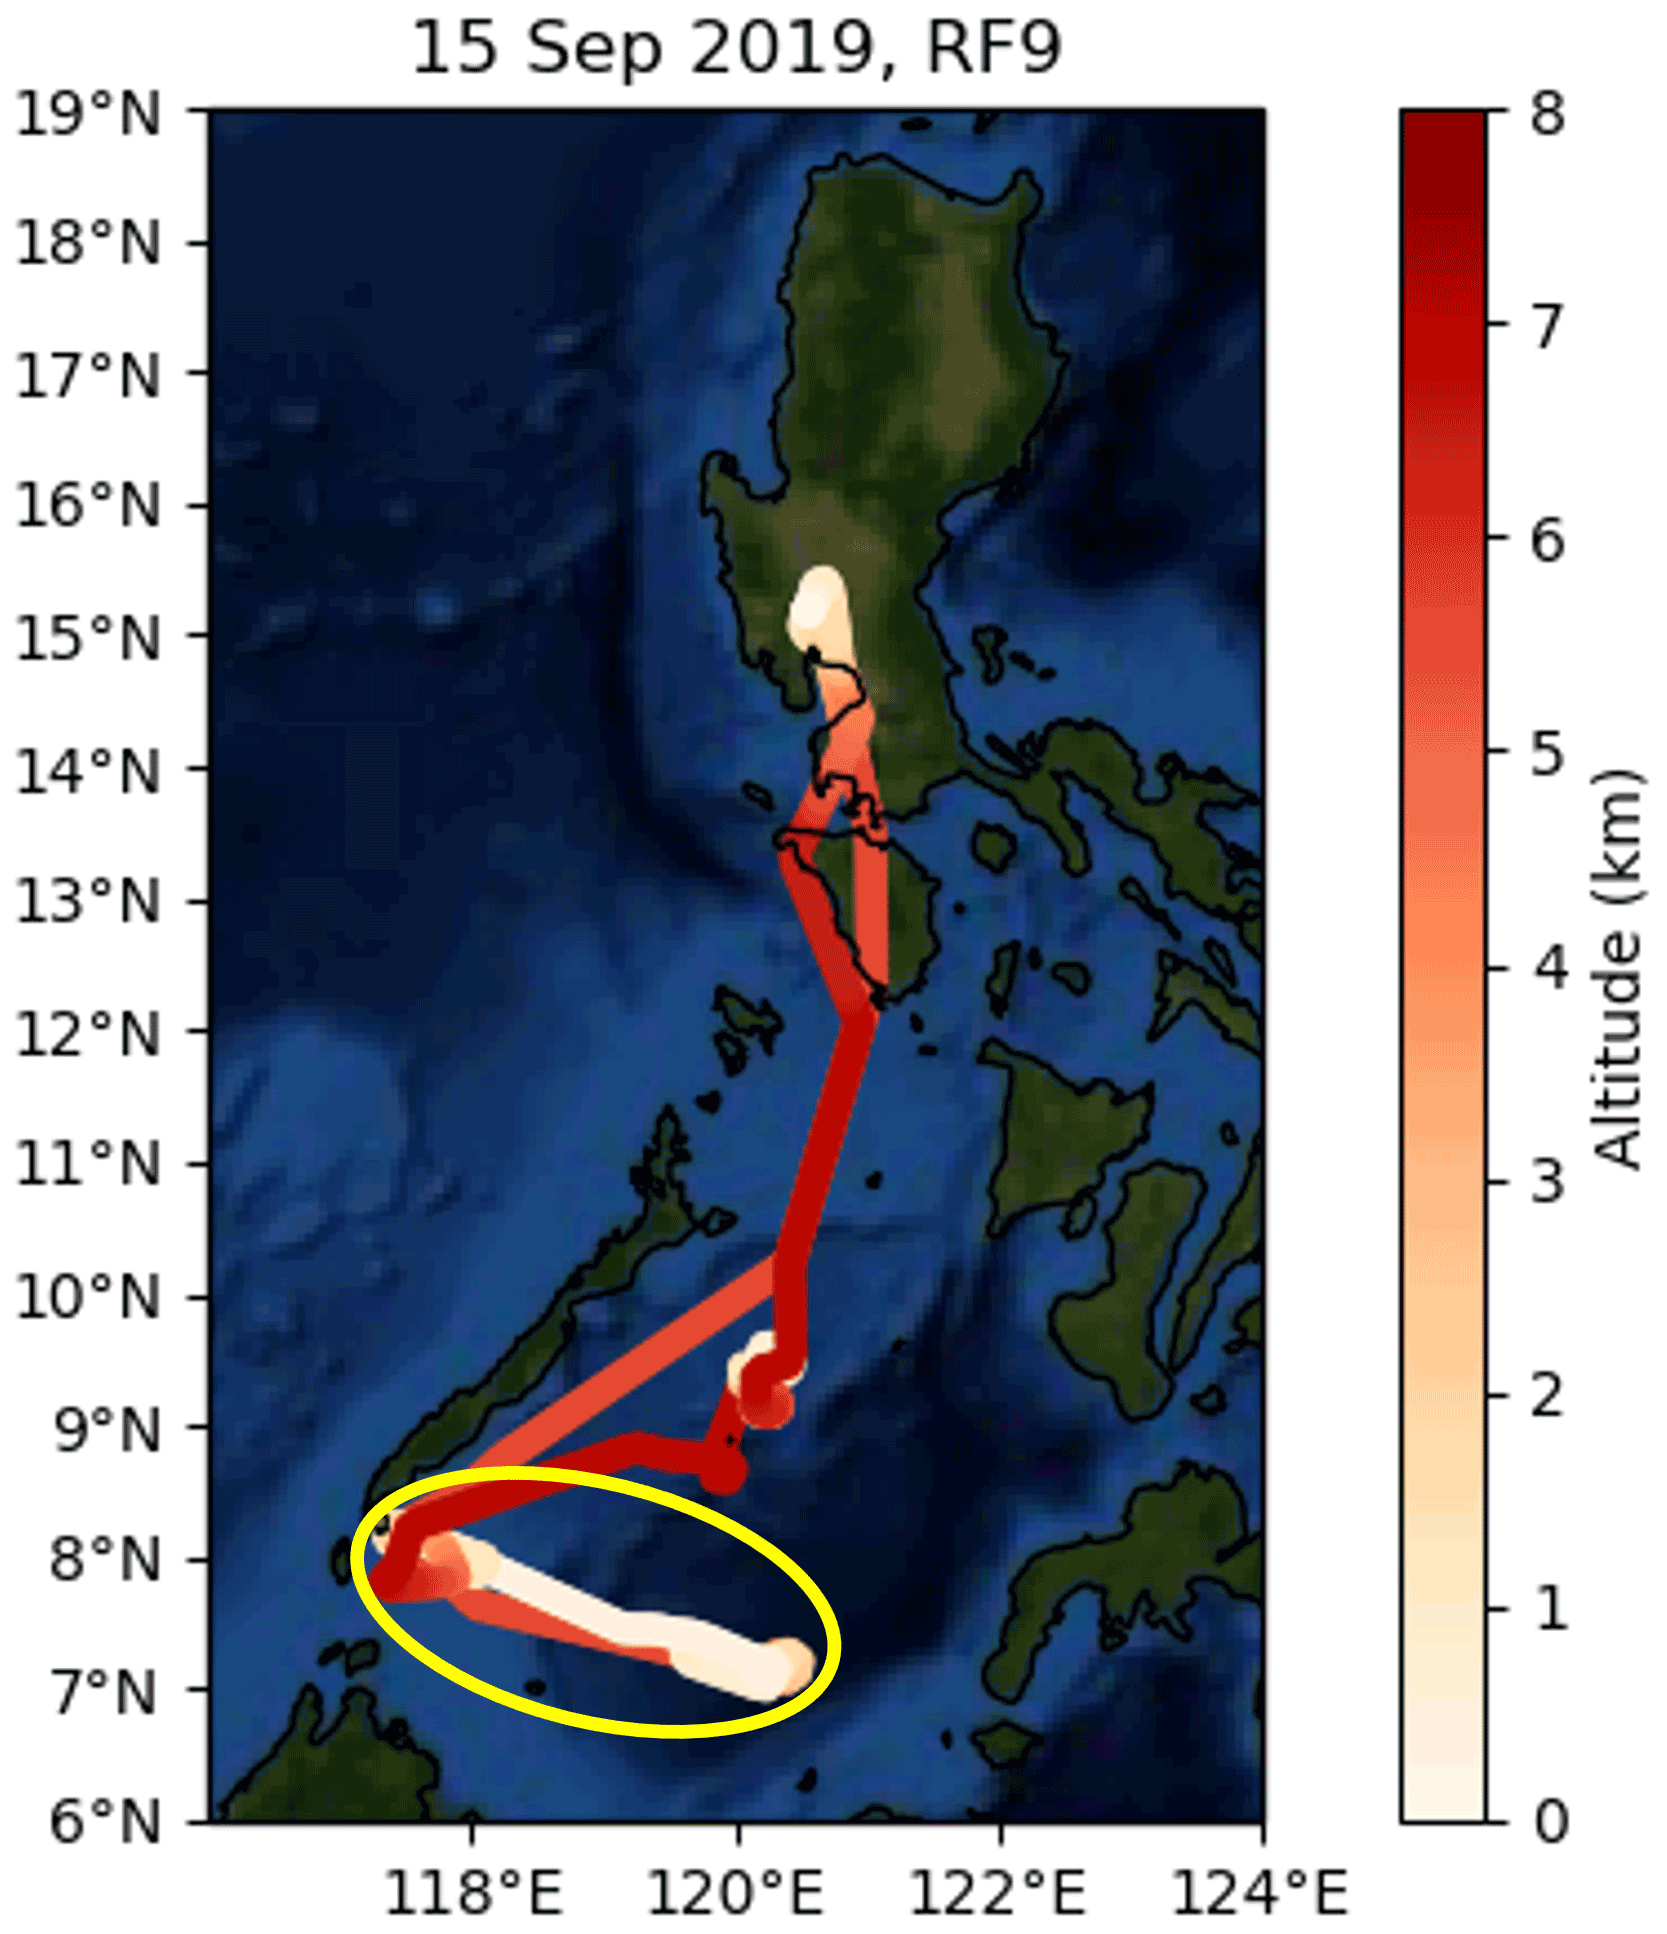
Figure 8Flight trajectory for RF9 on 15 September 2019 colored by the altitude of the aircraft. The yellow oval indicates the low-level transect focused on in Sect. 3.2.
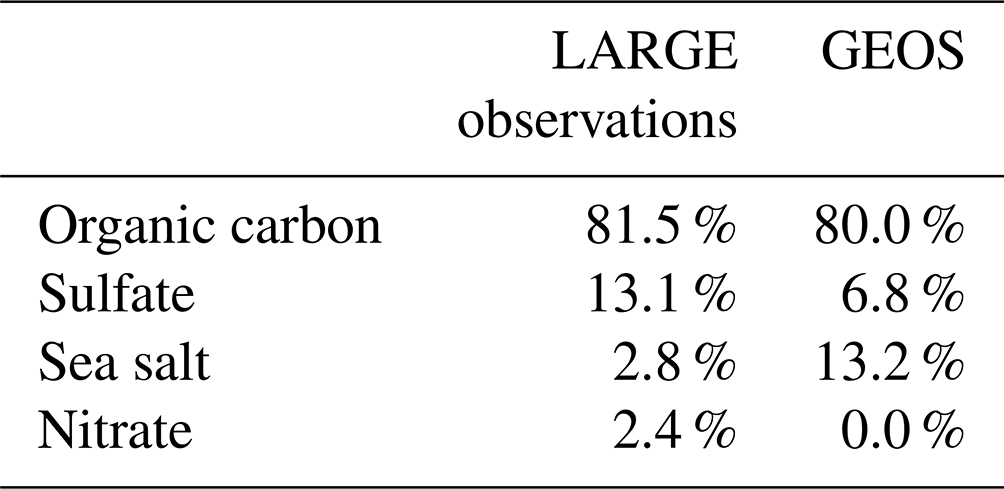
The observed aerosol composition during this flight segment was predominantly organic carbon (81.3 %), though it should be noted that the SP2 malfunctioned during this flight and the concentration of black carbon is not available. GEOS represented that percentage of organic carbon well; however, it struggled with the relative concentrations of sulfate, nitrate, and sea salt. The relative fraction of sea salt is exceptionally high in GEOS, despite the multiplication factor to convert observed sodium to sea salt. There are a few possible explanations for this overestimation. The total mass of sea salt in GEOS could be correct and the bias detected here could be related to the assumed size distribution. Only the three finest sea salt bins were included to match the inlet size for the aircraft. However, given the bias toward excessive coarse-mode sea salt in GEOS (Bian et al., 2019), we suspect this is not the case. A more likely scenario is that the AOD assimilation increases sea salt instead of sulfate and nitrate as those two species are not as prevalent. The deficiency in sulfate and nitrate in the model was noted throughout the entire CAMP2Ex campaign (Fig. 7c and d).
Table 3The percent contribution of aerosol species to the aerosol mass during the RF9 flight segment from AMS and PILS observations as well as GEOS GOCART. Black carbon is not available from the observations for this flight segment, but the ratio of BC : OC in GEOS is 0.07:1.
Dry and ambient aerosol optics for the flight segment are displayed in Fig. 9. The top two panels are colored based on the bias within GEOS for the mass concentration of organic carbon, which is always positive, and are representative of dry conditions. The smallest biases in organic carbon occur when both the observations and GEOS indicate lower amounts of dry scattering and extinction (Fig. 9a and b). It is evident that GEOS needs a large bias in the mass concentration of organic carbon to accurately represent dry extinction. Overall, there is a mean negative bias in dry scattering and extinction despite the positive bias in aerosol mass. Under ambient conditions, GEOS performs well with respect to extinction for many of the data points, except for a cluster of data points where LARGE observes an extinction of ∼0.5 km−1 yet GEOS has up to triple the extinction (Fig. 9c). As indicated by the blue shading for those data points, GEOS is too humid when the overestimation in extinction at 532 nm occurs. Some improvement can be seen when extinction is computed for GEOS using the observed relative humidity as indicated by an increase in the correlation and decrease in root mean square error relative to scattering in GEOS with the model's relative humidity; however, there is still an overall positive bias in ambient extinction (Fig. 9d), indicating a concern with hygroscopicity in the model.
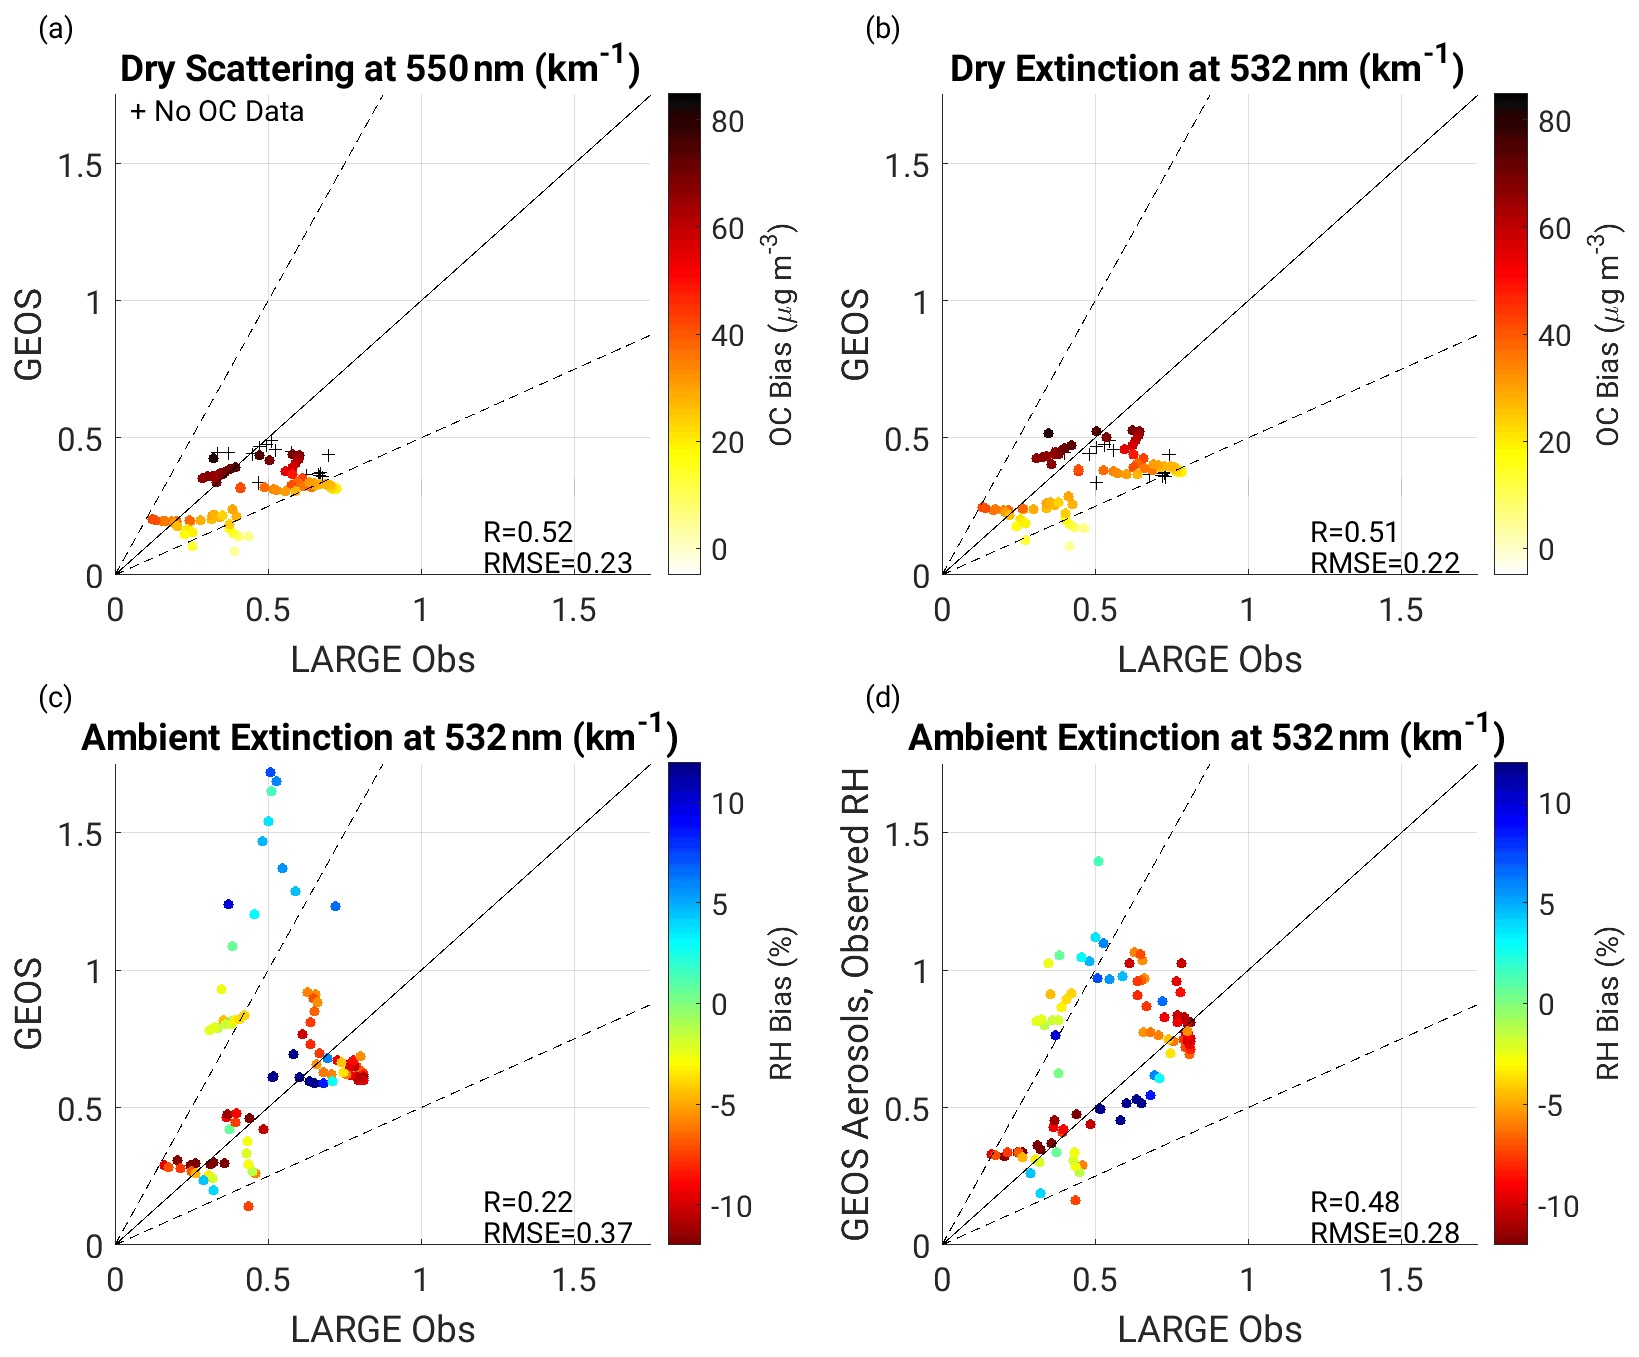
Figure 9Scatter plot of observations from LARGE versus GEOS GOCART2G for (a) dry scattering at 550 nm, (b) dry extinction at 532 nm, (c) ambient extinction at 532 nm, and (d) ambient extinction at 532 nm with bias-corrected relative humidity in GEOS. Panels (a) and (b) are colored based on the bias in organic carbon mass concentration, and panels (c) and (d) are colored based on the bias in relative humidity. The solid black line represents the one-to-one line, while dashed black lines are the two-to-one lines.
A comparison of the range in values for the dry and ambient extinction reveals that there is minimal hygroscopic growth in the observations, while GEOS extinction is highly sensitive to relative humidity (Fig. 9b and d). There is a hygroscopic growth factor, fRH (computed using 20 % and 80 % relative humidity), of less than 1 in the observations such that the aerosol shrinks rather than swells with increasing humidity. The average fRH for the flight segment is 0.915. In GEOS, the average fRH is 2.16, and anything less than 1 would be considered unphysical and is not permitted in the current optical lookup tables. Laboratory studies and aircraft observations of fresh smoke demonstrate a range of fRH values depending on fuel type, fire conditions, and RH (Day et al., 2006), with an fRH typically between ∼1 and ∼2 (Hand et al., 2010). The review of previous studies presented by Hand et al. (2010) shared conflicting results regarding aged smoke with one study on par with fresh smoke and the another suggesting higher values of fRH for aged smoke. Like during the smoke transect from CAMP2Ex, other field campaigns have observed an fRH below 1 on select occasions, hypothesized to be due to particle restructuring (Shingler et al., 2016). Even though a value of fRH below 1 is not possible in GEOS, 2.16 is still too high based on prior estimates in the literature.
A source of uncertainty in the observed fRH, especially during the flight segment within the boundary layer, is that observations are collected at a fixed relative humidity of 80 % such that scattering is extrapolated at ambient conditions more humid than a relative humidity of 80 %. For this reason, scattering at 550 nm is directly compared at a fixed relative humidity of 80 % (Fig. 10). The correlation between GEOS and the nephelometer scattering at 80 % relative humidity is the same as that for dry scattering (Fig. 9a). However, unlike with the dry scattering, GEOS overestimates scattering at 80 % relative humidity when the bias in the mass of organic aerosol is enhanced. Using the scattering in GEOS computed based on the observed relative humidity, scattering is plotted as a function of relative humidity in Figure 10b. The range and variability in 550 nm scattering are comparable between the model and observations below ∼85 % RH. Under highly humid conditions, GEOS follows an exponential curve for the relationship between scattering and relative humidity, while the observations maintain a linear relationship. With an extrapolation used to derive ambient scattering based on hygroscopic growth from 20 % to 80 % relative humidity in the observations it is difficult to quantify how much of the model bias in scattering at ambient relative humidity is due to deficiencies within GEOS.
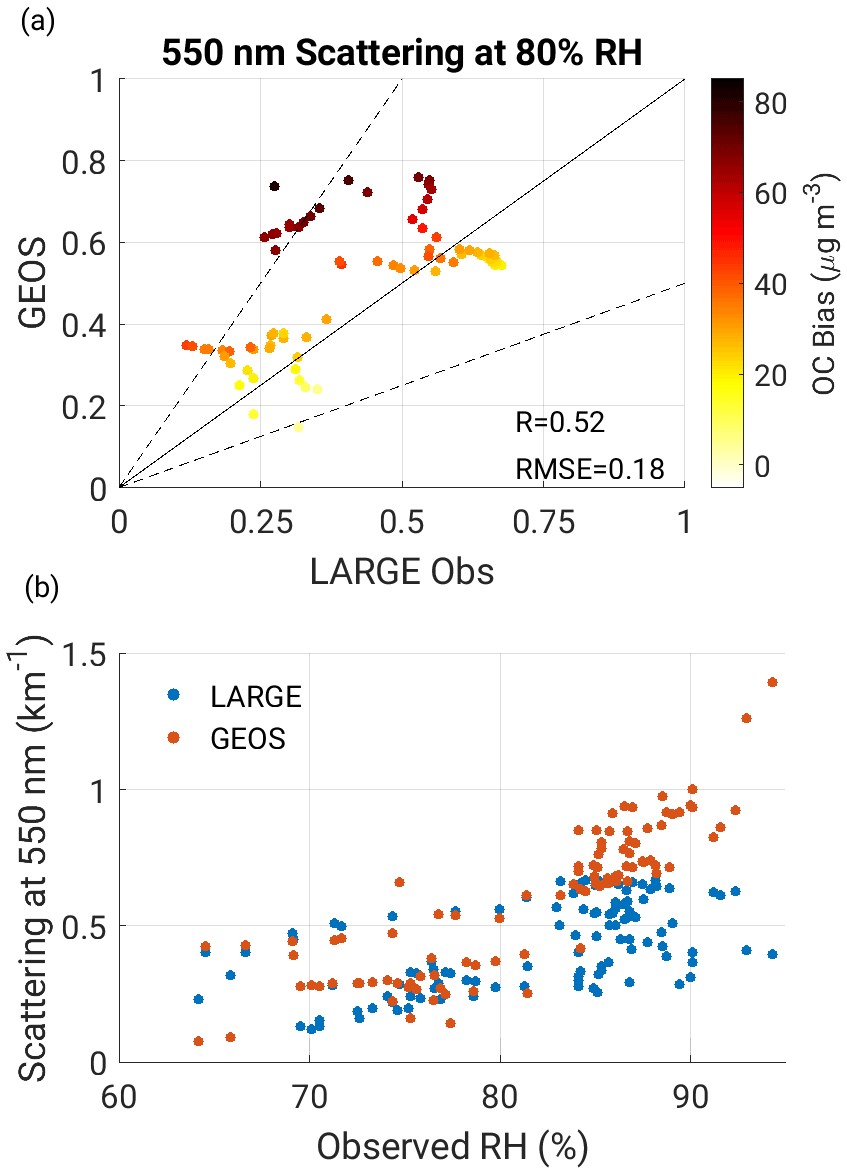
Figure 10(a) Scatter plot of observations from LARGE versus GEOS GOCART2G for scattering at 550 nm at a relative humidity of 80 % colored based on the bias in organic carbon mass concentration. The solid black line represents the one-to-one line, while dashed black lines are the two-to-one lines. (b) Scatter plot of observed relative humidity versus scattering at 550 nm from the LARGE observations and GOCART2G that has been bias-corrected for relative humidity.
Previous studies have documented a wavelength dependence on the SSA for biomass burning aerosol and uncertainty in observations of SSA in smoke plumes (e.g., Pistone et al., 2019). We find that the SSA is underestimated in GEOS and the modeled spectral dependence is not in good agreement with the observations. Ambient SSA is available at 550 nm from the LARGE observations and is displayed in Fig. 11 in comparison to GEOS for the flight segment. Nearly all observations have an SSA greater than 0.98, while the SSA in GEOS ranges from ∼0.9 to ∼0.96. There is also more variability with the SSA in GEOS connected to the dependence on RH. Correcting the bias in RH does not improve the overall mean value of ambient SSA at 550 nm; however, it does decrease the variability. Mean values of dry SSA across the entire flight transect are shown in Fig. 12 for three wavelengths: 450 nm, 550 nm, and 700 nm. As previously indicated for ambient RH, the mean SSA in GEOS is too absorbing at 550 nm, and this is also the case for dry SSA at the three wavelengths (Fig. 12). The observations indicate a linear relationship between SSA and wavelength, which is not the case for GEOS as the model is excessively too absorbing at 450 nm.
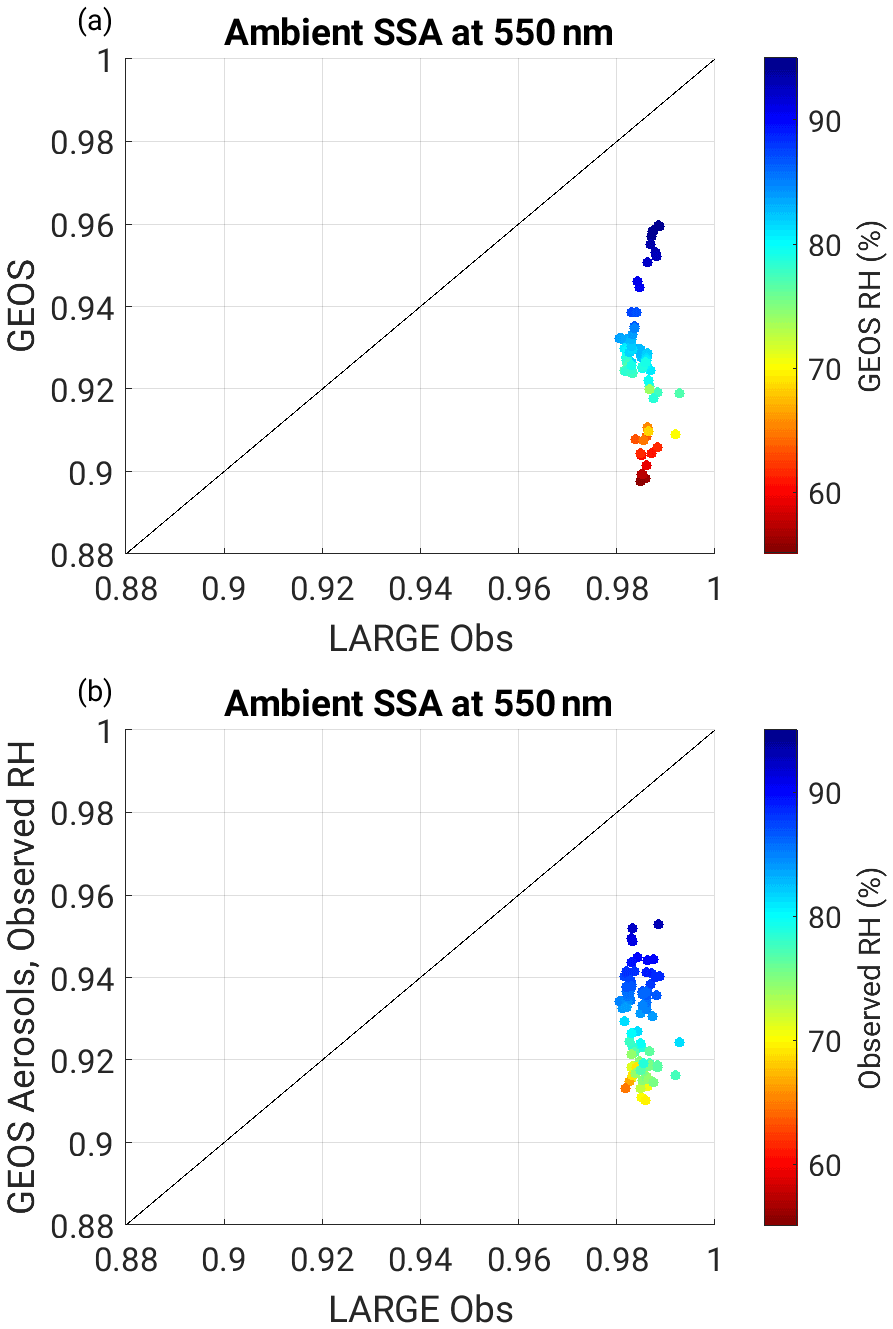
Figure 11Ambient single-scattering albedo at 550 nm computed using (a) the relative humidity from GEOS and (b) observed relative humidity from the aircraft versus the observed single-scattering albedo for the flight segment from RF9. Points are colored based on the relative humidity in GEOS in panel (a) and the observed relative humidity in panel (b).
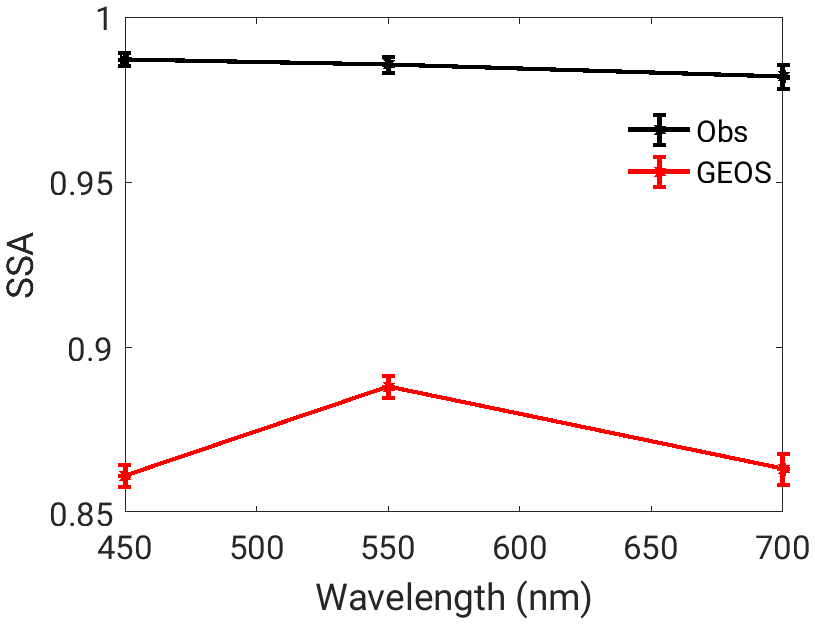
Figure 12Mean dry single-scattering albedo at 450, 550, and 700 nm from GEOS and the LARGE observations for the flight transect from RF9. Error bars indicate 1 standard deviation from the mean.
3.3 Aerosol size distribution
Through changing the optics lookup tables, greater extinction could be achieved in GEOS by altering the assumed particle size distribution for organic and brown carbon such that the mean radius is larger, and the width of the distribution is wider. We begin by looking at two flights, RF9, the flight examined in Sect. 3.2, and RF10, which also captured aged biomass burning aerosol but downstream in the Philippine Sea on the following day, to determine if changes to the particle size distribution are justified. Both flights are filtered to only include time steps in which the chemical influence flag indicated biomass burning aerosol (https://doi.org/10.5067/Airborne/CAMP2Ex_TraceGas_AircraftInSitu_P3_Data_1; NASA/LARC/SD/ASDC, 2020). RF9 contained 80 % organic carbon and 12.5 % sulfate, while RF10 had 70 % organic carbon, 14 % sulfate, and a non-negligible content of sea salt (15 %). Figure 13 shows the observed aerosol size distribution from FIMS as well as the assumed sized distribution for organic carbon and sulfate in GEOS. The size distributions for GEOS have been scaled such that the peak of the lognormal distribution matches the maximum from the observations. Comparing the range of the y axis for RF9 and RF10, it is obvious that RF9 had a higher aerosol loading as the aircraft sampled the Sulu Sea region closer to the source of the smoke. The observations indicate that biomass burning aerosol in this region has a bimodal size distribution, a feature that has been known for over a decade (Reid et al., 2005). Neither of the observed peaks line up with the assumed size distribution in GEOS for organic carbon or sulfate, with both peaks in GEOS falling between the observed peaks. The observed bimodal size distribution is a result of sub-flight variability (Fig. S7).
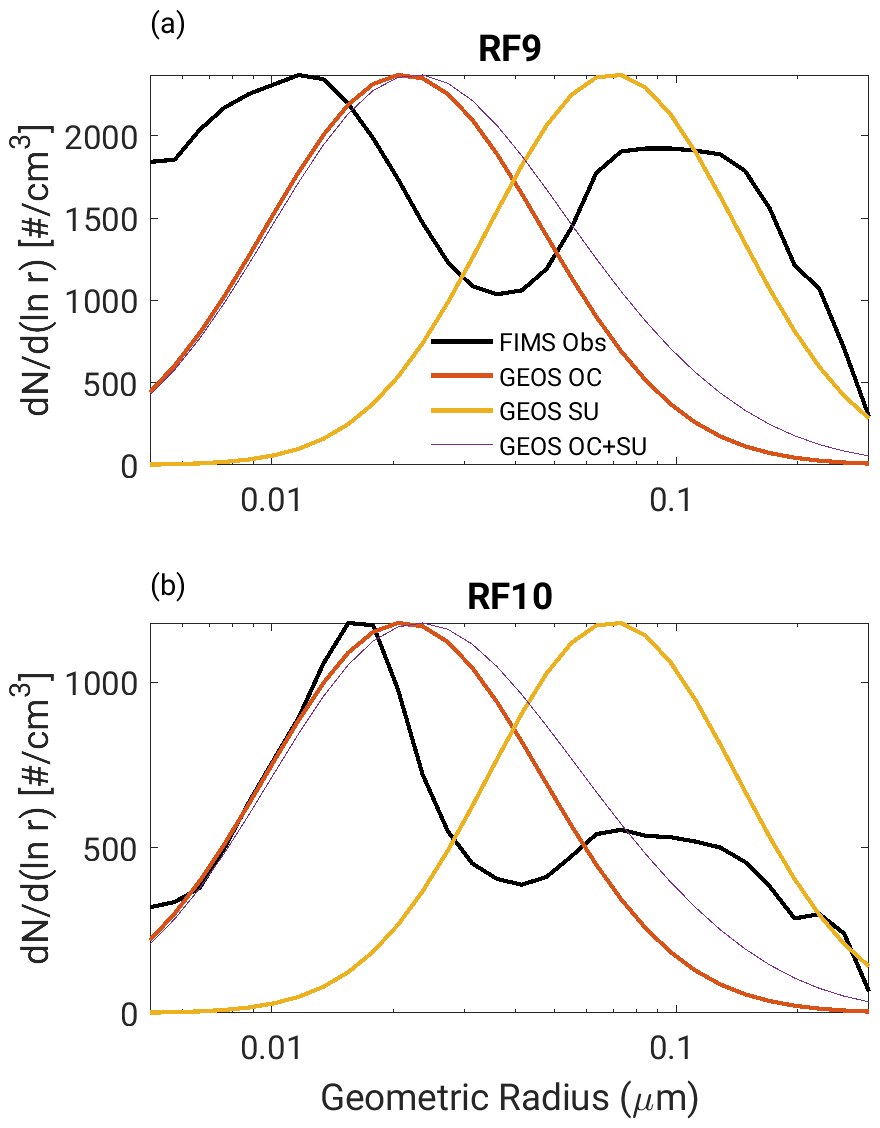
Figure 13The observed dry aerosol size distribution from FIMS for data points classified as a biomass burning regime from (a) RF9 and (b) RF10. Also shown is the assumed particle size distribution for organic carbon and sulfate in GEOS, scaled to match the peak in the observed distributions, as well as those distributions linearly added for a more direct comparison between GEOS and FIMS.
Agreement in peak radius is somewhat better for RF10; however, the width of the observed distribution, particularly for the peak with a smaller geometric radius, is narrower than what is assumed by GEOS. The primary peak in the size distribution, centered at ∼0.015 µm in the observations, is shifted towards a larger radius in GEOS. The relative magnitude of the two peaks in the bimodal distribution in the observed size distributions is intriguing as there is comparatively less aerosol peaking around 0.1 µm. If we were to assume that the smaller peak radius in the FIMS observations corresponds to organic carbon, the mean radius in GEOS should be reduced. This, however, contradicts earlier findings that the extinction in GEOS should be increased unless, of course, a corresponding increase in the mean radius for the relatively minor content of sulfate offsets a smaller radius for organic carbon. Furthermore, Mian Chin et al. (2009) reported that the effective radius for organic matter in GOCART is likely too small.
Figure 14 provides a closer look at the aerosol size distribution for the flight segment from RF9 evaluated in Sect. 3.2, which yields slightly different results, indicating variability in the observed particle size distribution for biomass burning aerosol during an individual flight. There is not, however, variability in the size distribution within the smoke transect. The primary observed peak from Fig. 13 is not present. There is likely internal mixing occurring during the lower-altitude flight segment, which cannot be achieved within GEOS. A lognormal fit to the FIMS observations during this flight segment indicates a median radius of 0.0995 µm and a modal width of 1.77. A very similar peak radius for biomass burning aerosol has been observed during SEAC4RS and ORACLES (Supplement), as denoted by the dashed line for “Schill” in Fig. 14; however, observations from the other campaigns indicate a narrower distribution. Based on these results, it can be hypothesized that by using the Schill distribution for the brown carbon component of the aerosol to mimic internally mixed, aged aerosol, an improvement will occur in the overall representation of biomass burning aerosol in GEOS. Overall, the FIMS observations during this segment, the Schill distribution, and results within the literature suggest that a sigma value of 2.2 for biomass burning aerosol in GEOS is too large (June et al., 2022, and references within).
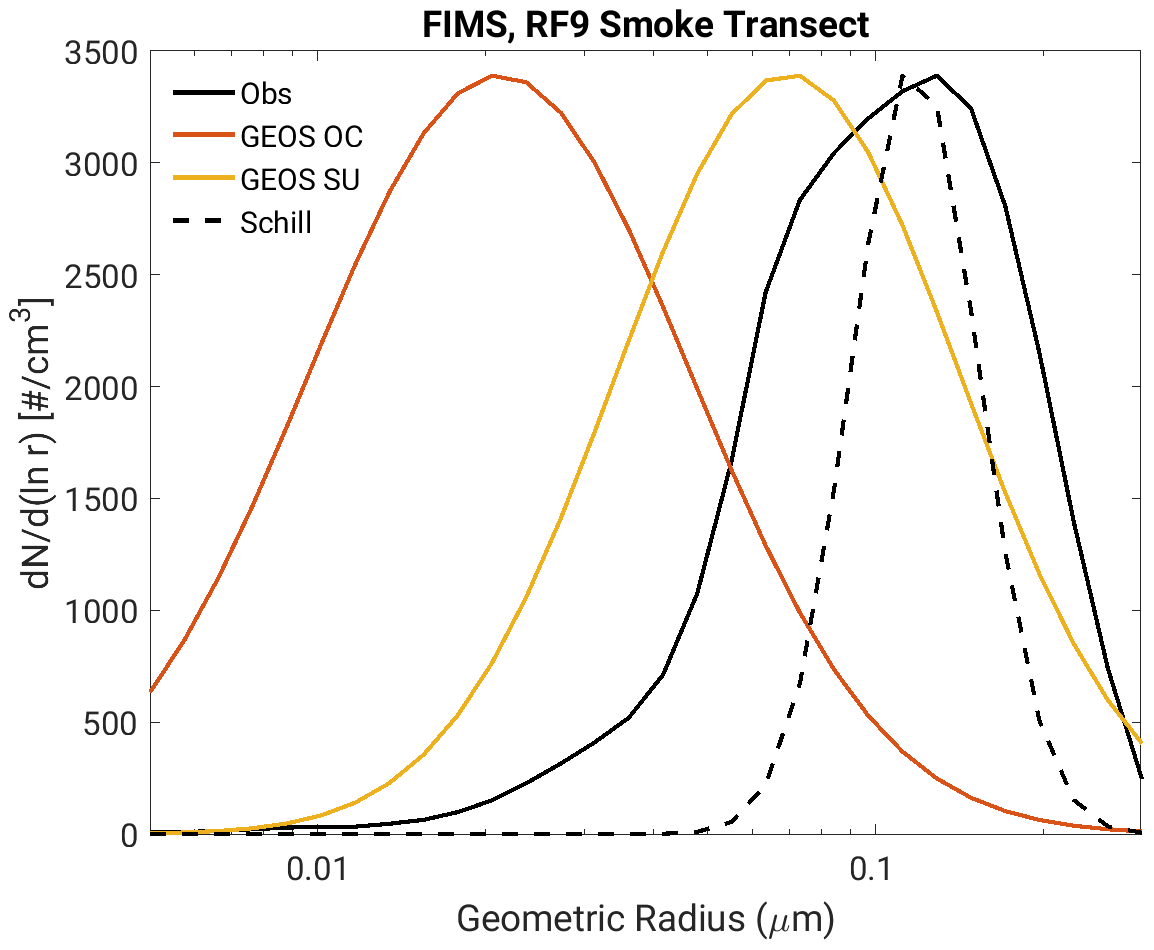
Figure 14The observed dry aerosol size distribution from FIMS for the flight segment from RF9 as well as the assumed particle size distributions for organic carbon and sulfate in GEOS and the Schill size distribution derived from data collected during SEAC4RS with a median radius of 0.1175 µm and sigma of 1.3 (see the Supplement for additional details).
The CAMP2Ex field campaign, comprised of 18 research aircraft flights using NASA's P3, took place from late August 2019 to early October 2019. The aircraft collected observations of clouds, aerosols, radiation, and meteorology using a suite of in situ and remote sensing instruments. Here, we take advantage of the plethora of data to evaluate the representation of biomass burning aerosols in GEOS. This was a timely exercise as recent updates in the convective parameterizations as well as GOCART had the potential to alter the vertical profile of aerosol mass and extinction. Updates of particular importance for evaluation included the introduction of brown carbon, a switch from a relaxed Arakawa and Schubert convective parameterization to the Grell–Freitas convective parameterization coupled with the University of Washington shallow convective scheme, and allowing convective scavenging to occur within the moist parameterization instead of within GOCART. Model updates were evaluated incrementally to determine their individual impacts; however, many biases noted in GEOS are independent of these changes.
The findings of this study highlight areas of focus for future development within GEOS and GOCART. From a model physics perspective, there is a need for improvement in the turbulence and shallow convection schemes that govern the height of the PBL and the vertical transport as indicated by the vertical profiles of aerosol mass concentration as well as atmospheric moisture. Using aerosol mass concentration as a tracer indicates an overestimate of aerosol within the boundary layer in GEOS, particularly at the top of the PBL such that the aerosol is unable to sufficiently penetrate the free troposphere. A similar finding was reported by Bian et al. (2021) when investigating organic aerosol in GEOS using aircraft observations in Brazil. While there was some improvement in relative humidity above 2 km through new convection parameterization in GEOS, biases remain below this height, in addition to the inability to capture the inversion. With a limited sample size associated with the aircraft flights, it is difficult to evaluate the vertical profile of aerosol mass across the diurnal cycle. It is, however, recommended that future studies investigate the diurnal cycle of aerosol backscatter using a stationary lidar, such as the University of Wisconsin HSRL aboard the Sally Ride during the PISTON campaign, based on differing biases in relative humidity across the diurnal cycle.
Deficiencies in sulfate and nitrate emphasize the need for assessing the budget for urban aerosols. Most of the sulfate and nitrate in GOCART are not emitted as aerosol, but rather form through aqueous oxidation and heterogenous chemistry of their precursory gaseous species. The production of nitrate and sulfate within GOCART should be reassessed, and there is also the possibility that too much of these species is being removed from the atmosphere through sedimentation, dry deposition, wet deposition, and/or convective scavenging. This is, however, dependent on an accurate emissions inventory for Asia within the CEDS database. It is plausible that the CEDS inventory lacks the proper emissions for precursor species for sulfate and nitrate over China, leading to an underestimate of aerosol mass downstream.
A more in-depth focus was placed on biomass burning aerosol. A limitation of GOCART is that the aerosol is considered externally mixed. Smoke is known to be internally mixed (Reid et al., 2005) and there is evidence of this in the FIMS observations from CAMP2Ex from variability in the particle size distribution. An abundant quantity of black and organic carbon is present in GEOS, which was also found to be the case during the ORACLES campaign (Shinozuka et al., 2020). The assimilation process constrains extinction for the whole column but does not place any constraint on aerosol mass, exacerbating an already existing bias in the mass of carbon. At the root of the overestimates of carbonaceous aerosol is an underestimate in the extinction defined through optics lookup tables as a function of mass, humidity, and the mode radius and width of a lognormal distribution representing the aerosol size distribution. A comparison to in situ observations from the CAMP2Ex campaign demonstrated issues with both the dependency on humidity and particle size distribution. While it is not possible for GEOS to match the hygroscopic growth from the observations, it is evident that GEOS has too large of an increase in extinction with an increase in humidity. Agreement between the modeled and observed extinction could be improved by adjusting the assumed particle size distribution for brown carbon to have a larger mode radius or a wider distribution. A comparison of the assumed particle size distribution to observations from FIMS indicated that the current mode radius is too small. The observed mode radius is in excellent agreement with observations from past field campaigns; however, the width for CAMP2Ex is larger. A limitation of GOCART, however, is that the particle size distribution cannot vary in time or space for a given aerosol species. This contradicts the variability seen within particle size distribution during the low-level flight segment from CAMP2Ex RF9 as well as results from other field campaigns that indicate the particle size distribution of biomass burning aerosol changes with respect to median diameter and modal width as smoke ages (June et al., 2022). If the assumed particle size distribution for brown carbon in GEOS were to be modified such that the mode radius is larger, it would need to be thoroughly evaluated as a change in the particle distribution would also impact fields such as the single-scattering albedo and Ångström exponent. Ultimately, a more physically based aerosol module would need to be used for GEOS to accurately represent the variability in the particle size distribution.
GEOS model output sampled along the aircraft trajectories for CAMP2Ex is available for download through the NCCS data portal at https://portal.nccs.nasa.gov/datashare/iesa/campaigns/CAMP2EX/ (last access: 13 December, 2022; NCCS Dataportal, 2022). CAMP2Ex observational datasets are available at https://doi.org/10.5067/Suborbital/CAMP2EX2018/DATA001 (NASA ASDC, 2020).
The supplement related to this article is available online at: https://doi.org/10.5194/acp-22-16091-2022-supplement.
ABMC led the investigation, visualization, and writing of the paper. Data curation was completed by RG (GEOS model), SB (HSRL2), RF (HSRL2), CH (HSRL2), and LZ (LARGE). All authors contributed to reviewing and editing of the paper.
The contact author has declared that none of the authors has any competing interests.
Publisher's note: Copernicus Publications remains neutral with regard to jurisdictional claims in published maps and institutional affiliations.
This article is part of the special issue “Cloud, Aerosol and Monsoon Processes Philippines Experiment (CAMP2Ex) (ACP/AMT inter-journal SI)”. It is not associated with a conference.
Computational resources supporting this work were provided by the NASA High-End Computing (HEC) Program through the NASA Center for Climate Simulation (NCCS) at Goddard Space Flight Center. This work was supported by the NASA Earth Science Project Office (ESPO) CAMP2Ex Mission. We would also like to thank Jeff Reid for his support and useful discussions, Josh DiGangi for providing the chemical influence flag, and Jian Wang, the PI for FIMS.
This research has been supported by the NASA's Earth Sciences Division.
This paper was edited by Steven Brown and reviewed by two anonymous referees.
Arnold, N., Putman, W., Freitas, S., Takacs, L., and Rabenhorst, S.: Impacts of new atmospheric physics in the updated GEOS FP system (Version 5.25), GMAO Research Brief, https://gmao.gsfc.nasa.gov/researchbriefs/new_atmos_phys_GEOS-FP/new_atmos_phys_GEOS-FP.pdf (last access: 22 November 2021), 2020.
Barahona, D., Molod, A., Bacmeister, J., Nenes, A., Gettelman, A., Morrison, H., Phillips, V., and Eichmann, A.: Development of two-moment cloud microphysics for liquid and ice within the NASA Goddard Earth Observing System Model (GEOS-5), Geosci. Model Dev., 7, 1733–1766, https://doi.org/10.5194/gmd-7-1733-2014, 2014.
Bahreini, R., Ervens, B., Middlebrook, A. M., Warneke, C., de Gouw, J. A., DeCarlo, P. F., Jimenez, J. L., Brock, C. A., Neuman, J. A., Ryerson, T. B., Stark, H., Atlas, E., Brioude, J., Fried, A., Holloway, J. S., Peischl, J., Richter, D., Walega, J., Weibring, P., Wollny, A. G., and Fehsenfeld, F. C.: Organic aerosol formation in urban and industrial plumes near Houston and Dallas, Texas, J. Geophys. Res.-Atmos., 114, D00F16, https://doi.org/10.1029/2008JD011493, 2009.
Bian, H., Chin, M., Hauglustaine, D. A., Schulz, M., Myhre, G., Bauer, S. E., Lund, M. T., Karydis, V. A., Kucsera, T. L., Pan, X., Pozzer, A., Skeie, R. B., Steenrod, S. D., Sudo, K., Tsigaridis, K., Tsimpidi, A. P., and Tsyro, S. G.: Investigation of global particulate nitrate from the AeroCom phase III experiment, Atmos. Chem. Phys., 17, 12911–12940, https://doi.org/10.5194/acp-17-12911-2017, 2017.
Bian, H., Froyd, K., Murphy, D. M., Dibb, J., Darmenov, A., Chin, M., Colarco, P. R., da Silva, A., Kucsera, T. L., Schill, G., Yu, H., Bui, P., Dollner, M., Weinzierl, B., and Smirnov, A.: Observationally constrained analysis of sea salt aerosol in the marine atmosphere, Atmos. Chem. Phys., 19, 10773–10785, https://doi.org/10.5194/acp-19-10773-2019, 2019.
Bian, H., Lee, E., Koster, R. D., Barahona, D., Chin, M., Colarco, P. R., Darmenov, A., Mahanama, S., Manyin, M., Norris, P., Shilling, J., Yu, H., and Zeng, F.: The response of the Amazon ecosystem to the photosynthetically active radiation fields: integrating impacts of biomass burning aerosol and clouds in the NASA GEOS Earth system model, Atmos. Chem. Phys., 21, 14177–14197, https://doi.org/10.5194/acp-21-14177-2021, 2021.
Brown, H., Liu, X., Pokhrel, R., Murphy, S., Lu, Z., Saleh, R., Mielonen, T., Kokkola, H., Bergman, T., Myhre, G., Skeie, R. B., Watson-Paris, D., Stier, P., Johnson, B., Bellouin, N., Schulz, M., Vakkari, V., Beukes, J. P., van Zyl, P. G., Liu, S., and Chand, D.: Biomass burning aerosols in most climate models are too absorbing, Nat. Commun., 12, 277, https://doi.org/10.1038/s41467-020-20482-9, 2021.
Buchard, V., da Silva, A. M., Colarco, P. R., Darmenov, A., Randles, C. A., Govindaraju, R., Torres, O., Campbell, J., and Spurr, R.: Using the OMI aerosol index and absorption aerosol optical depth to evaluate the NASA MERRA Aerosol Reanalysis, Atmos. Chem. Phys., 15, 5743–5760, https://doi.org/10.5194/acp-15-5743-2015, 2015.
Burton, S. P., Ferrare, R. A., Hostetler, C. A., Hair, J. W., Rogers, R. R., Obland, M. D., Butler, C. F., Cook, A. L., Harper, D. B., and Froyd, K. D.: Aerosol classification using airborne High Spectral Resolution Lidar measurements – methodology and examples, Atmos. Meas. Tech., 5, 73–98, https://doi.org/10.5194/amt-5-73-2012, 2012.
Burton, S. P., Hostetler, C. A., Cook, A. L., Hair, J. W., Seaman, S., Scola, S., Harper, D. B., Smith, J. A., Fenn, M A., Ferrare, R. A., Saide, P. E., Chemyakin, E. V., and Müller, D.: Calibration of a high spectral resolution lidar using a Michelson interferometer with data examples from ORACLES, Appl. Optics, 57, 6061–6075, 2018.
Chang, D.Y., Yoon, J., Lelieveld, J., Park, S.K., Yum, S.S., Kim, J., and Jeong, S.: Direct radiative forcing of biomass burning aerosols from the extensive Australian wildfires in 2019–2020, Environ. Res. Lett., 16, 044041, https://doi.org/10.1088/1748-9326/abecfe, 2021.
Chen, L., Li, Q., Wu, D., Sun, H., Wei, Y., Ding, X., Chen, H., Cheng, T., and Chen, J.: Size distribution and chemical composition of primary particles emitted during open biomass burning processes: Impacts on cloud condensation nuclei activation, Sci. Total Environ., 674, 179–188, https://doi.org/10.1016/j.scitotenv.2019.03.419, 2019.
Chin, M., Ginoux, P., Kinne, S., Torres, O., Holben, B. N., Duncan, B. N., Martin, R. V., Logan, J. A., Higurashi, A., and Nakajima, T.: Tropospheric aerosol optical thickness from the GOCART model and comparisons with satellite and sun photometer measurements, J. Atmos. Sci., 59, 461–483, https://doi.org/10.1175/1520-0469(2002)059<0461:TAOTFT>2.0.CO;2, 2002.
Chin, M., Chu, A., Levy, R., Remer, L., Kaufman, Y., Holben, B., Eck, T., Ginoux, P., and Gao, Q.: Aerosol distribution in the Northern Hemisphere during ACE-Asia: Results from global model, satellite observations, and Sun photometer measurements, J. Geophys. Res.-Atmos., 109, D23S90, https://doi.org/10.1029/2004JD004829, 2004.
Chudler, K. and Rutledge, S. A.: The coupling between convective variability and large-scale flow patterns observed during PISTON 2018–19, J. Climate, 34, 7199–7218, https://doi.org/10.1175/JCLI-D-20-0785.1, 2021.
Colarco, P., da Silva, A., Chin, M., and Diehl, T.: Online simulations of global aerosol distributions in the NASA GEOS-4 model and comparisons to satellite and ground-based aerosol optical depth, J. Geophys. Res., 115, D14207, https://doi.org/10.1029/2009JD012820, 2010.
Colarco, P. R., Nowottnick, E. P., Randles, C. A., Yi, B., Yang, P., Kim, K.-M., Smith, J. A., and Bardeen, C. G.: Impact of radiatively interactive dust aerosols in the NASA GEOS-5 climate model: Sensitivity to dust particle shape and refractive index, J. Geophys. Res.-Atmos., 119, 753–786, https://doi.org/10.1002/2013JD020046, 2014.
Colarco, P. R., Gassó, S., Ahn, C., Buchard, V., da Silva, A. M., and Torres, O.: Simulation of the Ozone Monitoring Instrument aerosol index using the NASA Goddard Earth Observing System aerosol reanalysis products, Atmos. Meas. Tech., 10, 4121–4134, https://doi.org/10.5194/amt-10-4121-2017, 2017.
Collow, A., Lucchesi, R., and Da Silva, A.: File specification for GEOS products sampled along aircraft trajectories, GMAO Office Note No. 18, Version 1.0, 36 pp., https://gmao.gsfc.nasa.gov/pubs/docs/Collow1227.pdf (last access: 7 December 2022), 2020.
Darmenov, A. and da Silva, A.: The Quick Fire Emissions Dataset (QFED): Documentation of versions 2.1, 2.2 and 2.4, NASA/TM–2015–104606, Vol. 38., https://gmao.gsfc.nasa.gov/pubs/docs/Darmenov796.pdf (last access: 1 August 2022), 2015.
Day, D. E., Hand, J. L., Carrico, C. M., Engling, G., and Malm, W. C.: Humidification factors from laboratory studies of fresh smoke from biomass fuels, J. Geophys. Res., 111, D22202, https://doi.org/10.1029/2006JD007221, 2006.
Ding, K., Huang, X., Ding, A., Wang, M., Su, H., Kerminen, V.-M., Petäjä, T., Tan, Z., Wang, Z., Zhou, D., Sun, J., Liao, H., Wang, H., Carslaw, K., Wood, R., Zuidema, P., Rosenfeld, D., Kulmala, M., Fu, C., Pöschl, U., Cheng, Y., and Andreae, M. O.: Aerosol-boundary-layer-monsoon interactions amplify semi-direct effect of biomass smoke on low cloud formation in Southeast Asia, Nat. Commun., 12, 6416, https://doi.org/10.1038/s41467-021-26728-4, 2021.
Edwards, E.-L., Reid, J. S., Xian, P., Burton, S. P., Cook, A. L., Crosbie, E. C., Fenn, M. A., Ferrare, R. A., Freeman, S. W., Hair, J. W., Harper, D. B., Hostetler, C. A., Robinson, C. E., Scarino, A. J., Shook, M. A., Sokolowsky, G. A., van den Heever, S. C., Winstead, E. L., Woods, S., Ziemba, L. D., and Sorooshian, A.: Assessment of NAAPS-RA performance in Maritime Southeast Asia during CAMP2Ex, Atmos. Chem. Phys., 22, 12961–12983, https://doi.org/10.5194/acp-22-12961-2022, 2022.
Freitas, S. R., Putman, W. M., Arnold, N. P., Adams, D. K., and Grell, G. A.: Cascading toward a kilometer-scale GCM: Impacts of a scale-aware convection parameterization in the Goddard Earth Observing System GCM, Geophys. Res. Lett., 47, e2020GL087682, https://doi.org/10.1029/2020GL087682, 2020.
Gelaro, R., McCarty, W., Suárez, M. J., Todling, R., Molod, A., Takacs, L., Randles, C., Darmenov, A., Bosilovich, M. G.,Reichle, R., Wargan, K., Coy, L., Cullather, R., Draper, C., Akella, S., Buchard, V., Conaty, A., da Silva, A., Gu, W., Kim, G.-K., Koster, R., Lucchesi, R., Merkova, D., Nielsen, J. E., Partyka, G., Pawson, S., Putman, W., Rienecker, M., Schubert, S. D., Sienkiewicz, M., and Zhao, B.: The Modern-Era Retrospective Analysis for Research and Applications, Version 2 (MERRA-2), J. Climate, 30, 5419–5454, https://doi.org/10.1175/JCLI-D-16-0758.1, 2017.
Gliß, J., Mortier, A., Schulz, M., Andrews, E., Balkanski, Y., Bauer, S. E., Benedictow, A. M. K., Bian, H., Checa-Garcia, R., Chin, M., Ginoux, P., Griesfeller, J. J., Heckel, A., Kipling, Z., Kirkevåg, A., Kokkola, H., Laj, P., Le Sager, P., Lund, M. T., Lund Myhre, C., Matsui, H., Myhre, G., Neubauer, D., van Noije, T., North, P., Olivié, D. J. L., Rémy, S., Sogacheva, L., Takemura, T., Tsigaridis, K., and Tsyro, S. G.: AeroCom phase III multi-model evaluation of the aerosol life cycle and optical properties using ground- and space-based remote sensing as well as surface in situ observations, Atmos. Chem. Phys., 21, 87–128, https://doi.org/10.5194/acp-21-87-2021, 2021.
Hair, J. W., Hostetler, C. A., Cook, A. L., Harper, D. B., Ferrare, R. A., Mack, T. L., Welch, W., Izquierdo, L. R., and Hovis, F. E.: Airborne high spectral resolution Lidar for profiling aerosol optical properties, Appl. Optics, 47, 6734–6752, 2008.
Hand, J. L., Day, D. E., McMeeking, G. M., Levin, E. J. T., Carrico, C. M., Kreidenweis, S. M., Malm, W. C., Laskin, A., and Desyaterik, Y.: Measured and modeled humidification factors of fresh smoke particles from biomass burning: role of inorganic constituents, Atmos. Chem. Phys., 10, 6179–6194, https://doi.org/10.5194/acp-10-6179-2010, 2010.
Hess, M., Koepke, P., and Schult, I.: Optical Properties of Aerosols and Clouds: The Software Package OPAC, B. Am. Meteorol. Soc., 79, 831–844, https://doi.org/10.1175/1520-0477(1998)079<0831:OPOAAC>2.0.CO;2, 1998.
Hilario, M. R. A., Crosbie, E., Shook, M., Reid, J. S., Cambaliza, M. O. L., Simpas, J. B. B., Ziemba, L., DiGangi, J. P., Diskin, G. S., Nguyen, P., Turk, F. J., Winstead, E., Robinson, C. E., Wang, J., Zhang, J., Wang, Y., Yoon, S., Flynn, J., Alvarez, S. L., Behrangi, A., and Sorooshian, A.: Measurement report: Long-range transport patterns into the tropical northwest Pacific during the CAMP2Ex aircraft campaign: chemical composition, size distributions, and the impact of convection, Atmos. Chem. Phys., 21, 3777–3802, https://doi.org/10.5194/acp-21-3777-2021, 2021.
Hodzic, A. and Jimenez, J. L.: Modeling anthropogenically controlled secondary organic aerosols in a megacity: a simplified framework for global and climate models, Geosci. Model Dev., 4, 901–917, https://doi.org/10.5194/gmd-4-901-2011, 2011.
Holben, B. N., Eck, T. F., Slutsker, I., Tanré, D., Buis, J. P., Setzer, A., Vermote, E., Reagan, J. A., Kaufman, Y. J., Nakajima, T., Lavenu, F., Jankowiak, I., and Smirnov, A.: AERONET – A federated instrument network and data archive for aerosol characterization, Remote Sens. Environ., 66, 1–16, https://doi.org/10.1016/S0034-4257(98)00031-5, 1998.
Hu, W., Day, D. A., Campuzano-Jost, P., Nault, B. A., Park, T., Lee, T., Croteau, P., Canagaratna, M. R., Jayne, J. T., Worsnop, D. R., and Jimenez, J. L.: Evaluation of the new capture vaporizer for aerosol mass spectrometers (AMS): Elemental composition and source apportionment of organic aerosols (OA), ACS Earth Space Chem., 2, 410–421, https://doi.org/10.1021/acsearthspacechem.8b00002, 2018.
Janssens-Maenhout, G., Crippa, M., Guizzardi, D., Dentener, F., Muntean, M., Pouliot, G., Keating, T., Zhang, Q., Kurokawa, J., Wankmüller, R., Denier van der Gon, H., Kuenen, J. J. P., Klimont, Z., Frost, G., Darras, S., Koffi, B., and Li, M.: HTAP_v2.2: a mosaic of regional and global emission grid maps for 2008 and 2010 to study hemispheric transport of air pollution, Atmos. Chem. Phys., 15, 11411–11432, https://doi.org/10.5194/acp-15-11411-2015, 2015.
June, N. A., Hodshire, A. L., Wiggins, E. B., Winstead, E. L., Robinson, C. E., Thornhill, K. L., Sanchez, K. J., Moore, R. H., Pagonis, D., Guo, H., Campuzano-Jost, P., Jimenez, J. L., Coggon, M. M., Dean-Day, J. M., Bui, T. P., Peischl, J., Yokelson, R. J., Alvarado, M. J., Kreidenweis, S. M., Jathar, S. H., and Pierce, J. R.: Aerosol size distribution changes in FIREX-AQ biomass burning plumes: the impact of plume concentration on coagulation and OA condensation/evaporation, Atmos. Chem. Phys., 22, 12803–12825, https://doi.org/10.5194/acp-22-12803-2022, 2022.
Kacarab, M., Thornhill, K. L., Dobracki, A., Howell, S. G., O'Brien, J. R., Freitag, S., Poellot, M. R., Wood, R., Zuidema, P., Redemann, J., and Nenes, A.: Biomass burning aerosol as a modulator of the droplet number in the southeast Atlantic region, Atmos. Chem. Phys., 20, 3029–3040, https://doi.org/10.5194/acp-20-3029-2020, 2020.
Kulkarni, P. and Wang, J.: New fast integrated mobility spectrometer for real-time measurement of aerosol size distribution – I: Concept and theory, J. Aerosol Sci., 37, 1303–1325, https://doi.org/10.1016/j.jaerosci.2006.01.005, 2006.
Li, Y.: Cloud condensation nuclei activity and hygroscopicity of fresh and aged biomass burning particles, Pure Appl. Geophys., 176, 345–356, https://doi.org/10.1007/s00024-018-1903-0, 2019.
Mallet, M., Solmon, F., Nabat, P., Elguindi, N., Waquet, F., Bouniol, D., Sayer, A. M., Meyer, K., Roehrig, R., Michou, M., Zuidema, P., Flamant, C., Redemann, J., and Formenti, P.: Direct and semi-direct radiative forcing of biomass-burning aerosols over the southeast Atlantic (SEA) and its sensitivity to absorbing properties: a regional climate modeling study, Atmos. Chem. Phys., 20, 13191–13216, https://doi.org/10.5194/acp-20-13191-2020, 2020.
McNaughton, C. S., Clarke, A. D., Howell, S. G., Pinkerton, M., Anderson, B., Thornhill, L., Hudgins, C., Winstead, E., Dibb, J. E., Scheuer E., and Maring, H.: Results from the DC-8 Inlet Characterization Experiment (DICE): Airborne versus surface sampling of mineral dust and sea salt aerosols, Aerosol Sci. Tech., 41, 136–159, https://doi.org/10.1080/02786820601118406, 2006.
Mian Chin, Diehl, T., Dubovik, O., Eck, T. F., Holben, B. N., Sinyuk, A., and Streets, D. G.: Light absorption by pollution, dust, and biomass burning aerosols: a global model study and evaluation with AERONET measurements, Ann. Geophys., 27, 3439–3464, https://doi.org/10.5194/angeo-27-3439-2009, 2009.
NASA ASDC: Clouds, Aerosol and Monsoon Processes – Philippines Experiment, NASA ASDC [data set], https://doi.org/10.5067/Suborbital/CAMP2EX2018/DATA001, 2020.
NASA/LARC/SD/ASDC: CAMP2Ex P-3 In-Situ Trace Gas Data, NASA Langley Atmospheric Science Data Center DAAC [data set], https://doi.org/10.5067/Airborne/CAMP2Ex_TraceGas_AircraftInSitu_P3_Data_1, 2020.
NCCS Dataportal: https://portal.nccs.nasa.gov/datashare/iesa/campaigns/CAMP2EX/, last access: 13 December 2022.
Norris, P., Takacs, L. L., Putman, W., Coy, L., Pawson, S., Mlawer, E., and Iacono, M.: Transition to the RRTMG shortwave radiation code in GEOS models, https://gmao.gsfc.nasa.gov/researchbriefs/sw_rrtmg_transition/sw_rrtmg_transition.pdf (last access: 22 November 2021), 2020.
Ott, L., Duncan, B., Pawson, S., Colarco, P., Chin, M., Randles, C., Diehl, T., and Nielsen, E.: Influence of the 2006 Indonesian biomass burning aerosols on tropical dynamics studied with the GEOS-5 AGCM, J. Geophys. Res.-Atmos., 115, D14121, https://doi.org/10.1029/2009jd013181, 2010.
Pan, X., Ichoku, C., Chin, M., Bian, H., Darmenov, A., Colarco, P., Ellison, L., Kucsera, T., da Silva, A., Wang, J., Oda, T., and Cui, G.: Six global biomass burning emission datasets: intercomparison and application in one global aerosol model, Atmos. Chem. Phys., 20, 969–994, https://doi.org/10.5194/acp-20-969-2020, 2020.
Petrenko, M., Kahn, R., Chin, M., and Limbacher, J.: Refined use of satellite aerosol optical depth snapshots to constrain biomass burning emissions in the GOCART model, J. Geophys. Res.-Atmos., 122, 10983–11004, https://doi.org/10.1002/2017JD026693, 2017.
Pistone, K., Redemann, J., Doherty, S., Zuidema, P., Burton, S., Cairns, B., Cochrane, S., Ferrare, R., Flynn, C., Freitag, S., Howell, S. G., Kacenelenbogen, M., LeBlanc, S., Liu, X., Schmidt, K. S., Sedlacek III, A. J., Segal-Rozenhaimer, M., Shinozuka, Y., Stamnes, S., van Diedenhoven, B., Van Harten, G., and Xu, F.: Intercomparison of biomass burning aerosol optical properties from in situ and remote-sensing instruments in ORACLES-2016, Atmos. Chem. Phys., 19, 9181–9208, https://doi.org/10.5194/acp-19-9181-2019, 2019.
Randles, C. A., da Silva, A. M., Buchard, V., Colarco, P. R., Darmenov, A., Govindaraju, R., Smirnov, A., Holben, B., Ferrare, R., Hair, J., Shinozuka, Y., and Flynn, C. J.: The MERRA-2 Aerosol Reanalysis, 1980 onward. Part I: System description and data assimilation evaluation, J. Climate, 30, 6823–6850, https://doi.org/10.1175/JCLI-D-16-0609.1, 2017.
Reid, J. S., Koppmann, R., Eck, T. F., and Eleuterio, D. P.: A review of biomass burning emissions part II: intensive physical properties of biomass burning particles, Atmos. Chem. Phys., 5, 799–825, https://doi.org/10.5194/acp-5-799-2005, 2005.
Reid, J. S., Xian, P., Hyer, E. J., Flatau, M. K., Ramirez, E. M., Turk, F. J., Sampson, C. R., Zhang, C., Fukada, E. M., and Maloney, E. D.: Multi-scale meteorological conceptual analysis of observed active fire hotspot activity and smoke optical depth in the Maritime Continent, Atmos. Chem. Phys., 12, 2117–2147, https://doi.org/10.5194/acp-12-2117-2012, 2012.
Rienecker, M. M., Suarez, M. J., Todling, R., Bacmeister, J., Takacs, L., Liu, H.-C., Gu, W., Sienkiewicz, M., Koster, R. D., Gelaro, R., Stajner, I., and Nielsen, J. E.: The GEOS-5 Data Assimilation System – documentation of Versions 5.0.1, 5.1.0, and 5.2.0, NASA/TM–2008–104606, 27, 1–118, https://gmao.gsfc.nasa.gov/pubs/docs/Rienecker369.pdf (last access: 7 December 2022), 2008.
Scarino, A. J., Obland, M. D., Fast, J. D., Burton, S. P., Ferrare, R. A., Hostetler, C. A., Berg, L. K., Lefer, B., Haman, C., Hair, J. W., Rogers, R. R., Butler, C., Cook, A. L., and Harper, D. B.: Comparison of mixed layer heights from airborne high spectral resolution lidar, ground-based measurements, and the WRF-Chem model during CalNex and CARES, Atmos. Chem. Phys., 14, 5547–5560, https://doi.org/10.5194/acp-14-5547-2014, 2014.
Shingler, T., Sorooshian, A., Ortega, A., Crosbie, E., Wonaschutz, A., Perring, A. E., Beyersdorf, A., Ziemba, L., Jimenez, J. L., Campuzano-Jost, P., Mikoviny, T., Wisthaler, A., and Russell, L. M.: Ambient observations of hygroscopic growth factor and f(RH) below 1: Case studies from surface and airborne measurements, J. Geophys. Res.-Atmos., 121, 13661–13677, https://doi.org/10.1002/2016jd025471, 2016.
Shinozuka, Y., Saide, P. E., Ferrada, G. A., Burton, S. P., Ferrare, R., Doherty, S. J., Gordon, H., Longo, K., Mallet, M., Feng, Y., Wang, Q., Cheng, Y., Dobracki, A., Freitag, S., Howell, S. G., LeBlanc, S., Flynn, C., Segal-Rosenhaimer, M., Pistone, K., Podolske, J. R., Stith, E. J., Bennett, J. R., Carmichael, G. R., da Silva, A., Govindaraju, R., Leung, R., Zhang, Y., Pfister, L., Ryoo, J.-M., Redemann, J., Wood, R., and Zuidema, P.: Modeling the smoky troposphere of the southeast Atlantic: a comparison to ORACLES airborne observations from September of 2016, Atmos. Chem. Phys., 20, 11491–11526, https://doi.org/10.5194/acp-20-11491-2020, 2020.
Tang, J., Li, J., Su, T., Han, Y., Mo, Y., Jiang, H., Cui, M., Jiang, B., Chen, Y., Tang, J., Song, J., Peng, P., and Zhang, G.: Molecular compositions and optical properties of dissolved brown carbon in biomass burning, coal combustion, and vehicle emission aerosols illuminated by excitation–emission matrix spectroscopy and Fourier transform ion cyclotron resonance mass spectrometry analysis, Atmos. Chem. Phys., 20, 2513–2532, https://doi.org/10.5194/acp-20-2513-2020, 2020.
Tsigaridis, K., Daskalakis, N., Kanakidou, M., Adams, P. J., Artaxo, P., Bahadur, R., Balkanski, Y., Bauer, S. E., Bellouin, N., Benedetti, A., Bergman, T., Berntsen, T. K., Beukes, J. P., Bian, H., Carslaw, K. S., Chin, M., Curci, G., Diehl, T., Easter, R. C., Ghan, S. J., Gong, S. L., Hodzic, A., Hoyle, C. R., Iversen, T., Jathar, S., Jimenez, J. L., Kaiser, J. W., Kirkevåg, A., Koch, D., Kokkola, H., Lee, Y. H., Lin, G., Liu, X., Luo, G., Ma, X., Mann, G. W., Mihalopoulos, N., Morcrette, J.-J., Müller, J.-F., Myhre, G., Myriokefalitakis, S., Ng, N. L., O'Donnell, D., Penner, J. E., Pozzoli, L., Pringle, K. J., Russell, L. M., Schulz, M., Sciare, J., Seland, Ø., Shindell, D. T., Sillman, S., Skeie, R. B., Spracklen, D., Stavrakou, T., Steenrod, S. D., Takemura, T., Tiitta, P., Tilmes, S., Tost, H., van Noije, T., van Zyl, P. G., von Salzen, K., Yu, F., Wang, Z., Wang, Z., Zaveri, R. A., Zhang, H., Zhang, K., Zhang, Q., and Zhang, X.: The AeroCom evaluation and intercomparison of organic aerosol in global models, Atmos. Chem. Phys., 14, 10845–10895, https://doi.org/10.5194/acp-14-10845-2014, 2014.
Wang, B., Huang, F., Wu, Z., Yang, J., Fu, X., and Kikuchi, K.: Multi-scale climate variability of the South China Sea monsoon: A review, Dynam. Atmos. Oceans, 47, 15–37, https://doi.org/10.1016/j.dynatmoce.2008.09.004, 2009.
Wang, J., Pikridas, M., Spielman, S. R., and Pinterich, T.: A fast integrated mobility spectrometer for rapid measurement of sub-micrometer aerosol size distribution, Part I: Design and model evaluation, J. Aerosol Sci., 108, 44–55, https://doi.org/10.1016/j.jaerosci.2017.02.012, 2017.
Wang, M., Chen, Y., Fu, H., Qu, X., Li, B., Tao, S., and Zhu, D.: An investigation on hygroscopic properties of 15 black carbon (BC)-containing particles from different carbon sources: roles of organic and inorganic components, Atmos. Chem. Phys., 20, 7941–7954, https://doi.org/10.5194/acp-20-7941-2020, 2020.
Wang, Y., Ma, P.-L., Peng, J., Zhang, R., Jiang, J. H., Easter, R. C., and Yung, Y. L.: Constraining aging processes of black carbon in the Community Atmosphere Model using environmental chamber measurements, J. Adv. Model. Earth Sy., 10, 2514–2516, https://doi.org/10.1029/2018MS001387, 2018.
Xian, P., Reid, J. S., Atwood, S. A., Johnson, R., Hyer, E. J., Westphal, D. L., and Sessions, W.: Smoke transport patters over the Maritime Continent, Atmos. Res., 122, 469–485, https://doi.org/10.1016/j.atmosres.2012.05.006, 2013.
Yin, S.: Biomass burning spatiotemporal variations over South and Southeast Asia, Environ. Int., 145, 106153, https://doi.org/10.1016/j.envint.2020.106153, 2020.
Zheng, G., Sedlacek, A. J., Aiken, A. C., Feng, Y., Watson, T. B., Raveh-Rubin, S., Uin, J., Lewis, E. R., and Wang, J.: Long-range transported North American wildfire aerosols observed in marine boundary layer of eastern North Atlantic, Environ. Int., 139, 105680, https://doi.org/10.1016/j.envint.2020.105680, 2020.