the Creative Commons Attribution 4.0 License.
the Creative Commons Attribution 4.0 License.
 | 15 Dec 2022
Fundamental oxidation processes in the remote marine atmosphere investigated using the NO–NO2–O3 photostationary state
Simone T. Andersen
Beth S. Nelson
Katie A. Read
Shalini Punjabi
Luis Neves
Matthew J. Rowlinson
James Hopkins
Tomás Sherwen
Lisa K. Whalley
James D. Lee
Lucy J. Carpenter
The photostationary state (PSS) equilibrium between NO and NO2 is reached within minutes in the atmosphere and can be described by the PSS parameter, φ. Deviations from expected values of φ have previously been used to infer missing oxidants in diverse locations, from highly polluted regions to the extremely clean conditions observed in the remote marine boundary layer (MBL), and have been interpreted as missing understanding of fundamental photochemistry. Here, contrary to these previous observations, we observe good agreement between PSS-derived NO2 ([NO2]PSS ext.), calculated from measured NO, O3, and jNO2 and photochemical box model predictions of peroxy radicals (RO2 and HO2), and observed NO2 ([NO2]Obs.) in extremely clean air containing low levels of CO (<90 ppbV) and VOCs (volatile organic compounds). However, in clean air containing small amounts of aged pollution (CO > 100 ppbV), we observed higher levels of NO2 than inferred from the PSS, with [NO2]Obs. [NO2]PSS ext. of 1.12–1.68 (25th–75th percentile), implying underestimation of RO2 radicals by 18.5–104 pptV. Potential NO2 measurement artefacts have to be carefully considered when comparing PSS-derived NO2 to observed NO2, but we show that the NO2 artefact required to explain the deviation would have to be ∼ 4 times greater than the maximum calculated from known interferences. If the additional RO2 radicals inferred from the PSS convert NO to NO2 with a reaction rate equivalent to that of methyl peroxy radicals (CH3O2), then the calculated net ozone production rate (NOPR, ppbV h−1) including these additional oxidants is similar to the average change in O3 observed, within estimated uncertainties, once halogen oxide chemistry is accounted for. This implies that such additional peroxy radicals cannot be excluded as a missing oxidant in clean marine air containing aged pollution and that modelled RO2 concentrations are significantly underestimated under these conditions.
- Article
(1526 KB) - Full-text XML
-
Supplement
(2220 KB) - BibTeX
- EndNote


Tropospheric NO, NO2, and O3 are rapidly interconverted during the day via Reactions (R1)–(R3), where NO is oxidised by O3 into NO2, which is then photolyzed into NO and O(3P), followed by a fast reaction of O(3P) with O2 to return O3.
The photostationary state (PSS) equilibrium between NO and NO2 is reached within minutes (Leighton, 1961) if it is not impacted by fresh NOx emissions and if the photolysis rate does not change quickly such as under rapidly changing cloud coverage (Mannschreck et al., 2004). The photostationary state can be described by the Leighton ratio (Leighton, 1961, Eq. 1), where jNO2 is the photolysis rate of NO2 and φ is the PSS parameter.
Under conditions where O3 is the only oxidant converting NO to NO2, φ is equal to 1 and NO2 at PSS can be estimated from the measured NO, O3, and jNO2 (Eq. 2).
Deviations from φ=1 suggest the presence of additional chemistry occurring (Calvert and Stockwell, 1983), particularly the conversion of NO to NO2 by reaction with an oxidant other than O3, such as hydroperoxy radicals (HO2) and organic peroxy radicals (RO2) (Reactions R4–R5, where R represents any organic functional group) or with halogen oxides (IO, BrO; Reactions R6–R7) in the marine atmosphere.
By including these additional NO oxidation reactions, the NO2 concentration at PSS can be estimated using Eq. (3). The photostationary state of can also be used to estimate the sum of HO2 and RO2 (ROx) or the sum of BrO and IO (XO) in the atmosphere using Eqs. (4) and (5) and assuming that k4=k5 and k6=k7, respectively:
Previous studies reporting deviations in the PSS parameter to estimate ROx concentrations in the atmosphere are summarised in Table 1, which compares [ROx]PSS against measured and/or modelled [ROx]. Measurements of ROx are predominantly conducted using chemical amplification, where each RO2 and HO2 molecule in ambient air leads to the formation of several NO2 molecules by chain reactions caused by the addition of high concentrations of NO and CO (Cantrell et al., 1993b). The resultant NO2 can be detected and converted back to a ROx concentration by quantification of the chain length of the reactions via calibration, typically using known concentrations of CH3O2 or peroxyacetyl (CH3C(O)O2) radicals (Cantrell et al., 1993b; Miyazaki et al., 2010; Wood and Charest, 2014). Since the basis of the chemical amplification technique is detection of ROx radicals from their ability to oxidise NO to NO2 (Reactions R4 and R5), which is also used to estimate ROx from the PSS, the ROx concentrations determined from these methods would be expected to agree reasonably well. However, PSS-derived ROx concentrations are generally higher than both measured values and those calculated from models and steady-state equations in rural conditions (Cantrell et al., 1997, 1993a; Ma et al., 2017; Mannschreck et al., 2004; Volz-Thomas et al., 2003) with exceptions such as in the Pearl River Delta where PSS-derived and measured ROx were comparable (Ma et al., 2017). During campaigns in relatively clean regions with moderate influence from pollution (Amazon Basin and Arabian Peninsula), median PSS-derived ROx modelled ROx (both box and 3D) ratios have been shown to be around 1, albeit with large variations in the data (Tadic et al., 2020; Trebs et al., 2012). In the remote marine boundary layer (MBL), PSS-derived ROx has been observed to be 1.27 times higher than the measured ROx over the South Atlantic Ocean, which itself was approximately 4 times higher than box-modelled (Hosaynali Beygi et al., 2011).
Table 1Summary of previous studies which have compared [ROx]PSS against measured and/or modelled [ROx] in rural, marine, and remote conditions.
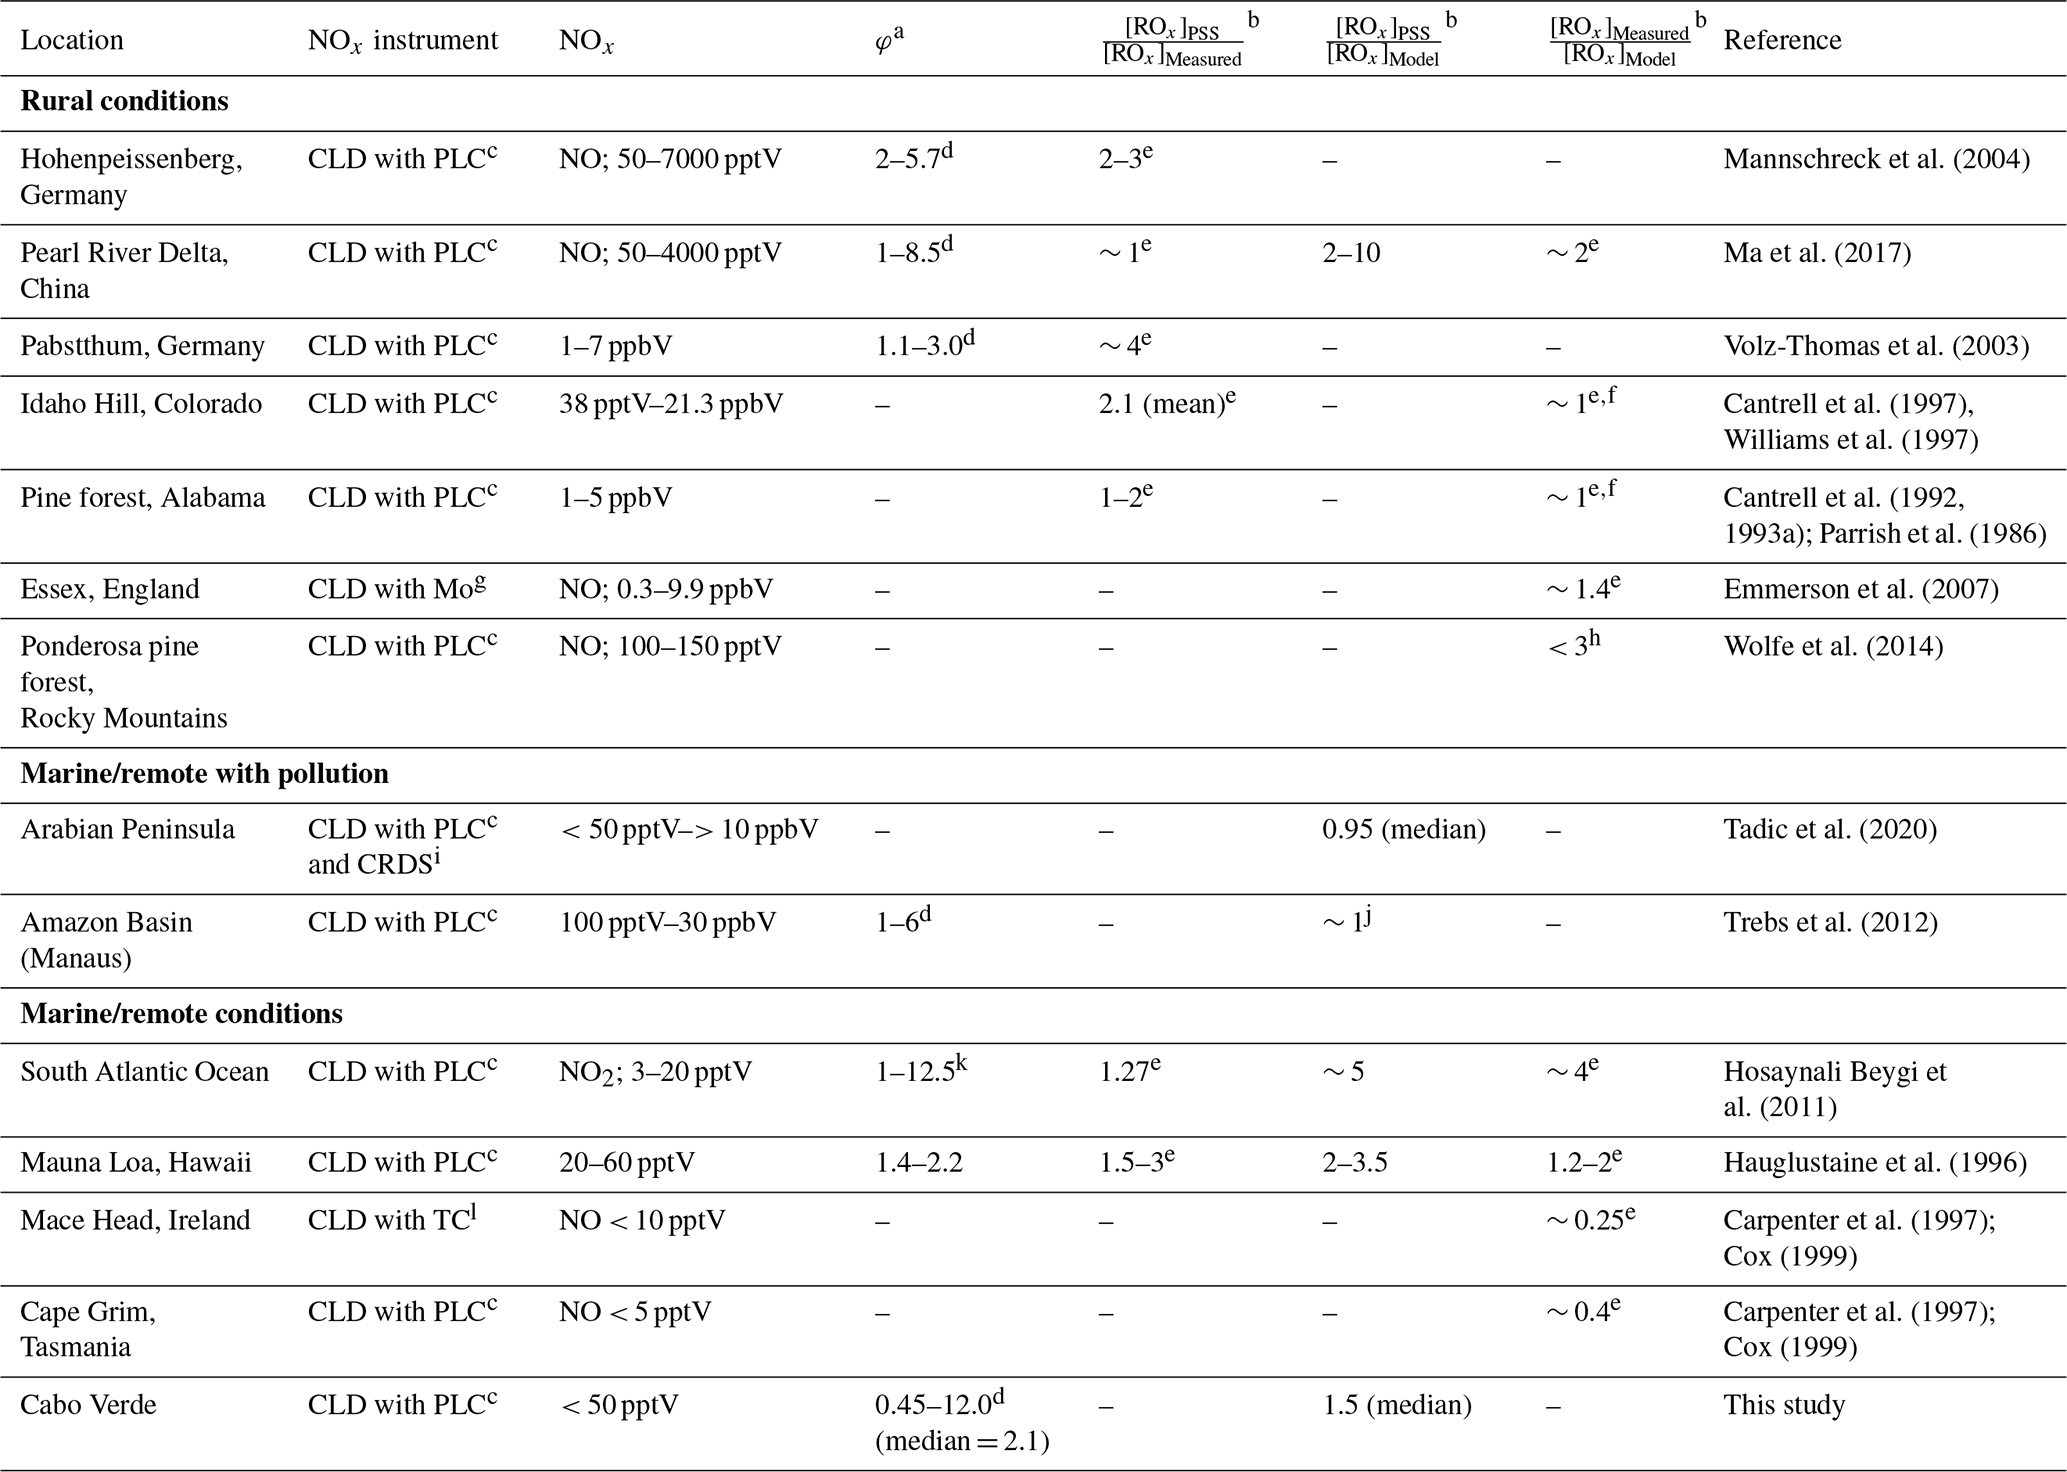
a Without radicals and halogens. b [ROx] = [HO2] + [RO2]. c CLD with PLC = Detection by chemiluminescence with photolytic converter for NO2. d Increasing φ with decreasing [NO], [NO2], or [NOx]. e [ROx] measured by chemical amplification. f Calculated/modelled using steady-state theory. g CLD with Mo = Detection by chemiluminescence with molybdenum converter. h [ROx] measured by peroxy radical chemical ionization mass spectrometry (PeRCIMS). i CRDS = Cavity ring down spectroscopy. j PSS derived [ROx] was within the range of the modelled values. k Increasing φ with increasing [NO2]. l CLD with TC = Detection by chemiluminescence with thermal converter.
Differences between measured, modelled, and PSS-derived ROx can be due to a variety of reasons. ROx concentrations calculated by box models rely on comprehensive constraint from co-measured trace gases and a reaction scheme which accurately represents the most important photochemical processes. Incomplete characterisation of ambient trace gases and/or reaction schemes can therefore result in uncertain ROx predictions. Large deviations (factor of ∼ 3) between box-modelled and measured ROx levels in a pine forest in the Rocky Mountains were attributed to a combination of a missing photolytic source of HO2 at midday and a missing reaction forming RO2 independently of sunlight in the model scheme (Wolfe et al., 2014). PSS-derived ROx can be significantly over- or underestimated if PSS has not been established, for example due to rapidly changing photolysis rates or local sources of NOx (Mannschreck et al., 2004). Another reason for overestimation of PSS-derived ROx is NO2 measurement artefacts (Bradshaw et al., 1999; Crawford et al., 1996), which results in overestimated NO2 concentrations. These are common in chemiluminescence instruments and can be due to photolytic or thermal decomposition of HONO, peroxyacetyl nitrate (PAN), and other nitrate molecules in the atmosphere (Bradshaw et al., 1999; Gao et al., 1994; Parrish et al., 1990; Pollack et al., 2010; Reed et al., 2016; Ridley et al., 1988; Ryerson et al., 2000).
Measurements of ROx are also not without challenges due to effects from e.g. the high reactivity of ROx, humidity, non-linearity of the NO2 detection, and formation of organic nitrates and nitrites. In the first chemical amplification instruments, NO2 was detected by luminol chemiluminescence, which has a non-linear response to NO2 resulting in the need for a multipoint calibration (Cantrell et al., 1997). However, more recent instruments use cavity attenuated phase shift (CAPS) spectroscopy (Duncianu et al., 2020; Wood and Charest, 2014), laser induced fluorescence (LIF) (Sadanaga et al., 2004), or cavity ring down spectroscopy (CRDS) (Liu and Zhang, 2014) for detection of NO2, all of which have been shown to have a linear response. Chemical amplifiers are usually only calibrated for one or two types of peroxy radicals. However, the chain length of each peroxy radical varies, resulting in a different amount of NO2 production depending on the mixture of peroxy radicals present, which could lead to over/underestimations depending on the ambient mixture. Additionally, the chain length is significantly affected by humidity due to the increase in HO2 wall loss on humid surfaces and to an enhanced termination rate of HO2 by reaction with NO to give HNO3. HO2 has been shown to form a complex with H2O (HO2 • H2O), which reacts 4–8 times faster with NO, creating HNO3, at 50 % relative humidity (RH) compared to under dry conditions (Butkovskaya et al., 2007, 2009; Duncianu et al., 2020). This leads to the measured chain length decreasing by a factor of 2 when going from dry conditions to 40 % RH and by a factor of 3 at 70 % RH (Duncianu et al., 2020; Mihele and Hastie, 1998). Finally, the chain length is impacted by the gas reagents (NO and CO). Peroxy radicals and alkoxy radicals (RO) can react with NO to create organic nitrates and nitrites, which terminates the chain reaction, preventing further radical propagation processes. This is favoured by longer chain peroxy radicals and at high NO concentrations. The formation yield of organic nitrates and nitrites differs from a few percent to up to ∼ 23 % depending on the nature of the R group present (Duncianu et al., 2020). The studies summarised in Table 1 using chemical amplification to measure total ROx have estimated the total uncertainty of the measurements to vary from 10 %–60 % (1σ) with the most recent study estimating the highest uncertainty (Ma et al., 2017).
In the presence of sufficient levels of NO, additional ambient peroxy radicals not accounted for in photochemical models should lead to an underestimation of the simulated production rate of O3, which occurs via Reactions (R4) and (R5) followed by photolysis of NO2. The production rate of O3 (P(O3)) can be calculated using Eq. (6):
Volz-Thomas et al. (2003) calculated O3 production rates from PSS-derived and chemical amplification-measured ROx during the BERLIOZ campaign in Pabstthum, Germany, resulting in an average of ∼ 20 and ∼ 2 ppbV h−1 across the campaign, respectively. The large difference was credited to an unknown process that converts NO into NO2 without causing additional O3 production (Volz-Thomas et al., 2003). This is possible if NO is oxidised by an oxidant which also destroys O3, similarly to halogen atoms/halogen oxides. This hypothesis is consistent with observations by Parrish et al. (1986) at a mountain station in Colorado, where a missing oxidant of photolytic origin was identified (Parrish et al., 1986). It was shown that if the NO to NO2 oxidation was completely due to ROx, the increased O3 production would result in O3 levels significantly higher than measured, yet if the oxidant exhibited similar reaction mechanisms to IO, extremely high (70 pptV) mixing ratios of IO would be needed (Parrish et al., 1986). These IO levels are more than an order of magnitude higher than observations in the marine atmosphere (Inamdar et al., 2020; Mahajan et al., 2010; Prados-Roman et al., 2015; Read et al., 2008).
In regions where the net O3 production rate (NOPR) is negligible or negative during the day due to very low NO levels, it is more relevant to compare the NOPR to the observed change in [O3]. The chemical NOPR can be calculated as the difference between the photochemical processes producing and destroying O3:
where P(O3) is determined using Eq. (6) and the loss rate of O3 (L(O3)) is usually determined from Reactions (R8)–(R12). Additionally, halogens have previously been shown to cause an O3 loss of 0.23±0.05 ppbV h−1 in the MBL (initiated by Reaction R13) (Read et al., 2008), which is in line with other studies suggesting that halogens can have a significant impact on O3 in marine environments (Saiz-Lopez et al., 2012; Sherwen et al., 2016; Vogt et al., 1999).
The actual rate of change of [O3] within the planetary boundary layer is also impacted by the physical processes of advection, deposition, and entrainment, which complicates comparisons with the NOPR. However, if these physical processes change only negligibly over the course of a day, such as in marine well-mixed air masses, their net influence can be deduced from the net night time change in O3 (Ayers and Galbally, 1995; Ayers et al., 1992; Read et al., 2008), allowing a calculation of the NOPR from observations. A comparison of the observed and calculated NOPR gives an indication of whether production and loss rates of O3 from known processes are sufficient to explain the observed O3 tendency (Read et al., 2008).
From the studies shown in Table 1, there is clearly widespread evidence of enhanced PSS-derived RO2 compared to measurements and models; however, all methods to derive ROx are not without challenges as described above. The large uncertainties associated with ROx measurements, especially at high humidities where the chain length is significantly impacted by enhanced wall loss and the production of HNO3, suggest that measurements could be underestimating ROx in the atmosphere. Previous studies also find that the additional conversion of NO to NO2 caused by the extra “RO2” should only produce minimal additional O3, or at least lead to additional O3 destruction, thus inferring an unknown missing oxidant which exhibits different chemical behaviour to peroxy radicals.
Up to 25 % of methane removal occurs in the tropical MBL due to the high photochemical activity and humidity resulting in high OH radical concentrations (Bloss et al., 2005). Thus, it is crucially important to understand the fundamental oxidation processes, such as the NOx-O3 cycle, occurring in this region. However, remote NOx measurements are rare due to the difficulty in measuring very low (pptV) mixing ratios. Most previous remote NOx measurements have taken place during short campaigns and do not give information on seasonal changes and long-term trends (Carsey et al., 1997; Jacob et al., 1996; Peterson and Honrath, 1999; Rhoads et al., 1997). Here, we investigate the photostationary state under clean marine conditions from 3 years of observations (2017–2020) at the Cape Verde Atmospheric Observatory (CVAO) in the tropical east Atlantic, representing a unique dataset to investigate NOx-O3 chemistry in the remote MBL (Andersen et al., 2021; Carpenter et al., 2010; Lee et al., 2009). We also compare the chemical net O3 production rate (NOPR) calculated from a box model with NOPR derived from the observed net O3 rate of change, in order to evaluate the possibility of missing peroxy radicals in this remote environment.
2.1 Measurements
Year-round measurements of meteorological parameters and trace gases including NO, NO2, and C2-C8 VOCs (volatile organic compounds) have been conducted at the CVAO (16∘51′ N, 24∘52′ W) since October 2006. The CVAO is located on the northeastern coast of São Vicente, Cabo Verde. The air sampled predominantly comes from the northeast (see Fig. 1) and has travelled over the Atlantic Ocean for multiple days since the last exposure to anthropogenic emissions, with the potential exception of ship emissions (Carpenter et al., 2010; Read et al., 2008). This makes it an ideal location to investigate fundamental photochemistry in an ultra-clean environment.
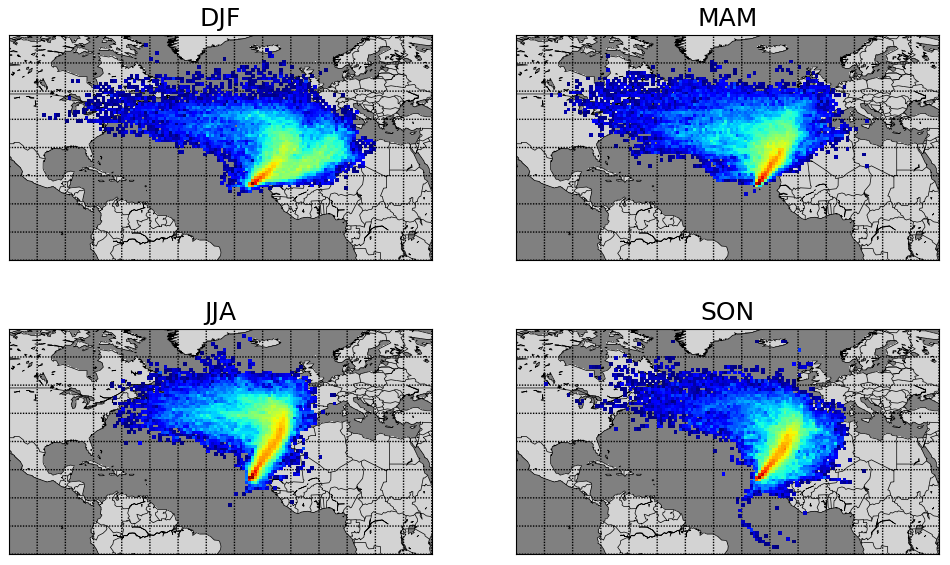
Figure 1Seasonal average 10 d back trajectories for the CVAO. Locations of released particles are plotted on a 1∘ × 1∘ grid, determined using FLEXPART as described in Andersen et al. (2021).
Wind speed (m s−1), wind direction (∘), temperature (∘C), relative humidity (%), barometric pressure (mbar), and total solar radiation (W m−2) are measured at a height of 7.5 m using an automatic weather station from Campbell Scientific. NO and NO2 have been measured using an ultra-high sensitivity NO chemiluminescence instrument, which measures NO2 by photolytic conversion to NO, at the CVAO since 2006 (Lee et al., 2009). The technique and data analysis have been described in detail elsewhere (Andersen et al., 2021). O3 is measured using a Thermo Scientific 49i Ozone monitor as described in Read et al. (2008). Photolysis rates of a variety of species were measured in 2020 using a spectral radiometer (a 2π sr quartz diffuser coupled to an Ocean Optics QE65000 spectrometer via a 10 m fibre optic cable). Prior to 2020, photolysis rates are calculated in this study based on the correlation between the measured photolysis rates in 2020 and the total solar radiation, as described in the Supplement. Average jNO2 and jO(1D) for different seasons are shown in Table 2. VOCs are measured using a dual channel Agilent 7890A gas chromatograph coupled with a flame ionization detector (GC-FID) and a MARKES thermal desorption unit with an ozone precursor trap that is cooled to −30 ∘C (Read et al., 2009). Details of the calibration and uncertainties are given in the World Calibration Centre (WCC) VOC audit report (Steinbrecher, 2019). Examples of the VOCs measured at the CVAO can be found in Table 2. Carbon monoxide (CO) and methane (CH4) are measured using a cavity ring down spectrometer (CRDS), G2401 manufactured by Picarro Inc, following the Global Atmosphere Watch (GAW) recommended technique for long-term remote measurements. The instrument is highly linear, has a precision of 1 and 0.3 ppbV over 10 min for CO and CH4, respectively, and no measurable drift (Zellweger et al., 2016, 2012).
Table 2Overview of instruments and measurements used from the CVAO.
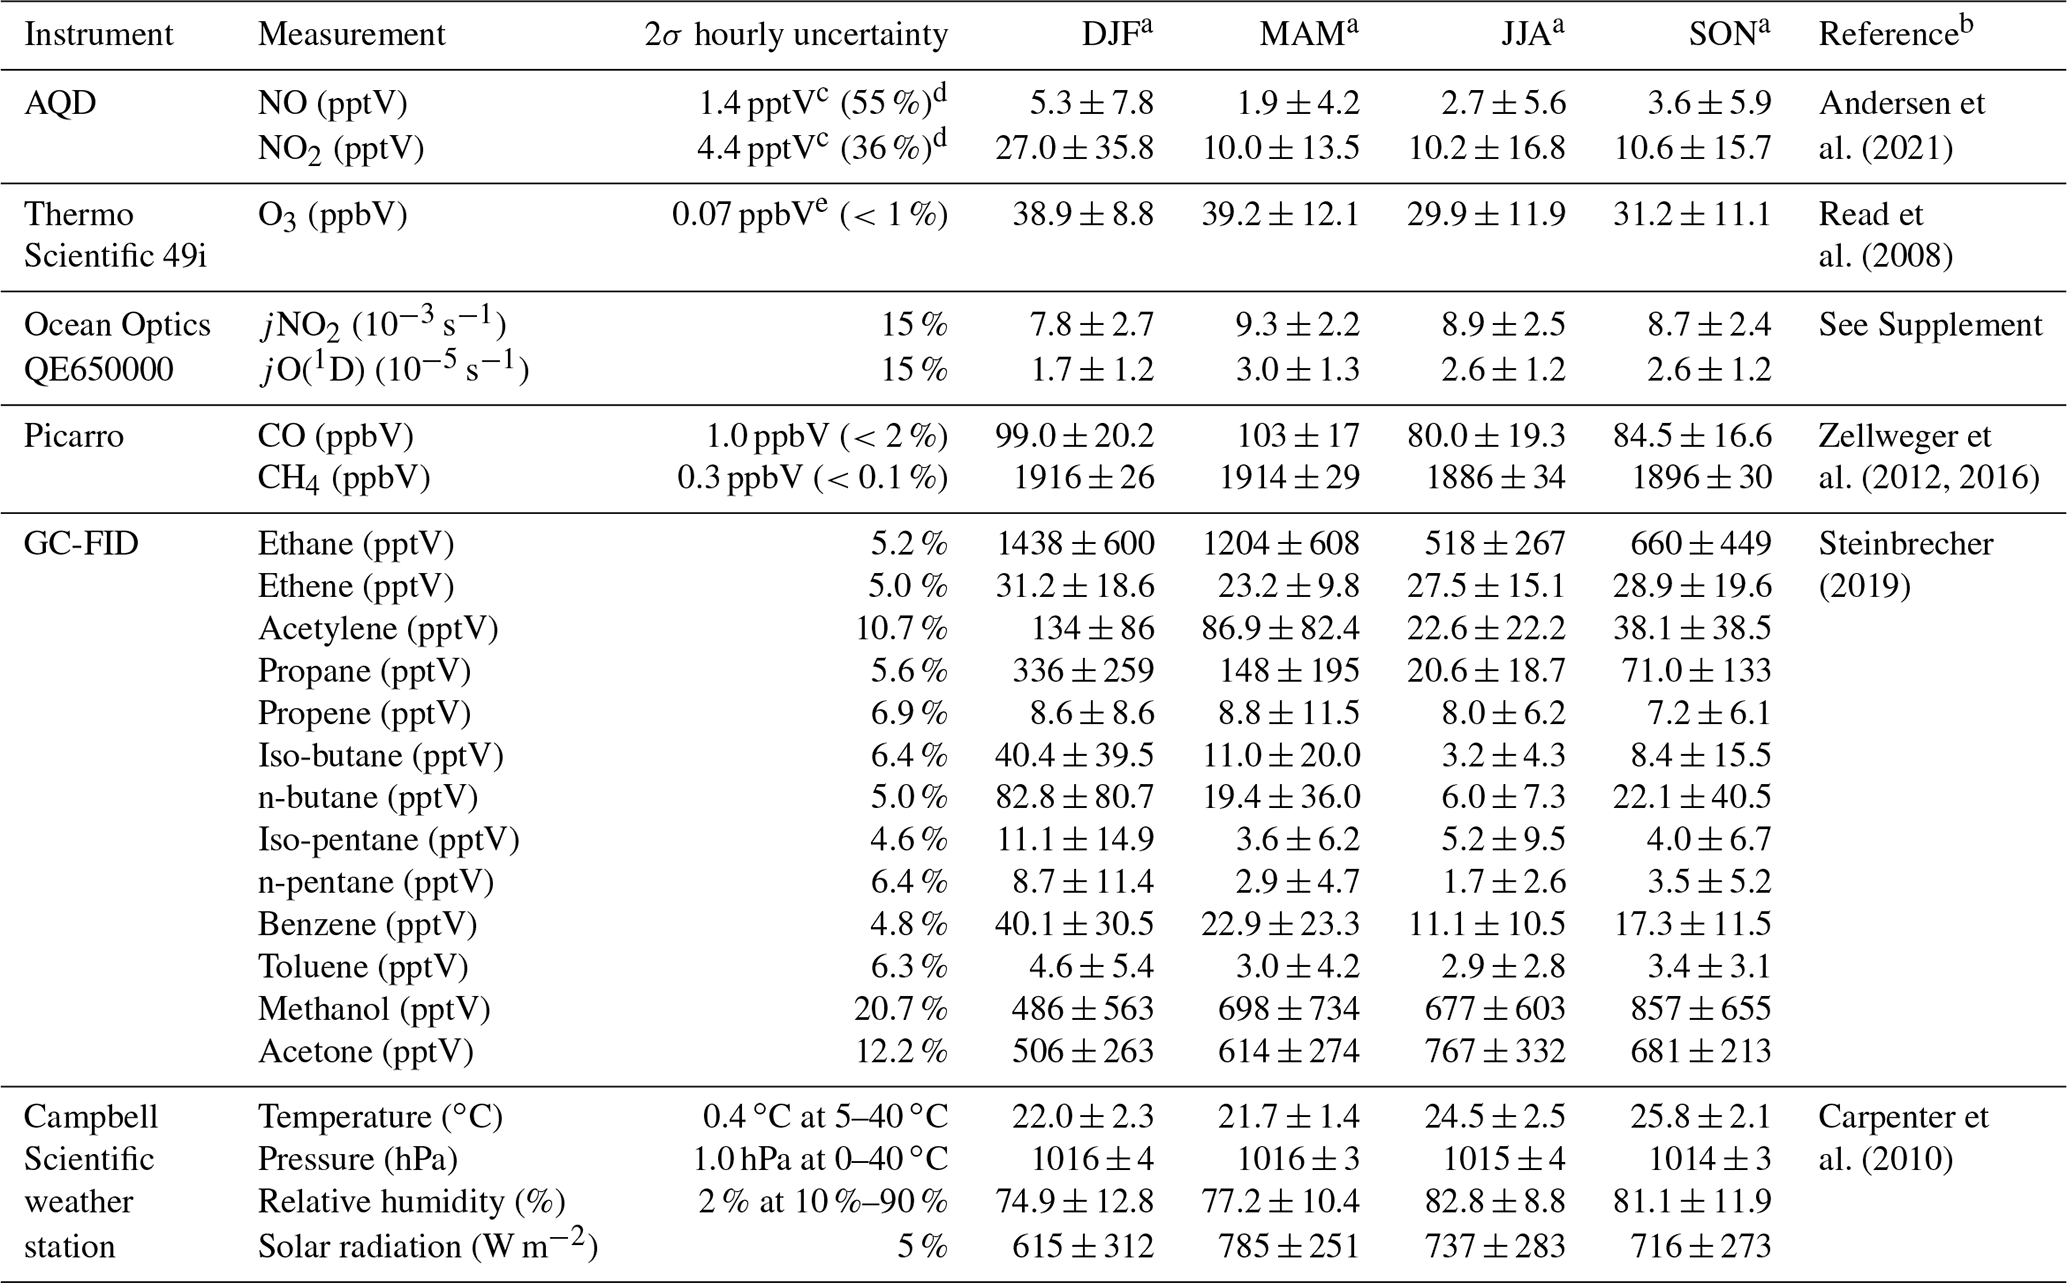
a Midday (12:00–15:00 UTC, local + 1) mean ± 2σ for July 2017–June 2020. b For further information on the instrument and the data processing. c Average uncertainties determined as described in Andersen et al. (2021). d Percentage given is relevant to average midday uncertainty. e Estimated from zero measurements and from running two O3 instruments together.
Time series of NO, NO2, O3, jNO2, jO(1D), temperature, CO, propene, benzene, and CH4 for July 2017–June 2020 are shown in Figs. S4–S6 in the Supplement. The specifics of each instrument and their respective measurements can be found in Table 2, and a full description of the CVAO site and associated measurements is given in Carpenter et al. (2010).
NO2 measurement artefact
One of the drawbacks of measuring NO2 by photolytic conversion to NO is it can be subject to artefacts. These could either be of a photolytic or thermal origin (Bradshaw et al., 1999; Gao et al., 1994; Parrish et al., 1990; Ridley et al., 1988; Ryerson et al., 2000). Photolytic artefacts occur when other compounds containing -NO, -NO2, or -NO3 photolyse to form NO over a similar wavelength range as NO2 and thereby produce an overestimate of NO2 in the sample (Pollack et al., 2010). Thermal artefacts are caused by thermally labile compounds which decompose in photolytic converters when they heat up and release NO that is measured by the detector or NO2 which is immediately photolytically converted to NO and then detected (Reed et al., 2016). Additional artefacts can arise from compounds sticking to the converter and creating an artefact when the converter is switched on. The potential NO2 artefact can be estimated using measured or modelled mixing ratios of a range of potential interfering compounds.
The photolytic contribution can be estimated based on the absorption cross section (ACS) of NO2 and the potential interferents around the peak wavelength of the diodes used to convert NO2 into NO (385±5 nm). The ACS of NO2 and some known interfering compounds over the wavelength range 380–390 nm are shown in Table 3. NO2 and most of the interferents, with the exception of HONO, show relatively invariant ACSs across these wavelengths. When the ACSs of both NO2 and the particular interferent are invariant over the spectral output of the diodes, the ratio at the peak wavelength is used to estimate the potential artefact. However, since the ACS of HONO varies significantly over the range, the ACS ratio has been estimated assuming a Gaussian output of the diodes over the wavelengths. It is also important to take into account whether photolysis of the potential interferent produces NO2 or NO. If NO is the product, then one converted molecule will be detected as two NO2 molecules if the conversion efficiency of NO2 is 50 %. If NO2 is the product then it will be photolysed to NO with a lower conversion efficiency than NO2 due to spending less time in the converter than ambient NO2. However, the conversion efficiency of NO2 is used here (Table 3) to determine an upper limit of the contribution to the NO2 artefact. The investigated organic nitrates (C2H5ONO2, CH3ONO2, n- and i-C3H7ONO2, 1- and 2-C4H9ONO2, CH3O2NO2 and CH3C(O)O2NO2), HNO3, and NO3 do not photolyse at 385 nm and have therefore not been included in the evaluation of photolytic artefacts (Atkinson et al., 2004).
Table 3Potential sources of NO2 artefacts at the CVAO.
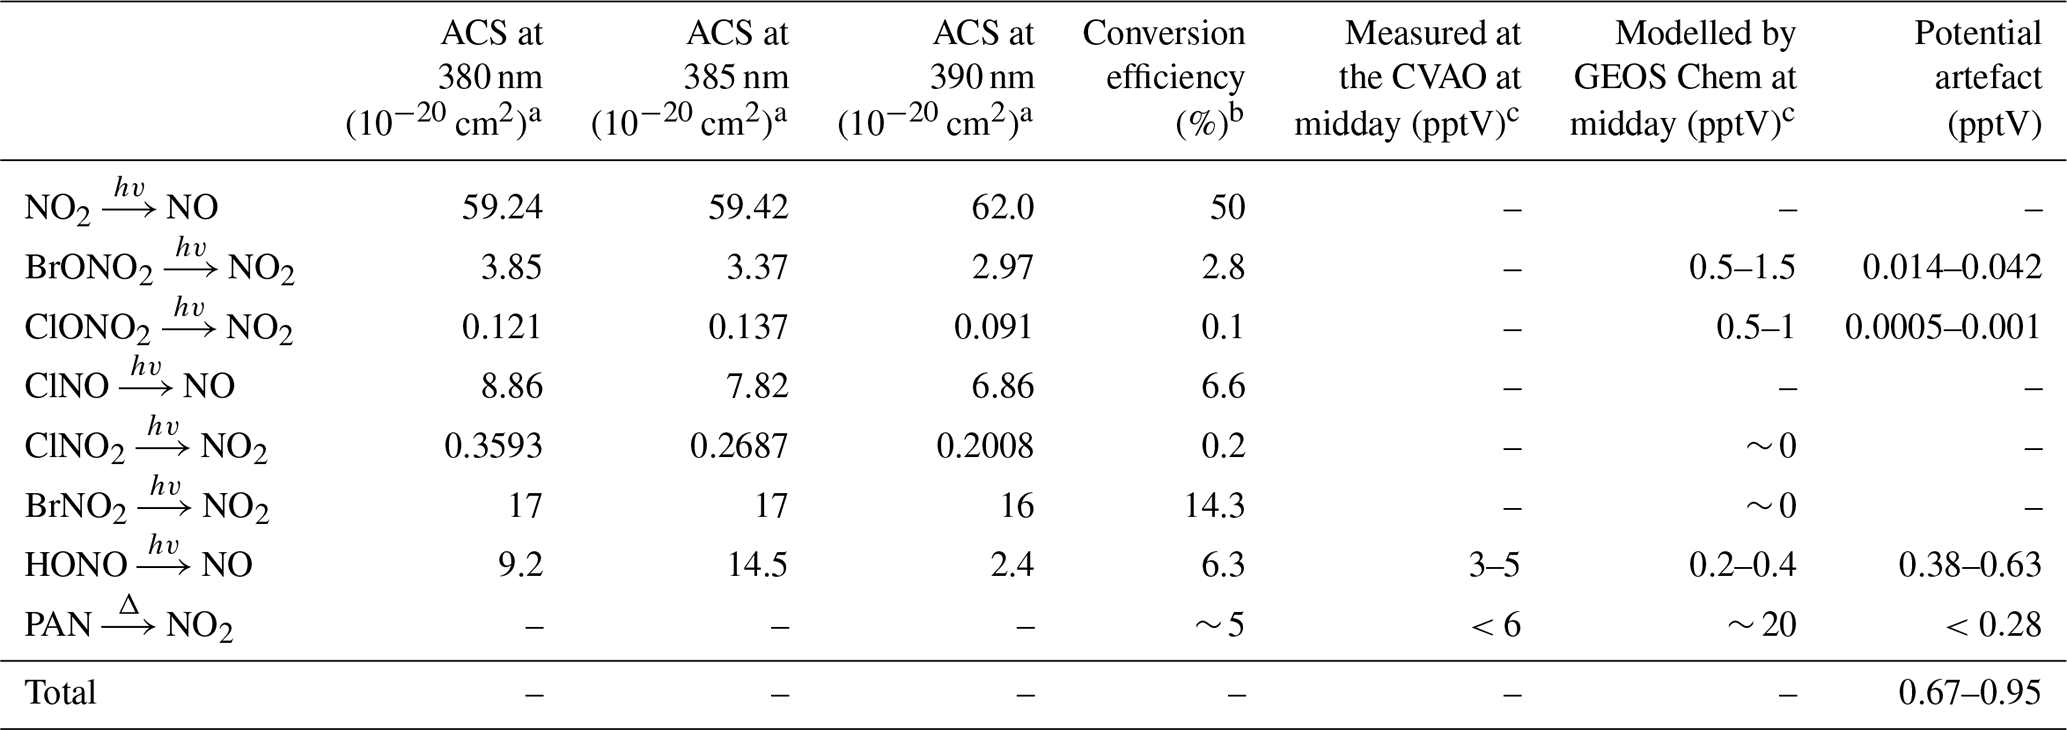
a All absorption cross sections have been reported by IUPAC (Atkinson et al., 2004). b The reported conversion efficiencies have been calculated based on a NO2 CE of 50 %. c Midday is defined as 12:00–15:00 UTC (local + 1).
The main potential photolytic artefact for the CVAO NO2 measurements is HONO. Measurements of HONO at the CVAO using a long path absorption photometer (LOPAP) show levels of up to ∼ 5 pptV (Reed et al., 2017), indicating an NO2 artefact of up to 0.63 pptV. However, these measurements were made using a thermostated inlet system with reactive HONO stripping, where loss of HONO to the sample lines is minimised. The NOx instrument at the CVAO samples at the end of the glass manifold making it highly likely that a fraction of HONO is lost on the manifold before the air is introduced to the NOx instrument due to the high surface reactivity of HONO (Pinto et al., 2014; Syomin and Finlayson-Pitts, 2003). Thus, we regard the potential HONO-induced artefact of 0.63 pptV as an upper limit. No other potential photolytic artefacts have been measured at the CVAO; however, using the GEOS-Chem model (see Sect. 3.2.2), we calculated seasonal cycles of 20 potential interfering compounds at the CVAO (Fig. S7). None of these compounds exhibit major seasonal differences, indicating that any measurement artefact will be fairly constant across the year. The contribution from photolytic degradation of compounds other than HONO is predicted to be less than 0.05 pptV using the estimated conversion efficiency of each compound in Table 3 and the modelled mixing ratios at the CVAO.
Peroxyacetyl nitrate (PAN) is produced in polluted areas and transported to remote regions, where it can thermally decompose into peroxy radicals and NO2. Of the available PAN, 5.8 % has been shown to thermally decompose in blue light converters (BLCs) switched on 40 % of the time (Reed et al., 2016). This can cause significant overestimations of NO2 in colder regions where PAN can build up in the atmosphere due to its long lifetime (Kleindienst, 1994); however, in warmer regions such as Cabo Verde the overestimation will be substantially lower due to the much shorter lifetime (∼ 40–230 min at 25 ∘C) (Bridier et al., 1991; Kleindienst, 1994) and hence lower concentration of PAN. At the CVAO, PAN was measured in February 2020 using gas chromatography as described by Whalley et al. (2004); however, all measurements were below the limit of detection (LOD) of 6 pptV. We measured the temperature increase of the air within an identical photolytic converter (PLC) to the one used at the CVAO to be less than 1 ∘C in the laboratory, suggesting a minimal shift in the PAN equilibrium in ambient air. We calculate an increase in NO2 of 0.28 pptV arising from 6 pptV of PAN when increasing the temperature from 298 to 299 K. Combining photolytic and thermal artefact contributions gives a maximum potential NO2 artefact of 0.95 pptV at the CVAO, which is within the uncertainty previously reported for the NO2 measurements (Andersen et al., 2021), as shown in Table 2.
2.2 Modelling
2.2.1 Chemical box modelling
A tailored zero-dimensional chemical box model of the lower atmosphere, incorporating a subset of the Master Chemical Mechanism (MCM v3.3.1) (Jenkin et al., 2015) into the AtChem2 modelling toolkit (Sommariva et al., 2020), was used to estimate concentrations of OH, HO2 and RO2, and daily chemical production and loss of O3 at the CVAO. The MCM describes the detailed atmospheric chemical degradation of 143 VOCs through 17 500 reactions of 6900 species. More details can be found on the MCM website (http://mcm.york.ac.uk, last access: 4 March 2022). A fixed deposition rate of s−1 was applied to all model generated species, giving them a lifetime of approximately 24 h. The model was constrained to 34 observationally derived photolysis rates, temperature, pressure, and relative humidity, along with a range of observed chemical species defined in Table 2.
While the box model is constrained to a variety of VOCs, which are expected to be the most dominant at the CVAO, it is only constrained to two oxygenated VOCs (OVOCs), methanol and acetone, due to the lack of reliable measurements of other OVOCs. Acetaldehyde and formaldehyde are expected to be the dominant OVOCs not constrained in the box model. Acetaldehyde from the ATom aircraft campaigns in October 2017, May 2018, and August 2018 show levels of between ∼ 150 and ∼ 250 pptV (Wofsy et al., 2021), which agrees well with average observations of 180 pptV in the Northern Hemisphere over the Atlantic Ocean (Yang et al., 2014). Formaldehyde measured at the CVAO in 2006–2007 varied from 350 to 550 pptV (Mahajan et al., 2011). Compared to using the levels generated by the box model of ∼ 8 pptV of acetaldehyde and 270 pptV of formaldehyde, constraining these gases to 150 and 450 pptV, respectively, increases the total ROx levels by 3 % from 52.7 to 54.4 pptV. Thus, we consider that the major VOCs and OVOCs are constrained sufficiently well in the box model for the purpose of simulating HO2 and RO2 levels.
2.2.2 GEOS-Chem
Concentrations of 20 different chemical species were extracted every hour during 2019 at nearest point in space and time from the GEOS-Chem model (v12.9.0, https://doi.org/10.5281/zenodo.3950327). The v12.9.0 model as described by Wang et al. (2021) was run at a nested horizontal resolution of 0.25×0.3125∘ over the region (−32.0 to 15.0∘ E, 0.0 to 34.0∘ N), with boundary conditions provided by a separate global model run spun up for 1 year and with acid uptake on dust considered as described by Fairlie et al. (2010; Wang et al., 2021).
Monthly diurnal cycles of HO2, RO2, and OH were modelled by constraining the box model to the measurements described in Table 2 (except NO2) using hourly median concentrations for each month from July 2017–June 2020 where all the trace gas measurements were available. When measured jO(1D) was not available, the hourly average from the same month across the other years was used. Calculated photolysis rates based on total solar radiation (see Supplement) were used up to December 2019 for all other photolysis rates than jO(1D).
The modelled OH, HO2, and RO2 concentrations agree reasonably well with previous measurements from short-term field campaigns based at the CVAO and from various cruises in the Atlantic Ocean (see Fig. 2). All the previous measurements of ROx (HO2 + RO2) shown in Fig. 2 were conducted using the chemical amplifier technique, which is subject to high uncertainties due to the challenges described above. The box-modelled RO2 shows a strong correlation with the measured jO(1D), but no correlation to CO (pollution tracer) or CH4, which is expected to be the primary precursor. Daily diurnal cycles of RO2 and HO2 for 9 d in August 2017, 12 d in October 2017, and 20 d in January 2018 were modelled to investigate their daily variability (see Fig. S8). Seasonal differences can be observed from the daily outputs but with no major day to day changes within a given month.

Figure 2Average monthly diurnal cycles of modelled OH, HO2, RO2, and HO2 + RO2 coloured by season compared to midday measurements during SOS (February, May, September, and November) (Carpenter et al., 2010; Vaughan et al., 2012), RHaMBLe (May and June) (Whalley et al., 2010), AEROSOLS99 (January and February) (Hernández et al., 2001) and ALBATROSS (November and December) (Burkert et al., 2001).
3.1 Comparison of measured and PSS NO2 concentrations
Daily midday (12:00–15:00 UTC, local + 1) NO2 mixing ratios were calculated from the Leighton ratio using Eq. (2) ([NO2]PSS), the measured NO, O3, and jNO2 and × (Atkinson et al., 2004) for a 3-year period (July 2017–June 2020). Individual uncertainties of [NO2]PSS were determined to be 4.20±3.74 pptV (1σ) for each day using the 2σ hourly uncertainties for all the used measurements, which is very similar to the uncertainty of hourly measured [NO2] (Table 2). Figure 3a shows that [NO2]PSS significantly underestimates the measured NO2, indicating that additional oxidants are needed to convert NO into NO2. Daily midday values of [NO2]PSS ext. were calculated using Eq. (3), where a midday average of each modelled monthly diurnal cycle of HO2 and RO2 in Fig. 2 was used for all days of their respective month together with previous yearly averaged midday measurements of IO (1.4±0.8 pptV, 1σ) and BrO (2.5±1.1 pptV, 1σ) (Mahajan et al., 2010; Read et al., 2008) at the CVAO. RO2 was assumed to be equivalent to CH3O2, making , , , and (Atkinson et al., 2004). Uncertainties for each estimation of [NO2]PSS ext. were determined using the calculated 2σ hourly uncertainties on the measurements and a 20 % uncertainty on all rate coefficients. This gives a total average uncertainty of 4.90±4.12 pptV (1σ), excluding any uncertainties in [HO2] and [RO2]. [NO2]PSS ext. was calculated using a midday average of the modelled monthly [HO2] and [RO2] in Fig. 2 as well as the modelled daily midday averages from the diurnal cycles in Fig. S8 for August 2017, October 2017, and January 2018. A scatter plot of monthly vs. daily calculated [NO2]PSS ext. around the 1 : 1 line (see Fig. S9) verifies the use of monthly calculated [HO2] and [RO2] for the remaining analyses.
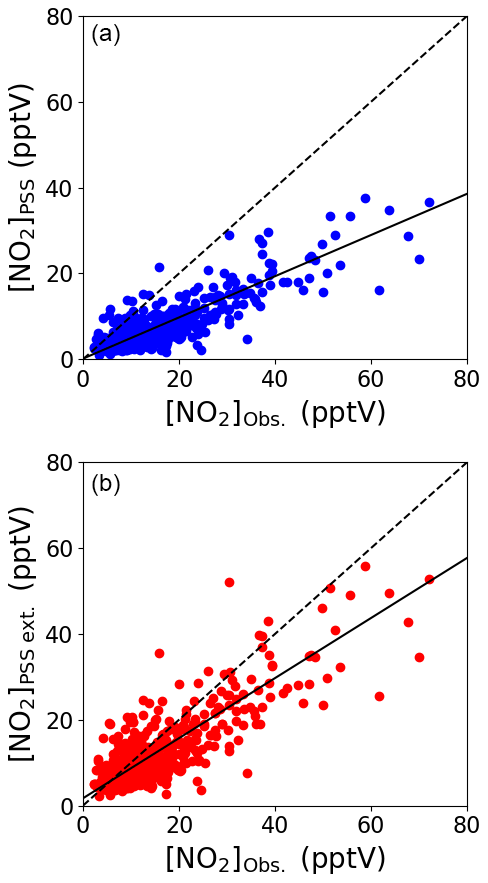
Figure 3Midday (12:00–15:00 UTC, local + 1) daily averages of [NO2]PSS (a) and [NO2]PSS ext. (b) plotted against the observed NO2 using measurements from July 2017–June 2020. The black dashed lines show the 1 : 1 ratio and the solid black lines show the linear fit to the datapoints (a: , b: ).
Figure 3b shows that the agreement between measured and predicted NO2 was improved significantly by including modelled additional oxidants with the slope of the linear fit increasing from 0.48 to 0.71. The coefficient of determination was similar for both plots: Fig. 3a, r2=0.81 and Fig. 3b, r2=0.77. We next investigate whether the mixing ratio of NO influences the ability of the full PSS equation (Eq. 3) to predict NO2. Daily midday averages of [NO2]Obs. [NO2]PSS ext. are plotted as a function of NO in Fig. 4. A ratio of 1 would be expected if all relevant reaction mechanisms have been taken into account. The deviations from 1 in the ratio can be observed to increase with decreasing NO mixing ratio during March–December. The dashed lines in Fig. 4 visualise the effect of a constant NO2 artefact of 0.95 pptV (our calculated upper limit) on the [NO2]Obs. [NO2]PSS ext. ratio, showing that the artefact, while small, can explain some of this observed trend. However, only a small dependence on the NO mixing ratio is seen for January and February, where enhancements of [NO2]Obs. [NO2]PSS ext. above 1 continue out to 10 pptV of NO. At Hohenpeissenberg, Germany, similar trends with increasing ratio with decreasing NO have been observed, which were partly explained by measurement uncertainty in NO and partly by the PSS not being established after being perturbed by NOx emissions or variable jNO2 (Mannschreck et al., 2004). An opposite trend to that observed here and at Hohenpeissenberg was observed over the South Atlantic Ocean, with increasing deviations in [NO2]Obs. [NO2]PSS ext. with increasing NO2 from 3–20 pptV (Hosaynali Beygi et al., 2011), which was explained by a missing photolytic oxidation process.
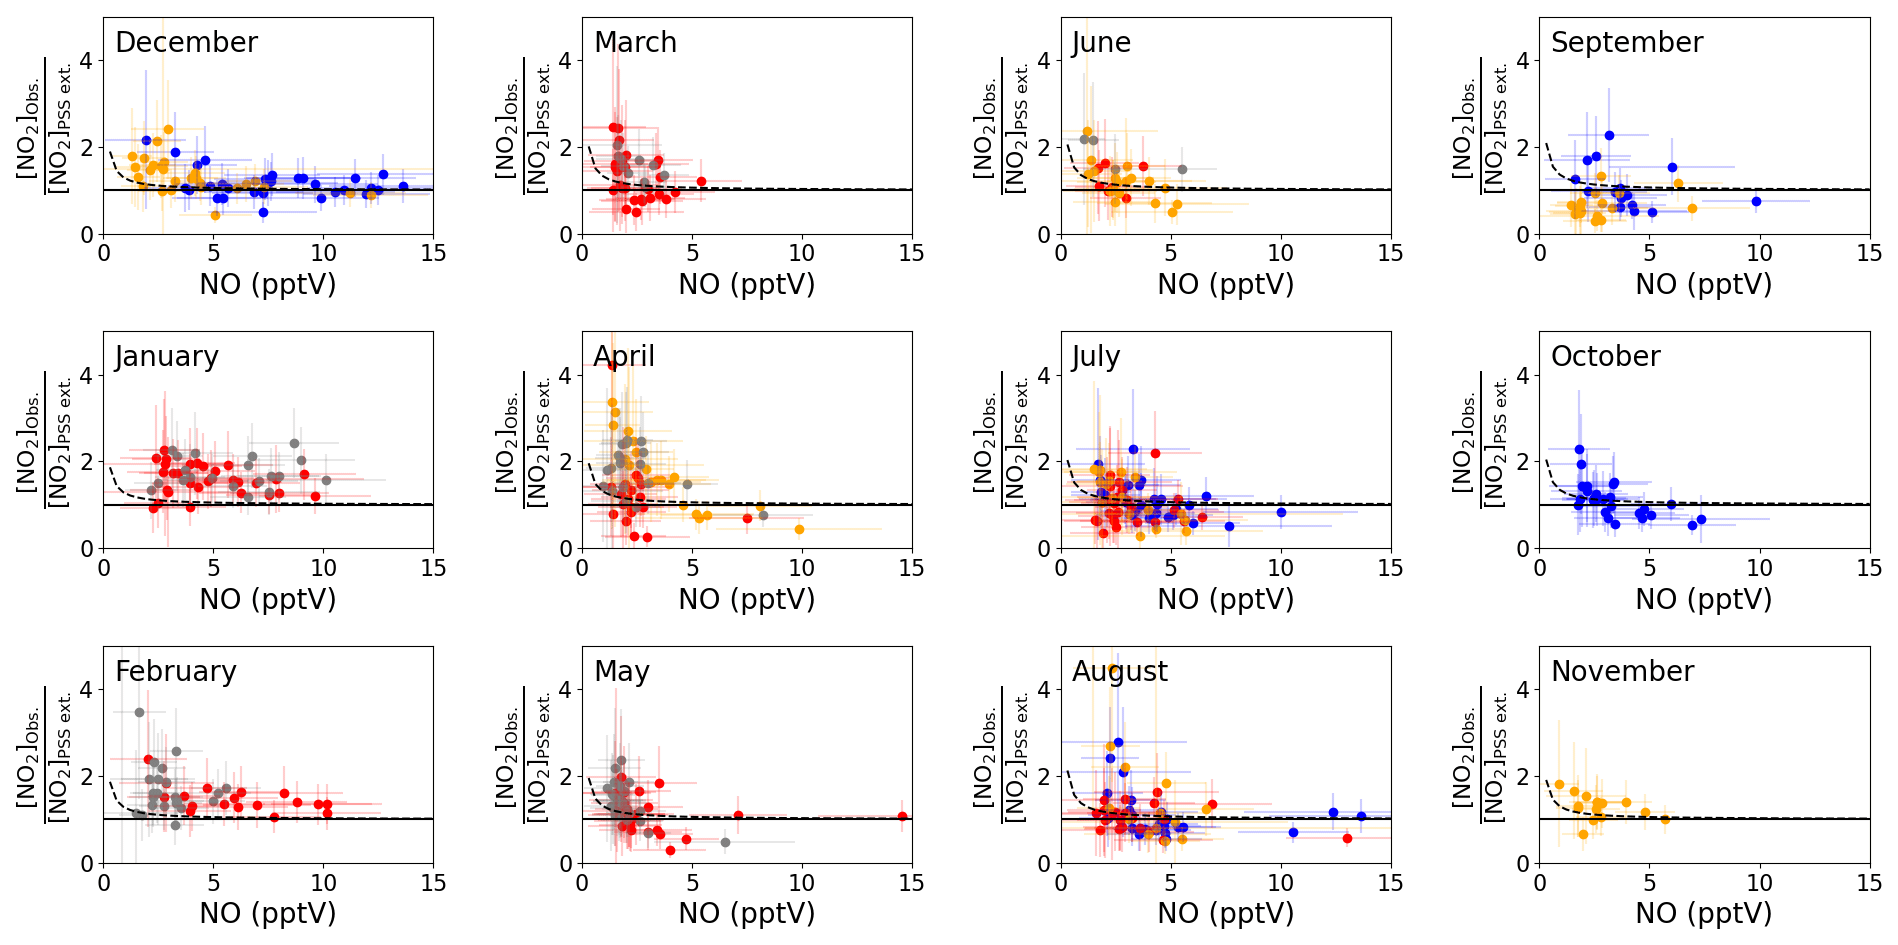
Figure 4Monthly plots of midday (12:00–15:00 UTC, local + 1) daily averages of [NO2]Obs. [NO2]PSS ext. vs. the measured NO mixing ratio. The solid lines represent a ratio of 1 between the observed and predicted NO2. The error bars represent ±2σ uncertainty on the calculated ratio and measured NO. The colours represent the year of the measurements: 2017 = blue, 2018 = red, 2019 = orange, 2020 = grey. The dashed lines represent ([NO2] pptV) [NO2]PSS ext. to visualise the effect of a NO2 artefact of 0.95 pptV on the ratio using the average measured jNO2 and O3 and modelled HO2 and RO2 for each month and the annually average measured IO and BrO for the CVAO. The uncertainty of each data point has been determined from measurement uncertainties in Table 2, the uncertainties in the measured BrO and IO described in the text, and 20 % uncertainty on all the rate coefficients. The uncertainty in the modelled radicals has not been included.
3.2 NO2 artefact or missing oxidant?
Deviations between [NO2]Obs. and [NO2]PSS ext. are usually attributed to an unaccounted artefact in the NO2 measurements or a missing oxidant converting NO into NO2 (Bradshaw et al., 1999; Carpenter et al., 1998; Crawford et al., 1996; Hauglustaine et al., 1999, 1996; Hosaynali Beygi et al., 2011; Volz-Thomas et al., 2003). As discussed above, we show that below 5 pptV of ambient NO, our calculated maximum NO2 artefact of 0.95 pptV starts to have an impact on the [NO2]Obs. [NO2]PSS ext. ratio; however, it is not enough to explain the enhancements observed, especially in wintertime at the CVAO.
The production of RO2 and HO2 radicals is dependent on the abundance of their VOC and CO precursors and on photochemical activity. To investigate whether the availability of VOCs, CO, or sunlight was related to the discrepancy between [NO2]Obs. and [NO2]PSS ext., box plots of the [NO2]Obs. [NO2]PSS ext. ratio are plotted as a function of intervals of the mixing ratio of different precursors and jNO2 (Fig. 5). The high deviations in [NO2]Obs. [NO2]PSS ext. can be observed to be associated with higher measured mixing ratios of CO, ethane, and acetylene. No obvious trend can be observed in the dependence on jNO2, contrast to Hosaynali Beygi et al. (2011), who observed increasing deviations in [NO2]Obs. [NO2]PSS ext. with increasing jNO2. However, it should be noted that midday jNO2 at the sub-tropical CVAO shows relatively little seasonal variation. Figure 5 shows that the abundances of ethene and propene, both of which have atmospheric lifetimes of less than 3 d, do not seem to affect the deviation of [NO2]Obs. [NO2]PSS ext. from 1. Conversely, high abundances of CO, ethane, and acetylene, which all have atmospheric lifetimes above 6 weeks (Atkinson et al., 2006), are observed to be associated with higher [NO2]Obs. [NO2]PSS ext. ratios. This could indicate that long-range transport of pollutants supplies additional peroxy radicals (or other NO to NO2 oxidants) at the CVAO, which are not predicted from known sources and photochemistry.
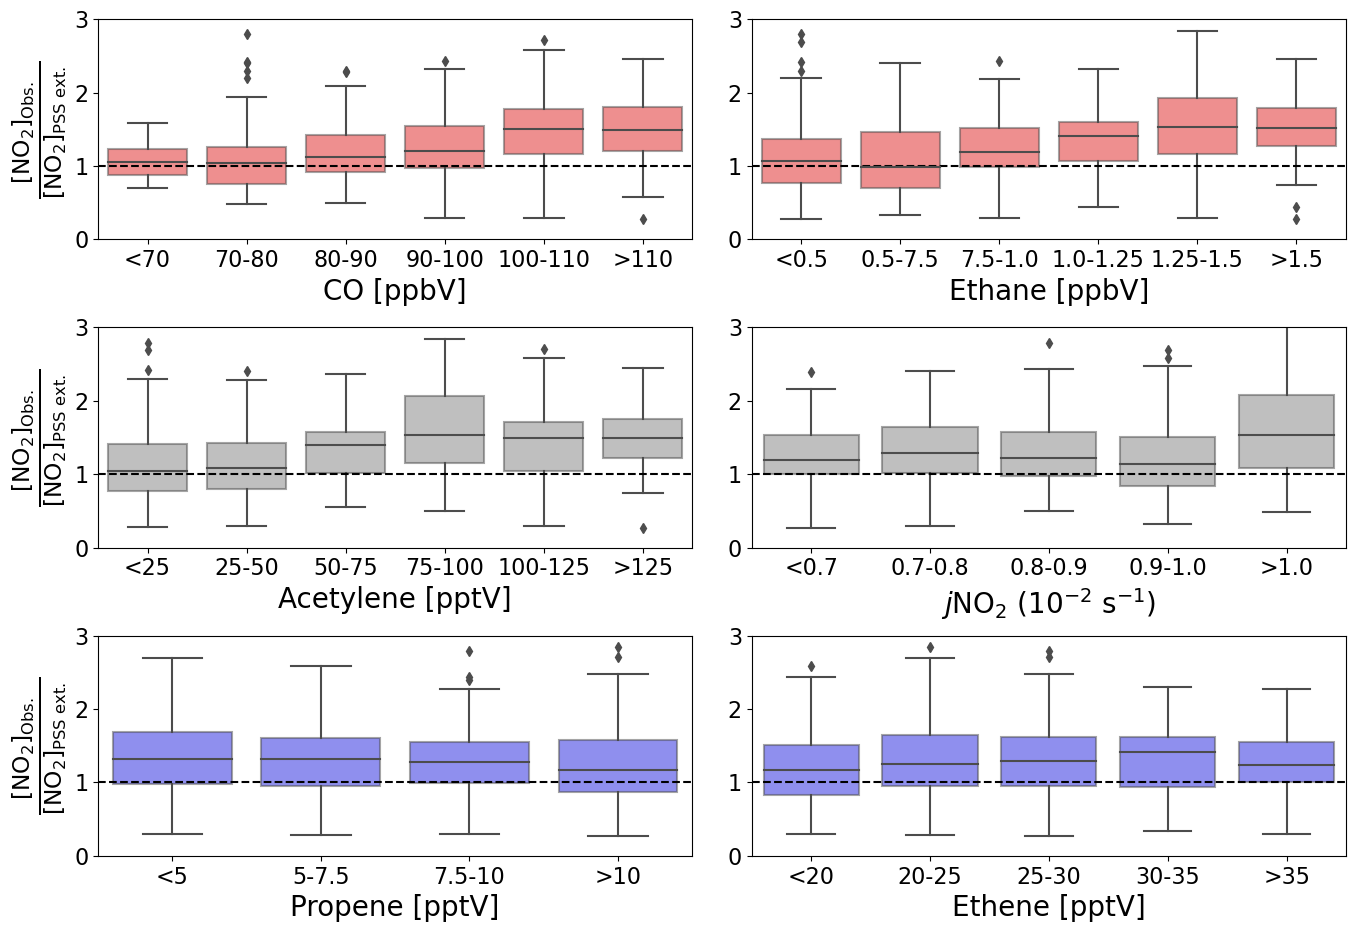
Figure 5Box plots of midday (12:00–15:00 UTC, local + 1) daily averages of [NO2]Obs. [NO2]PSS ext. from July 2017 to June 2020 plotted against intervals of five different measured precursors for either HO2 or RO2 and jNO2. The black dashed lines represent a ratio of 1.
To further evaluate the impact of pollution, [NO2]Obs. [NO2]PSS ext. was separated into three categories based on CO mixing ratios: CO < 90 ppbV, 90 ppbV < CO < 100 ppbV, and CO > 100 ppbV. The deviations of [NO2]Obs. [NO2]PSS ext. from 1 increase with increasing [CO], with 50th (25th–75th) percentiles of 1.10 (0.82–1.37) for CO < 90 ppbV, 1.20 (0.97–1.54) for 90 ppbV < CO < 100 ppbV, and 1.50 (1.18–1.78) for CO > 100 ppbV. The small deviation from 1, which is within the uncertainty of our measurements (see below), for CO < 90 ppbV is strong evidence that fundamental oxidation process in ultra-clean marine air, where the main precursors of RO2 and HO2 are CH4 and CO giving CH3O2 and HO2, respectively, is well understood.
An NO2 artefact of 0.7 pptV would reduce the ratio of 1.10 to 1.00 in air masses with CO < 90 ppbV. Since the minimum value of the artefact is 0 pptV (if there was no conversion of interferent compounds to NO or NO2), and our estimated upper limit is 0.95 pptV, we therefore consider it a reasonable assumption that the average NO2 artefact of our instrument at the CVAO is 0.7 pptV. We make the simple a priori assumption that this applies across all measurements during the period of analyses. Such an artefact is insignificant when considering total NOx concentrations; however, it has a non-negligible impact when investigating ratios in this very low NOx environment.
Subtracting 0.7 pptV from all the NO2 observations results in median (25th–75th percentiles) ratios of 1.00 (0.76–1.29) for CO < 90 ppbV, 1.14 (0.89–1.47) for 90 ppbV < CO < 100 ppbV, and 1.42 (1.12–1.68) for CO > 100 ppbV (Table 4). A student's t test was performed to evaluate whether the two categories where CO < 90 ppbV and CO > 100 ppbV were significantly different. A mean and standard deviation of 1.06 and 0.42 for CO < 90 ppbV and 1.45 and 0.61 for CO < 100 ppbV results in a t value of 6.59, which makes the two categories statistically different. Distributions of each category are plotted in Fig. 6a. When CO is between 90 and 100 ppbV, the distribution of [NO2]Obs. [NO2]PSS ext. shows the highest occurrences at ratios of ∼ 1 and ∼ 1.5. When CO > 100 ppbV, it is evident that either additional oxidants are needed to convert NO to NO2, or an additional NO2 artefact of the order of 4.4 pptV is present in these air masses. As an artefact of 0.7 pptV has already been subtracted, and measurements of HONO and PAN and modelled mixing ratios of halogen nitrates indicate a fairly stable artefact across the year, 4.4 pptV of additional artefact seems highly unlikely. This leaves the possibility of a missing oxidant when the sampled air is enhanced in CO.
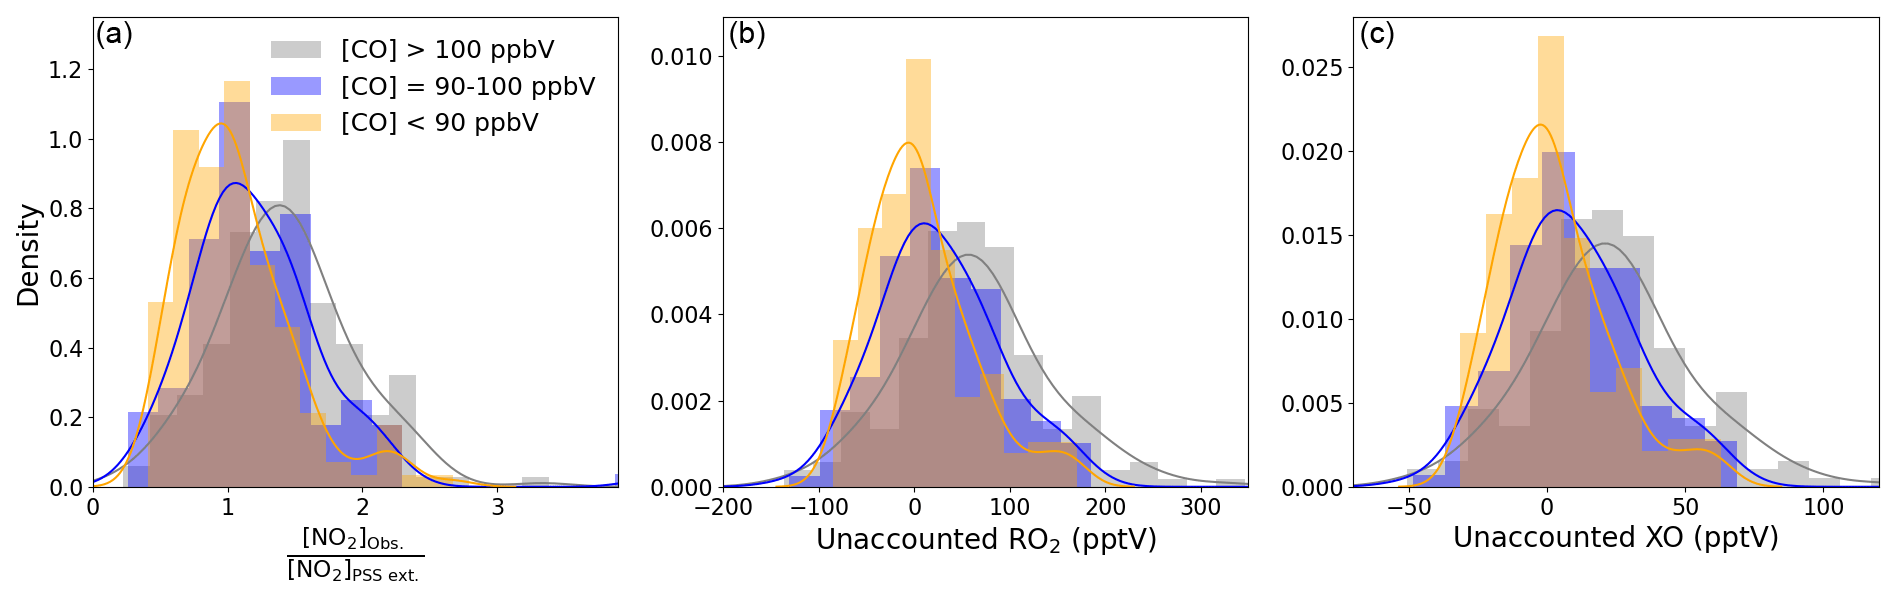
Figure 6Density distributions of (a) [NO2]Obs. [NO2]PSS ext., (b) unaccounted RO2, and (c) unaccounted XO separated by measured CO mixing ratios. An NO2 artefact of 0.7 pptV has been subtracted from all data.
Table 4Summary over the required additional artefact, RO2, and XO to give [NO2]Obs. [NO2]PSS ext. = 1 given as 50th (25th–75th) percentile when subtracting a NO2 artefact of 0.7 pptV.
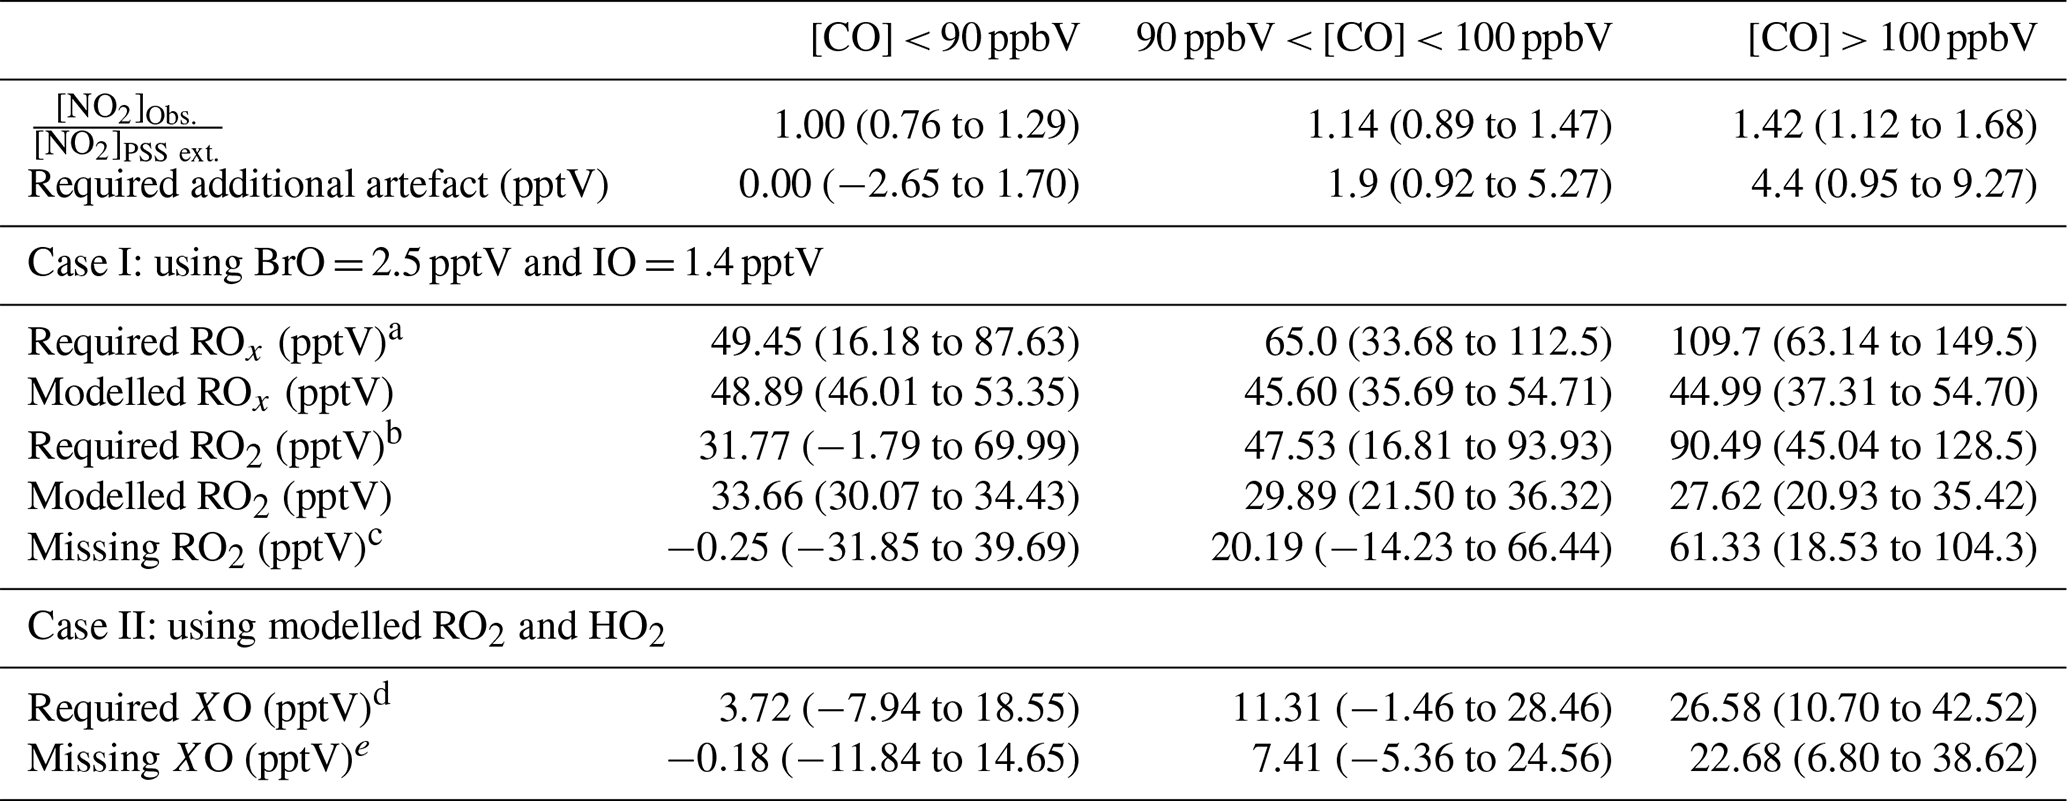
a Calculated using Eq. (4). b Calculated using Eq. (8). c Calculated using Eq. (9). d Calculated using Eq. (5). e Subtracted 3.9 pptV of XO from the required XO (2.5 pptV BrO + 1.4 pptV IO).
Using Eqs. (4) and (5), the required ROx (RO2 + HO2) and XO (IO + BrO) concentrations needed to reconcile [NO2]Obs. with [NO2]PSS ext can be estimated using and (Atkinson et al., 2004). Our calculations are based on two scenarios: (1) that the measured [BrO] and [IO] are correct and there is unaccounted for ROx, or (2) that the modelled [ROx] is correct and there is more [XO] than measured. Due to the similar rate coefficients for IO and BrO reacting with NO, a combined XO can be estimated. The results are summarised in Table 4 based on the three CO categories. The median required ROx was determined to be 65.0 (33.68–112.5, 25th–75th percentile) pptV and 109.7 (63.14–149.5, 25th–75th percentile) pptV for 90 ppbV < CO < 100 ppbV and CO > 100 ppbV, respectively. ROx measurements during the ALBATROSS cruise varied from 40–80 pptV while in the North Atlantic; however, with a reported uncertainty of 25 % (1σ) they could be as high as 100 pptV (Burkert et al., 2001). Such concentrations are comparable to the required median ROx in this study of 109.7 pptV when CO > 100 ppbV. The uncertainty reported for ALBATROSS is similar to many other studies which have reported 10 %–36 % uncertainty on chemical amplification ROx measurements (Cantrell et al., 1997; Clemitshaw et al., 1997; Handisides et al., 2003; Hernández et al., 2001; Hosaynali Beygi et al., 2011; Volz-Thomas et al., 2003); however, a recent study in the Pearl River Delta reported an uncertainty of 60 % (1σ) (Ma et al., 2017). This combined with measurements up to ∼ 150 pptV of ROx in the South Atlantic Ocean (Hosaynali Beygi et al., 2011) indicates that our required ROx levels of ∼ 100 pptV may not be unrealistic in the MBL.
The median required ROx ([ROx]PSS) can be observed to be ∼ 2.5 times higher than the levels estimated using the box model for air masses where CO > 100 ppbV, whereas the required [XO] is a factor of ∼ 6.5 higher than previous observations at the CVAO (Mahajan et al., 2010; Read et al., 2008). Across the three categories, the daily median ratio of [ROx]PSS [ROx]Model is 1.5, which is similar to those observed in previous studies both in remote and rural regions (see Table 1). The additional XO required to reconcile [NO2]Obs. with [NO2]PSS ext. was determined for each CO category by subtracting the previous measured average concentration of 3.9 pptV (2.5 pptV BrO + 1.4 pptV IO) (Read et al., 2008) from the required XO. Since CO, the main precursor for HO2, is constrained by measurements in the model, the calculated [HO2] is assumed to be correct. Thus, we estimate the required and unaccounted for RO2 assuming it is all in the form of CH3O2 from the following:
Figure 6b and c shows that the unaccounted for RO2 or XO level increases with increasing [CO], reaching a median of 61.3 and 22.7 pptV, respectively, for air masses where CO > 100 ppbV, which is approximately 2.2 times the box-modelled RO2 and 5.5 times the measured XO in the same air masses. Such an increase in organic peroxy radicals would, under more polluted conditions, cause a major increase in O3 production during a day (Volz-Thomas et al., 2003). We next examine the impact of additional RO2 on the net O3 production rate in Cabo Verde.
3.3 Chemical O3 loss
The daily chemical loss of O3 between 09:30 (09:00–10:00) and 17:30 (17:00–18:00) UTC was used to evaluate whether the PSS-derived [RO2] was consistent with the net chemical destruction of O3 at the CVAO. As discussed above, the measured O3 mixing ratio in the MBL is affected by loss mechanisms in the form of photolysis, reactions with HOx and halogens, and deposition, and by production through NO2 photolysis and by entrainment from the O3-enriched free troposphere. Due to the very stable meteorological condition of the MBL, the variability in entrainment and deposition between night and day is expected to be negligible (Ayers and Galbally, 1995; Ayers et al., 1992; Read et al., 2008). A combined entrainment/deposition term can therefore be estimated from night time O3 measurements when there is no photochemical production or loss. An hourly entrainment/deposition term was determined for each month using the average change in O3 between 22:30 (22:00–23:00) and 03:30 (03:00–04:00) UTC, and found to vary from 0.18 ppbV h−1 in January to 0.35 ppbV h−1 in May, which is in good agreement with previous measurements at the CVAO of 0.18–0.48 ppbV h−1 (Read et al., 2008). The observed daily change in O3 (ΔO3 obs.) (09:30–17:30) was determined to be ppbV h−1 (1σ) across the 3 years (2017–2020), which is almost identical to the ppbV h−1 (1σ) observed at the CVAO in 2007 (Read et al., 2008), but roughly 2 times the daily ΔO3 obs. in baseline air at Cape Grim ( ppbV h−1, 1σ) and Mace Head ( ppbV h−1, 1σ) (Carpenter et al., 1997) and 2–40 times the modelled O3 loss at Mauna Loa (−0.01 to −0.21 ppbV h−1) (Cantrell et al., 1996; Ridley et al., 1992).
By subtracting the monthly average entrainment/deposition term from the observed daily ΔO3, the daily chemical loss of O3, ΔO3 chem., is obtained. The observations were filtered to exclude periods where the change in CO concentration over the interval period, ΔCO, was outside 1 standard deviation of the mean ΔCO, to avoid the ΔO3 determination being affected by changing air masses. The resulting observed chemical loss of O3 is averaged by month and plotted in black in Fig. 7. ΔO3 chem. can be observed to follow photochemical activity, with the lowest ΔO3 chem. in October–February, where the lowest photolysis rates are measured (see Supplement and Table 2) and highest ΔO3 chem. in March–May and September. A small decrease in ΔO3 chem. in June–August occurred simultaneously to the small drop in photolysis rates in June–August. Overall, ΔO3 chem. varied from −0.48 ppbV h−1 in January to −0.88 ppbV h−1 in May.

Figure 7Average monthly ΔO3 due to chemical loss between 09:30 (09:00–10:00) and 17:30 (17:00–18:00) UTC for each month (black) compared to box-modelled ΔO3 due to chemical loss using modelled RO2 and HO2 with (blue) and without (grey) halogen monoxides (BrO and IO), and using required RO2 to get [NO2]Obs. [NO2], modelled HO2, and the annually averaged halogen monoxides (orange). The error bars on the observed chemical loss is the standard error of all the days used for each month, and for the box model, it is the minimum and maximum ΔO3 modelled for each month. The blue shaded area shows the possible variability in the chemical loss when including the measured halogens at the CVAO (BrO; 2.5±1.1 pptV, IO; 1.4±0.8 pptV) (Read et al., 2008).
In order to evaluate whether these observationally derived chemical loss rates of O3 are consistent with PSS-derived peroxy radical concentrations, ΔO3 chem. was estimated using a chemical box model incorporating the MCM, as described in Sect. 3.2.1. The model was constrained to all the measurements described in Table 2, except NO2 and O3, which were left unconstrained. ΔO3 chem. was simulated with box-modelled [RO2] and [HO2], with (blue line in Fig. 7) and without (grey in Fig. 7) inclusion of the halogen chemistry described in Table S1 in the Supplement, allowing an evaluation of the O3 loss due to halogens, as previously discussed by Read et al. (2008). Simulations were also performed with [CH3O2] constrained to the required RO2, box-modelled [HO2] and including halogen chemistry (orange in Fig. 7). In model runs with halogen chemistry, BrO and IO were constrained to previously measured annual averages ± reported uncertainties (blue shaded area in Fig. 7) (Read et al., 2008). Diurnal cycles of the required RO2 were constructed using the median of the daily midday averages for each month determined using Eq. (8) for the peak concentration at midday, 1 pptV overnight and interpolating linearly in between.
Figure 7 shows that all three modelled ΔO3 chem. exhibited very similar seasonality as the observed ΔO3 chem.. The difference between running the box model with and without halogen chemistry was 0.24±0.02 ppbV h−1 (1σ), which is almost equivalent to the results of Read et al. (2008) from the CVAO of 0.23±0.05 ppbV h−1 (1σ). From May–December, the box-modelled ΔO3 chem. was almost identical whether using modelled RO2 or constraining CH3O2 to the required RO2, and both were very similar to observed ΔO3 chem.. The largest difference in ΔO3 chem. between using box-modelled RO2 and constraining CH3O2 is observed in January where the difference reached 0.09 ppbV h−1; however, this is caused by constraining CH3O2 to 100 pptV, which is 5 times more than the modelled RO2. The average difference between the observed and box-modelled ΔO3 chem. is 0.06±0.07 ppbV h−1 (1σ) when constraining CH3O2 to the required RO2 and 0.04±0.07 ppbV h−1 (1σ) when using box-modelled RO2.
Overall, the very small differences in modelled ΔO3 chem. whether including the unaccounted for RO2 or not are a function of the highly NOx-limited conditions of the remote MBL, where O3 production is relatively insensitive to the mixture and abundance of peroxy radicals (Sillman, 1999). Thus, although our analysis shows that peroxy radicals with the equivalent O3 production potential as CH3O2 cannot be ruled out as the missing oxidant in marine air masses with aged pollution, neither does it provide robust evidence that the missing oxidant is O3-producing. Nevertheless, the deviation between PSS-derived peroxy radicals in this study and previous measurements can potentially be explained by the difficulty in measuring peroxy radicals, as discussed above. This would have important consequences for our understanding of O3 production under higher NOx conditions.
In the remote MBL (CO < 90 ppbV, NOx < 43 pptV (90th percentile = 23 pptV)), we have shown that the observed ratio is consistent with fundamental photochemical theory, and that neither missing oxidants nor deviations of the photostationary state are required to reconcile observations with the calculated ratio. This is to our knowledge the first time this has been shown in a low NOx environment. However, observed NO2 levels became increasingly higher than predicted as the CO mixing ratio increased and the air more influenced by long-range transport of air pollution in winter. A detailed analysis of potential NO2 measurement artefacts at the CVAO showed that such artefacts were unlikely to account for these deviations, thus we evaluated the case for a missing NO to NO2 oxidant. The required oxidant in air masses with CO > 100 ppbV reached a median of 109.7 pptV when treated as CH3O2. These levels are ∼ 2.5 times higher than both our box-modelled ROx (RO2 + HO2) and previous measurements of ROx measured by chemical amplification at the CVAO. However, chemical amplification measurements are known to be highly uncertain due to the difficulty in determining the chain length of the mixture of RO2 in the ambient matrix, and we note that the box-modelled O3 production at the CVAO, with the inclusion of these additional peroxy radicals, did not deviate significantly from the observed O3 production. Overall, we conclude that there is strong evidence for a missing oxidant in remote marine air impacted by long-range transport of pollution, and that peroxy radicals cannot be ruled out as to their identity.
NOx, VOCs, meteorological data, CO, and O3: WDCRG (World Data Centre for Reactive Gases)/Norwegian Institute for Air Research (NILU) EBAS database (EBAS, https://ebas-data.nilu.no/DataSets.aspx?stations=CV0001G&nations=CV238CPV&components=2-methylbutane,2-methylpropane,benzene,bromochloromethane,bromodichloromethane,bromoform,carbon_monoxide,dibromochloromethane,dibromomethane,dichloromethane,diiodomethane,dimethylsulfide,ethanal,ethane,ethene,ethyne,isoprene,methanol,methyl_iodide,n-butane,n-hexane,n-pentane,nitrogen_dioxide,nitrogen_monoxide,ozone,propane,propanone,propene,sulphur_dioxide,toluene,trichloromethane&matrices=air&fromDate=1970-01-01&toDate=2022-12-31, Andersen et al., 2022).
CH4: WDCGG (World Data Centre for Greenhouse Gases, http://kishou.go.jp, Read and Carpenter, 2022).
The supplement related to this article is available online at: https://doi.org/10.5194/acp-22-15747-2022-supplement.
Data analysis has been performed by STA. The box model has been run by BSN. Back trajectories have been modelled by MJR. GEOS-Chem has been run by TS. The instruments at the CVAO have been run by STA, KAR, SP, JH, and LN. KAR and LKW have processed the spectral radiometer data. The paper has been written by STA, LJC, JDL, BSN, and KAR.
At least one of the (co-)authors is a member of the editorial board of Atmospheric Chemistry and Physics. The peer-review process was guided by an independent editor, and the authors also have no other competing interests to declare.
Publisher’s note: Copernicus Publications remains neutral with regard to jurisdictional claims in published maps and institutional affiliations.
The authors would like to thank the UK Natural Environment Research Council/National Centre for Atmospheric Science (NERC/NCAS) through the Atmospheric Measurement and Observation Facility (AMOF) for funding the CVAO programme. Simone T. Andersen's PhD was supported by the SPHERES Natural Environment Research Council (NERC) Doctoral Training Partnership (DTP) under grant NE/L002574/1.
This research has been supported by the European Research Council, H2020 European Research Council (O3-SML (grant no. 833290)).
This paper was edited by John Orlando and reviewed by two anonymous referees.
Andersen, S. T., Carpenter, L. J., Nelson, B. S., Neves, L., Read, K. A., Reed, C., Ward, M., Rowlinson, M. J., and Lee, J. D.: Long-term NOx measurements in the remote marine tropical troposphere, Atmos. Meas. Tech., 14, 3071–3085, https://doi.org/10.5194/amt-14-3071-2021, 2021.
Andersen, S. T., Read, K. A., and Punjabi, S.: CVAO measurements, EBAS [data set], https://ebas-data.nilu.no/DataSets.aspx?stations=CV0001G&nations=CV238CPV&components=2-methylbutane,2-methylpropane,benzene,bromochloromethane,bromodichloromethane,bromoform,carbon_monoxide,dibromochloromethane,dibromomethane,dichloromethane,diiodomethane,dimethylsulfide,ethanal,ethane,ethene,ethyne,isoprene,methanol,methyl_iodide,n-butane,n-hexane,n-pentane,nitrogen_dioxide,nitrogen_monoxide,ozone,propane,propanone,propene,sulphur_dioxide,toluene,trichloromethane&matrices=air&fromDate=1970-01-01&toDate=2022-12-31, last access: 31 August 2022.
Atkinson, R., Baulch, D. L., Cox, R. A., Crowley, J. N., Hampson, R. F., Hynes, R. G., Jenkin, M. E., Rossi, M. J., and Troe, J.: Atmos. Chem. Phys., 4, 1461, 2004; IUPAC Task Group on Atmospheric Chemical Kinetic Data Evaluation, http://iupac.pole-ether.fr (last access: 31 August 2022), 2004.
Atkinson, R., Baulch, D. L., Cox, R. A., Crowley, J. N., Hampson, R. F., Hynes, R. G., Jenkin, M. E., Rossi, M. J., Troe, J., and IUPAC Subcommittee: Evaluated kinetic and photochemical data for atmospheric chemistry: Volume II – gas phase reactions of organic species, Atmos. Chem. Phys., 6, 3625–4055, https://doi.org/10.5194/acp-6-3625-2006, 2006.
Ayers, G. P. and Galbally, I. E.: A preliminary investigation of a boundary layer-free troposphere entrainment velocity at Cape Grim, Baseline, 92, 10–15, https://doi.org/10.4225/08/5862ad7e847b2, 1995.
Ayers, G. P., Penkett, S. A., Gillett, R. W., Bandy, B., Galbally, I. E., Meyer, C. P., Elsworth, C. M., Bentley, S. T., and Forgan, B. W.: Evidence for photochemical control of ozone concentrations in unpolluted marine air, Nature, 360, 446–449, https://doi.org/10.1038/360446a0, 1992.
Bloss, W. J., Evans, M. J., Lee, J. D., Sommariva, R., Heard, D. E., and Pilling, M. J.: The oxidative capacity of the troposphere: Coupling of field measurements of OH and a global chemistry transport model, Faraday Discuss., 130, 425–436, https://doi.org/10.1039/B419090D, 2005.
Bradshaw, J., Davis, D., Crawford, J., Chen, G., Shetter, R., Müller, M., Gregory, G., Sachse, G., Blake, D., Heikes, B., Singh, H., Mastromarino, J., and Sandholm, S.: Photofragmentation two-photon laser-induced fluorescence detection of NO2 and NO: Comparison of measurements with model results based on airborne observations during PEM-Tropics A, Geophys. Res. Lett., 26, 471–474, https://doi.org/10.1029/1999GL900015, 1999.
Bridier, I., Caralp, F., Loirat, H., Lesclaux, R., Veyret, B., Becker, K. H., Reimer, A., and Zabel, F.: Kinetic and theoretical studies of the reactions acetylperoxy + nitrogen dioxide + M acetyl peroxynitrate + M between 248 and 393 K and between 30 and 760 torr, The J. Phys. Chem., 95, 3594–3600, https://doi.org/10.1021/j100162a031, 1991.
Burkert, J., Andrés-Hernández, M.-D., Stöbener, D., Burrows, J. P., Weissenmayer, M., and Kraus, A.: Peroxy radical and related trace gas measurements in the boundary layer above the Atlantic Ocean, J. Geophys. Res.-Atmos., 106, 5457–5477, https://doi.org/10.1029/2000JD900613, 2001.
Butkovskaya, N., Kukui, A., and Le Bras, G.: HNO3 Forming Channel of the HO2 + NO Reaction as a Function of Pressure and Temperature in the Ranges of 72–600 Torr and 223–323 K, J. Phys. Chem. A, 111, 9047–9053, https://doi.org/10.1021/jp074117m, 2007.
Butkovskaya, N., Rayez, M.-T., Rayez, J.-C., Kukui, A., and Le Bras, G.: Water Vapor Effect on the HNO3 Yield in the HO2 + NO Reaction: Experimental and Theoretical Evidence, J. Phys. Chem. A, 113, 11327–11342, https://doi.org/10.1021/jp811428p, 2009.
Calvert, J. G. and Stockwell, W. R.: Deviations from the O3–NO–NO2 photostationary state in tropospheric chemistry, Can. J. Chem., 61, 983–992, https://doi.org/10.1139/v83-174, 1983.
Cantrell, C. A., Lind, J. A., Shetter, R. E., Calvert, J. G., Goldan, P. D., Kuster, W., Fehsenfeld, F. C., Montzka, S. A., Parrish, D. D., Williams, E. J., Buhr, M. P., Westberg, H. H., Allwine, G., and Martin, R.: Peroxy radicals in the ROSE experiment: Measurement and theory, J. Geophys. Res.-Atmos., 97, 20671–20686, https://doi.org/10.1029/92JD01727, 1992.
Cantrell, C. A., Shetter, R. E., Calvert, J. G., Parrish, D. D., Fehsenfeld, F. C., Goldan, P. D., Kuster, W., Williams, E. J., Westberg, H. H., Allwine, G., and Martin, R.: Peroxy radicals as measured in ROSE and estimated from photostationary state deviations, J. Geophys. Res.-Atmos., 98, 18355–18366, https://doi.org/10.1029/93JD01794, 1993a.
Cantrell, C. A., Shetter, R. E., Lind, J. A., McDaniel, A. H., Calvert, J. G., Parrish, D. D., Fehsenfeld, F. C., Buhr, M. P., and Trainer, M.: An improved chemical amplifier technique for peroxy radical measurements, J. Geophys. Res.-Atmos., 98, 2897–2909, https://doi.org/10.1029/92JD02842, 1993b.
Cantrell, C. A., Shetter, R. E., Gilpin, T. M., and Calvert, J. G.: Peroxy radicals measured during Mauna Loa Observatory Photochemistry Experiment 2: The data and first analysis, J. Geophys. Res.-Atmos., 101, 14643–14652, https://doi.org/10.1029/95JD01698, 1996.
Cantrell, C. A., Shetter, R. E., Calvert, J. G., Eisele, F. L., Williams, E., Baumann, K., Brune, W. H., Stevens, P. S., and Mather, J. H.: Peroxy radicals from photostationary state deviations and steady state calculations during the Tropospheric OH Photochemistry Experiment at Idaho Hill, Colorado, 1993, J. Geophys. Res.-Atmos., 102, 6369–6378, https://doi.org/10.1029/96JD01703, 1997.
Carpenter, L. J., Monks, P. S., Bandy, B. J., Penkett, S. A., Galbally, I. E., and Meyer, C. P.: A study of peroxy radicals and ozone photochemistry at coastal sites in the northern and southern hemispheres, J. Geophys. Res.-Atmos., 102, 25417–25427, https://doi.org/10.1029/97JD02242, 1997.
Carpenter, L. J., Clemitshaw, K. C., Burgess, R. A., Penkett, S. A., Cape, J. N., and McFadyen, G. G.: Investigation and evaluation of the NOx/O3 photochemical steady state, Atmos. Environ., 32, 3353–3365, https://doi.org/10.1016/S1352-2310(97)00416-0, 1998.
Carpenter, L. J., Fleming, Z. L., Read, K. A., Lee, J. D., Moller, S. J., Hopkins, J. R., Purvis, R. M., Lewis, A. C., Müller, K., Heinold, B., Herrmann, H., Fomba, K. W., van Pinxteren, D., Müller, C., Tegen, I., Wiedensohler, A., Müller, T., Niedermeier, N., Achterberg, E. P., Patey, M. D., Kozlova, E. A., Heimann, M., Heard, D. E., Plane, J. M. C., Mahajan, A., Oetjen, H., Ingham, T., Stone, D., Whalley, L. K., Evans, M. J., Pilling, M. J., Leigh, R. J., Monks, P. S., Karunaharan, A., Vaughan, S., Arnold, S. R., Tschritter, J., Pöhler, D., Frieß, U., Holla, R., Mendes, L. M., Lopez, H., Faria, B., Manning, A. J., and Wallace, D. W. R.: Seasonal characteristics of tropical marine boundary layer air measured at the Cape Verde Atmospheric Observatory, J. Atmos. Chem., 67, 87–140, https://doi.org/10.1007/s10874-011-9206-1, 2010.
Carsey, T. P., Churchill, D. D., Farmer, M. L., Fischer, C. J., Pszenny, A. A., Ross, V. B., Saltzman, E. S., Springer-Young, M., and Bonsang, B.: Nitrogen oxides and ozone production in the North Atlantic marine boundary layer, J. Geophys. Res.-Atmos., 102, 10653–10665, https://doi.org/10.1029/96JD03511, 1997.
Clemitshaw, K. C., Carpenter, L. J., Penkett, S. A., and Jenkin, M. E.: A calibrated peroxy radical chemical amplifier for ground-based tropospheric measurements, J. Geophys. Res.-Atmos., 102, 25405–25416, https://doi.org/10.1029/97JD01902, 1997.
Cox, R. A.: Ozone and peroxy radical budgets in the marine boundary layer: Modeling the effect of NOx, J. Geophys. Res.-Atmos., 104, 8047–8056, https://doi.org/10.1029/1998JD100104, 1999.
Crawford, J., Davis, D., Chen, G., Bradshaw, J., Sandholm, S., Gregory, G., Sachse, G., Anderson, B., Collins, J., Blake, D., Singh, H., Heikes, B., Talbot, R., and Rodriguez, J.: Photostationary state analysis of the NO2-NO system based on airborne observations from the western and central North Pacific, J. Geophys. Res.-Atmos., 101, 2053–2072, https://doi.org/10.1029/95JD02201, 1996.
Duncianu, M., Lahib, A., Tomas, A., Stevens, P. S., and Dusanter, S.: Characterization of a chemical amplifier for peroxy radical measurements in the atmosphere, Atmos. Environ., 222, 117106, https://doi.org/10.1016/j.atmosenv.2019.117106, 2020.
Emmerson, K. M., Carslaw, N., Carslaw, D. C., Lee, J. D., McFiggans, G., Bloss, W. J., Gravestock, T., Heard, D. E., Hopkins, J., Ingham, T., Pilling, M. J., Smith, S. C., Jacob, M., and Monks, P. S.: Free radical modelling studies during the UK TORCH Campaign in Summer 2003, Atmos. Chem. Phys., 7, 167–181, https://doi.org/10.5194/acp-7-167-2007, 2007.
Fairlie, T. D., Jacob, D. J., Dibb, J. E., Alexander, B., Avery, M. A., van Donkelaar, A., and Zhang, L.: Impact of mineral dust on nitrate, sulfate, and ozone in transpacific Asian pollution plumes, Atmos. Chem. Phys., 10, 3999–4012, https://doi.org/10.5194/acp-10-3999-2010, 2010.
Gao, R. S., Keim, E. R., Woodbridge, E. L., Ciciora, S. J., Proffitt, M. H., Thompson, T. L., Mclaughlin, R. J., and Fahey, D. W.: New photolysis system for NO2 measurements in the lower stratosphere, J. Geophys. Res.-Atmos., 99, 20673–20681, https://doi.org/10.1029/94JD01521, 1994.
Handisides, G. M., Plass-Dülmer, C., Gilge, S., Bingemer, H., and Berresheim, H.: Hohenpeissenberg Photochemical Experiment (HOPE 2000): Measurements and photostationary state calculations of OH and peroxy radicals, Atmos. Chem. Phys., 3, 1565–1588, https://doi.org/10.5194/acp-3-1565-2003, 2003.
Hauglustaine, D. A., Madronich, S., Ridley, B. A., Walega, J. G., Cantrell, C. A., Shetter, R. E., and Hübler, G.: Observed and model-calculated photostationary state at Mauna Loa Observatory during MLOPEX 2, J. Geophys. Res.-Atmos., 101, 14681–14696, https://doi.org/10.1029/95JD03612, 1996.
Hauglustaine, D. A., Madronich, S., Ridley, B. A., Flocke, S. J., Cantrell, C. A., Eisele, F. L., Shetter, R. E., Tanner, D. J., Ginoux, P., and Atlas, E. L.: Photochemistry and budget of ozone during the Mauna Loa Observatory Photochemistry Experiment (MLOPEX 2), J. Geophys. Res.-Atmos., 104, 30275–30307, https://doi.org/10.1029/1999JD900441, 1999.
Hernández, M. D. A., Burkert, J., Reichert, L., Stöbener, D., Meyer-Arnek, J., Burrows, J. P., Dickerson, R. R., and Doddridge, B. G.: Marine boundary layer peroxy radical chemistry during the AEROSOLS99 campaign: Measurements and analysis, J. Geophys. Res.-Atmos., 106, 20833–20846, https://doi.org/10.1029/2001JD900113, 2001.
Hosaynali Beygi, Z., Fischer, H., Harder, H. D., Martinez, M., Sander, R., Williams, J., Brookes, D. M., Monks, P. S., and Lelieveld, J.: Oxidation photochemistry in the Southern Atlantic boundary layer: unexpected deviations of photochemical steady state, Atmos. Chem. Phys., 11, 8497–8513, https://doi.org/10.5194/acp-11-8497-2011, 2011.
Inamdar, S., Tinel, L., Chance, R., Carpenter, L. J., Sabu, P., Chacko, R., Tripathy, S. C., Kerkar, A. U., Sinha, A. K., Bhaskar, P. V., Sarkar, A., Roy, R., Sherwen, T., Cuevas, C., Saiz-Lopez, A., Ram, K., and Mahajan, A. S.: Estimation of reactive inorganic iodine fluxes in the Indian and Southern Ocean marine boundary layer, Atmos. Chem. Phys., 20, 12093–12114, https://doi.org/10.5194/acp-20-12093-2020, 2020.
Jacob, D. J., Heikes, E. G., Fan, S.-M., Logan, J. A., Mauzerall, D. L., Bradshaw, J. D., Singh, H. B., Gregory, G. L., Talbot, R. W., Blake, D. R., and Sachse, G. W.: Origin of ozone and NOx in the tropical troposphere: A photochemical analysis of aircraft observations over the South Atlantic basin, J. Geophys. Res.-Atmos., 101, 24235–24250, https://doi.org/10.1029/96JD00336, 1996.
Jenkin, M. E., Young, J. C., and Rickard, A. R.: The MCM v3.3.1 degradation scheme for isoprene, Atmos. Chem. Phys., 15, 11433–11459, https://doi.org/10.5194/acp-15-11433-2015, 2015.
Kleindienst, T. E.: Recent developments in the chemistry and biology of peroxyacetyl nitrate, Res. Chem. Intermediat., 20, 335–384, https://doi.org/10.1163/156856794X00379, 1994.
Lee, J. D., Moller, S. J., Read, K. A., Lewis, A. C., Mendes, L., and Carpenter, L. J.: Year-round measurements of nitrogen oxides and ozone in the tropical North Atlantic marine boundary layer, J. Geophys. Res.-Atmos., 114, D21302, https://doi.org/10.1029/2009JD011878, 2009.
Leighton, P. A.: Photochemistry of Air Pollution, Academic Press, ISBN 978-0124333345, 1961.
Liu, Y. and Zhang, J.: Atmospheric Peroxy Radical Measurements Using Dual-Channel Chemical Amplification Cavity Ringdown Spectroscopy, Anal. Chem., 86, 5391–5398, https://doi.org/10.1021/ac5004689, 2014.
Ma, Y., Lu, K., Chou, C. C. K., Li, X., and Zhang, Y.: Strong deviations from the NO-NO2-O3 photostationary state in the Pearl River Delta: Indications of active peroxy radical and chlorine radical chemistry, Atmos. Environ., 163, 22–34, https://doi.org/10.1016/j.atmosenv.2017.05.012, 2017.
Mahajan, A. S., Plane, J. M. C., Oetjen, H., Mendes, L., Saunders, R. W., Saiz-Lopez, A., Jones, C. E., Carpenter, L. J., and McFiggans, G. B.: Measurement and modelling of tropospheric reactive halogen species over the tropical Atlantic Ocean, Atmos. Chem. Phys., 10, 4611–4624, https://doi.org/10.5194/acp-10-4611-2010, 2010.
Mahajan, A. S., Whalley, L. K., Kozlova, E., Oetjen, H., Mendez, L., Furneaux, K. L., Goddard, A., Heard, D. E., Plane, J. M. C., and Saiz-Lopez, A.: DOAS observations of formaldehyde and its impact on the HOx balance in the tropical Atlantic marine boundary layer, J. Atmos. Chem., 66, 167, https://doi.org/10.1007/s10874-011-9200-7, 2011.
Mannschreck, K., Gilge, S., Plass-Duelmer, C., Fricke, W., and Berresheim, H.: Assessment of the applicability of NO-NO2-O3 photostationary state to long-term measurements at the Hohenpeissenberg GAW Station, Germany, Atmos. Chem. Phys., 4, 1265–1277, https://doi.org/10.5194/acp-4-1265-2004, 2004.
Mihele, C. M. and Hastie, D. R.: The sensitivity of the radical amplifier to ambient water vapour, Geophys. Res. Lett., 25, 1911–1913, https://doi.org/10.1029/98GL01432, 1998.
Miyazaki, K., Parker, A. E., Fittschen, C., Monks, P. S., and Kajii, Y.: A new technique for the selective measurement of atmospheric peroxy radical concentrations of HO2 and RO2 using a denuding method, Atmos. Meas. Tech., 3, 1547–1554, https://doi.org/10.5194/amt-3-1547-2010, 2010.
Parrish, D. D., Trainer, M., Williams, E. J., Fahey, D. W., Hübler, G., Eubank, C. S., Liu, S. C., Murphy, P. C., Albritton, D. L., and Fehsenfeld, F. C.: Measurements of the NOx-O3 photostationary state at Niwot Ridge, Colorado, J. Geophys. Res.-Atmos., 91, 5361–5370, https://doi.org/10.1029/JD091iD05p05361, 1986.
Parrish, D. D., Hahn, C. H., Fahey, D. W., Williams, E. J., Bollinger, M. J., Hübler, G., Buhr, M. P., Murphy, P. C., Trainer, M., Hsie, E. Y., Liu, S. C., and Fehsenfeld, F. C.: Systematic variations in the concentration of NOx (NO + NO2) at Niwot Ridge, Colorado, J. Geophys. Res.-Atmos., 95, 1817–1836, https://doi.org/10.1029/JD095iD02p01817, 1990.
Peterson, M. C. and Honrath, R. E.: NOx and NOy over the northwestern North Atlantic: Measurements and measurement accuracy, J. Geophys. Res.-Atmos., 104, 11695–11707, 1999.
Pinto, J. P., Dibb, J., Lee, B. H., Rappenglück, B., Wood, E. C., Levy, M., Zhang, R.-Y., Lefer, B., Ren, X.-R., Stutz, J., Tsai, C., Ackermann, L., Golovko, J., Herndon, S. C., Oakes, M., Meng, Q.-Y., Munger, J. W., Zahniser, M., and Zheng, J.: Intercomparison of field measurements of nitrous acid (HONO) during the SHARP campaign, J. Geophys. Res.-Atmos., 119, 5583–5601, https://doi.org/10.1002/2013JD020287, 2014.
Pollack, I. B., Lerner, B. M., and Ryerson, T. B.: Evaluation of ultraviolet light-emitting diodes for detection of atmospheric NO2 by photolysis – chemiluminescence, J. Atmos. Chem., 65, 111–125, https://doi.org/10.1007/s10874-011-9184-3, 2010.
Prados-Roman, C., Cuevas, C. A., Hay, T., Fernandez, R. P., Mahajan, A. S., Royer, S.-J., Galí, M., Simó, R., Dachs, J., Großmann, K., Kinnison, D. E., Lamarque, J.-F., and Saiz-Lopez, A.: Iodine oxide in the global marine boundary layer, Atmos. Chem. Phys., 15, 583–593, https://doi.org/10.5194/acp-15-583-2015, 2015.
Read, K. and Carpenter, L.: Atmospheric CH4 at Cape Verde, Atmospheric Observatory by University of York, dataset published as CH4_CVO_surface-insitu_UYRK_data1 at WDCGG [data set], ver. 2022-06-24-1032, http://kishou.go.jp (registration required), last access: 31 August 2022.
Read, K. A., Mahajan, A. S., Carpenter, L. J., Evans, M. J., Faria, B. V. E., Heard, D. E., Hopkins, J. R., Lee, J. D., Moller, S. J., Lewis, A. C., Mendes, L., McQuaid, J. B., Oetjen, H., Saiz-Lopez, A., Pilling, M. J., and Plane, J. M. C.: Extensive halogen-mediated ozone destruction over the tropical Atlantic Ocean, Nature, 453, 1232, https://doi.org/10.1038/nature07035, 2008.
Read, K. A., Lee, J. D., Lewis, A. C., Moller, S. J., Mendes, L., and Carpenter, L. J.: Intra-annual cycles of NMVOC in the tropical marine boundary layer and their use for interpreting seasonal variability in CO, J. Geophys. Res.-Atmos., 114, D21303, https://doi.org/10.1029/2009JD011879, 2009.
Reed, C., Evans, M. J., Di Carlo, P., Lee, J. D., and Carpenter, L. J.: Interferences in photolytic NO2 measurements: explanation for an apparent missing oxidant?, Atmos. Chem. Phys., 16, 4707–4724, https://doi.org/10.5194/acp-16-4707-2016, 2016.
Reed, C., Evans, M. J., Crilley, L. R., Bloss, W. J., Sherwen, T., Read, K. A., Lee, J. D., and Carpenter, L. J.: Evidence for renoxification in the tropical marine boundary layer, Atmos. Chem. Phys., 17, 4081–4092, https://doi.org/10.5194/acp-17-4081-2017, 2017.
Rhoads, K. P., Kelley, P., Dickerson, R. R., Carsey, T. P., Farmer, M., Savoie, D. L., and Prospero, J. M.: Composition of the troposphere over the Indian Ocean during the monsoonal transition, J. Geophys. Res.-Atmos., 102, 18981–18995, https://doi.org/10.1029/97JD01078, 1997.
Ridley, B. A., Carroll, M. A., Gregory, G. L., and Sachse, G. W.: NO and NO2 in the troposphere: Technique and measurements in regions of a folded tropopause, J. Geophys. Res.-Atmos., 93, 15813–15830, https://doi.org/10.1029/JD093iD12p15813, 1988.
Ridley, B. A., Madronich, S., Chatfield, R. B., Walega, J. G., Shetter, R. E., Carroll, M. A., and Montzka, D. D.: Measurements and model simulations of the photostationary state during the Mauna Loa Observatory Photochemistry Experiment: Implications for radical concentrations and ozone production and loss rates, J. Geophys. Res.-Atmos., 97, 10375–10388, https://doi.org/10.1029/91JD02287, 1992.
Ryerson, T. B., Williams, E. J., and Fehsenfeld, F. C.: An efficient photolysis system for fast-response NO2 measurements, J. Geophys. Res.-Atmos., 105, 26447–26461, https://doi.org/10.1029/2000jd900389, 2000.
Sadanaga, Y., Matsumoto, J., Sakurai, K.-I., Isozaki, R., Kato, S., Nomaguchi, T., Bandow, H., and Kajii, Y.: Development of a measurement system of peroxy radicals using a chemical amplification/laser-induced fluorescence technique, Rev. Sci. Instrum., 75, 864–872, https://doi.org/10.1063/1.1666985, 2004.
Saiz-Lopez, A., Plane, J. M. C., Baker, A. R., Carpenter, L. J., von Glasow, R., Gómez Martín, J. C., McFiggans, G., and Saunders, R. W.: Atmospheric Chemistry of Iodine, Chem. Rev., 112, 1773–1804, https://doi.org/10.1021/cr200029u, 2012.
Sherwen, T., Evans, M. J., Carpenter, L. J., Andrews, S. J., Lidster, R. T., Dix, B., Koenig, T. K., Sinreich, R., Ortega, I., Volkamer, R., Saiz-Lopez, A., Prados-Roman, C., Mahajan, A. S., and Ordóñez, C.: Iodine's impact on tropospheric oxidants: a global model study in GEOS-Chem, Atmos. Chem. Phys., 16, 1161–1186, https://doi.org/10.5194/acp-16-1161-2016, 2016.
Sillman, S.: The relation between ozone, NOx and hydrocarbons in urban and polluted rural environments, Atmos. Environ., 33, 1821–1845, https://doi.org/10.1016/S1352-2310(98)00345-8, 1999.
Sommariva, R., Cox, S., Martin, C., Borońska, K., Young, J., Jimack, P. K., Pilling, M. J., Matthaios, V. N., Nelson, B. S., Newland, M. J., Panagi, M., Bloss, W. J., Monks, P. S., and Rickard, A. R.: AtChem (version 1), an open-source box model for the Master Chemical Mechanism, Geosci. Model Dev., 13, 169–183, https://doi.org/10.5194/gmd-13-169-2020, 2020.
Steinbrecher, R.: SYSTEM AND PERFORMANCE AUDIT FOR NON METHANE VOLATILE ORGANIC COMPOUNDS: Global GAW Station – Cape Verde Atmospheric Observatory Calhau, Cape Verde, WMO World Calibration Centre for VOC, Karlsruhe Institute of Technology, KIT/IMK-IFU, Garmisch-Partenkirchen, Germany, GAW report no. 265, 2019.
Syomin, D. A. and Finlayson-Pitts, B. J.: HONO decomposition on borosilicate glass surfaces: implications for environmental chamber studies and field experiments, Phys. Chem. Chem. Phys., 5, 5236–5242, https://doi.org/10.1039/B309851F, 2003.
Tadic, I., Crowley, J. N., Dienhart, D., Eger, P., Harder, H., Hottmann, B., Martinez, M., Parchatka, U., Paris, J.-D., Pozzer, A., Rohloff, R., Schuladen, J., Shenolikar, J., Tauer, S., Lelieveld, J., and Fischer, H.: Net ozone production and its relationship to nitrogen oxides and volatile organic compounds in the marine boundary layer around the Arabian Peninsula, Atmos. Chem. Phys., 20, 6769–6787, https://doi.org/10.5194/acp-20-6769-2020, 2020.
Trebs, I., Mayol-Bracero, O. L., Pauliquevis, T., Kuhn, U., Sander, R., Ganzeveld, L., Meixner, F. X., Kesselmeier, J., Artaxo, P., and Andreae, M. O.: Impact of the Manaus urban plume on trace gas mixing ratios near the surface in the Amazon Basin: Implications for the NO-NO2-O3 photostationary state and peroxy radical levels, J. Geophys. Res.-Atmos., 117, D05307, https://doi.org/10.1029/2011JD016386, 2012.
Vaughan, S., Ingham, T., Whalley, L. K., Stone, D., Evans, M. J., Read, K. A., Lee, J. D., Moller, S. J., Carpenter, L. J., Lewis, A. C., Fleming, Z. L., and Heard, D. E.: Seasonal observations of OH and HO2 in the remote tropical marine boundary layer, Atmos. Chem. Phys., 12, 2149–2172, https://doi.org/10.5194/acp-12-2149-2012, 2012.
Vogt, R., Sander, R., von Glasow, R., and Crutzen, P. J.: Iodine Chemistry and its Role in Halogen Activation and Ozone Loss in the Marine Boundary Layer: A Model Study, J. Atmos. Chem., 32, 375–395, https://doi.org/10.1023/A:1006179901037, 1999.
Volz-Thomas, A., Pätz, H.-W., Houben, N., Konrad, S., Mihelcic, D., Klüpfel, T., and Perner, D.: Inorganic trace gases and peroxy radicals during BERLIOZ at Pabstthum: An investigation of the photostationary state of NOx and O3, J. Geophys. Res.-Atmos., 108, PHO 4-1–PHO 4-15, https://doi.org/10.1029/2001JD001255, 2003.
Wang, X., Jacob, D. J., Downs, W., Zhai, S., Zhu, L., Shah, V., Holmes, C. D., Sherwen, T., Alexander, B., Evans, M. J., Eastham, S. D., Neuman, J. A., Veres, P. R., Koenig, T. K., Volkamer, R., Huey, L. G., Bannan, T. J., Percival, C. J., Lee, B. H., and Thornton, J. A.: Global tropospheric halogen (Cl, Br, I) chemistry and its impact on oxidants, Atmos. Chem. Phys., 21, 13973–13996, https://doi.org/10.5194/acp-21-13973-2021, 2021.
Whalley, L. K., Lewis, A. C., McQuaid, J. B., Purvis, R. M., Lee, J. D., Stemmler, K., Zellweger, C., and Ridgeon, P.: Two high-speed, portable GC systems designed for the measurement of non-methane hydrocarbons and PAN: Results from the Jungfraujoch High Altitude Observatory, J. Environ. Monitor., 6, 234–241, https://doi.org/10.1039/B310022G, 2004.
Whalley, L. K., Furneaux, K. L., Goddard, A., Lee, J. D., Mahajan, A., Oetjen, H., Read, K. A., Kaaden, N., Carpenter, L. J., Lewis, A. C., Plane, J. M. C., Saltzman, E. S., Wiedensohler, A., and Heard, D. E.: The chemistry of OH and HO2 radicals in the boundary layer over the tropical Atlantic Ocean, Atmos. Chem. Phys., 10, 1555–1576, https://doi.org/10.5194/acp-10-1555-2010, 2010.
Williams, E. J., Roberts, J. M., Baumann, K., Bertman, S. B., Buhr, S., Norton, R. B., and Fehsenfeld, F. C.: Variations in NOy composition at Idaho Hill, Colorado, J. Geophys. Res.-Atmos., 102, 6297–6314, https://doi.org/10.1029/96JD03252, 1997.
Wofsy, S. C., Afshar, S., Allen, H. M., Apel, E. C., Asher, E. C., Barletta, B., Bent, J., Bian, H., Biggs, B. C., Blake, D. R., Blake, N., Bourgeois, I., Brock, C. A., Brune, W. H., Budney, J. W., Bui, T. P., Butler, A., Campuzano-Jost, P., Chang, C. S., Chin, M., Commane, R., Correa, G., Crounse, J. D., Cullis, P. D., Daube, B. C., Day, D. A., Dean-Day, J. M., Dibb, J. E., DiGangi, J. P., Diskin, G. S., Dollner, M., Elkins, J. W., Erdesz, F., Fiore, A. M., Flynn, C. M., Froyd, K. D., Gesler, D. W., Hall, S. R., Hanisco, T. F., Hannun, R. A., Hills, A. J., Hintsa, E. J., Hoffman, A., Hornbrook, R. S., Huey, L. G., Hughes, S., Jimenez, J. L., Johnson, B. J., Katich, J. M., Keeling, R. F., Kim, M. J., Kupc, A., Lait, L. R., McKain, K., McLaughlin, R. J., Meinardi, S., Miller, D. O., Montzka, S. A., Moore, F. L., Morgan, E. J., Murphy, D. M., Murray, L. T., Nault, B. A., Neuman, J. A., Newman, P. A., Nicely, J. M., Pan, X., Paplawsky, W., Peischl, J., Prather, M. J., Price, D. J., Ray, E. A., Reeves, J. M., Richardson, M., Rollins, A. W., Rosenlof, K. H., Ryerson, T. B., Scheuer, E., Schill, G. P., Schroder, J. C., Schwarz, J. P., St.Clair, J. M., Steenrod, S. D., Stephens, B. B., Strode, S. A., Sweeney, C., Tanner, D., Teng, A. P., Thames, A. B., Thompson, C. R., Ullmann, K., Veres, P. R., Wagner, N. L., Watt, A., Weber, R., Weinzierl, B. B., Wennberg, P. O., Williamson, C. J., Wilson, J. C., Wolfe, G. M., Woods, C. T., Zeng, L. H., and Vieznor, N.: ATom: Merged Atmospheric Chemistry, Trace Gases, and Aerosols, Version 2, ORNL Distributed Active Archive Center [data set], https://doi.org/10.3334/ORNLDAAC/1925, 2021.
Wolfe, G. M., Cantrell, C., Kim, S., Mauldin III, R. L., Karl, T., Harley, P., Turnipseed, A., Zheng, W., Flocke, F., Apel, E. C., Hornbrook, R. S., Hall, S. R., Ullmann, K., Henry, S. B., DiGangi, J. P., Boyle, E. S., Kaser, L., Schnitzhofer, R., Hansel, A., Graus, M., Nakashima, Y., Kajii, Y., Guenther, A., and Keutsch, F. N.: Missing peroxy radical sources within a summertime ponderosa pine forest, Atmos. Chem. Phys., 14, 4715–4732, https://doi.org/10.5194/acp-14-4715-2014, 2014.
Wood, E. C., and Charest, J. R.: Chemical Amplification – Cavity Attenuated Phase Shift Spectroscopy Measurements of Atmospheric Peroxy Radicals, Anal. Chem., 86, 10266–10273, https://doi.org/10.1021/ac502451m, 2014.
Yang, M., Beale, R., Liss, P., Johnson, M., Blomquist, B., and Nightingale, P.: Air–sea fluxes of oxygenated volatile organic compounds across the Atlantic Ocean, Atmos. Chem. Phys., 14, 7499–7517, https://doi.org/10.5194/acp-14-7499-2014, 2014.
Zellweger, C., Steinbacher, M., and Buchmann, B.: Evaluation of new laser spectrometer techniques for in-situ carbon monoxide measurements, Atmos. Meas. Tech., 5, 2555–2567, https://doi.org/10.5194/amt-5-2555-2012, 2012.
Zellweger, C., Emmenegger, L., Firdaus, M., Hatakka, J., Heimann, M., Kozlova, E., Spain, T. G., Steinbacher, M., van der Schoot, M. V., and Buchmann, B.: Assessment of recent advances in measurement techniques for atmospheric carbon dioxide and methane observations, Atmos. Meas. Tech., 9, 4737–4757, https://doi.org/10.5194/amt-9-4737-2016, 2016.