the Creative Commons Attribution 4.0 License.
the Creative Commons Attribution 4.0 License.
 | 09 Dec 2022
Interaction between cloud–radiation, atmospheric dynamics and thermodynamics based on observational data from GoAmazon 2014/15 and a cloud-resolving model
Layrson J. M. Gonçalves
Simone M. S. C. Coelho
Paulo Y. Kubota
Dayana C. Souza
Observational meteorological data from the field experiment GoAmazon 2014/15 and data from numerical simulations with the cloud-resolving model (CRM) called the System for Atmospheric Modeling (SAM) are used to study the interaction between the cloudiness–radiation as well as the atmospheric dynamics and thermodynamics variables for a site located in the central Amazon region (−3.2∘ S, −60.6∘ W) during the wet and dry periods. The main aims are to (a) analyze the temporal series of the integrated cloud fraction, precipitation rate and downward shortwave flux as well as (b) to determine the relationship between the integrated cloud fraction, radiative fluxes and large-scale variable anomalies as a function of the previous day's average. The temporal series of the integrated cloud fraction, precipitation rate and downward shortwave flux from SAM simulations showed physical consistency with the observations from GoAmazon 2014/15. Shallow and deep convection clouds show to have a meaningful impact on radiation fluxes in the Amazon region during wet and dry periods. Anomalies of large-scale variables (relative to the previous day's average) are physically associated with cloud formation, evolution and dissipation. SAM consistently simulated these results, where the cloud fraction vertical profile shows a pattern very close to the observed data (cloud type). Additionally, the integrated cloud fraction and large-scale variable anomalies, as a function of the previous day's average, have a good correlation. These results suggest that the memory of the large-scale dynamics from the previous day can be used to estimate the cloud fraction as well as the water content, which is a variable of the cloud itself. In general, the SAM satisfactorily simulated the interaction between cloud–radiation as well as dynamic and thermodynamic variables of the atmosphere during the periods of this study, being able to obtain atmospheric variables that are impossible to obtain in an observational way.
- Article
(8076 KB) - Full-text XML
- BibTeX
- EndNote


The interaction of radiation fluxes with clouds plays an important role in the Earth's atmosphere through the direct forcing on the diurnal cycle of meteorological variables and convective processes (Yang and Slingo, 2001). The physical processes associated with the formation of clouds produce disturbances in the atmosphere that interact with waves of different periods that propagate from the tropical region of the Pacific, influencing the cycles of active and passive convection in remote regions. The main waves that act in the tropical region are Rossby, Kelvin and inertial gravity waves that cover periods of a few days to several weeks (Matsuno, 1966; Mather, 2005). For this reason, weather and climate scales are strongly modulated by the presence of clouds that influence the energy balance of the Earth system (L'Ecuyer et al., 2019).
The clouds play an important role in planetary albedo, reflecting solar radiative flux back into space and controlling the excessive heating of the planet (Wielicki, 1995). Additionally, clouds behave as a barrier to longwave radiation emitted by oceans and continents, absorbing such radiation and emitting some back to the surface; this process creates a greenhouse-like effect in the atmosphere and maintains the average temperature of the planet (Chen, 2000; Patnaude and Diao, 2020). The effects of clouds on the warming or cooling climate system will depend on several factors: cloud-base and cloud-top height, cloud fraction, optical properties, and liquid or ice phase of the cloud particle (Wang et al., 2019; Liou, 2002). These cloud-related factors will define the absorption, transmittance and scattering properties of longwave and shortwave radiation (Mardi et al., 2019; Maghrabi et al., 2019).
The variability of cloud type and composition depends on the region where clouds are formed (Giangrande et al., 2017). In the case of the Amazon region, the type and composition of clouds play a very important role in modulating the global and regional climate, especially over South America. As a region with great convective activity, behaving as a great source of heat and humidity (Satyamurty et al., 2013; Nunes et al., 2016; Yanai and Tomita, 1998), these factors and the instability force the formation of different types of clouds.
One of the great challenges of the scientific community is modeling the formation, properties and feedback of different types of clouds correctly (Zhang, 2005; Su et al. 2010; Bodas-Salcedo et al., 2014; Calisto et al., 2014). Previous works found in the literature indicate that the deficiency of cloud simulation can generate weak or strong feedback in global climate models (GCMs). Therefore, these shortcomings remain a major source of uncertainty in weather and climate forecasting and climate change simulation (Klein and Del Genio, 2006; Del Genio 2012). Thus, understanding the processes that involve cloud formation and the interactions of clouds with radiation fluxes (called the cloud–radiation feedback process) is one of the main challenges for numerical modeling of the atmosphere due to the characteristics and diversity of the types of clouds in the Earth's atmosphere (Giangrande et al., 2017; Chen et al., 2000).
The knowledge obtained through observed data on the different atmospheric physical processes related to the generation, development and dissipation of clouds, as well as the interaction of radiation with cloud cover, is necessary to determine other phenomena that are not directly perceptible. Thus, new theories can be formulated, helping to improve existing physical parameterizations in atmospheric circulation models. In this sense, several campaigns for data collection realized in different regions will be useful in this work, for example GoAmazon (Giangrande et al., 2017) and DYNAMO (Feng et al., 2014; Fliegel and Schumacher, 2012).
The results obtained in these campaigns for data collection are being used to calibrate different types of radiative, convective and turbulent parameterizations (Ciesielski et al., 2017; Feng et al., 2015; Pujiana et al., 2018; Moulin et al. 2018) as well as to explain meteorological phenomena at different weather and climate scales (Hagos et al., 2016; Rowe et al., 2019; Mather, 2005). These field campaigns (GoAmazon and DYNAMO) helped to improve the understanding of cloud–radiation interaction processes and the physical processes responsible for the development of meteorological convective systems.
Numerical modeling is another methodology used to try to better understand the feedback of the interaction of radiation, cloud and turbulence. Numerical models have a hierarchy based on the degree of precision of their parameterizations and simplifications in the dynamic equations (Frassoni et al., 2018; Jeevanjee et al., 2017), such as the atmospheric general circulation model (AGCM-3D), single-column models (SCMs), cloud-resolving models (CRMs) and large eddy simulation (LES). Each model has a scale domain that can be represented.
LES models and CRMs are high-resolution numerical models whose grid spacings are sufficiently refined to allow explicit simulations of turbulent eddies and individual clouds throughout the entire life cycle or part of it (Tao and Moncrieff, 2009). The LES model is dedicated to the study of shallow, smaller and short-lived cumulus clouds, and CRMs are suitable for the study of deep convective clouds with a longer life cycle (Frassoni et al., 2018; Tao and Moncrieff, 2009).
Several works found in the literature show the efficiency of CRMs in simulating atmospheric phenomena (convective systems) with high resolution (Khairoutdinov et al., 2001, 2002, 2003; Mechem et al., 2018; Bretherton et al., 2017). More specifically for the Amazon region, which is the region of interest for this article, there are several studies carried out that use numerical models of the LES type (Dias-Junior et al., 2015; Neves et al., 2018; Chamecki et al., 2020) and CRMs (Khairoutdinov and Randall, 2006). However, for this region, no studies were found in the literature that use forced CRMs with data from the GoAmazon 2014/15. Therefore, the use of CRMs for studies on the Amazon region, using more recent observational data, can provide detailed information on the evolution of the cloud life cycle and the interaction of radiation with nebulosity that is not possible to obtain with observed data. This information can help improve cloud parameterizations used in atmospheric models.
In this sense, obtaining observed data or high-resolution modeling is essential to help understand how the physical processes of the atmosphere are related to the effects of cloud–radiation interaction that impact the development of convective systems in the tropical region. In the context of the problem of cloud representation in numerical models of weather and climate, the cloud fraction schemes are highlighted, which are mostly based on relative humidity thresholds, and some important parameters for cloud fraction diagnosis. These parameters are usually empirically calculated, and the choice of these values can generate uncertainties in the representation of cloudiness (Park et al., 2016; Geoffroy et al., 2017). This work aims to obtain information on variables related to the cloud itself, such as water and ice content, as well as large-scale variables (temperature, omega and relative humidity) to understand the conditions for the formation, maintenance or dissipation of clouds.
The main objective of this work is to understand the cloud–radiation interaction and the role of large-scale variables and liquid water–ice content in the development, maintenance and dissipation of cloudiness from observational data and high-resolution modeling. The results of this article will be used to improve the cloud fraction parameterization used in atmospheric general circulation models (AGCMs) in future work.
The next sections of this article are divided as follows. Section 2 shows a brief description of the data and CRM used, in addition to the design of the experiments performed, and Sect. 3 presents the results and discussions regarding the observational and complementary study using numerical modeling (CRM). In Sect. 4 are the main conclusions regarding this research.
2.1 Data and site descriptions
The Amazon region plays a very important role in modulating the global and regional climate, especially over South America, as it is a great source of heat and humidity for the development and maintenance of precipitating meteorological systems. Due to variation in the annual circulation pattern and thermodynamic structure, the region has defined wet and dry seasons (Carneiro and Fisch, 2020), with annual rainfall totals of approximately 2200 mm (Marengo et al., 2018). The rainfall characteristics of the region are defined by the presence of different systems and meteorological phenomena throughout the year, such as the Intertropical Convergence Zone, squall lines, friagens, river breeze, and penetration of frontal systems and convection organization (Fisch et al., 1998). Due to the action of different meteorological systems together with local convection, the region has different types of clouds (Giangrande et al., 2017), and the interaction of these clouds with radiation is the focus of different studies and field campaigns carried out in the region.
The observational data are from the field experiment called Observations and Modeling of the Green Ocean Amazon (GoAmazon, 2014/15). The GoAmazon experiment 2014/15, carried out from January 2014 to December 2015, several data collection points around the city of Manaus in the central region of the Amazon basin (Fig. 1). The city of Manaus is an urbanized region within the Amazon rainforest capable of causing a heat island about 3 ∘C higher than the surrounding forest. This region for studies is important for its geographic characteristics, which include two large rivers nearby and undulating relief, reaching up to 200 m in altitude (Martin et al., 2016). The experiment's focus was to study the interaction between vegetation–atmosphere, atmospheric chemistry, aerosol production, clouds, radiation and precipitation, with the aim of understanding and quantifying these interconnected processes (Macedo and Fisch, 2018; Machado et al., 2018; Martin et al., 2016).
For this article, we only used data obtained at the point called the Atmospheric Radiation Measurement (ARM) site (Fig. 1), also referred as T3 (Martin et al., 2016), which is located in Manacapuru and AM city (3.2133∘ S; 60.5987∘ W). Data were collected through the ARM program from sets of instruments called the ARM Mobile Facility (AMF) and ARM Aerial Facility (AAF). These data, in general, are very important for the scientific community because they allow doing detailed studies about the diurnal cycle evolution of clouds and the interaction with radiation fluxes (Giangrande et al., 2017). Additionally, they are useful for numerical modeling studies, which can be used as initial condition data and large-scale forcing for the integration of CRM-, LES- and SCM-type numerical models for the development of physical parameterizations, and these can be used as reference data for the evaluation of numerical simulations.
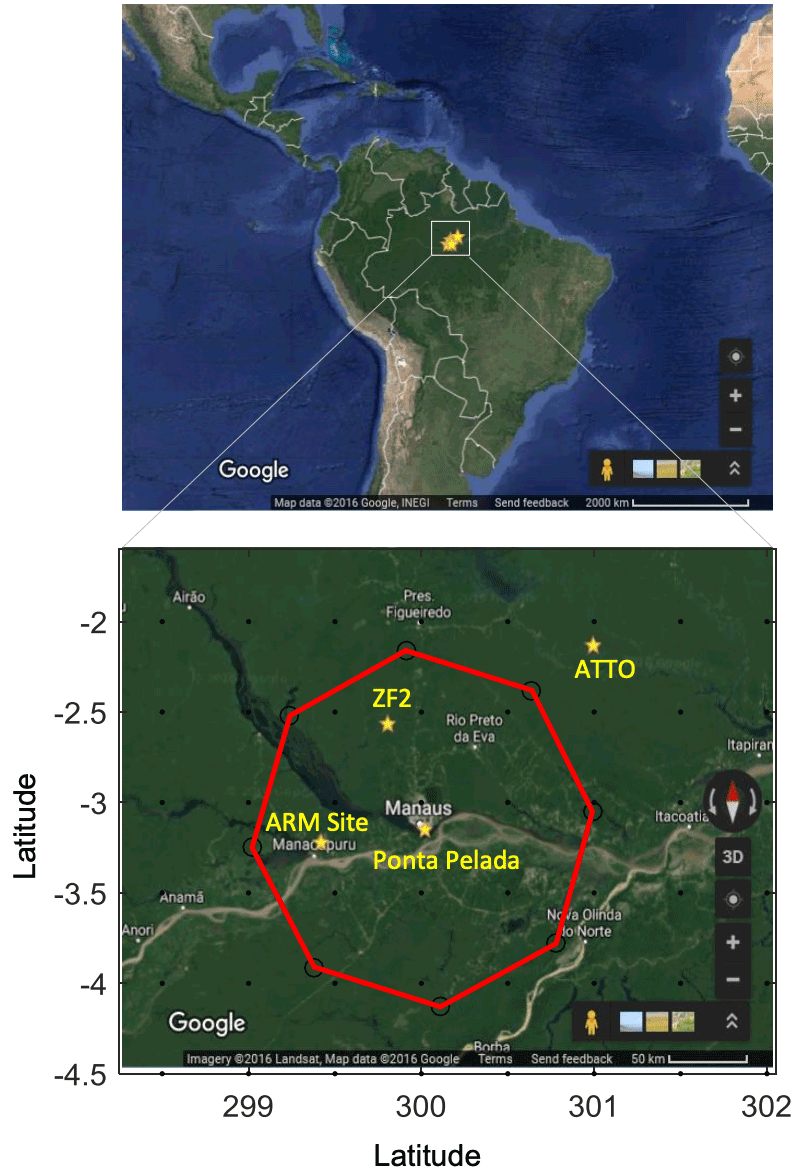
Figure 1Data collection area of the GoAmazon 2014/15 experiment and domain of VARANAL analyses (red octagon). Images extracted from Google (map data © 2016), INEGI and Landsat (imagery © 2016). Source: Tang et al. (2016).
During the GoAmazon 2014/15 field campaign, two intensive data collection periods were carried out, called IOP1 (15 February–25 March 2014) and IOP2 (1 September–10 October 2014). These IOPs were defined as aiming to better characterize the wet (IOP1) and dry (IOP2) periods of the Amazon region. Since this article aims to study the cloud–radiation interaction during the wet and dry seasons, the observed data used will be only those obtained during the IOPs.
The data generated during the GoAmazon 2014/15 that were used in this article are related to the macrophysical (cloud fraction and type of clouds) and microphysical (water content and ice content) characteristics of clouds, downward longwave and shortwave radiation fluxes for clear-sky and cloudy-sky conditions, and large-scale variables (temperature, omega, relative humidity). For the simulations carried out with the SAM model, large-scale forcing (horizontal advection of temperature and humidity) and initial condition (surface pressure and profiles of temperature, specific humidity, and U and V components of the wind) data from the Variational Analysis product (VARANAL) were used (Tang et al., 2016). The list of observational data used in this article and the references in which the methodologies adopted for the collection (instruments) or estimation (products) of the data can be found is in Table 1.
Table 1Summary of observational data (GoAmazon 2014/15).
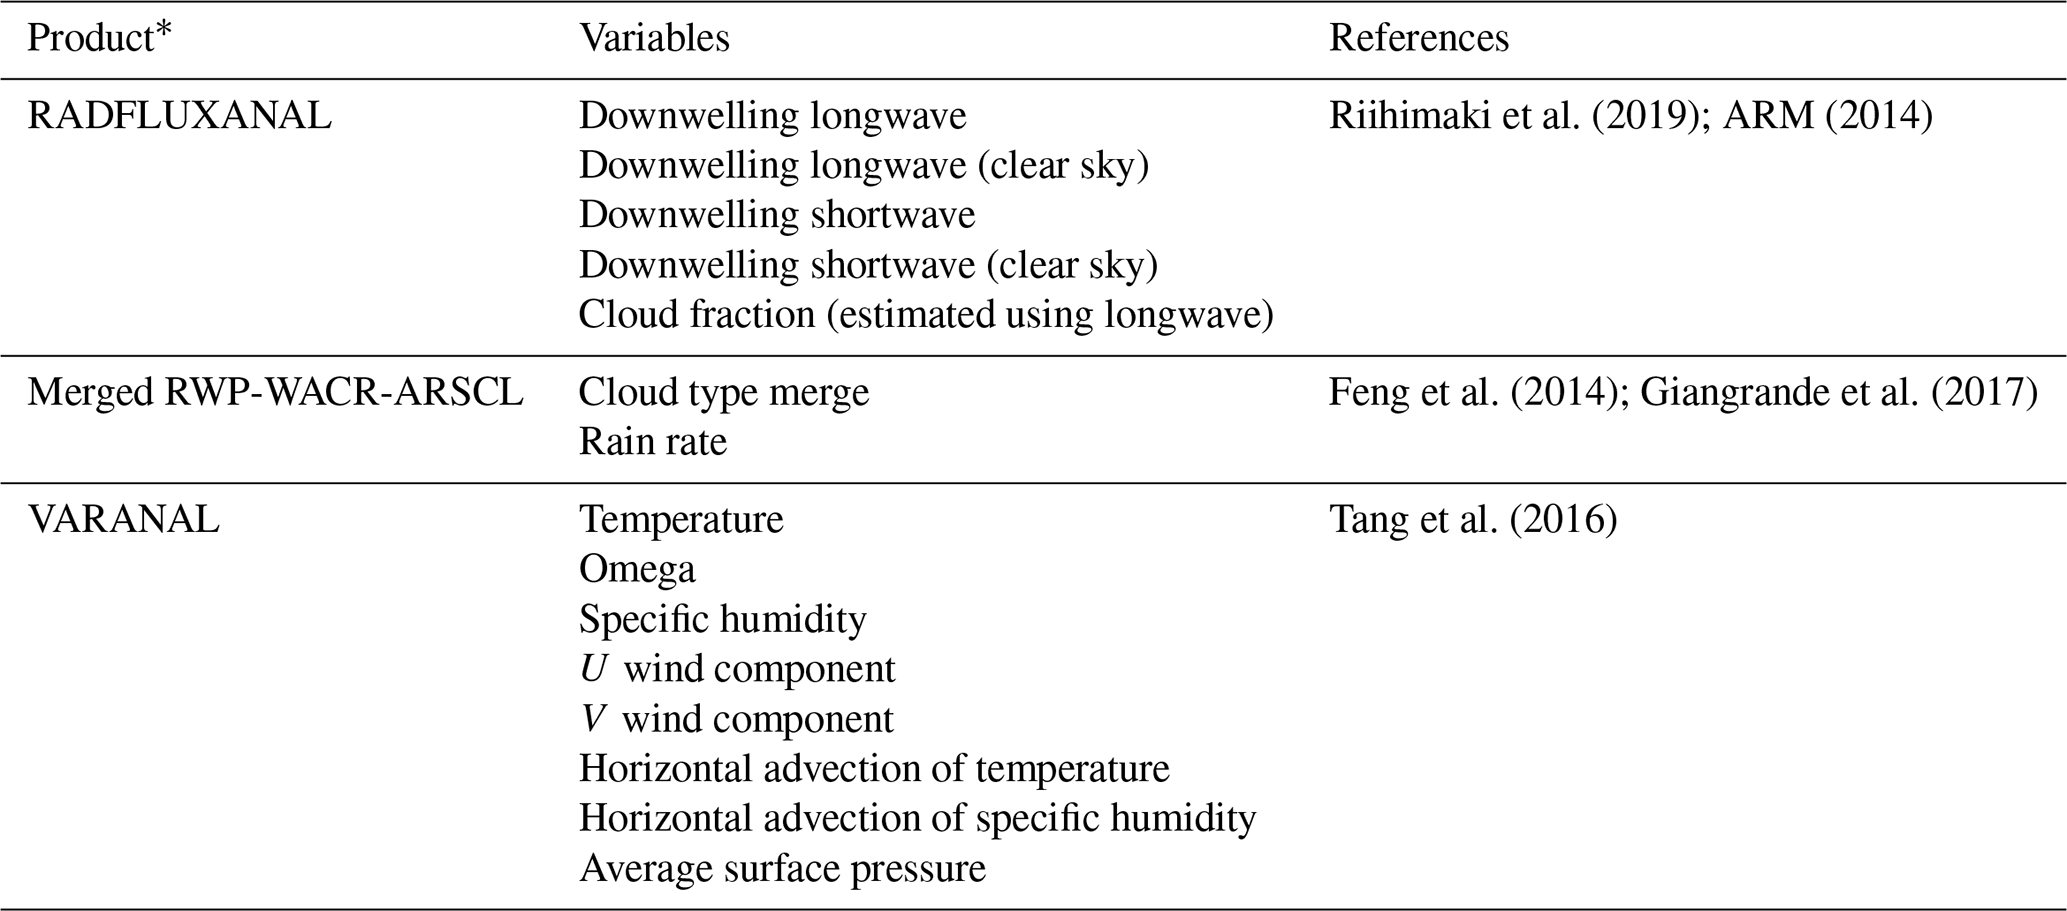
* According to GoAmazon 2014/15 nomenclature.
2.2 Model descriptions
The cloud-resolving model (CRM) used in this research was the System for Atmospheric Model (SAM) version SAM6.11.4 of July 2020 (Khairoutdinov and Randall, 2003). The model was created from a large eddy simulation (LES) model at the University of Oklahoma, and later new parameterizations were implemented to transform it into a CRM. This model can be used in the LES version in simulations for shallow convection and CRM mode for simulations in which there are deep convection clouds with a vertical velocity above 1 m s−1.
The SAM is a non-hydrostatic model with an anelastic dynamic core. It has five microphysics schemes, including single-moment microphysics, double-moment microphysics (Morrison et al., 2005), Thompson microphysics (Thompson et al., 2008) and two radiation schemes, being CAM3 Radiation (Collins et al., 2006) and the Rapid Radiative Transfer Model (RRTM) (Iacono et al., 2008).
The surface fluxes can be prescribed or simulated using the coupled surface model called the Simplified Land Model (SLM) (Lee and Khairoutdinov, 2015). SLM was developed for use in cloud-resolving models; it has an interactive vegetation layer on the ground and supports 17 classes of soil types in addition to using input data such as sand, clay, moisture and soil temperature content profiles.
2.3 Design of evaluation experiments
In this work, the SAM model is used mainly as a complement to the observed data. For this, the consistency of the model is verified in simulating the interaction between cloud cover and radiation fluxes, as well as large-scale variables (temperature, relative humidity and omega), in order to use variables that are not available in the GoAmazon 2014/15 and to understand the importance of correctly simulating the cloudiness pattern in numerical models.
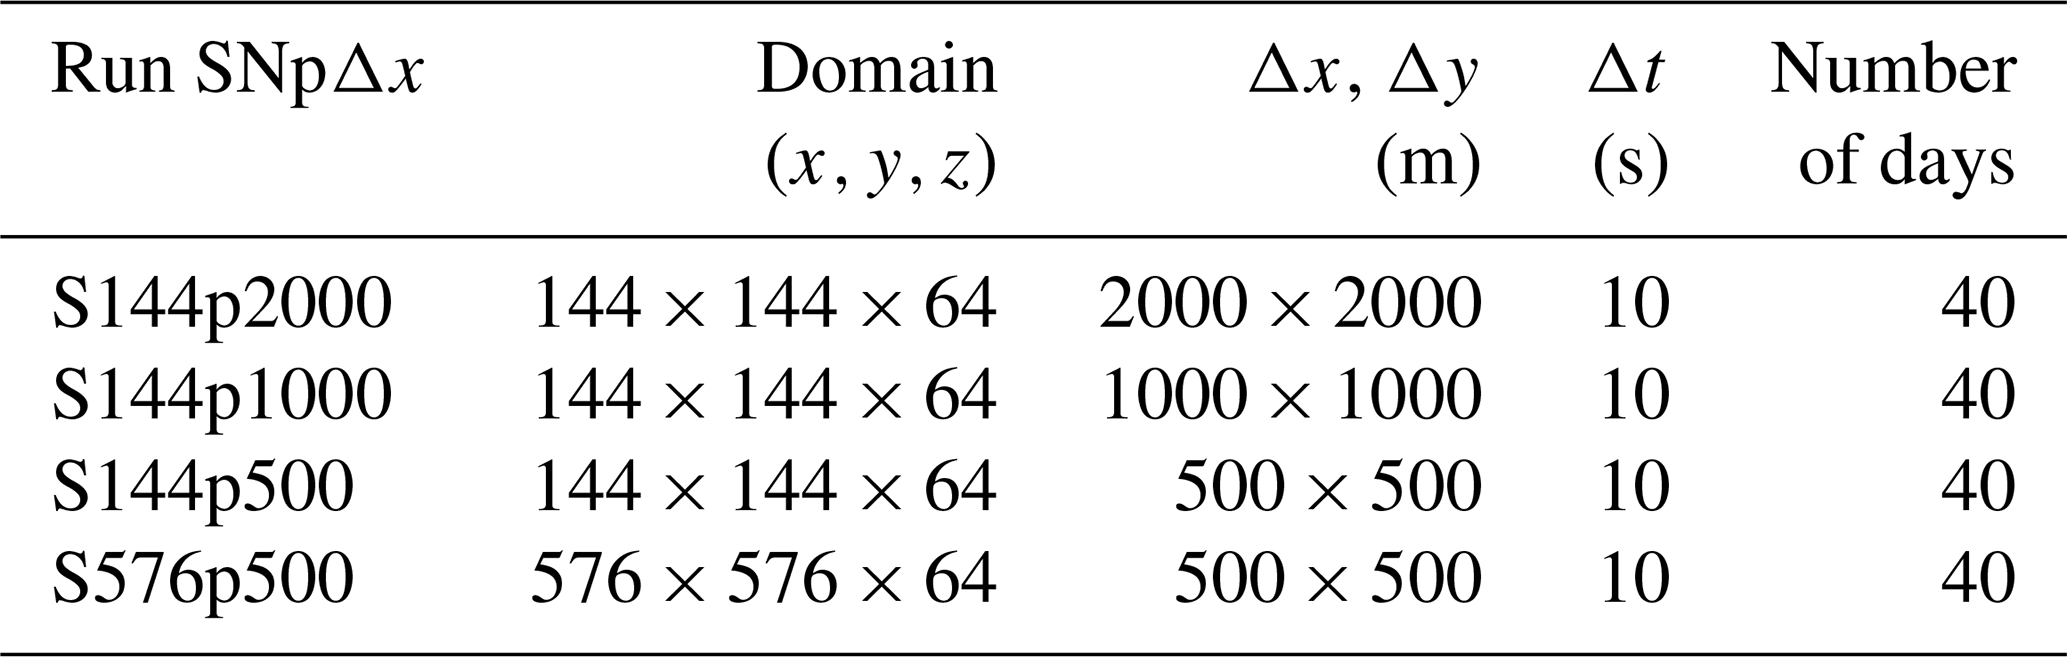
For this paper, the SAM model was configured using the single-moment microphysics scheme and the CAM3 radiation scheme, and the surface fluxes were calculated using the SLM. The forcing large-scale (LSF) and initial condition (SND) data were extracted from the VARANAL product (Tang et al., 2016). In total, eight simulations with different horizontal resolutions were performed, in which there four configurations for IOP1 and the same number of simulations for IOP2. Each simulation was integrated by the total period of each IOP (40 d) with 64 vertical levels and varying only in the horizontal domains.
For both IOPs, the following horizontal domains were used: 82 944 km2 (grid with a horizontal resolution of 2000 m), 20.736 km2 (grid with a horizontal resolution of 1000 m), 5.184 km2 (grid with a horizontal resolution of 500 m) and 82 944 km2 ( grid with 500 m horizontal resolution). Table 2 summarizes the simulation settings.
Table 2Horizontal resolution of simulations with SAM. Np represents the horizontal point numbers.
The results section is divided into three parts and structured as follows.
Section 3.1 evaluates the temporal evolution of the integrated cloud fraction, precipitation rate and downward shortwave flux for the wet (IOP1) and dry (IOP2) periods. Additionally, it was verified that the impact of the different horizontal resolutions was used in the simulations with the SAM model.
Section 3.2 shows the diurnal cycle of some atmospheric variables for two specific days, one within the wet period (IOP1) and the other to the dry period (IOP2). The analyzed variables are associated with macrophysical characteristics of clouds (cloud type, integrated cloud fraction and cloud fraction profile), incident radiation fluxes at the surface (longwave and shortwave) and anomalies of large-scale variables (temperature, relative humidity and omega). For each day, there are presented observational variables and those obtained from simulations performed with the SAM model. This section aims to evaluate the behavior of radiation fluxes as a function of the presence of different types of clouds and how the average atmospheric conditions of the previous day can influence the cloudiness.
Finally, Sect. 3.3 shows dispersion figures correlating the cloud fraction variable with radiation fluxes and anomalies of large-scale variables. This procedure was performed for both observational data (Sect. 3.3.1) and for simulations with the SAM model (Sect. 3.3.2). The main objective is to quantify the cloud fraction values in relation to the anomalies of the large-scale variables.
3.1 Horizontal resolution sensitivity and validation of the SAM model
The first part of the results evaluates the impact of horizontal resolution in simulations performed with the SAM model. The simulations are performed for GoAmazon 2014/15 IOP1 and IOP2 that represent the wet and dry season, respectively. Four different horizontal resolution configurations were tested (see Table 2) for each period (IOP1 and IOP2), for a total of eight numerical experiments. The temporal evolution of domain-average precipitation rate, cloud fraction and shortwave radiation fluxes simulated by SAM is compared with observational data.
The temporal precipitation rate evolution (Fig. 2a) is generally well represented in the SAM simulations. However, despite consistently simulating the observed patterns, the SAM model underestimates the peaks of the maximum intensity of the precipitation rate during IOP1. On the other hand, the simulations reproduce the observed daily precipitation cycle with well-defined maximum peaks and precipitation rates above 2.5 mm h−1. In representing the precipitation diurnal cycle, the SAM model performance has already been shown by other authors for other regions of the planet (Blossey et al., 2007; Khairoutdinov and Randall, 2003). The good performance of the SAM model is due to the data used as large-scale forcing (in this VARANAL–GoAmazon 2014/15 study) to represent the dynamics in CRM- and SCM-type models. These forcings are produced using precipitation data from radar products and observational measurements (Tang et al., 2016).
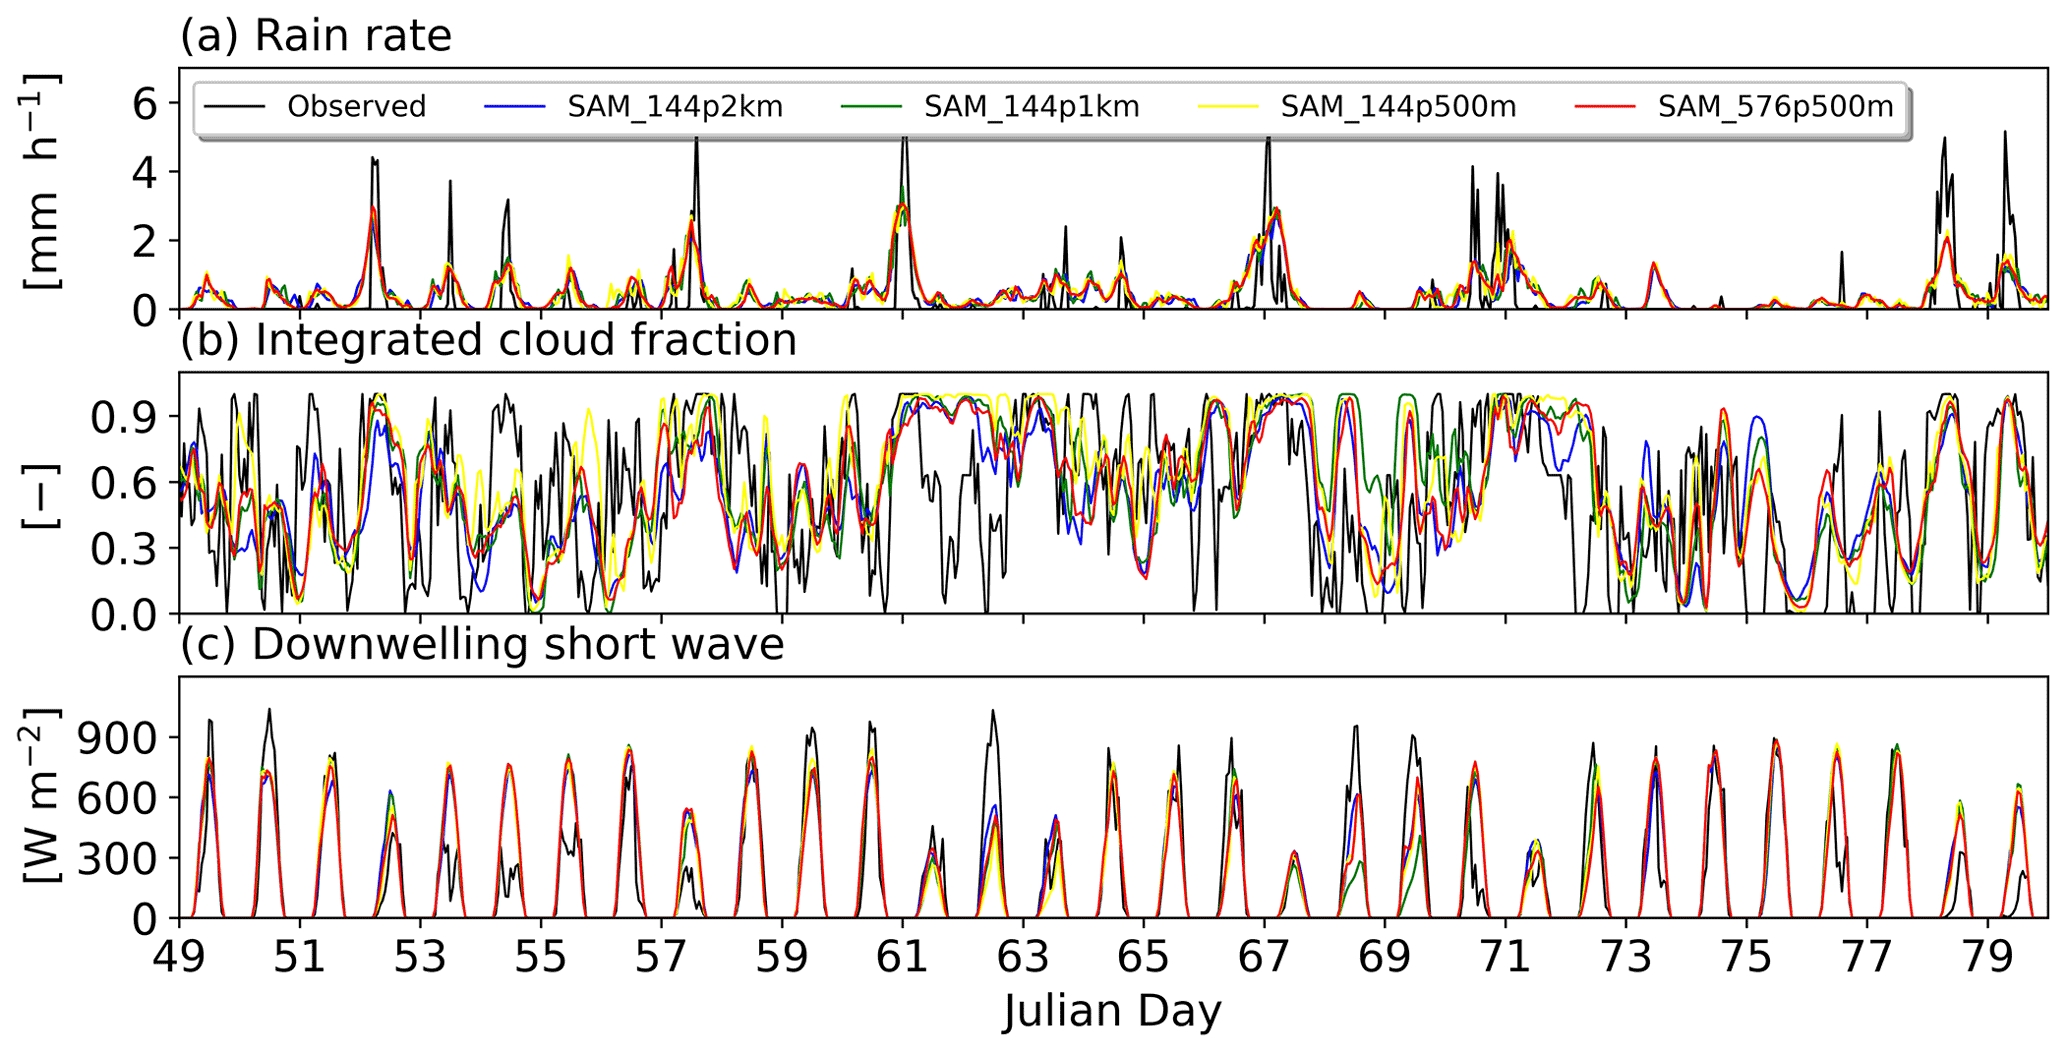
Figure 2Time series of the domain average of the column-integrated cloud fraction (ranging from 0 for clear sky to 1 for overcast sky 1), precipitation rate (mm h−1) and downward shortwave flux (W m−2) for the observations and the simulations with the SAM model for IOP1 (wet season). The black line represents the reference data (GoAmazon 2014/15), and the other colors represent the different horizontal resolutions used in the simulations (SAM).
The cloud fraction (Fig. 2b) simulated by the SAM model presents results consistent with the observed data. During the IOP1 time series (wet season), it is observed that the maximum precipitation peaks (Fig. 2a) are associated with the maximum cloud fraction values and lower values of downward shortwave flux (Fig. 2c). These results are physically consistent, as the presence of clouds, especially deep convection clouds, tends to generate large precipitation volumes and reduce the amount of solar radiation transmitted to the Earth's surface.
It is important to mention that the observed cloud fraction is a punctual and indirect measure of the cloudiness condition. The GoAmazon observed cloud fraction is retrieved from the observed downward longwave radiation (Dürr, 2004; Riihimaki et al., 2019). For an illustration, the 61st day of the Julian calendar (2 March 2014) stands out; even though simulations and observations agree with the absence of rain and low incidence of solar radiation, the simulations diverge from the observations in terms of the cloud fraction daily cycle. The observation data indicate a temporal evolution of the cloud fraction throughout the day with values below 0.6, while the simulations show values practically constant and close to 1. The satellite images obtained from GOES-13 (not shown here) show a multilayer cloud type throughout the day over the experimental site. In this sense, the cloud fraction used as a reference is a proxy for the cloud information. Thus, it shows the importance of using the results of the simulations of the SAM model as a complement to the observed data.
Figure 3 is similar to Fig. 2, but for IOP2 (dry season). The SAM model simulated lower precipitation rates for IPO2 (Fig. 3a) than for the wet period (IOP1), consistent with the observed data. Precipitation rate peaks of values below 2.0 mm h−1 are also correctly simulated, just like in the wet season (IOP1). The cloud fraction (Fig. 3b) indicates a smaller cloud amount in IOP2 (dry period) compared to IOP1 (wet period) for both observational data and simulations.
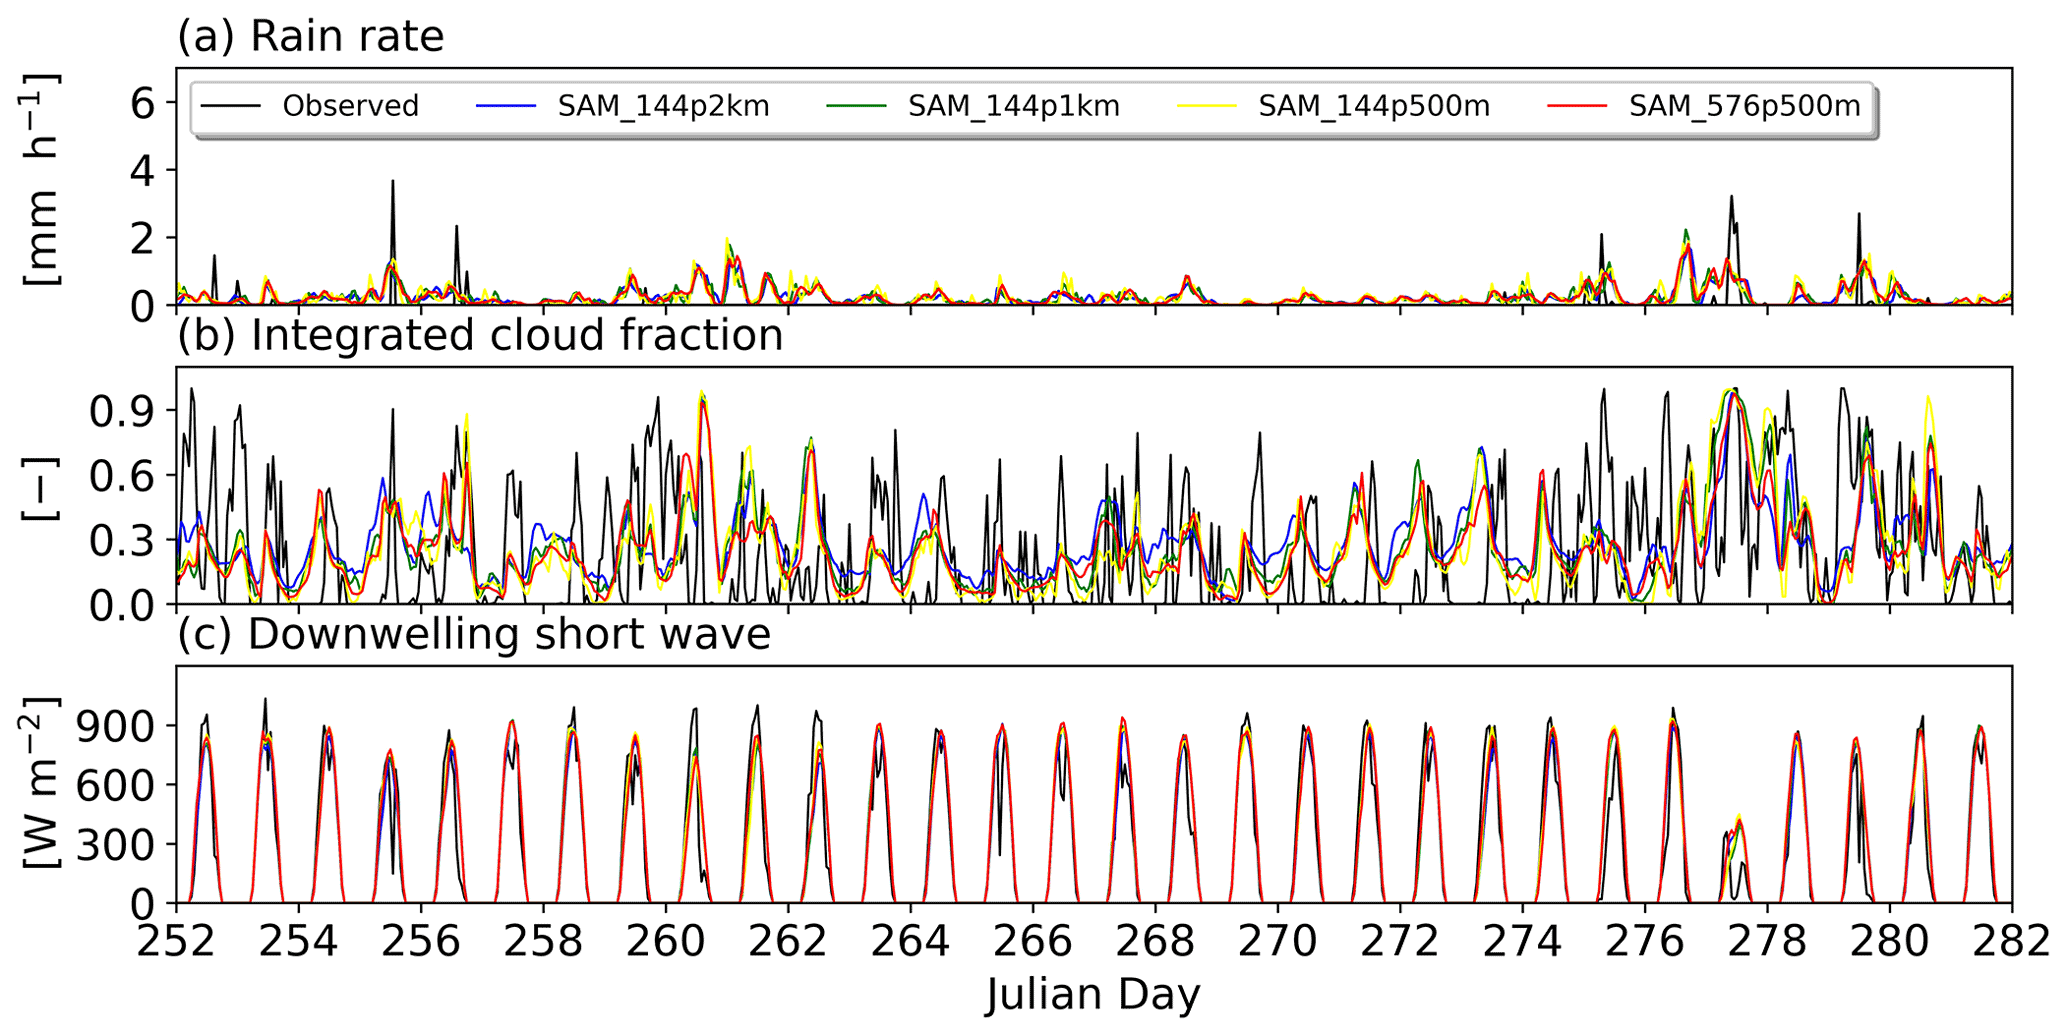
Figure 3Time series of the domain average of the column-integrated cloud fraction (ranging from 0 for clear sky to 1 for overcast sky 1), precipitation rate (mm h−1) and downward shortwave flux (W m−2) for the observations and the simulations with the SAM model for IOP2 (dry season). The black line represents the reference data (GoAmazon 2014/15), and the other colors represent the different horizontal resolutions used in the simulations (SAM).
Downward shortwave flux (Fig. 3c) is higher in the dry period due to the smaller amount of cloud than in the wet period. However, observations show that the last days of IOP2 are untypically the rainiest and with the highest precipitation rate for a dry period. The time series feature is well represented by the simulations. Julian day 277 (4 October 2014) stands out, when there is a decrease in the amount of downward shortwave flux due to the high frequency of cloud cover (Fig. 3b) and precipitation occurrence (Fig. 3a).
In general, the SAM model can adequately simulate the different precipitation patterns, cloud fraction and shortwave radiation flux observed in the wet (IOP1) and dry (IOP2) periods for the Amazon region. These results are initially related to the large-scale forcings (VARANAL–GoAmazon 2014/15) used in the simulations. These forcings are generated from the observed precipitation, and they determine the large-scale conditions of the atmospheric systems acting in the study region for the SAM model. Furthermore, the consistent results are related to the physical parameterization options used in the simulations.
Other authors (Blossey et al., 2007; Khairoutdinov and Randall, 2003) have already shown the SAM model's ability to simulate the variables observed in other regions of the planet. However, for the dry and wet seasons of the Amazon region, studies are not found in the literature with the SAM model.
Figure 4a and b show the histograms of cloud fraction distribution in the Amazon region for the wet (IOP1) and dry (IOP2) periods. The cloud fraction distribution is presented for the observed data and simulations of the SAM model with different horizontal resolutions.
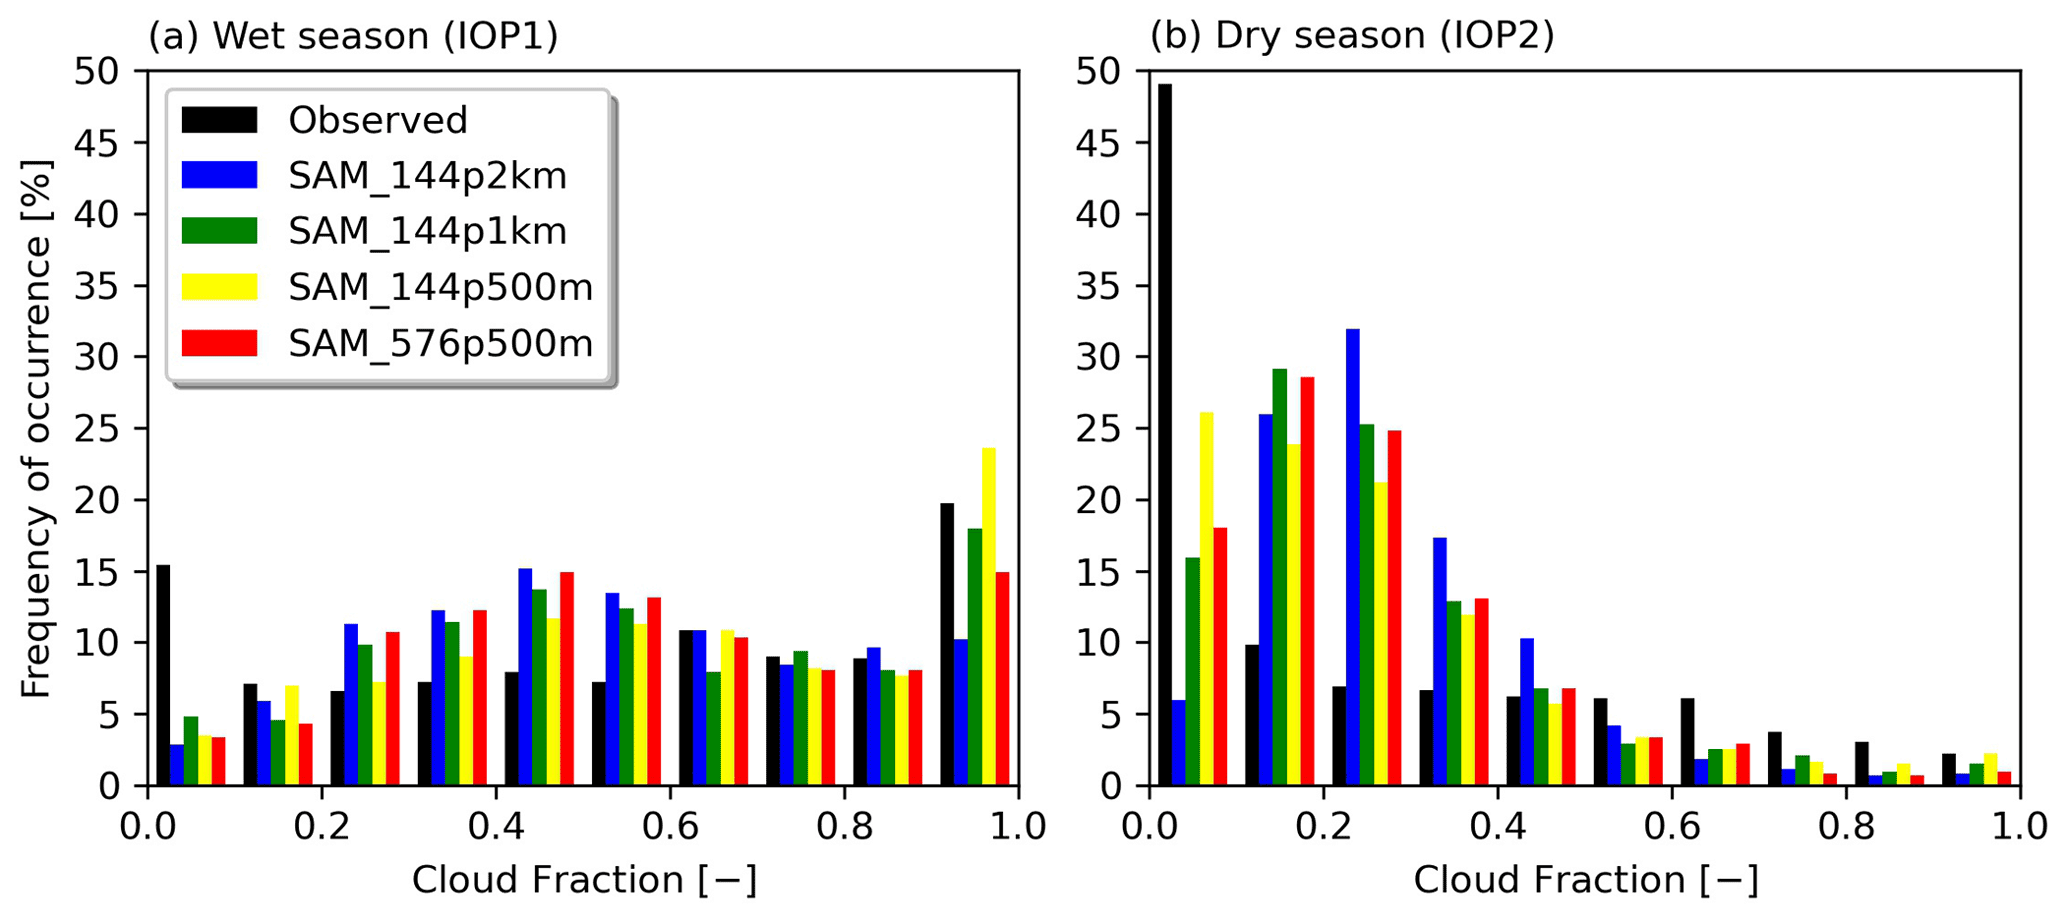
Figure 4Histogram of the integrated cloud fraction distribution (clear sky 0 and cloudy sky 1) for the observed and simulated data with the SAM model in different resolutions for IOP1 (a) and IOP2 (b).
In IOP1 (Fig. 4a), a peak of maximum cloud fraction values above 0.9 is observed. The cloud fraction distribution is consistent with the meteorological characteristics of this period, in which there is more presence of clouds due to local convection and the presence of large-scale systems that favor convection in the region, such as instability lines (Cohen et al., 1995), CCMs and the ITCZ. The SAM model adequately simulates the cloud distribution pattern for the wet season (IOP1) in the Amazon. The different horizontal resolutions were similar between them, with only a notable difference for the maximum values of cloud fraction, but this was not significant. Regarding observations, the SAM model with all resolutions has fewer cases with cloud fractions below 0.1. However, these cases of low cloudiness (fraction < 0.2) are observed for concise periods during IOP1 (Fig. 2). For other cloud fraction values, the model simulates them reasonably well, following the observational data distribution.
In the dry period (Fig. 4b), the observed and simulated pattern of cloud fraction distribution is inverse to the wet period, with a smaller number of cases with cloud fraction above 0.4. This pattern is expected, knowing that convection in the dry period is generated mainly by local factors with insignificant large-scale influences. The SAM (dry period) model showed a deficiency in simulating cloud fraction values below 0.4. This is an expected feature since the cloud fraction parameterizations, in general, are unable to simulate partially clear-sky conditions with the presence of shallow clouds. The simulations in all different horizontal resolutions represent the cloud fraction distribution satisfactorily.
Table 3Summary of the statistical analysis. The correlation coefficient (r), bias and RMSE were calculated between the observed data and each simulation with different horizontal resolutions for the wet (IOP1) and dry (IOP2) periods.
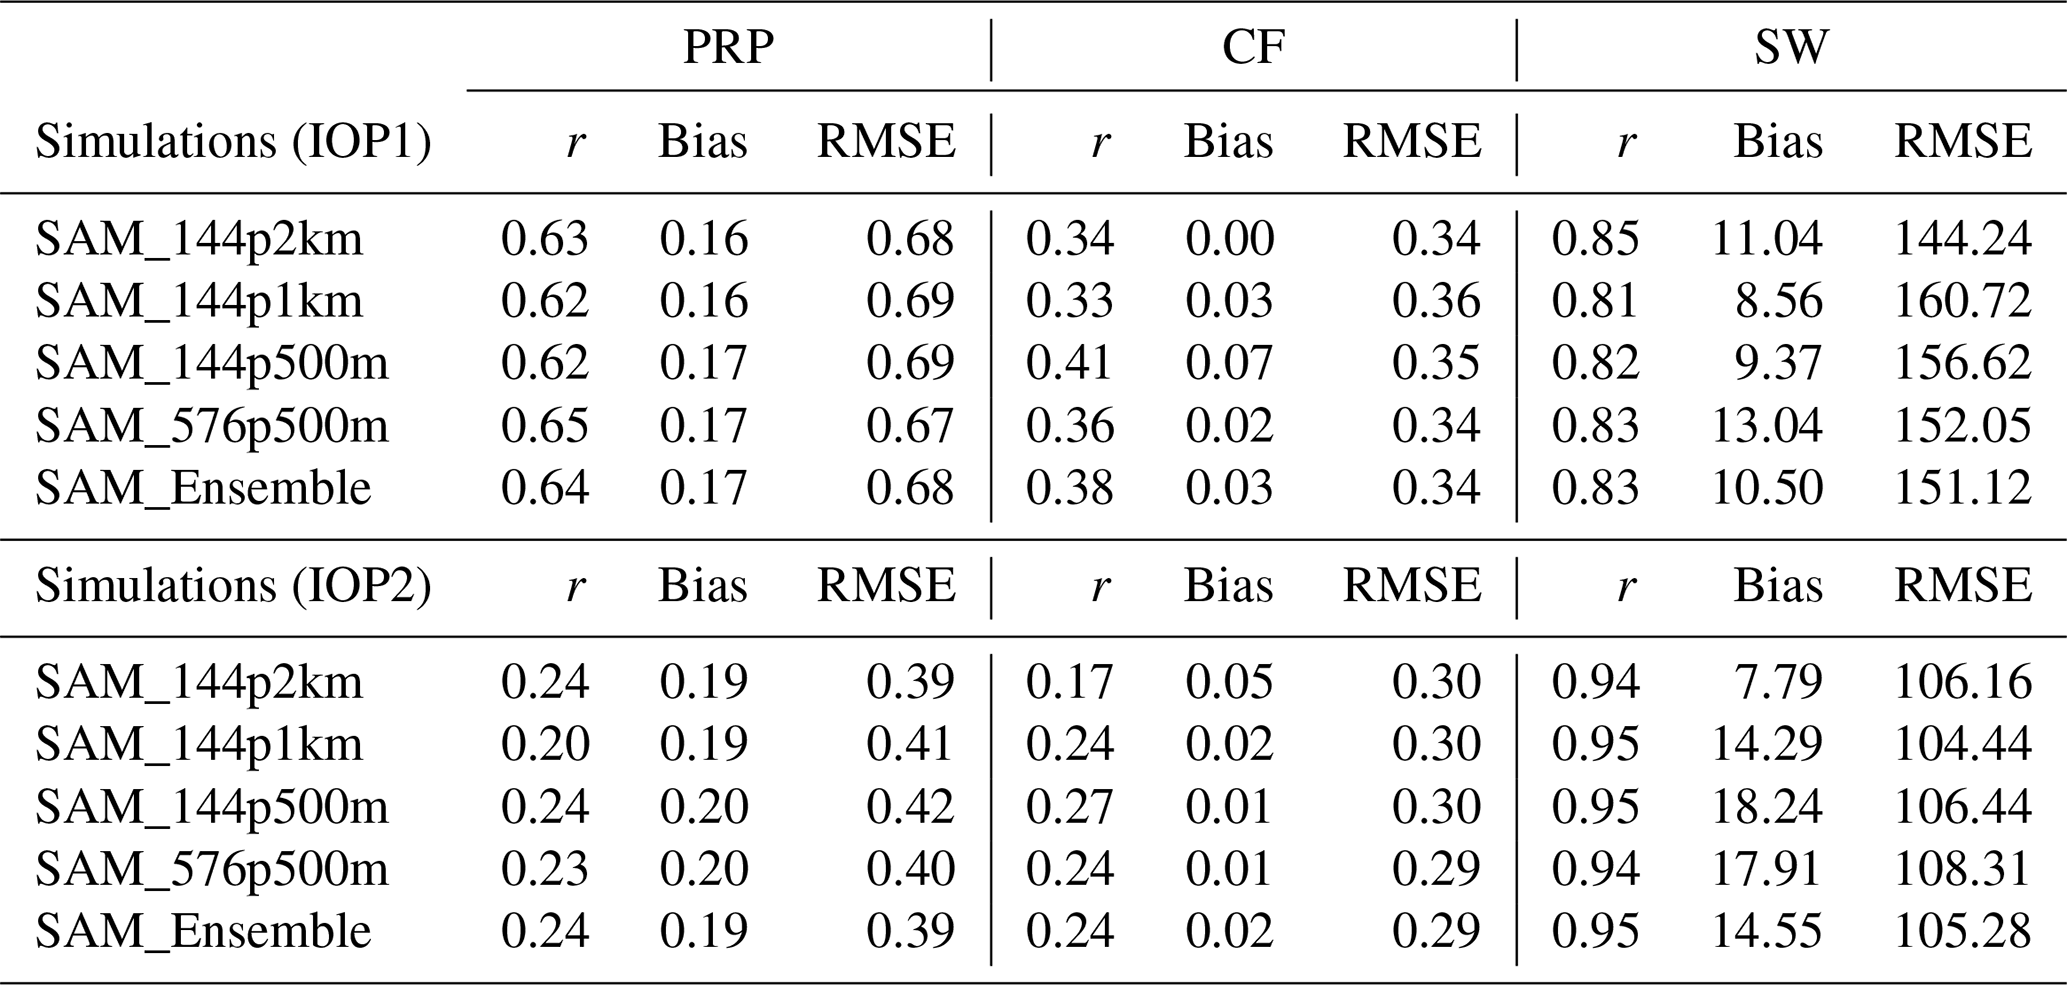
In Table 3, the correlation coefficient of precipitation and shortwave radiation between the observed and simulated data presents a good correlation, indicating that the variability of the observed data is well simulated by the model. However, the bias and root mean square errors (RMSEs) indicate that the data simulated by the SAM are overestimated in relation to the observation.
Statistical analysis of the cloud fraction does not show satisfactory values for the statistical indices, probably due to the methodology for calculating the cloud fraction obtained with observed data (Riihimaki et al., 2019) and how it is parameterized in the SAM model (Khairoutdinov and Randall, 2003), which distinctly produces cloud fraction values.
Thus, from the histogram of the distribution of the integrated cloud fraction (Fig. 4) and the statistical analyses (Table 3), it was not possible to define a better configuration of horizontal resolution to be used in the work, so it was decided to use the average among the four resolutions (ensemble) for the other analyses.
At this stage, it is shown that the simulations with the SAM model for IOP1 and IOP2, which occurred during the GoAmazon 2014/15 experiment, are satisfactory when analyzing the time series of precipitation, cloud fraction and shortwave radiative flux. In the next section of the work, a more detailed discussion is carried out for the case of two specific days, a typical day of the wet period and another of the dry period. It is expected to evaluate the skill of the SAM model and the physical consistency between the variables related to the cloud–radiation interaction.
3.2 Daily cycle of large-scale variables and radiation fluxes
In this section, the results are discussed for two distinct dates and with typical characteristics of the wet (21 February 2014 – IOP1) and dry (4 October 2014 – IOP2) periods. In addition, the days were chosen throughout the period analyzed (IOP1 and IOP2) depending on the presence of the types of clouds, especially when the occurrence of high, medium and low clouds were well defined during the day. The main objective is to evaluate the behavior of large-scale variables and radiation fluxes in relation to the presence of different types of clouds. It is also important to know if the SAM model consistently and accurately simulates the role of cloudiness in the interaction with radiation fluxes and large-scale variables due to the need to use model variables that are not possible to obtain observationally, in the case of this study the content of liquid water and ice.
Figure 5a and b show the diurnal cycle, from 21 February 2014, of the variables obtained from observational data and from simulations performed with the SAM model, respectively. The analyzed variables are cloud types, cloud fraction profile, downward longwave and shortwave flux, precipitation rate, and column-integrated cloud fraction. Additionally, the figures show the anomalies in relation to the previous day's average for the temperature, omega and relative humidity profiles.
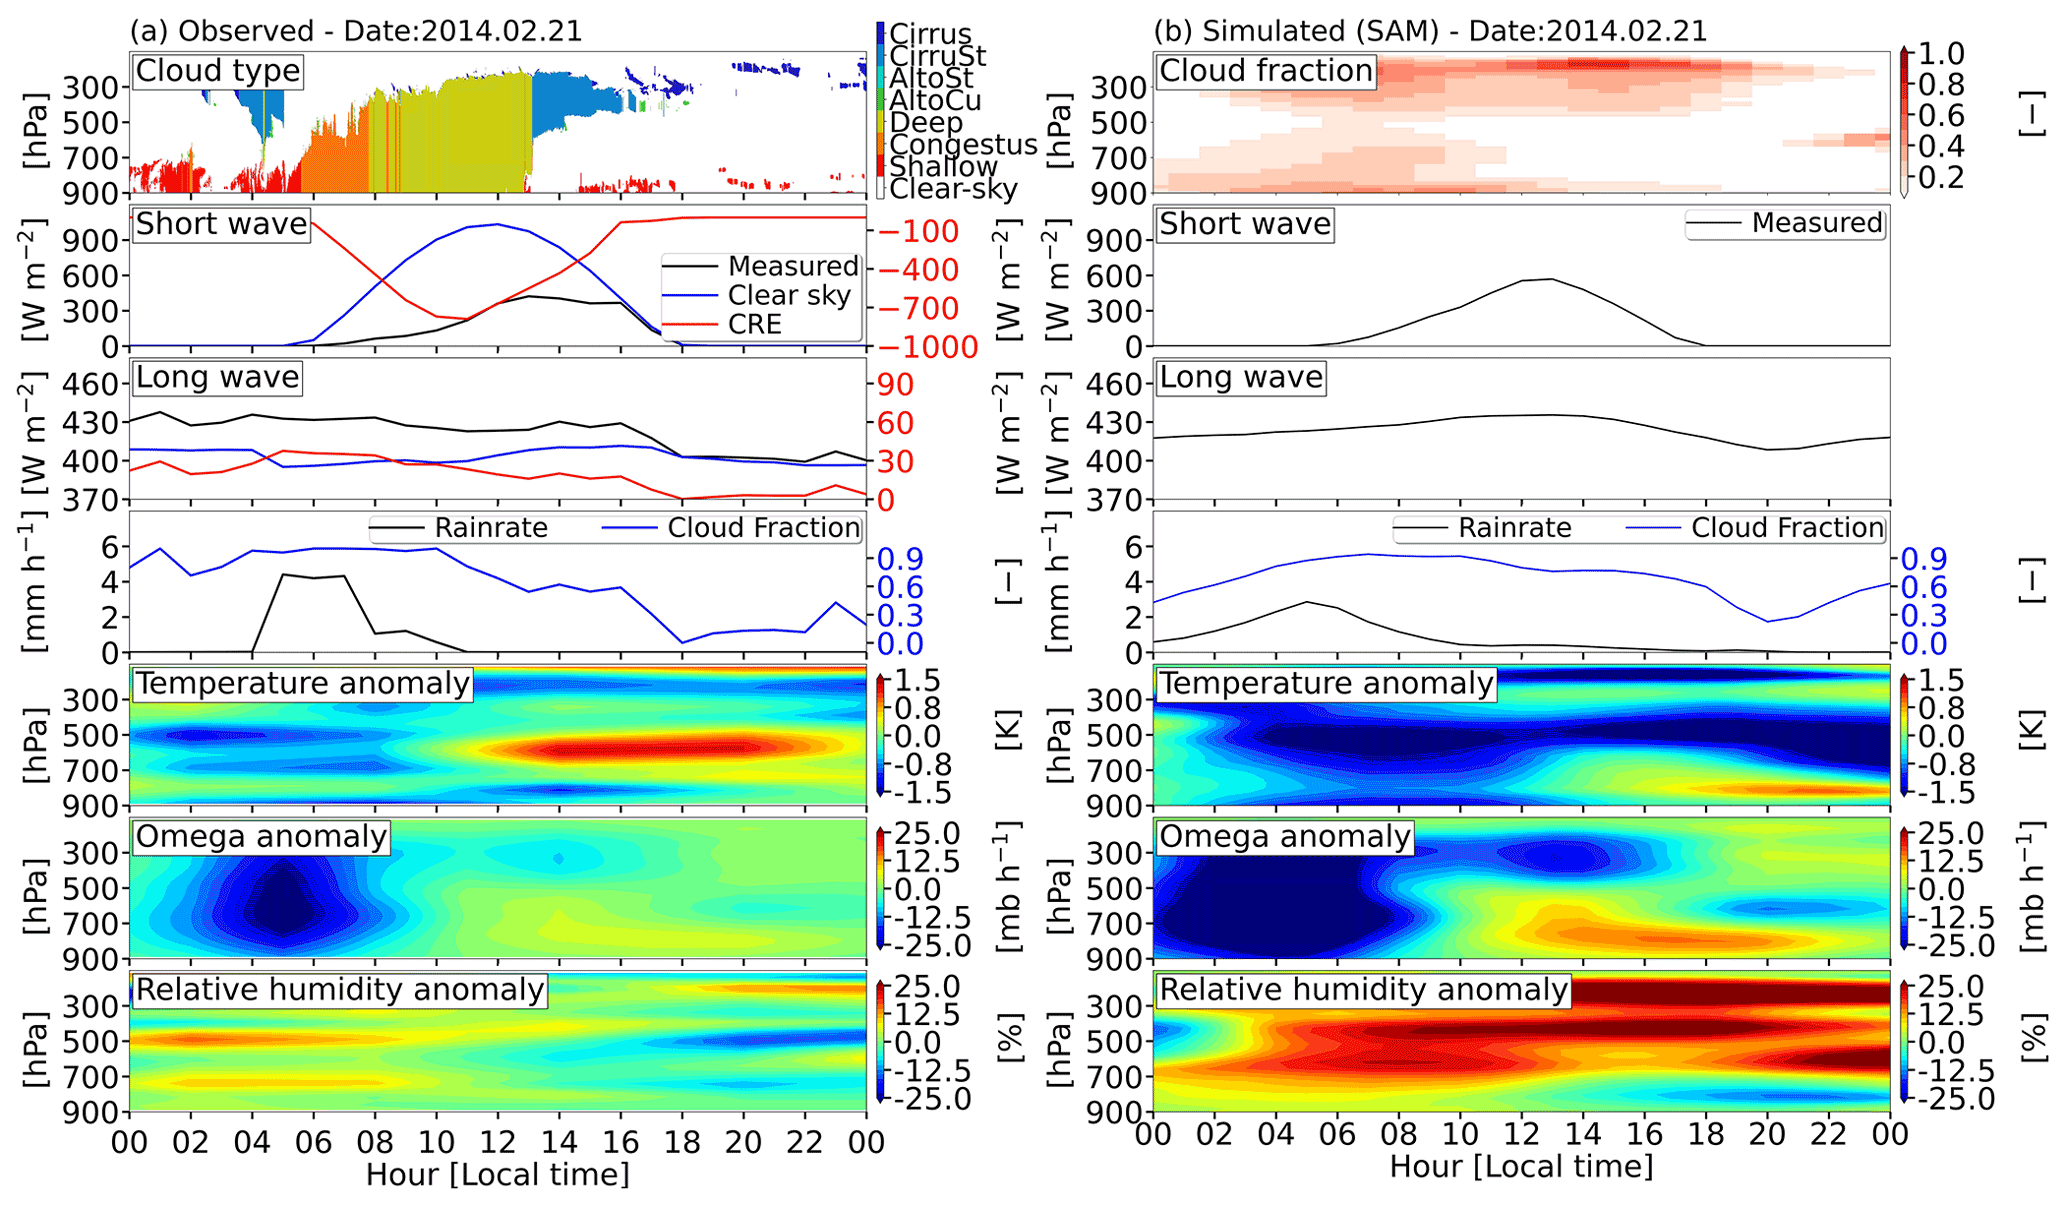
Figure 5Daily cycle of cloud type, cloud fraction profile, longwave and shortwave radiation fluxes for cloud and clear sky (W m−2), precipitation rate (mm h−1), integrated cloud fraction and temperature (K), omega (mb h−1), and relative humidity (%) anomaly from 21 February 2014 for the (a) observed data and (b) simulated with the SAM model.
The observed data (Fig. 5a) show the evolution of cloud types during 21 February 2014. In the early hours of the day, there are cirrus clouds at high levels and clouds associated with shallow convection at low levels. At approximately 06:00 local time, when heating by solar radiation starts, there is an evolution from shallow clouds to congestus-type clouds and later to deep convection clouds (between 08:00 and 13:00 local time). After deep convection and precipitation, for the rest of the day, high clouds and some shallow low clouds are observed.
For the shortwave radiation flux, a negative effect is observed mainly in the presence of congestus and deep clouds. These types of clouds decrease the incident radiation on the surface. However, the greatest negative effect of the shortwave radiation flux occurs in the presence of deep convection. This is due to some characteristics of this type of cloud, such as great optical and geometric thickness, in addition to a high and cold top. These types of clouds reflect some shortwave radiation back into space, and they absorb incident solar radiation. The line (red) showing the radiative effect of clouds (difference between fluxes in the cloudy-sky and clear-sky condition) clearly indicates a decrease in the shortwave radiation flux of about 800 Wm−2 observed in the presence of a cloud related to deep convection (deep).
Despite a very humid atmosphere, longwave radiation fluxes are also altered in the presence of different types of clouds in the atmosphere. Clouds with a low base and great vertical development, such as congestus clouds and deep convection, present greater radiative forcing, increasing the longwave radiation descending to the surface up to 40 Wm−2. On the other hand, high clouds formed by ice crystals, such as cirrostratus, have a forcing of 20 Wm−2, while cirrus has no effect in terms of descending longwave radiation.
The integrated cloud fraction shows values close to 1, indicating that the sky was completely covered by clouds during the early morning hours until approximately 13:00 local time. During this period, shallow, congestus and deep cloud types are observed. In the early evening, at 18:00 local time, there is a reduction in the cloud fraction, which is associated with the presence of some cirrus clouds.
Large-scale variables such as temperature, omega and relative humidity were analyzed, as they are of great importance in the representation of macrophysical characteristics in cloud formation and are also used to estimate cloudiness in atmospheric numerical models based on cloud fraction parameterizations (Geoffroy et al., 2017).
These variables were analyzed in the form of anomalies in relation to the average of the previous day. The average characteristics of the previous day can indicate in the calculation of the anomaly of large-scale variables (temperature, omega and relative humidity) if there is the performance of a large-scale system or more intense environmental conditions that may favor the formation of different types of clouds.
In Fig. 5a, from 00:00 to 09:00 local time, a favorable behavior is observed in the atmosphere for the generation of deep convection, where there is a tendency for a negative temperature anomaly at medium levels and positive at low levels, strong upward vertical movements throughout the atmospheric profile, and large amounts of relative humidity in the middle and lower atmosphere. After this time, the presence of clouds is observed associated with deep convection. Precipitation occurs between 04:00 and 11:00 local time, and it is associated with shallow, congestus and deep clouds. After the precipitation, there is a warming of the atmosphere due to the release of latent heat, weak subsiding vertical movements and positive relative humidity anomaly.
Figure 5b shows the diurnal cycle of the profile of cloud fraction simulated by the SAM: longwave and shortwave radiation incident on the surface, integrated cloud fraction, precipitation and temperature, omega, and relative humidity in the average from the day before.
The pattern of the cloud fraction profile simulated with the SAM model is similar to the distribution pattern of the cloud types obtained from the observational data (Fig. 5a); however, the cloud fraction of the SAM model is described in terms of intensity, where 1 represents a completely cloudy sky and 0 represents a clear sky. During the diurnal cycle, in the early hours of the day (00:00 to 06:00 local time), as well as in the observed data, there is the presence of clouds at low and high levels. From 06:00 local time, the SAM model shows clouds in all layers of the atmosphere, indicating the evolution to deep convection; however, this pattern persists only until approximately 08:00 local time. The observed data indicate that there is the presence of clouds generated as a result of deep convection up to 13:00 local time. After 13:00 local time (between 13:00 and 00:00 local time), the SAM model simulated the presence of clouds at high and low levels, as well as showing the observed data.
The surface downward fluxes of shortwave and longwave radiation simulated with the SAM model show a behavior similar to the observed data in terms of both the daily cycle pattern and the magnitude of the values. The longwave radiation, as well as observed data, shows an increase in incident flux to the surface in the presence of clouds. Clouds with a low and warm base emit a greater amount of longwave radiation towards the Earth's surface. The temperature, omega and relative humidity anomalies obtained from the SAM model showed a similar pattern but with a higher anomaly intensity modulus compared to the observed data.
Figure 6a and b show the diurnal cycle of the same variables as in Fig. 5a (observed) and b (SAM model), but for 1 d of the dry season (4 October 2014 – IOP2).
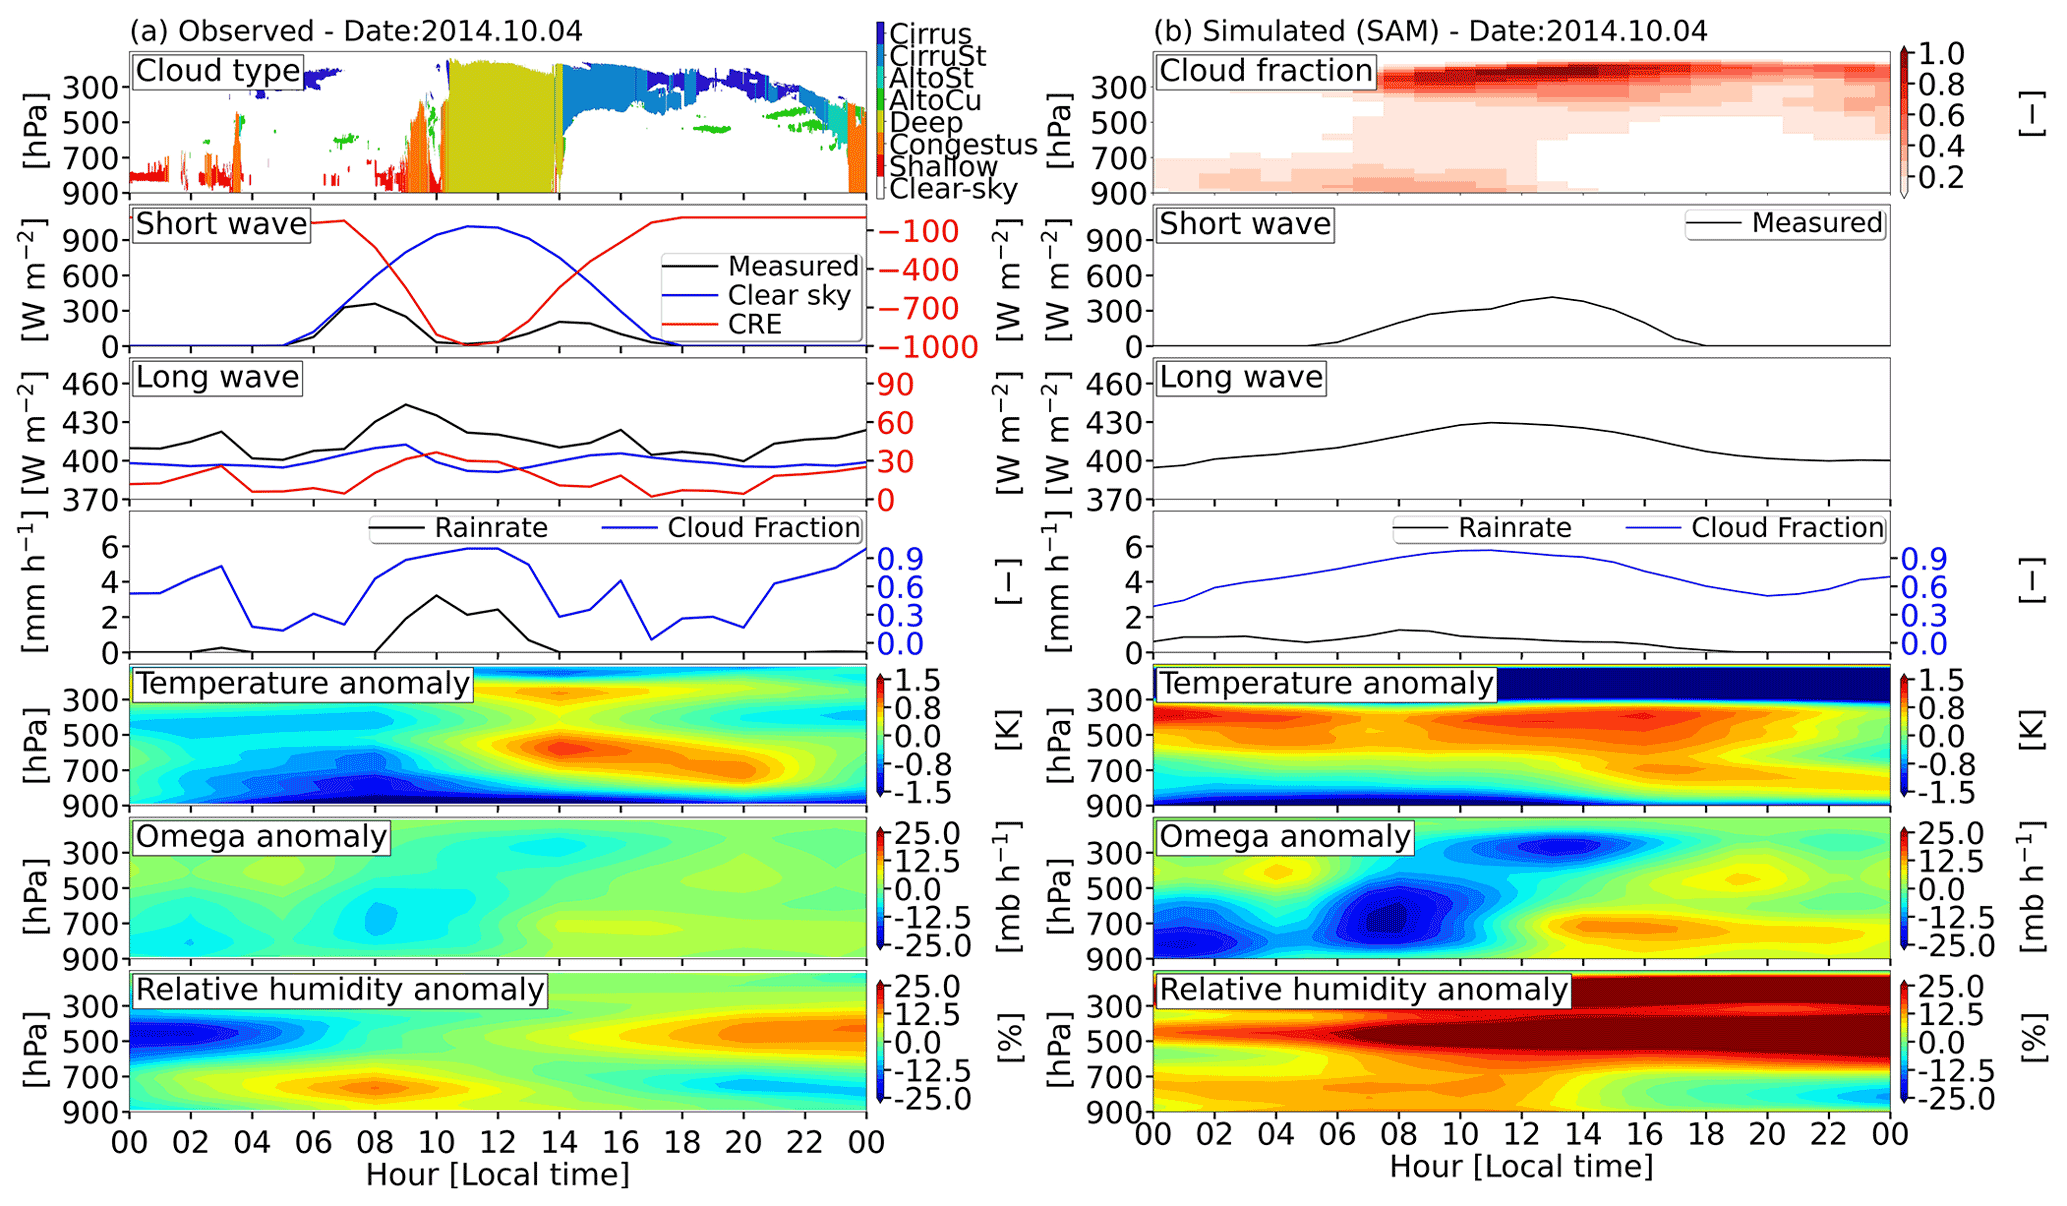
Figure 6Daily cycle of cloud type, cloud fraction profile, and longwave and shortwave radiation fluxes for cloud and clear sky (W m−2), precipitation rate (mm h−1), integrated cloud fraction and temperature (K), omega (mb h−1), and relative humidity (%) anomaly from 4 October 2014 for the (a) observed data and (b) simulated with the SAM model.
The diurnal cycle of the types of clouds (Fig. 6a) shows that in the early hours of the day (between 00:00 and 06:00 local hours), there is the presence of high (cirrus) and low (shallow and congestus) clouds and soon after the evolution of shallow clouds for deep convection (between 07:00 and 14:00 local time); at later times it is possible to observe the presence of high clouds until the end of the day (between 14:00 and 23:00 local time). Both shortwave radiation fluxes and longwave fluxes show variations related to the different types of clouds present in the atmosphere. However, during the presence of deep convection, the SAM model is unable to simulate the attenuation of shortwave radiation. The physical properties and amount of liquid water and ice as well as other hydrometeors can affect the attenuation of shortwave radiation by clouds. These and other physical considerations are discussed in the next sections.
The integrated cloud fraction shows higher values (approximately 1) at times with the presence of high or low clouds and where deep convection occurs. Only in the presence of high clouds are the cloud fraction values low at around 0.1 and 0.2. As mentioned before, the observed integrated cloud fraction is estimated from the longwave radiation flux; this can lead to estimation errors, mainly in the estimation of the high cloud fraction. Due to a large moisture amount at low levels in the Amazon region, the longwave radiation flux emitted by high clouds is poorly transmitted to the surface. This is due to the absorption of descending longwave radiation by water vapor at low levels, which re-emits towards the surface. Thus, longwave radiation descending to the surface is a little sensitive to radiation emitted by high clouds, and this may explain the low cloud fraction values observed in the presence of high clouds of the type cirrus and cirrostratus. In simulations, the cloud fraction tends to be higher.
The anomalies in relation to the previous day's average of temperature, omega and relative humidity describe the atmospheric behavior for the generation of clouds present during the diurnal cycle well. Before the deep convection, the atmosphere has negative temperature anomalies, the omega variable indicates that there are upward vertical movements (negative omega), and there is the availability of water vapor for condensation as indicated by positive relative humidity anomalies. Soon after the precipitation that occurs in the presence of clouds related to deep convection (between 06:00 and 14:00 local time), positive temperature anomalies are observed, possibly related to the release of latent heat.
Figure 6b shows the diurnal cycle of the variables simulated with the SAM model. The simulation of the cloud fraction profile was similar to the pattern of cloud types obtained from observational data. The simulated values of the cloud fraction profile, ranging from 0 for clear sky and 1 for completely cloudy sky, were able to clearly indicate the presence of different types of clouds (high, low and deep). In general, the cloud fraction pattern simulated with the SAM model well represented the pattern of the types of clouds present during the observed diurnal cycle. The shortwave and longwave radiation fluxes are impacted by the presence of different types of clouds in the atmosphere, mainly deep convection. These variations in radiative fluxes are also observed in the reference data (Fig. 6a).
The simulated integrated cloud fraction shows a maximum (approximately 1.0) at times when there are clouds related to deep convection. In the presence of high clouds, observed cloud fraction values are approximately 0.5. This indicates the good performance of the SAM model in simulating variables related to clouds.
3.3 Relation of large-scale meteorological variables and the cloud fraction
The last two sections qualitatively show that the SAM model has an excellent performance in simulations of variables associated with clouds and large scales, as well as showing a good description of the processes of cloud formation and interaction of radiation and clouds. This section shows the relationships between large-scale variables (temperature, omega and relative humidity), cloud fraction and radiation fluxes, and liquid–ice water content from scatter plots. The objective is to analyze how the variables are correlated with each other and to quantify the cloud fraction values in relation to the anomalies of the large-scale variables and liquid–ice water content, with the purpose of proposing these relationships for use in physical parameterizations related to the generation, maintenance and dissipation of cloudiness.
For this, a larger sample of days within the wet and dry periods is considered. Of the wet period (IOP1), 7 d were selected and 5 d of the dry period (IOP2). The criteria for the choice of days were based on the presence of a well-defined cloud cycle over the chosen days, in which it was possible to verify from the observations (MERGE-RADAR/cloud mask) the presence of high clouds (cirrus) as well as clouds related to shallow convection (shallow) and deep convection (deep). In Figs. 7, 8, 9 and 10, all the chosen days of each period (7 d for wet and 5 d for dry period) were used and for the atmospheric layer between 965 and 90 hPa. For the large-scale variables, only the values referring to the environmental conditions that are associated with cloud formation, the minimum values for temperature anomalies, minimum values for omega anomalies (when negative, they indicate upward vertical movement) and maximum values for relative humidity anomalies were used. For the observed data (Figs. 7 and 8), the variable fraction of cloud integrated in the atmosphere was used, while for the simulations with the SAM model (Figs. 9, 10 and 11) the cloud fraction profile was used.
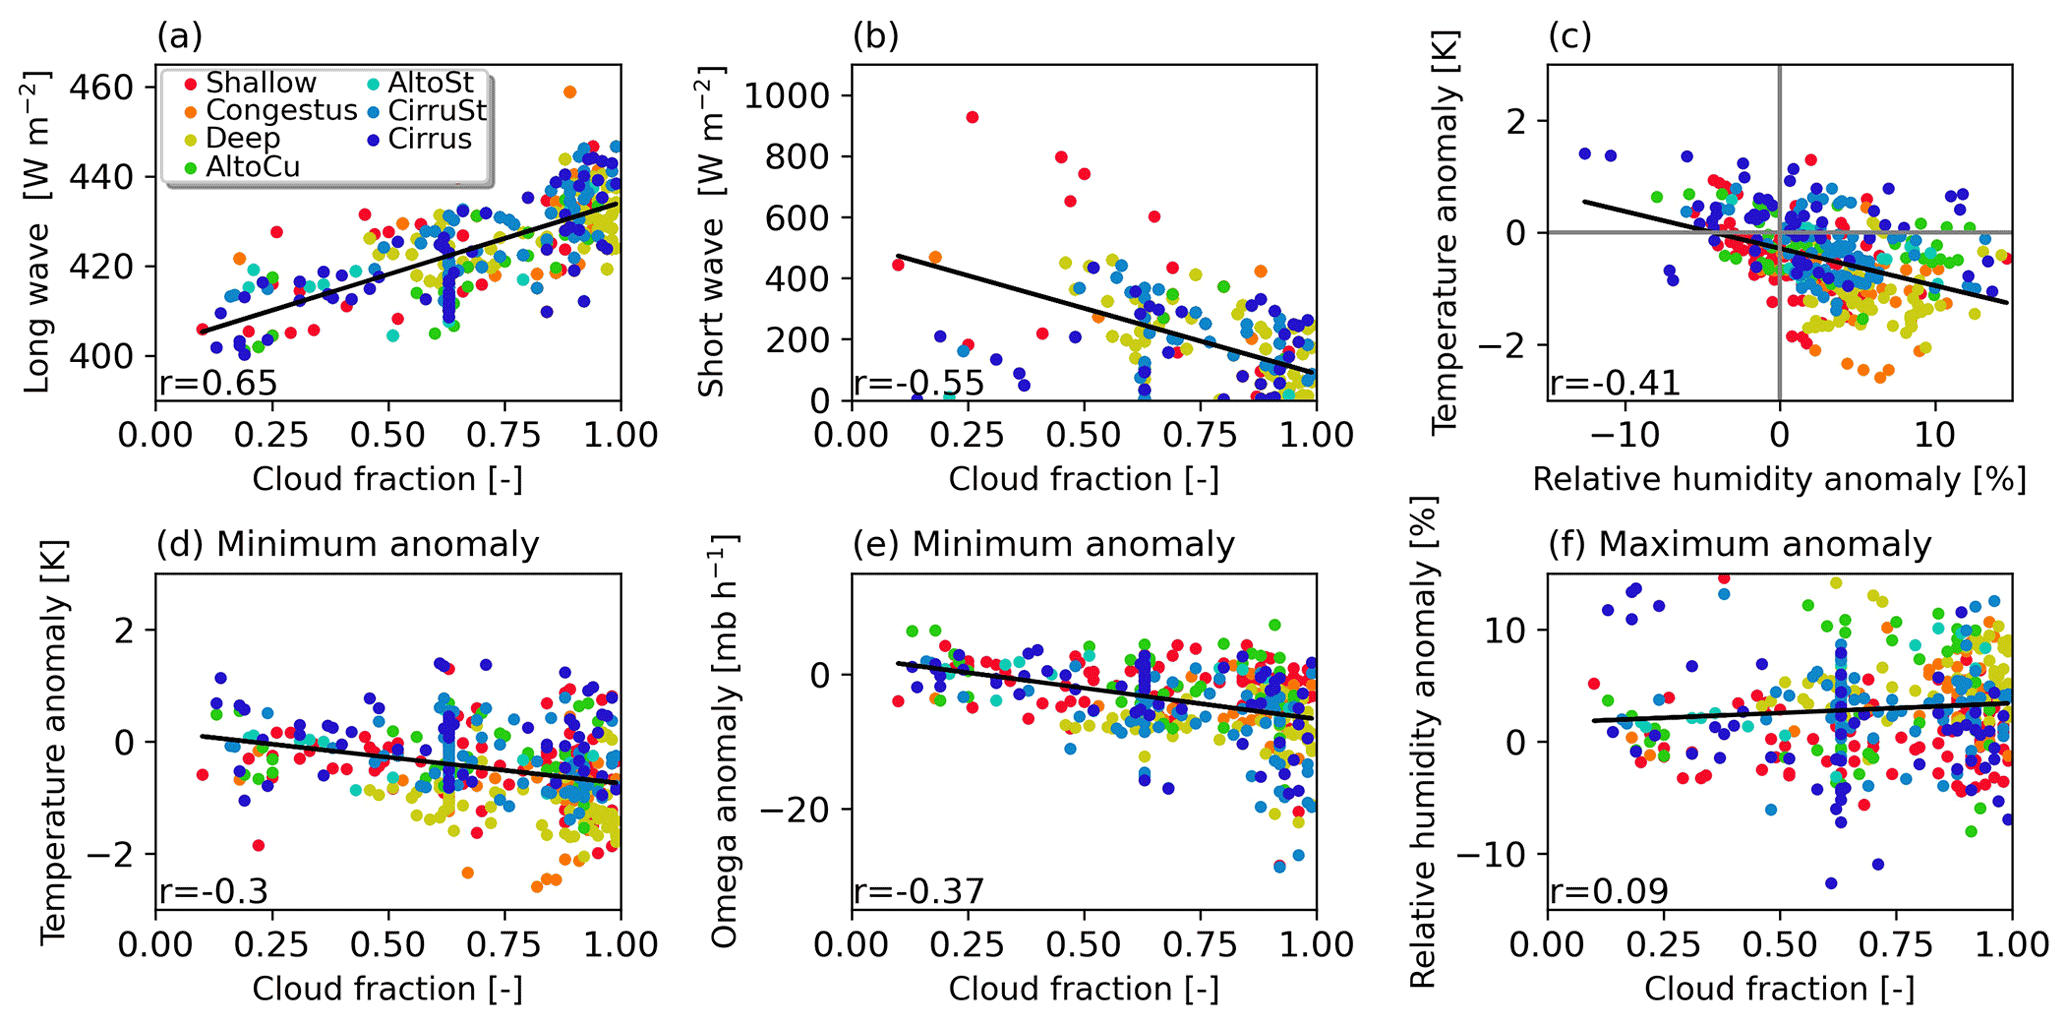
Figure 7Scatter plot between observed cloud fraction and longwave radiation, shortwave radiation, precipitation rate, minimum values of temperature variance, minimum omega, and maximum relative humidity for selected cases during IOP1 (wet season). Each color represents a cloud type: blue (cirrus), cobalt (cirrost), teal (altost), green (altocu), yellow (deep), orange (congestus), red (shallow) and white (clear sky).

Figure 8Scatter plot between observed cloud fraction and longwave radiation, shortwave radiation, precipitation rate, minimum values of temperature variance, minimum omega, and maximum relative humidity for selected cases during IOP2 (dry season). Each color represents a cloud type: blue (cirrus), cobalt (cirrost), teal (altost), green (altocu), yellow (deep), orange (congestus), red (shallow) and white (clear sky).
3.3.1 The relationships between radiation, dynamics and thermodynamics with the cloud fraction in the observed data from GoAmazon 2014/15
The scatter plots between the integrated cloud fraction and the longwave (Fig. 7a) and shortwave radiation fluxes (Fig. 7b), temperature and relative humidity anomalies (Fig. 7c), minimum temperature anomaly and cloud fraction (Fig. 7d), minimum omega anomaly and cloud fraction (Fig. 7e), and maximum relative humidity anomaly with cloud fraction (Fig. 7f) were analyzed for the wet period (IOP1) using observed data from GoAmazon 2014/15.
The scatter plot of longwave radiation flux versus cloud fraction (Fig. 7a) shows a positive trend; that is, higher values of cloud fraction are associated with higher values of longwave radiation flux. These results indicate that the radiative effect of clouds for longwave radiation increases with increasing cloud cover in the atmosphere. On the other hand, the highest values of cloud fraction are associated with a decrease in the downward shortwave radiation flux (Fig. 7b), mainly in the presence of deep clouds (yellow dots). These clouds have high albedo values, reflecting much of the incident solar radiation on the planet back into space, and additionally attenuate descending solar radiation.
Figure 7c shows the scatter plots between the minimum temperature and maximum relative humidity anomalies and indicates a negative trend. In the first quadrant of the figure, it is observed that high (cirrus and cirrostratus) and medium (altostratus) clouds are associated with positive temperature and relative humidity anomalies. In the second quadrant, positive temperature anomalies and negative relative humidity anomalies are observed for shallow convection (shallow) and cirrus clouds. In the process of formation of these clouds, the phase changes from water vapor to liquid water and ice tend to warm the atmosphere.
The fourth quadrant shows that negative temperature anomalies and positive relative humidity anomalies are mainly related to clouds of the deep convection type (deep – yellow dots). Positive relative humidity anomalies are associated with humidity horizontal advection and negative temperature anomalies are associated with vertical advection that favors the rise of warm and humid air; consequently, the descent of dry and cold air to lower levels of the atmosphere cools the environment.
The large-scale variables (temperature, omega and relative humidity) that are commonly used in cloud fraction parameterizations are shown in Fig. 7d, e and f, respectively. The cloud fraction tends to increase with the negative temperature anomaly. The warm and humid air parcels of the Amazon region rise, expand and condense, forming clouds and consequently cooling the environment. Deep convection clouds (yellow dots) are observed when the temperature anomalies are between −1 and −2 K and in the cloud fraction range of 0.4 and 1. For shallow clouds (red dots), it is observed that positive temperature anomalies are related to negative relative humidity anomalies, being associated with the water vapor condensation process.
Figure 7e shows that the cloud fraction has a positive trend with a negative omega anomaly. Minimum negative omega anomaly values indicate strong upward vertical movements in the atmosphere, favoring cloud formation.
No significant relationship was found between cloud fraction and relative humidity anomalies (Fig. 7f). However, clouds related to deep convection (yellow dots) only appear to be related to positive relative humidity anomaly values, indicating that for the formation of this type of cloud, it is necessary that the atmosphere is wetter.
Figure 8 shows the scatter plot for the same variables as in Fig. 7, but for the selected 5 d of the dry period (IOP2). The behavior of the variables in relation to cloud fraction is similar to that found in the wet period (IOP1), including an (i) increase (decrease) in longwave radiation (shortwave Fig. 8a and b) with the cloud fraction. (ii) Despite not finding a relationship between minimum temperature anomalies and maximum relative humidity values, deep convection clouds are found in the fourth quadrant and are associated with negative temperature anomalies and positive relative humidity anomalies (Fig. 8c). (iii) Minimum values of temperature and omega anomalies, as well as in the wet period, during the dry season show a tendency to increase the cloud fraction (Fig. 8d and e); that is, the decrease in temperature and upward vertical movements are associated with greater presence of clouds, mainly of the congestus (orange dots), shallow (red dots) and deep (yellow dots) types.
In the dry period, a smaller number of clouds of types cirrus (blue dots) and cirrostratus (cobalt dots) were observed and are associated with the maximum values of cloud fraction (between 0.7 and 1.0) in relation to the wet period (Fig. 8). These clouds in the wet season are associated with moisture availability and the formation of an anvil in clouds associated with deep convection.
3.3.2 The relationships between radiation, dynamics and thermodynamics with the fraction of clouds in simulations with SAM
The discussion about the relationships between large-scale variables, radiation fluxes and cloud fraction is carried out for the simulations of the SAM model. For this analysis, the same days chosen for the observed data are used (7 d for IOP1 and 5 d for IOP2).
Figure 9 shows the scatter plots between the cloud fraction with the downward longwave radiative flux (Fig. 9a), shortwave radiation flux (Fig. 9b), and temperature and relative humidity anomalies (Fig. 9c) in addition to the cloud fraction with the minimum temperature anomalies (Fig. 9d), minimum omega anomalies (Fig. 9e) and maximum relative humidity anomaly (Fig. 9f) for the wet period (blue) and dry period (red).
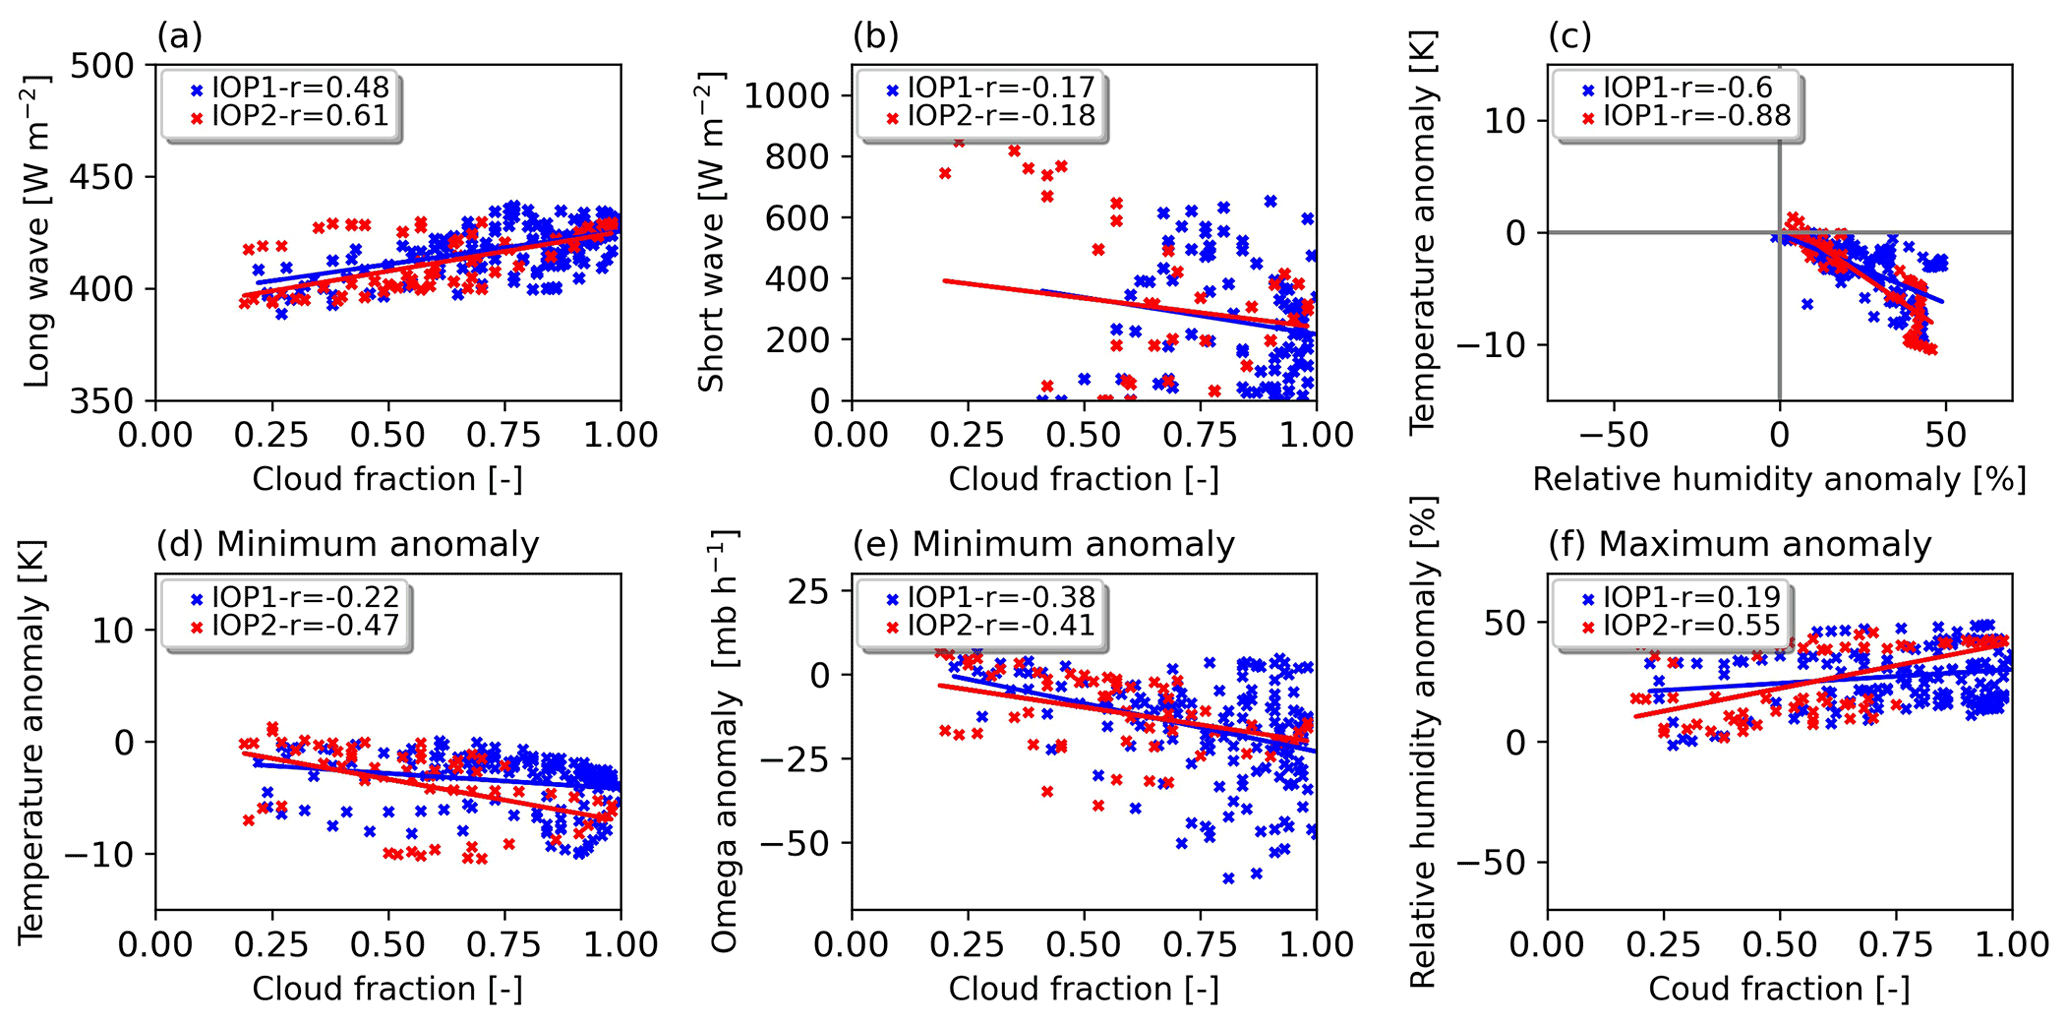
Figure 9Scatter plots between the cloud fraction simulated with the SAM model and longwave radiation, shortwave radiation, temperature and relative humidity anomalies, minimum values of temperature anomalies, minimum omega anomalies, and maximum relative humidity anomalies for selected cases during IOP1 (wet season – blue markers) and IOP2 (dry season – red markers).
The incident flux at the surface of longwave radiation increases as the cloud fraction increases for both the wet and dry periods. In the wet period, it is observed that there are more occurrences of high cloud fraction values (between 0.8 and 0.9) due to the performance of large-scale systems, together with local convection. The relationship between downward longwave radiative flux and the integrated cloud fraction is complex because the radiation that reaches the surface does not often represent clouds at higher levels of the atmosphere, but a good relationship was obtained between the variables.
For shortwave radiation fluxes, there is a tendency to decrease in relation to the increase in cloud fraction due to absorption and cloud albedo. The correlation between the variables is not ideal due to the presence of a lot of diffuse radiation in the atmosphere, which prevents a direct correlation between the shortwave radiation and the vertically integrated cloud fraction. The trends between longwave and shortwave radiation fluxes relative to cloud fractions are consistent with those found in the observed data. Figure 9c shows the scatter plot of minimum temperature anomaly values and maximum relative humidity anomaly values. As in the observed data a negative trend is identified.
Figure 9d shows the minimum temperature anomaly in relation to cloud fraction. It is observed that there is a tendency to increase the cloud fraction in relation to more negative values of temperature anomaly. The same behavior is observed for the negative omega anomalies (Fig. 9e). These trends are observed for both the wet and dry periods. The relative humidity anomaly (Fig. 9f) shows an inverse behavior in relation to temperature and omega; the higher relative humidity anomaly values are associated with higher cloud fraction values. The behavior of these variables with respect to cloud fraction is physically consistent. When there are clouds, a reduction in temperature is observed, and it is necessary to upward vertical movements and availability of water in the atmosphere. These results also agree with those presented in the observational analysis.
Figure 10 shows the scatter plot between liquid water content and cloud fraction, both simulated with the SAM model and for all atmospheric levels. A clear trend of increasing cloud fraction is observed as the liquid water content increases. Higher values of cloud fraction and water content are observed in the wet period (between 0.4 and 0.7 of cloud fraction and 0.10 and 0.18 g kg−1 of WLC). The good correlation for both the wet season (0.75) and the dry season (0.74) indicates that WLC can be used to estimate the cloud fraction from physical parameterizations used in weather and climate numerical models.
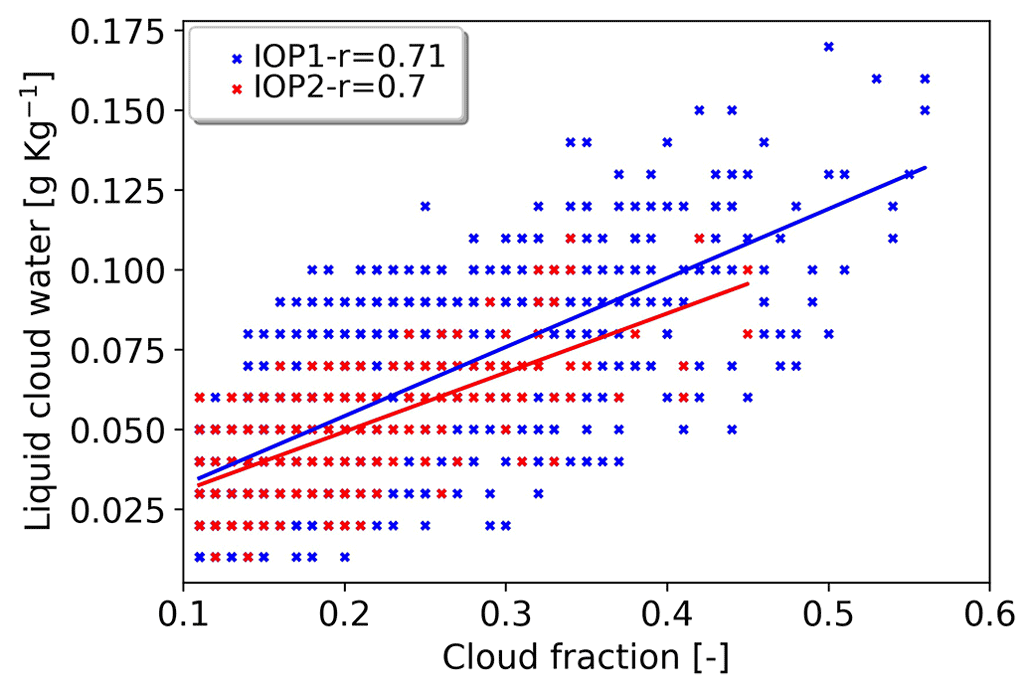
Figure 10Scatter plot between the simulated cloud fraction and liquid cloud water content for the lower layer for cases selected during IOP1 (wet season – blue markers) and IOP2 (dry season – red markers).
The results obtained in this article aimed to understand the interactions between the dynamic and thermodynamic variables of the atmosphere and cloudiness. For this, observational data were used from the GoAmazon 2014/15 field campaign. As a complement to these data, a high-resolution numerical model (CRM-SAM) was used. All analyses were performed for the wet period (IOP1) and for the dry period (IOP2).
The time series of precipitation rate, integrated cloud fraction and downward shortwave radiative flux simulated using the SAM model (with different horizontal resolutions) were compared with observational data obtained during the 2014/15 GoAmazon field campaign. The SAM model, even underestimating the maximum peaks of the precipitation rate, satisfactorily simulated the patterns of this variable compared to observational data. The integrated cloud fraction and shortwave radiation flux also follow the same pattern of precipitation rate. Both in the simulations and in the observational data, the maximum precipitation peaks are associated with maximum values of cloud fraction and with a decrease in the downward shortwave radiative flux. This behavior of shortwave radiation is related to the strong albedo of clouds, especially deep convection clouds. In both periods (wet and dry), the simulations were consistent and this can be confirmed by the cloud fraction distribution histogram, which showed a higher occurrence of maximum values of cloud fraction (from 0.9 to 1.0) in the wet period and higher occurrence of minimum values of cloud fraction (from 0.0 to 0.4) in the dry period. This pattern of the maximum (wet) and minimum (dry) cloud fraction variable is due to the wet period being characterized by the performance of large-scale systems (instability lines, CCMs and ITCZ) together with local convection, causing a higher occurrence of clouds, mainly of deep convection and generating more precipitation in this period compared to the dry period.
For the analyses referring to the temporal series of the wet and dry periods, 1 d of each period was chosen for a more detailed analysis of the diurnal cycle of the interactions between radiation fluxes, dynamic and thermodynamic variables of the atmosphere, and cloudiness. The variables temperature, omega and relative humidity were analyzed as anomalies in relation to the average of the previous day.
On both days, the cloud fraction profile simulated with the SAM model, showed a pattern similar to the observed data. The behavior of the surface incident shortwave and longwave radiation fluxes is physically associated with the cloud patterns found in the observed data and in the simulation with the SAM model. It was possible to observe in the simulated data that there is a negative (positive) effect on the surface incident shortwave (longwave) radiation flux due to the presence of different types of clouds and the shape of the cloud fraction vertical distribution. In general, the impact on shortwave and longwave radiation fluxes is mainly associated with the presence of shallow and deep convection clouds.
Anomalies in relation to the average of the previous day of the large-scale variables presented behaviors physically associated with cloud formation, evolution and dissipation. In the evolution of clouds associated with shallow to deep convection, it was observed that there were positive (negative) temperature anomalies at low (medium) levels, intense upward vertical movements and positive relative humidity anomalies at low levels. Warming of the atmosphere was also observed after the occurrence of precipitation, possibly associated with the release of latent heat. This behavior was found in the observed data and in the simulation with the SAM. Thus, it is concluded that the anomalies of large-scale variables can be optimal estimates for use in cloud fraction parameterizations in numerical weather and climate models.
Regarding the analysis of the time series and the analysis of two chosen days, it was possible to conclude that the variables obtained observationally with different methodologies showed physical consistency between them. The only point to be highlighted is related to the variable vertically integrated cloud fraction, which is estimated from the longwave radiation. This estimate, in general, showed a consistent behavior; however, as it is a variable estimated from the longwave radiation flux, it may present some inconsistency in cases of an atmosphere with high moisture content, such as the Amazon region. In relation to the SAM model, a good performance was observed when compared to the observed data. It also showed physical consistency between the analyzed variables, which was to be expected, since it is a model that simulates an integrated system of the atmosphere based on sophisticated physical parameterizations and a prescribed dynamic based on large-scale forcings. Thus, the variables simulated with the SAM model can be used in cases when the variables cannot be obtained observationally, for example, cloud fraction vertical profiles, water and ice content.
The results of the dispersion analyses confirmed that the downward longwave and shortwave radiative fluxes show alterations associated with the presence of clouds in the atmosphere, mainly of deep convection. A positive trend was observed between the cloud fraction and the longwave radiation, with a higher cloud fraction and higher longwave radiation flux. The opposite happens with shortwave radiation flux (higher cloud fraction values are associated with smaller shortwave radiation flux values). This behavior was found in the observed data and in the simulations with the SAM, thus showing the importance of consistently simulating the cloud fraction for a good performance of the radiation scheme in numerical weather and climate models, considering that the radiation schemes use cloud fraction information to estimate radiation fluxes.
Different types of clouds are associated with different environmental conditions represented by anomalies of large-scale variables. As an example, high and medium clouds are associated with positive temperature and relative humidity anomalies. Clouds related to deep convection, which modify radiation fluxes, are mainly associated with negative temperature anomalies and positive relative humidity anomalies. This analysis showed that large-scale variable anomalies can be used for cloud fraction estimation. The water content profile is another important variable that can also be used to estimate cloud fraction, as it showed a positive trend and good correlation with cloud fraction.
From the results of Sect. 3.1 and 3.2, the importance of correctly simulating the representation of cloud cover in a weather and climate model is evident. The results of Sect. 3.3 indicate that the cloud fraction is related to the anomalies of the large-scale variables and to the liquid–ice water content. Therefore, we propose that the results found in Sect. 3.3 be used to define thresholds for large-scale variables (relative humidity, omega and temperature) and water content in the development and calibration of cloud fraction parameterizations. These results are an attempt to better represent cloudiness in numerical models of weather and climate and thus reduce cloud-related errors.
The results of this article are part of the project to develop the Brazilian Atmospheric Model (BAM) (Coelho et al., 2021, 2022b, a; Guimarães et al., 2021; Figueroa et al., 2016). All the information obtained through this work is being used to develop and improve the parameterization of the cloud fraction used in the BAM. A second article is being prepared with a focus on the description of the new parameterization of the cloud fraction and its validation.
The data used in this study are available in the ARM Climate Research Facility database for the GoAmazon2014/15 experiment (Martin et al., 2016). Data can be downloaded at https://adc.arm.gov/discovery/#/results/site_code::mao/start_date::2014-01-01/end_date::2015-11-30 (ARM, 2021).
LJMG, PYK and SMSCC idealized this study. LJMG manipulated the data and the model. DCS contributed to the organization of this paper, and all authors participated in the discussions and contributed to the writing of this paper.
The contact author has declared that none of the authors has any competing interests.
Publisher's note: Copernicus Publications remains neutral with regard to jurisdictional claims in published maps and institutional affiliations.
We thank the Brazilian Coordination for the Improvement of the Higher Level Personnel (CAPES; finance code 001) and the National Council for Scientific and Technological Development (grant no. 140345/2019-1) for the financial support during this research. We also thank ARM for the data provided and Marat Khairoutdinov for allowing the use of the SAM model.
This study was financed in part by the Brazilian Coordination for the Improvement of the Higher Level Personnel (CAPES; finance code 001) and the National Council for Scientific and Technological Development (grant no. 140345/2019-1).
This paper was edited by Martina Krämer and reviewed by two anonymous referees.
Atmospheric Radiation Measurement (ARM) user facility: Radiative Flux Analysis (RADFLUX1LONG), 2013-12-23 to 2015-12-01, ARM Mobile Facility (MAO) Manacapuru, Amazonas, Brazil, AMF1 (M1), compiled by: Long, C., Gaustad, K., and Riihimaki, L., ARM Data Center [data set], https://doi.org/10.5439/1157585, 2014 (updated hourly).
Atmospheric Radiation Measurement (ARM) user facility: Database for the GoAmazon2014/15 experiment, https://adc.arm.gov/discovery/#/results/site_code::mao/start_date::2014-01-01/end_date::2015-11-30, last access: 6 March 2021.
Blossey, P. N., Bretherton, C. S., Cetrone, J. and Kharoutdinov, M.: Cloud-Resolving Model Simulations of KWAJEX: Model Sensitivities and Comparisons with Satellite and Radar Observations, J. Atmos. Sci., 64, 1488–1508, https://doi.org/10.1175/JAS3982.1, 2007.
Bodas-Salcedo, A., Williams, K. D., Ringer, M. A., Beau, I., Cole, J. N. S., Dufresne, J.-L., Koshiro, T., Stevens, B., Wang, Z. and Yokohata, T.: Origins of the Solar Radiation Biases over the Southern Ocean in CFMIP2 Models, J. Climate, 27, 41–56, https://doi.org/10.1175/JCLI-D-13-00169.1, 2014.
Bretherton, C. S. and Blossey, P. N.: Understanding Mesoscale Aggregation of Shallow Cumulus Convection Using Large-Eddy Simulation, J. Adv. Model. Earth Sy., 9, 2798–2821, https://doi.org/10.1002/2017MS000981, 2017.
Carneiro, R. G. and Fisch, G.: Observational analysis of the daily cycle of the planetary boundary layer in the central Amazon during a non-El Niño year and El Niño year (GoAmazon project 2014/5), Atmos. Chem. Phys., 20, 5547–5558, https://doi.org/10.5194/acp-20-5547-2020, 2020.
Calisto, M., Folini, D., Wild, M., and Bengtsson, L.: Cloud radiative forcing intercomparison between fully coupled CMIP5 models and CERES satellite data, Ann. Geophys., 32, 793–807, https://doi.org/10.5194/angeo-32-793-2014, 2014.
Chamecki, M., Freire, L. S., Dias, N. L., Chen, B., Dias-Junior, C. Q., Toledo Machado, L. A., Sörgel, M., Tsokankunku, A., and de Araújo, A. C.: Effects of Vegetation and Topography on the Boundary Layer Structure above the Amazon Forest, J. Atmos. Sci., 77, 2941–2957, https://doi.org/10.1175/JAS-D-20-0063.1, 2020.
Chen, T., Rossow, W. B., and Zhang, Y.: Radiative Effects of Cloud-Type Variations, J. Climate, 13, 264–286, https://doi.org/10.1175/1520-0442(2000)013<0264:REOCTV>2.0.CO;2, 2000.
Ciesielski, P. E., Johnson, R. H., Jiang, X., Zhang, Y., and Xie, S.: Relationships between radiation, clouds, and convection during DYNAMO, J. Geophys. Res.-Atmos., 122, 2529–2548, https://doi.org/10.1002/2016JD025965, 2017.
Coelho, C. A. S., de Souza, D. C., Kubota, P. Y., Costa, S. M. S., Menezes, L., Guimarães, B. S., Figueroa, S. N., Bonatti, J. P., Cavalcanti, I. F. A., Sampaio, G., Klingaman, N. P., and Baker, J. C. A.: Evaluation of climate simulations produced with the Brazilian global atmospheric model version 1.2, Clim. Dynam., 56, 873–898, https://doi.org/10.1007/s00382-020-05508-8, 2021.
Coelho, C. A. S., Baker, J. C. A., Spracklen, D. V., Kubota, P. Y., Souza, D. C., Guimarães, B. S., Figueroa, S. N., Bonatti, J. P., Sampaio, G., Klingaman, N. P., Chevuturi, A., Woolnough, S. J., Hart, N., Zilli, M., and Jones, C. D.: A perspective for advancing climate prediction services in Brazil, Clim. Resil. Sustain., 1, e29, https://doi.org/10.1002/cli2.29, 2022a.
Coelho, C. A. S., Souza, D. C., Kubota, P. Y., Cavalcanti, I. F. A., Baker, J. C. A., Figueroa, S. N., Firpo, M. A. F., Guimarães, B. S., Costa, S. M. S., Gonçalves, L. J. M., Bonatti, J. P., Sampaio, G., Klingaman, N. P., Chevuturi, A., and Andrews, M. B.: Assessing the representation of South American monsoon features in Brazil and U.K. climate model simulations, Clim. Resil. Sustain., 1, e27, https://doi.org/10.1002/cli2.27, 2022b.
Cohen, J. C. P., Silva Dias, M. A. F. and Nobre, C. A.: Environmental Conditions Associated with Amazonian Squall Lines: A Case Study, Mon. Weather Rev., 123, 3163–3174, https://doi.org/10.1175/1520-0493(1995)123<3163:ECAWAS>2.0.CO;2, 1995.
Collins, W. D., Rasch, P. J., Boville, B. A., Hack, J. J., McCaa, J. R., Williamson, D. L., Briegleb, B. P., Bitz, C. M., Lin, S.-J., and Zhang, M.: The Formulation and Atmospheric Simulation of the Community Atmosphere Model Version 3 (CAM3), J. Climate, 19, 2144–2161, https://doi.org/10.1175/JCLI3760.1, 2006.
Dias-Junior, C. Q., Marques Filho, E. P., and Sá, L. D. A.: A large eddy simulation model applied to analyze the turbulent flow above Amazon forest, J. Wind Eng. Ind. Aerod., 147, 143–153, https://doi.org/10.1016/j.jweia.2015.10.003, 2015.
Dürr, B.: Automatic cloud amount detection by surface longwave downward radiation measurements, J. Geophys. Res., 109, D05201, https://doi.org/10.1029/2003JD004182, 2004.
Feng, Z., McFarlane, S. A., Schumacher, C., Ellis, S., Comstock, J., and Bharadwaj, N.: Constructing a Merged Cloud–Precipitation Radar Dataset for Tropical Convective Clouds during the DYNAMO/AMIE Experiment at Addu Atoll, J. Atmos. Ocean. Tech., 31, 1021–1042, https://doi.org/10.1175/JTECH-D-13-00132.1, 2014.
Feng, Z., Hagos, S., Rowe, A. K., Burleyson, C. D., Martini, M. N. and Szoeke, S. P.: Mechanisms of convective cloud organization by cold pools over tropical warm ocean during the AMIE/DYNAMO field campaign, J. Adv. Model. Earth Sy., 7, 357–381, https://doi.org/10.1002/2014MS000384, 2015.
Figueroa, S. N., Bonatti, J. P., Kubota, P. Y., Grell, G. A., Morrison, H., Barros, S. R. M., Fernandez, J. P. R., Ramirez, E., Siqueira, L., Luzia, G., Silva, J., Silva, J. R., Pendharkar, J., Capistrano, V. B., Alvim, D. S., Enoré, D. P., Diniz, F. L. R., Satyamurti, P., Cavalcanti, I. F. A., Nobre, P., Barbosa, H. M. J., Mendes, C. L., and Panetta, J.: The Brazilian Global Atmospheric Model (BAM): Performance for Tropical Rainfall Forecasting and Sensitivity to Convective Scheme and Horizontal Resolution, Weather Forecast., 31, 1547–1572, https://doi.org/10.1175/WAF-D-16-0062.1, 2016.
Fisch, G., Marengo, J. A., and Nobre, C. A.: Uma revisão geral sobre o clima da Amazônia, Acta Amaz., 28, 101–101, https://doi.org/10.1590/1809-43921998282126, 1998.
Fliegel, J. M. and Schumacher, C.: Quality control and census of SMART-R observations from the DYNAMO/CINCY2011 field campaign, MS thesis, Dept. of Atmospheric Science, Texas A&M University, 84 pp., 2012.
Frassoni, A., Castilho, D., Rixen, M., Ramirez, E., de Mattos, J. G. Z., Kubota, P., Peixoto Calheiros, A. J., Reed, K. A., da Silva Dias, M. A. F., da Silva Dias, P. L., de Campos Velho, H. F., de Roode, S. R., Doblas-Reyes, F., Eiras, D., Ek, M., Figueroa, S. N., Forbes, R., Freitas, S. R., Grell, G. A., Herdies, D. L., Lauritzen, P. H., Machado, L. A. T., Manzi, A. O., Martins, G., Oliveira, G. S., Rosário, N. E., Sales, D. C., Wedi, N. and Yamada, B.: Building the Next Generation of Climate Modelers: Scale-Aware Physics Parameterization and the “Grey Zone” Challenge, B. Am. Meteorol. Soc., 99, ES185–ES189, https://doi.org/10.1175/BAMS-D-18-0145.1, 2018.
Del Genio, A. D.: Representing the Sensitivity of Convective Cloud Systems to Tropospheric Humidity in General Circulation Models, Surv. Geophys., 33, 637–656, https://doi.org/10.1007/s10712-011-9148-9, 2012.
Geoffroy, O., Sherwood, S. C., and Fuchs, D.: On the role of the stratiform cloud scheme in the inter-model spread of cloud feedback, J. Adv. Model. Earth Sy., 9, 423–437, https://doi.org/10.1002/2016MS000846, 2017.
Giangrande, S. E., Feng, Z., Jensen, M. P., Comstock, J. M., Johnson, K. L., Toto, T., Wang, M., Burleyson, C., Bharadwaj, N., Mei, F., Machado, L. A. T., Manzi, A. O., Xie, S., Tang, S., Silva Dias, M. A. F., de Souza, R. A. F., Schumacher, C., and Martin, S. T.: Cloud characteristics, thermodynamic controls and radiative impacts during the Observations and Modeling of the Green Ocean Amazon (GoAmazon2014/5) experiment, Atmos. Chem. Phys., 17, 14519–14541, https://doi.org/10.5194/acp-17-14519-2017, 2017.
Guimarães, B. S., Coelho, C. A. S., Woolnough, S. J., Kubota, P. Y., Bastarz, C. F., Figueroa, S. N., Bonatti, J. P., and de Souza, D. C.: An inter-comparison performance assessment of a Brazilian global sub-seasonal prediction model against four sub-seasonal to seasonal (S2S) prediction project models, Clim. Dynam., 56, 2359–2375, https://doi.org/10.1007/s00382-020-05589-5, 2021.
Hagos, S. M., Zhang, C., Feng, Z., Burleyson, C. D., De Mott, C., Kerns, B., Benedict, J. J. and Martini, M. N.: The impact of the diurnal cycle on the propagation of Madden-Julian Oscillation convection across the Maritime Continent, J. Adv. Model. Earth Syst., 8, 1552–1564, https://doi.org/10.1002/2016MS000725, 2016.
Iacono, M. J., Delamere, J. S., Mlawer, E. J., Shephard, M. W., Clough, S. A., and Collins, W. D.: Radiative forcing by long-lived greenhouse gases: Calculations with the AER radiative transfer models, J. Geophys. Res., 113, D13103, https://doi.org/10.1029/2008JD009944, 2008.
Jeevanjee, N., Hassanzadeh, P., Hill, S. and Sheshadri, A.: A perspective on climate model hierarchies, J. Adv. Model. Earth Sy., 9, 1760–1771, https://doi.org/10.1002/2017MS001038, 2017.
Khairoutdinov, M. F. and Randall, D. A.: A cloud resolving model as a cloud parameterization in the NCAR Community Climate System Model: Preliminary results, Geophys. Res. Lett., 28, 3617–3620, https://doi.org/10.1029/2001GL013552, 2001.
Khairoutdinov, M. F. and Randall, D. A.: Similarity of Deep Continental Cumulus Convection as Revealed by a Three-Dimensional Cloud-Resolving Model, J. Atmos. Sci., 59, 2550–2566, https://doi.org/10.1175/1520-0469(2002)059<2550:SODCCC>2.0.CO;2, 2002.
Khairoutdinov, M. F. and Randall, D. A.: Cloud Resolving Modeling of the ARM Summer 1997 IOP: Model Formulation, Results, Uncertainties, and Sensitivities, J. Atmos. Sci., 60(4), 607–625, https://doi.org/10.1175/1520-0469(2003)060<0607:CRMOTA>2.0.CO;2, 2003.
Khairoutdinov, M. and Randall, D.: High-Resolution Simulation of Shallow-to-Deep Convection Transition over Land, J. Atmos. Sci., 63, 3421–3436, https://doi.org/10.1175/JAS3810.1, 2006.
L'Ecuyer, T. S., Hang, Y., Matus, A. V., and Wang, Z.: Reassessing the Effect of Cloud Type on Earth's Energy Balance in the Age of Active Spaceborne Observations. Part I: Top of Atmosphere and Surface, J. Climate, 32, 6197–6217, https://doi.org/10.1175/JCLI-D-18-0753.1, 2019.
Lee, J. M. and Khairoutdinov, M.: A Simplified Land Model (SLM) for use in cloud-resolving models: Formulation and evaluation, J. Adv. Model. Earth Sy., 7, 1368–1392, https://doi.org/10.1002/2014MS000419, 2015.
Liou, K. N.: An Introduction to Atmospheric Radiation, edited by Elsevier Inc. All rights reserved, Elsevier Inc., All rights reserved, https://www.sciencedirect.com/bookseries/international-geophysics/vol/84/suppl/C (last access: 27 April 2021), 2002.
Macedo, A. S. and Fisch, G.: Variabilidade Temporal da Radiação Solar Durante o Experimento GOAmazon 2014/15, Weather Rev., 144, 1219–1229, https://doi.org/10.1175/MWR-D-15-0273.1, 2016
Machado, L. A. T., Calheiros, A. J. P., Biscaro, T., Giangrande, S., Silva Dias, M. A. F., Cecchini, M. A., Albrecht, R., Andreae, M. O., Araujo, W. F., Artaxo, P., Borrmann, S., Braga, R., Burleyson, C., Eichholz, C. W., Fan, J., Feng, Z., Fisch, G. F., Jensen, M. P., Martin, S. T., Pöschl, U., Pöhlker, C., Pöhlker, M. L., Ribaud, J.-F., Rosenfeld, D., Saraiva, J. M. B., Schumacher, C., Thalman, R., Walter, D., and Wendisch, M.: Overview: Precipitation characteristics and sensitivities to environmental conditions during GoAmazon2014/5 and ACRIDICON-CHUVA, Atmos. Chem. Phys., 18, 6461–6482, https://doi.org/10.5194/acp-18-6461-2018, 2018.
Maghrabi, A. H., Almutayri, M. M., Aldosary, A. F., Allehyani, B. I., Aldakhil, A. A., Aljarba, G. A. and Altilasi, M. I.: The influence of atmospheric water content, temperature, and aerosol optical depth on downward longwave radiation in arid conditions, Theor. Appl. Climatol., 138, 1375–1394, https://doi.org/10.1007/s00704-019-02903-y, 2019.
Mardi, A. H., Dadashazar, H., MacDonald, A. B., Crosbie, E., Coggon, M. M., Azadi Aghdam, M., Woods, R. K., Jonsson, H. H., Flagan, R. C., Seinfeld, J. H. and Sorooshian, A.: Effects of Biomass Burning on Stratocumulus Droplet Characteristics, Drizzle Rate, and Composition, J. Geophys. Res.-Atmos., 124, 12301–12318, https://doi.org/10.1029/2019JD031159, 2019.
Marengo, J. A., Souza, C. M., Thonicke, K., Burton, C., Halladay, K., Betts, R. A., Alves, L. M., and Soares, W. R.: Changes in Climate and Land Use Over the Amazon Region: Current and Future Variability and Trends, Front. Earth Sci., 6, 228, https://doi.org/10.3389/feart.2018.00228, 2018.
Martin, S. T., Artaxo, P., Machado, L. A. T., Manzi, A. O., Souza, R. A. F., Schumacher, C., Wang, J., Andreae, M. O., Barbosa, H. M. J., Fan, J., Fisch, G., Goldstein, A. H., Guenther, A., Jimenez, J. L., Pöschl, U., Silva Dias, M. A., Smith, J. N., and Wendisch, M.: Introduction: Observations and Modeling of the Green Ocean Amazon (GoAmazon2014/5), Atmos. Chem. Phys., 16, 4785–4797, https://doi.org/10.5194/acp-16-4785-2016, 2016.
Mather, J. H.: Seasonal Variability in Clouds and Radiation at the Manus ARM Site, J. Climate, 18, 2417–2428, https://doi.org/10.1175/JCLI3401.1, 2005.
Matsuno, T.: Quasi-Geostrophic Motions in the Equatorial Area, J. Meteorol. Soc. Jan., 44, 25–43, https://doi.org/10.2151/jmsj1965.44.1_25, 1966.
Mechem, D. B. and Giangrande, S. E.: The Challenge of Identifying Controls on Cloud Properties and Precipitation Onset for Cumulus Congestus Sampled During MC3E, J. Geophys. Res.-Atmos., 123, 3126–3144, https://doi.org/10.1002/2017JD027457, 2018.
Morrison, H., Curry, J. A., and Khvorostyanov, V. I.: A New Double-Moment Microphysics Parameterization for Application in Cloud and Climate Models. Part I: Description, J. Atmos. Sci., 62, 1665–1677, https://doi.org/10.1175/JAS3446.1, 2005.
Moulin, A. J., Moum, J. N., and Shroyer, E. L.: Evolution of Turbulence in the Diurnal Warm Layer, J. Phys. Oceanogr., 48, 383–396, https://doi.org/10.1175/JPO-D-17-0170.1, 2018.
Neves, T., Fisch, G. and Raasch, S.: Local Convection and Turbulence in the Amazonia Using Large Eddy Simulation Model, Atmosphere-Basel, 9, 399, https://doi.org/10.3390/atmos9100399, 2018.
Nunes, A. M. P., Silva Dias, M. A. F., Anselmo, E. M., and Morales, C. A.: Severe Convection Features in the Amazon Basin: A TRMM-Based 15-Year Evaluation, Front. Earth Sci., 4, 37, https://doi.org/10.3389/feart.2016.00037, 2016.
Park, R.-S., Chae, J.-H., and Hong, S.-Y.: A Revised Prognostic Cloud Fraction Scheme in a Global Forecasting System, Mon. Weather Rev., 144, 1219–1229, https://doi.org/10.1175/MWR-D-15-0273.1, 2016.
Patnaude, R. and Diao, M.: Aerosol Indirect Effects on Cirrus Clouds Based on Global Aircraft Observations, Geophys. Res. Lett., 47, e2019GL086550, https://doi.org/10.1029/2019GL086550, 2020.
Pujiana, K., Moum, J. N., and Smyth, W. D.: The Role of Turbulence in Redistributing Upper-Ocean Heat, Freshwater, and Momentum in Response to the MJO in the Equatorial Indian Ocean, J. Phys. Oceanogr., 48, 197–220, https://doi.org/10.1175/JPO-D-17-0146.1, 2018.
Riihimaki, L. D., Gaustad, K. L., and Long, C. N.: Radiative Flux Analysis (RADFLUXANAL) Value-Added Product: Retrieval of Clear-Sky Broadband Radiative Fluxes and Other Derived Values, technical report, Oak Ridge National Laboratory (ORNL), Oak Ridge, TN (US), https://doi.org/10.2172/1569477, 2019.
Rowe, A. K., Houze, R. A., Brodzik, S. and Zuluaga, M. D.: The Diurnal and Microphysical Characteristics of MJO Rain Events during DYNAMO, J. Atmos. Sci., 2019, 67–80, https://doi.org/10.1175/JAS-D-18-0316.1, 2019.
Satyamurty, P., da Costa, C. P. W., and Manzi, A. O.: Moisture source for the Amazon Basin: a study of contrasting years, Theor. Appl. Climatol., 111, 195–209, https://doi.org/10.1007/s00704-012-0637-7, 2013.
Klein, S. A. and Del Genio, A.: ARM's support for GCM improvement: A white paper, https://www.arm.gov/publications/programdocs/doe-sc-arm-0612.pdf (last access: 3 May 2021), 2006.
Su, W., Bodas-Salcedo, A., Xu, K.-M., and Charlock, T. P.: Comparison of the tropical radiative flux and cloud radiative effect profiles in a climate model with Clouds and the Earth's Radiant Energy System (CERES) data, J. Geophys. Res., 115, D01105, https://doi.org/10.1029/2009JD012490, 2010.
Tang, S., Xie, S., Zhang, Y., Zhang, M., Schumacher, C., Upton, H., Jensen, M. P., Johnson, K. L., Wang, M., Ahlgrimm, M., Feng, Z., Minnis, P., and Thieman, M.: Large-scale vertical velocity, diabatic heating and drying profiles associated with seasonal and diurnal variations of convective systems observed in the GoAmazon2014/5 experiment, Atmos. Chem. Phys., 16, 14249–14264, https://doi.org/10.5194/acp-16-14249-2016, 2016.
Tao, W.-K. and Moncrieff, M. W.: Multiscale cloud system modeling, Rev. Geophys., 47, RG4002, https://doi.org/10.1029/2008RG000276, 2009.
Thompson, G., Field, P. R., Rasmussen, R. M., and Hall, W. D.: Explicit Forecasts of Winter Precipitation Using an Improved Bulk Microphysics Scheme. Part II: Implementation of a New Snow Parameterization, Mon. Weather Rev., 136, 5095–5115, https://doi.org/10.1175/2008MWR2387.1, 2008.
Wang, Y., Yang, P., Hioki, S., King, M. D., Baum, B. A., Di Girolamo, L., and Fu, D.: Ice Cloud Optical Thickness, Effective Radius, And Ice Water Path Inferred From Fused MISR and MODIS Measurements Based on a Pixel-Level Optimal Ice Particle Roughness Model, J. Geophys. Res.-Atmos., 124, 12126–12140, https://doi.org/10.1029/2019JD030457, 2019.
Wielicki, B. A., Harrison, E. F., Cess, R. D., King, M. D. and Randall, D. A.: Mission to Planet Earth: Role of Clouds and Radiation in Climate, B. Am. Meteorol. Soc., 76, 2125–2153, https://doi.org/10.1175/1520-0477(1995)076<2125:MTPERO>2.0.CO;2, 1995.
Yanai, M. and Tomita, T.: Seasonal and Interannual Variability of Atmospheric Heat Sources and Moisture Sinks as Determined from NCEP–NCAR Reanalysis, J. Climate, 11, 463–482, https://doi.org/10.1175/1520-0442(1998)011<0463:SAIVOA>2.0.CO;2, 1998.
Yang, G.-Y. and Slingo, J.: The Diurnal Cycle in the Tropics, Mon. Weather Rev., 129, 784–801, https://doi.org/10.1175/1520-0493(2001)129<0784:TDCITT>2.0.CO;2, 2001.
Zhang, M. H.: Comparing clouds and their seasonal variations in 10 atmospheric general circulation models with satellite measurements, J. Geophys. Res., 110, D15S02, https://doi.org/10.1029/2004JD005021, 2005.