the Creative Commons Attribution 4.0 License.
the Creative Commons Attribution 4.0 License.
 | 05 Jan 2022
Effects of oligomerization and decomposition on the nanoparticle growth: a model study
Kari Lehtinen
Tuukka Petäjä
Felipe Lopez-Hilfiker
Joel A. Thornton
Markku Kulmala
Taina Yli-Juuti
The rate at which freshly formed secondary aerosol particles grow is an important factor in determining their climate impacts. The growth rate of atmospheric nanoparticles may be affected by particle-phase oligomerization and decomposition of condensing organic molecules. We used the Model for Oligomerization and Decomposition in Nanoparticle Growth (MODNAG) to investigate the potential atmospheric significance of these effects. This was done by conducting multiple simulations with varying reaction-related parameters (volatilities of the involved compounds and reaction rates) using both artificial and ambient measured gas-phase concentrations of organic vapors to define the condensing vapors. While our study does not aim at providing information on any specific reaction, our results indicate that particle-phase reactions have significant potential to affect the nanoparticle growth. In simulations in which one-third of a volatility basis set bin was allowed to go through particle-phase reactions, the maximum increase in growth rates was 71 % and the decrease 26 % compared to the base case in which no particle-phase reactions were assumed to take place. These results highlight the importance of investigating and increasing our understanding of particle-phase reactions.
- Article
(2043 KB) - Full-text XML
- BibTeX
- EndNote


Aerosols are ubiquitous in the atmosphere, and they affect our climate in multiple ways. Directly they can affect the radiative forcing by reflecting, refracting and absorbing sunlight and indirectly by acting as cloud condensation nuclei (CCN) and forming clouds (Boucher et al., 2013). The effect of aerosol–cloud interactions in the Earth's radiative balance is one of the biggest uncertainties we have in recent climate models and studies (IPCC, chap. 7, Boucher et al., 2013).
For an aerosol particle to act as CCN, it needs to be large enough in size, at least some tens of nanometers in diameter (Pierce and Adams, 2007; Reddington et al., 2017). This can be, on one hand, a limiting factor for climate impacts of small primary aerosols as Aitken-mode-sized primary particles such as soot particles are quite often non-hygroscopic, which hinders their activation as CCN (e.g., Zhang et al., 2008). However, atmospheric aging typically enhances their solubility and alters their morphology towards being CCN active (Tritscher et al., 2011; Lambe et al., 2015). On the other hand, the secondary aerosols that are formed in the atmosphere via gas-to-particle conversion (e.g., Kulmala et al., 2014) need to undergo substantial growth until they reach sizes relevant for CCN activation (Kerminen et al., 2012). Regardless, it is estimated that approximately half of the particles acting as CCN are formed in the atmosphere by nucleation from atmospheric gases (Merikanto et al., 2009; Paramonov et al., 2015).
Organic molecules play an important role in the early state of the growth of atmospheric particles (Wehner et al., 2005; Kerminen et al., 2012; Kulmala et al., 2013; Shrivastava et al., 2017; Mohr et al., 2019; Yli-Juuti et al., 2020). Gas-phase oxidation of volatile organic compounds produces a variety of molecules, some of which condense on particles and form secondary organic aerosol (SOA) (Hallquist et al., 2009). How much a compound contributes to the particle growth is to a large extent controlled by their gas-phase concentration and volatility. In recent studies, nanoparticle growth simulated based on the observed organic vapor concentrations and estimated saturation vapor concentrations have been found in fairly good agreement with observed particle growth in an atmospheric environment (Mohr et al., 2019) and in laboratory (Stolzenburg et al., 2018), although uncertainties are associated with both the measured gas-phase concentrations and the estimated saturation concentrations.
In addition to gas-phase reactions, particle-phase reactions can increase or reduce the volatility. One pathway for more volatile compounds to affect the growth is by oligomerization in the particle phase (Tolocka et al., 2004; Hall and Johnston, 2012). Studies have reported that oligomers are in abundance in SOA and that they may contribute up to 50 % of organic mass in them (Gao et al., 2004; Denkenberger et al., 2007; Hall and Johnston, 2011; Kourtchev et al., 2016). In oligomerization two or more smaller molecules combine with each other forming larger oligomer molecules which are likely less volatile, i.e., less likely to evaporate. In contrast, if a molecule decomposes inside a particle, it breaks down forming new smaller molecules. These molecules tend to have higher volatility than the original molecule and thus may evaporate back to the gas phase, hindering the particle growth even if the original molecule would have preferred to stay in the particle phase. Recent studies have reported a wide range of different oligomerization and decomposition rates in multiple reactions. For example, several studies have been conducted optimizing a model to measurements using oligomerization and decomposition reactions as fitting parameters. The fitted reaction rates for oligomerization have ranged between 10−26 and cm3 molec.−1 s−1 (Kolesar et al., 2015; Roldin et al., 2014; Vesterinen et al., 2007) and for decomposition between 10−5 and 10−2 s−1 (Kolesar et al., 2015; Roldin et al., 2014; D'Ambro et al., 2018; Trump and Donahue, 2014). However, as the identities of the organic compounds participating in atmospheric nanoparticle growth are largely unknown or uncertain, there is a lack of knowledge on the particle-phase reactivity and reaction rates of the molecules in the condensed phase.
In this study we use an atmospheric process model to study how the particle-phase oligomerization and decomposition influence the growth of atmospheric nanoparticles. Particularly, our aim is to explore how much particle-phase reactions can affect nanoparticle growth and further to compare these effects with the uncertainties in the ambient and saturation vapor concentrations of the gas-phase products. To do this, we carried out two sets of simulations. In Case 1, simulations are performed based on artificially created but justified gas-phase concentrations with a series of assumptions about particle-phase reaction properties. These simulations are subsequently used to determine the range of properties to which particle growth is sensitive. In Case 2, simulations constrained by atmospheric observations are performed in order to estimate the extent to which particle-phase reactions can impact particle growth. This will allow us to investigate the sensitivities of predicted growth for reactions and the related properties but will not infer what kind of reactions take place in the atmospheric nanoparticles.
2.1 Model description
The Model for Oligomerization and Decomposition in NAnoparticle Growth (MODNAG) was developed based on MABNAG (Yli-Juuti et al., 2013) and is used in this study. MODNAG is a single-particle growth model that simulates the time evolution of particle size and composition based on ambient gas-phase concentrations of condensing compounds, temperature and relative humidity (RH). In this study, the system consists of multiple organic compounds, water, sulfuric acid and ammonia.
The organics are divided into four groups (I–IV): three groups (I–III) that condense from the gas phase and one group (IV) that includes oligomerization and decomposition products that are formed in the particle phase during the simulation. The three condensing groups (I–III) all include seven organic compounds which are defined by their saturation concentration (C*) using volatility basis set (VBS; Donahue et al., 2011), in which the volatility bins range from µg m−3 to µg m−3. The bin with C* of 10−4 µg m−3 is defined as extremely low-volatile organic compounds (ELVOCs), bins from 10−3 to 10−1 µg m−3 as low-volatile organic compounds (LVOC) and bins from 100 to 102 µg m−3 as semi-volatile organic compounds (SVOCs) based on Donahue et al. (2013). The three condensing groups (I–III) differ in terms of what kind of reactions they can go through in the particle phase. Organic group I is called non-reactant group, and these compounds will not go through any reactions in the particle phase. The compounds in organic group II, called oligomerization group, can combine with each other in the particle phase, forming new compounds, dimers. The compounds in organic group III, called decomposition group, can fragment into two smaller compounds in the particle phase. The products of the reactions from the oligomerization and decomposition groups form organic group IV in the model.
The change in the mass of compound j in a particle (mj) is calculated based on the mass flux between gas and particle phase and the oligomerization and decomposition reactions they go through using the following equation:
where Mj (kg mol−1) is the molar mass, dj molecular diameter (m), Dj diffusion coefficient (m2 s−1), Cj gas-phase mass concentration, and Ceq,j equilibrium mass concentration of compound j (note that both are here converted to units of kg m−3); dp is the diameter (m), Dp the diffusion coefficient of the particle (m2 s−1) and NA Avogadro's constant (mol−1). Polig,j and Lolig,j are the production and loss rates by oligomerization, and Pdec,j and Ldec,j are the production and loss rates by decomposition.
The first part on the right in Eq. (1) describes the transition regime mass flux of condensation to or evaporation from a particle and is based on the difference in the gas-phase and equilibrium concentrations of the compound. βi is the transition regime correction factor defined as follows (Fuchs and Sutugin, 1970):
where αm,j is mass accommodation coefficient, and Knj is the Knudsen number. In our model, for the Knudsen number we use the following (Lehtinen and Kulmala, 2003):
where λj is the free mean path of the condensing compound j. The mean free path is defined as follows (Lehtinen and Kulmala, 2003):
where cp and cj are the mean thermal speed of the particle and condensing compound, respectively. The equilibrium vapor concentration of j is calculated as
where γj is the activity coefficient, χj the mole fraction, the saturation concentration, νj the molar volume of compound j, σ the surface tension of the particle, R the gas constant and T the temperature. In this study we assume an ideal solution, and therefore the activity coefficient γj is equal to 1.
The second part on the right-hand side of Eq. (1) describes the production and loss of compound j from oligomerization and decomposition reactions. Lolig,j describes the loss rate of compound j due to oligomerization reactions with other compounds i ( only for organic group II) and is calculated as
where kolig is the oligomerization rate coefficient, Vp the volume of the particle, and Nj and Ni the particle-phase molecular concentrations of compounds j and i, respectively. Ldec,j describes the loss rate of compound j due to decomposition to smaller molecules ( only for organic group III) and is calculated as
where kdec is the decomposition rate coefficient of compound j. Polig,j and Pdec,j describe the production of compound j by oligomerization and decomposition, respectively (≠0 only for organic group IV), and they are calculated as
where f, y, and i indexes describe the two oligomerizing compounds from group II and the fragmenting compound in group III, respectively.
Equation (1) is used for both organics and sulfuric acid. Water is assumed to be constantly in equilibrium between gas and particle phases, and the amount of ammonia (by mole) is assumed to equal the amount of sulfuric acid in the particle phase. In this study, an ideal solution assumption without acid-base chemistry is applied as the focus is on the organics, although we acknowledge that acidity can enhance the oligomerization (Tolocka et al., 2004).
The particle is assumed to be liquid-like and have no particle-phase diffusional limitations. The viscosity of the particle has been suggested to possibly have an effect on the particle growth (Virtanen et al., 2010); however, the effect may not be significant at the atmospheric boundary layer's relative humidities at least in warm environments (Renbaum-Wolff et al., 2013; Yli-Juuti et al., 2017; Li et al., 2019), and here such an effect was neglected to focus on oligomerization and decomposition. For example, viscosity of 109 Pa s, corresponding to upper limit estimates of α-pinene SOA particles at atmospherically relevant RH (Renbaum-Wolf et al., 2013; Zhang et al., 2015; Yli-Juuti et al., 2017), would indicate a characteristic time of bulk diffusion of less than an hour for 10 nm particles and over a day for 100 nm particles (Shiraiwa et al., 2011). Considering that the growth of nanoparticles takes place over hours, with such high viscosity, particle-phase diffusion limitations could become important in the size range between 10 and 100 nm. The lower the viscosity is, the larger the size is in which particle-phase diffusivity becomes important (Shiraiwa et al., 2011).
2.2 Simulation setup
In MODNAG it is possible to include multiple oligomerization and decomposition reactions in the same simulation. In recent studies it has been shown that oligomerization is often reversible (Trump and Donahue, 2014). In our simulations we have mostly assumed irreversible reactions but conducted simulations with reversible oligomerization for a few example cases to explore potential influences on this process. Also, for simplicity we have assumed that only one reaction happens at a time and that it happens only between two compounds, although in reality the reaction chains are observed to be longer and include multiple reactions and compounds (Tolocka et al., 2004; Kolesar et al., 2015; Heaton et al., 2007). In all simulations the initial particle diameter was 2 nm, and it consisted solely of sulfuric acid.
Our analysis included “oligomerization simulations” and “decomposition simulations”. In the oligomerization simulations one pair of compounds in organic group II was allowed to react and form a dimer (compound in group IV). Other compounds in group II and all compounds in group III were assumed to be non-reactant similar to group I compounds. We run such simulations for reactions between all possible compound pairs in organic group II. For each pair of reacting compounds, several simulations were run by assuming the product to have a saturation concentration between and 101 µg m−3; however, the volatility of the product was restricted to be always at least 1 order of magnitude lower than the volatility of the less volatile reacting compounds. For each combination of the pair of reacting compounds and C* of the product, the analysis included simulations in which oligomerization rate coefficient kolig ranged from 10−21 to 10−12 cm3 s−1. We chose these limits based on sensitivity tests, which showed that with higher or lower oligomerization rate coefficients there were not any significant changes in the results compared to these upper and lower limits, respectively.
In the decomposition simulations the initial compound from organic group III fragments formed two smaller product compounds (compounds in group IV). These two product compounds could be identical or have different properties. Other compounds in group III and all compounds in group I and group II were assumed to be non-reactant. For each decomposing compound from organic group III, simulations were run with volatilities of the product compounds ranging from to 102 µg m−3. The volatility of each product compound was limited to be always at least 1 order of magnitude higher than the initial compound's volatility. For each combination of the initial compound and the pair of product compounds, simulations were run with a decomposition rate coefficient kdec ranging from 10−5 to 1 s−1. We chose these limits based on sensitivity tests, which showed that with higher or lower decomposition rate coefficients there were not any significant changes in the results compared to these upper and lower limits, respectively.
In the simulations with a reversible reaction, oligomerization of compounds was done similarly to that in irreversible oligomerization simulations described above, with the exception that the formed oligomers could decompose back to their initial group II bins after oligomerization. Ranges for kolig and kdec were similar to the irreversible reactions.
The total gas-phase concentration of compounds in different VBS bins was divided evenly between groups I, II and III, which means that one-third of a bin was reacting in a given simulation. We chose this in order to investigate effects of particle-phase reactions in a more moderate case compared to assuming that all or a majority of the compounds of any volatility would undergo reactions. An assumption for this was required since relevant particle-phase reactions of organics are not well known. We tested the sensitivity of results to this assumption by performing additional simulations with the assumption that all molecules of a bin can react (see Results, Sect. 3.2).
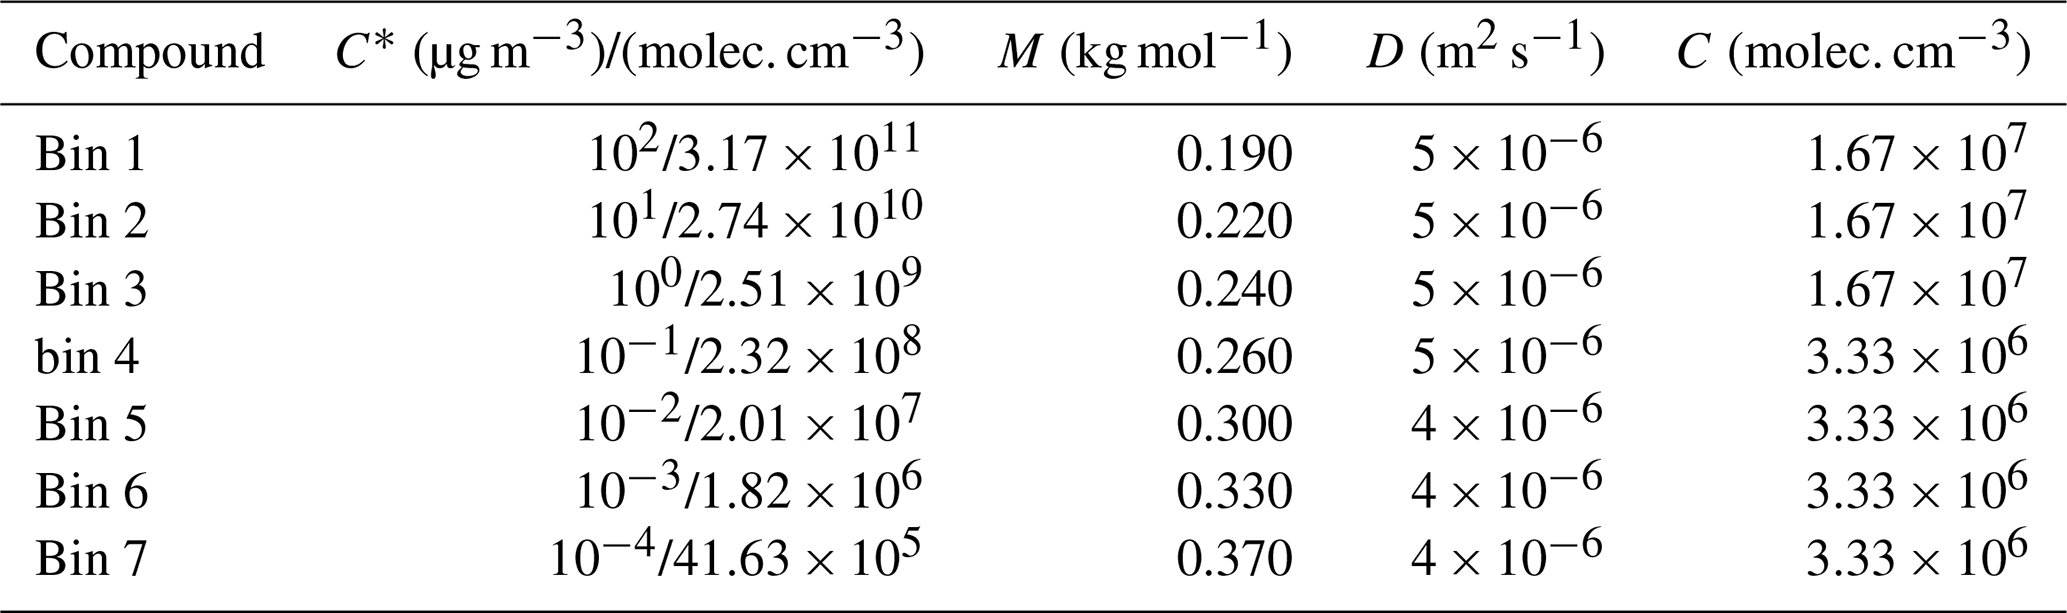
In this study the aim was to get an overview of how much oligomerization and decomposition can affect the growth of atmospheric nanoparticles. For this, the above sensitivity runs were performed for two scenarios being representative of environments where the nanoparticle are growing. In Case 1, an artificial gas-phase composition was given as an input to the model. The vapor concentrations were selected in a way that vapor concentrations and the resulting particle growth rates were of a similar magnitude as those observed in the boreal forest atmosphere (Mohr et al., 2019). Additionally, the less volatile organic compounds were set to have lower concentrations compared to the more volatile compounds following atmospheric observations but in a simplified way (Mohr et al., 2019). Properties of the seven model compounds (VBS bins) in all condensing groups (I–III) are illustrated in Table 1. For group IV compounds, which are the oligomerization and decomposition products (280 compounds), the properties were defined based on the reacted compounds and volatility of the product. The gas-phase diffusivity of group IV compounds is assumed to be similar with condensing components in a similar volatility bin. For oligomerization product compounds the molar mass of the compound was the sum of molar masses of reacting compounds, and for decomposing product compounds the molar masses were calculated by dividing the molar mass of the decomposing compound relative to the log C* of the product compounds.
Table 1The properties of organic model compounds in groups I, II and III, for Case 1, in which the properties are artificial, mimicking atmospheric conditions. C* is saturation concentration, M molar mass, D gas-phase diffusion coefficient and C gas-phase concentration. C* is expressed both in units of micrograms per cubic meter (µg m−3) and molecules per cubic centimeter (molec. cm−3).
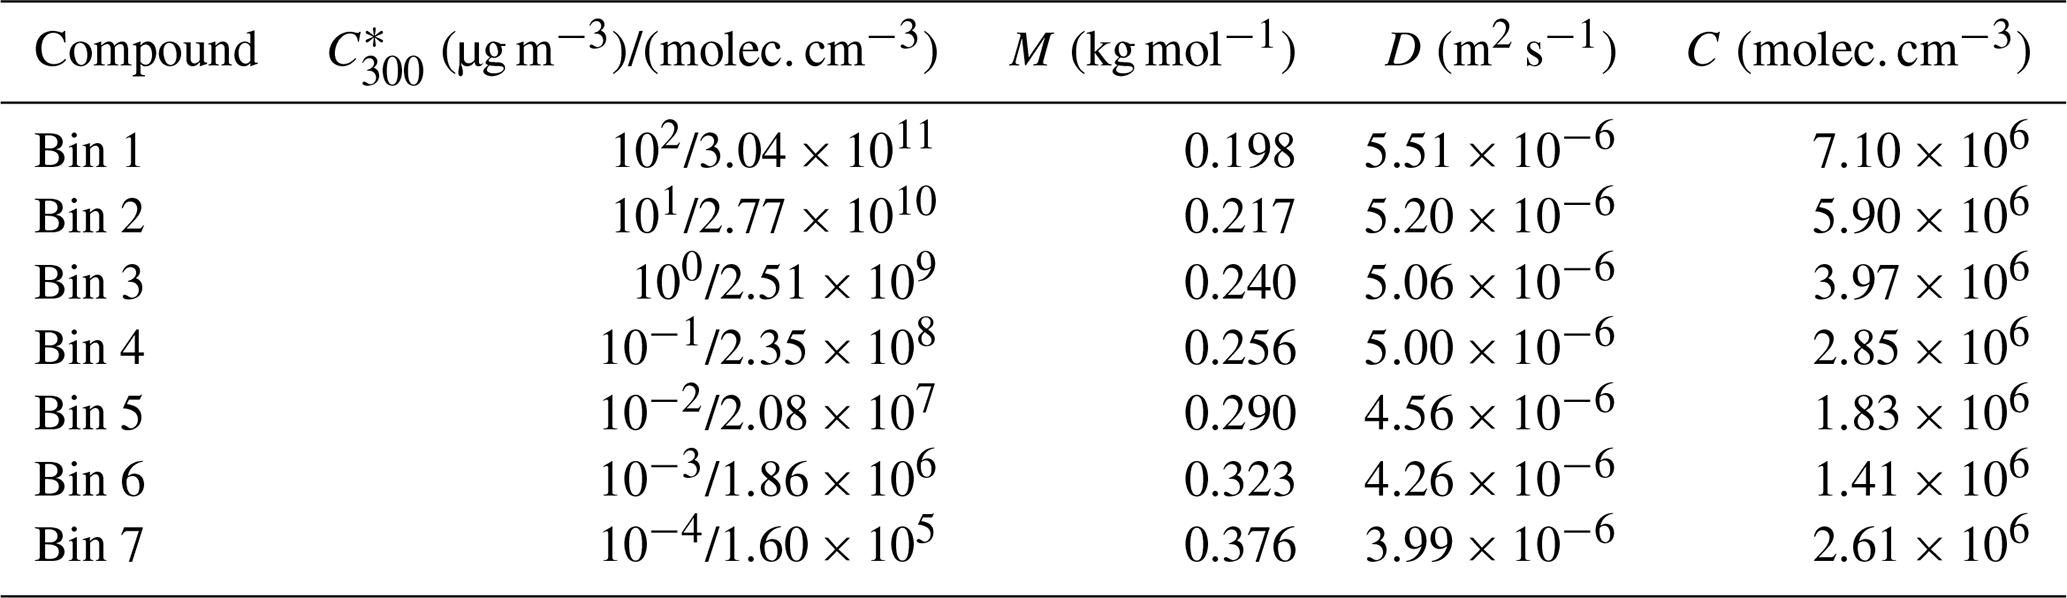
In Case 2, simulations were run with gas composition more directly restricted by atmospheric observations. Vapor concentrations and molecular composition measured with a chemical ionization mass spectrometer at Hyytiälä measurement station (Mohr et al., 2019) in spring 2014 during a new particle formation (NPF) event were grouped in a VBS based on their C* estimated with the parameterization by Li et al. (2016) and temperature dependence of C* estimated based on the method by Epstein et al. (2010). This VBS representation of the gas concentrations of the organics was used as an input for the model. The measured gas-phase concentrations were assigned evenly for organic groups I, II and III, but since only one oligomerization or decomposition reaction was allowed in a simulation, most of the concentration was not reacting except for the one-third of a bin assigned to reacting compounds of organic group II or III to investigate oligomerization or decomposition, respectively. The observational data used here are presented in Mohr et al. (2019), in which particle growth was simulated based on the observed gas-phase concentrations without considering the particle-phase oligomerization or decomposition of organic compounds. In these simulations, we used averages over the detected NPF event for ambient conditions, and properties (Mj and Dj) of model compounds (VBS bins) were calculated as gas-phase mass-concentration-weighted averages of organic compounds grouped to each model compound. The properties of model compounds in these Case 2 simulations are listed in Table 2. The properties for group IV compounds were defined similarly to Case 1.
Table 2The properties of model compounds in groups I, II and III, for Case 2. Concentrations are from measurements of Mohr et al. (2019). Saturation concentrations at 300 K () are calculated using parametrization by Li et al. (2016) and converted to the ambient temperature in the model based on temperature dependence by Epstein et al. (2010). M is molar mass, D gas-phase diffusion coefficient and C gas-phase concentration.
3.1 Simulations based on artificially generated gas-phase concentrations
The particle growth in simulations with artificially generated gas-phase concentrations (Case 1) are presented in Fig. 1. In general, our results show that oligomerization increases and decomposition decreases the particle growth rate. At maximum, the growth rate was increased 139 % by oligomerization and decreased 20 % by decomposition. In some simulations the growth rate is decreased also by oligomerization. These are simulations in which two low-volatile or extremely low-volatile ( µg m−3) model compounds are forming a dimer, and the product is only 1 order of magnitude less volatile than the initial compounds. For the sake of completeness these simulations were included in our simulation set even though they may be unlikely in real atmospheric conditions, based on the dependence of C* on molecular composition (Li et al., 2016). Also in this case, oligomerization reactions decrease the molar fractions of the condensing compounds in the particle phase, therefore decreasing their equilibrium vapor concentration and enhancing their condensation. However, due to small differences in volatilities between the reacting monomers and the product dimer and zero gas-phase concentration of the product compound, the evaporation rate of the product compound exceeds the enhancement of condensation due to oligomerization.
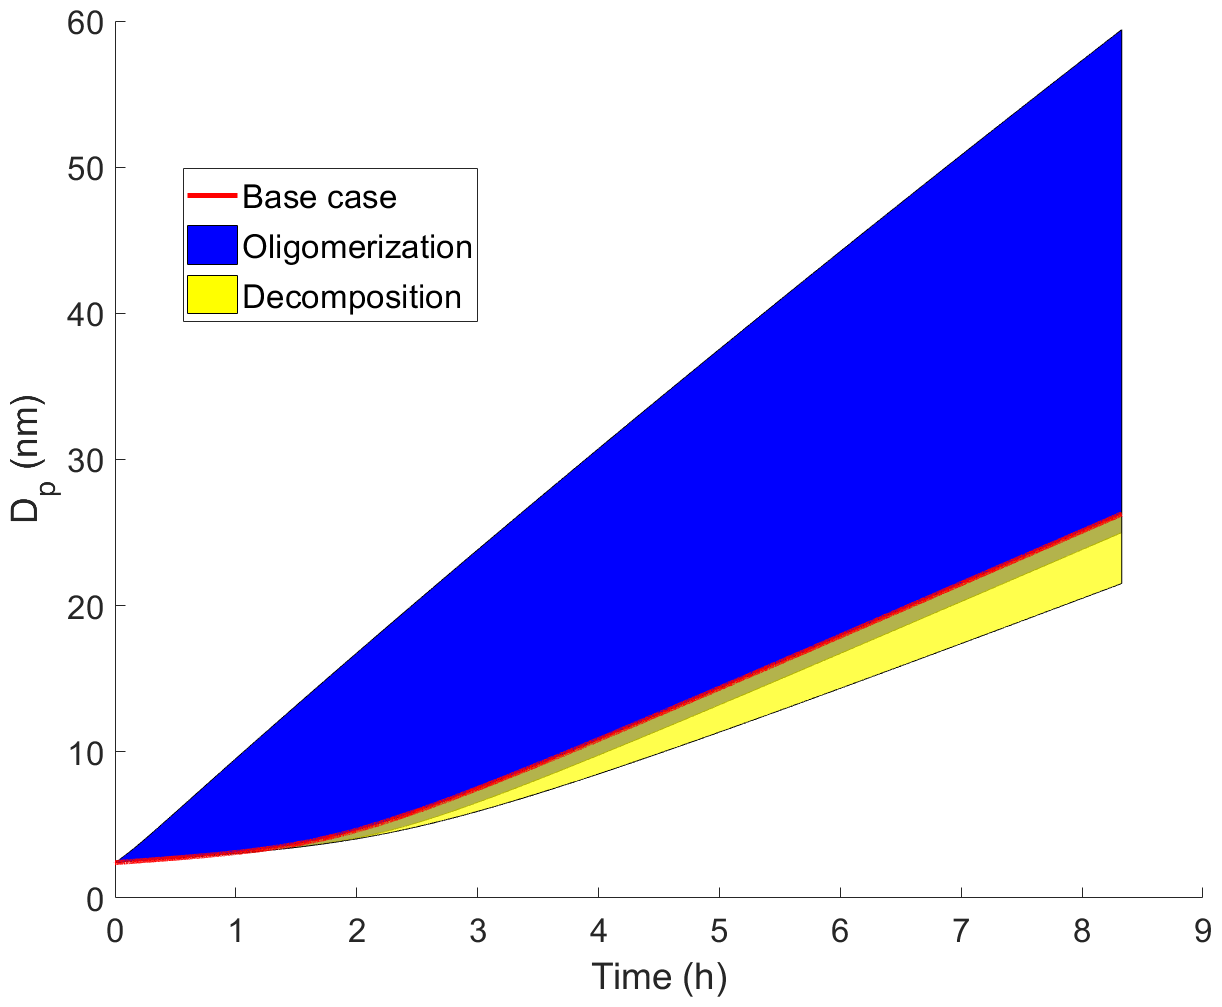
Figure 1Diameter of the growing particle as a function of time in simulations based on artificial gas-phase concentrations (Case 1 simulations). The red line shows the base case simulation in which no particle-phase reactions were allowed. The blue area shows the contribution of oligomerization to the growth, i.e., the envelope of the simulations in which oligomerization was allowed. The yellow area shows the contribution of decomposition to the growth, i.e., the envelope of the simulations in which decomposition was allowed.
The effects of different parameters on the growth with oligomerization can be seen in Fig. 2, in which simulations with different oligomerization rate coefficient (Fig. 2a, b), saturation concentrations of oligomerization product (; Fig. 2c, d) and saturation concentration of one of the oligomerizing compounds (; Fig. 2e, f) are presented. Each panel shows the base case simulation with no reactions (dashed red line) and the simulation with the fastest growth, in which compounds from bins 2 ( µg m−3) and 3 ( µg m−3) form a compound with lower saturation concentration by 2 orders of magnitude than in bin 7 ( µg m−3) with an oligomerization rate coefficient kolig of 10−12 cm3 s−1 (dashed black line). Growth rate (GR) is the changing rate of the particle diameter, and it was calculated based on differences in simulated diameter between each time step. The growth rate increases with increasing kolig rates and with the decreasing volatility of the oligomerization product. Generally, the growth rate also increases with the increasing volatility of oligomerizing compounds. However, with very high volatilities ( µg m−3) the tendency of these compounds to evaporate can hinder the oligomerization reactions.
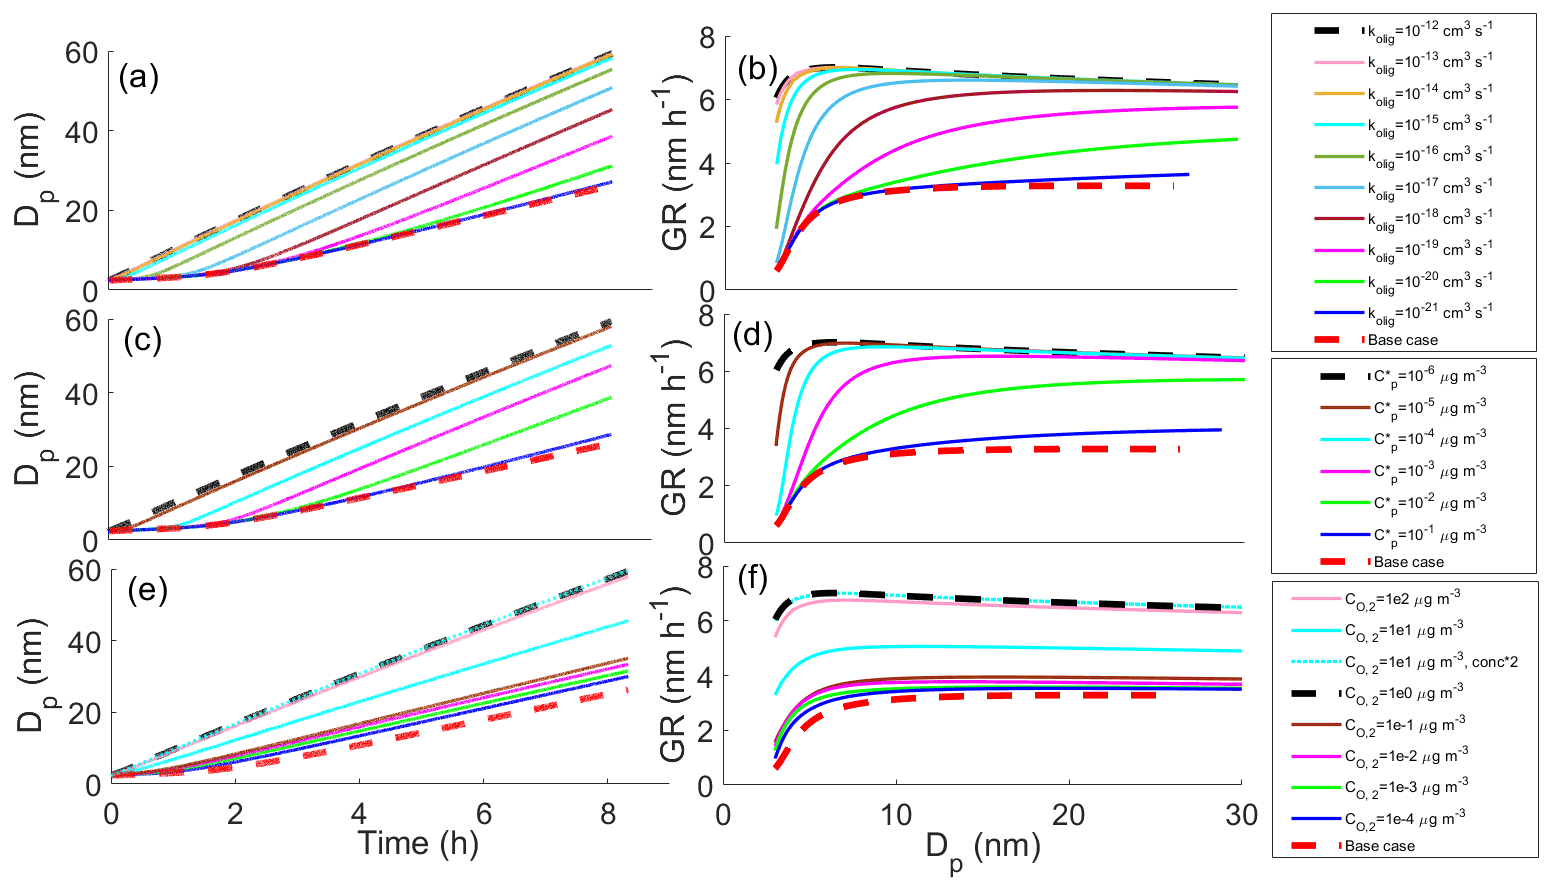
Figure 2Diameter of the particle (Dp) as a function of time and growth rate (GR) of the particle as a function of diameter in simulations in which two model compounds oligomerize forming a new oligomerization product, (a, b) for simulations with different oligomerization rate coefficients, (c, d) for simulations with different saturation concentrations of oligomerization product compounds () and (e, f) for simulations with different saturation concentrations of one of the oligomerizing compounds (). Except for the parameter that was varied, values were as follows: cm3 s−1, µg m−3, µg m−3 and the saturation concentration of the other reacting compound µg m−3. These parameter values correspond to the simulation with the fastest growth among the Case 1 simulations, which is present in every panel as a dashed black line. The base case simulation in each panel describes simulation without oligomerization reactions. Panels (e)–(f) also present simulation, in which both oligomerizing compounds are from same volatility bin ( µg m−3), and two-thirds of compounds in that volatility bin can go through oligomerization reaction. In other simulations one-third of a bin can go through a reaction.
In Fig. 2e–f the case when is 10 µg m−3, i.e., when both reacting compounds have the same volatility, is diverging from the general trend of how the volatility of reacting compounds affects the growth. The reason for this is that since we have assumed only one-third of a bin to be compounds that can go through reaction in the particle-phase, the total gas-phase concentration of reacting compounds is lower (one-third of one bin) than in the case of compounds of different bins reacting with each other (one-third of each bin). As a comparison, a simulation in which and are both 10 µg m−3 and in which two-thirds of this bin is allowed to react is also presented in Fig. 2e–f (dotted cyan line). This simulation follows the similar trend as simulations in which two compounds with different C* are reacting and shows similar growth as the simulation in which is 1 µg m−3 and is 10 µg m−3.
All parameters discussed above, oligomerization rate coefficient and volatility of oligomerizing and product compounds, have a clear effect on particle growth. However, their effect is dependent on each other, which will be discussed below.
Wang et al. (2010) concluded that oligomerization is nearly inhibited for small particles (<4 nm) because oligomerization is highly dependent on particle-phase concentrations, which are very low in the small particles due to an increase in equilibrium vapor concentrations caused by the surface curvature (Kelvin effect). A similar effect can be seen also in part of our simulations, as indicated by the small difference in GR between various simulations and the base case simulation particularly for the size below 5 nm (Fig. 2). However, when kolig and differences in volatilities of oligomerizing and product compounds are large enough, oligomerization enhances the growth of even the sub-5 nm particles based on our simulations. If kolig is high, even the small equilibrium particle-phase concentration of the SVOCs, which is decreased further for small particles due to surface curvature, may lead to significant oligomer production, and if the product has a low enough volatility, the increase in equilibrium vapor concentration due to the surface curvature will not drive it to evaporate quickly even from the smallest particles, and, thus, particle growth is enhanced. When interpreting our simulation results for the small particle sizes, it should be noted that the initial assumption of a particle containing only sulfuric acid may affect the results at the beginning of the simulation. As the initial particle contains no organics, some organics will condense in the particle fast during the first-time steps (due to the solution effect in Ceq) causing artificially high GR for the beginning of the simulation. For this reason, in Fig. 2b, d and f we present the GR only after the diameter reaches 3 nm. At this point the mass of the particle is about twice the initial mass.
Figure 3 shows effects of different parameters on the particle growth in simulations in which decomposition is allowed. Simulations with different decomposition rate coefficients (Fig. 3a, b), saturation concentrations of decomposing compounds (; Fig. 3c, d) and saturation concentrations of one product compound (; Fig. 3e, f) are shown. Each panel shows the base case simulation (no reactions, dashed red line) and the simulation with the slowest growth, in which the compound from bin 7 ( = 10−6 µg m−3) decomposes into two product compounds in bin 1 ( and both equal to 102 µg m−3) with a decomposition rate coefficient kdec of 1 s−1 (dashed black line). Our results show that all varied parameters affect the growth of the particle. For kdec the effect is quite straightforward; with increasing kdec, the growth rate is decreased. The growth rate slows down with a decreasing C* of decomposing compounds due to a larger contribution of lower-volatility compounds to the particle growth and with an increasing C* of the product as a consequence of the product evaporating faster for the higher C* compounds.
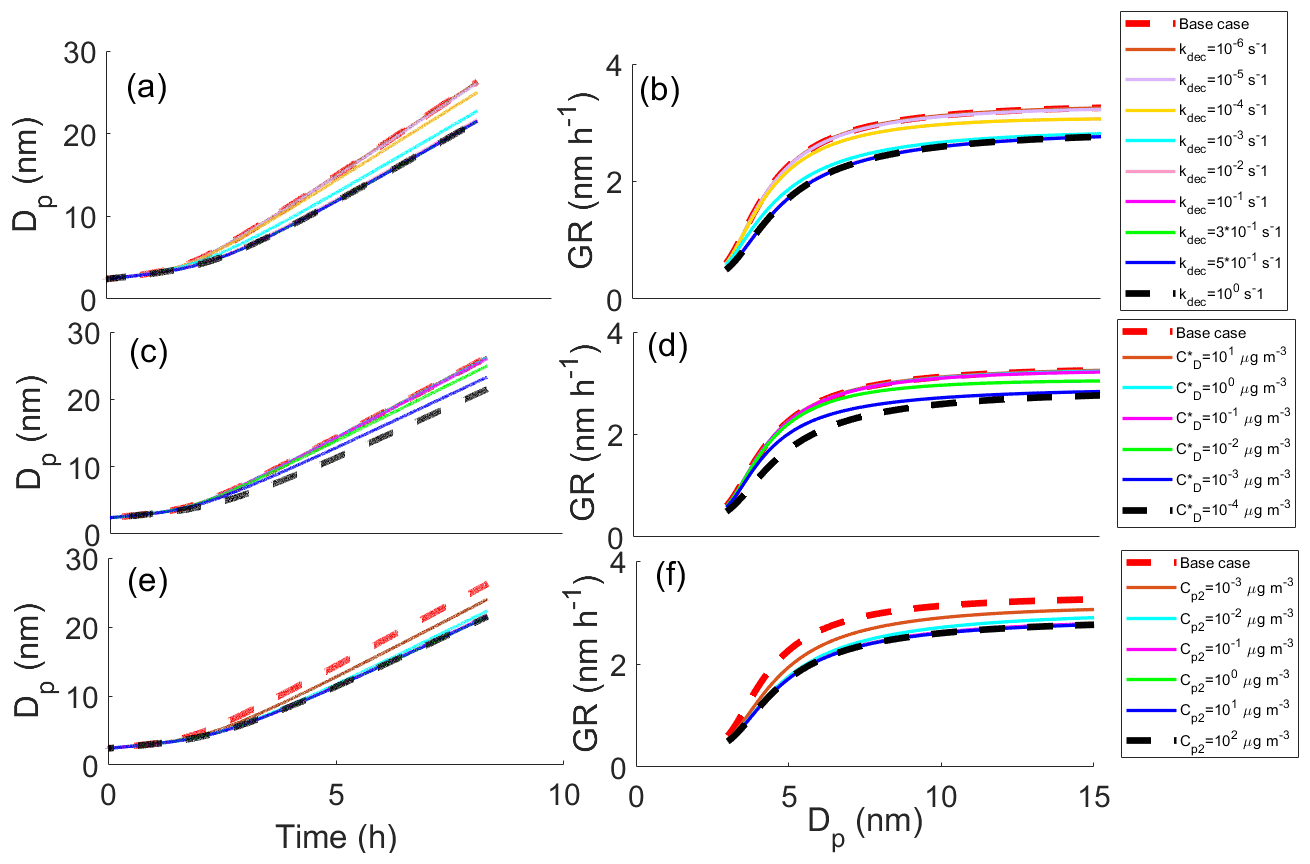
Figure 3The diameter of the particle (Dp) as a function of time and growth rate (GR) of the particle as a function of diameter in simulations, in which one model compound is allowed to decompose into two smaller compounds, (a, b) for simulations with different decomposition rate coefficients, (c, d) for simulations with different saturation concentrations of decomposing compounds () and (e, f) for simulations with different saturation concentrations of one of the decomposed product compounds (). Except for the parameter that was varied, values were as follows: kdec=1 s−1, µg m−3, µg m−3 and the saturation concentration of the other product compound µg m−3. These parameter values correspond to the simulation with the slowest growth among the Case 1 simulations which is present in every panel as a dashed black line. The base case simulation in each panel describes simulation without decomposition reaction.
In Fig. 4 we present the growth rate of the particle in all different simulations with oligomerization for particles under 5 nm in diameter (Fig. 4a) and over 5 nm in diameter (Fig. 4b). Each colored dot represents one simulation, and the color describes the growth rate. Growth rates are calculated by fitting a straight line in diameter as a function of time, i.e., assuming linear growth. This is important to notice especially with particles under 5 nm in diameter because in that size range the growth is not usually linear (see Figs. 2 and 3). From left to right the subplots show simulations with increasing kolig and from top to bottom decreasing saturation concentration of the product compound formed in the oligomerization reaction. In each subplot on the y and x axes are the saturation concentrations of the oligomerizing compounds.

Figure 4Growth rate of the particle in simulations with oligomerization for (a) particles over 5 nm in diameter and (b) particles under 5 nm in diameter. Each dot describes one simulation, and the color shows the corresponding growth rate. The growth rates are calculated assuming a linear growth curve. In the smaller figures the axes describe saturation concentrations of oligomerizing model compounds (µg m−3). The wider horizontal axis describes the oligomerization rate coefficient in the simulation and the vertical axis the saturation concentration of the forming oligomerization product.
For small values of kolig ( cm3 s−1) the increase in growth rate due to oligomerization is small, especially for under 5 nm particles, at which any notable increase can be seen only after cm3 s−1. Even for simulations in which the most volatile compounds in our setup (bin 1 and 2) oligomerize, growth does not increase much with these low kolig rates since the rate of production of the less volatile oligomers is low due to the small equilibrium particle-phase concentrations of the reacting compounds and the low reaction rate coefficient. With larger kolig rates, however, these higher-volatility molecules will oligomerize significantly despite their small equilibrium particle-phase concentrations. Without oligomerization reactions these compounds would almost not at all contribute to the growth, so with their oligomerization the growth is enhanced greatly. The gas-phase concentrations of three higher-volatility compounds are higher than those of lower-volatility compounds, which enhances the growth rates even further in simulations in which oligomerization takes place between high volatile compounds.
Similar to Fig. 4 for oligomerization reactions, in Fig. 5 we present the growth rate of the particle in all different simulations with decomposition for particles over 5 nm. We have excluded the results for particles under 5 nm in diameter because for particles under 5 nm decomposition causes little effect on growth. Again, each colored dot represents one simulation, and the color describes the average growth rate during the simulation. The subplots are arranged so that from left to right we have simulations with increasing kdec and from top to bottom decreasing saturation concentration of the decomposing compound. In each subplot the y and x axes are the saturation concentration of the end products of decomposition reaction.
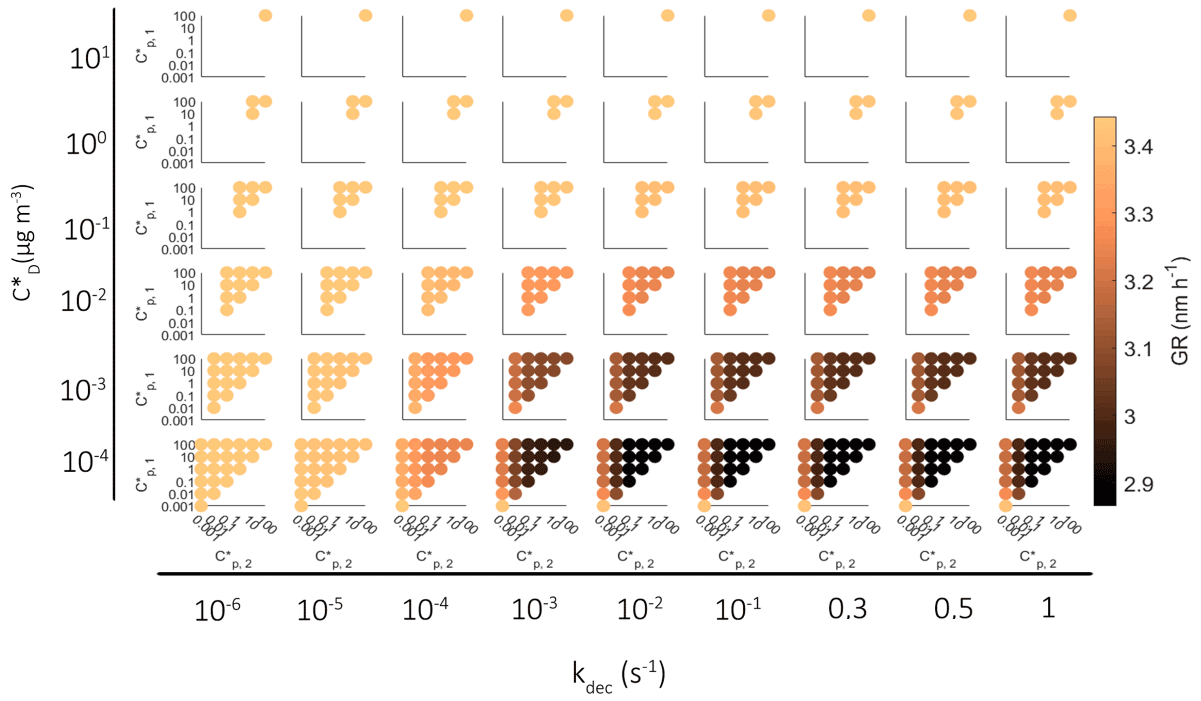
Figure 5Growth rate of the particle in simulations with a decomposition reaction for particles over 5 nm in diameter. Each dot describes one simulation, and the color shows the growth rate. Growth rates are calculated assuming linear growth curve. In smaller figures the axes describe saturation concentrations of compounds formed by decomposition. The wider horizontal axis describes the decomposition rate coefficient in the simulation and the vertical axis the saturation concentration of decomposing model components.
A clear result here is that the decomposition decreases the GR across the board. In more detail, with a small kdec ( s−1) the decomposition does not affect the growth since the rate of reactions is slow compared to the condensation mass flux, and therefore only a relatively small fraction of molecules react. The decomposition starts to have an impact if kdec is at least 10−4 s−1, and the impact is dependent on the volatilities of the decomposing compound and the product compounds. If the decomposing compound is one of the most volatile compounds in our setup, i.e., from the three most volatile bins with µg m−3, the effect of decomposition on GR is very small because of their low contribution to particle mass. Instead, if the decomposing component is from the least volatile bin ( µg m−3), the effect on GR is large even if the C* of the product compounds would be as low as 10−2 µg m−3. Note that the color scale in Fig. 4 extends in a much wider GR range than in Fig. 5 since the simulated effect of decomposition to the particle growth is much smaller than that of oligomerization.
In the main body of our study, we have concentrated on compounds that may contribute to the particle growth of an atmospheric particle even without going through particle-phase reactions. However, via oligomerization even higher-volatility compounds can contribute to the growth (Berkemeier et al., 2020). To demonstrate this effect, we conducted a few additional simulations, in which we increased the volatility (to 104 µg m−3) and gas-phase concentration (up to five-fold) of our highest volatility bin (originally µg m−3) and allowed this compound to react with itself forming less volatile oligomers. These simulations are presented in Fig. 6 along with reference simulations in which C* of the reacting compound was 102 µg m−3. The results suggest that even compounds with C* of 104 µg m−3 could affect the particle growth via oligomerization if their gas-phase concentration and oligomerization rate are high enough. For simulations presented in Fig. 6a–b, kolig was set to 10−12 cm3 s−1, i.e., fastest oligomerization rate constant in our simulations. These simulations show that with similar gas-phase concentrations, setting the C* of the most volatile compound to 104 µg m−3 instead of 102 µg m−3 decreases growth rate. However, already the doubling of gas-phase concentrations for the compounds with C* of 104 µg m−3 results in a faster growth due to the oligomerization compared to the initial case with the highest volatility bin of C* of 102 µg m−3. The assumption of higher-volatility compounds having higher gas-phase concentrations compared to less volatile compounds is reasonable based on atmospheric observations (Hunter et al., 2017). Figure 6c–d demonstrates the sensitivity of the contribution of the compounds with C* of 104 µg m−3 on kolig for the emphasized case with 2-fold concentration compared to the initial highest volatility bin of 102 µg m−3. Unlike with the 102 µg m−3 compounds, the enhancement of growth by the oligomerization of 104 µg m−3 compounds differs between the three highest tested kolig values (10−12–10−14 cm3 s−1) and is insignificant for cm3 s−1.
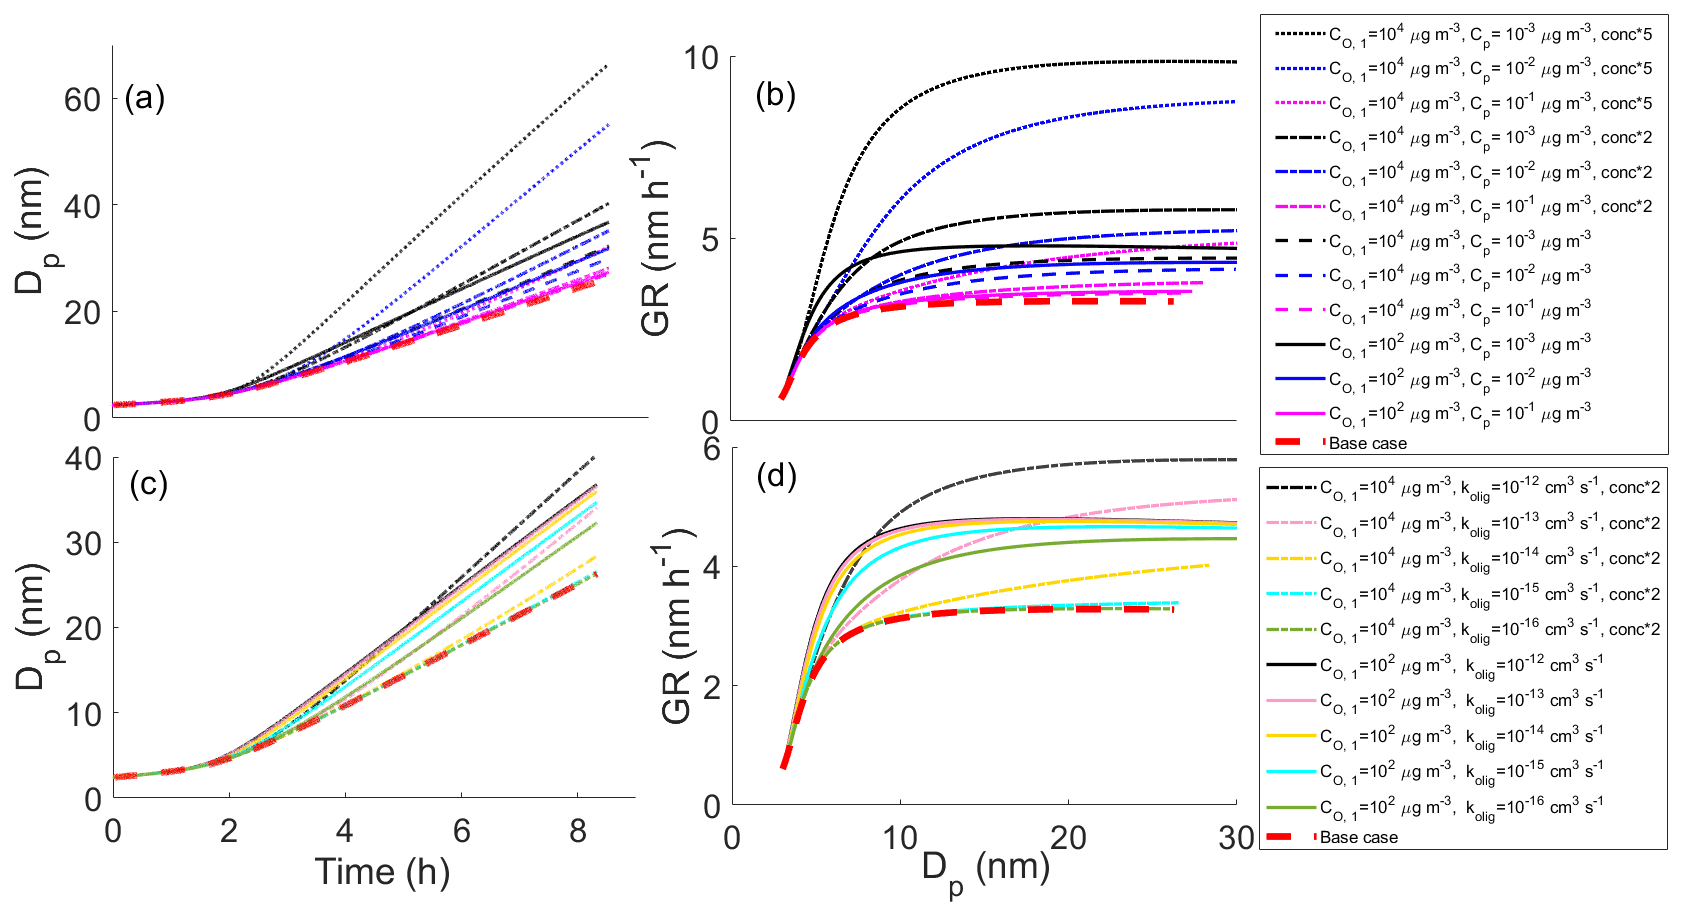
Figure 6Diameter of a particle (Dp) as a function of time (a, c) and growth rate (GR) of the particle as a function of diameter (b, d) in simulations in which we have altered the volatility and concentration of the highest volatility bin along with reference simulations. Panels (a) and (b) show the effect of gas-phase concentration and (c) and (d) the effect of the oligomerization rate coefficient. In each simulation, the highest volatility compound (C* either 102 or 104 µg m−3) reacts with itself forming a lower-volatility compound. In (a) and (b) kolig = 10−12 cm3 s−1 (similar to Fig. 2c–f). The base case simulation in each panel describes the simulation without oligomerization reactions.
In most of our simulations and in all the results presented this far, the oligomerization and decomposition reactions are assumed to be irreversible. In Fig. 7 we present a few cases for which we tested the effect of reversible reactions.
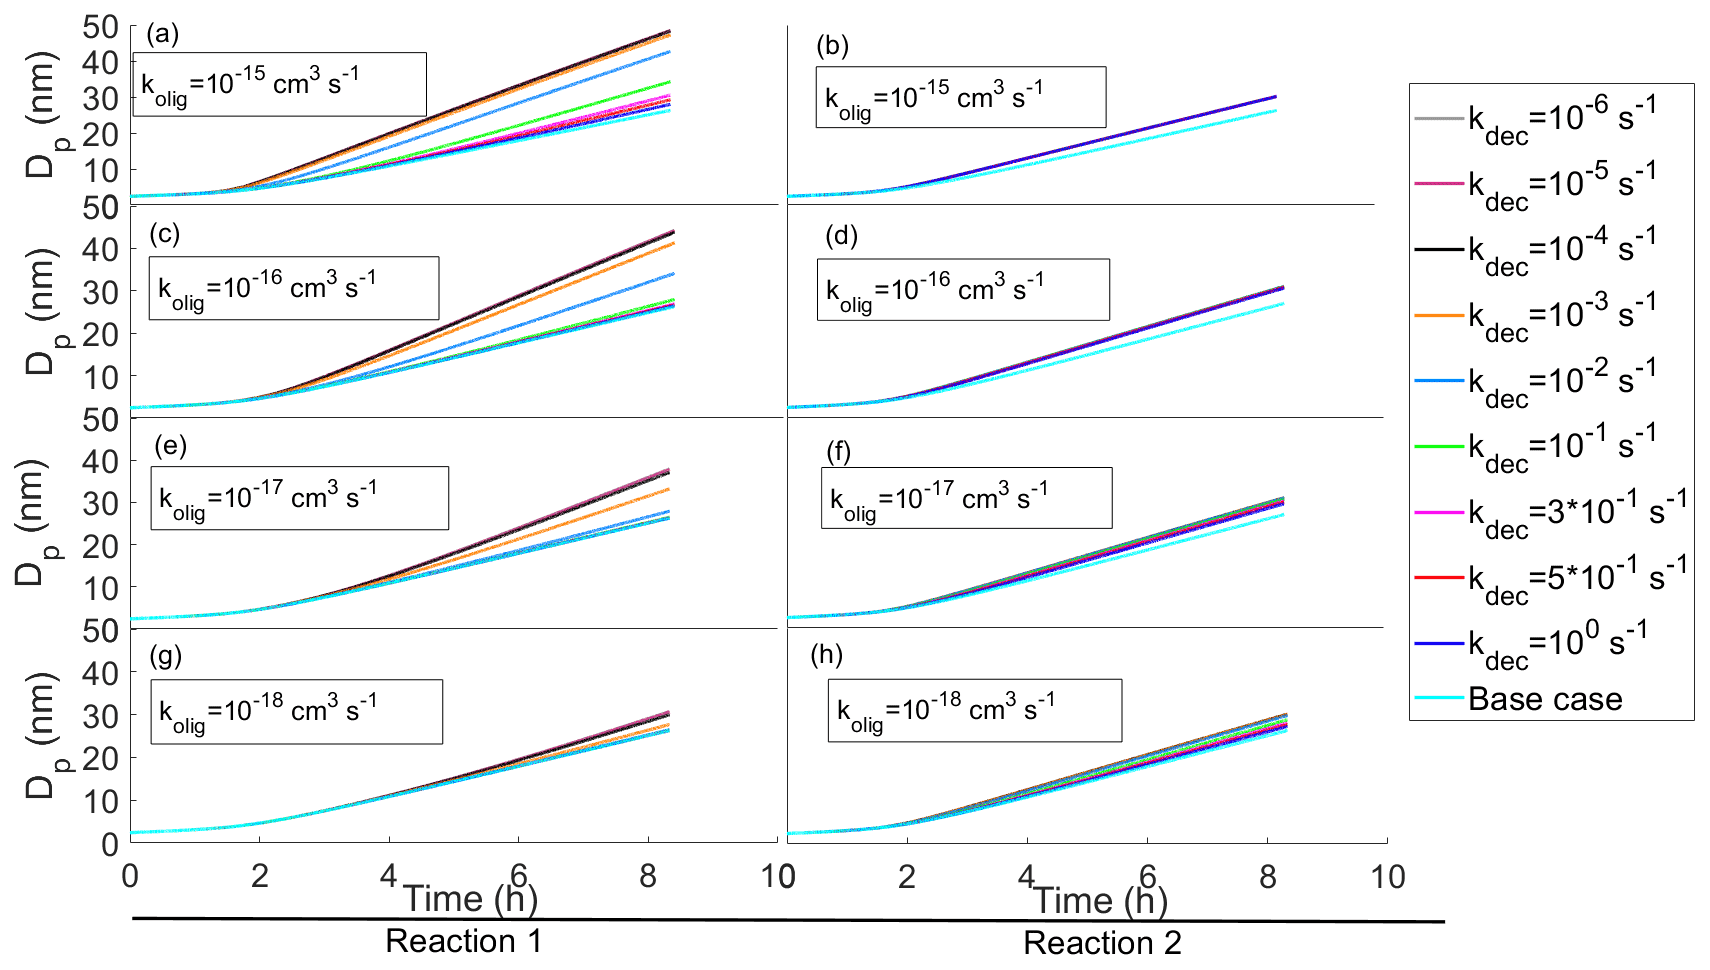
Figure 7Diameter of the particle as a function of time with reversible oligomerization reactions with different oligomerization and decomposition reaction rates. In each subplot simulations with the same oligomerization reaction rate and with different decomposition reaction rates are presented. The oligomerization reaction rates decrease when ascending with subplots. On the left column of panels (a, c, e, g) the simulations have a reaction in which two SVOCs from the two highest volatility bins ( and 101 µg m−3) form an ELVOC ( µg m−3), and on the right column of panels (b, d, f, h) the simulations have a reaction in which a SVOC and LVOC ( and 10−2 µg m−3) form an ELVOC ( µg m−3).
In panels (a), (c), (e) and (g) (Reaction 1 in Fig. 7) compounds from the two most volatile bins (1 and 2, and 101 µg m−3, respectively) form an ELVOC (bin 7, µg m−3), and in panels (b), (d), (f) and (h) (Reaction 2) compounds from bin 2 and 5 ( and 10−2 µg m−3) form a similar ELVOC as in the left-hand side reactions (bin 7, µg m−3). In both cases the oligomerization product can decompose into the initial compounds. In Reaction A the effect of oligomerization is large since without it the reacting compounds would contribute to the growth very little. In Reaction B the effect of oligomerization is smaller, for especially the low-volatile reacting compound would condense to the particle phase even without oligomerization. It is worth noting that the difference in gas-phase concentrations between higher- and lower-volatility bins also contributes to the extent that the oligomerization enhances the growth rate. In Reaction B the effect of reversibility is seen only with small values of oligomerization rate coefficients ( cm3 s−1), while in Reaction A the effect of different decomposition rate coefficients can be seen already with larger values of oligomerization rate coefficients ( cm3 s−1). In Reaction B the reversibility of the reaction has less effect on the growth because a lower-volatility reacting compound tends to stay in the particle phase and thus helps drive the oligomerization reaction.
3.2 Simulations based on measured gas-phase concentrations
Here we explore the thermodynamic parameters in the model and contrast the results to observations in an aerosol formation event observed at the Station for Measuring Ecosystem–Atmosphere Relations (SMEAR-II; Hari and Kulmala, 2005) in Hyytiälä, Finland. Nanoparticle growth after nucleation has been extensively studied at Hyytiälä, and nanoparticle GR is relatively well characterized there. At this location, GR values ranging from below 1 nm h−1 to several tens of nanometers per hour have been observed (Dal Maso et al., 2005; Yli-Juuti et al., 2011), average GR for 3–25 nm particles being 2.5 nm h−1 (Nieminen et al., 2014). While sub-20 nm particle composition measurements are missing, seasonal variation in GR with a maximum in summer indicates the importance of organic vapors with biogenic origin (Dal Maso et al., 2005; Yli-Juuti et al., 2011). The importance of organics is supported, e.g., by the positive correlation found between GR of 7–20 nm particles and monoterpene concentration (Yli-Juuti et al., 2011). Further, sulfuric acid condensation can explain only a small fraction of particle growth even down to the sub-3 nm size range (Nieminen et al., 2014; Yli-Juuti et al., 2016), and the composition observations of 20 nm particles indicate that organics would cover more than half of particle mass growth (Pennington et al., 2013). On the other hand, GR of particles has been observed to increase with particle size, and GR of sub-3 nm particles does not exhibit similar seasonal variation as GR of larger particles, which together suggests that there may be different factors affecting growth at different sizes (Yli-Juuti et al., 2011). A particle growth model constrained by observed gas-phase concentration of organics captures the observed growth rate fairly well without the need to assume particle-phase reactions (Mohr et al., 2019). However, due to uncertainties in gas-phase concentrations and properties of organics, the possibility of particle-phase reactions cannot be completely overruled. Ehn et al. (2007) compared ambient particle size distributions and those measured after heating to 280 ∘C in a thermodenuder for new particle formation events. They found that the growth rate of the non-volatile fraction of particles, observed as the size distribution behind a thermodenuder, was one fourth of the GR measured with a normal differential mobility particle sizer (DMPS). Based on a long-term volatility measurements, Häkkinen et al. (2012) found out that soot is not able to explain the residual in the particulate phase and speculated that oligomerization contributes to the non-volatile cores of nanoparticles growing in the boreal environment.
An evolution of aerosol number size distribution in Hyytiälä on 23 April 2014 and the geometric mean diameter of the nucleation mode are presented in Fig. 8. The geometric mean diameters of the nucleation mode were determined by fitting a multi-log-normal distribution function to the measured particle size distribution (Hussein et al., 2005). The observed growth rate was 1.7 nm h−1. In the subsequent simulations we explored the capability of the model and parameter selection to explain the observed aerosol growth in the boreal environment.

Figure 8Observed particle size distribution, geometric mean diameters of nucleation mode (DGM) and the model results on diameter of the particle as a function of time in simulations based on measured gas-phase concentrations. The base case simulation with no reactions is shown with the red line. The blue area shows the possible contribution of oligomerization to the growth, i.e., the envelope of the simulations in which oligomerization was allowed. The yellow area shows the possible contribution of decomposition to the growth, i.e., the envelope of the simulations in which decomposition was allowed. The measured particle size distribution is shown in the background. (a) Model simulations in which one-third of the VBS bin was allowed to react. (b) Model simulations in which the whole VBS bin was allowed to react.
Growth of the particle in simulations with measured gas-phase concentrations (Case 2) can be seen in Fig. 8a. The blue area envelopes simulation results with a oligomerization reaction, and the yellow area envelopes simulation results with a decomposition reaction. In the figure, the starting point of the simulations is set so that the base case simulation matches with the third fitted geometric mean diameter. Without oligomerization the growth in the model is slower than the observed growth (GR in the base case simulation 1.54 nm h−1, observed GR 1.7 nm h−1). When oligomerization is allowed in the model, it is possible to reach similar GR as observed. However, this can be achieved with multiple combinations of parameters, and therefore it would be challenging to try to estimate what kind of reactions take place in the growing particles by optimizing the model respect to the observed growth. For example, fitting growth rate can be achieved with simulations in which compounds from bin 3 and bin 7 form an ELVOC ( µg m−3) with an oligomerization rate coefficient of 10−21 cm3 s−1 and also with simulations in which two compounds from bin 1 form an LVOC ( µg m−3) with an oligomerization rate coefficient of 10−13 cm3 s−1. A similar problem has also been noted by Roldin et al. (2014) when analyzing particle evaporation in laboratory and by Trump and Donahue (2014) when comparing their model to the SOA formation measurements by Presto and Donahue (2006).
Uncertainties in saturation concentrations of organic compounds are another issue that makes it difficult to approximate which of the assumed oligomerization reactions would fit best with the observed growth. In this study, we used the parametrization of Li et al. (2016) to calculate the C* values based on molecular formula. Multiple other parametrizations have also been proposed (e.g., Donahue et al., 2011; Stolzenburg et al., 2018; Mohr et al., 2019), and these lead to somewhat different simulated growth rates (Mohr et al., 2019). It should be noted that while the observational data used here were part of the analysis in Mohr et al. (2019), a different C* parametrization was used there as the base case, and with that parameterization the growth was overestimated even without any particle-phase reactions. Overall, the C* values of organics can vary over several orders of magnitude between different calculation methods (Mohr et al., 2019). Therefore, the reaction that would produce the best fit between observed and simulated GR may vary from oligomerization to decomposition between the different C* parameterizations.
In the results presented so far, in each simulation one-third of a VBS bin was allowed to react. To see how this assumption affects model results, we made additional simulations in which we allowed all molecules of a bin to react. The growth of the particle in these simulations is presented in Fig. 8b. The possible contribution of oligomerization or decomposition reaction is remarkable. If only one-third of a bin was allowed to react, the growth rate of the particle was at maximum increased 71 % by oligomerization and decreased 26 % by decomposition, but if the whole bin reacted, the maximum increase was 138 % and decrease 80 %.
A wide range of model simulations were conducted to study the effect of particle-phase oligomerization and decomposition on the nanoparticle growth. Based on our model results, these reactions have potential to affect particle growth. However, the extent of the effect was strongly dependent on the assumed properties of the organics (volatilities of the initial and product compounds, reaction rate coefficients, and fraction of molecules that are reactive), and the sensitivity of particle growth on one property depended on the other properties. In the simulations constrained by observed gas-phase concentrations, the agreement between simulated and observed particle growth rate changed considerably when the assumptions of the organic properties were varied. However, simulated and observed growth rate can be brought to a good agreement with multiple combinations of assumptions of the properties which would make it challenging to try to estimate which combination describes the condensing organic properties best.
When considering the agreement between observation-constrained growth model simulations and observations of particle growth, uncertainties in gas-phase concentration measurements and in the estimation of the saturation vapor pressure of organics need to be considered. For example, the C* values vary over several orders of magnitude between different parametrizations (Mohr et al., 2019), and there are discrepancies in C* of organics based on different measurement techniques (Bilde et al., 2015). Mohr et al. (2019) estimated the uncertainty for gas-phase concentrations of organics, which were same as those used in our study, to be 53 % and considered an uncertainty of 2 orders of magnitude for saturation concentrations. In their model simulations these uncertainty limits lead to 46 % and 64 % increase and 41 % and 27 % decrease in growth rates for uncertainties in gas-phase concentrations and saturation vapor pressures, respectively. Compared to the 71 % increase by oligomerization and 26 % decrease by decomposition calculated in our study, if one-third of a bin is allowed to react, these effects are similar in magnitude, but if the whole bin is allowed to react, the effects by oligomerization and decomposition are greater.
Within uncertainties, it is possible to explain the detected atmospheric nanoparticle growth based on the observed gas-phase concentrations even without particle-phase oligomerization and decomposition, as shown by Mohr et al. (2019) and our base case simulation. Nevertheless, oligomers are found in abundance in SOA, and although some of it is oligomers condensed straight from the gas phase, it is presumable that also particle-phase oligomerization and decomposition occur, as has been shown by multiple studies (e.g., Zhao et al., 2005, 2006; Krizner et al., 2009; Wang et al., 2010). Hence, it remains open to what extent particle-phase reactions take place in nanoparticles and how much particle growth rate is affected by them. Our results suggest that including these processes in models that describe atmospheric particle dynamics may be required, however, as the simulated growth is sensitive to the assumptions of reactions and reaction rates, as well as investigations to determine the exact properties that are needed for this development to lead to a more accurate model representation of the nanoparticle growth.
It is evident that oligomerization, if taking place in particle phase, increases particle growth rate, making it easier for them to reach a large enough size to act as CCN. For instance, the survival probabilities of particles from 3 to 20 nm calculated by applying the method by Lehtinen et al. (2007) for the measured size distribution evolution of the NPF event presented in Fig. 8 were 15 %, 25 % and 44 %, respectively, when using the GR from the slowest-growing, the base case and the fastest-growing simulations among the ones in which one-third of a bin could react. The competition between growth and scavenging is of crucial importance when considering survival probability, especially at the smallest sizes as the coagulation sink decreases rapidly with growing particle size. On the other hand, due to the nano-Köhler effect the growth rate is also typically enhancing as a function of size (Kulmala et al., 2004). However, although a particle's ability to act as CCN is strongly dependent on size, that is not the only affecting factor as it depends also on particle hygroscopicity (Köhler, 1936; Giordano et al., 2015). Oligomerization decreases particle hygroscopicity (Xu et al., 2014), which raises a question of how these two effects – increase in growth rate and decrease in hygroscopicity – compare to each other considering cloud formation. This is an interesting and important topic of study for the future. In our simulations the molar fraction of oligomers was at maximum 18 % for simulations in which one-third of a bin was allowed to react and 27 % in simulations in which the whole bin was allowed to react. Further modeling studies are needed to simulate the parameter space in different environments and explore the competing processes in nanoparticle growth towards CCN sizes. These models require comprehensive aerosol- and gas-phase measurements to provide data to evaluate the performance of the models in different atmospheric environments.
The code for MODNAG are available at https://doi.org/10.5281/zenodo.5592258 (Heitto, 2021).
The data used in the study are published in Mohr et al. (2019, https://doi.org/10.1038/s41467-019-12473-2).
AH and TYJ designed the study, AH developed the code and conducted the simulations, FLH, JAT, TP and MK planned and performed the measurements, AH, KL and TYJ analyzed the results, and AH and TYJ prepared the manuscript with contribution from all co-authors.
The contact author has declared that neither they nor their co-authors have any competing interests.
Publisher’s note: Copernicus Publications remains neutral with regard to jurisdictional claims in published maps and institutional affiliations.
This work was supported by the Academy of Finland Center of Excellence Programme (grant no. 307331), the Academy of Finland Flagship funding (grants no. 337550 and 337549), the Academy of Finland (projects no. 1325656, 299544, 316114 and 325647), “Quantifying carbon sink, CarbonSink+ and their interaction with air quality” INAR project funded by the Jane and Aatos Erkko Foundation, and European Research Council (ERC) project ATM-GTP (Contract No. 742206). Technical and scientific staff in Hyytiälä Station are acknowledged. Joel A. Thornton and Felipe Lopez-Hilfiker were supported by grants from the US Department of Energy's Atmospheric System Research Program (DE-SC0011791 and DE-SC0021097).
This research has been supported by the Academy of Finland (grant nos. 307331, 337550, 337549, 1325656, 299544, 316114 and 325647), the Jane ja Aatos Erkon Säätiö (Quantifying carbon sink, CarbonSink+ and their interaction with air quality), the European Research Council, H2020 European Research Council (ATM-GTP (grant no. 742206)), and the US Department of Energy (grant nos. DE-SC0011791 and DE-SC0021097).
This paper was edited by Hang Su and reviewed by two anonymous referees.
Berkemeier, T., Takeuchi, M., Eris, G., and Ng, N. L.: Kinetic modeling of formation and evaporation of secondary organic aerosol from NO3 oxidation of pure and mixed monoterpenes, Atmos. Chem. Phys., 20, 15513–15535, https://doi.org/10.5194/acp-20-15513-2020, 2020.
Bilde, M., Barsanti, K., Booth, M., Cappa, C. D., Donahue, N. M., Emanuelsson, E. U., McFiggans, G., Krieger, U. K., Marcolli, C., Topping, D., Ziemann, P., Barley, M., Clegg, S., Dennis-Smither, B., Hallquist, M., Hallquist, A. M., Khlystov, A., Kulmala, M., Mogensen, D., Percival, C. J., Pope, F., Reid, J. P., Ribeiro da Silva, M. A. V., Rosenoern, T., Salo, K., Soonsin, V., Yli-Juuti, T., Prisle, N. L., Pagels, J., Rarey, J., Zardini, A. A., and Riipinen, I.: Saturation vapor pressures and transition enthalpies of low-volatility organic molecules of atmospheric relevance: from dicarboxylic acids to complex mixtures, Chem. Rev., 115, 4115–4156, 2015.
Boucher, O., Randall, D., Artaxo, P., Bretherton, C., Feingold, G., Forster, P., Kerminen, V.-M., Kondo, Y., Liao, H., Lohmann, U., Rasch, P., Satheesh, S. K., Sherwood, S., Stevens, B., and Zhang, X. Y.: Clouds and Aerosols, in: Climate Change 2013: The Physical Science Basis. Contribution of Working Group I to the Fifth Assessment Report of the Intergovernmental Panel on Climate Change, edited by: Stocker, T. F., Qin, D., Plattner, G.-K., Tignor, M., Allen, S. K., Boschung, J., Nauels, A., Xia, Y., Bex, V., and Midgley, P. M., Cambridge University Press, Cambridge, United Kingdom and New York, NY, USA, 2013.
D'Ambro, E. L., Schobesberger, S., Zaveri, R. A., Shilling, J. E., Hwan Lee, B., Lopez-Hilfiker, F. D., Mohr, C., and Thornton, J. A.: Isothermal Evaporation of α-Pinene Ozonolysis SOA: Volatility, Phase State, and Oligomeric Composition, ACS Earth Space Chem., 2, 1058–1067, 2018.
Dal Maso, M., Kulmala, M., Riipinen, I., Wagner, R., Hussein, T., Aalto, P. P., and Lehtinen, K. E. J.: Formation and growth of fresh atmospheric aerosols: eight years of aerosol size distribution data from SMEAR II, Hyytiälä, Finland, Boreal Environ. Res., 10, 323–336, 2005.
Denkenberger, K. A., Mofet, R. C., Holecek, J. C., Rebotier, T. P., and Prather, K. A.: Real-Time, Single-Particle Measurements of Oligomers in Aged Ambient Aerosol Particles, Environ. Sci. Technol., 41, 5439–5446, 2007.
Donahue, N. M., Epstein, S. A., Pandis, S. N., and Robinson, A. L.: A two-dimensional volatility basis set: 1. organic-aerosol mixing thermodynamics, Atmos. Chem. Phys., 11, 3303–3318, https://doi.org/10.5194/acp-11-3303-2011, 2011.
Donahue, N. M., Ortega, I. K., Chuang, W., Riipinen, I., Riccobono, F., Schobesberger, S., Dommen, J., Baltensperger, U., Kulmala, M., Worsnop, D. R., and Vehkamäki, H.: How do organic vapors contribute to new-particle formation?, Faraday Discuss., 165, 91–104, https://doi.org/10.1039/c3fd00046j, 2013.
Ehn, M., Petäjä, T., Aufmhoff, H., Aalto, P., Hämeri, K., Arnold, F., Laaksonen, A., and Kulmala, M.: Hygroscopic properties of ultrafine aerosol particles in the boreal forest: diurnal variation, solubility and the influence of sulfuric acid, Atmos. Chem. Phys., 7, 211–222, https://doi.org/10.5194/acp-7-211-2007, 2007.
Epstein, S. A., Riipinen, I., and Donahue, N. M.: A semiempirical correlation between enthalpy of vaporization and saturation concentration for organic aerosol, Environ. Sci. Technol., 44, 743–748, 2010.
Fuchs, N. A. and Sutugin, A. G.: Highly dispersed aerosols, Ann Arbor Science Publishers Inc., Ann Arbor London, 1970.
Gao, S., Keywood, M., Ng, N. L., Surratt, J., Varutbangkul, V., Bahreini, R., Flagan, R. C., and Seinfeld, J. H.: Low-Molecular-Weight and Oligomeric Components in Secondary Organic Aerosol from the Ozonolysis of Cycloalkenes and r-Pinene, J. Phys. Chem., 108, 10147–10164, 2004.
Giordano, M., Espinoza, C., and Asa-Awuku, A.: Experimentally measured morphology of biomass burning aerosol and its impacts on CCN ability, Atmos. Chem. Phys., 15, 1807–1821, https://doi.org/10.5194/acp-15-1807-2015, 2015.
Hall IV, W. A. and Johnston, M. V.: Oligomer Content of α-Pinene Secondary Organic Aerosol, Aerosol Sci. Tech., 45, 37–45, https://doi.org/10.1080/02786826.2010.517580, 2011.
Hall IV, W. A. and Johnston, M. V.: Oligomer Formation Pathways in Secondary Organic Aerosol from MS and MS/MS Measurements with High Mass Accuracy and Resolving Power, J. Am. Soc. Mass Spectr., 23, 1097–1108, https://doi.org/10.1007/s13361-012-0362-6, 2012.
Hallquist, M., Wenger, J. C., Baltensperger, U., Rudich, Y., Simpson, D., Claeys, M., Dommen, J., Donahue, N. M., George, C., Goldstein, A. H., Hamilton, J. F., Herrmann, H., Hoffmann, T., Iinuma, Y., Jang, M., Jenkin, M. E., Jimenez, J. L., Kiendler-Scharr, A., Maenhaut, W., McFiggans, G., Mentel, Th. F., Monod, A., Prévôt, A. S. H., Seinfeld, J. H., Surratt, J. D., Szmigielski, R., and Wildt, J.: The formation, properties and impact of secondary organic aerosol: current and emerging issues, Atmos. Chem. Phys., 9, 5155–5236, https://doi.org/10.5194/acp-9-5155-2009, 2009.
Hari, P. and Kulmala, M.: Station for measuring ecosystem-atmosphere relations (SMEAR II), Boreal Environ. Res., 10, 315–322, 2005.
Heaton, K. J., Dreyfus, M. A., Wang, S., and Johnston, M. V.: Oligomers in the early stage of biogenic secondary organic aerosol formation and growth, Environ. Sci. Technol., 41, 6129–6136, https://doi.org/10.1021/es070314n, 2007.
Häkkinen, S. A. K., Äijälä, M., Lehtipalo, K., Junninen, H., Backman, J., Virkkula, A., Nieminen, T., Vestenius, M., Hakola, H., Ehn, M., Worsnop, D. R., Kulmala, M., Petäjä, T., and Riipinen, I.: Long-term volatility measurements of submicron atmospheric aerosol in Hyytiälä, Finland, Atmos. Chem. Phys., 12, 10771–10786, https://doi.org/10.5194/acp-12-10771-2012, 2012.
Heitto, A.: MODNAG, first version (v1.0.0), Zenodo [code], https://doi.org/10.5281/zenodo.5592258, 2021.
Hunter, J. F., Day, D. A., Palm, B. B., Yatavelli, R. L. N., Chan, A. W. H., Kaser, L., Cappellin, L., Hayes, P. L., Cross, E. S., Carrasquillo, A. J., Campuzano-Jost, P., Stark, H., Zhao, Y., Hohaus, T., Smith, J. N., Hansel, A., Karl, T., Goldstein, A. H., Guenther, A., Worsnop, D. R., Thornton, J. A., Heald, C. L., Jimenez, J. L., and Kroll, J. H.: Comprehensive characterization of atmospheric organic carbon at a forested site, Nat. Geosci., 10, 748–753, https://doi.org/10.1038/ngeo3018, 2017.
Hussein, T., Dal Maso, M., Petäjä, T., Koponen, I. K., Paatero, P., Aalto, P. P., Hämeri, K., and Kulmala, M.: Evaluation of an automatic algorithm for fitting the particle number size distributions, Boreal Environ. Res., 10, 337–355, 2005.
Kerminen, V.-M., Paramonov, M., Anttila, T., Riipinen, I., Fountoukis, C., Korhonen, H., Asmi, E., Laakso, L., Lihavainen, H., Swietlicki, E., Svenningsson, B., Asmi, A., Pandis, S. N., Kulmala, M., and Petäjä, T.: Cloud condensation nuclei production associated with atmospheric nucleation: a synthesis based on existing literature and new results, Atmos. Chem. Phys., 12, 12037–12059, https://doi.org/10.5194/acp-12-12037-2012, 2012.
Köhler, H.: The nucleus in and the growth of hygroscopic droplets, Trans. Faraday Soc., 32, 1152–1161, 1936.
Kolesar, K. R., Chen, C., Johnson, D., and Cappa, C. D.: The influences of mass loading and rapid dilution of secondary organic aerosol on particle volatility, Atmos. Chem. Phys., 15, 9327–9343, https://doi.org/10.5194/acp-15-9327-2015, 2015.
Kourtchev, I., Giorio, C., Manninen, A., Wilson, E., Mahon, B., Aalto, J., Kajos, M., Venables, D., Ruuskanen, T., Levula, J., Loponen, M., Connors, S., Harris, N., Zhao, D., Kiendler-Scharr, A., Mentel, T., Rudich, Y., Hallquist, M., Doussin, J.-F., Maenhaut, W., Bäck, J., Petäjä, T., Wenger, J., Kulmala, M., and Kalberer, M.: Enhanced volatile organic compounds emissions and organic aerosol mass increase the oligomer content of atmospheric aerosols, Sci. Rep.-UK, 6, 35038, https://doi.org/10.1038/srep35038, 2016.
Krizner, H. E., De Haan, D. O., and Kua, J.: Thermodynamics and kinetics of methylglyoxal dimer formation: A computational study, J. Phys. Chem., 113, 6994–7001, 2009.
Kulmala, M., Laakso, L., Lehtinen, K. E. J., Riipinen, I., Dal Maso, M., Anttila, T., Kerminen, V.-M., Hõrrak, U., Vana, M., and Tammet, H.: Initial steps of aerosol growth, Atmos. Chem. Phys., 4, 2553–2560, https://doi.org/10.5194/acp-4-2553-2004, 2004.
Kulmala, M., Kontkanen, J., Junninen, H., Lehtipalo, K., Manninen, H. E., Nieminen, T., Petäjä, T., Sipilä, M., Schobesberger, S., Rantala, P., Franchin, A., Jokinen, T., Järvinen, E., Äijälä, M., Kangasluoma, J., Hakala, J., Aalto, P. P., Paasonen, P., Mikkilä, J., Vanhanen, J., Aalto, J., Hakola, H., Makkonen, U., Ruuskanen, T., Mauldin 3rd, R. L., Duplissy, J., Vehkamäki, H., Bäck, J., Kortelainen, A., Riipinen, I., Kurtén, T., Johnston, M. V., Smith, J. N., Ehn, M., Mentel, T. F., Lehtinen, K. E., Laaksonen, A., Kerminen, V.-M., and Worsnop, D. R.: Direct observations of atmospheric aerosol nucleation, Science, 339, 943–946, https://doi.org/10.1126/science.1227385, 2013.
Kulmala, M., Petäjä, T., Ehn, M., Thornton, J., Sipilä, M., Worsnop, D. R., and Kerminen, V.-M.: Chemistry of atmospheric nucleation: On the recent advances on precursor characterization and atmospheric cluster composition in connection with atmospheric new particle formation, Annu. Rev. Phys. Chem., 65, 21–37, https://doi.org/10.1146/annurev-physchem-040412-110014, 2014.
Lambe, A. T., Ahern, A. T., Wright, J. P., Croasdale, D. R., Davidovits, P., and Onasch, T. B.: Oxidative aging and cloud condensation nuclei activation of laboratory combustion soot, J. Aerosol Sci., 79, 31–39, https://doi.org/10.1016/j.jaerosci.2014.10.001, 2015
Lehtinen, K. E. J. and Kulmala, M.: A model for particle formation and growth in the atmosphere with molecular resolution in size, Atmos. Chem. Phys., 3, 251–257, https://doi.org/10.5194/acp-3-251-2003, 2003.
Lehtinen, K. E. J., Dal Maso, M., Kulmala, M., and Kerminen, V.-M.: Apparent nucleation rates: a revised formulation of the Kerminen-Kulmala equation, J. Aerosol Sci., 38, 988–994, 2007.
Li, Y., Pöschl, U., and Shiraiwa, M.: Molecular corridors and parameterizations of volatility in the chemical evolution of organic aerosols, Atmos. Chem. Phys., 16, 3327–3344, https://doi.org/10.5194/acp-16-3327-2016, 2016.
Li, Z., Tikkanen, O.-P., Buchholz, A., Hao, L., Kari, E., Yli-Juuti, T., and Virtanen, A.: Effect of Decreased Temperature on the Evaporation of α-Pinene Secondary Organic Aerosol Particles, ACS Earth Space Chem., 3, 2775–2785, https://doi.org/10.1021/acsearthspacechem.9b00240, 2019.
Merikanto, J., Spracklen, D. V., Mann, G. W., Pickering, S. J., and Carslaw, K. S.: Impact of nucleation on global CCN, Atmos. Chem. Phys., 9, 8601–8616, https://doi.org/10.5194/acp-9-8601-2009, 2009.
Mohr, C., Thornton, J. A., Heitto, A., Lopez-Hilfiker, F. D., Lutz, A., Riipinen, I., Hong, J., Donahue, N. M., Hallquist, M., Petäjä, T., Kulmala, M., and Yli-Juuti, T.: Molecular identification of organic vapors driving atmospheric nanoparticle growth, Nat. Commun., 10, 4442, https://doi.org/10.1038/s41467-019-12473-2, 2019.
Nieminen, T., Asmi, A., Dal Maso, M., Aalto, P. P., Keronen, P., Petäjä, T., Kulmala, M., and Kerminen, V.-M.: Trends in atmospheric new-particle formation: 16 years of observations in a boreal-forest environment, Boreal Environ. Res., 19, 191–214, 2014.
Paramonov, M., Kerminen, V.-M., Gysel, M., Aalto, P. P., Andreae, M. O., Asmi, E., Baltensperger, U., Bougiatioti, A., Brus, D., Frank, G. P., Good, N., Gunthe, S. S., Hao, L., Irwin, M., Jaatinen, A., Jurányi, Z., King, S. M., Kortelainen, A., Kristensson, A., Lihavainen, H., Kulmala, M., Lohmann, U., Martin, S. T., McFiggans, G., Mihalopoulos, N., Nenes, A., O'Dowd, C. D., Ovadnevaite, J., Petäjä, T., Pöschl, U., Roberts, G. C., Rose, D., Svenningsson, B., Swietlicki, E., Weingartner, E., Whitehead, J., Wiedensohler, A., Wittbom, C., and Sierau, B.: A synthesis of cloud condensation nuclei counter (CCNC) measurements within the EUCAARI network, Atmos. Chem. Phys., 15, 12211–12229, https://doi.org/10.5194/acp-15-12211-2015, 2015.
Pennington, M. R., Bzdek, B. R., DePalma, J. W., Smith, J. N., Kortelainen, A.-M., Hildebrandt Ruiz, L., Petäjä, T., Kulmala, M., Worsnop, D. R., and Johnston, M. V.: Identification and quantification of particle growth channels during new particle formation, Atmos. Chem. Phys., 13, 10215–10225, https://doi.org/10.5194/acp-13-10215-2013, 2013.
Pierce, J. R. and Adams, P. J.: Efficiency of cloud condensation nuclei formation from ultrafine particles, Atmos. Chem. Phys., 7, 1367–1379, https://doi.org/10.5194/acp-7-1367-2007, 2007.
Presto, A. A. and Donahue, N. M.: Investigation of alpha-pinene plus ozone secondary organic aerosol formation at low total aerosol mass, Environ. Sci. Technol., 40, 3536–3543, https://doi.org/10.1021/Es052203z, 2006.
Reddington, C. L., Carslaw, K. S., Stier, P., Schutgens, N., Coe, H., Liu, D., Allan, J., Browse, J., Pringle, K. J., Lee, L. A., Yoshioka, M., Johnson, J. S., Regayre, L. A., Spracklen, D. V., Mann, G. W., Clarke, A., Hermann, M., Henning, S., Wex, H., Kristensen, T. B., Leaitch, W. R., Pöschl, U., Rose, D., Andreae, M. O., Schmale, J., Kondo, Y., Oshima, N., Schwarz, J. P., Nenes, A., Anderson, B., Roberts, G. C., Snider, J. R., Leck, C., Quinn, P. K., Chi, X., Ding, A., Jimenez, J. L., and Zhang, Q.: The Global Aerosol Synthesis and Science Project (GASSP) Measurements and Modeling to Reduce Uncertainty, B. Am. Meteorol. Soc., 98, 1857–1877, 2017.
Renbaum-Wolff, L., Grayson, J. W., Bateman, A. P., Kuwata, M., Sellier, M., Murray, B. J., Shilling, J. E., Martin, S. T., and Bertram, A. K.: Viscosity of α-pinene secondary organic mate-rial and implications for particle growth and reactivity, P. Natl. Acad. Sci. USA, 110, 8014–8019, 2013.
Roldin, P., Eriksson, A. C., Nordin, E. Z., Hermansson, E., Mogensen, D., Rusanen, A., Boy, M., Swietlicki, E., Svenningsson, B., Zelenyuk, A., and Pagels, J.: Modelling non-equilibrium secondary organic aerosol formation and evaporation with the aerosol dynamics, gas- and particle-phase chemistry kinetic multilayer model ADCHAM, Atmos. Chem. Phys., 14, 7953–7993, https://doi.org/10.5194/acp-14-7953-2014, 2014.
Shiraiwa, M., Ammann, M., Koop, T., and Pöschl, U.: Gas uptake and chemical aging of semisolid organic aerosol particles, P. Natl. Acad. Sci. USA, 108, 11003–11008, https://doi.org/10.1073/pnas.1103045108, 2011.
Shrivastava, M., Cappa, C. D., Fan, J., Goldstein, A. H., Guenther, A. B., Jimenez, J. L., Kuang, C., Laskin, A., Martin, S. T., Ng, N. L., Pätäjä, T., Pierce, J. R., Rasch, P. J., Roldin, P., Seinfeld, J. H., Shilling, J., Smith, J. N., Thornton, J. A., Volkamer, R., Wang J., Worsnop, D. R., Zaveri, R. A., Zelemyuk, A., and Zhang, Q.: Recent advances in understanding secondary organic aerosol: Implications for global climate forcing, Rev. Geophys., 55, 509–559, 2017.
Stolzenburg, D., Fischer, L., Vogel, A., L., Heinritzi, M., Schervish, M., Simon, M., Wagner, A. C., Dada, L., Ahonen, L. R., Amorim, A., Baccarini, A., Bauer, P. S., Baumgartner, B., Bergen, A., Bianchi, F., Breitenlechner, M., Brilke, S., Buenrostro Mazon, S., Chen, D., DiasI, A., Draper, D. C., Duplissy, J., El Haddad, I., Finkenzeller, H., Frege, C., Fuchs, C., Garmash, O., Gordon, H., He, X., Helm, J., Hofbauer, V., Hoyle, C. R., Kim, C., Kirkby, J., Kontkanen, J., K ürten, A., Lampilahti, J., Lawler, M., Lehtipalo, K., Leiminger, M., Mai, H., Mathot, S., Mentler, B., Molteni, U., Nie, W., Nieminen, T., Nowak, J. B., Ojdanic, A., Onnela, A., Passananti, M., Petäjä, T., Qu él éver, L. L. J.,, Rissanen, M. P., Sarnela, N., Schallhart, S., Tauber, C., Tomé, A., Wagner, R., Wang, M., Weitz, L., Wimmer, D., Xiao, M., Yan, C., Ye, P., Zha, Q., Baltensperger, U., Curtius, J., Dommen, J., Flagan, R. C., Kulmala, M., Smith, J. N., Worsnop, D. R., Hansel, A., Donahue, N. M., and Winkler, P., M.: Rapid growth of organic aerosol nanoparticles over a wide tropospheric temperature range, P. Natl. Acad. Sci. USA, 115, 9122–9127, https://doi.org/10.1073/pnas.1807604115, 2018.
Tolocka, M. P., Jang, M., Ginter, J. M., Cox, F. J., Kamens, R. M., and Johnston, M. V.: Formation of Oligomers in Secondary Organic Aerosol, Environ. Sci. Technol., 38, 1428–1434, 2004.
Tritscher, T., Jurányi, Z., Martin, M., Chirico, R., Gysel, M., Heringa, M. F., DeCarlo, P. F., Sierau, B., Prévôt, A. S. H., Weingartner, E., and Baltensperger, U.: Changes of Hygroscopicity and Morphology During Ageing of Diesel Soot, Environ. Res. Lett., 6, 034026, https://doi.org/10.1088/1748-9326/6/3/034026, 2011.
Trump, E. R. and Donahue, N. M.: Oligomer formation within secondary organic aerosols: equilibrium and dynamic considerations, Atmos. Chem. Phys., 14, 3691–3701, https://doi.org/10.5194/acp-14-3691-2014, 2014.
Vesterinen, M., Lehtinen, K. E. J., Kulmala, M., and Laaksonen, A.: Effect of particle phase oligomer formation on aerosol growth, Atmos. Environ., 41, 1768–1776, 2007.
Virtanen, A., Joutsensaari, J., Koop, T., Kannosto, J., Yli-Pirilä, P., Leskinen, J., Mäkela, J. M., Holopainen, J. K., Pöschl, U., Kulmala, M., Worsnop, D. R., and Laaksonen, A.: An amorphous solid state of biogenic secondary organic aerosol particles, Nature, 467, 824–827, https://doi.org/10.1038/nature09455, 2010.
Wang, L., Khalizov, A. F., Zheng, J., Xu, W., Ma, Y., Lal, V., and Zhang, R.: Atmospheric nanoparticles formed from heterogeneous reactions of organics, Nat. Geosci., 3, 238–242, https://doi.org/10.1038/NGEO778, 2010.
Wehner, B., Petäjä, T., Boy, M., Engler, C., Birmili, W., Touch, T., Wiedensohler, A., and Kulmala, M.: The contribution of sulfuric acid and non-volatile compounds on the growth of freshly formed atmospheric aerosols, Geophys. Res. Lett., 32, L17810, https://doi.org/10.1029/2005GL023827, 2005.
Xu, W., Guo, S., Gomez-Hernandez, M., Zamora, M. L., Secrest, J., Marrero-Ortiz, W., Zhang, A. L., Collins, D. R., and Zhang, R.: Cloud forming potential of oligomers relevant to secondary organic aerosols, Geophys. Res. Lett., 41, 6538–6545, https://doi.org/10.1002/2014GL061040, 2014.
Yli-Juuti, T., Nieminen, T., Hirsikko, A., Aalto, P. P., Asmi, E., Hõrrak, U., Manninen, H. E., Patokoski, J., Dal Maso, M., Petäjä, T., Rinne, J., Kulmala, M., and Riipinen, I.: Growth rates of nucleation mode particles in Hyytiälä during 2003−2009: variation with particle size, season, data analysis method and ambient conditions, Atmos. Chem. Phys., 11, 12865–12886, https://doi.org/10.5194/acp-11-12865-2011, 2011.
Yli-Juuti, T., Barsanti, K., Hildebrandt Ruiz, L., Kieloaho, A.-J., Makkonen, U., Petäjä, T., Ruuskanen, T., Kulmala, M., and Riipinen, I.: Model for acid-base chemistry in nanoparticle growth (MABNAG), Atmos. Chem. Phys., 13, 12507–12524, https://doi.org/10.5194/acp-13-12507-2013, 2013.
Yli-Juuti, T., Tikkanen, O.-P., Manninen, H. E., Nieminen, T., and Kulmala, M.: Analysis of sub-3 nm particle growth in connection with sulfuric acid in a boreal forest, Boreal Environ. Res., 21, 287–298, 2016.
Yli-Juuti, T., Pajunoja, A., Tikkanen, O.-P., Buchholz, A., Faiola, C., Väisänen, O., Liqing, H., Kari, E., Peräkylä, O., Garmash, O., Shiraiwa, M., Ehn, M., Lehtinen, K., and Virtanen, A.: Factors controlling the evaporation of secondary organic aerosol from α-pinene ozonolysis. Geophys. Res. Lett., 44, 2562–2570, https://doi.org/10.1002/2016GL072364, 2017.
Yli-Juuti, T., Mohr, C., and Riipinen, I.: Open questions on atmospheric nanoparticle growth, Communications Chemistry, 3, 106, https://doi.org/10.1038/s42004-020-00339-4, 2020.
Zhang, R., Khalizov, A. F., Pagels, J., Zhang, D., Xue, H., and Mc-Murry, P. H.: Variability in morphology, hygroscopicity, and op-tical properties of soot aerosols during atmospheric processing, P. Natl. Acad. Sci. USA, 105, 10291–10296, https://doi.org/10.1073/pnas.0804860105, 2008.
Zhang, Y., Sanchez, M. S., Douet, C., Wang, Y., Bateman, A. P., Gong, Z., Kuwata, M., Renbaum-Wolff, L., Sato, B. B., Liu, P. F., Bertram, A. K., Geiger, F. M., and Martin, S. T.: Changing shapes and implied viscosities of suspended submicron particles, Atmos. Chem. Phys., 15, 7819–7829, https://doi.org/10.5194/acp-15-7819-2015, 2015.
Zhao, J., Levitt, N. P., and Zhang, R. Heterogeneous chemistry of octanal and 2,4-hexadienal with sulfuric acid, Geophys. Res. Lett., 32, L09802, https://doi.org/10.1029/2004GL022200, 2005.
Zhao, J., Levitt, N. P., Zhang, R., and Chen, J.: Heterogeneous reactions of methylglyoxal in acidic media: Implications for secondary organic aerosol formation, Environ. Sci. Technol., 40, 7682–7687, 2006.