the Creative Commons Attribution 4.0 License.
the Creative Commons Attribution 4.0 License.
 | 30 Nov 2022
The unexpected high frequency of nocturnal surface ozone enhancement events over China: characteristics and mechanisms
Cheng He
Haolin Wang
Haichao Wang
Yan Li
Guowen He
Yuanping He
Yurun Wang
Youlang Zhang
Yiming Liu
Qi Fan
Shaojia Fan
Surface ozone concentrations typically peak during the daytime, driven by active photochemical production, and decrease gradually after sunset, due to chemical destruction and dry deposition. Here, we report that nocturnal ozone enhancement (NOE, defined as an ozone increase of more than 5 ppbv h−1 in 1 of any 2 adjacent hours between 20:00 and 06:00 LT, local time) events are observed at multiple monitoring sites in China at a high frequency, which has not been recognized in previous studies. We present an overview of the general characteristics of NOE events in China and explore the possible mechanisms based on 6 years of observations from the national monitoring network. We find that the mean annual frequency of NOE events is 41±10 % (i.e., about 140 d would experience an NOE event per year) averaged over all 814 Chinese sites between 2014 and 2019, which is 46 % larger than that over Europe or the United States. The NOE event frequency is higher in industrialized city clusters (>50 %) than in regions with lighter ozone pollution, and it is higher in the warm season (46 %) than in the cold season (36 %), consistent with the spatiotemporal evolution of ozone levels. The mean ozone peak during NOE events reaches 37±6 ppbv in the warm season. The ozone enhancements are within 5–15 ppbv h−1 during 85 % of the NOE events; however, in about 10 % of cases, the ozone increases can exceed 20 ppbv h−1. We propose that high photochemistry-induced ozone during the daytime provides a rich ozone source in the nighttime residual layer, determining the overall high frequency of NOE events in China, and that enhanced atmospheric mixing then triggers NOE events by allowing the ozone-rich air in the residual layer to mix into the nighttime boundary layer. This is supported by our analyses which show that 70 % (65 %) of the NOE events are associated with increases in friction velocity (planetary boundary layer height), indicative of enhanced atmospheric mixing, and also supported by the observed sharp decreases in surface NO2 and CO concentrations with ozone increases in NOE events, a typical signal of mixing with air in the residual layer. Three case studies in Beijing and Guangzhou show that synoptic processes such as convective storms and low-level jets can lead to NOE events by aggravating vertical mixing. Horizontal transport of ozone-rich plumes may also be a supplementary driver of NOE events. Our results summarize, for the first time, the characteristics and mechanism of NOE events in China based on nationwide and long-term observations, and our findings emphasize the need for more direct measurements and modeling studies on the nighttime ozone evolution from the surface to the residual layer.
- Article
(16126 KB) - Full-text XML
-
Supplement
(2011 KB) - BibTeX
- EndNote


Surface layer ozone is a major air pollutant and controls the oxidation capacity of the atmospheric boundary layer. Ozone is mainly generated from the sunlight-driven photochemical reactions of nitrogen oxides (NOx, NO ± NO2), carbon monoxide (CO), and volatile organic compounds (VOCs) released from anthropogenic and natural sources at the surface (Sillman, 1995; Jacob, 2000; Monks et al., 2015). It is also transported downward from the upper troposphere or even stratosphere, with mesoscale dynamic processes triggering deep stratospheric incursions (Stohl et al., 2003; Škerlak et al., 2014; H. Wang et al., 2020). Surface layer ozone levels in polluted regions typically increase during the daytime, fostered by photochemical formation in the presence of solar radiation and emissions of precursors, and decrease gradually after sunset, due to chemical destruction (i.e., NOx titration) and dry deposition, shaping the well-established single daytime peak pattern of the ozone diurnal cycle (Lin et al., 2008; Strode et al., 2019). Here, we report that nocturnal ozone enhancement events are observed at multiple monitoring sites in China at a high frequency, which has not been recognized in previous studies.
Analyses of nocturnal ozone enhancement events and the associated ozone peaks have important implications for nocturnal atmospheric dynamics and chemistry as well as for ozone exposure with respect to human and vegetation health. Due to the lack of nighttime chemical sources, elevated nocturnal ozone levels are thought to be driven by enhanced transport or atmospheric mixing, which can be indicative of atmospheric dynamic processes such as the boundary layer low-level jets (Klein et al., 2014). The enhanced nighttime ozone then reshapes the ozone diurnal cycle and may increase daily integrated ozone exposure time of humans and vegetation, thereby threatening human health (Turner et al., 2016; Fleming et al., 2018) and crop yields (Yue et al., 2017; Lefohn et al., 2018; Feng et al., 2022; Li et al., 2022). Enhanced nocturnal ozone can also increase the oxidation capacity, by simulating nitrate radical formation (Wang et al., 2021), and promote the formation of secondary pollutants, such as particulate nitrate and secondary organic aerosols (Brown and Stutz, 2012; Huang et al., 2020). It can further affect the atmospheric chemistry of the following day (Millet et al., 2016; Caputi et al., 2019; Zhao et al., 2020). While long-term trends in the mean nighttime ozone level have been extensively studied as an important metric for assessing ozone air quality and emission changes (Cooper et al., 2012; Lu et al., 2020), the more episodic nocturnal ozone enhancement events have been underappreciated, despite their unusuality and important implications.
A number of studies have reported episodic nocturnal ozone enhancement events at individual sites around the world (Eliasson et al., 2003; Hu et al., 2012, 2013; Klein et al., 2014; Kulkarni et al., 2016; Caputi et al., 2019; Zhu et al., 2020; He et al., 2021). The reported nocturnal ozone enhancements mostly ranged from 5 to 30 ppbv, but they were found to be up to 70 ppbv in an extreme event observed in summer 2013 over the North China Plain (Jia et al., 2015). The mean nocturnal ozone peaks during these episodes may exceed 40 ppbv (Zhu et al., 2020), which is high enough to pose a threat to human and vegetation health. Previous studies have identified that the horizontal transport of ozone-rich air from polluted regions as well as enhanced turbulent mixing and vertical mixing, which can be triggered by synoptic processes such as convective storms and low-level jets, are the mechanisms driving nocturnal ozone enhancement (Reitebuch et al., 2000; Hu et al., 2013; Klein et al., 2014; Caputi et al., 2019). These studies, however, have focused on episodic cases at only one or a few sites and have been limited to timescales of days or months. A comprehensive view on general characteristics and mechanisms of nocturnal ozone enhancements based on multiyear and large-scale observation monitoring network is currently missing.
In this study, we examine the frequency, peak ozone values, magnitude, and trend of the nocturnal ozone enhancement (NOE) events over China, based on 6 years (2014–2019) of ozone observations from the nationwide monitoring network. We compare the frequency of NOE events in China with those in the United States (US) and Europe in the same period to demonstrate the higher frequency of NOE events over China compared with the other two regions, which has not been recognized in previous studies. We then explore the potential drivers of the NOE events over China by examining the evolution of nighttime chemical components and meteorological factors indicative of the atmospheric mixing ability in the NOE events. Our study provides the first overview of nocturnal ozone enhancement events in China, adding new insights into surface ozone evolution, and may have important implications for designing ozone regulation strategies.
2.1 Surface observations of ozone and air pollutants over China, Europe, and the US
The nationwide hourly observations of surface air pollutants (ozone, NO2, and CO) in mainland China are derived from the China National Environmental Monitoring Center (CNEMC) network and obtained from https://quotsoft.net/air (last access: 15 April 2022; X. L. Wang, 2020). This network for air pollution monitoring commenced operation in 74 key cities in 2013, and it rapidly expanded to more than 400 cities afterwards (Fig. S1 in the Supplement). The dataset has been applied in many studies for analyzing the diurnal cycle, season shifts, and interannual variations of ozone levels over Chinese cities (W.-N. Wang et al., 2017; Guo et al., 2019; Liu and Wang, 2020; Lu et al., 2020; Li et al., 2021). Here, we use the hourly data from 2014 to 2019 at 814 sites covering 74 cities with continuous ozone observations during the 6-year period (Fig. S1). The measurements are reported using Beijing time (UTC+8) in units of micrograms per cubic meter (µg m−3), and we transfer them to mixing ratios (ppbv) at local time (LT) based on the time zone of sites. We carry out data quality controls for observations of all pollutants to remove potential data outliers following Lu et al. (2018) and Jiang et al. (2021) (Supplement).
We additionally use hourly surface ozone observations from the US and Europe (EU) during the same 2014–2019 period for a global comparison of the frequency of nocturnal ozone enhancement events. Ozone observations at 762 sites over the US and 1880 sites over EU (Fig. S1) are obtained from the US Environmental Protection Agency (https://www.epa.gov/outdoor-air-quality-data, last access: 15 April 2022) and the European Environment Agency (https://discomap.eea.europa.eu/map/fme/AirQualityExport.htm, last access: 15 April 2022), respectively. We also convert the measurements to local time in units of mixing ratios (ppbv) and apply the same data quality control procedures to these observations as to the CNEMC observations.
2.2 Meteorological parameters and ozone from the ERA5 dataset
We apply three-dimensional fields of meteorological parameters, including temperature, relative humidity, and horizontal and vertical wind speed and direction on pressure levels, and two-dimensional fields of planetary boundary layer height and friction velocity from the ERA5 dataset, i.e., the fifth generation of the European Centre for Medium-Range Weather Forecasts (ECMWF) atmospheric reanalysis of the global climate (https://cds.climate.copernicus.eu/#!/home, last access: 15 April 2022). The ERA5 dataset combines observations of meteorological parameters across the world with model outputs, and it has been extensively evaluated with independent observations of key meteorological parameters in the troposphere (Hersbach et al., 2020). The three-dimensional ozone fields from the ERA5 dataset are also utilized for the analysis of ozone vertical transport. We use the ERA5 data with a horizontal resolution of , a vertical resolution of 25 hPa, and a temporal resolution of 1 h. We sample the ERA5 data at the grid of a monitoring site for site-level analyses.
2.3 Definition of a nocturnal ozone enhancement event and the related magnitude and nocturnal ozone peaks
Following the previous studies of Eliasson et al. (2003) and Zhu et al. (2020), we define a nocturnal ozone enhancement (NOE) event as an ozone increase of more than 5 ppbv h−1 ( ppb h−1) in 1 of any 2 adjacent hours in the nighttime period (between 20:00 and 06:00 LT, local time). We find that nocturnal values at Chinese sites generally follow a Gaussian distribution. For all hourly nocturnal values, ppb h−1 cases only account for 7.7 % of the dataset, indicating that this threshold should have effectively ruled out nocturnal ozone fluctuations that occur under normal atmospheric conditions (Fig. S2a). For the daily maximum nocturnal values only, the probability peaks in the range of 2–3 ppbv h−1, and the 5 ppbv h−1 threshold is found to be the approximate turning point that halves the probability distribution (Fig. S2b). Thus, we apply the ppb h−1 threshold in the NOE definition. We only define one NOE event if there is more than 1 h with ppb h−1 on a specific night, and observations with the maximum are used for statistical analyses. We also define the corresponding magnitude of an NOE event as the maximum ozone enhancement in the 2 adjacent hours during the nighttime period (maximum of ). The nocturnal ozone peak in an NOE event is defined as the maximum ozone concentration during the nighttime period. For comparison, we define a non-enhanced nocturnal ozone (NNOE) event as a maximum ozone enhancement of less than 1 ppbv (maximum of ppb h−1) in all adjacent 2 h periods during the night.
3.1 The frequency and magnitude of NOE events from 2014 to 2019
Figure 1a compares the annual frequency of NOE events over China, Europe, and the continental US averaged over 2014–2019. We estimate the frequency of NOE events to be 41±10 % (mean ± standard deviation, 814 sites) averaged for all Chinese sites in 2014–2019, with 140 sites showing a frequency of 50 % or higher. The annual frequency of NOE events over China is 46 % larger than that over Europe (28±12 %, 1880 sites) or the US (28±13 %, 762 sites), and this high frequency of NOE events has been largely unrecognized by existing ozone studies in China. Spatially, sites with a high frequency of NOE events (>50 %) are widely distributed across the industrialized regions of China, such as the North China Plain (NCP), the Yangtze River Delta (YRD), the Pearl River Delta (PRD), and the Sichuan Basin (SCB), and are also scattered in regions of western China, the Mediterranean, and the western US. These regions have been previously identified as hotspots of severe surface ozone pollution due to either high anthropogenic emissions of ozone precursors or natural background ozone (Zhang et al., 2014; T. Wang et al., 2017; Lu et al., 2018, 2021). As shown in Fig. 1b and c, the spatial pattern of NOE event frequencies is closely related to the afternoon (14:00–17:00 LT) ozone and nighttime Ox (O3+NO2) concentrations measured at the surface. This feature has important implications for understanding the mechanism of NOE events, which will be analyzed in Sect. 3.2.
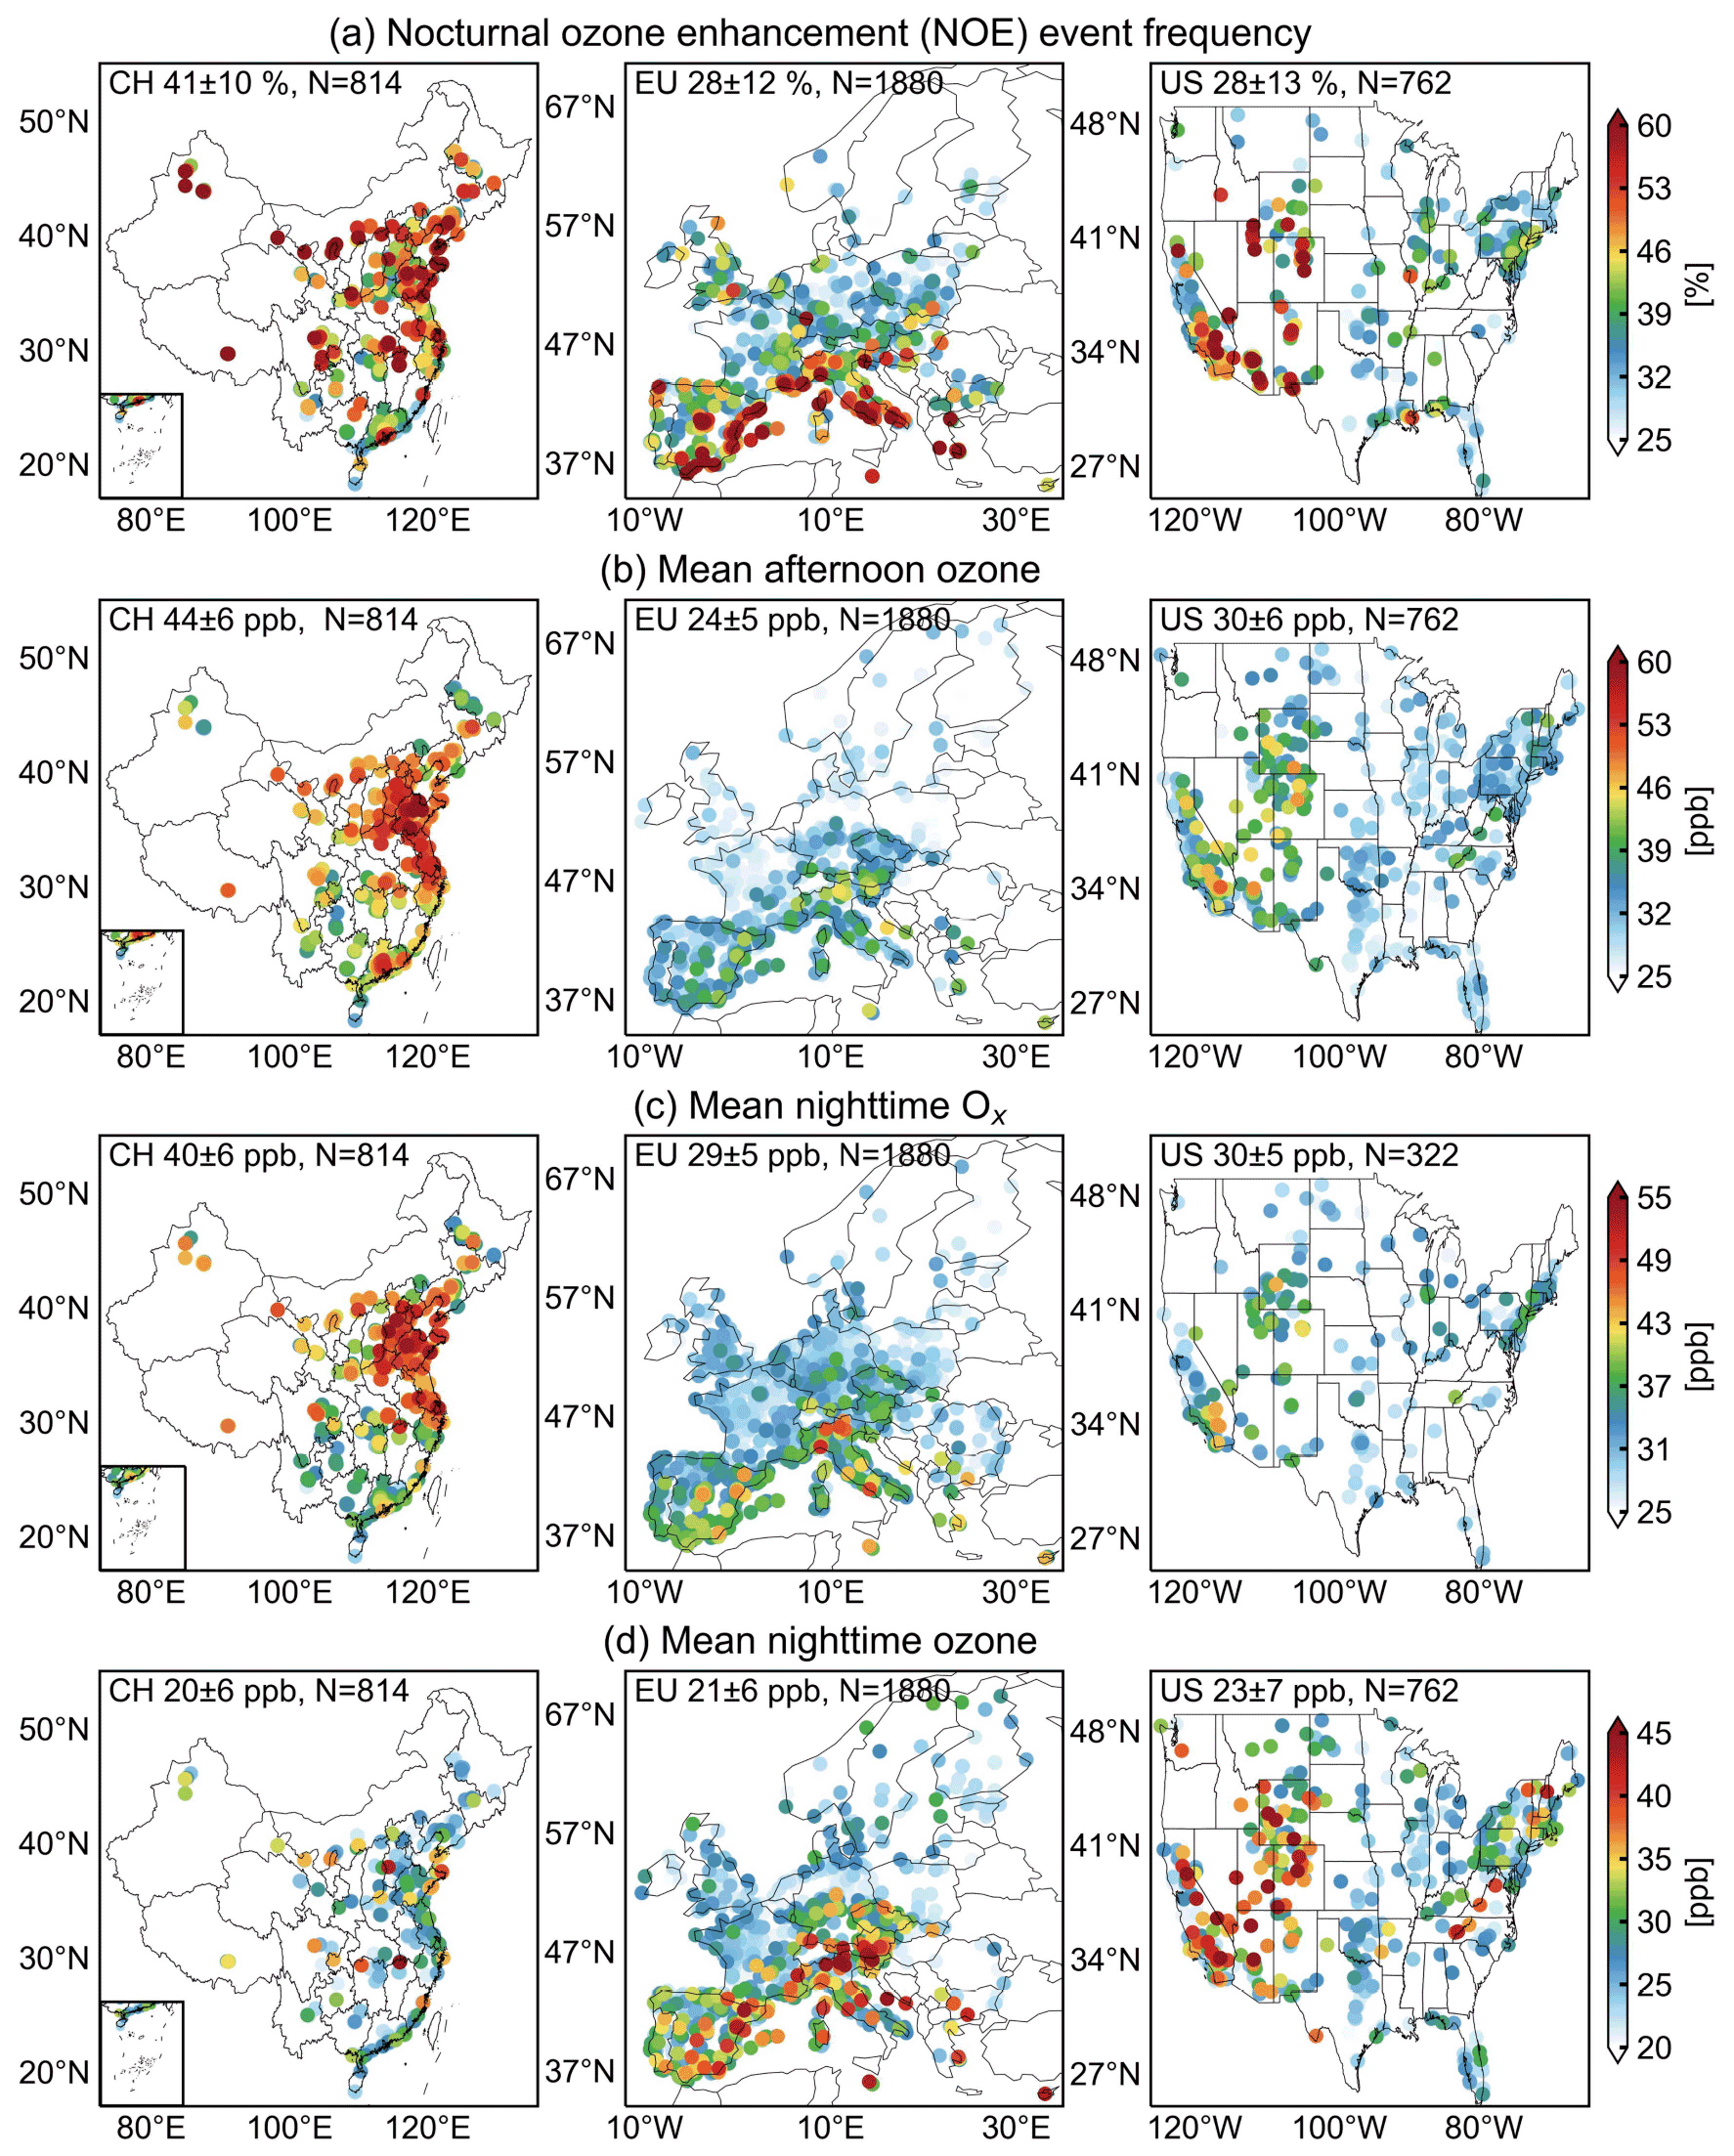
Figure 1Comparison of the annual frequency of nocturnal ozone enhancement (NOE) events, mean afternoon (14:00–17:00 LT) ozone, and mean nighttime (20:00–06:00 LT) ozone between China (CH), Europe (EU), and the United States (US), averaged over 2014–2019. Only sites with continuous measurements are included. The regional mean values and standard deviations among the N sites are shown inset at the top of each figure (mean ± standard deviation).
Figure 2 compares the frequency and nocturnal ozone peaks of NOE events in the warm (April–September) and cold (other months) seasons across the Chinese monitoring sites. We see notable seasonal shifts in the spatial distributions of NOE event frequencies, from 46±11 % averaged for all sites in the warm season to 36±10 % in the cold season. Regionally, the frequencies of NOE events are higher in the NCP during the warm season, whereas the frequencies are higher in the cold season in the PRD region (largely driven by October), although there are also large variabilities, even at adjacent sites. Sites in western China typically show high frequencies of NOE events throughout the year. These seasonal shifts in the NOE event frequency in different regions are also consistent with the seasonal evolution of ozone concentrations. Previous studies have documented the warm-season peak in ozone over the NCP, driven by the active photochemical formation of ozone in the presence of intensive anthropogenic emissions, and the autumn peak in ozone over the PRD, due to the influences of summer monsoon (Lu et al., 2018; Gao et al., 2020).
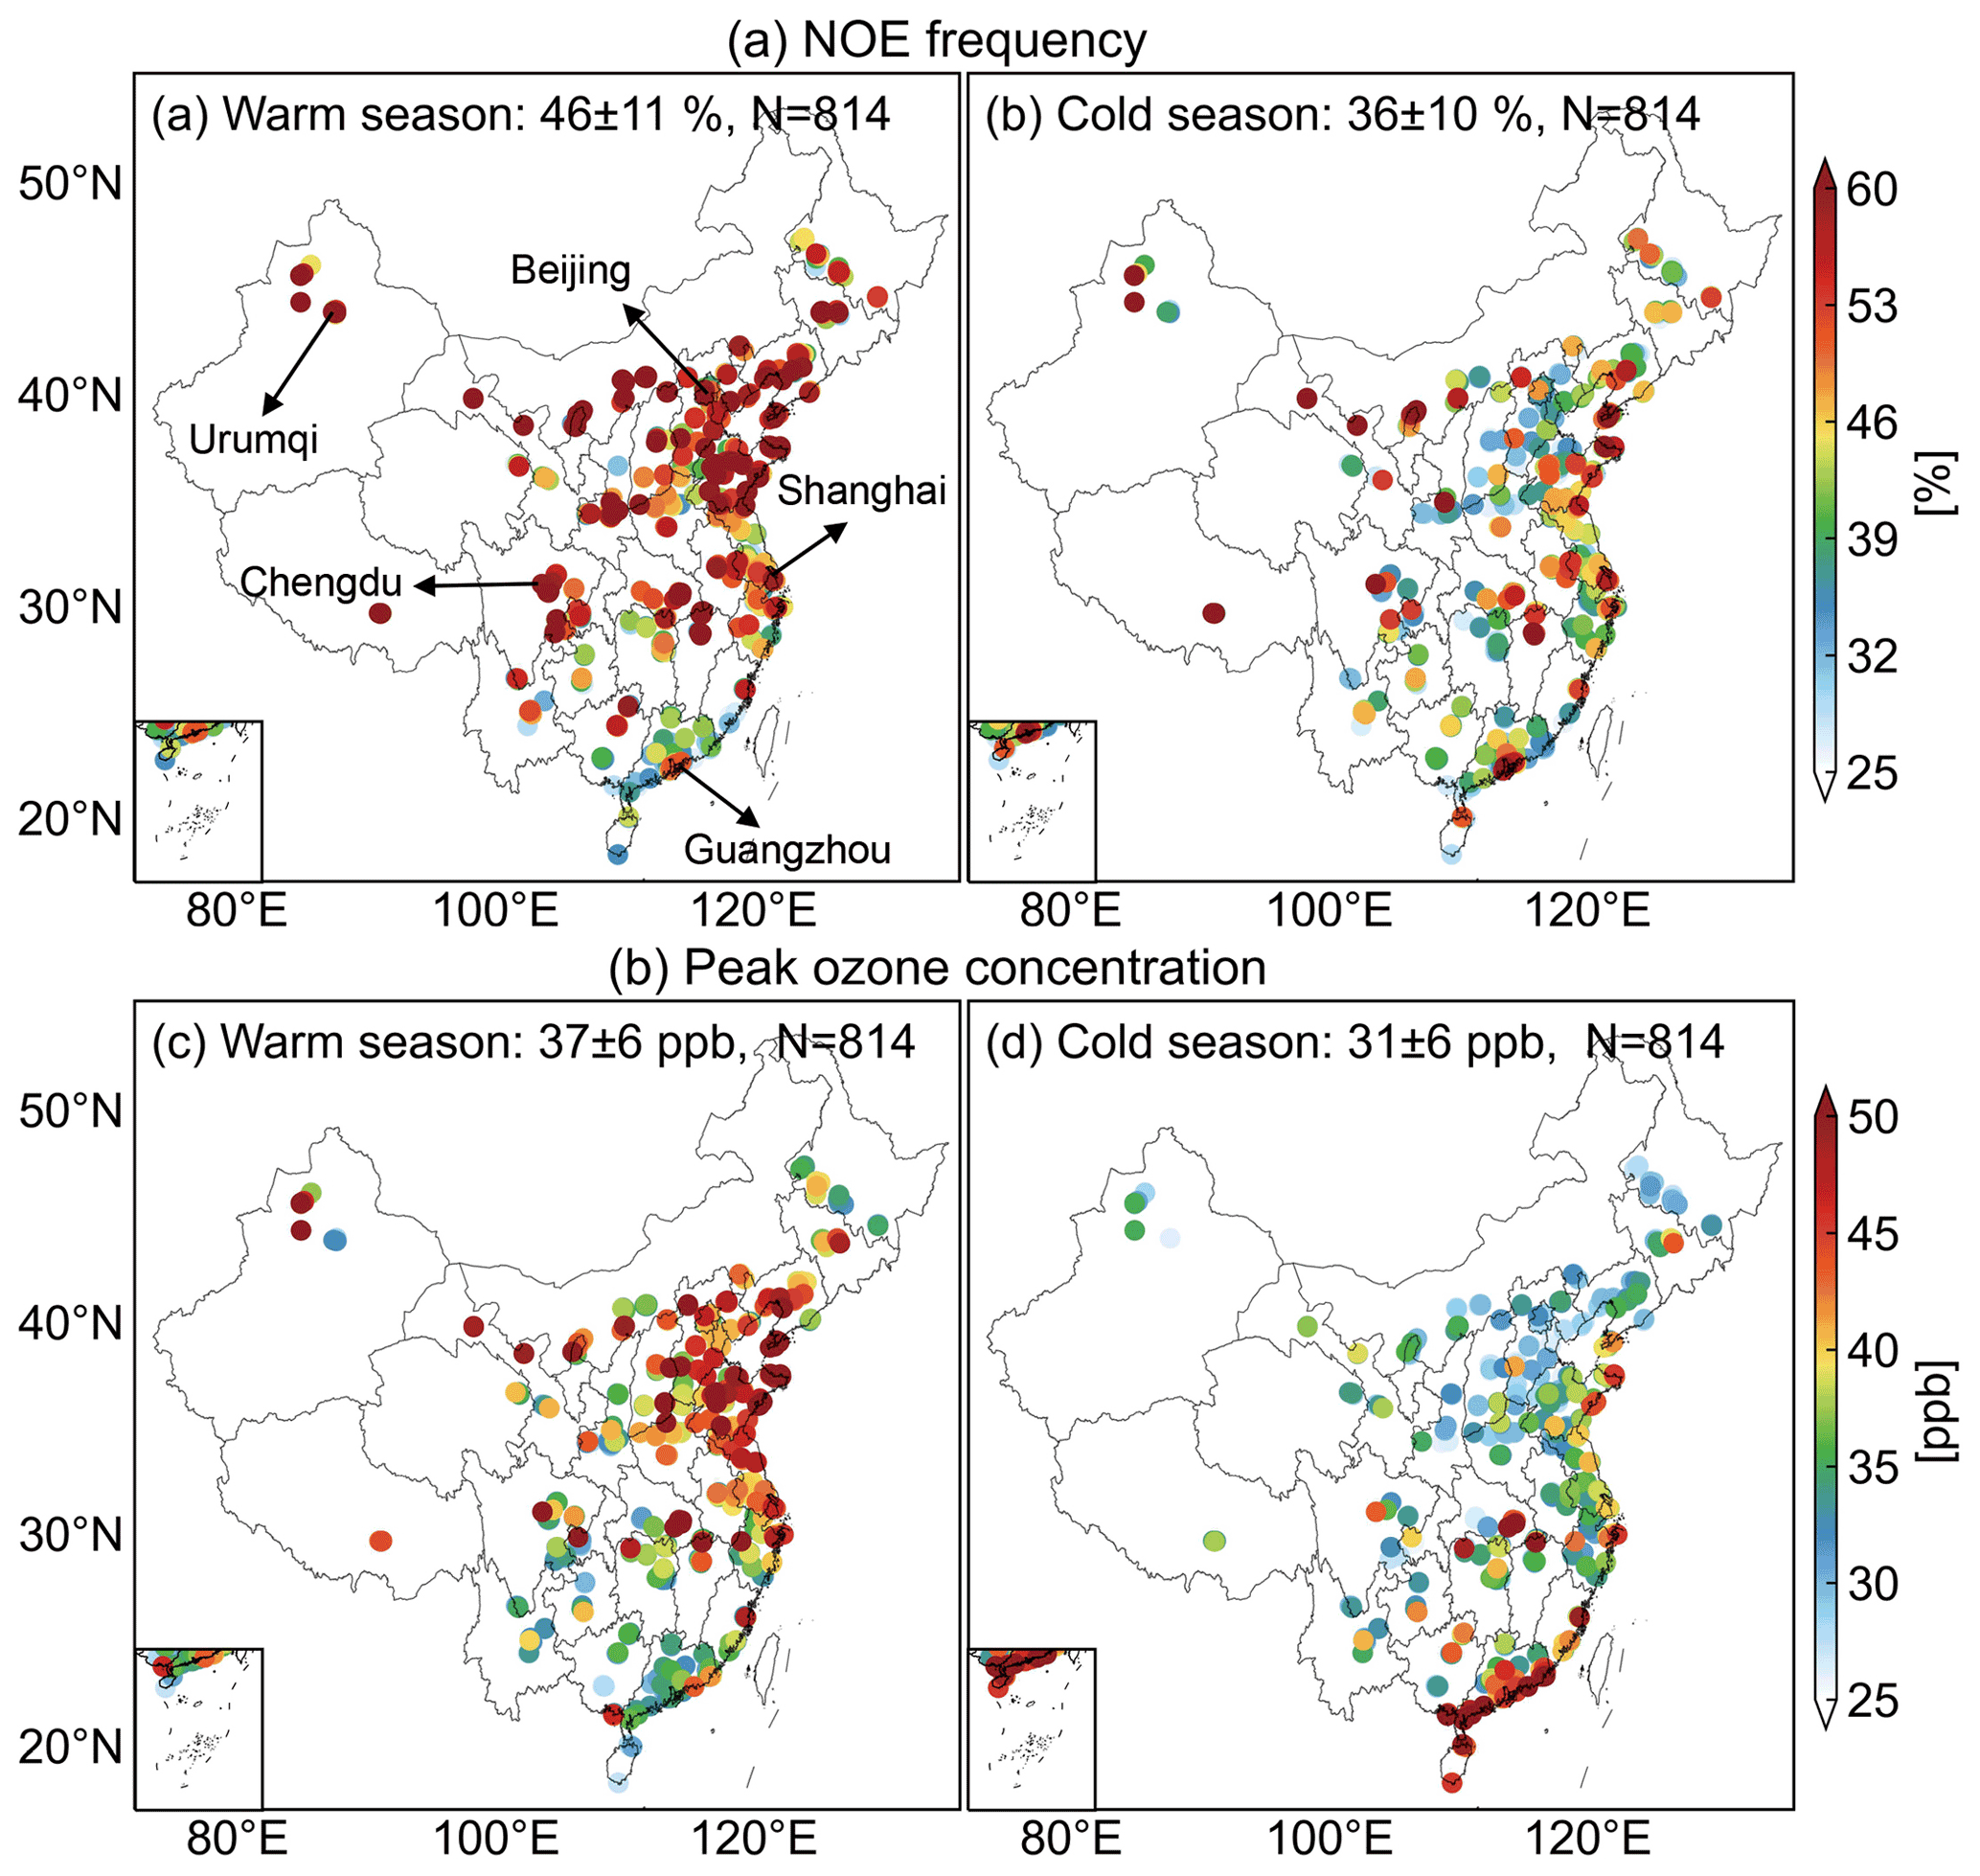
Figure 2Comparison of the NOE event frequency and nocturnal peak ozone concentrations between the (a, c) warm season (April–September) and (b, d) cold season (October–March) in China. The regional mean values and standard deviations among the N sites are shown inset at the top of each figure (mean ± standard deviation).
We then examine the peak ozone concentrations in the NOE events in Fig. 2 to quantify the influences of NOE events on nighttime ozone levels. The NOE-induced nocturnal ozone peaks are 37±6 and 31±6 ppbv averaged in the warm season and cold season, respectively, and are significantly higher than those during NNOE events (17±11 and 10±9 ppbv, respectively). High nocturnal peak ozone concentrations of more than 50 ppbv during NOE events are found over the NCP in the warm season. These ozone values can reach over 80 % of the corresponding daytime mean ozone concentrations and are sufficiently high compared with the threshold above which ozone exposures are expected to exert a negative effect on human health and vegetation growth (Lefohn et al., 2018). The mean nighttime peak ozone concentration during NOE events in Beijing is 40 ppbv in the warm season averaged over 2014 to 2019; this is comparable with the results of Zhu et al. (2020), who found a value of 68.1 µg m−3 (approximately 34 ppbv) averaged over May–September from 2014 to 2015. We also find that the peak ozone concentrations during NOE events show positive trends from 2014–2019 at more than 70 % sites (Fig. S3). This may also reflect the rapidly increasing nighttime ozone levels in China during this period, as reported in Lu et al. (2020).
Figure 3 presents the magnitude of the NOE events (i.e., the maximum during NOE events) over China in the warm season, quantifying the extent of ozone increases in the 2 adjacent hours during NOE events. We focus on the warm season here because it shows a significantly higher frequency of NOE events in most regions (Fig. 2). We find that about 85 % of the maximum ozone enhancements during NOE events are within 5–15 ppbv h−1; however, in about 10 % of the NOE events, ozone enhancement can exceed 20 ppbv h−1 within 1 h, which may significantly change the ozone diurnal cycle. The frequency of low ozone enhancement, in the range of 5 to 10 ppb h−1, during NOE events is higher in southern China than in northern China, but the pattern reverses for large NOE magnitudes, exceeding 10 ppb h−1, reflecting that NOE events may have larger influences on the ozone diurnal cycle in northern China (Fig. 3). We also find a significant positive correlation between the NOE frequency and magnitude across 814 Chinese sites (r=0.4, p value <0.01), indicating that sites with more frequent NOE events are more likely to experience larger nighttime ozone increase.
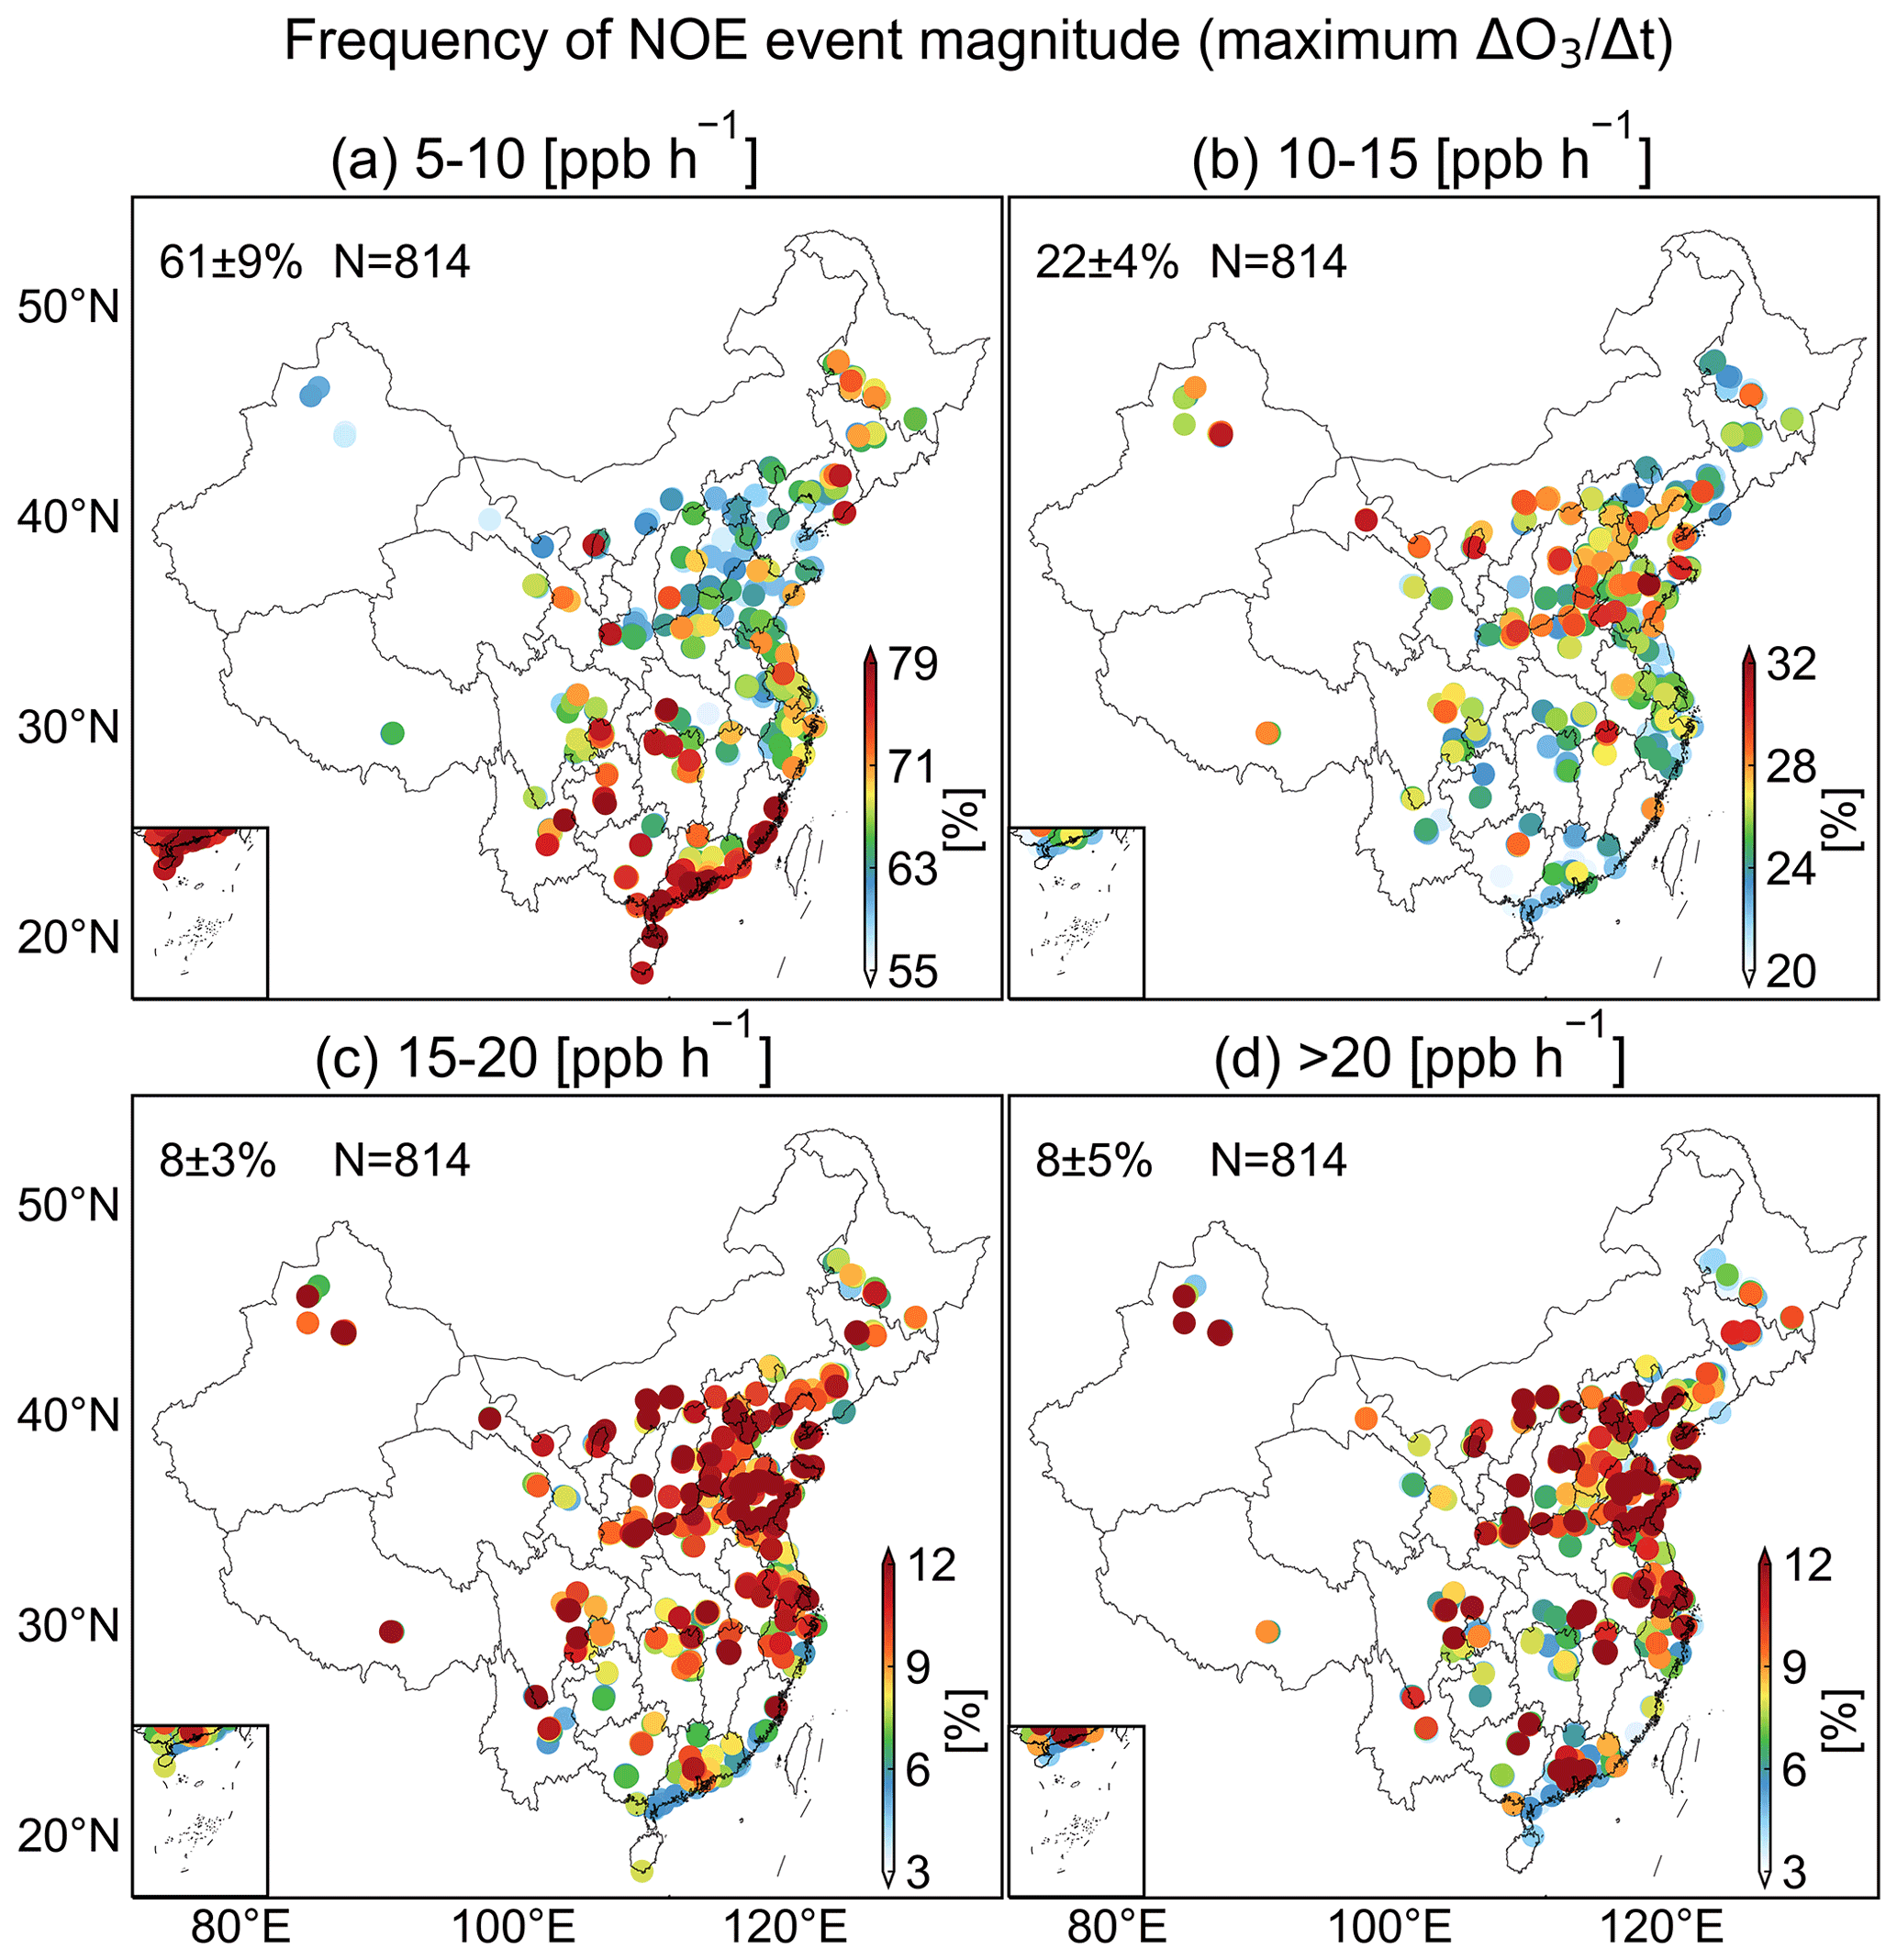
Figure 3The frequency of different magnitudes of NOE events (the maximum of in an NOE event) in the warm season in China. The regional mean values and standard deviations among the N sites are shown inset at the top of each figure (mean ± standard deviation).
Figure 4 shows the time distribution of NOE events (i.e., the hour when the maximal occurs) in the five key cities (Beijing, Shanghai, Guangzhou, Chengdu, and Ürümqi), which are representative of different regions in China (Fig. 2a), and compares the time series of ozone, NO2, and CO during NOE events with those during NNOE events. Each city contains a number of monitoring sites, and we average the data across the sites within the city to represent ozone at the city level. We identify between 211 and 419 NOE events for the five cities in the warm season during the 2014–2019 period, corresponding to a frequency of between 19 % and 38 %, and between 66 and 314 NNOE events, corresponding to a frequency of between 6 % and 29 %. The estimated NOE frequency at the city level based on the site-average ozone values is lower than that at the site level, as the occurrence time of NOE events may vary at different sites.
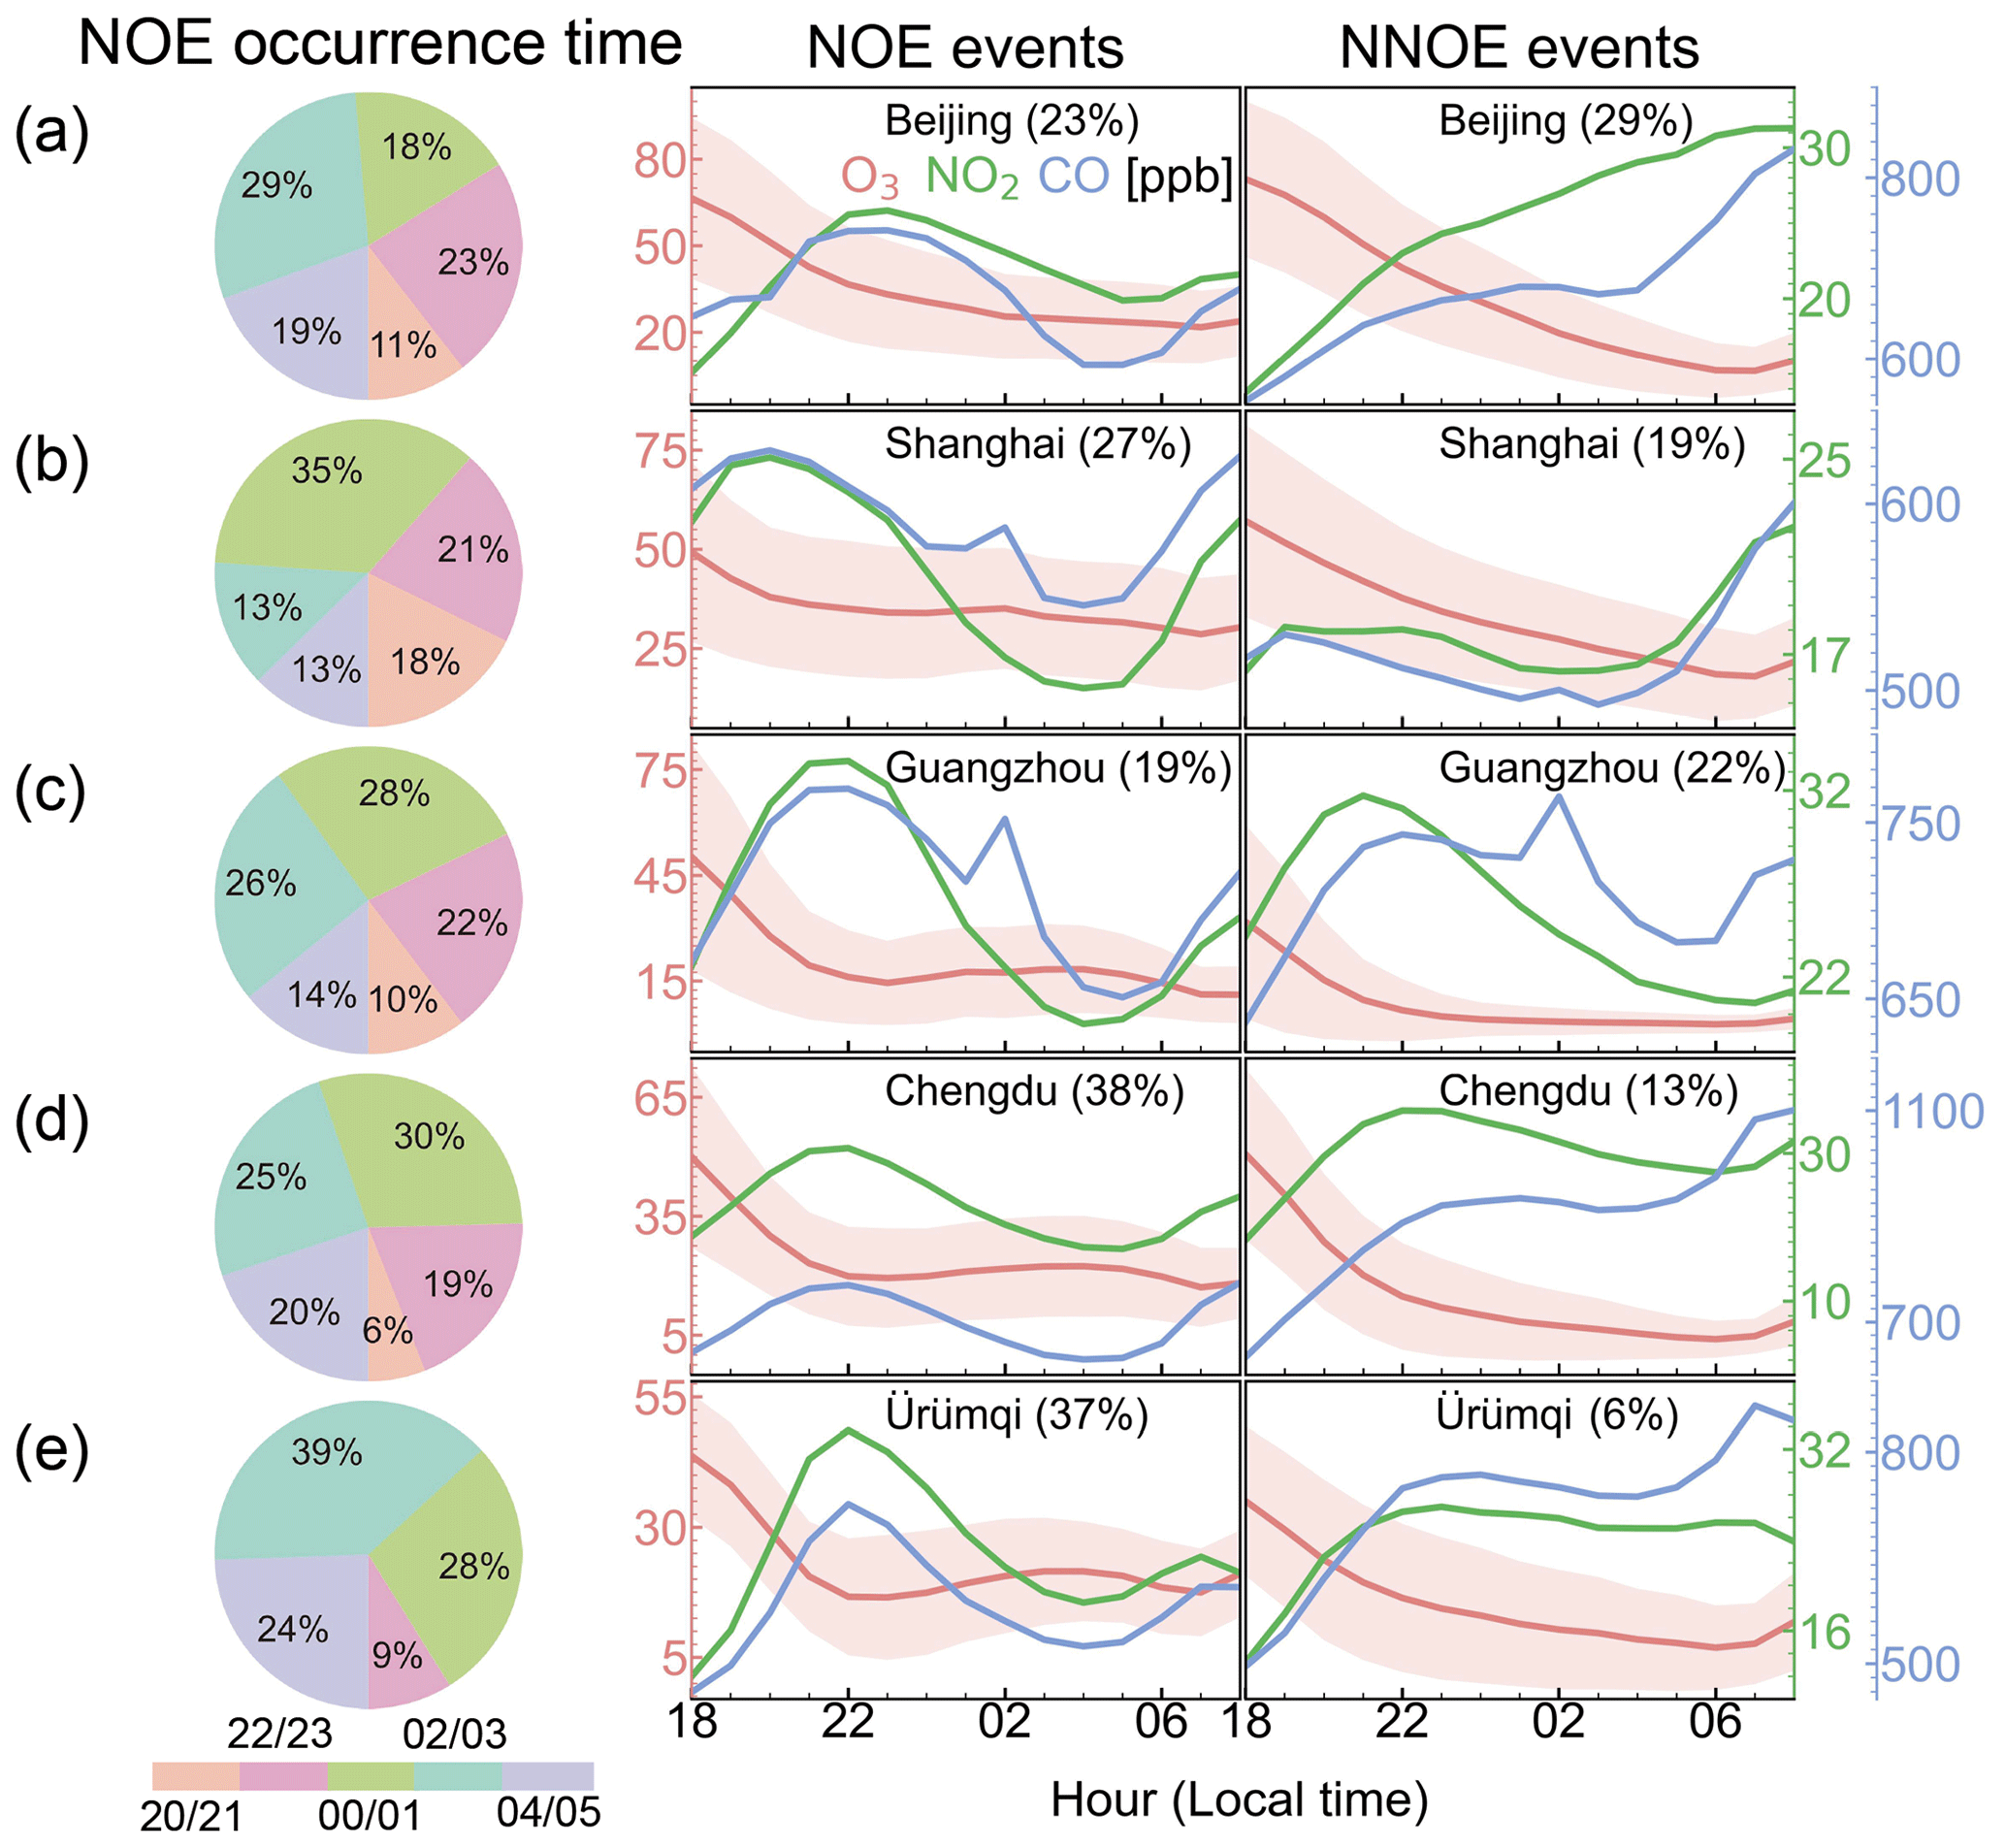
Figure 4Comparison of the temporal variation in nocturnal air pollutants (ozone, NO2, and CO) between the NOE and the NNOE events in the warm season in five typical cities (Beijing, Shanghai, Guangzhou, Chengdu, and Ürümqi). Each city contains a number of monitoring sites, and we average the data across the sites within the city to represent ozone at the city level. The numbers in parentheses represent the frequency of NOE and NNOE events in the city. The estimated NOE frequency at the city level based on the site-average ozone values is lower than that at the site level, as the occurrence time of NOE events may vary at different sites. Note that the axis range for different cities varies. The pie charts show the frequency of the occurrence time of the NOE events, defined as the time with maximum ( in each NOE event.
We find that the timing of NOE event occurrence shows different patterns in these five cities; however, all cities consistently show a small fraction of NOE event occurrence during the early night (20:00–21:00 LT). This is reasonable because the decreasing rate of ozone is fast during the early night, due to rapid chemical loss via NOx titration (, , ) when emissions are still active and NO levels are high, as evident from the sharp increase in NO2 when ozone decreases during the early night. The rate of ozone decrease (and rate of NO2 increase) then slows down with reduced NO levels. In Beijing, the timing of NOE events is diversely distributed between 00:00 and 06:00 LT with a frequency ranging from 18 % to 29 %, resulting in a flat ozone change when averaging the ozone time series for all NOE events (Fig. 4a). In Shanghai, Guangzhou, Chengdu, and Ürümqi, a slightly larger fraction of NOE events occurs between 00:00 and 03:00 LT, shaping the peak ozone values at around 03:00 LT on average, but the timing of NOE events is generally widely distributed over the night (Fig. 4b, c, d, e). The wide distribution of NOE event timing indicates that NOE events are more likely driven by episodic synoptic process than by anthropogenic-driven factors, which would otherwise show a clearer temporal pattern.
Figure 4 illustrates that the occurrence of NOE events changes the ozone diurnal cycle and leads to a secondary ozone peak at night. It also reveals distinct differences in the temporal evolution of NO2 and CO between the NOE and NNOE events. NO2 and CO typically show increases during the early night because of the shrinking planetary boundary layer, continuous nighttime emissions, and titration (for NO2 only), and they peak in most cities at around 22:00 LT. The concentration of both species decreases afterwards, due to the combined effect of chemical destruction (, ), mixing, and deposition, although a midnight peak in CO at around 02:00 LT that may be linked to regional heavy-vehicle traffic is observed in Shanghai and Guangzhou. In particular, we find that NO2 and CO concentrations decrease at a much faster rate from 22:00 to 05:00 LT during NOE events, compared with those during NNOE events. This feature has important implications for understanding the potential driver of NOE events, as will be discussed in Sect. 3.2.
3.2 Frequent NOE events associated with high ozone in the nighttime residual layer and enhanced vertical mixing
Section 3.1 provides an overview of the general characteristics of NOE events over China, including the spatial and seasonal distributions of NOE event frequencies, peak ozone values, and magnitudes, on the basis of 6 years of nationwide observations. We now examine the factors that determine the overall pattern of NOE event frequencies, as displayed in Fig. 1a, and trigger the occurrence of NOE events in order to explain the evolution of ozone, NO2, and CO, as shown in Fig. 4. Section 3.3 will present typical episodic NOE events as case studies.
Nighttime ozone decreases are due to the combined effect of net chemical loss, as a result of null photochemical ozone production in the absence of sunlight and ozone depletion by the NOx titration effect, and continued ozone dry deposition to the surface. Reduced ozone loss due to weakening of the titration effect and deposition can slow down the nighttime ozone rate of decrease but would not increase ozone. Thus, the enhancement of nighttime ozone at a given location requires an external ozone source, either via horizontal transport from adjacent regions with high ozone levels or through vertical transport/mixing of ozone-rich air to the surface. Sharper decreases in the NO2 and CO concentrations during NOE events compared with NNOE events, as shown in Fig. 4, suggest that vertical mixing of air above the surface layer with typically low NO2 and CO levels is a prioritized candidate. This motivates us to examine the following:
-
whether the regions with a high frequency of NOE events, as shown in Fig. 1a, are associated with high concentration of nighttime ozone in the residual layer (the region remaining between the stable nocturnal boundary layer at surface and the free atmosphere), and
-
whether atmospheric mixing, which allows the mixing of high-concentration ozone in the residual layer to the surface, is more active during NOE events compared with NNOE events.
However, examining the first factor is particularly challenging due to the extreme sparsity of direct ozone measurements of the nighttime residual layer.
Here, we propose the use of surface ozone averaged over the afternoon (14:00–17:00 LT) as an indicator of the ozone level in the nighttime residual layer at a given site. This is because, under typical fair-weather conditions, surface ozone is expected to be mixed into the well-developed mixing boundary layer by active atmospheric turbulence in the afternoon. With the sunset, the turbulent mixing in the boundary layer weakens in the absence of solar heating, and the consequent radiative cooling of the ground surface throughout the night forms a stable nocturnal boundary layer with a typical depth of 100–500 m above the surface. The erstwhile mixing layer from the daytime, overlying the nighttime boundary layer, is known as the residual layer. This latter layer serves as a reservoir for ozone, in which ozone is not effectively titrated nor deposited; therefore, the ozone before sunset largely remains in the nighttime residual layer (Caputi et al., 2019). Using the afternoon ozone to indicate the ozone level in the nighttime residual layer neglects the impact of external transport of ozone to the residual layer; thus, we suggest that this method makes more sense when the analyses are conducted based on an ensemble of 6 years of observations. Using this technique, we propose that the assessment of ozone in nighttime residual layer at thousands of sites is achievable, as direct measurement of ozone vertical profile is rather sparse. Similarly we may use the surface nighttime Ox (O3+NO2) concentration as an indicator of ozone in the nighttime residual layer (Kleinman et al., 2002; Wang et al., 2018; Tan et al., 2021), assuming that nighttime titration is much stronger than the effect of deposition and regional transport.
Figures 1b and c present the mean afternoon ozone and nighttime Ox concentrations over China, Europe, and the US. Comparison of Fig. 1a with Fig. 1b or c reveals that the spatial pattern of NOE event frequencies, afternoon ozone level, and nighttime Ox level (the latter two of which are both indicative of ozone in the nighttime residual level) are largely consistent. In particular, sites over China, the Mediterranean, and the mountainous western US that record frequent NOE events also consistently observe a high afternoon ozone level or nighttime Ox level. Figure 5 further shows that the NOE frequency at Chinese sites increases with a rising mean afternoon ozone level or nighttime Ox level and is 10 % (18 %) higher when the afternoon ozone levels (nighttime Ox level) exceed 50 ppb, compared with when they are below 30 ppb.
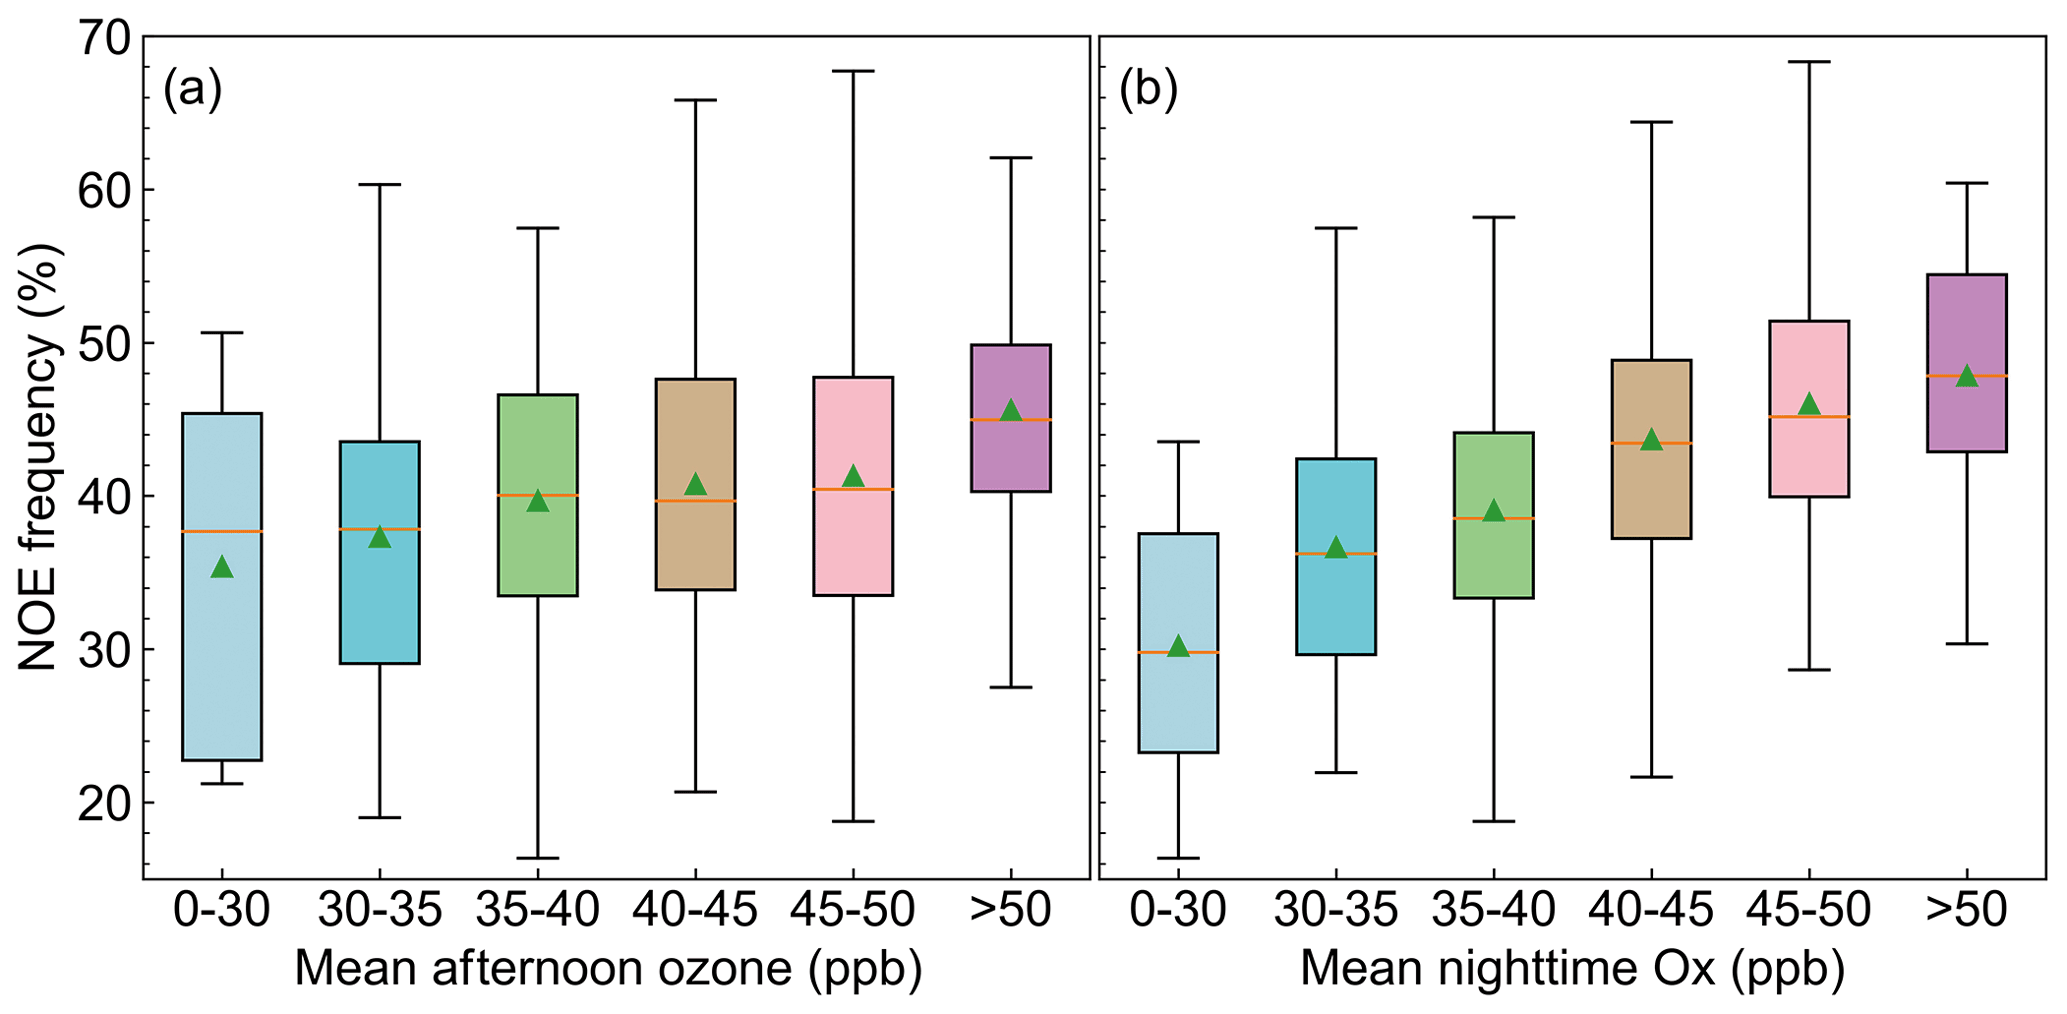
Figure 5The relationship of NOE frequencies with afternoon ozone (a) and with nighttime Ox (b) at 814 Chinese sites. The colored box-and-whisker plots (showing the 5th, 25th, 50th, 75th, and 95th percentiles as well as the mean values, which are denoted as triangles) present the NOE frequencies at different concentrations.
A high frequency of NOE events (>50 %) and high nighttime ozone level in the residual layer, as indicated by afternoon ozone or nighttime Ox levels (>50 ppbv), are both found in industrialized regions over China, including the NCP and YRD city clusters. At night, surface ozone is effectively removed by NOx titration and dry deposition, and nighttime ozone levels are 24 ppbv lower on average than those in the afternoon (Fig. 1d). The afternoon vs. nighttime ozone difference is even larger (∼30 ppbv) over the NCP, YRD, and PRD regions. A large ozone contrast between the nighttime residual layer and the boundary layer is expected, as afternoon ozone can largely remain in the nighttime residual layer, in which ozone is not effectively destroyed nor deposited. This is evident from a number of measurements of nighttime vertical ozone profiles that have indicated large ozone gradients between the surface and 100–300 m aloft in different regions in China (Chi et al., 2018; Wang et al., 2018; He et al., 2021). The ozone-rich air in the residual layer can be effectively mixed to the ground once atmospheric mixing is triggered or enhanced by synoptic processes. Regions with higher nighttime ozone in the residual layer are more likely to experience surface ozone increases exceeding the threshold of the NOE event definition ( ppb h−1) compared with regions with lower ozone at a similar frequency of enhanced nighttime mixing. This explains the observed co-location of high afternoon ozone concentrations (nighttime Ox concentrations) and NOE event frequencies, as shown in Fig. 1a vs. Fig. 1b or c. The strong relationship between the two also explains why the seasonal shifts in the frequency and magnitude of NOE events are similar to those in the ozone pollution level, as presented Sect. 3.1.
We also see an equivalent high frequency of NOE events in the Mediterranean and western US, with afternoon ozone levels (∼40 ppbv) that are relatively high compared with other sites in Europe and the US but lower compared with those over China. The afternoon vs. nighttime ozone contrast over the Mediterranean and western US is much smaller compared with those observed over China. Ozone at high-elevation sites over the Mediterranean and western US is largely contributed by high background ozone and frequent downward mixing, while local anthropogenic influences are relatively small (Zhang et al., 2014; Dayan et al., 2017; Jaffe et al., 2018). Frequent downward subsidence of ozone-rich air in the free troposphere, which may occur at any time of the day, can bring external ozone input to the mountainous surface, resulting in high NOE frequencies in these areas. In other regions over Europe and the US, we see much lower NOE event frequencies on average. This is because the daytime peak ozone is relatively lower than those over China, leading to low nighttime ozone concentrations in the residual layer (as indicated by afternoon ozone concentrations at surface of 30 ppbv or less). In addition, nighttime NO emissions there are low, which contributes to a weak titration effect (as indicated by the small difference between the nighttime ozone and Ox level). As such, the ozone difference between the surface and the residual layer is less stark, and residual layer ozone cannot serve as an effective source to enhance ozone at the surface even if there is strong mixing or transport.
Our analyses above show that the high ozone levels in the nighttime residual layer, which largely remain from daytime ozone, provide a critical source of nighttime ozone enhancement at the surface. The triggering of a specific NOE event requires the mixing of ozone-rich air from the nighttime residual layer to the surface or the horizontal transport of ozone-rich air from adjacent regions. Active nighttime transport and vertical mixing of air are associated with increasing atmospheric instability, which can be quantitatively indicated by the friction velocity (U*), the planetary boundary layer height (PBLH), and vertical profiles of temperature (Su et al., 2018; Arrillaga et al., 2019; Wang et al., 2019; Shao et al., 2020). The U* and PBLH are widely applied to assess the atmospheric turbulence capacity for the vertical mixing, transport, and diffusion of air pollutants. Increasing U* and PBLH levels typically indicate enhanced turbulent kinetic energy and intensity, thereby indicating a more unstable boundary layer and stronger atmospheric mixing (Ren et al., 2021; He et al., 2022). We now evaluate the behavior of atmospheric instability and the strength of vertical mixing during in the NOE events vs. NNOE events using these physical parameters obtained from the ERA5 dataset (Sect. 2.2).
Figure 6a and c compare the evolution of the U* and PBLH at the five representative cities averaged over the NOE events with that over the NNOE events. We find that the absolute values of the nighttime U* and PBLH are generally larger during NOE events than during NNOE events (Fig. S4). More importantly, we see distinct differences in their temporal evolution: the U* and PBLH typically show a steady decreasing trend throughout the nighttime during NNOE events, whereas they both show an increase during at least a certain part of the nighttime period during NOE events, suggesting that atmospheric mixing and downward infiltration of residual layer mass are becoming more active (Fig. 6a, c).
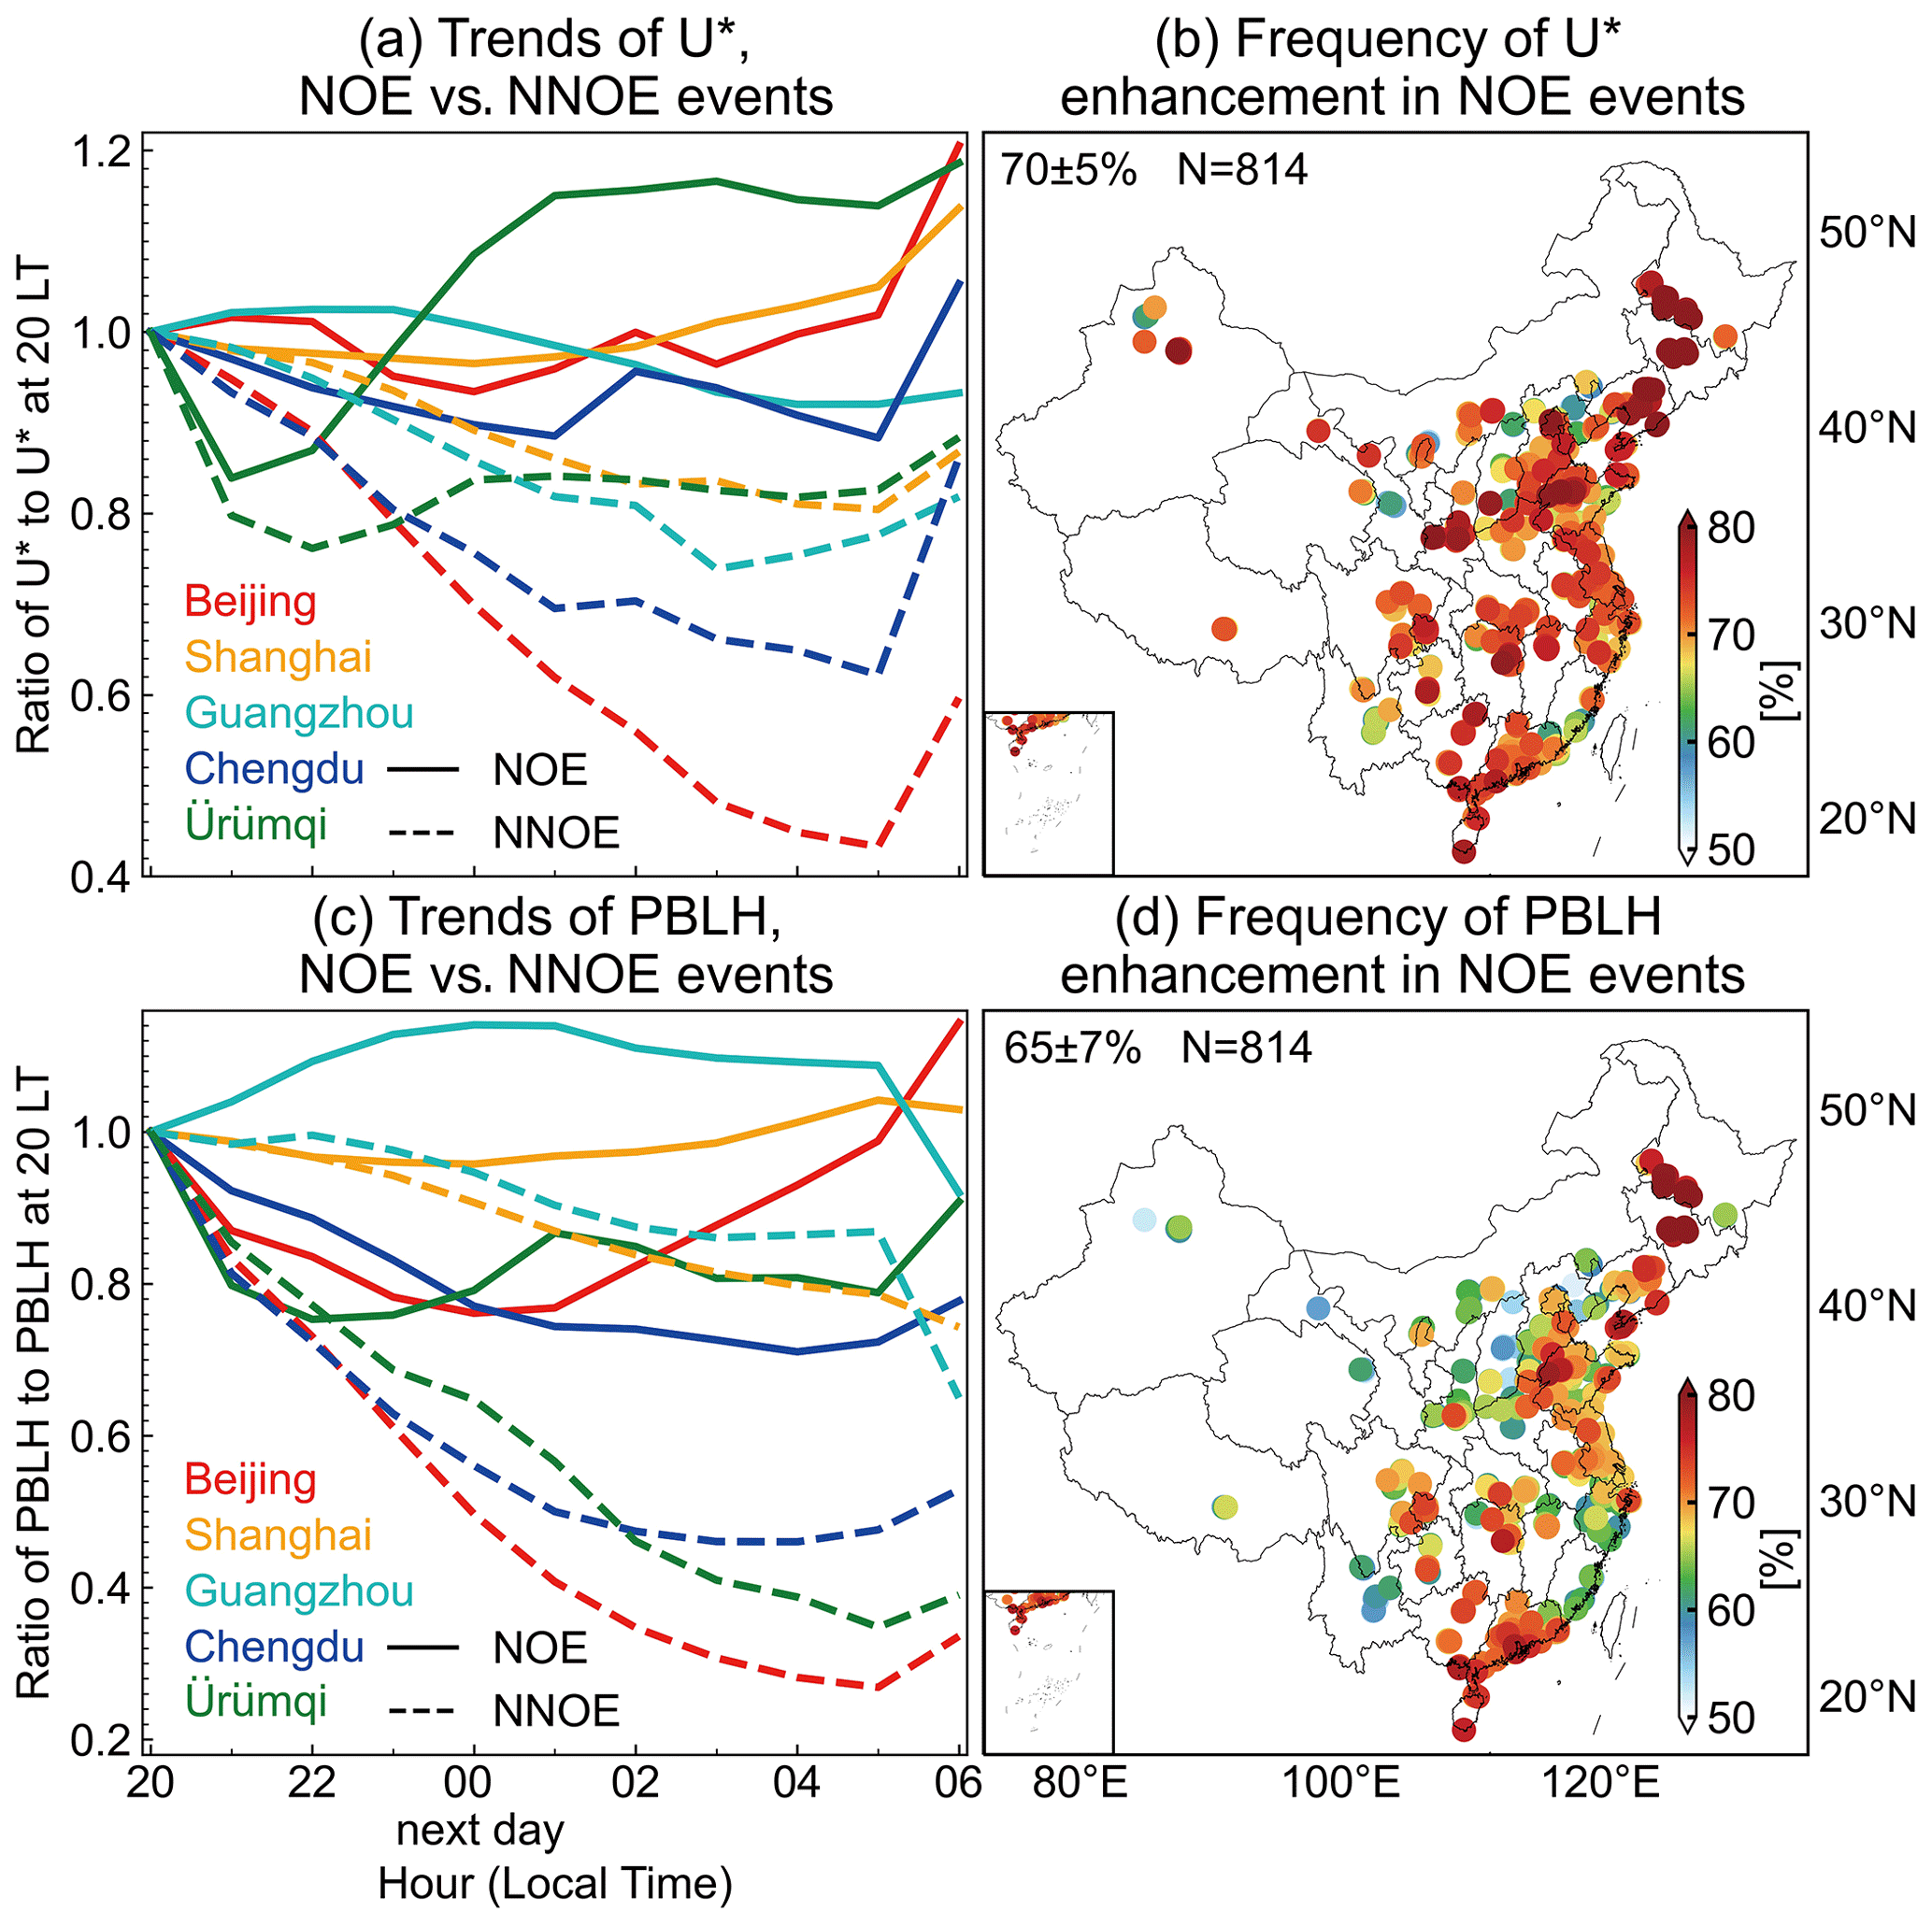
Figure 6Increases in the friction velocity (U*) and planetary boundary layer height (PBLH) during NOE events. Panels (a) and (c) shows the nighttime evolution of the U* and PBLH, scaled by the values at 20:00 LT, averaged over all NOE and NNOE events in the five representative cities. The absolute values of the U* and PBLH are shown in Fig. S5. Panels (b) and (d) show the frequency of the U* and PBLH increase within the 2 h prior to the occurrence of an NOE event at the individual sites. The regional means and standard deviations among the N sites are shown inset. The U* and PBLH data are from the ERA5 dataset.
We then calculate the frequency of the U* and PBLH increase within the 2 h prior to the occurrence time of an NOE event to see whether the increases in the U* and PBLH are consistently found during most of the NOE events across all sites. We use 2 h instead of 1 h because the response of ozone can lag behind enhanced atmospheric mixing. As shown in Fig. 6b and d, 70 % (65 %) of the NOE events are associated with an increase in the U* (PBLH) averaged over all 814 sites in 2014–2019, supporting the fact that increasing atmospheric instability is critical for triggering NOE events. Enhanced atmospheric instability, as indicated by the rise in the U* and PBLH values, not only enhances the activity of turbulent mixing and vertical mixing, which promote the downward mixing of ozone-rich air masses from the residual layer to the surface, but it also dilutes the concentration of NOx and weakens the titration effect. The combined effects of mixing-induced ozone enhancement and weakened titration-induced ozone loss increase the probability of NOE events. This also explains the sharper decrease in NO2 and CO during NOE events than during NNOE events, as shown in Fig. 4, as NO2 and CO concentrations are much lower in the nighttime residual layer than at the surface. We also find a higher frequency of nighttime U* and PBLH enhancement in the warm season than that in the cold season, suggesting that a seasonal difference in nighttime atmospheric mixing activity also contributes to the difference in the NOE frequency, as shown in Fig. 2.
The enhanced atmospheric instability and vertical mixing during NOE events can be further supported by the differences in the evolution of vertical potential temperature profiles during the NOE events vs. NNOE events, as shown in Fig. 7. Here, we use potential temperature as the metric because it describes the efficiency of heat exchange between the land and near-surface atmosphere. During NOE events at all the five representative cities, the decreases in potential temperature with time driven by long-wave radiative cooling extend from the ground to 700 hPa or higher, reflecting effective heat exchange between the land and the near-surface atmosphere and, thus, more active mixing. In comparison, the potential temperature decreases are largely limited in the lowest 100 hPa during NNOE events, indicating a stable and shallow nighttime boundary layer, which is not favorable for the mixing of air pollutants. The higher potential temperature in Ürümqi during NOE events than during NNOE events is due to the higher NOE frequency in May–August, when the temperature is significantly higher than that during April and September.
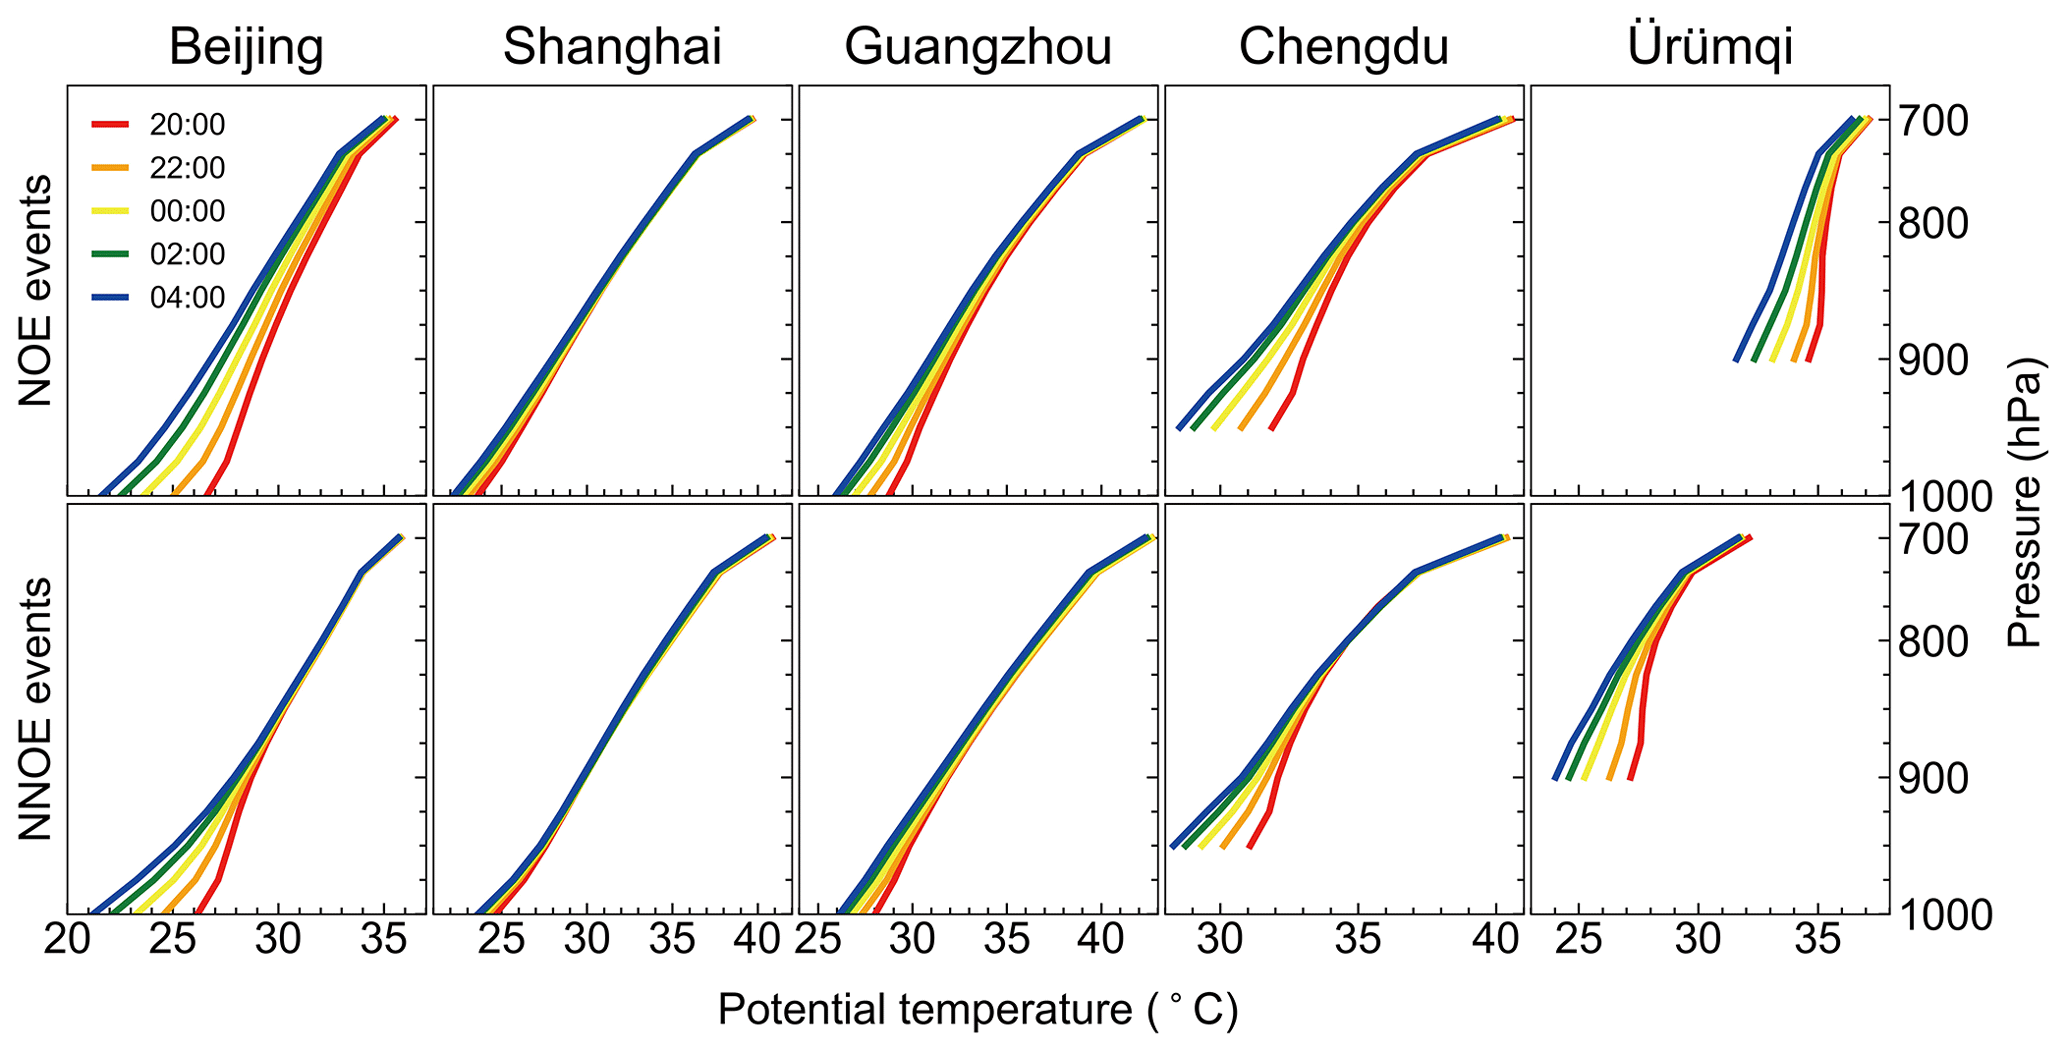
Figure 7Comparison of the vertical profiles of potential temperature at five typical cities between the NOE (top row) and the NNOE (bottom row) events. The colored lines represent potential temperature profiles at different times of the night. The temperature data are from the ERA5 dataset.
Previous studies have also shown that the horizontal transport of ozone-rich air from polluted regions can lead to episodic NOE events (Sousa et al., 2011; Ghosh et al., 2013; He et al., 2021; Yang et al., 2022). We expect that horizontal transport contributes to ozone enhancement in a specific area if there is a higher ozone level upwind. The ozone transport efficiency and magnitude are dependent on the ozone gradient between the source and receptor as well as on the transport pathway and distance, which are highly influenced by rapid-shift weather conditions. In addition, efficient horizontal transport is typically driven by synoptic processes that may also involve enhanced vertical mixing. These characteristics make it hard to classify the contribution of horizontal transport to NOE events at the national scale, but we will explore their role in the case studies below.
3.3 Case studies of NOE events
The above analyses have illustrated that the high afternoon ozone produced from intensive anthropogenic emissions provides a rich ozone source in the nighttime residual layer, leading to an overall higher frequency of NOE events in China, especially in industrialized regions (compared with other regions), and the enhanced mixing of ozone-rich air in the nighttime residual layer to the surface is a critical mechanism for triggering NOE events. We now present three cases of NOE events in Beijing (representative of the NCP region) and Guangzhou (representative of the PRD region) to focus on the specific synoptic processes that may contribute to the increase in vertical mixing and, thus, trigger NOE events.
Figure 8 shows an NOE event observed on 29 July 2015 at multiple sites in Beijing that was triggered by a convective system. Ozone levels in Beijing exceeded 120 ppbv in the afternoon, decreased rapidly with the sunset, and started increasing at around 23:00 LT. The magnitude of this NOE event was up to 36 ppbv with the nighttime peak value exceeding 70 ppbv.
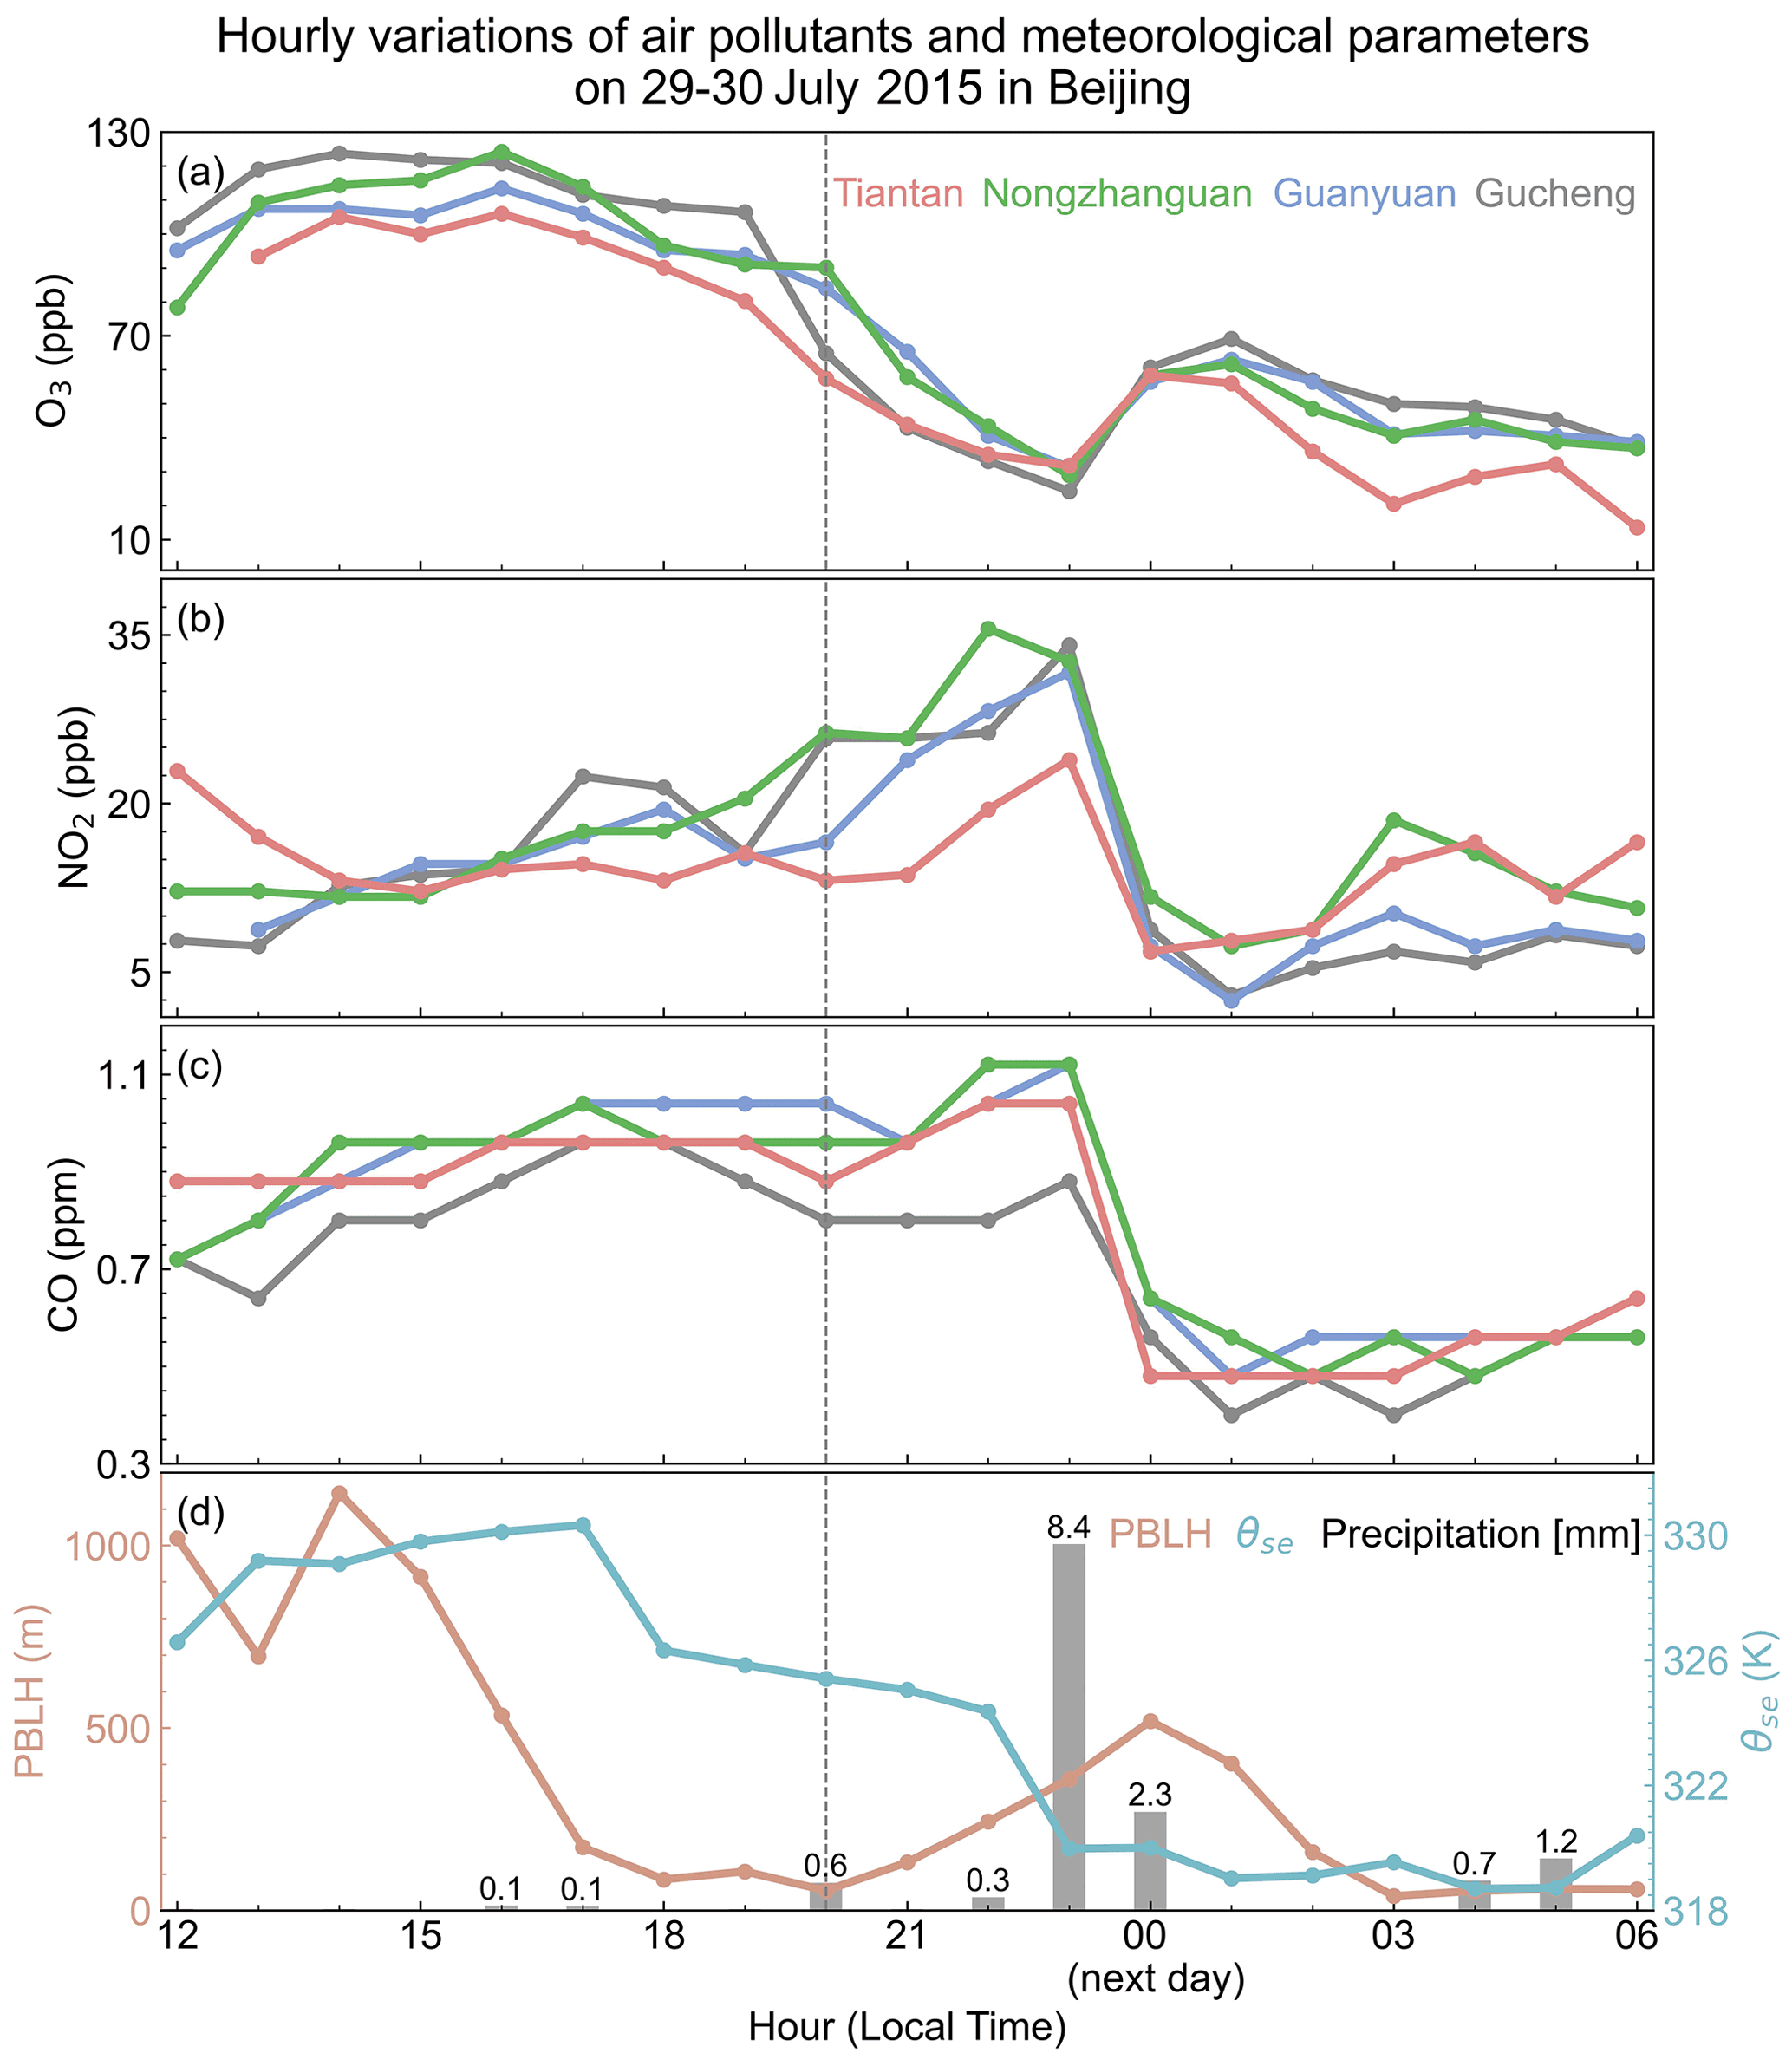
Figure 8Hourly variations in air pollutants and meteorological parameters at four sites during a Beijing NOE event on 29–30 July 2015 that was induced by a convective storm. Panels (a), (b), and (c) show the evolution of ozone, NO2, and CO, respectively. Panel (d) shows the evolution of the PBLH, equivalent potential temperature (θse), and precipitation from the ERA5 dataset. The vertical dashed line marks the start of nighttime.
We find that the nocturnal ozone increases at all sites were accompanied by a sharp decrease in the NO2 and CO concentrations and an increase in the PBLH, a typical signal of enhanced vertical mixing from the ozone-rich air in the residual layer. The large hourly precipitation of 8.4 mm at 23:00 LT indicates that there was a convective storm with the occurrence of an NOE event, and we also find a follow-up decrease in the equivalent potential temperature (θse, derived from temperature and relative humidity), a typical feature of downdrafts in convective storms (Fig. 8d) (Jia et al., 2015; Zhu et al., 2020). The examination of the large-scale synoptic pattern suggests that this convective storm was triggered by a cold vortex. Beijing was located on the periphery of a subtropical high at 500 hPa and was strongly influenced by southwest warm–wet flow that transported abundant water vapor to Beijing (Fig. S5). The analyses of vertical velocity in Fig. S6 show that there was strong upward movement before 23:00 LT, lifting warm and moist air and facilitating the formation of convective storms. With the start of rainfall, the precipitation particles fell into the dry air below, and downdrafts were strengthened via evaporative cooling, motivating the transport of ozone from upper layers to the surface. Thus, this case illustrates that strengthened downdrafts and vertical mixing triggered by convective storms are drivers of NOE events. Jia et al. (2015) and Zhu et al. (2020) also presented cases of convective-storm-induced NOE events with a similar evolution of NO2, CO, and meteorological parameters in summer in the NCP region.
Figure 9 shows the case of an NOE event under the influence of boundary layer low-level jets in Beijing on 26 August 2017. The nocturnal ozone concentration started to increase at 21:00 LT, flatted at 23:00 LT, and increased again at 02:00 LT. The magnitude of the NOE event was 22 ppb h−1. In this NOE case, the nighttime peak ozone concentrations (about 50 ppbv) were even higher than the afternoon ozone concentrations (30 ppbv), suggesting that there was an external ozone source besides the daytime ozone remaining in the nighttime residual layer. We find a subsident branch of air above the Beijing city during this event, which may bring ozone-rich air from the middle troposphere to the lower troposphere (Fig. S7).
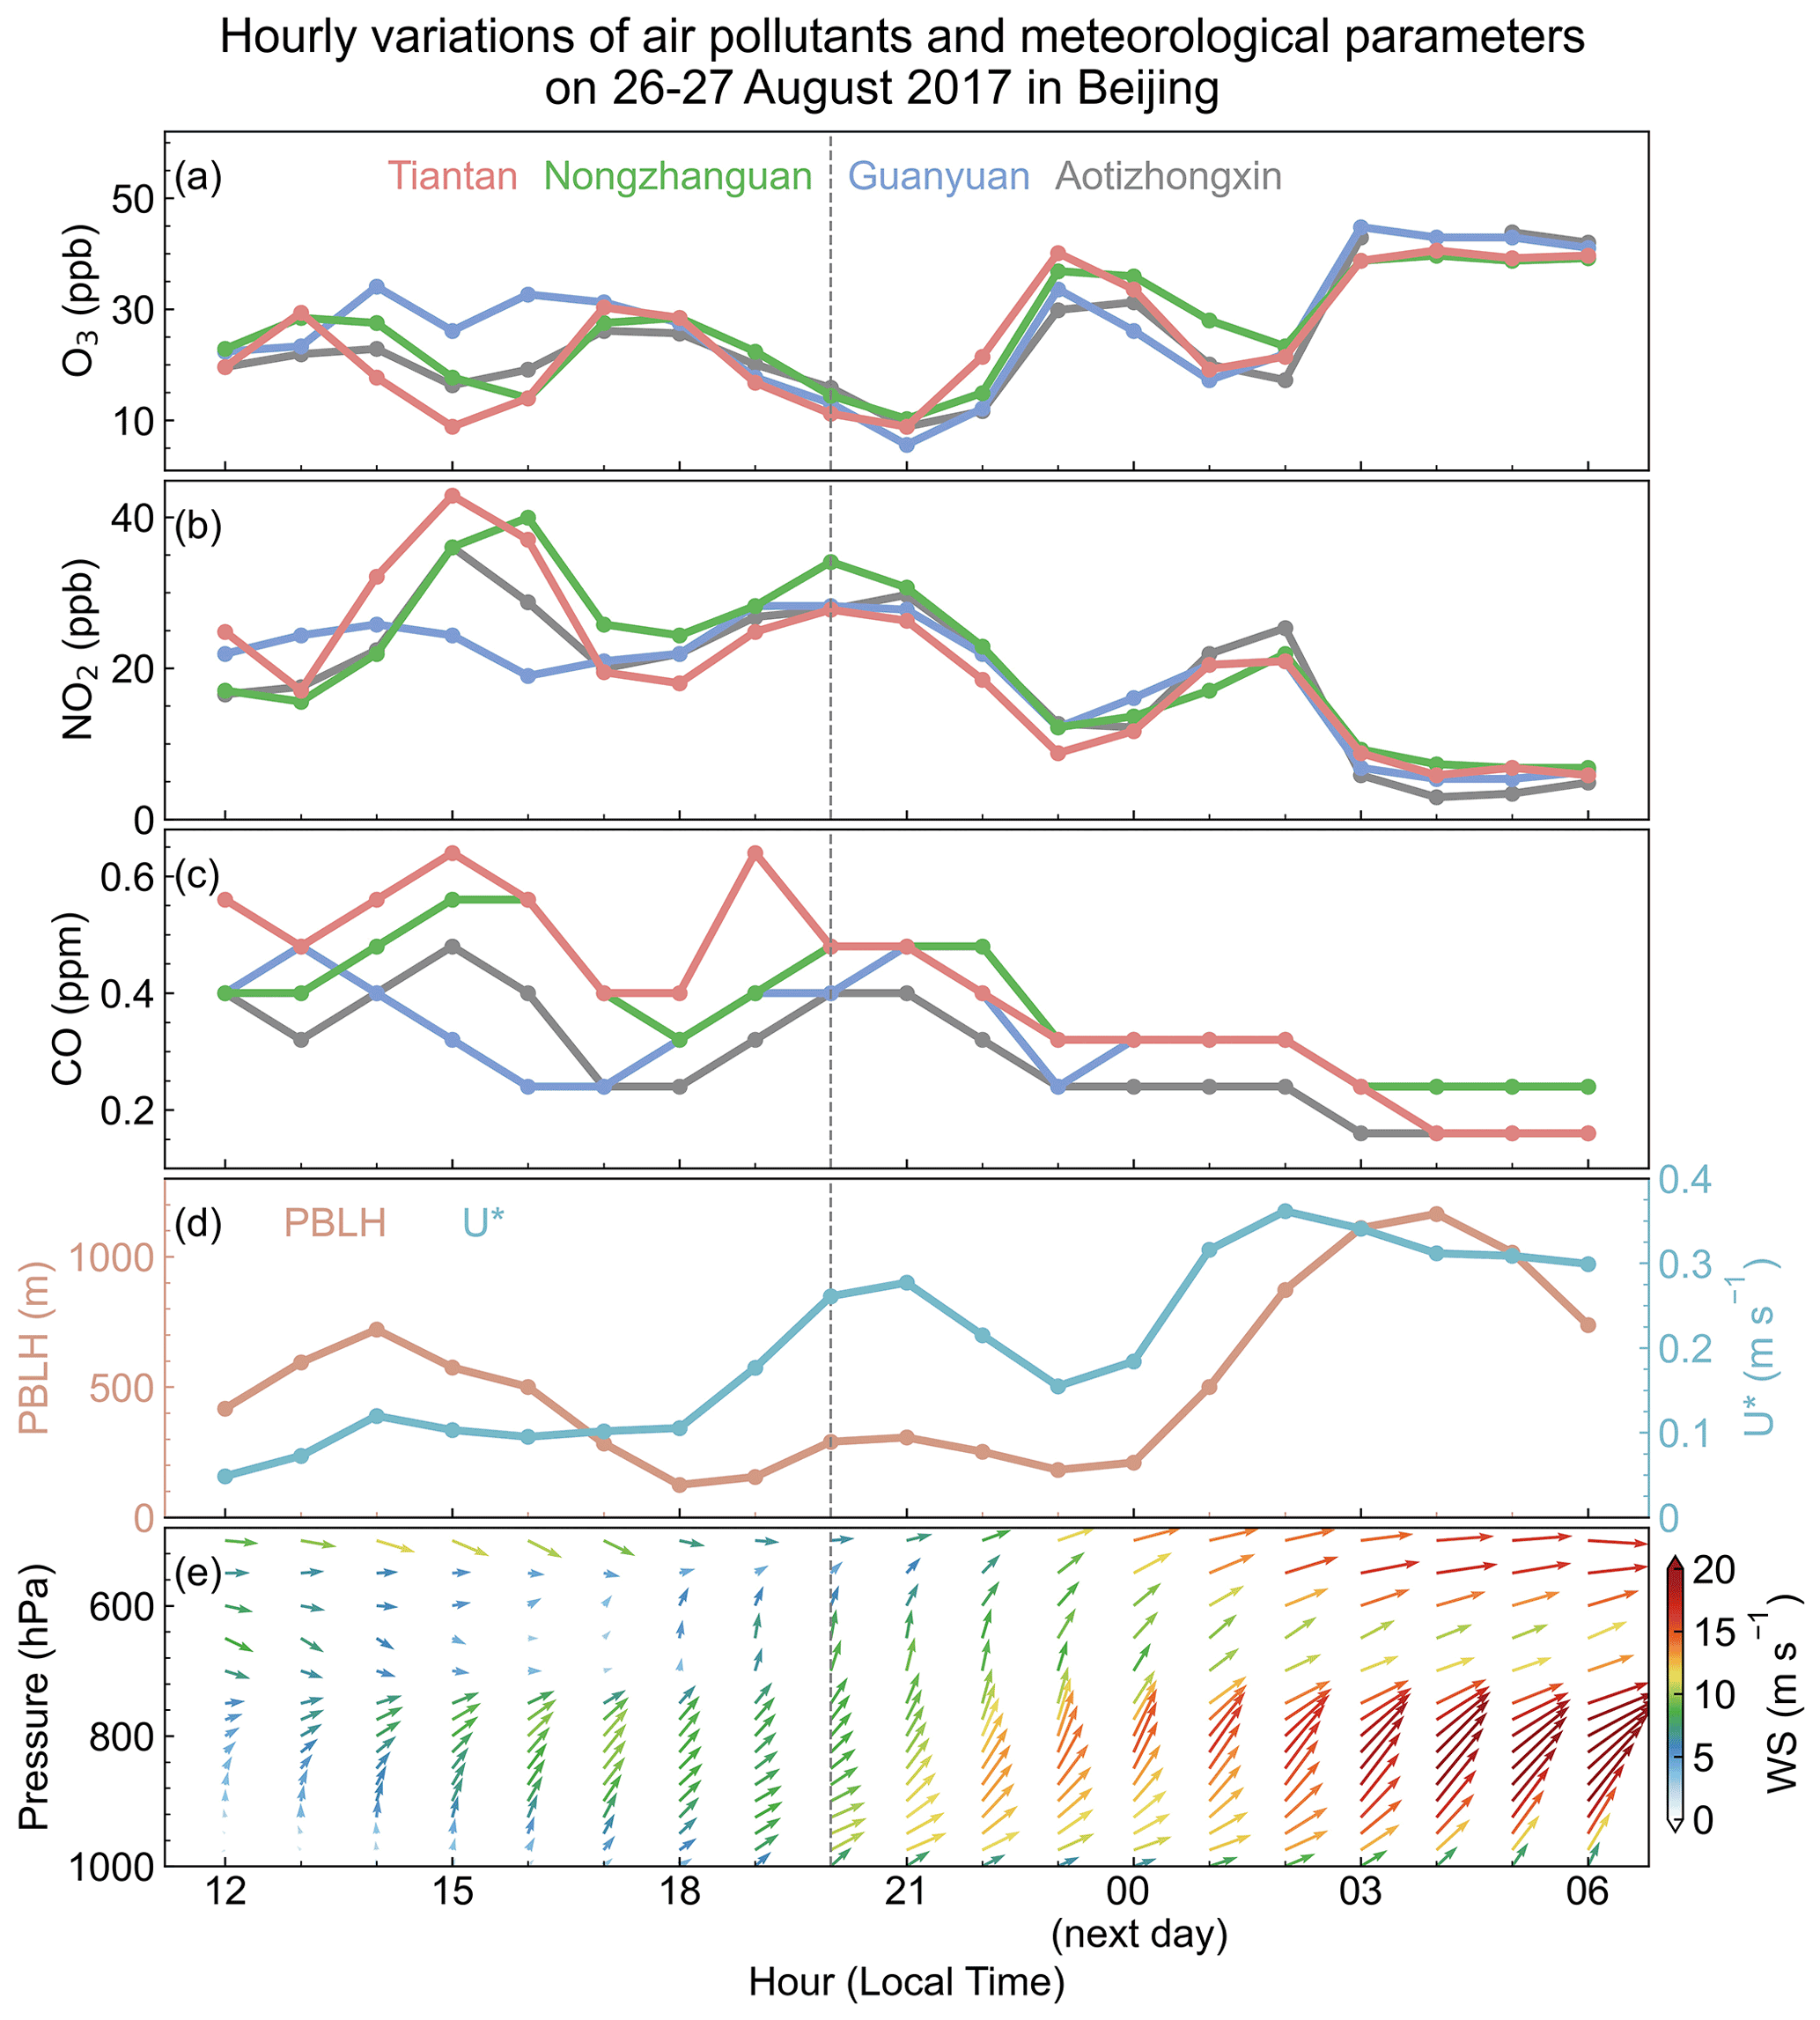
Figure 9Hourly variations in air pollutants and meteorological parameters at four sites during a Beijing NOE event on 26–27 August 2017 that was induced by low-level jets. Panels (a), (b), and (c) show the evolution of ozone, NO2, and CO, respectively. Panel (d) shows the evolution of the PBLH and frequent velocity (U*). Panel (e) shows the temporal variation in the horizontal wind profiles, with the color representing the wind speed. The vertical dashed line marks the start of nighttime.
Both periods with ozone increases during this event were associated with enhanced PBLH and U* values and declining NO2 and CO levels, again indicating enhanced vertical mixing from air in the upper layer to the surface. Analyses of the wind profile show that the wind speed continued increasing and exceeded 10 m s−1 in the lower troposphere, shaping a strong vertical wind shear – a typical feature of low-level jets (Figs. 9e, S8). The low-level jets and associated wind shear have been shown to produce turbulent kinetic energy, weaken the decoupling of the residual layer and the stable nighttime boundary layer, and aggravate vertical mixing (Banta et al., 2003; Tsiringakis et al., 2022). We find that the first period of ozone increase between 21:00 and 23:00 LT was associated with the strengthening of the low-level jets, as indicated by the rapid increase in the wind speed from 10 to 13 m s−1. There was little increase in the wind speed from 23:00 to 01:00 LT and, correspondingly, no significant ozone increases in this period. The second period of ozone increase was again accompanied by the strengthening of low-level jets with wind speeds exceeding 20 m s−1 from 800 to 975 hPa (Fig. 9e). Thus, this case presents how the development of boundary layer low-level jets triggers NOE events. The low-level jets have also been identified as a key factor causing multiple NOE events in different regions in China (Zhu et al., 2020; Wu et al., 2022), the US (Kuang et al., 2011; Hu et al., 2013; Sullivan et al., 2017; Caputi et al., 2019), and Europe (Kulkarni et al., 2016; Klein et al., 2019).
Figure 10 also illustrates a low-level-jet-induced NOE event in Guangzhou in the southern China on 21 September 2014. The afternoon ozone concentrations in Guangzhou reached about 60 ppbv. The nocturnal ozone exhibited continuous increases from 21:00 to 04:00 LT accompanied by increases in the PBLH and decreases in the NO2 concentration, lifting the surface ozone level from 9 to 34 ppbv. We find clear development of the low-level jet and wind shear from the wind profiles which can enhance atmospheric mixing, as discussed above (Fig. 10b).

Figure 10An NOE event in Guangzhou on 21–22 September 2014. Panel (a) shows the hourly variations in nocturnal ozone, NO2, and the PBLH. Panel (b) shows the evolution of vertical profiles of wind speed. Panel (c) shows the 10 m wind fields and changes in ozone relative to the previous hour. Panel (d) shows the 10 m wind fields and hourly ozone concentration. The purple line is the 12 h backward trajectories of air masses calculated using the Hybrid Single-Particle Lagrangian Integrated Trajectory (HYSPLIT) model.
We further notice that the nocturnal ozone enhancement in this case was not limited to Guangzhou city but was also spread across multiple sites in the PRD region on the background of strong northerly winds produced by the typhoon “Fung-wong” (Fig. 10c). Fung-wong was located in the east of the PRD region, and the PRD was exposed to northerly winds from the system's circulation (Fig. S9). Descending air in the periphery of the typhoon can trigger vertical transport of ozone-rich air from upper troposphere or even the lower stratosphere to the surface, contributing to ozone enhancement (Jiang et al., 2015). More importantly, nocturnal ozone started to increase at sites north of Guangzhou city from 21:00 LT and then gradually propagated to Guangzhou and the southern sites. Figure 1d indicates that the mean nighttime ozone concentrations are typically below 25 ppbv in the PRD and its northern surrounding regions. However, we find that, in this specific case, ozone concentrations at sites north of the PRD region reached 40 ppbv, which is much higher than those over the PRD region (Fig. 10d). The northerly winds on the background of typhoon circulation are expected to transport ozone-rich air in the north of the PRD region, contributing to nocturnal ozone enhancement in this area. This is also supported by backward-trajectory analyses using the Hybrid Single-Particle Lagrangian Integrated Trajectory (HYSPLIT) model (Stein et al., 2015; Rolph et al., 2017) (Fig. 10d). Thus, the analysis above illustrates that horizontal transport may also contribute to the NOE event; however, quantifying the relative contribution of vertical mixing vs. horizontal transport to ozone enhancement would require modeling studies.
3.4 Implications for ozone evolution on the next day
We also examine whether NOE events would enable us to clearly predict daytime ozone during the day following the event in China. Figure 4 shows that the occurrence of NOE events tends to induce higher ozone in the early morning of the next day in the five representative cities, compared with NNOE events. However, this does not necessarily result in higher daytime ozone compared with the preceding day, which highly depends on the timing and strength of the NOE event as well as the variation in ozone precursors and redistribution in the vertical direction. We find that the frequency of daytime ozone increase or decrease on the day following an NOE event is roughly equivalent (46 % vs. 54 %) for all sites in China. Previous studies have shown that ozone in the nighttime residual layer influenced surface ozone levels on the following day due to the fumigation of ozone in the residual layer into the developing daytime boundary layer. While the enhanced nocturnal mixing between the residual layer and nighttime boundary layer contributes to nocturnal ozone enhancement at the surface, the enhanced ozone is also subject to more efficient chemical destruction and dry deposition, resulting in lower ozone peak values the next day (Hu et al., 2013; Caputi et al., 2019). As such, whether NOE events would increase or decrease the ozone level and integrated ozone exposure on the following day is yet to be determined. Analyzing the implication of NOE events with respect to the next day's ozone level will need to further separate the daily variation in ozone from shifts in meteorological conditions and the resulting impacts on ozone chemistry and transport. This would be an important topic of ozone air quality research over China in the future.
In this study, we report a previously unrecognized high frequency of NOE events in China, present their statistical characteristics, and explore the possible mechanisms based on 6 years (2014–2019) of observations from the Chinese national monitoring network. We find that the mean annual frequency of NOE events is 41±10 %, averaged over all 814 Chinese sites in 2014–2019, which is 46 % larger than those over Europe and the US. Sites with a high frequency (>50 %) of NOE events are concentrated in industrialized city clusters (NCP, YRD, and PRD) and in western China. The NOE frequency is higher in the warm (46 %) than in the cold season (36 %) in most regions, except for the PRD where NOE events occur at a higher frequency in the cold season than in the warm season, consistent with the seasonal evolution of ozone levels. The mean ozone peak during NOE events in the warm season is 37±6 ppbv (31±6 ppbv in the cold season), which is significantly higher than those during NNOE events, 17±11 ppbv (10±9 ppbv), and high enough to have negative impacts on human health and vegetation activity. During about 85 % of NOE events, the maximum ozone enhancement is within 5–15 ppbv h−1; however, in 10 % of cases, the ozone increase can exceed 20 ppbv h−1. We also find a much faster decreasing rate of nighttime NO2 and CO concentrations as well as increases in the U* and PBLH that are indicative of enhanced atmospheric vertical mixing during NOE events compared with NNOE events.

We propose that high afternoon ozone provides a rich ozone source in the nighttime residual layer, determining the overall higher frequency of NOE events in regions with severe ozone pollution (compared with cleaner regions), and that enhanced atmospheric mixing then triggers NOE events by allowing the ozone-rich air in the residual layer to mix into the nighttime boundary layer. Figure 11 illustrates a conceptual model of the formation of the high NOE frequency over China. High ozone is generated by active photochemistry during the daytime and has a relatively small vertical gradient in the daytime boundary layer, with effective vertical mixing and turbulent mixing. At night, the surface ozone decreases significantly due to titration in a high-NOx environment as well as dry deposition with the shallowing of nighttime boundary layer, while relatively higher ozone remains in the residual layer. Synoptic processes, such as convective storms and low-level jets, produce turbulent kinetic energy, weaken the decoupling of the residual layer and the nighttime boundary layer, and aggravate vertical mixing of ozone-rich air in the residual layer into the nighttime boundary layer, thereby causing an NOE event. This is supported by our analyses that more than 70 % (65 %) of NOE events are associated with increases in U* and PBLH values as well as by the observed sharper decreases in NO2 and CO concentrations during NOE events compared with NNOE events. In addition, horizontal transport of ozone-rich plumes may also be a supplementary driver of NOE events in areas such as the PRD.
Thus, our study provides a first overview of the NOE events over China from characteristics to mechanisms. Nevertheless, as we focus more on general behaviors during NOE events (based on 6 years of observations at hundreds of sites) than on episodic cases, the proposed conceptual diagram of the NOE event mechanism may not cover all NOE events. We call for more direct observations of the vertical structure of ozone and its evolution from daytime to nighttime (Kuang et al., 2011; Jia et al., 2015; Caputi et al., 2019; He et al., 2021) as well as more three-dimensional chemical modeling studies (Hu et al., 2013; Klein et al., 2014) to quantitatively explore the contribution of mixing and regional transport to NOE events (including the underlying synoptic processes such as low-level jets and convective storms) and to further analyze the impacts of NOE events on atmospheric chemistry, human health, and vegetation productivity.
Hourly observational air pollutant data are available from https://quotsoft.net/air/ (last access: 15 April 2022; X. L. Wang, 2020) for China, from https://www.epa.gov/outdoor-air-quality-data (last access: 15 April 2022; US EPA, 2022) for the United States, and from https://discomap.eea.europa.eu/map/fme/AirQualityExport.htm (last access: 15 April 2022; EU EEA, 2022) for Europe. The ERA5 reanalysis data can be accessed via https://cds.climate.copernicus.eu/#!/search?text=ERA5 (last access: 15 April 2022; Hersbach et al., 2020; https://doi.org/10.1002/qj.3803).
The supplement related to this article is available online at: https://doi.org/10.5194/acp-22-15243-2022-supplement.
XL and SJF designed the study. CH conducted the data collection and analyses with contributions from HLW, HCW, YL, GWH, YPH, YRW, YLZ, YML, and QF. All authors provided practical comments. CH, XL, and SJF wrote the paper with input from all co-authors.
The contact author has declared that none of the authors has any competing interests.
Publisher’s note: Copernicus Publications remains neutral with regard to jurisdictional claims in published maps and institutional affiliations.
The authors gratefully acknowledge the NOAA Air Resources Laboratory (ARL) for the provision of the HYSPLIT transport and dispersion model used in this publication.
This research has been supported by the Key-Area Research and Development Program of Guangdong Province (grant no. 2020B1111360003), the Guangdong Basic and Applied Basic Research project (grant no. 2020B0301030004), the Guangdong Science and Technology Plan project (grant no. 2019B121201002), and the National Natural Science Foundation of China (grant no. 42105103).
This paper was edited by Graciela Raga and reviewed by three anonymous referees.
Arrillaga, J. A., Yagüe, C., Román-Cascón, C., Sastre, M., Jiménez, M. A., Maqueda, G., and Vilà-Guerau de Arellano, J.: From weak to intense downslope winds: origin, interaction with boundary-layer turbulence and impact on CO2 variability, Atmos. Chem. Phys., 19, 4615–4635, https://doi.org/10.5194/acp-19-4615-2019, 2019.
Banta, R. M., Pichugina, Y. L., and Newsom, R. K.: Relationship between Low-Level Jet Properties and Turbulence Kinetic Energy in the Nocturnal Stable Boundary Layer, J. Atmos. Sci., 60, 2549–2555, https://doi.org/10.1175/1520-0469(2003)060<2549:RBLJPA>2.0.CO;2, 2003.
Brown, S. S. and Stutz, J.: Nighttime radical observations and chemistry, Chem. Soc. Rev., 41, 6405–6447, https://doi.org/10.1039/C2CS35181A, 2012.
Caputi, D. J., Faloona, I., Trousdell, J., Smoot, J., Falk, N., and Conley, S.: Residual layer ozone, mixing, and the nocturnal jet in California's San Joaquin Valley, Atmos. Chem. Phys., 19, 4721–4740, https://doi.org/10.5194/acp-19-4721-2019, 2019.
Chi, X., Liu, C., Xie, Z., Fan, G., Wang, Y., He, P., Fan, S., Hong, Q., Wang, Z., Yu, X., Yue, F., Duan, J., Zhang, P., and Liu, J.: Observations of ozone vertical profiles and corresponding precursors in the low troposphere in Beijing, China, Atmos. Res., 213, 224–235, https://doi.org/10.1016/j.atmosres.2018.06.012, 2018.
Cooper, O. R., Gao, R.-S., Tarasick, D., Leblanc, T., and Sweeney, C.: Long-term ozone trends at rural ozone monitoring sites across the United States, 1990–2010, J. Geophys. Res.-Atmos., 117, D22307, https://doi.org/10.1029/2012JD018261, 2012.
Dayan, U., Ricaud, P., Zbinden, R., and Dulac, F.: Atmospheric pollution over the eastern Mediterranean during summer – a review, Atmos. Chem. Phys., 17, 13233–13263, https://doi.org/10.5194/acp-17-13233-2017, 2017.
Eliasson, I., Thorsson, S., and Andersson-Sköld, Y.: Summer nocturnal ozone maxima in Göteborg, Sweden, Atmos. Environ., 37, 2615–2627, https://doi.org/10.1016/S1352-2310(03)00205-X, 2003.
EU EEA: E2a observation data, DiscoMap EEA [data set], https://discomap.eea.europa.eu/map/fme/AirQualityExport.htm, last access: 15 April 2022.
Feng, Z., Xu, Y., Kobayashi, K., Dai, L., Zhang, T., Agathokleous, E., Calatayud, V., Paoletti, E., Mukherjee, A., Agrawal, M., Park, R. J., Oak, Y. J., and Yue, X.: Ozone pollution threatens the production of major staple crops in East Asia, Nature Food, 3, 47–56, https://doi.org/10.1038/s43016-021-00422-6, 2022.
Fleming, Z. L., Doherty, R. M., von Schneidemesser, E., Malley, C. S., Cooper, O. R., Pinto, J. P., Colette, A., Xu, X., Simpson, D., Schultz, M. G., Lefohn, A. S., Hamad, S., Moolla, R., Solberg, S., and Feng, Z.: Tropospheric Ozone Assessment Report: Present-day ozone distribution and trends relevant to human health, Elementa: Science of the Anthropocene, 6, 12, https://doi.org/10.1525/elementa.273, 2018.
Gao, M., Gao, J., Zhu, B., Kumar, R., Lu, X., Song, S., Zhang, Y., Jia, B., Wang, P., Beig, G., Hu, J., Ying, Q., Zhang, H., Sherman, P., and McElroy, M. B.: Ozone pollution over China and India: seasonality and sources, Atmos. Chem. Phys., 20, 4399–4414, https://doi.org/10.5194/acp-20-4399-2020, 2020.
Ghosh, D., Lal, S., and Sarkar, U.: High nocturnal ozone levels at a surface site in Kolkata, India: Trade-off between meteorology and specific nocturnal chemistry, Urban Climate, 5, 82–103, https://doi.org/10.1016/j.uclim.2013.07.002, 2013.
Guo, H., Gu, X., Ma, G., Shi, S., Wang, W., Zuo, X., and Zhang, X.: Spatial and temporal variations of air quality and six air pollutants in China during 2015–2017, Sci. Rep., 9, 15201, https://doi.org/10.1038/s41598-019-50655-6, 2019.
He, J. Y., Chan, P. W., Li, Q. S., Li, L., Zhang, L., and Yang, H. L.: Observations of wind and turbulence structures of Super Typhoons Hato and Mangkhut over land from a 356 m high meteorological tower, Atmos. Res., 265, 105910, https://doi.org/10.1016/j.atmosres.2021.105910, 2022.
He, Y., Wang, H., Wang, H., Xu, X., Li, Y., and Fan, S.: Meteorology and topographic influences on nocturnal ozone increase during the summertime over Shaoguan, China, Atmos. Environ., 256, 118459, https://doi.org/10.1016/j.atmosenv.2021.118459, 2021.
Hersbach, H., Bell, B., Berrisford, P., Hirahara, S., Horányi, A., Muñoz-Sabater, J., Nicolas, J., Peubey, C., Radu, R., Schepers, D., Simmons, A., Soci, C., Abdalla, S., Abellan, X., Balsamo, G., Bechtold, P., Biavati, G., Bidlot, J., Bonavita, M., De Chiara, G., Dahlgren, P., Dee, D., Diamantakis, M., Dragani, R., Flemming, J., Forbes, R., Fuentes, M., Geer, A., Haimberger, L., Healy, S., Hogan, R. J., Hólm, E., Janisková, M., Keeley, S., Laloyaux, P., Lopez, P., Lupu, C., Radnoti, G., de Rosnay, P., Rozum, I., Vamborg, F., Villaume, S., and Thépaut, J.-N.: The ERA5 global reanalysis, Q. J. Roy. Meteor. Soc., 146, 1999–2049, https://doi.org/10.1002/qj.3803, 2020 (data available at: https://cds.climate.copernicus.eu/#!/search?text=ERA5, last access: 15 April 2022).
Hu, X.-M., Doughty, D. C., Sanchez, K. J., Joseph, E., and Fuentes, J. D.: Ozone variability in the atmospheric boundary layer in Maryland and its implications for vertical transport model, Atmos. Environ., 46, 354–364, https://doi.org/10.1016/j.atmosenv.2011.09.054, 2012.
Hu, X.-M., Klein, P. M., Xue, M., Zhang, F., Doughty, D. C., Forkel, R., Joseph, E., and Fuentes, J. D.: Impact of the vertical mixing induced by low-level jets on boundary layer ozone concentration, Atmos. Environ., 70, 123–130, https://doi.org/10.1016/j.atmosenv.2012.12.046, 2013.
Huang, X., Ding, A., Gao, J., Zheng, B., Zhou, D., Qi, X., Tang, R., Wang, J., Ren, C., Nie, W., Chi, X., Xu, Z., Chen, L., Li, Y., Che, F., Pang, N., Wang, H., Tong, D., Qin, W., Cheng, W., Liu, W., Fu, Q., Liu, B., Chai, F., Davis, S. J., Zhang, Q., and He, K.: Enhanced secondary pollution offset reduction of primary emissions during COVID-19 lockdown in China, Natl. Sci. Rev., 8, nwaa137, https://doi.org/10.1093/nsr/nwaa137, 2020.
Jacob, D. J.: Heterogeneous chemistry and tropospheric ozone, Atmos. Environ., 34, 2131–2159, https://doi.org/10.1016/S1352-2310(99)00462-8, 2000.
Jaffe, D. A., Cooper, O. R., Fiore, A. M., Henderson, B. H., Tonnesen, G. S., Russell, A. G., Henze, D. K., Langford, A. O., Lin, M., and Moore, T.: Scientific assessment of background ozone over the U.S.: Implications for air quality management, Elementa: Science of the Anthropocene, 6, 56, https://doi.org/10.1525/elementa.309, 2018.
Jia, S., Xu, X., Lin, W., Wang, Y., He, X., and Hualong, Z.: Increased Mixing Ratio of Surface Ozone by Nighttime Convection Process over the North China Plain, J. Appl. Meteor. Sci., 26, 280–290, https://doi.org/10.11898/1001-7313.20150303, 2015.
Jiang, Y. C., Zhao, T. L., Liu, J., Xu, X. D., Tan, C. H., Cheng, X. H., Bi, X. Y., Gan, J. B., You, J. F., and Zhao, S. Z.: Why does surface ozone peak before a typhoon landing in southeast China?, Atmos. Chem. Phys., 15, 13331–13338, https://doi.org/10.5194/acp-15-13331-2015, 2015.
Jiang, Z., Li, J., Lu, X., Gong, C., Zhang, L., and Liao, H.: Impact of western Pacific subtropical high on ozone pollution over eastern China, Atmos. Chem. Phys., 21, 2601–2613, https://doi.org/10.5194/acp-21-2601-2021, 2021.
Klein, A., Ravetta, F., Thomas, J. L., Ancellet, G., Augustin, P., Wilson, R., Dieudonné, E., Fourmentin, M., Delbarre, H., and Pelon, J.: Influence of vertical mixing and nighttime transport on surface ozone variability in the morning in Paris and the surrounding region, Atmos. Environ., 197, 92–102, https://doi.org/10.1016/j.atmosenv.2018.10.009, 2019.
Klein, P. M., Hu, X.-M., and Xue, M.: Impacts of Mixing Processes in Nocturnal Atmospheric Boundary Layer on Urban Ozone Concentrations, Bound.-Lay. Meteorol., 150, 107–130, https://doi.org/10.1007/s10546-013-9864-4, 2014.
Kleinman, L., Daum, P., Lee, Y.-N., Nunnermacker, L., Springston, S., Weinstein-Lloyd, J., and Rudolph, J.: Ozone production efficiency in an urban area, J. Geophys. Res., 107, 4733, https://doi.org/10.1029/2002JD002529, 2002.
Kuang, S., Newchurch, M. J., Burris, J., Wang, L., Buckley, P. I., Johnson, S., Knupp, K., Huang, G., Phillips, D., and Cantrell, W.: Nocturnal ozone enhancement in the lower troposphere observed by lidar, Atmos. Environ., 45, 6078–6084, https://doi.org/10.1016/j.atmosenv.2011.07.038, 2011.
Kulkarni, P. S., Dasari, H. P., Sharma, A., Bortoli, D., Salgado, R., and Silva, A. M.: Nocturnal surface ozone enhancement over Portugal during winter: Influence of different atmospheric conditions, Atmos. Environ., 147, 109–120, https://doi.org/10.1016/j.atmosenv.2016.09.056, 2016.
Lefohn, A. S., Malley, C. S., Smith, L., Wells, B., Hazucha, M., Simon, H., Naik, V., Mills, G., Schultz, M. G., Paoletti, E., De Marco, A., Xu, X., Zhang, L., Wang, T., Neufeld, H. S., Musselman, R. C., Tarasick, D., Brauer, M., Feng, Z., Tang, H., Kobayashi, K., Sicard, P., Solberg, S., and Gerosa, G.: Tropospheric ozone assessment report: Global ozone metrics for climate change, human health, and crop/ecosystem research, Elementa: Science of the Anthropocene, 6, 27, https://doi.org/10.1525/elementa.279, 2018.
Li, D., Shindell, D., Ding, D., Lu, X., Zhang, L., and Zhang, Y.: Surface ozone impacts on major crop production in China from 2010 to 2017, Atmos. Chem. Phys., 22, 2625–2638, https://doi.org/10.5194/acp-22-2625-2022, 2022.
Li, K., Jacob, D. J., Liao, H., Qiu, Y., Shen, L., Zhai, S., Bates, K. H., Sulprizio, M. P., Song, S., Lu, X., Zhang, Q., Zheng, B., Zhang, Y., Zhang, J., Lee, H. C., and Kuk, S. K.: Ozone pollution in the North China Plain spreading into the late-winter haze season, P. Natl. Acad. Sci. USA, 118, e2015797118, https://doi.org/10.1073/pnas.2015797118, 2021.
Lin, J., Youn, D., Liang, X., and Wuebbles, D.: Global model simulation of summertime U.S. ozone diurnal cycle and its sensitivity to PBL mixing, spatial resolution, and emissions, Atmos. Environ., 42, 8470–8483, https://doi.org/10.1016/j.atmosenv.2008.08.012, 2008.
Liu, Y. and Wang, T.: Worsening urban ozone pollution in China from 2013 to 2017 – Part 1: The complex and varying roles of meteorology, Atmos. Chem. Phys., 20, 6305–6321, https://doi.org/10.5194/acp-20-6305-2020, 2020.
Lu, X., Hong, J., Zhang, L., Cooper, O. R., Schultz, M. G., Xu, X., Wang, T., Gao, M., Zhao, Y., and Zhang, Y.: Severe Surface Ozone Pollution in China: A Global Perspective, Environ. Sci. Tech. Let., 5, 487–494, https://doi.org/10.1021/acs.estlett.8b00366, 2018.
Lu, X., Zhang, L., Wang, X., Gao, M., Li, K., Zhang, Y., Yue, X., and Zhang, Y.: Rapid Increases in Warm-Season Surface Ozone and Resulting Health Impact in China Since 2013, Environ. Sci. Tech. Let., 7, 240–247, https://doi.org/10.1021/acs.estlett.0c00171, 2020.
Lu, X., Ye, X., Zhou, M., Zhao, Y., Weng, H., Kong, H., Li, K., Gao, M., Zheng, B., Lin, J., Zhou, F., Zhang, Q., Wu, D., Zhang, L., and Zhang, Y.: The underappreciated role of agricultural soil nitrogen oxide emissions in ozone pollution regulation in North China, Nat. Commun., 12, 5021, https://doi.org/10.1038/s41467-021-25147-9, 2021.
Millet, D. B., Baasandorj, M., Hu, L., Mitroo, D., Turner, J., and Williams, B. J.: Nighttime Chemistry and Morning Isoprene Can Drive Urban Ozone Downwind of a Major Deciduous Forest, Environ. Sci. Technol., 50, 4335–4342, https://doi.org/10.1021/acs.est.5b06367, 2016.
Monks, P. S., Archibald, A. T., Colette, A., Cooper, O., Coyle, M., Derwent, R., Fowler, D., Granier, C., Law, K. S., Mills, G. E., Stevenson, D. S., Tarasova, O., Thouret, V., von Schneidemesser, E., Sommariva, R., Wild, O., and Williams, M. L.: Tropospheric ozone and its precursors from the urban to the global scale from air quality to short-lived climate forcer, Atmos. Chem. Phys., 15, 8889–8973, https://doi.org/10.5194/acp-15-8889-2015, 2015.
Reitebuch, O., Strassburger, A., Emeis, S., and Kuttler, W.: Nocturnal secondary ozone concentration maxima analysed by sodar observations and surface measurements, Atmos. Environ., 34, 4315–4329, https://doi.org/10.1016/S1352-2310(00)00185-0, 2000.
Ren, Y., Zhang, H., Zhang, X., Wei, W., Li, Q., Wu, B., Cai, X., Song, Y., Kang, L., and Zhu, T.: Turbulence barrier effect during heavy haze pollution events, Sci. Total. Environ., 753, 142286, https://doi.org/10.1016/j.scitotenv.2020.142286, 2021.
Rolph, G., Stein, A., and Stunder, B.: Real-time Environmental Applications and Display sYstem: READY, Environ. Model. Softw., 95, 210–228, https://doi.org/10.1016/j.envsoft.2017.06.025, 2017.
Shao, Y., Zhang, J., Ishizuka, M., Mikami, M., Leys, J., and Huang, N.: Dependency of particle size distribution at dust emission on friction velocity and atmospheric boundary-layer stability, Atmos. Chem. Phys., 20, 12939–12953, https://doi.org/10.5194/acp-20-12939-2020, 2020.
Sillman, S.: The use of NOy, H2O2, and HNO3 as indicators for ozone-NOx-hydrocarbon sensitivity in urban locations, J. Geophys. Res., 100, 14175–14188, https://doi.org/10.1029/94JD02953, 1995.
Škerlak, B., Sprenger, M., and Wernli, H.: A global climatology of stratosphere–troposphere exchange using the ERA-Interim data set from 1979 to 2011, Atmos. Chem. Phys., 14, 913–937, https://doi.org/10.5194/acp-14-913-2014, 2014.
Sousa, S. I. V., Alvim-Ferraz, M. C. M., and Martins, F. G.: Identification and origin of nocturnal ozone maxima at urban and rural areas of Northern Portugal – Influence of horizontal transport, Atmos. Environ., 45, 942–956, https://doi.org/10.1016/j.atmosenv.2010.11.008, 2011.
Stein, A. F., Draxler, R. R., Rolph, G. D., Stunder, B. J. B., Cohen, M. D., and Ngan, F.: NOAA’s HYSPLIT Atmospheric Transport and Dispersion Modeling System, B. Am. Meteorol. Soc., 96, 2059–2077, https://doi.org/10.1175/bams-d-14-00110.1, 2015.
Stohl, A., Bonasoni, P., Cristofanelli, P., Collins, W., Feichter, J., Frank, A., Forster, C., Gerasopoulos, E., Gäggeler, H., James, P., Kentarchos, T., Kromp-Kolb, H., Krüger, B., Land, C., Meloen, J., Papayannis, A., Priller, A., Seibert, P., Sprenger, M., Roelofs, G. J., Scheel, H. E., Schnabel, C., Siegmund, P., Tobler, L., Trickl, T., Wernli, H., Wirth, V., Zanis, P., and Zerefos, C.: Stratosphere-troposphere exchange: A review, and what we have learned from STACCATO, J. Geophys. Res., 108, 8516, https://doi.org/10.1029/2002JD002490, 2003.
Strode, S. A., Ziemke, J. R., Oman, L. D., Lamsal, L. N., Olsen, M. A., and Liu, J.: Global changes in the diurnal cycle of surface ozone, Atmos. Environ., 199, 323–333, https://doi.org/10.1016/j.atmosenv.2018.11.028, 2019.
Su, T., Li, Z., and Kahn, R.: Relationships between the planetary boundary layer height and surface pollutants derived from lidar observations over China: regional pattern and influencing factors, Atmos. Chem. Phys., 18, 15921–15935, https://doi.org/10.5194/acp-18-15921-2018, 2018.
Sullivan, J. T., Rabenhorst, S. D., Dreessen, J., McGee, T. J., Delgado, R., Twigg, L., and Sumnicht, G.: Lidar observations revealing transport of O3 in the presence of a nocturnal low-level jet: Regional implications for “next-day” pollution, Atmos. Environ., 158, 160–171, https://doi.org/10.1016/j.atmosenv.2017.03.039, 2017.
Tan, Z., Ma, X., Lu, K., Jiang, M., Zou, Q., Wang, H., Zeng, L., and Zhang, Y.: Direct evidence of local photochemical production driven ozone episode in Beijing: A case study, Sci. Total Environ., 800, 148868, https://doi.org/10.1016/j.scitotenv.2021.148868, 2021.
Tsiringakis, A., Theeuwes, N. E., Barlow, J. F., and Steeneveld, G.-J.: Interactions Between the Nocturnal Low-Level Jets and the Urban Boundary Layer: A Case Study over London, Bound.-Lay. Meteorol., 183, 249–272, https://doi.org/10.1007/s10546-021-00681-7, 2022.
Turner, M. C., Jerrett, M., Pope III, C. A., Krewski, D., Gapstur, S. M., Diver, W. R., Beckerman, B. S., Marshall, J. D., Su, J., Crouse, D. L., and Burnett, R. T.: Long-Term Ozone Exposure and Mortality in a Large Prospective Study, Am. J. Resp. Crit. Care, 193, 1134-1142, https://doi.org/10.1164/rccm.201508-1633OC, 2016.
US EPA: AQS observation data, US EPA [data set], https://www.epa.gov/outdoor-air-quality-data, last access: 15 April 2022).
Wang, H., Lu, K., Chen, X., Zhu, Q., Wu, Z., Wu, Y., and Sun, K.: Fast particulate nitrate formation via N2O5 uptake aloft in winter in Beijing, Atmos. Chem. Phys., 18, 10483–10495, https://doi.org/10.5194/acp-18-10483-2018, 2018.
Wang, H., Wang, W., Huang, X., and Ding, A.: Impacts of stratosphere-to-troposphere-transport on summertime surface ozone over eastern China, Sci. Bull., 65, 276–279, https://doi.org/10.1016/j.scib.2019.11.017, 2020.
Wang, H., Lu, K., Chen, S., Li, X., Zeng, L., Hu, M., and Zhang, Y.: Characterizing nitrate radical budget trends in Beijing during 2013–2019, Sci. Total Environ., 795, 148869, https://doi.org/10.1016/j.scitotenv.2021.148869, 2021.
Wang, L., Liu, J., Gao, Z., Li, Y., Huang, M., Fan, S., Zhang, X., Yang, Y., Miao, S., Zou, H., Sun, Y., Chen, Y., and Yang, T.: Vertical observations of the atmospheric boundary layer structure over Beijing urban area during air pollution episodes, Atmos. Chem. Phys., 19, 6949–6967, https://doi.org/10.5194/acp-19-6949-2019, 2019.
Wang, T., Xue, L., Brimblecombe, P., Lam, Y. F., Li, L., and Zhang, L.: Ozone pollution in China: A review of concentrations, meteorological influences, chemical precursors, and effects, Sci. Total Environ., 575, 1582–1596, https://doi.org/10.1016/j.scitotenv.2016.10.081, 2017.
Wang, W.-N., Cheng, T.-H., Gu, X.-F., Chen, H., Guo, H., Wang, Y., Bao, F.-W., Shi, S.-Y., Xu, B.-R., Zuo, X., Meng, C., and Zhang, X.-C.: Assessing Spatial and Temporal Patterns of Observed Ground-level Ozone in China, Sci. Rep., 7, 3651, https://doi.org/10.1038/s41598-017-03929-w, 2017.
Wang, X. L.: Historical air quality data in China [data set], https://quotsoft.net/air, last access: 15 April 2022.
Wu, Y., Chen, W., You, Y., Xie, Q., Jia, S., and Wang, X.: Quantitative impacts of vertical transport on long-term trend of nocturnal ozone increase over the Pearl River Delta region during 2006–2019, Atmos. Chem. Phys. Discuss. [preprint], https://doi.org/10.5194/acp-2022-360, in review, 2022.
Yang, H., Lu, C., Hu, Y., Chan, P.-W., Li, L., and Zhang, L.: Effects of Horizontal Transport and Vertical Mixing on Nocturnal Ozone Pollution in the Pearl River Delta, Atmosphere, 13, 1318, https://doi.org/10.3390/atmos13081318, 2022.
Yue, X., Unger, N., Harper, K., Xia, X., Liao, H., Zhu, T., Xiao, J., Feng, Z., and Li, J.: Ozone and haze pollution weakens net primary productivity in China, Atmos. Chem. Phys., 17, 6073–6089, https://doi.org/10.5194/acp-17-6073-2017, 2017.
Zhang, L., Jacob, D. J., Yue, X., Downey, N. V., Wood, D. A., and Blewitt, D.: Sources contributing to background surface ozone in the US Intermountain West, Atmos. Chem. Phys., 14, 5295–5309, https://doi.org/10.5194/acp-14-5295-2014, 2014.
Zhao, D., Liu, G., Xin, J., Quan, J., Wang, Y., Wang, X., Dai, L., Gao, W., Tang, G., Hu, B., Ma, Y., Wu, X., Wang, L., Liu, Z., and Wu, F.: Haze pollution under a high atmospheric oxidization capacity in summer in Beijing: insights into formation mechanism of atmospheric physicochemical processes, Atmos. Chem. Phys., 20, 4575–4592, https://doi.org/10.5194/acp-20-4575-2020, 2020.
Zhu, X., Ma, Z., Li, Z., Wu, J., Guo, H., Yin, X., Ma, X., and Qiao, L.: Impacts of meteorological conditions on nocturnal surface ozone enhancement during the summertime in Beijing, Atmos. Environ., 225, 117368, https://doi.org/10.1016/j.atmosenv.2020.117368, 2020.