the Creative Commons Attribution 4.0 License.
the Creative Commons Attribution 4.0 License.
 | 25 Nov 2022
Diagnosing ozone–NOx–VOC sensitivity and revealing causes of ozone increases in China based on 2013–2021 satellite retrievals
Jie Ren
Fangfang Guo
Shaodong Xie
Particulate matter (PM2.5) concentrations in China have decreased significantly in recent years, but surface ozone (O3) concentrations showed upward trends at more than 71 % of air quality monitoring stations from 2015 to 2021. To reveal the causes of O3 increases, O3 production sensitivity is accurately diagnosed by deriving regional threshold values of the satellite tropospheric formaldehyde-to-NO2 ratio (), and O3 responses to precursor changes are evaluated by tracking volatile organic compounds (VOCs) and NOx with satellite HCHO and NO2. Results showed that the ranges of transition from VOC-limited to NOx-limited regimes apparently vary among Chinese regions. VOC-limited regimes are found widely over megacity clusters (North China Plain, Yangtze River Delta and Pearl River Delta) and concentrated in developed cities (such as Chengdu, Chongqing, Xi'an and Wuhan). NOx-limited regimes dominate most of the remaining areas. From 2013 to 2021, satellite NO2 and HCHO columns showed an annual decrease of 3.0 % and 0.3 %, respectively, indicating an effective reduction in NOx emissions but a failure to reduce VOC emissions. This finding further shows that O3 increases in major cities occur because the Clean Air Action Plan only reduces NOx emissions without effective VOC control. Based on the O3–NOx–VOC relationship by satellite NO2 and HCHO in Beijing, Chengdu and Guangzhou, the ozone concentration can be substantially reduced if the reduction ratio of is between 2:1 and 4:1.
- Article
(8240 KB) - Full-text XML
-
Supplement
(1738 KB) - BibTeX
- EndNote


China has been dedicated to fighting air pollution in the past years. Since the Chinese government implemented the Air Pollution Prevention and Control Action Plan in 2013, the ambient concentration of particulate matter with an aerodynamic diameter of <2.5 µm (PM2.5) has decreased significantly (Jiang et al., 2020; Xiao et al., 2021); however, ozone (O3) pollution remains severe or has even continued to worsen at least until 2019 (Lu et al., 2020; Zhao et al., 2020). Ozone pollution has restricted the continuous improvement in China's air quality. Thus, it has attracted widespread attention from the government, scientists and the public.
Tropospheric ozone is produced by photochemical oxidation of volatile organic compounds (VOCs) in the presence of nitrogen oxides (NOx: NO + NO2) (Atkinson, 2000). However, the O3 responses to NOx and VOC reduction are not linear. The O3 formation throughout much of the troposphere is largely controlled by the availability of NOx (NOx-limited), but in regions with high NOx emissions, such as metropolitan areas, O3 formation can be VOC-limited or transform between regimes (Sillman and He, 2002; Kleinman, 1994). A VOC-limited regime means that reducing VOC emissions can result in low O3 production; in the presence of high NOx, the reduction in NOx emissions alleviates ozone titration and even leads to ozone increases (Sillman, 1999). Local O3 formation chemistry determines the effect of changes in VOC and NOx emissions on ozone concentrations.
Various ground-based observation (Nelson et al., 2021; Tan et al., 2018) and model-based methods (Shen et al., 2021; Wang et al., 2019, 2021) have been applied to study O3–NOx–VOC sensitivity. The field observation methods can provide accurate in situ diagnoses of O3 sensitivity but are limited in temporal and spatial extent (Wang et al., 2017). Air quality model-based methods provide descriptions across time and space. However, uncertainties mainly from emission inventories as well as meteorological factors and photochemical reactions reduce the accuracy of simulation results (Liu and Shi, 2021). Based on the continuous global observations of formaldehyde (HCHO) and nitrogen dioxide (NO2) by satellite spectrometers, the space-based HCHO-to-NO2 ratio can be used as an indicator of O3 sensitivity because theoretically reflects the relative availability of NOx and total organic reactivity to hydroxyl radicals (Sillman, 1995). This satellite-based method can provide global-scale photochemical information with good time continuity and little human disturbance, which governments and policymakers are keen to know.
In China, there have been many studies exploring O3–NOx-VOC sensitivity based on satellite-retrieved (Jin and Holloway, 2015; Li et al., 2021). They are based on thresholds derived from earlier work that used air quality models to link with surface O3 sensitivity over the United States (Martin et al., 2004; Duncan et al., 2010; Choi et al., 2012). However, the model approach can be biased because modeled and observed HCHO columns, NO2 columns and surface O3 often disagree. Jin et al. (2020) derived the threshold values from observations and found the transition in O3 formation regimes occurs at a higher value than previously determined from models. Also, the range of marking transitional regimes varies regionally because of the differences in meteorological conditions, ozone levels and precursor composition (Schroeder et al., 2017). The threshold extracted in the United States may not be suitable for China and a uniform value may not be applicable to all Chinese cities. In addition, most previous studies utilized the Ozone Monitoring Instrument (OMI) satellite (Li et al., 2021; Wang et al., 2021). The newly launched Tropospheric Monitoring Instrument (TROPOMI) aboard Sentinel-5P provides a new perspective to characterize the chemistry of surface O3 at finer spatial scales (Veefkind et al., 2012). Therefore, for a more accurate diagnosis of the ozone-precursor sensitivity across China, the transitional regime range of using the new generation of satellites requires further in-depth investigation.
Recent O3 trends in China have been driven by a variety of anthropogenic factors. Some model simulations revealed a strong influence of the PM2.5 decrease on the O3 increase and attributed that response to the aerosol sink of hydroperoxy (HO2) radicals (Li et al., 2019). Other studies attributed the anthropogenic drivers mainly to the rapid reduction in NOx emission and the non-linear response of O3 in the VOC-limited regime in urban regions (Ren et al., 2021; Yang et al., 2019; Wang et al., 2019). Nationwide annual estimates of anthropogenic VOC and NOx emissions in China show different trends from 2013 to 2019, with successive large decreases in NOx but only slight changes in VOC (Zheng et al., 2018; Simayi et al., 2022). Notably, anthropogenic VOC changes have been discussed relatively less than NOx or aerosols in previous studies of urban O3 in China. There is a lack of observational evidence on the role of VOC control in explaining O3 trends. Satellite-based HCHO and NO2 can be used as visual, timely and high-resolution trackers of VOCs and NOx emissions, respectively (Duncan et al., 2010), in order to reveal the relationship between ozone increases and changes in its precursors' emissions.
In this study, we first take advantage of the Chinese extensive air quality monitoring network to assess the latest trends in ozone concentrations comprehensively. The threshold values that mark the O3 formation transition are derived and used to identify the O3–NOx–VOC sensitivity by matching satellite-based with ground-based O3 measurements across China and in different regions. The effects of precursors on ozone and the causes of ozone increase are explored by combining ozone production regimes with interannual variations in NOx and VOC emissions inferred from tropospheric NO2 and HCHO vertical columns. Furthermore, the optimal reduction ratio is probed in three typical cities – Beijing, Chengdu and Guangzhou – based on the relationships between O3 and , to provide scientific support for future O3 pollution control.
2.1 Ground-based observation of O3 and NO2
The Chinese nationwide air quality monitoring network provides surface O3 and NO2 data. Since 2015, more than 1400 sites have covered more than 330 cities across the country. The nationwide hourly O3 and NO2 concentration data in Chinese cities in 2014–2021 were obtained from the National Urban Air Quality Real-Time Publishing Platform (https://air.cnemc.cn:18007/, last access: 1 September 2022).
O3 and NO2 measurements were reported in micrograms per cubic meter and the mass concentrations for all years were unified to the reference state (298.15 K, 1013.25 hPa). Extensive data quality controls were applied to eliminate unreliable observed outliers following the method of previous studies (Lu et al., 2018). The average of daily NO2 and the daily maximum 8 h average (MDA8) O3 concentration for all nationally controlled sites in a city was regarded as the city's daily NO2 and O3 levels.
2.2 Satellite observations of O3 precursors
Given the short lifetime of NOx, the high ratio in the boundary layer and the fact that HCHO is an intermediate in the oxidation reactions of various VOCs and is approximately proportional to the total rate of VOC reactions with OH radicals (Duncan et al., 2010), current satellite-based spectrometers have provided continuous global observations for two species indicative of O3 precursors, namely, NO2 for NOX (Lamsal et al., 2014; Martin, 2003) and HCHO for VOCs (Shen et al., 2019; Zhu et al., 2014).
Satellite products of tropospheric NO2 and HCHO vertical columns are retrieved from two satellite instruments: the Ozone Monitoring Instrument (OMI) the and Tropospheric Monitoring Instrument (TROPOMI). The high spatial resolution (24×13 km2 for OMI and 5×3.5 km2 for TROPOMI) allows for the observation of fine details of atmospheric parameters. They provide daily global observations, and the overpass time (13:40–13:50 and 13:30 local time) is well suited to detect the O3 formation sensitivity when O3 photochemical production peaks. The boundary layer is high, and the solar zenith angle is small, thereby maximizing instrument sensitivity to HCHO and NO2 in the lower troposphere (Jin et al., 2017).
The TROPOMI data from the Earth Engine Data Catalog are based on the algorithm developments for the QA4ECV (Quality Assurance for Essential Climate Variables project) reprocessed dataset for OMI and have been further optimized. The TROPOMI data, available for 2019–2021, are processed with a spatial resolution of 1113.2 m (about 0.009∘ within China). The same chemistry transport model for HCHO and NO2 is better suited for analyzing their ratio than products developed with different prior profiles.
The OMI data with longer time horizons (2013–2021) are used to study the long-term changes in NO2 and HCHO and track changes in emissions of NOx and VOCs. Tropospheric NO2 vertical columns are obtained from the Aura OMI Level-3 NO2 products (OMNO2d 003) with a grid resolution of , while HCHO total columns were obtained from OMI/Aura Level-3 HCHO products (OMHCHOd 003) with a grid resolution of . Since HCHO mainly presides in the troposphere, its total column can be regarded as the tropospheric column (Duncan et al., 2010).
2.3 Connecting satellite with ground-based O3 observations
The high spatial-resolution TROPOMI data are used to derive the threshold values marking transitions in O3 formation regimes and to diagnose the current ozone–NOx–VOC sensitivity in China. TROPOMI data are aggregated by sampling gridded NO2 and HCHO columns consistent with the ground-based observations of O3. O3 concentrations are averaged at all available sites every half-month for the warm season (April to September) from 2019 to 2021. O3 measurements at 13:00 to 14:00 local time are selected to match the TROPOMI overpass time. Considering the data volume and the need to reduce retrieval noise, TROPOMI-retrieved NO2 and HCHO columns are sampled every half-month over O3 sites for the same period, yielding nearly 100 000 paired observations. In addition, considering the number of available data and topographic conditions, China is divided into nine regions to evaluate the satellite-based and to study the O3 production regimes, as shown in Fig. S2.
3.1 Surface ozone trends
The ozone concentrations averaged from 367 cities with monitoring sites in China from 2015 to 2021 are shown in Fig. 1a. The three metrics include the maximum 6-month MDA8 ozone running average (MMA6-MDA8) and the 90th and 99th percentiles of the annual distribution of MDA8-O3 (MDA8-90th, MDA8-99th), following the definition in the World Health Organization global air quality guidelines (World Health Organization, 2021) and Chinese ambient air quality standards (GB 3095-2012). The three metrics increased by 2.3 (2 %), 2.5 (2 %) and 2.3 (1 %) µg m−3 yr−1 in 2015–2021. Moreover, they significantly increased by 4.6 (5 %), 5.6 (4 %) and 5.4 (3 %) µg m−3 yr−1 (all with p<0.05) in 2015–2019, based on the linear trend estimate.
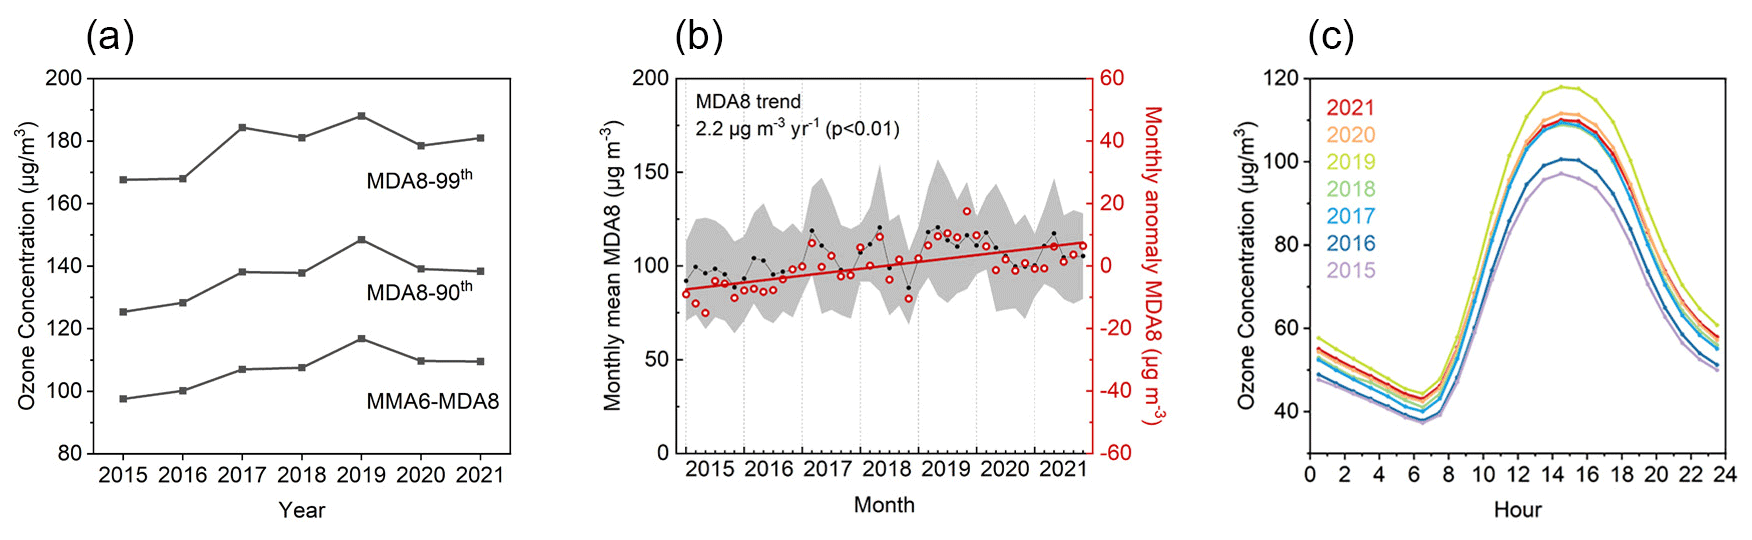
Figure 1Surface ozone concentrations in China. (a) MDA8-99th, MDA8-90th, MMA6-MDA8 and (b) monthly average (black dots, left axis) and anomaly (circle, right axis) of MDA8 ozone concentrations averaged for all 367 cities with monitoring sites in 2015–2021. Gray shading: mean value ± standard deviation across all cities for each month. Solid line: linear fitted curve. (c) Ozone diurnal cycles from April to September.
The time series of the monthly mean MDA8 ozone in 2015–2021 is shown in Fig. 1b. Based on the monthly anomalies (the difference between the observed monthly mean and the 7-year monthly mean for the same month), MDA8 ozone levels increased by 2.3 µg m−3 yr−1 (3.0 % yr−1, p<0.01) averaged for all cities. Rapid increases are also exhibited before 2019, with 3.5 µg m−3 yr−1 (4.5 % yr−1, p<0.01). The daytime and nighttime mean ozone levels show similar trends. In 2015–2019, the maximum and minimum hourly average concentration increased from 97.1 to 117.9 µg m−3 and from 37.3 to 44.3 µg m−3, respectively, based on the mean April to September ozone diurnal variation, as shown in Fig. 1c. Overall, the average ozone concentration shows an increasing trend from 2015 to 2021, although it has decreased in the last 2 years compared to the peak in 2019.

Figure 2Spatiotemporal distributions of MDA8-90th ozone in the study area from 2014 to 2021 and trends for 2015–2019 and 2015–2021.
The spatial patterns of MDA8-90th and their trends for approximately 367 cities in 2014–2021 are shown in Fig. 2. The cities with high ozone levels are widely distributed in eastern and central China, where intensive anthropogenic emissions are located. Distinct exacerbation of ozone pollution can be observed from 2014 to 2019. The locations and definitions of the key regions are shown in Fig. S1 in the Supplement. In 2014–2015, sites with MDA8-90th greater than 160 µg m−3 were concentrated near the Beijing–Tianjin–Hebei and the Yangtze River Delta (YRD) megacity clusters. By 2019, ozone hot spots extended westward to the Fenwei Plain and southward to the central Yangtze River Plain. During the 6 years, the ozone concentration has increased almost everywhere in China, particularly in the North China Plain (NCP) and the central Yangtze River Plain. In 2020 and 2021, ozone pollution was alleviated, the level of which is equivalent to the level of ozone pollution in 2017–2018. O3 concentration decreases in major key regions, including the North China Plain, Pearl River Delta (PRD) and Sichuan Basin (SCB).
The percentage of sites with MDA8-90th ozone higher than 160 µg m−3, the Chinese grade II national air quality standard, increased from 15.0 % in 2015 to 39.3 % in 2019 and then decreased to 23.0 % in 2021. The percentage of sites with increasing ozone trends was 83.1 % in 2015–2019 and 71.8 % in 2015–2021. From a national perspective, widespread surface ozone increases occurred in Chinese cities during 2015–2019. Moreover, decreases have been observed in the last 2 years.
3.2 Ozone–NOx–VOC sensitivity over China
3.2.1 Ozone–NOx–VOC chemistry captured by satellite-based
Ozone formation can be limited by NOx, VOCs or both. Satellite-based HCHO and NO2 columns are evaluated as to whether they can capture the non-linearities in O3–VOC–NOx chemistry. Figure 3a, similar to classic ozone isopleths typically generated with models (Sillman et al., 1990; Pusede et al., 2015), shows the in situ O3 concentration as a function of TROPOMI NO2 and HCHO derived solely from observations.
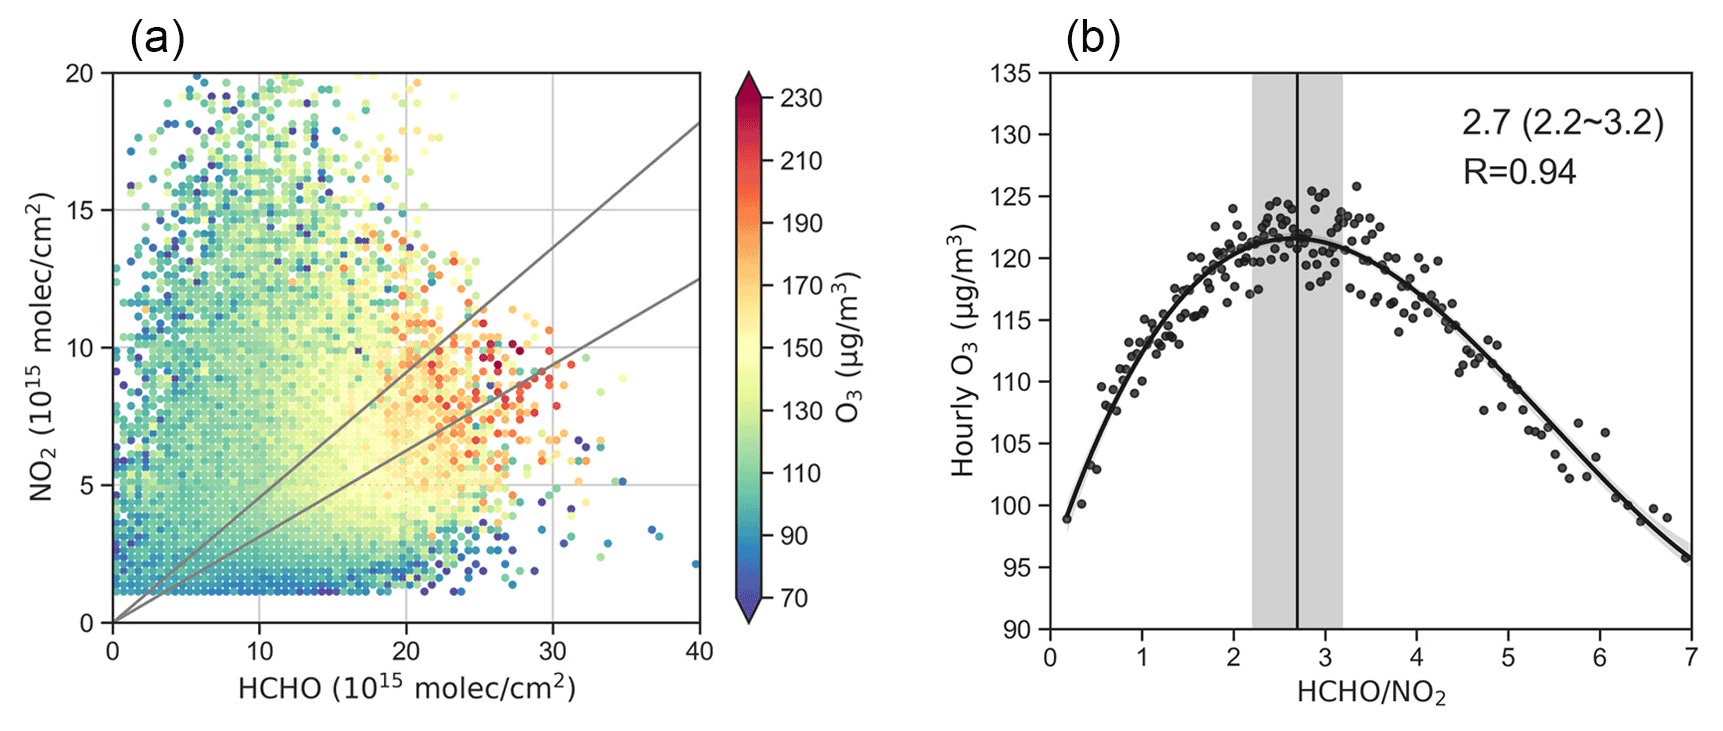
Figure 3(a) O3 concentration as a function of TROPOMI HCHO and NO2. All surface hourly O3 observations (13:00 to 14:00 local time) averaged over each half-month from April to September 2019–2021 are aggregated based on the corresponding TROPOMI HCHO and NO2 (interval: 0.5 unit ×0.25 unit). The black lines delineate the TROPOMI values of 2.2 and 3.2. (b) O3 concentration (13:00 to 14:00) as a function of TROPOMI . O3 average concentration is calculated by first matching hourly O3 observations with TROPOMI for each half of the month, dividing these paired observations into 200 bins based on and then calculating the O3 average concentration (y axis) for each TROPOMI bin (x axis). The solid line is fitted with third-order polynomial curves, and the shading indicates 95 % confidence intervals. The vertical lines indicate the maximum of the fitted curve, and the vertical shading represents the range with the curve slope from −3 to +3 (regime transition).
Consistent with O3 isopleths, O3 concentration is a non-linear process in relation to NO2 and HCHO, as shown in Fig. 3a. Three regimes can be roughly identified. When HCHO is low and NO2 is relatively high, the O3 concentration is high at lower NO2 or higher HCHO, indicating VOC-limited (or NOx-saturated) chemistry. When NO2 is low and HCHO is relatively high, the O3 concentration increases with increasing NO2, indicating NOx-limited chemistry. When both NO2 and HCHO are high, O3 concentration peaks and increases with both increasing NO2 and HCHO. However, the division between the three regimes is uncertain and ambiguous, which may be influenced by other factors such as different meteorology, noisy satellite retrievals, the spatial mismatch between gridded satellite observations and point measurements on the ground, and a lack of statistical power to calculate average concentrations in some intervals due to small sample sizes. Despite these uncertainties, Fig. 3a qualitatively illustrates the non-linear relationship between O3 and satellite NO2 and HCHO, similar to the overall O3–NOx–VOC chemistry.
After the qualitative approach is established, the thresholds that mark the O3 transitional regime are then derived by calculating the average ozone concentration for a given TROPOMI from Fig. 3a and examining their statistical relationships in China and the different regions within it. Empirical relationships are investigated by applying second-order and third-order polynomial models (Jin et al., 2020) to the observations over all cities in China. The third-order polynomial model is used to derive the maximum mean O3 concentration (the peak of the curve in Fig. 3b) because it fits the data with the high correlation coefficient better than the second-order model does. Assuming that the peak of the curve (with a slope of 0) marks the transition from VOC-limited to NOx-limited regimes, the transitional regime (mixed sensitive regime) is defined as the range with a slope between −3 and +3.
The aggregation of the overall available observations used in Fig. 3a shows that the O3 concentration peaks at are equal to 2.7, with the transitional regime between 2.2 and 3.2. A separate evaluation for nine regions also reveals the strong non-linear relationships between the O3 concentration and TROPOMI , despite differences in the overall O3 concentrations. The Pearson correlation coefficient between the fitted third-order polynomial curve and the data is generally more than 0.73, except for Inner Mongolia (0.59). The marking the regime transition varies among these regions (Table 1 and Fig. S3), with the highest in Shanxi–Shaanxi–Henan [3.7 (3.2–1.3)] and the lowest in Heilongjiang–Jilin–Liaoning [2.0 (1.2–3.2)]. Different cities respond differently to changes in NOx and VOC emissions. Previous studies have also demonstrated regional differences in the threshold values of (Schroeder et al., 2017; Chang et al., 2016) and other photochemical indicators (Liu and Shi, 2021). This difference among regions may reflect environmental conditions (Liu and Shi, 2021), such as radiation intensity and surface temperature.
Table 1 threshold values between O3 production regimes in nine Chinese regions.
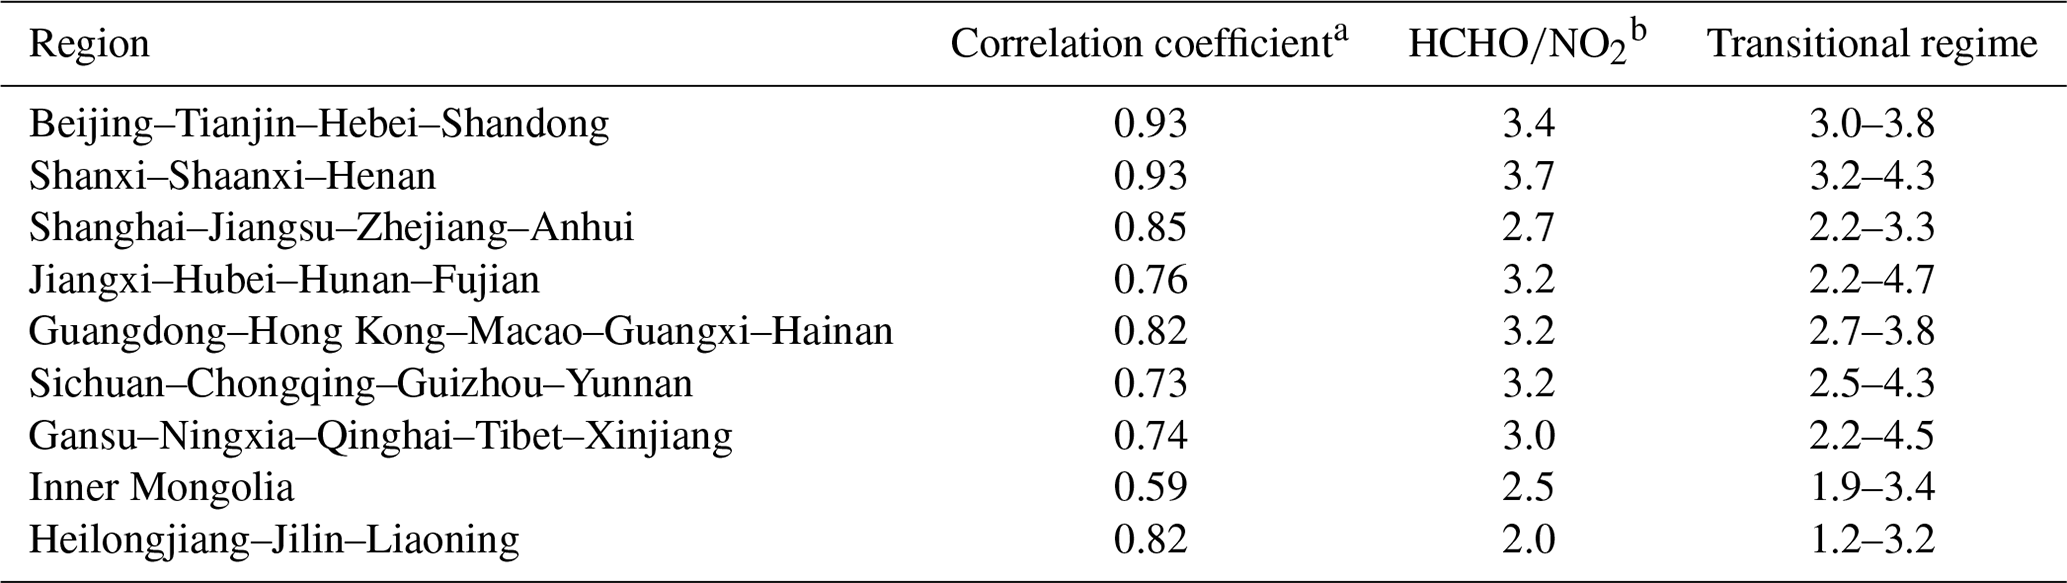
a The Pearson correlation coefficient between the fitted third-order polynomial curve and the data. b value at the maximum of the fitted curve (peak O3 concentration).
The thresholds in the present study are higher than the previously reported model-based values, such as 1–2 by Jin and Holloway (2015) and Duncan et al. (2010), and 1.5–2.3 by Chang et al. (2016). Thus, this observation-based method indicates that O3 production tends to be VOC-limited at the same . This discrepancy stems from the different approaches linking to O3 production regimes. Previous modeling studies derived thresholds by simulating the response of surface O3 to the overall reductions in NOx or VOC emissions. Moreover, these thresholds were derived from the study area in the United States, which best represents regional rather than local O3–NOx–VOC sensitivities (Martin et al., 2004; Jin et al., 2017). Thresholds derived with in situ observations in China take full account of the local O3 chemistry.
3.2.2 Spatial distribution of O3 production regimes
The derived thresholds were used to identify the O3 production regimes over China from April to September 2019–2021. Based on the same threshold across China (2.2–3.2) and different thresholds for different regions, two methods yield similar spatial distributions of O3 sensitivity (Figs. S4 and 4). However, the regional approach suggests that O3 production tends to be VOC-limited because the thresholds derived in many key regions individually are higher than the national overall threshold.
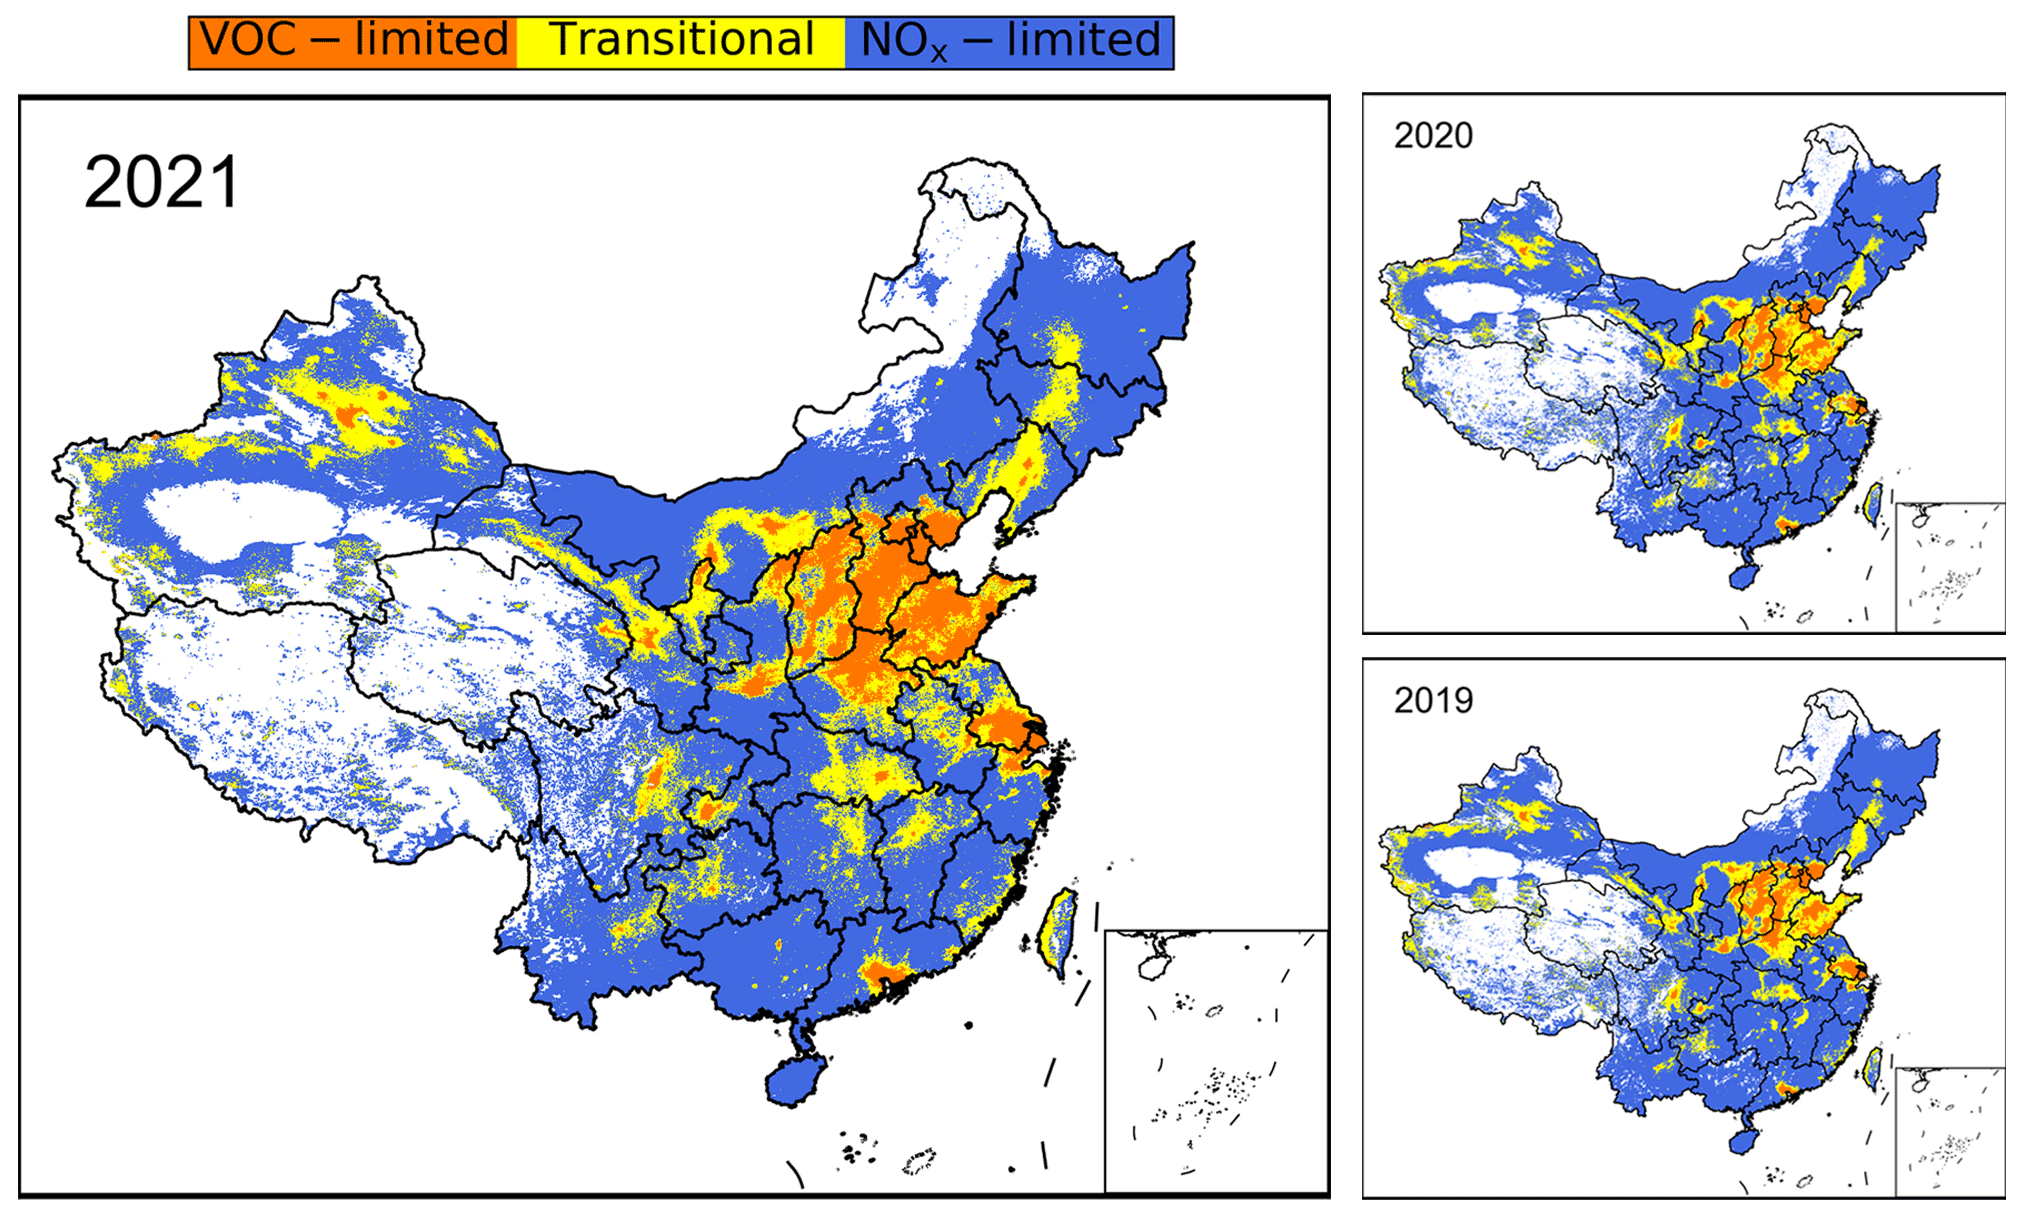
Figure 4Ozone sensitivity classification in the study area from April to September 2019–2021 using different thresholds in different regions. Only polluted regions are displayed (defined as average TROPOMI NO2 columns higher than 1.0×10¹⁵ molec. cm−2).
As shown in Fig. 4, the NOx-limited regime dominates in most regions from April to September. VOC-limited chemistry exists in urban areas of almost every province, with transitional regimes occurring around the VOC-limited regimes in wide urban and suburban areas. Widespread VOC-limited and transitional regimes are observed over major megacity clusters. In the North China Plain, the VOC-limited regimes are distributed in Beijing and most regions in the provinces of Hebei, Shanxi, Henan and Shandong. Transitional regimes control almost all the remaining regions, except for individual cities in northern Hebei and southwestern Henan. The percentages of the VOC-sensitive regime and the transitional regime are 59.2 % and 26.7 % in 2021 (Table S1). In the Yangtze River Delta, the VOC-limited regimes are found in some developed urban cities including Shanghai and some cities in southern Jiangsu Province (such as Suzhou, Wuxi and most of Nanjing and Nantong) and Zhejiang Province (Jiaxing, urban areas of Hangzhou and Ningbo). VOC-limited and transitional or mixed regimes occupy 23.5 % and 31.4 % of the total grid cells (Table S1). In the Pearl River Delta and surrounding areas (Guangdong Province), VOC-limited regimes (8.0 %) and transitional regimes (11.0 %) control Shenzhen, Dongguan, Foshan, Zhongshan, Zhuhai, most of Guangzhou and some other urban areas, whereas NOx-sensitive regimes dominate most of the remaining cities. In addition, extensive VOC-limited and transitional regimes occur in developed cities of Sichuan Basin (urban centers of Chongqing and Chengdu), Shaanxi Province (Xi'an), Hubei Province (Wuhan) and other regions. Compared with previous studies (Jin and Holloway, 2015; Wang et al., 2019), the results of this study are slightly different. The areas dominated by VOC-limited and transitional regimes in China are expanded, especially in NCP, while in the southern region (e.g., Guangdong Province), VOC-sensitive regimes are only concentrated in major cities.
Air quality monitoring sites are generally located in built-up areas of cities, representing the environment in which people live. The ozone sensitivity regime of all monitoring sites' locations based on and the O3 MDA8-90th in 2021 are shown in Fig. S5. VOC-limited and transitional regimes dominate O3 formation at 86.2 % of the sites, with VOC-limited chemistry accounting for 52.5 %.
The comparison of O3 sensitivities from 2019 to 2021 (Fig. 4) shows a slight change in the trends of individual regions from VOC-limited regimes to transitional regimes or from transitional regimes to NOx-limited regimes as a result of NOx reduction. However, there has been no remarkable change in China as a whole. The changes in VOC and NOx emissions in recent years have not led to the transition in the spatial distribution of the O3 production regime defined by our thresholds.
3.3 Effects of ozone precursors' variations on ozone
Based on the non-linear O3–NOx–VOC relationship, changes in ozone precursors can directly affect ozone levels. Ground-based measurements of NO2 and satellite-based NO2 columns are used to indicate the changes in NOx emissions. As shown in Figs. 5a and S6, NO2 is concentrated over urban areas and industrial cities, particularly in megacity clusters, such as the NCP, YRD and PRD and large cities, such as Wuhan (in Hubei) and Xi'an (in Shaanxi). Satellite observations show large NO2 decreases from 2013. This finding is consistent with previous studies (Wang et al., 2019; Lin et al., 2019). Moreover, the decrease is more than 2.8 % yr−1 in half of the grids. Figure 5b shows that the average annual reduction in satellite NO2 in eastern China is 2.96 % (0.11×10¹⁵ molec. cm−2, p<0.01). Figure S8 shows similar trends in surface NO2 concentrations and satellite-based NO2 columns averaged in April–September. More than 75 % of the cities show negative trends in surface NO2 levels (and 22 % with p<0.05), and nearly 64 % of the grids show decreases in satellite NO2 columns. Strong and consistent decreases in high-value areas, particularly the NCP, as well as YRD, PRD and SCB, have been observed in the last 9 years. The mean NO2 in NCP has decreased by 0.37×10¹⁵ molec. cm−2 yr−1 (4.59 %, p<0.01) from 2013 to 2021.
The variations in VOCs primarily drive the temporal patterns of satellite HCHO columns over China (Shen et al., 2019). The changes in satellite HCHO can roughly indicate changes in VOC emissions, which has been applied in several previous studies (K. Li et al., 2020; Shen et al., 2019; Zhu et al., 2014). Figures 6a and S7 compare the HCHO columns from April to September 2013–2021. As expected, a clear gap exists between the HCHO in southeast and northwest China. The mean HCHO is high over megacity clusters in the southeastern regions, such as the North China Plain, Sichuan Basin, Yangtze River Delta, Pearl River Delta and the Central Yangtze River plain. More than 45 % of the grids show positive trends in satellite HCHO columns in 2013–2021. HCHO columns increase insignificantly by 0.90 % yr−1, averaged for all grids in 2013–2019 in eastern China. This finding is consistent with the increases in anthropogenic VOC emissions (Zheng et al., 2018; Zhang et al., 2019). In 2020–2021, satellite-based HCHO decreases in most of eastern China compared to 2019.
In addition to anthropogenic and biogenic emissions, the long-term changes in HCHO are driven by several other factors (Zhu et al., 2017): NOx reductions can lower the HCHO yield from isoprene oxidation (Souri et al., 2020; Wolfe et al., 2016), and, in addition, HCHO columns may show interannual variability driven by interannual variability of meteorology, particularly temperature as shown in Fig. S9 (Duncan et al., 2009; Abbot et al., 2003). Nevertheless, HCHO has not declined as dramatically as NO2, particularly until 2019. In the NCP, where VOC-limited chemistry exists most widely, the gap between HCHO and NO2 changes is even larger.
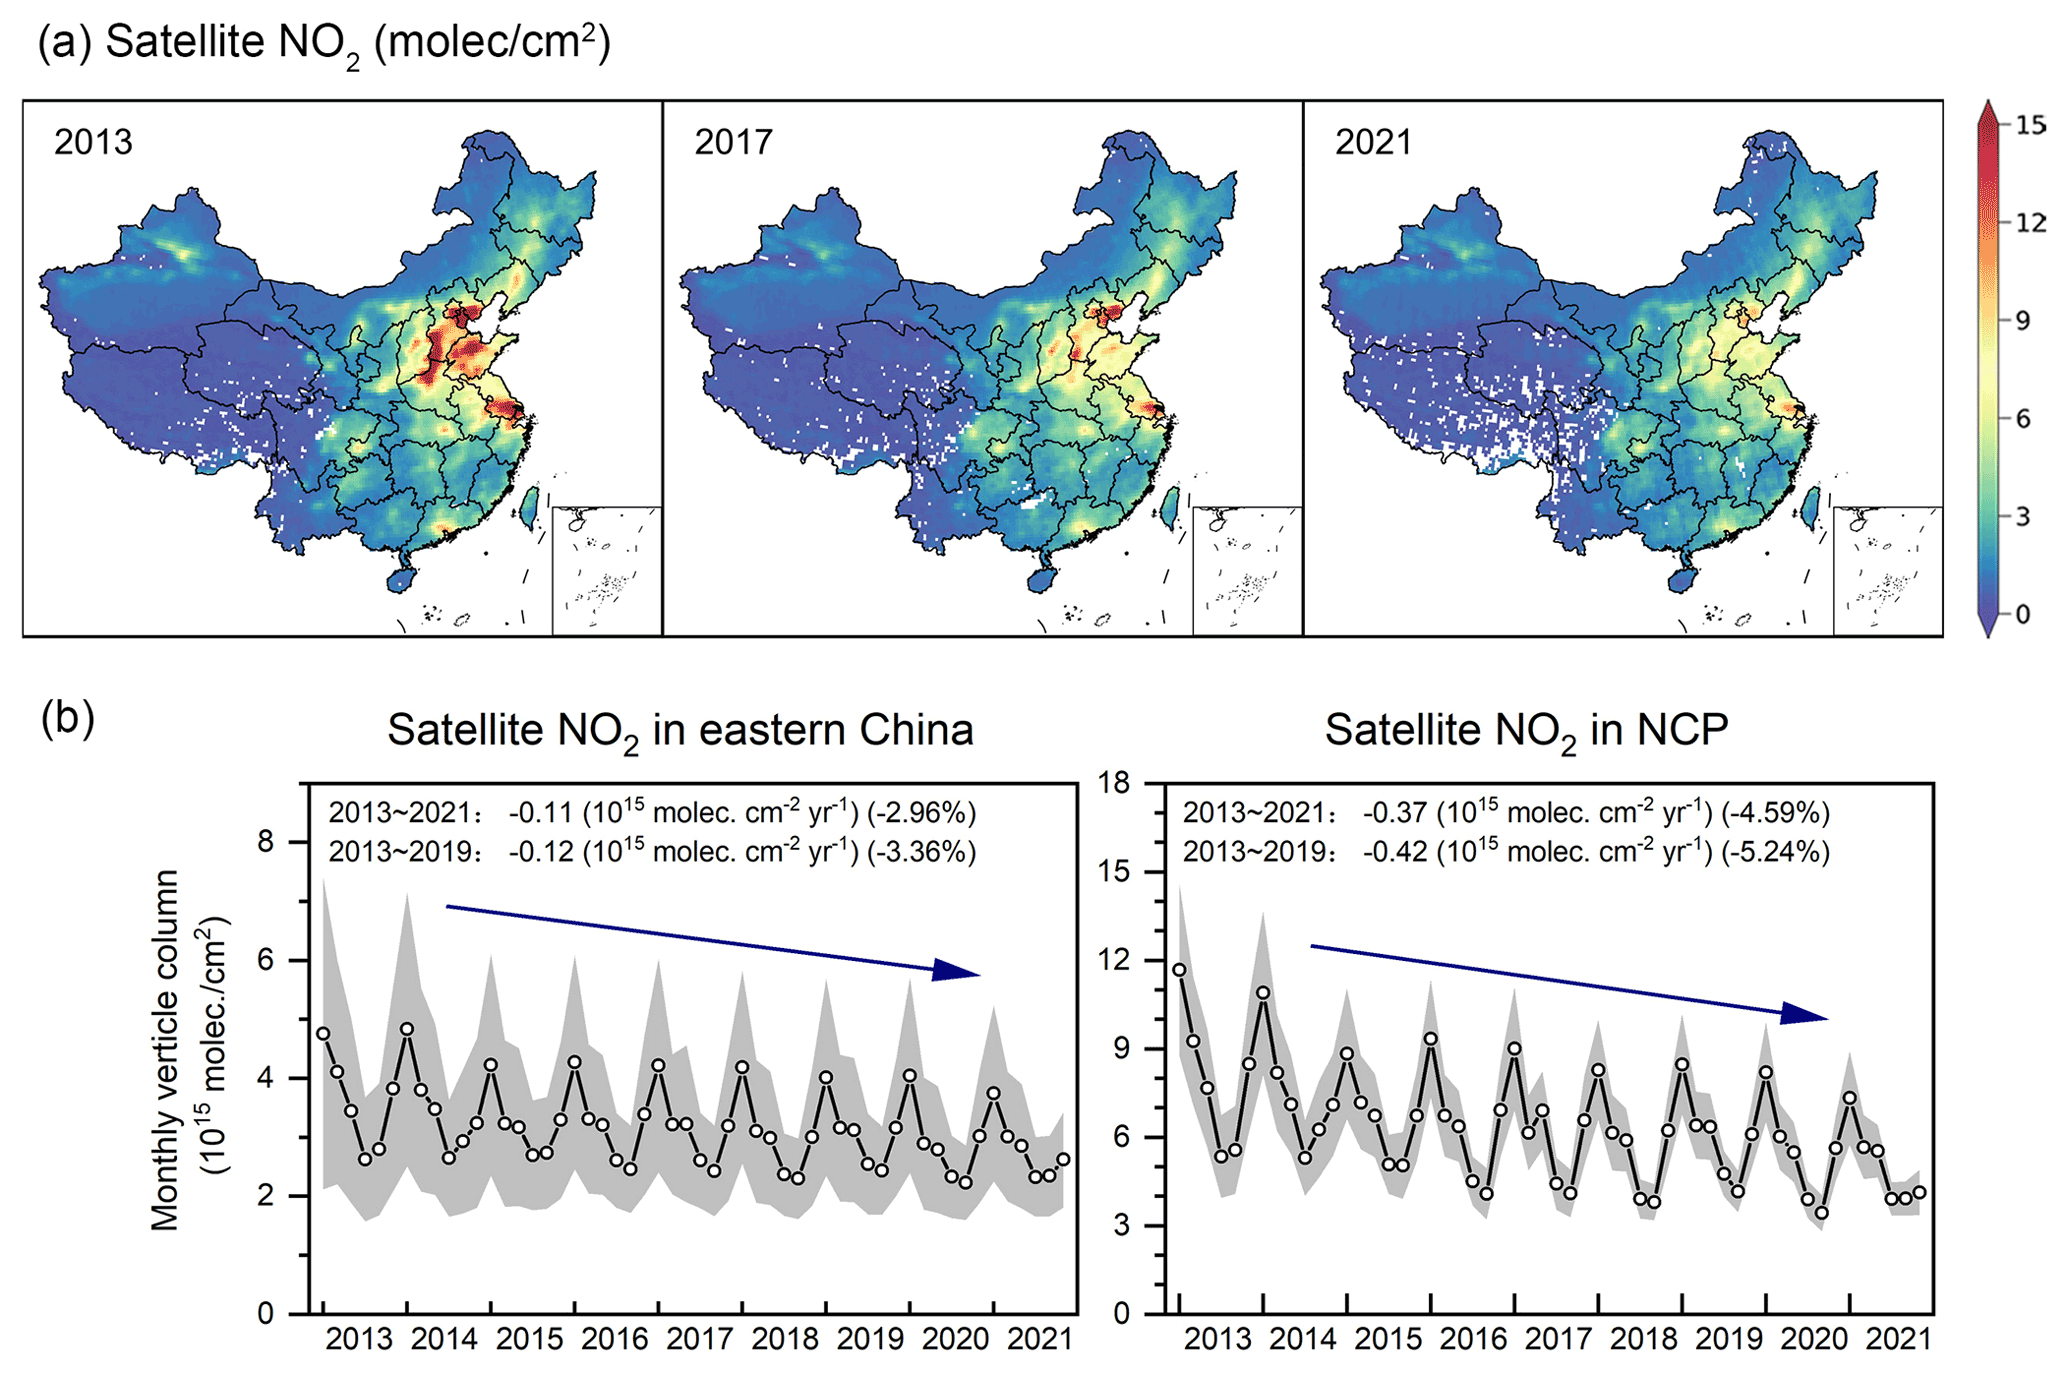
Figure 5(a) Maps of average satellite-based NO2 columns from April to September and (b) monthly mean NO2 columns averaged over eastern China and the North China Plain in April–September. Gray shading: mean value ±50 % standard deviation across all grids for each month. Inset: absolute annual linear trend and percentage of annual trend (% yr−1, the linear trend divided by the 2013 mean values).

Figure 6Same as Fig. 5 but for satellite-based HCHO columns.
The changes in VOC and NOx emissions presumably have the same disparity as the changes in satellite HCHO and NO2. The anthropogenic NOx emission has been decreased considerably since 2013. However, VOC emissions have not been effectively reduced or even slightly increased until 2019. The significant NOx reduction alone without effective VOC control has not worked or has even aggravated O3 pollution in recent years because of the VOC-limited (or NOx-saturated) O3 production regimes in major city clusters. Considering that biological VOC also increased (L. Li et al., 2020), it is clear that the reduction in anthropogenic VOCs is not sufficient to bring down the total VOC emissions. The slight decrease in HCHO and the corresponding slight decrease in O3 concentrations in 2020–2021 are more indicative of the effect of the lack of VOC emission reductions on the increase in O3 over the last 9 years.

Figure 7O3 concentration as a function of for all sites in Beijing, Chengdu and Guangzhou. Black dots and lines are the same as those in Fig. 3b but divided into 100 bins, and blue circles are original concentrations.
3.4 reduction ratio for typical cities
The synergistic control of NOx and VOC, with VOC control as the focus, can help reduce ozone pollution in major cities. The reduction ratio of can be indicated by the slope of the ridge line of the classic ozone isopleths (Ou et al., 2016; Wang et al., 2019). The relationship between O3 concentrations and the satellite HCHO and NO2 columns reflected by the approach in Fig. 3a is similar to the O3–VOC–NOx isopleths. Thus the peak of the fitted curve of O3 and , corresponding to the ridge line of O3 isopleths, is the ratio of HCHO to NO2 reduction for the fastest decrease in O3, i.e., .
This approach is used to provide preliminary scenarios for synergistic VOC and NOx reduction in three developed cities: Beijing in the NCP, Guangzhou in the PRD and Chengdu in the SCB. All of these are dominated by the VOC-limited regime. As shown in Fig. 7, the optimal decrease ratio of HCHO to NO2 is between 2:1 and 4:1, which is 3.4–3.9 for Beijing, 2.2–2.6 for Chengdu and 2.3–2.8 for Guangzhou. The results obtained by this method roughly reflect the optimal abatement pathways for the two precursors by using the satellite HCHO and NO2 to represent VOC and NOx. The short-term future O3 control becomes much more promising in terms of enhanced VOC control in urban cities dominated by VOC-limited regimes.
Based on the evaluation of the non-linearity of O3–NOx–VOC chemistry captured by space-based , this study derives thresholds marking the transitions between chemical regimes in different regions of China and diagnoses the current spatial distribution of O3 production regimes. To reveal the causes of O3 increases, O3 responses to precursor changes are evaluated by tracking VOCs and NOx with satellite HCHO and NO2.
Results showed that the ranges of transition from VOC-limited to NOx-limited regimes apparently vary among Chinese regions, which is inconsistent with previous studies (Wang et al., 2021; Li et al., 2021). The higher-resolution TROPOMI satellite data enable a better match between the location of ground-based O3 monitoring stations and the grid of satellite data, thus allowing a more accurate derivation of thresholds and reflection of ozone–NOx–VOC sensitivity. For April–September 2021, VOC-limited regimes are widely found over megacity clusters (NCP, YRD and PRD) and concentrated in developed cities (such as Chengdu, Chongqing, Xi'an and Wuhan). NOx-limited regimes dominate most of the remaining areas. Moreover, the high-resolution TROPOMI data can more accurately resolve strongly VOC-limited conditions in urban cores.
However, the use of satellite for quantitative diagnosis of ozone–NOx–VOC sensitivity is influenced by the following uncertainties and requires further investigation. First, the thresholds derived from the observation-based approach may be affected by biases in the satellite retrieval algorithm. Satellite instruments measure vertically integrated column densities, and the inhomogeneity of the vertical distribution might impose negative influences (Schroeder et al., 2017). Second, the relationship between satellite-based HCHO and surface VOC reactivity is not fully understood. There are differences in HCHO yields for different classes of VOCs (Shen et al., 2019). Biogenic VOC emissions also have an influence. Since HCHO is a weaker UV-visible absorber than NO2, satellite retrieval of HCHO is more error-prone. These factors may limit their usefulness in detecting HCHO from local sources of anthropogenic VOCs.
Identifying the causes of ozone increases since 2013 is crucial for effectively controlling ozone pollution in China. From 2013 to 2021, satellite NO2 and HCHO columns showed an annual decrease of 3.0 % and 0.3 %, respectively, indicating an effective reduction in NOx emissions alone without effective VOC control. The Chinese government has been controlling mainly particulate matter, SO2 and NOx since 1998 (Zhang et al., 2016). The Air Pollution Prevention and Action Plan, implemented in 2013, aimed to reduce the annual average PM2.5 concentration by 10 % in 2017 compared with 2012 (Chinese State Council, 2013). In 2018, the Chinese government promulgated the Three-Year Action Plan for Winning the Battle of the Blue Sky, which still regards PM2.5 control as the primary goal and targets SO2 and NOx emission reductions (Chinese State Council, 2018). These nationwide emission control measures have decreased PM2.5 concentrations rapidly (Xiao et al., 2021) and reduced anthropogenic NOx emissions. At the same time, however, the decline in VOC emissions is not yet evident until 2019. VOC-limited chemistry exists in most city clusters in China, particularly in built-up areas of cities where air quality monitoring sites are located. As a result, this has led to no significant decrease in O3. The slight decrease in VOC and the corresponding slight decrease in O3 concentrations in 2020–2021 are more indicative of the effect of the lack of VOC emission reductions on O3 increases over the last 9 years.
In summary, the significant reduction in NOx alone without effective control of VOC, combined with the effect of the decrease in PM2.5 mentioned in previous studies (Li et al., 2019, 2022), has led to an increase in O3 in major regions in China. Currently, the VOC-limited regime exists in most major urban clusters in China, which are also areas with high ozone levels. The exploration of the causes of ozone rise in China illustrates the current need for VOC control, which is consistent with the findings of previous studies on major cities and city clusters (Wang et al., 2022; Yang et al., 2019). Appropriate reduction ratios of VOC and NOx emission can control both PM2.5 and O3 pollution, which is suggested by the simultaneous decline in O3 and PM2.5 concentrations in Beijing in recent years (Ren et al., 2021). Deep NOx reductions will eventually reduce O3 concentrations to lower levels. However, if only NOx is currently reduced without VOC reductions, O3 concentrations will not be effectively reduced until NOx is reduced to very low levels, leading to a shift in O3 formation mechanisms toward NOx-limited. This would take a long time and be very costly. In contrast, synergistic control of NOx and VOC, with a focus on VOC control, is currently a direct and effective approach to alleviating ozone pollution in large cities.
The surface O3 and NO2 network data are available at https://quotsoft.net/air (Wang, 2022). The OMI satellite data for NO2 and HCHO are available at https://disc.gsfc.nasa.gov/ (GES DISC, 2022). The TROPOMI data for NO2 and HCHO are available from the Earth Engine Data Catalog at https://developers.google.com/earth-engine/datasets/catalog/sentinel-5p (last access: 1 September 2022).
The supplement related to this article is available online at: https://doi.org/10.5194/acp-22-15035-2022-supplement.
SX and JR initiated the research project. JR performed the data analyses and wrote the paper. SX and FG reviewed and revised the paper.
The contact author has declared that none of the authors has any competing interests.
Publisher's note: Copernicus Publications remains neutral with regard to jurisdictional claims in published maps and institutional affiliations.
This research has been supported by the National Key Research and Development Program of China (grant no. 2018YFC0214001).
This paper was edited by Anne Perring and reviewed by two anonymous referees.
Abbot, D. S., Palmer, P. I., Martin, R. V., Chance, K. V., Jacob, D. J., and Guenther, A.: Seasonal and interannual variability of North American isoprene emissions as determined by formaldehyde column measurements from space, Geophys. Res. Lett., 30, 1886, https://doi.org/10.1029/2003GL017336, 2003.
Atkinson, R.: Atmospheric chemistry of VOCs and NOx, Atmos. Environ., 34, 2063–2101, https://doi.org/10.1016/S1352-2310(99)00460-4, 2000.
Chang, C., Faust, E., Hou, X., Lee, P., Kim, H. C., Hedquist, B. C., and Liao, K.: Investigating ambient ozone formation regimes in neighboring cities of shale plays in the Northeast United States using photochemical modeling and satellite retrievals, Atmos. Environ., 142, 152–170, https://doi.org/10.1016/j.atmosenv.2016.06.058, 2016.
Chinese State Council: Action plan on air pollution prevention and control: http://www.gov.cn/zwgk/2013-09/12/content_2486773.htm, (last accessed: 7 March 2022), 2013 (in Chinese).
Chinese State Council: Three-year action plan on defending the blue Sky: http://www.gov.cn/zhengce/content/2018-07/03/content_5303158.htm, (last accessed: 7 March 2022), 2018 (in Chinese).
Choi, Y., Kim, H., Tong, D., and Lee, P.: Summertime weekly cycles of observed and modeled NOx and O3 concentrations as a function of satellite-derived ozone production sensitivity and land use types over the Continental United States, Atmos. Chem. Phys., 12, 6291–6307, https://doi.org/10.5194/acp-12-6291-2012, 2012.
Duncan, B. N., Yoshida, Y., Damon, M. R., Douglass, A. R., and Witte, J. C.: Temperature dependence of factors controlling isoprene emissions, Geophys. Res. Lett., 36, L05813, https://doi.org/10.1029/2008GL037090, 2009.
Duncan, B. N., Yoshida, Y., Olson, J. R., Sillman, S., Martin, R. V., Lamsal, L., Hu, Y., Pickering, K. E., Retscher, C., Allen, D. J., and Crawford, J. H.: Application of OMI observations to a space-based indicator of NOx and VOC controls on surface ozone formation, Atmos. Environ., 44, 2213–2223, https://doi.org/10.1016/j.atmosenv.2010.03.010, 2010.
GES DISC: The OMI satellite data for NO2 and HCHO, NASA [data set], https://disc.gsfc.nasa.gov/, last access: 1 September 2022.
Jiang, Z., Jolleys, M. D., Fu, T., Palmer, P. I., Ma, Y., Tian, H., Li, J., and Yang, X.: Spatiotemporal and probability variations of surface PM2.5 over China between 2013 and 2019 and the associated changes in health risks: An integrative observation and model analysis, Sci. Total Environ., 723, 137896, https://doi.org/10.1016/j.scitotenv.2020.137896, 2020.
Jin, X. and Holloway, T.: Spatial and temporal variability of ozone sensitivity over China observed from the Ozone Monitoring Instrument, J. Geophys. Res.-Atmos., 120, 7229–7246, https://doi.org/10.1002/2015JD023250, 2015.
Jin, X., Fiore, A. M., Murray, L. T., Valin, L. C., Lamsal, L. N., Duncan, B., Folkert Boersma, K., De Smedt, I., Abad, G. G., Chance, K., and Tonnesen, G. S.: Evaluating a Space-Based Indicator of Surface Ozone-NOx-VOC Sensitivity Over Midlatitude Source Regions and Application to Decadal Trends, J. Geophys. Res.-Atmos., 122, 410–439, https://doi.org/10.1002/2017JD026720, 2017.
Jin, X., Fiore, A., Boersma, K. F., De Smedt, I., and Valin, L.: Inferring Changes in Summertime Surface Ozone-NOx-VOC Chemistry over US Urban Areas from Two Decades of Satellite and Ground-Based Observations, Environ. Sci. Technol., 54, 6518–6529, https://doi.org/10.1021/acs.est.9b07785, 2020.
Kleinman, L. I.: Low and high NOx tropospheric photochemistry, J. Geophys. Res.-Atmos., 99, 16831–16838, https://doi.org/10.1029/94JD01028, 1994.
Lamsal, L. N., Krotkov, N. A., Celarier, E. A., Swartz, W. H., Pickering, K. E., Bucsela, E. J., Gleason, J. F., Martin, R. V., Philip, S., Irie, H., Cede, A., Herman, J., Weinheimer, A., Szykman, J. J., and Knepp, T. N.: Evaluation of OMI operational standard NO2 column retrievals using in situ and surface-based NO2 observations, Atmos. Chem. Phys., 14, 11587–11609, https://doi.org/10.5194/acp-14-11587-2014, 2014.
Li, C., Zhu, Q. D., Jin, X. M., and Cohen, R. C.: Elucidating Contributions of Anthropogenic Volatile Organic Compounds and Particulate Matter to Ozone Trends over China, Environ. Sci. Technol., 56, 12906–12916, https://doi.org/10.1021/acs.est.2c03315, 2022.
Li, D., Wang, S., Xue, R., Zhu, J., Zhang, S., Sun, Z., and Zhou, B.: OMI-observed HCHO in Shanghai, China, during 2010–2019 and ozone sensitivity inferred by an improved ratio, Atmos. Chem. Phys., 21, 15447–15460, https://doi.org/10.5194/acp-21-15447-2021, 2021.
Li, K., Jacob, D. J., Liao, H., Shen, L., Zhang, Q., and Bates, K. H.: Anthropogenic drivers of 2013–2017 trends in summer surface ozone in China, P. Natl. Acad. Sci. USA, 116, 422–427, https://doi.org/10.1073/pnas.1812168116, 2019.
Li, K., Jacob, D. J., Shen, L., Lu, X., De Smedt, I., and Liao, H.: Increases in surface ozone pollution in China from 2013 to 2019: anthropogenic and meteorological influences, Atmos. Chem. Phys., 20, 11423–11433, https://doi.org/10.5194/acp-20-11423-2020, 2020.
Li, L., Yang, W. Z., Xie, S. D., and Wu, Y.: Estimations and uncertainty of biogenic volatile organic compound emission inventory in China for 2008–2018, Sci. Total Environ., 733, 139301, https://doi.org/10.1016/j.scitotenv.2020.139301, 2020.
Li, R., Xu, M., Li, M., Chen, Z., Zhao, N., Gao, B., and Yao, Q.: Identifying the spatiotemporal variations in ozone formation regimes across China from 2005 to 2019 based on polynomial simulation and causality analysis, Atmos. Chem. Phys., 21, 15631–15646, https://doi.org/10.5194/acp-21-15631-2021, 2021.
Lin, N., Wang, Y., Zhang, Y., and Yang, K.: A large decline of tropospheric NO2 in China observed from space by SNPP OMPS, Sci. Total Environ., 675, 337–342, https://doi.org/10.1016/j.scitotenv.2019.04.090, 2019.
Liu, C. and Shi, K.: A review on methodology in O3-NOx-VOC sensitivity study, Environ. Pollut., 291, 118249, https://doi.org/10.1016/j.envpol.2021.118249, 2021.
Lu, X., Hong, J., Zhang, L., Cooper, O. R., Schultz, M. G., Xu, X., Wang, T., Gao, M., Zhao, Y., and Zhang, Y.: Severe Surface Ozone Pollution in China: A Global Perspective, Environ. Sci. Tech. Let., 5, 487–494, https://doi.org/10.1021/acs.estlett.8b00366, 2018.
Lu, X., Zhang, L., Wang, X., Gao, M., Li, K., Zhang, Y., Yue, X., and Zhang, Y.: Rapid Increases in Warm-Season Surface Ozone and Resulting Health Impact in China Since 2013, Environ. Sci. Tech. Let., 7, 240–247, https://doi.org/10.1021/acs.estlett.0c00171, 2020.
Martin, R. V.: Global inventory of nitrogen oxide emissions constrained by space-based observations of NO2 columns, J. Geophys. Res., 108, 4537, https://doi.org/10.1029/2003JD003453, 2003.
Martin, R. V., Fiore, A. M., and Van Donkelaar, A.: Space-based diagnosis of surface ozone sensitivity to anthropogenic emissions, Geophys. Res. Lett., 31, L06120, https://doi.org/10.1029/2004GL019416, 2004.
Nelson, B. S., Stewart, G. J., Drysdale, W. S., Newland, M. J., Vaughan, A. R., Dunmore, R. E., Edwards, P. M., Lewis, A. C., Hamilton, J. F., Acton, W. J., Hewitt, C. N., Crilley, L. R., Alam, M. S., Şahin, Ü. A., Beddows, D. C. S., Bloss, W. J., Slater, E., Whalley, L. K., Heard, D. E., Cash, J. M., Langford, B., Nemitz, E., Sommariva, R., Cox, S., Shivani, Gadi, R., Gurjar, B. R., Hopkins, J. R., Rickard, A. R., and Lee, J. D.: In situ ozone production is highly sensitive to volatile organic compounds in Delhi, India, Atmos. Chem. Phys., 21, 13609–13630, https://doi.org/10.5194/acp-21-13609-2021, 2021.
Ou, J., Yuan, Z., Zheng, J., Huang, Z., Shao, M., Li, Z., Huang, X., Guo, H., and Louie, P. K. K.: Ambient Ozone Control in a Photochemically Active Region: Short-Term Despiking or Long-Term Attainment?, Environ. Sci. Technol., 50, 5720–5728, https://doi.org/10.1021/acs.est.6b00345, 2016.
Pusede, S. E., Steiner, A. L., and Cohen, R. C.: Temperature and Recent Trends in the Chemistry of Continental Surface Ozone, Chem. Rev., 115, 3898–3918, https://doi.org/10.1021/cr5006815, 2015.
Ren, J., Hao, Y., Simayi, M., Shi, Y., and Xie, S.: Spatiotemporal variation of surface ozone and its causes in Beijing, China since 2014, Atmos. Environ., 260, 118556, https://doi.org/10.1016/j.atmosenv.2021.118556, 2021.
Schroeder, J. R., Crawford, J. H., Fried, A., Walega, J., Weinheimer, A., Wisthaler, A., Muller, M., Mikoviny, T., Chen, G., Shook, M., Blake, D. R., and Tonnesen, G. S.: New insights into the column ratio as an indicator of near-surface ozone sensitivity, J. Geophys. Res.-Atmos., 122, 8885–8907, https://doi.org/10.1002/2017JD026781, 2017.
Shen, H., Sun, Z., Chen, Y., Russell, A. G., Hu, Y., Odman, M. T., Qian, Y., Archibald, A. T., and Tao, S.: Novel Method for Ozone Isopleth Construction and Diagnosis for the Ozone Control Strategy of Chinese Cities, Environ. Sci. Technol., 55, 15625–15636, https://doi.org/10.1021/acs.est.1c01567, 2021.
Shen, L., Jacob, D. J., Zhu, L., Zhang, Q., Zheng, B., Sulprizio, M. P., Li, K., De Smedt, I., Abad, G. G., Cao, H., Fu, T., and Liao, H.: The 2005-2016 Trends of Formaldehyde Columns Over China Observed by Satellites: Increasing Anthropogenic Emissions of Volatile Organic Compounds and Decreasing Agricultural Fire Emissions, Geophys. Res. Lett., 46, 4468–4475, https://doi.org/10.1029/2019GL082172, 2019.
Sillman, S.: The use of NOY, H2O2, and HNO3 as indicators for ozone-nox-hydrocarbon sensitivity in urban locations, J. Geophys. Res.-Atmos., 100, 14175–14188, https://doi.org/10.1029/94JD02953, 1995.
Sillman, S.: The relation between ozone, NOx and hydrocarbons in urban and polluted rural environments, Atmos. Environ., 33, 1821–1845, https://doi.org/10.1016/S1352-2310(98)00345-8, 1999.
Sillman, S. and He, D. Y.: Some theoretical results concerning O-3-NOx-VOC chemistry and NOx-VOC indicators, J. Geophys. Res.-Atmos., 107, 4659, https://doi.org/10.1029/2001JD001123, 2002.
Sillman, S., Logan, J. A., and Wofsy, S. C.: The sensitivity of ozone to nitrogen oxides and hydrocarbons in regional ozone episodes, J. Geophys. Res.-Atmos., 95, 1837–1851, https://doi.org/10.1029/JD095iD02p01837, 1990.
Simayi, M., Shi, Y., Xi, Z., Ren, J., Hini, G., and Xie, S.: Emission trends of industrial VOCs in China since the clean air action and future reduction perspectives, Sci. Total Environ., 826, 153994, https://doi.org/10.1016/j.scitotenv.2022.153994, 2022.
Souri, A. H., Nowlan, C. R., Wolfe, G. M., Lamsal, L. N., Chan Miller, C. E., Abad, G. G., Janz, S. J., Fried, A., Blake, D. R., Weinheimer, A. J., Diskin, G. S., Liu, X., and Chance, K.: Revisiting the effectiveness of HCHO/NO2 ratios for inferring ozone sensitivity to its precursors using high resolution airborne remote sensing observations in a high ozone episode during the KORUS-AQ campaign, Atmos. Environ., 224, 117341, https://doi.org/10.1016/j.atmosenv.2020.117341, 2020.
Tan, Z., Lu, K., Jiang, M., Su, R., Dong, H., Zeng, L., Xie, S., Tan, Q., and Zhang, Y.: Exploring ozone pollution in Chengdu, southwestern China: A case study from radical chemistry to O3-VOC-NOx sensitivity, Sci. Total Environ., 636, 775–786, https://doi.org/10.1016/j.scitotenv.2018.04.286, 2018.
Veefkind, J. P., Aben, I., McMullan, K., Forster, H., de Vries, J., Otter, G., Claas, J., Eskes, H. J., de Haan, J. F., Kleipool, Q., van Weele, M., Hasekamp, O., Hoogeveen, R., Landgraf, J., Snel, R., Tol, P., Ingmann, P., Voors, R., Kruizinga, B., Vink, R., Visser, H., and Levelt, P. F.: TROPOMI on the ESA Sentinel-5 Precursor: A GMES mission for global observations of the atmospheric composition for climate, air quality and ozone layer applications, Remote Sens. Environ., 120, 70–83, https://doi.org/10.1016/j.rse.2011.09.027, 2012.
Wang, N., Lyu, X., Deng, X., Huang, X., Jiang, F., and Ding, A.: Aggravating O3 pollution due to NOx emission control in eastern China, Sci. Total Environ., 677, 732–744, https://doi.org/10.1016/j.scitotenv.2019.04.388, 2019.
Wang, T., Xue, L., Brimblecombe, P., Lam, Y. F., Li, L., and Zhang, L.: Ozone pollution in China: A review of concentrations, meteorological influences, chemical precursors, and effects, Sci. Total Environ., 575, 1582–1596, https://doi.org/10.1016/j.scitotenv.2016.10.081, 2017.
Wang, W., van der A, R., Ding, J., van Weele, M., and Cheng, T.: Spatial and temporal changes of the ozone sensitivity in China based on satellite and ground-based observations, Atmos. Chem. Phys., 21, 7253–7269, https://doi.org/10.5194/acp-21-7253-2021, 2021.
Wang, W., Parrish, D. D., Wang, S., Bao, F., Ni, R., Li, X., Yang, S., Wang, H., Cheng, Y., and Su, H.: Long-term trend of ozone pollution in China during 2014–2020: distinct seasonal and spatial characteristics and ozone sensitivity, Atmos. Chem. Phys., 22, 8935–8949, https://doi.org/10.5194/acp-22-8935-2022, 2022.
Wang, X., Fu, T., Zhang, L., Cao, H., Zhang, Q., Ma, H., Shen, L., Evans, M. J., Ivatt, P. D., Lu, X., Chen, Y., Zhang, L., Feng, X., Yang, X., Zhu, L., and Henze, D. K.: Sensitivities of Ozone Air Pollution in the Beijing–Tianjin–Hebei Area to Local and Upwind Precursor Emissions Using Adjoint Modeling, Environ. Sci. Technol., 55, 5752–5762, https://doi.org/10.1021/acs.est.1c00131, 2021.
Wang, X. L.: Historical air quality data in China, Quotsoft [data set], https://quotsoft.net/air, last access: 1 September 2022.
Wolfe, G. M., Kaiser, J., Hanisco, T. F., Keutsch, F. N., de Gouw, J. A., Gilman, J. B., Graus, M., Hatch, C. D., Holloway, J., Horowitz, L. W., Lee, B. H., Lerner, B. M., Lopez-Hilifiker, F., Mao, J., Marvin, M. R., Peischl, J., Pollack, I. B., Roberts, J. M., Ryerson, T. B., Thornton, J. A., Veres, P. R., and Warneke, C.: Formaldehyde production from isoprene oxidation across NOx regimes, Atmos. Chem. Phys., 16, 2597–2610, https://doi.org/10.5194/acp-16-2597-2016, 2016.
World Health Organization: WHO's global air-quality guidelines0140-6736, https://www.who.int/publications/i/item/9789240034228 (last access: 1 September 2022), 2021.
Xiao, Q., Geng, G., Xue, T., Liu, S., Cai, C., He, K., and Zhang, Q.: Tracking PM2.5 and O-3 Pollution and the Related Health Burden in China 2013–2020, Environ. Sci. Technol., 56, 6922–6932, https://doi.org/10.1021/acs.est.1c04548, 2021.
Yang, L., Luo, H., Yuan, Z., Zheng, J., Huang, Z., Li, C., Lin, X., Louie, P. K. K., Chen, D., and Bian, Y.: Quantitative impacts of meteorology and precursor emission changes on the long-term trend of ambient ozone over the Pearl River Delta, China, and implications for ozone control strategy, Atmos. Chem. Phys., 19, 12901–12916, https://doi.org/10.5194/acp-19-12901-2019, 2019.
Zhang, H., Wang, S., Hao, J., Wang, X., Wang, S., Chai, F., and Li, M.: Air pollution and control action in Beijing, J. Clean. Prod., 112, 1519–1527, https://doi.org/10.1016/j.jclepro.2015.04.092, 2016.
Zhang, Q., Zheng, Y., Tong, D., Shao, M., Wang, S., Zhang, Y., Xu, X., Wang, J., He, H., Liu, W., Ding, Y., Lei, Y., Li, J., Wang, Z., Zhang, X., Wang, Y., Cheng, J., Liu, Y., Shi, Q., Yan, L., Geng, G., Hong, C., Li, M., Liu, F., Zheng, B., Cao, J., Ding, A., Gao, J., Fu, Q., Huo, J., Liu, B., Liu, Z., Yang, F., He, K., and Hao, J.: Drivers of improved PM2.5 air quality in China from 2013 to 2017, P. Natl. Acad. Sci. USA, 116, 24463–24469, https://doi.org/10.1073/pnas.1907956116, 2019.
Zhao, S., Yin, D., Yu, Y., Kang, S., Qin, D., and Dong, L.: PM2.5 and O3 pollution during 2015–2019 over 367 Chinese cities: Spatiotemporal variations, meteorological and topographical impacts, Environ. Pollut., 264, 114694, https://doi.org/10.1016/j.envpol.2020.114694, 2020.
Zheng, B., Tong, D., Li, M., Liu, F., Hong, C., Geng, G., Li, H., Li, X., Peng, L., Qi, J., Yan, L., Zhang, Y., Zhao, H., Zheng, Y., He, K., and Zhang, Q.: Trends in China's anthropogenic emissions since 2010 as the consequence of clean air actions, Atmos. Chem. Phys., 18, 14095–14111, https://doi.org/10.5194/acp-18-14095-2018, 2018.
Zhu, L., Jacob, D. J., Mickley, L. J., Marais, E. A., Cohan, D. S., Yoshida, Y., Duncan, B. N., Abad, G. G., and Chance, K. V.: Anthropogenic emissions of highly reactive volatile organic compounds in eastern Texas inferred from oversampling of satellite (OMI) measurements of HCHO columns, Environ. Res. Lett., 9, 114004, https://doi.org/10.1088/1748-9326/9/11/114004, 2014.
Zhu, L., Mickley, L. J., Jacob, D. J., Marais, E. A., Sheng, J., Hu, L., Abad, G. G., and Chance, K.: Long-term (2005–2014) trends in formaldehyde (HCHO) columns across North America as seen by the OMI satellite instrument: Evidence of changing emissions of volatile organic compounds, Geophys. Res. Lett., 44, 7079–7086, https://doi.org/10.1002/2017GL073859, 2017.