the Creative Commons Attribution 4.0 License.
the Creative Commons Attribution 4.0 License.
 | 22 Nov 2022
Examining the implications of photochemical indicators for O3–NOx–VOC sensitivity and control strategies: a case study in the Yangtze River Delta (YRD), China
Xun Li
Lin Li
Kangjia Gong
Huizhong Shen
Jingyi Li
Jianlin Hu
Ozone (O3) has become a significant air pollutant in China in recent years. O3 abatement is challenging due to the nonlinear response of O3 to precursors nitrogen oxides (NOx) and volatile organic compounds (VOCs). Photochemical indicators are widely used to estimate the O3–NOx–VOC sensitivity, and this has important policy implications. However, the effectiveness of the indicators has seldom been evaluated. This study examined the applications of four indicators that include the ratio of the production rates of H2O2 and HNO3 (), , , and reactive nitrogen (NOy) in the Yangtze River Delta (YRD) with localized thresholds. The overall accuracy was high (>92 %) for all indicators and not significantly reduced with different simulation periods or in different locations of the region. By comparing with the O3 isopleths, it was found that and showed the most consistency, whereas (NOy) tended to underestimate (overestimate) the positive response of O3 to NOx. Additionally, was less likely to attribute the O3 formation to mixed sensitivity than the other indicators, and this demonstrated a preference for a single-pollutant control strategy. This study also revealed that the details in the methodology used to derive the threshold values impacted the results, and this may produce uncertainties in the application of photochemical indicators.
- Article
(2893 KB) - Full-text XML
-
Supplement
(2232 KB) - BibTeX
- EndNote


Ozone (O3) is one of the most important pollutants in the atmosphere, high concentrations of which pose a serious threat to human health, ecosystems, and global climate change (Y. Wang et al., 2020; Liang et al., 2019; De Marco et al., 2022; Feng et al., 2022; Skeie et al., 2020). Many metropolitan areas in China, such as Beijing–Tianjin–Hebei (BTH), the Yangtze River Delta (YRD), and the Pearl River Delta (PRD), have been experiencing severe O3 pollution in recent years (Gao et al., 2017; Lu et al., 2018). Moreover, unlike the decline in fine particulate matter (PM2.5), the O3 concentrations in urban areas have increased (Wang et al., 2019; Lu et al., 2020; Li et al., 2020).
O3 is produced by photochemical reactions involving nitrogen oxides (NOx) and volatile organic compounds (VOCs). However, the response of O3 to either precursor is nonlinear due to the changing roles of NOx and VOCs with different ratios in O3 chemistry, making O3 pollution abatement more challenging (Wang et al., 2011; Liu et al., 2013). Briefly, when O3 increases with a reduction (increase) in NOx (VOCs), O3 formation is in a NOx-saturated or VOC-limited regime that tends to occur in urban areas or cold seasons with relatively low ratios (Tan et al., 2018; Sillman, 1995). Conversely, O3 decreases with reduced NOx and is typically insensitive to VOC levels in a NOx-limited regime. This is often the case in rural and remote regions with lower NOx emissions (Murphy et al., 2007; Sillman, 1999). Importantly, a reduction in either NOx or VOCs can lead to less O3 production when the O3 formation regime is shifted from one to the other, and this is referred to as the transitional regime (Chen et al., 2021; Jin and Holloway, 2015).
Many approaches, including photochemical indicators, the observation-based modeling method (OBM), and the emission-based method (EBM), have been developed to predict O3–NOx–VOC sensitivity (Sillman, 2002; M. Wang et al., 2020; Shen et al., 2021). Among these approaches, the values of the photochemical indicators (such as , the ratios of hydrogen peroxide to nitric acid () or production rates of H2O2 and HNO3 (), the ratios of formaldehyde to nitrogen dioxide or reactive nitrogen ( or ), the O3-to-nitric-acid ratios (), and NOy) can be derived directly from ground-based measurements, chemical transport models, or even satellite measurements if available and thus have been widely used in previous studies (Martin et al., 2004; Jin and Holloway, 2015; Jiménez and Baldasano, 2004; Sillman, 2002; Liu et al., 2010b). For instance, Ye et al. (2021) presented hourly (NOz= NOy− NOx) ratios based on measurements at Mount Tai and found that O3 formation was VOC-limited in the morning (H2O2 NOz<0.15) and switched to NOx-limited (H2O2 NOz>0.2) in the afternoon. The ratio is considered one of the most robust indicators to determine O3 sensitivity, while the thresholds are highly variable for different regions (Peng et al., 2011; Xie et al., 2014; Ye et al., 2016). is primarily used in modeling work, such as the spatial distribution of O3 formation regimes over the modeling domain that was exhibited with the indicator (Liu et al., 2010a; Du et al., 2022; Zhang et al., 2020). Based on long-term measurements of HCHO and NO2 columns from satellites, Jin and Holloway (2015) found that near-surface O3 formation in several megacities in China had changed from VOC-limited in 2005 to transitional in 2013 with reduced NO2.
The thresholds of photochemical indicators that split VOC-limited, transitional, and NOx-limited regimes vary from region to region, largely depending on local emissions and possibly related to meteorological conditions as well. It was found that the primary emissions of HCHO increased the value of , and therefore the O3 sensitivity determined by the ratio could have been biased with given thresholds. For example, some VOC-limited regimes are misclassified as transitional (Liu et al., 2021). Du et al. (2022) compared the spatial distribution of O3 sensitivity regimes diagnosed using different indicators and pointed out that could be more affected by local emissions than . As H2O2 and HNO3 are very soluble and susceptible to deposition and aerosol formation, the indicator values that involve the two species may change with the meteorological conditions (Castell et al., 2009). However, certain thresholds were often used without considering the variability, such as the range of one to two for (Jin and Holloway, 2015; Tang et al., 2012; Ma et al., 2021). In particular, the integrated source apportionment method (ISAM) implemented in the Community Multiscale Air Quality (CMAQ) model attributes O3 production to either VOC or NOx tracers based on a comparison of the instantaneous with 0.35, and this ultimately affects the source apportionment of O3 using ISAM (Kwok et al., 2015). Whether photochemical indicators can accurately predict O3 sensitivity to precursors with given threshold values has seldom been examined.
In light of the above, this work aimed to revisit the effectiveness of photochemical indicators in the prediction of the O3-precursor response based on a case study in the YRD region in eastern China. Specifically, the work deployed the most used method to derive localized thresholds of the four photochemical indicators (i.e., , , HCHO/NOy, and NOy) for Jiangsu Province in the YRD, which has been experiencing severe photochemical pollution (Qin et al., 2021; Xu et al., 2021; Lu et al., 2018). The assessment was conducted to examine three aspects: (1) whether the localized threshold values are appropriate for a different location or a different year, (2) the consistency of the photochemical indicator approach with O3 isopleths plots for predicting the O3–NOx–VOC response, and (3) possible uncertainties induced by the methodology with which the threshold values are determined. This work can provide insight into the use of photochemical indicators in understanding O3 formation and making effective strategies for emission control.
2.1 Model configurations
The CMAQ model version 5.2 was applied to simulate the photochemical pollution over the YRD and its surrounding areas (Fig. 1) in July 2017. The simulation was performed at a 4 km resolution, using the chemical mechanism of saprc07tic. A regional O3 pollution event that occurred from 22 to 31 July with the mean level of the observed daily maximum 8 h average (MDA8) O3 exceeding 85 ppb over the YRD was selected to study the relationship between the O3–NOx–VOC sensitivity and the values of the photochemical indicators. The CMAQ model was driven by a mesoscale meteorological model, the Weather Research and Forecasting (WRF) version 4.2.2. The 2017 emission inventory of anthropogenic air pollutants in the YRD compiled by the Shanghai Academy of Environmental Sciences (An et al., 2021) was adopted, with the details of the other emissions (i.e., biogenic emissions and open burning) found in Hu et al. (2016).
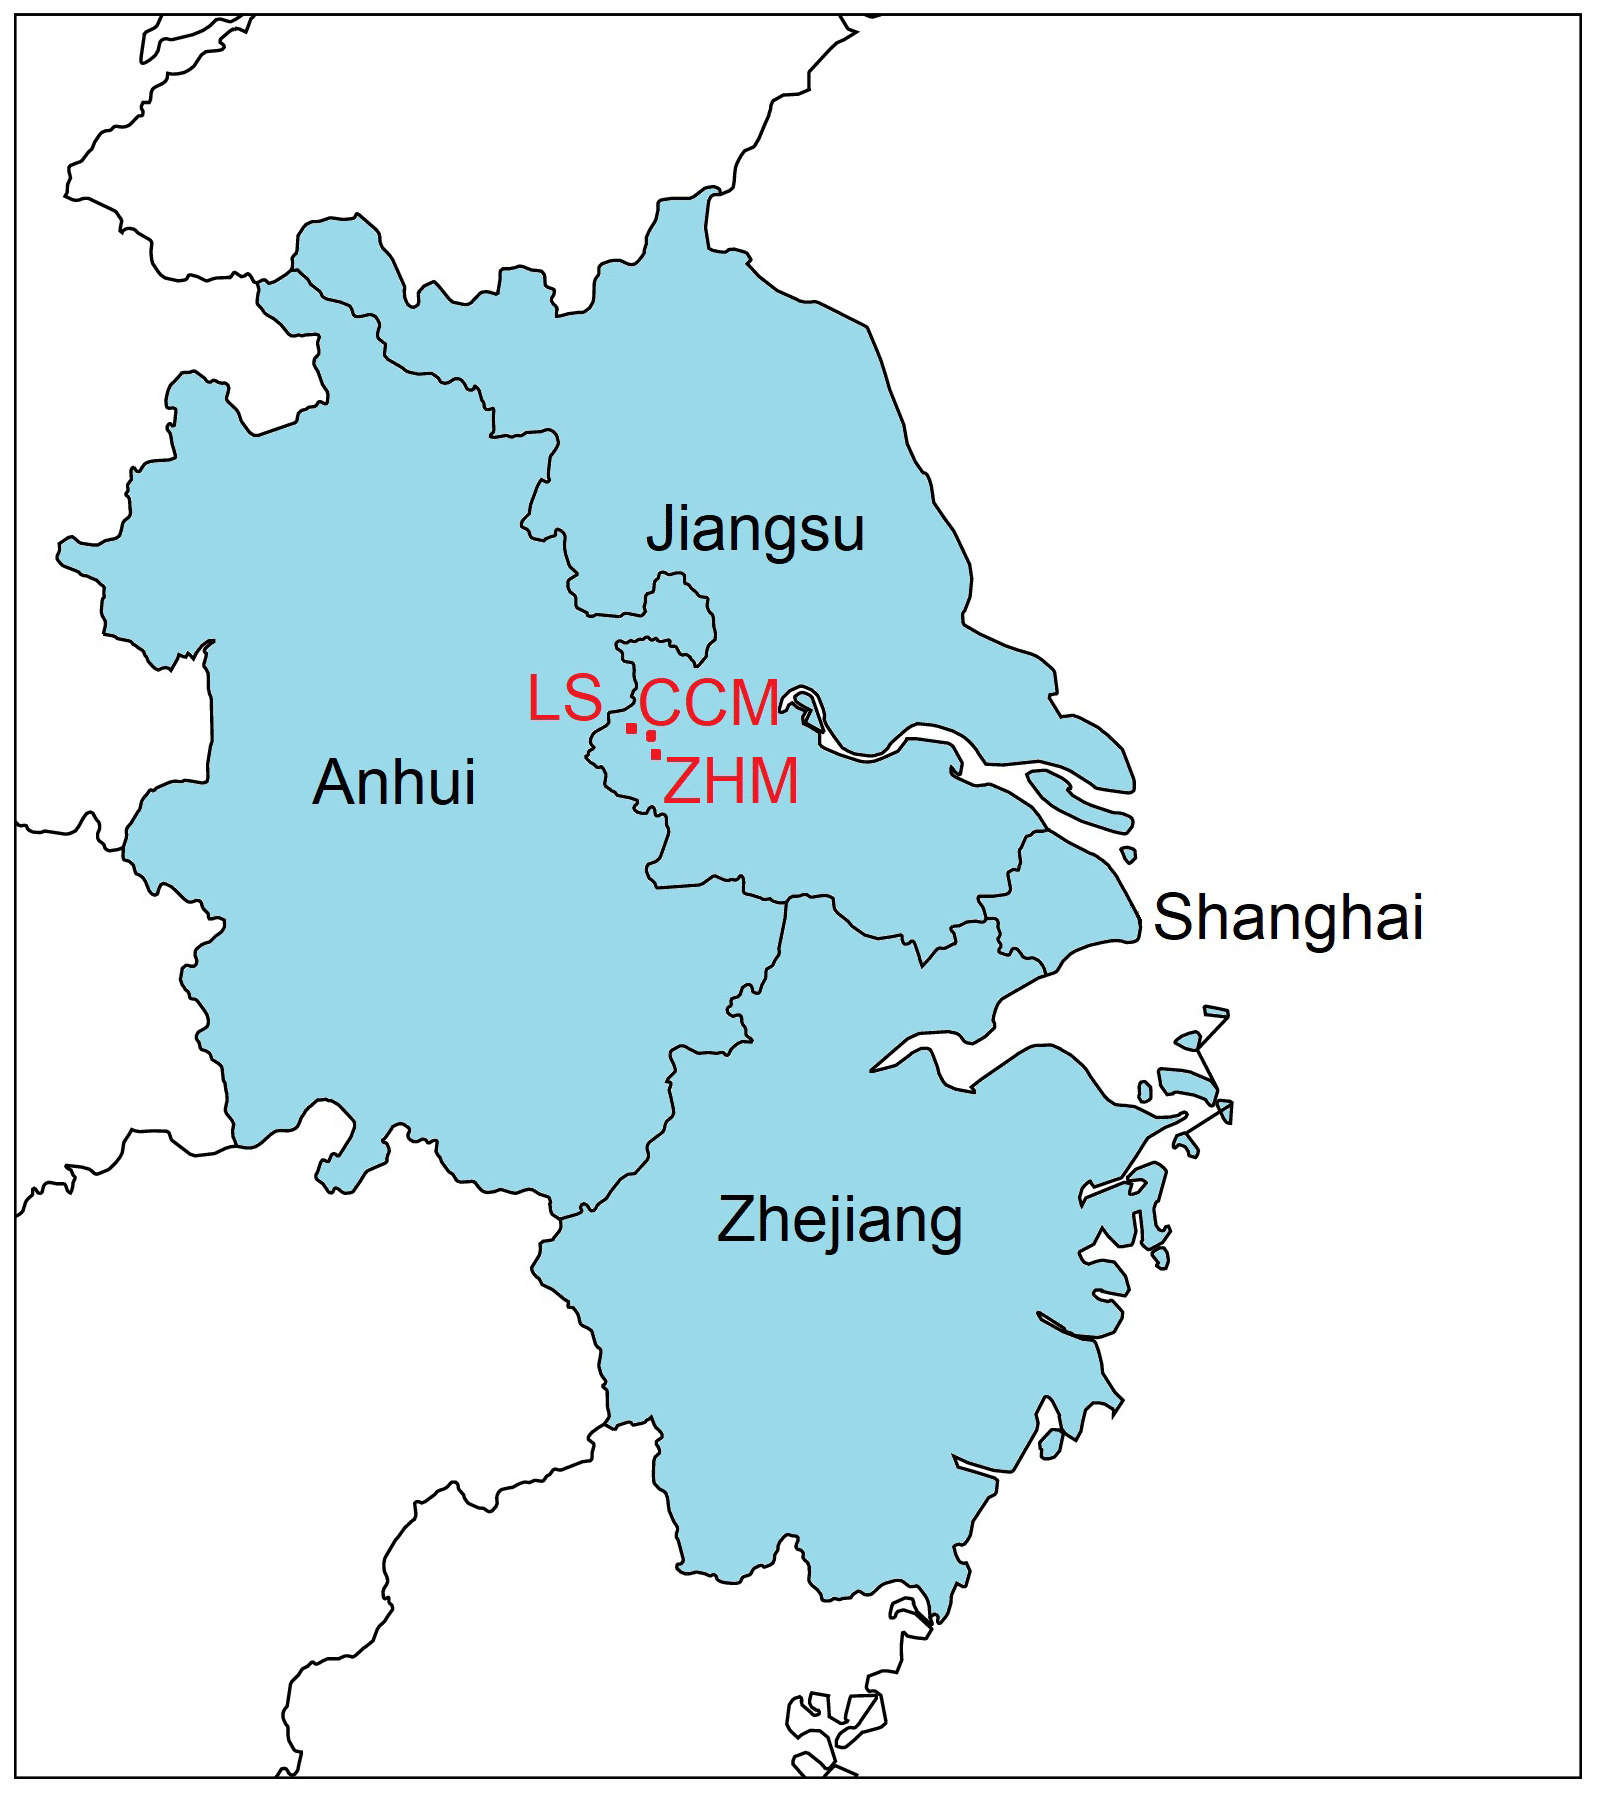
Figure 1The simulation domain. The blue area indicates the YRD including Jiangsu, Anhui, Shanghai, and Zhejiang. Three representative sites of Caochangmen (CCM), Zhonghuamen (ZHM), and Laoshan (LS) are marked.
2.2 Model performance evaluation
The model performance on O3 was examined by comparing the simulation with observational data at the monitoring sites supervised by the China National Environmental Monitoring Center (CNEMC) in 13 cities in Jiangsu Province. Three metrics (the normalized mean bias (NMB), the normalized mean error (NME), and the correlation coefficient (r)) as in Sheng et al. (2022) were calculated to evaluate the agreement between the simulation and observations. The criteria of the model performance were recommended by Emery et al. (2017). Table S1 in the Supplement shows that the NMB (NME) values in 12 (10) out of 13 cities met the criteria, indicating that the overall performance was good. In general, the model overestimated O3, with the NMB in the range of −2 % to 17 %. The correlations of the simulation with the observations (all r values above 0.5) indicated that hourly variations in the simulation agree well with the observations. Additionally, three sites in Nanjing (a megacity in Jiangsu), including Caochangmen (CCM), Zhonghuamen (ZHM), and Laoshan (LS), representing downtown, upwind, and downwind areas of the city (see Fig. 1), respectively, were selected to examine the consistency between the photochemical indicators and the O3 isopleths in the implication of O3-precursor sensitivities. Figure S1 in the Supplement shows that the model well reproduced the O3 pollution events at the three sites during the simulation period.
Other species involved in the photochemical indicators, such as HCHO,
HNO3, NO2, and NOy (NOy
(g)=NO+NO2+NO3+2×N2O5+HONO+HNO3+HNO4+
peroxyacetyl nitrate and
its homologs (PANs)+alkyl nitrates (ANs) and nitrogen oxychlorides
(ClNOx) in the model), were examined and compared with observations
during the EXPLORE-YRD campaign (Li et al., 2021; Sun et al., 2022).
Figure S2 shows that HCHO was underestimated by 51 %, while NO2 and
NOy were slightly overestimated, with NMBs of 16 % and 7 %,
respectively. The anthropogenic emission inventory and model were set up as
in the simulation for the EXPLORE-YRD campaign, and the simulated ratios of
and in this study could have been
underestimated. In addition, the simulation could represent an environment
with less abundant VOCs than in the real atmosphere over the YRD.
2.3 Determination of the indicator thresholds
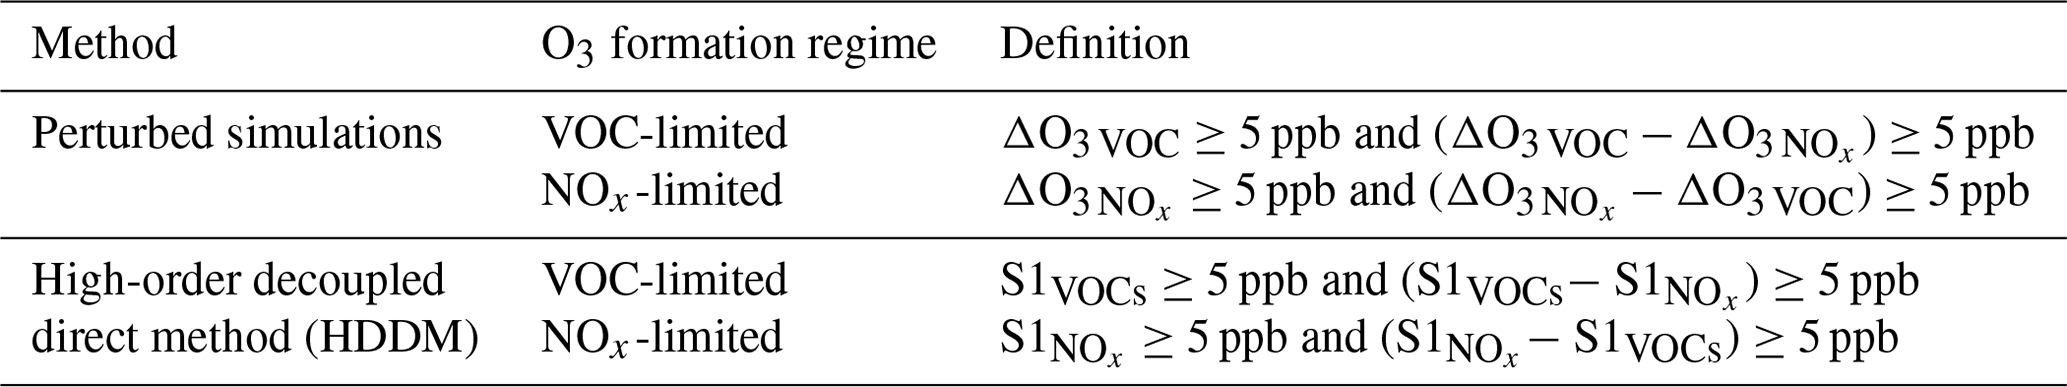
The use of photochemical indicators requires threshold values that differentiate O3 formation regimes. In this study, the thresholds of the indicators were derived based on the association of the O3 reduction relative to the baseline emission scenario resulting from NOx or VOC emission reductions (i.e., ΔO or ΔO3 VOC), with concurrent indicator values at all grid cells in Jiangsu Province. Therefore, two additional runs with either a 35 % decrease in NOx or a 35 % decrease in VOC emissions were performed following Sillman et al. (1998) and other studies (Xie et al., 2014; Peng et al., 2011). The resulting O3 changes (ΔO and ΔO3 VOC) were obtained to identify the O3 formation regimes at each grid cell, with the criteria given in Table 1. It should be noted that the average changes in O3 during 13:00–16:00 LT (local time) during the simulation period were used when O3 peaked and was of most concern.
Table 1Identification of the O3 formation regimes at each grid cell based on the O3 changes resulting from perturbed emissions as in Sillman et al. (1998) or the sensitivity coefficients using the high-order decoupled direct method (HDDM) as in Wang et al. (2011).
This study focused on four photochemical indicators that are frequently used, including , , , and NOy, with the underlying mechanisms extensively described in the literature (Xie et al., 2014; Kwok et al., 2015; Sillman, 1995; Duncan et al., 2010). The indicator values for each grid cell were calculated based on the simulated concentrations of related species, except for , which were obtained using the integrated reaction rate (IRR) of the CMAQ process analysis tool (Gipson and Young, 1999). The percentile distribution of the indicator values for the VOC-limited grid cells and the NOx-limited grid cells were examined individually. The photochemical indicators typically showed higher values at NOx-limited grid cells than in VOC-limited locations. Finally, the thresholds of a certain indicator were determined using the 95th-percentile value of the indicator for the VOC-limited grid cells and the 5th-percentile value for the NOx-limited grid cells as the lower and upper limits of the transition intervals, respectively. Indicator values lower than the transition intervals suggested O3 formation was VOC-limited, while higher values than the transition intervals were associated with NOx-limited regimes. In some cases, the 95th-percentile VOC-limited value was higher than the 5th-percentile NOx-limited value, indicating the indicator was invalid and could not be used to determine the O3 sensitivity properly.
2.4 Evaluation of the indicators
2.4.1 Evaluation metrics
The feasibility of a given threshold for an indicator applied throughout a region or over a short-term period (the order of 1–2 years) was evaluated in this study. Some metrics have been developed to estimate the uncertainties in the determination of O3 regimes using photochemical indicators (Wang et al., 2011; Ye et al., 2016). This work applied Error A, Error B, and the overall accuracy (OA) in Ye et al. (2016) for the evaluation, with the equations given in Table 2. For example, ErrA_NOx describes the situation where among all grid cells (colored areas in Fig. 2d) with indicator values higher than the upper limit of the transition interval (i.e., assigned to NOx-limited regimes with the indicator), there existed VOC-limited grid cells that were incorrectly assigned to the NOx-limited regime. ErrB_NOx estimates the fraction of the NOx-limited grid cells (blue areas in Fig. 2d) that were not classified as a NOx-limited regime since the corresponding indicator values were lower than the upper threshold. ErrA_VOC and ErrB_VOC were defined analogously. OA describes the fraction of all correctly classified grid cells using the indicator at all VOC- or NOx-limited grid cells.
Table 2Metrics of the indicator performance evaluation provided in Ye et al. (2016).

The indicator evaluation was conducted for the simulation in 2017 (see Sect. 2.1). Additionally, a simulation for the same period (over 22–31 July) in 2018, which has an identical model configuration and identical inputs in all aspects except for the meteorology, was performed for the evaluation as well. Thus, applications of the photochemical indicators with derived thresholds in a different location within the region, in a different year, or with changes in both can be examined separately. This provided insight into the uncertainties associated with emissions or meteorology.
2.4.2 O3 isopleths
The O3–NOx–VOC sensitivity determined by photochemical indicators was compared with the O3 isopleths that describe the nonlinear relationship between O3 and the precursors and inform decision makers of emission control strategies in a different manner. The response of O3 to the domain-wide reductions in VOC and NOx emissions at three representative sites (CCM, ZHM, and LS) during 13:00–16:00 LT during the simulation period was investigated. Specifically, a total of 36 emission scenarios with anthropogenic VOC and NOx emissions reduced by 0 %, 20 %, 40 %, 60 %, 80 %, and 100 %, both singly and in combination, were simulated to construct the O3 isopleth diagram. The O3 formation regimes based on the thresholds derived in Sect. 2.3 were indicated with color and overlapped with the isopleths.
2.5 Uncertainties in the thresholds
In Sect. 2.3, the O3 formation regimes were presumably identified according to changes in O3 with the emission reductions, while the rules could be different in detail. For example, Liang et al. (2006) examined changes in the 8 h O3 with a 25 % reduction in VOC or NOx emissions instead of the 1 h O3 with 35 % reductions as in Sillman (1995). Accordingly, the criteria changed from 5 to 2.5 ppb. Zhang et al. (2020) explored the correlation of indicator values with the relative O3 changes resulting from a 50 % reduction in the NOx or VOC emissions. Du et al. (2022) applied the decoupled direct method (DDM) to investigate the sensitivity of O3 to precursors, instead of perturbing emissions. The impacts on the derived thresholds of the indicators were explored by conducting a few individual tests:
-
The criteria for the O3 reduction (see Table 1) were set at 2, 3, and 6 ppb.
-
The relative changes in O3 were examined using the criteria of 2 %, 5 %, and 8 % instead of an absolute change of 5 ppb.
-
The 35 % emission reduction scenarios were replaced with a 20 % and a 40 % reduction in the VOC or NOx emissions.
-
The high-order decoupled direct method (HDDM) was adopted to split the O3 formation regimes in two manners referred to as “DDM1” and “DDM2”. The HDDM can quantify the responsiveness of air pollutants to infinitesimal perturbations of a model parameter or input (e.g., an emission rate of a precursor) with sensitivity coefficients (Cohan et al., 2005). In this study, the HDDM estimated the first- and second-order sensitivity coefficients of O3 to NOx and VOCs (i.e., S1, S1VOCs, S2, S2VOCs). With the DDM1 approach, the NOx-limited locations were defined as those grid cells where S1 NOx was higher than 5 ppb and at least 5 ppb higher than S1 VOCs (Table 1), following Wang et al. (2011). The VOC-limited grid cells were defined similarly. The DDM2 approach estimated O3 changes with 35 % reductions in emissions via the Taylor series expansions (Cohan et al., 2005) instead of the perturbed simulations.
3.1 Threshold values of the photochemical indicators
The changes in the O3 concentrations when reducing VOC or NOx emissions were used to determine the O3 formation regimes. Figure 2a shows that high O3 concentrations (averaged from 13:00 to 16:00 LT during 22–31 July) primarily occurred along the Yangtze River and southern Jiangsu, and O3 in northern Jiangsu was relatively low. The NOx emission reduction predominantly led to O3 decreases in Jiangsu, while only a few locations, such as near the estuary of the Yangtze River, showed an increased O3 relative to the base case (Fig. 2b). The VOC emission reductions resulted in less significant O3 decreases compared to the NOx reduction scenario (Fig. 2c). The O3 sensitivity regime for each grid cell in Jiangsu was identified with the method described in Sect. 2.3 (Fig. 2d). The O3 formation in central and southern Jiangsu, where O3 is abundant, is typically NOx-limited as a result of a relatively low NOx concentration in the afternoon (Duncan et al., 2010; Jin et al., 2017; Jin and Holloway, 2015). Some areas along (and on) the Yangtze River were characterized to be VOC-limited regimes, with substantial emissions of NOx from ship emissions and industry (Sheng et al., 2022). However, not all grid cells in Jiangsu were assigned to the VOC- or NOx-limited regimes. The white areas in Jiangsu in Fig. 2d indicate that O3 was insensitive to both NOx and VOCs (i.e., ΔO3 VOC<5 and ΔO ppb); alternatively, O3 was sensitive to NOx (VOC) emissions but showed small changes in O3 with the perturbation of NOx (VOC) relative to the VOC (NOx) reduction scenario (i.e., |ΔO3 VOC−ΔO ppb).
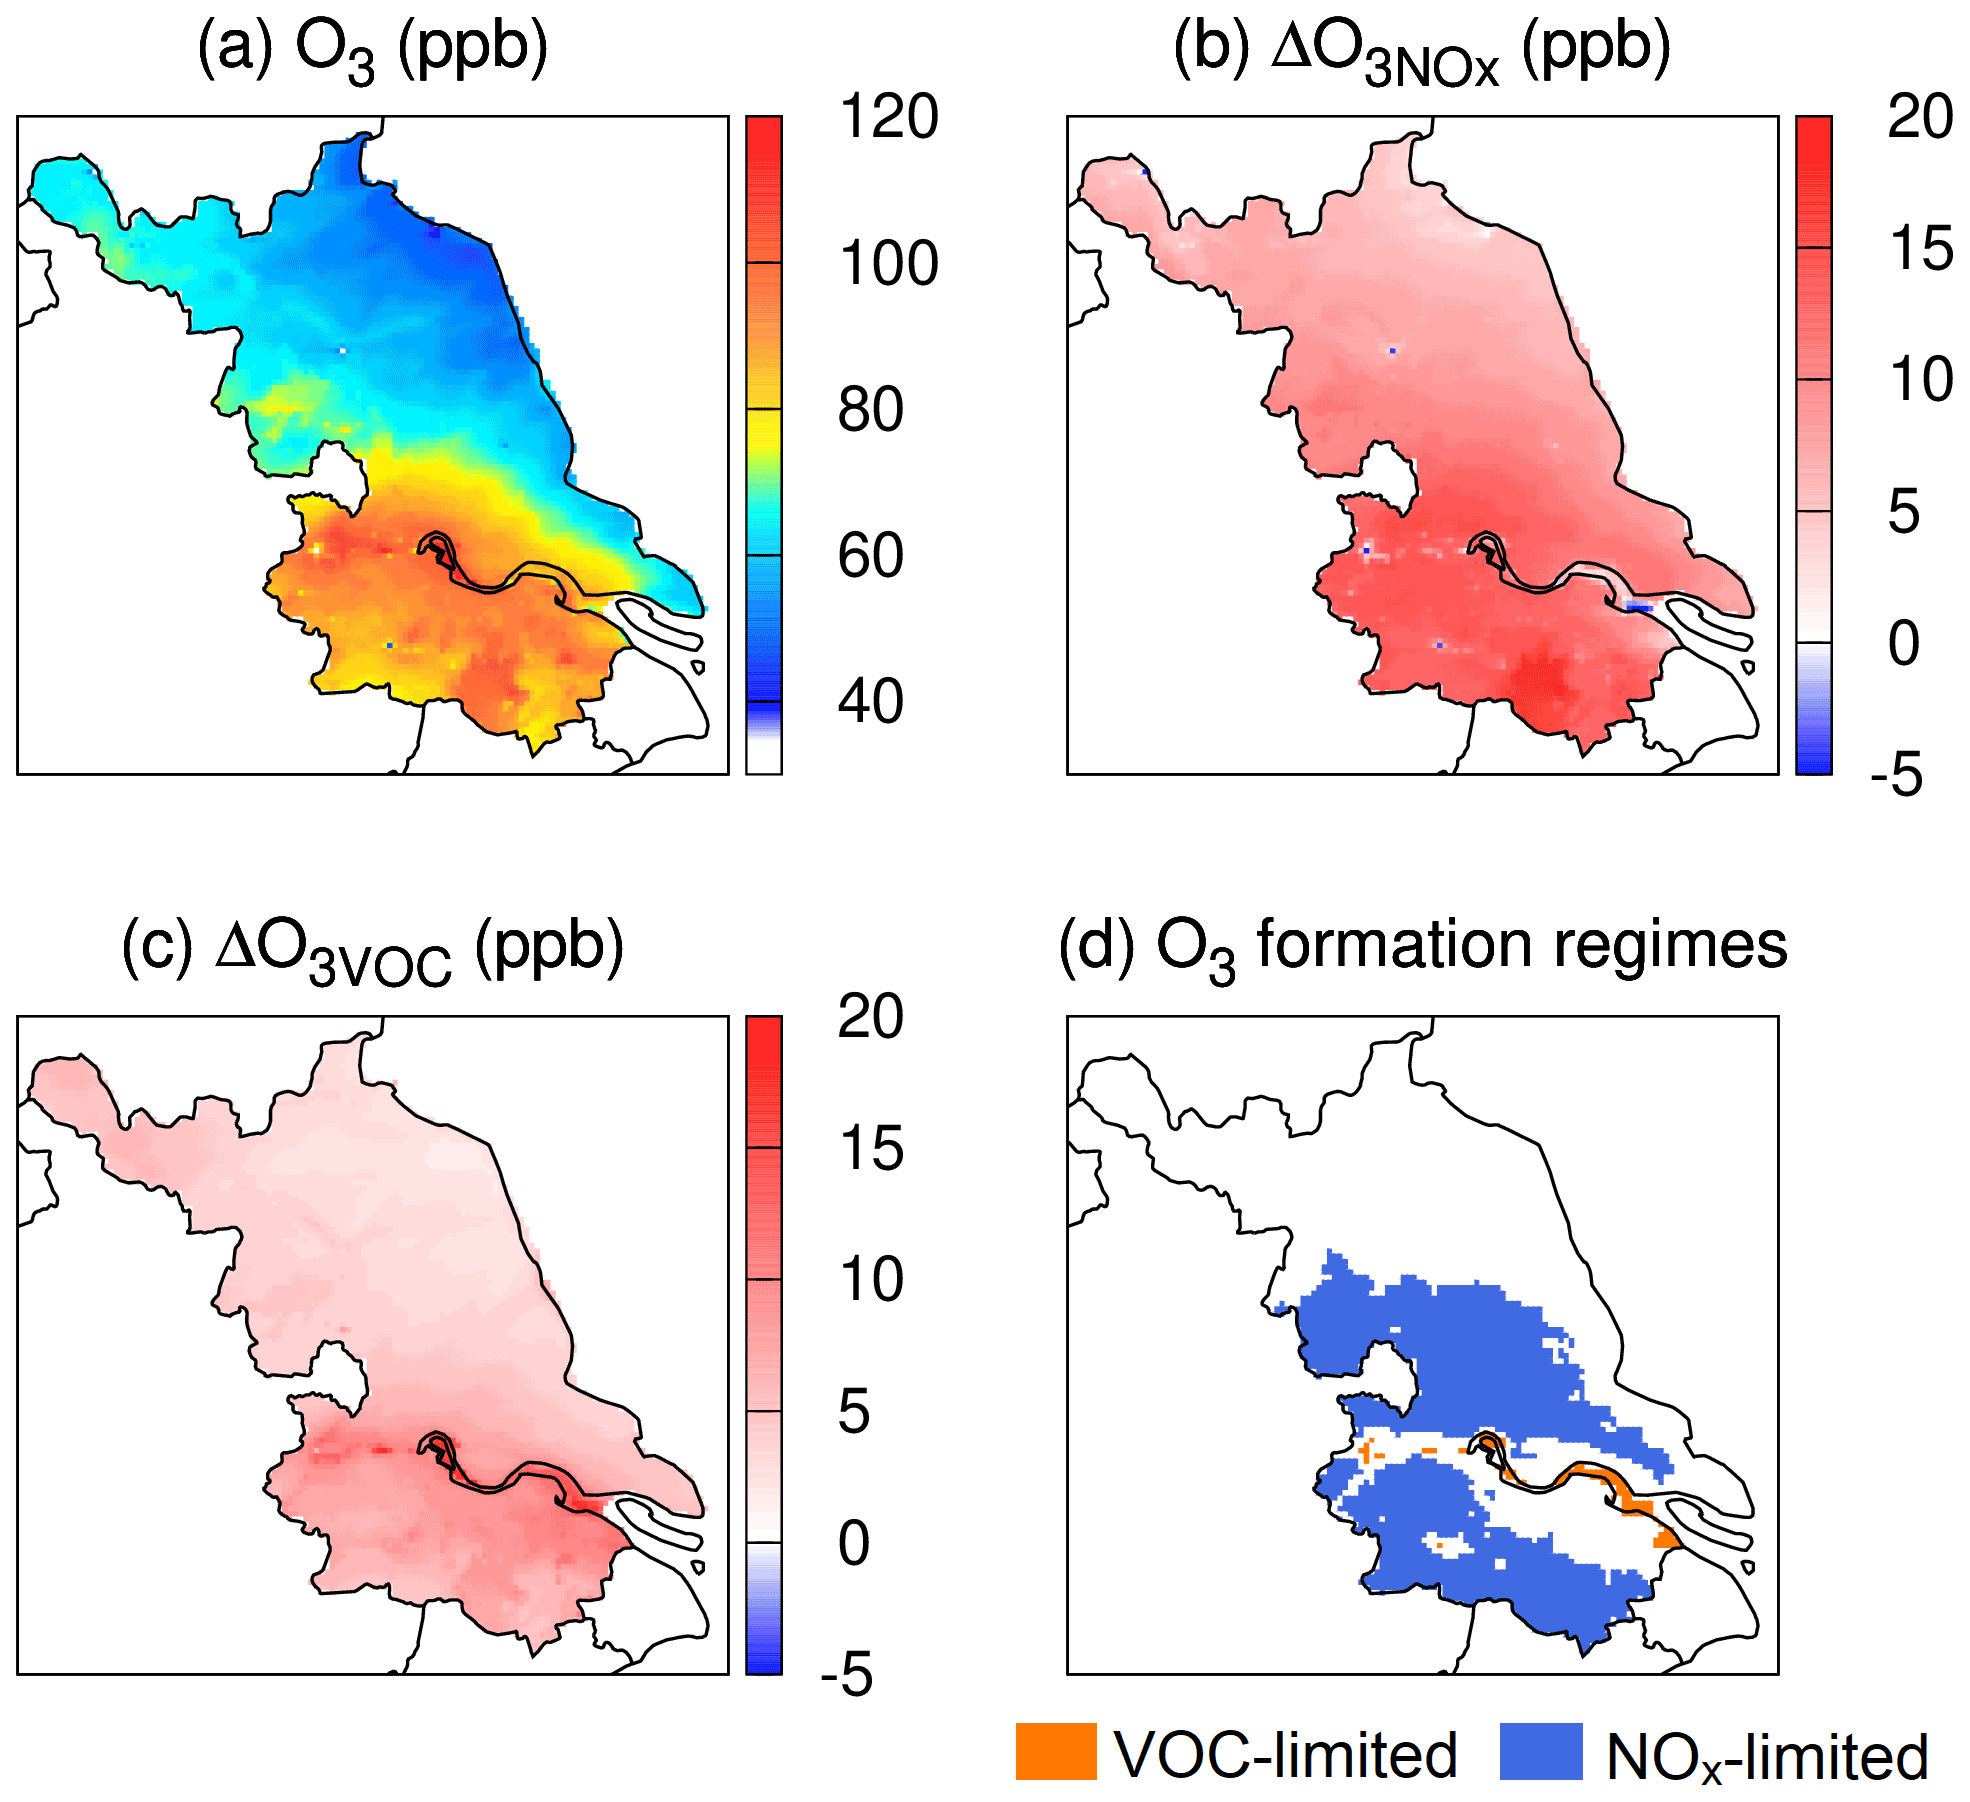
Figure 2(a) Simulated spatial distribution of O3 averaged from 13:00 to 16:00 LT. during 22–31 July in Jiangsu Province; (b–c) O3 reduction due to a 35 % reduction in domain-wide NOx and VOC emissions, respectively; (d) O3 formation regimes determined with perturbed simulations.
The O3 reductions (ΔO or ΔO3 VOC) against photochemical indicator values at all grid cells over the domain were examined (Fig. 3). The mean values of the ΔO slightly increased with higher , while the ΔO3 VOC values showed a decreasing trend, indicating that a reduction in NOx (VOC) emissions became more (less) effective for O3 abatement in the locations with higher indicator values. Other indicators displayed a similar pattern except for NOy, which displayed an opposite result. Due to the contrasting dependence of the ΔO and the ΔO3 VOC on the indicator values, the thresholds of the photochemical indicators that separate the O3 formation regimes were determined (Table 3 and vertical lines in Fig. 3). The localized thresholds for [0.55, 0.75] were remarkably higher than that implemented in the model, i.e., 0.35, which would lead to misattribution of the VOC-limited or the transitional regime to the NOx-limited regime in some locations if the single value was directly used. The thresholds differed from those proposed by researchers in other countries, and some regions in China had significantly distinct thresholds as well (Du et al., 2022; Zhang et al., 2020; Tonnesen and Dennis, 2000a; Liu et al., 2010a).
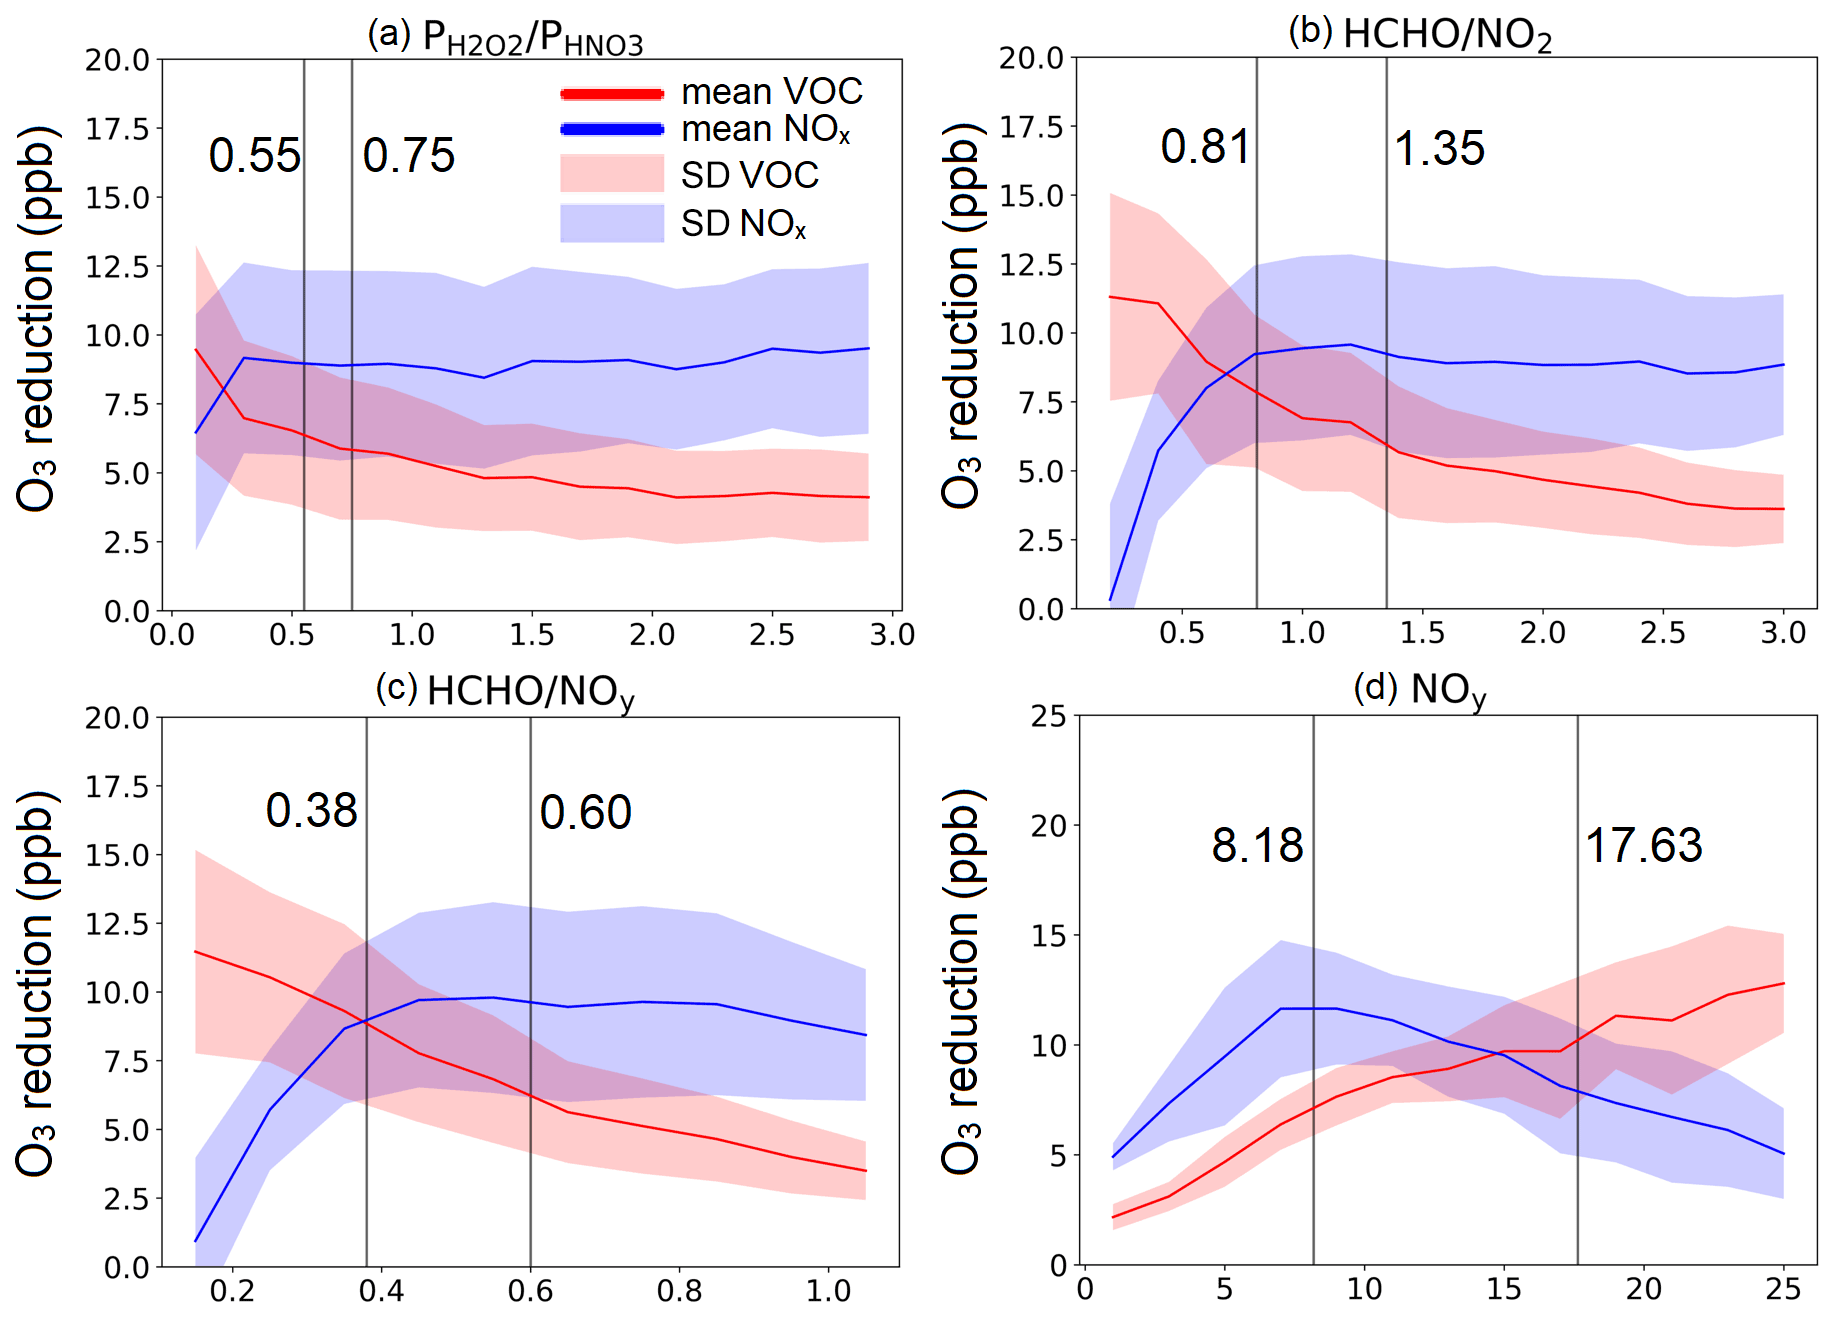
Figure 3Relationships between the simulated O3 reductions with the perturbed emissions and concurrent values of , , , and NOy at all the grid cells in the domain. The red (blue) lines represent the average O3 changes resulting from VOC (NOx) emission reductions, with the shaded areas for the standard deviations. The thresholds derived in this study (see Table 3, with the method detailed in Sect. 2.3) are indicated by the gray vertical lines.
Table 3Thresholds of the indicators derived in this study and reported in previous work.
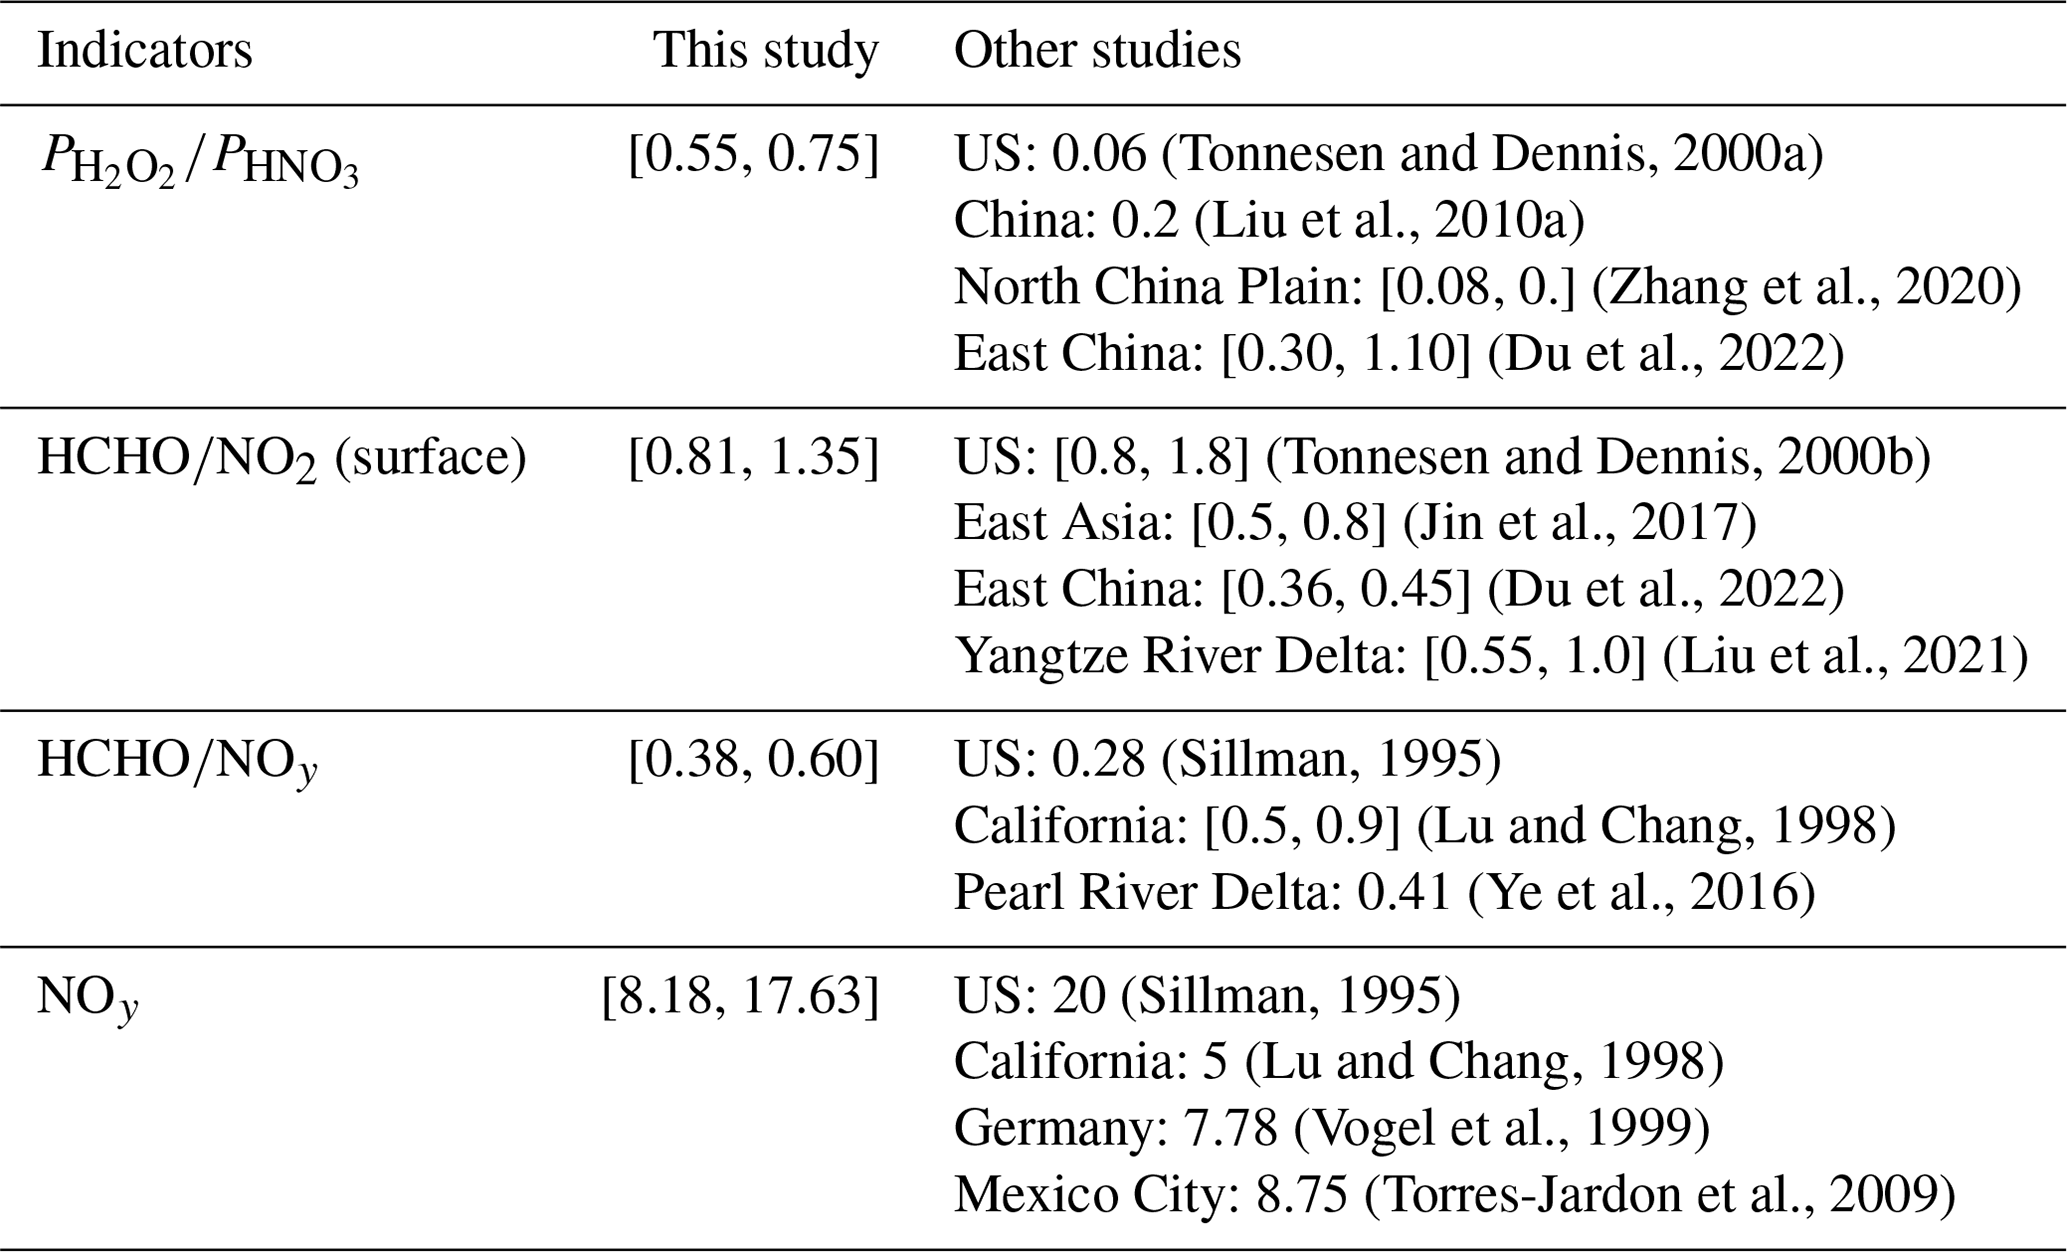
This work revisited other photochemical indicators including the surface , , and NOy. The transition interval of was determined as [0.81, 1.35], showing a higher and wider range than in other work (Jin et al., 2017; Liu et al., 2021; Du et al., 2022) but relative consistency with Tonnesen and Dennis (2000b). It is worth noting that the values mentioned above are all based on measurements or simulations at the ground level, while column retrieved from satellite measurements are more widely used, with thresholds of [1, 2] (Jin and Holloway, 2015; Jin et al., 2017; Duncan et al., 2010; Wang et al., 2021). The transition range for the column is typically broader than that for the surface ratio, e.g., the former of [1.17, 2.42] versus the latter of [0.36, 0.45] in East China (Du et al., 2022). The thresholds of and NOy in this study were [0.38, 0.60] and [8.18, 17.63], respectively, comparable to the values proposed previously. The comparison shown in Table 3 suggests that the thresholds were mostly location-specific, possibly as they are dependent on atmospheric conditions and emission features. However, the methodology that is used to derive thresholds can also lead to distinct threshold values, and this is discussed in Sect. 3.4.
The spatial distributions of the O3 formation regimes identified by the photochemical indicators with localized thresholds are exhibited in Fig. 4. Most of the areas in Jiangsu (>80 % of the grid cells covering Jiangsu, Table S2) were attributed to NOx-limited regimes in terms of the summertime O3 formation in the afternoon using all indicators. A few urban centers and some locations near the Yangtze River were identified as VOC-limited or transitional regimes where the four indicators largely showed differences. The O3 formations in these areas were primarily VOC-limited according to and showed a transition from VOC-limited to NOx-limited at the surrounding grid cells. However, other indicators tended to assign the areas along and to the south of the river to transitional regimes. The fraction of the VOC-limited regimes in the area in Jiangsu with (∼13 %) was considerably higher than that using and (4 %–5 %). NOy, which is the least impacted by VOC emissions, attributed the fewest areas to the VOC-limited regimes (∼2 %) concerning O3 formation. Accordingly, transitional regimes were the lowest using , ∼5 % compared to 13 %–15 % using , , and NOy.
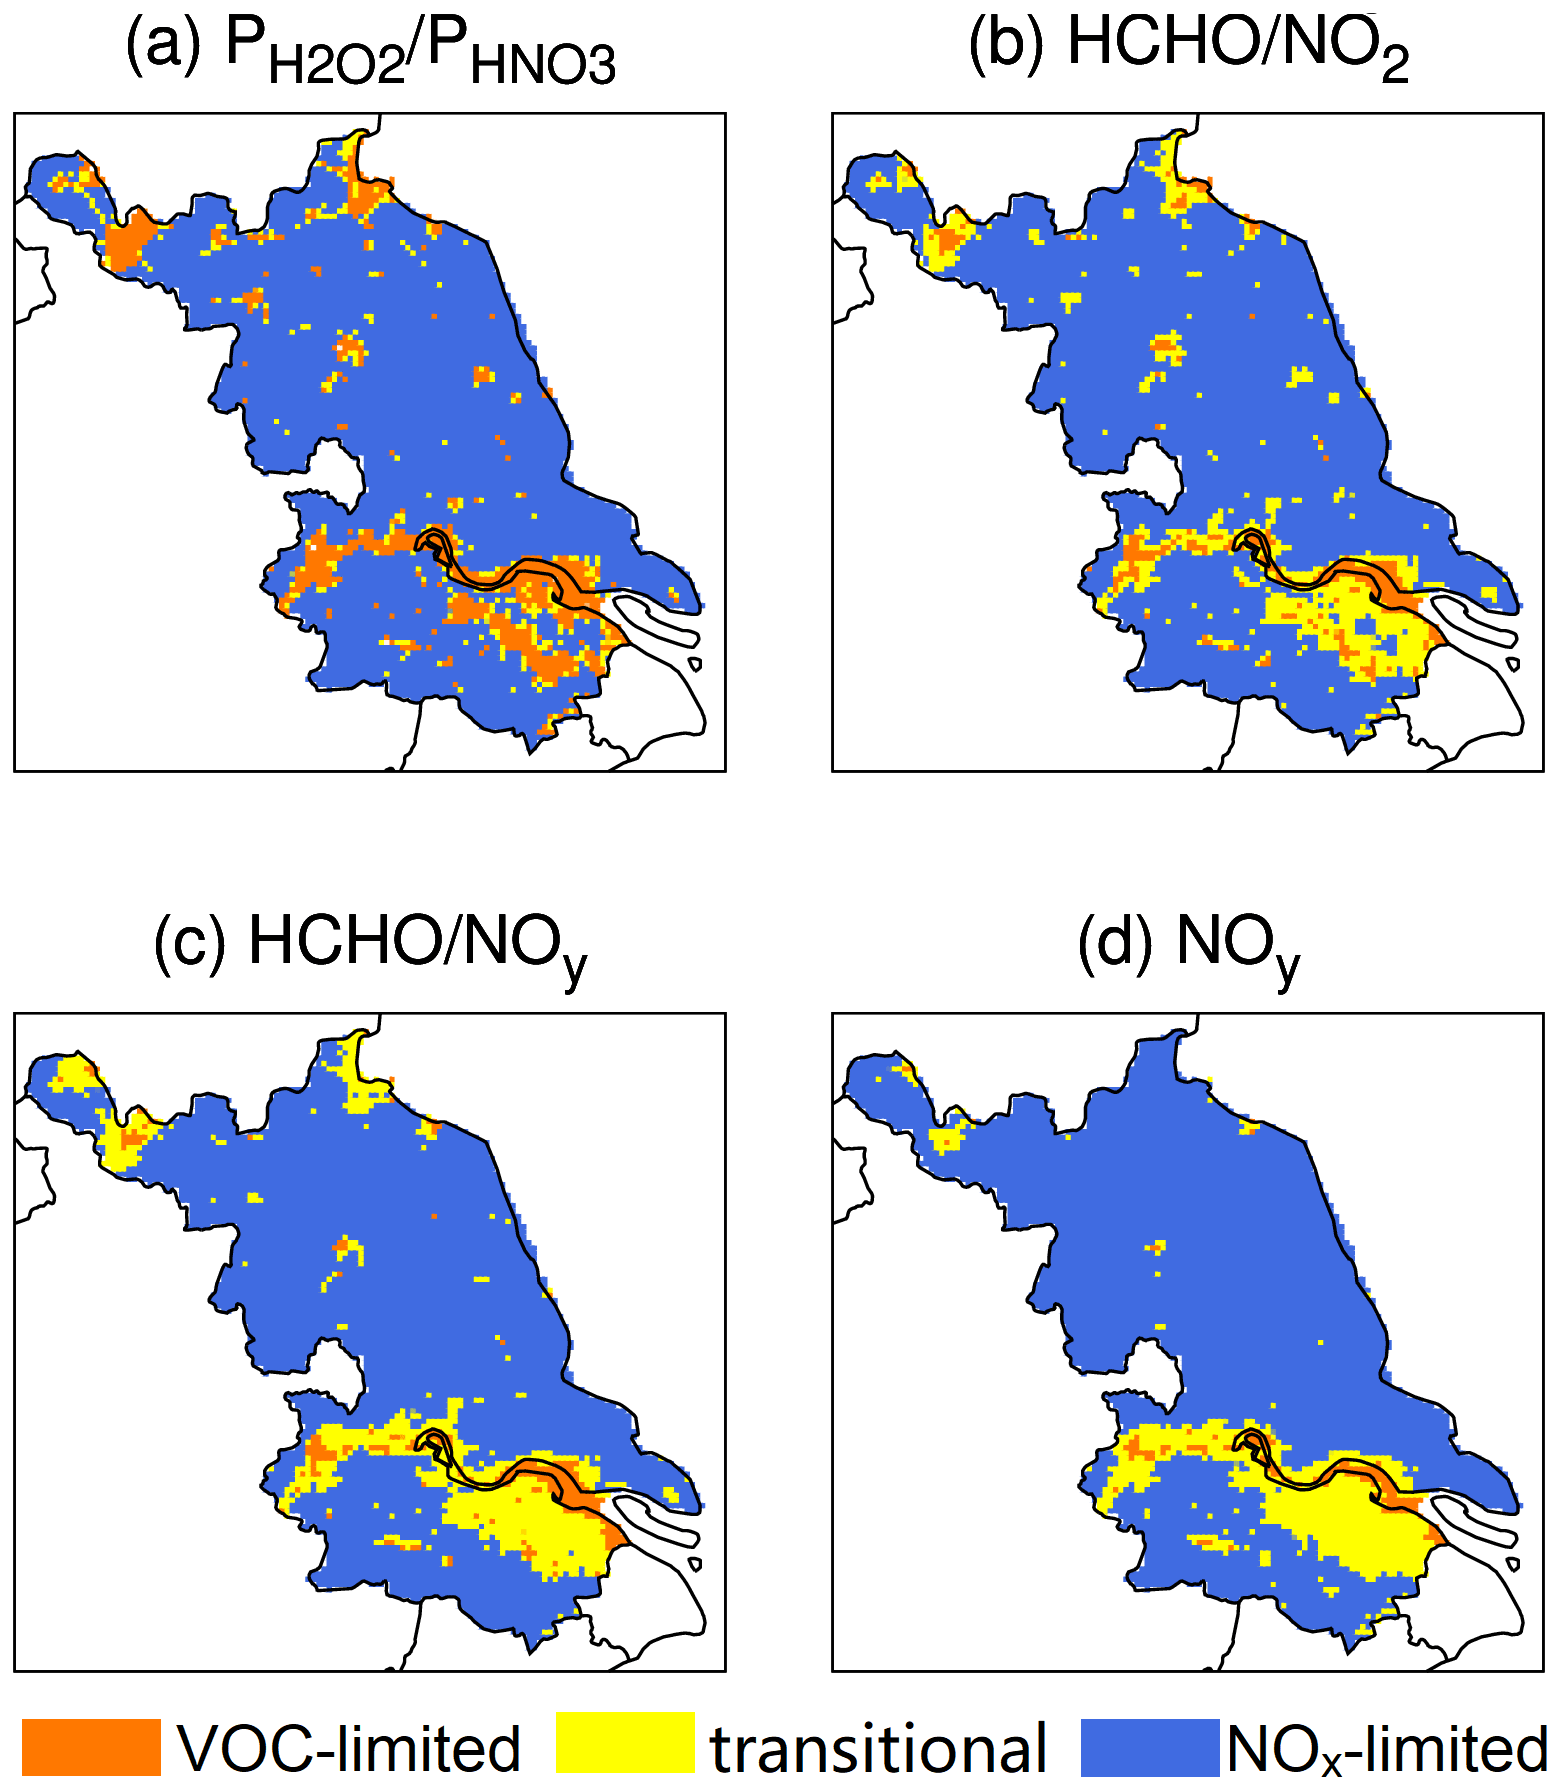
Figure 4O3 formation regimes based on the indicator values and thresholds in Table 3. The orange indicates a VOC-limited regime. The blue indicates a NOx-limited regime. The yellow is associated with a transitional regime.
3.2 Evaluation of the photochemical indicators
Table 4 shows the accuracy of the photochemical indicators in splitting the O3 formation regimes with thresholds derived in this study. As expected, the ErrB and OA for the application in Jiangsu in 2017 (see the case Sim_2017+Jiangsu in Table 4) were approximately 5 % and 95 %, respectively, as a result of the nature of the method (see Sect. 2.3). The values of ErrA were lower than ErrB, suggesting that chemical regimes determined by the indicator values were largely consistent with that based on O3 changes when perturbing emissions. However, it is more likely that sensitivities indicated by O3 changes do not necessarily correspond to indicator values in the correct intervals. Additionally, the ErrA_VOC and ErrA_NOx for were higher than that of the other indicators, likely due to less area associated with mixed O3 sensitivity using (see Table S2), which could increase the chance of misclassification.
Table 4Evaluation of the photochemical indicators in the YRD (unit of %).
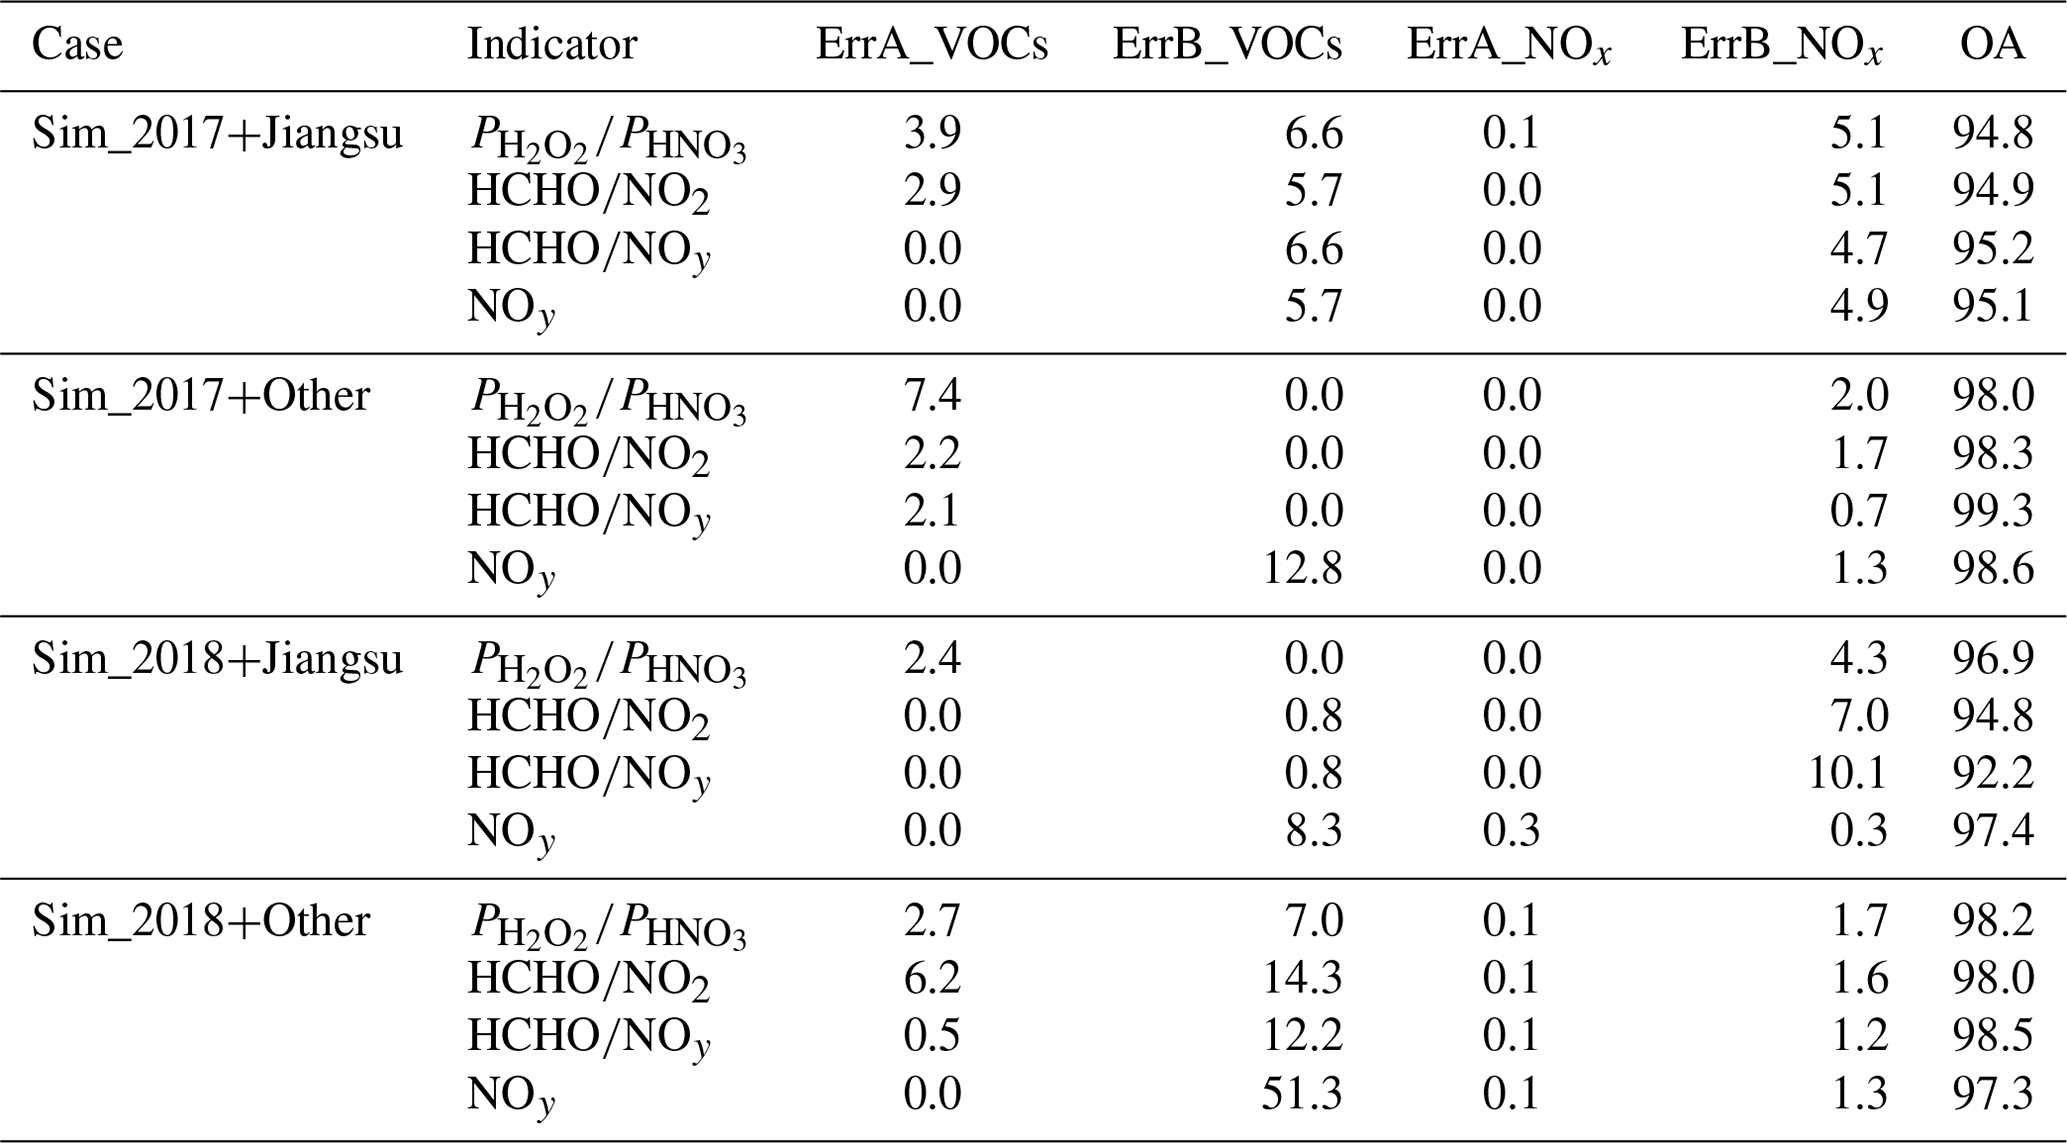
The above evaluation also showed that emissions could have a minor effect on the performance of the indicators on a regional scale. The thresholds derived from the simulation in Jiangsu well identified O3 sensitivities in other regions of the YRD (see the case Sim_2017+Other), where emissions were different (e.g., abundant biogenic VOCs in the southern YRD vs. dominance of anthropogenic emissions in Jiangsu) and with OAs greater than 98 % for all the indicators. This suggests that it is plausible to specify region-wide thresholds for photochemical indicators. In addition, the indicators can generally separate O3 formation regimes in Jiangsu for the same period in 2018 (see the case Sim_2018+Jiangsu) when the meteorology could differ from that in 2017. However, and appeared to be more easily affected by meteorology, as indicated by the ErrB_NOx that showed that many NOx-limited grids had indicator values lower than the upper thresholds. The OAs were relatively high in the case when both the emissions and meteorology changed (see the case Sim_2018+Other), although the ErrB_VOC was remarkably higher. This was due to fewer VOC-limited grids in the YRD, half of which had indicator values within the transition intervals and thus were misclassified as the transitional regime. The evaluation showed that indicators could perform better in detecting O3 formation regimes that were predominant. However, the drawback of the evaluation is that it does not account for grids that are neither VOC-limited nor NOx-limited in terms of the O3 formation based on the ΔO or the ΔO3 VOC (i.e., the white area in Jiangsu in Fig. 2d), and the uncertainties of the photochemical indicators in these areas are unknown.
3.3 Consistency with the O3 isopleths
O3 formation regimes identified by the indicator values with varied combinations of VOC and NOx emissions were plotted together with the O3 isopleths to examine the indicators for implications in effective emission control strategies. Figures 5 and S3–S4 show the comparison at the CCM, ZHM, and LS sites, respectively. As no significant variations were found at the three sites, only the plot for CCM is shown in the main text. The value with the base emission points to a VOC-limited regime at the CCM site, whereas the isopleths suggest that a reduction in the NOx emissions should lead to reduced O3. This also happens in some cases with lower VOC and NOx emissions, indicating that is likely to underestimate the positive sensitivity of O3 to NOx. The indicators were assumed to have constant thresholds that do not change with emissions; this could partially explain the inconsistency of the indicators with the O3 isopleths. The values at the LS and ZHM sites showed similar results, except that the O3 formation at the LS site shifted from VOC-limited to a transitional regime earlier with decreasing NOx emissions than at the other two sites as indicated by the ratio.
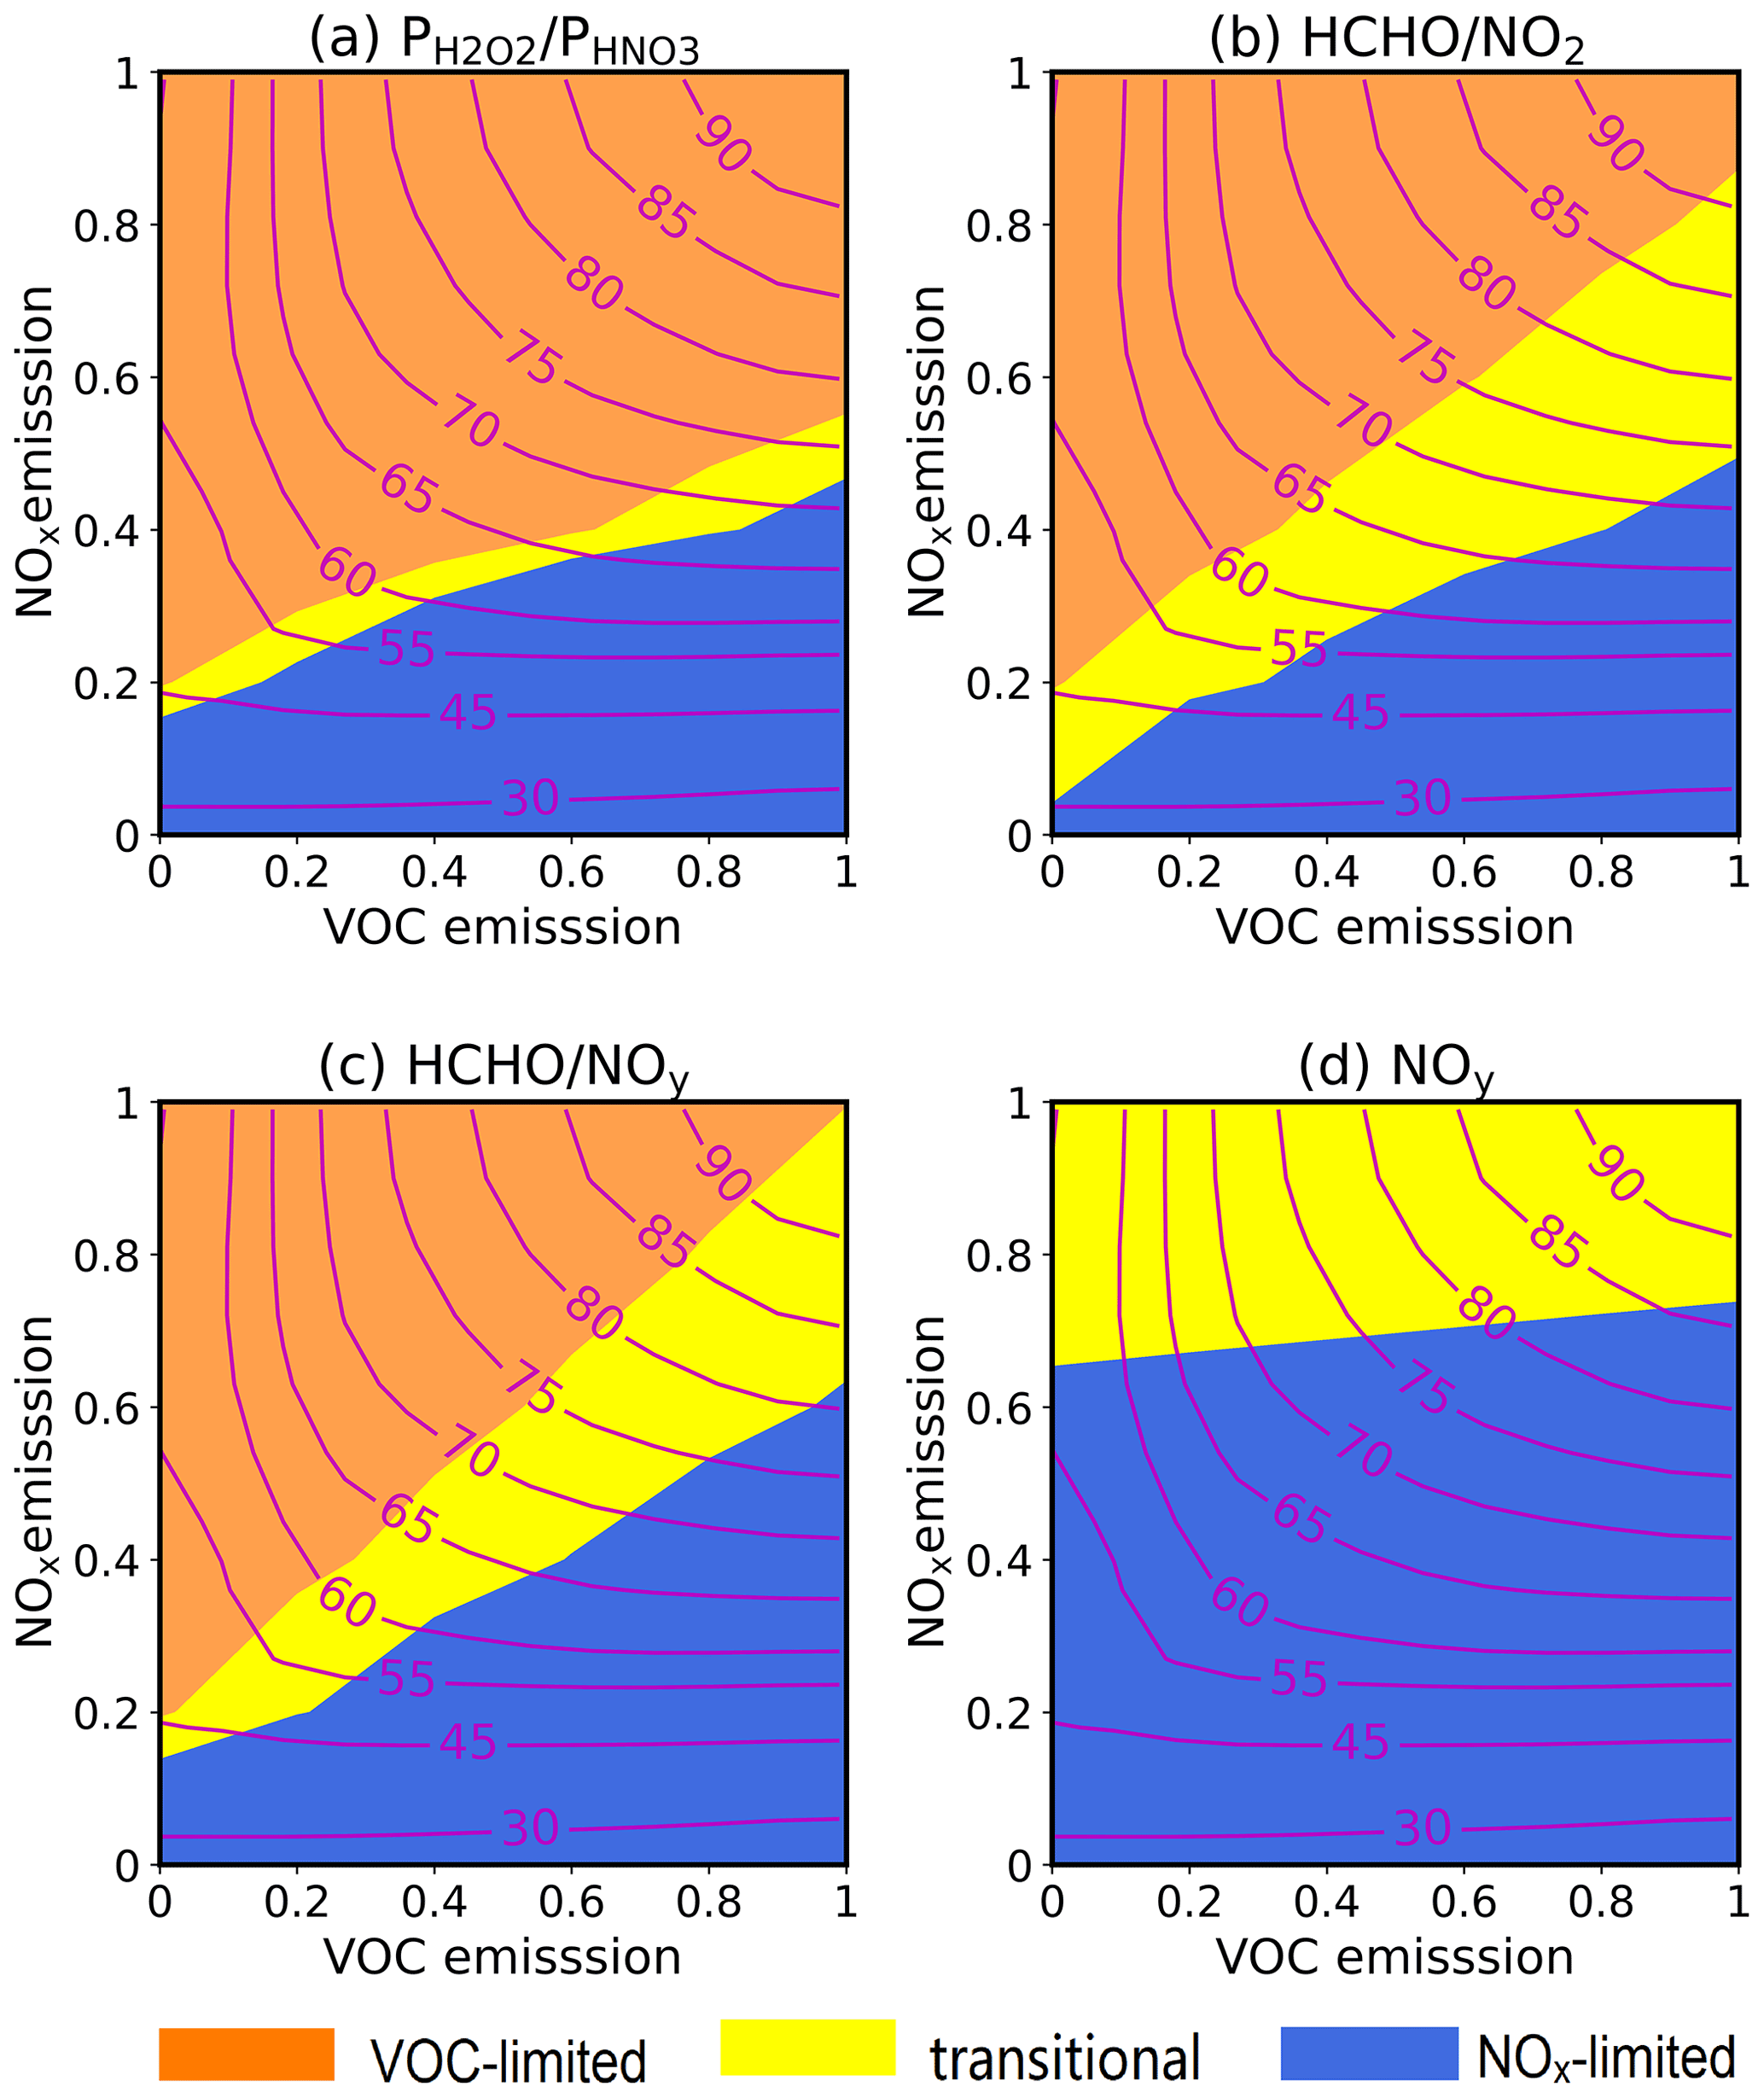
Figure 5O3 isopleths (red lines) overlap with the O3 formation regimes (shading color) identified with , , , and NOy (the thresholds given in Table 3) at the CCM site. The orange indicates a VOC-limited regime. The yellow indicates a transitional regime, and the blue indicates a NOx-limited regime.
It appears that was the most consistent with the O3 isopleths among the four indicators, followed by . Both and suggest that all three sites resided in transitional regimes under the base emission scenario, except for CCM using , which showed that O3 would respond to NOx changes negatively. However, and had more emission scenarios assigned to transitional regimes compared with , which was in agreement with the spatial distributions shown in Fig. 4. This implies that the two indicators emphasize controlling both VOC and NOx rather than a single pollutant. However, the HCHO levels could be affected by primary emissions (Liu et al., 2021) or be highly variable due to the dependence of isoprene on temperature (isoprene dominating HCHO production with intensive biogenic emissions) (Duncan et al., 2010). Therefore, the link between the (or ) values and the O3–VOC–NOx sensitivity and resulting emission control strategies of anthropogenic precursors (that are controllable) is more uncertain under certain conditions.
The O3 formation at the CCM site was dominated by NOx-limited regimes based on NOy, which was predominantly affected by NOx emissions, and did not show a sole sensitivity to VOCs (Fig. 5d). This was different from other indicators as well as the O3 isopleths in terms of policy implications. The comparison between the O3–VOC–NOx sensitivity revealed by NOy and the O3 isopleths showed that the indicator tended to overestimate the response of O3 to NOx (i.e., the VOC-limited regimes were misclassified as transitional regimes in the upper left corner of Fig. 5d) or underestimate the O3–VOC sensitivity (i.e., the transitional regimes were misclassified as NOx-limited regimes in the middle left portion of Fig. 5d).
3.4 Uncertainties associated with the methodology
Apart from local emissions and meteorology that could partially explain the gap between the indicator thresholds proposed earlier and in this work, we found that the methodology to derive the thresholds could be slightly different and the impacts are unknown. Therefore, a series of tests were conducted to examine how those details in the methodology alter the thresholds of (Fig. 6) and other indicators (Figs. S6–S8).
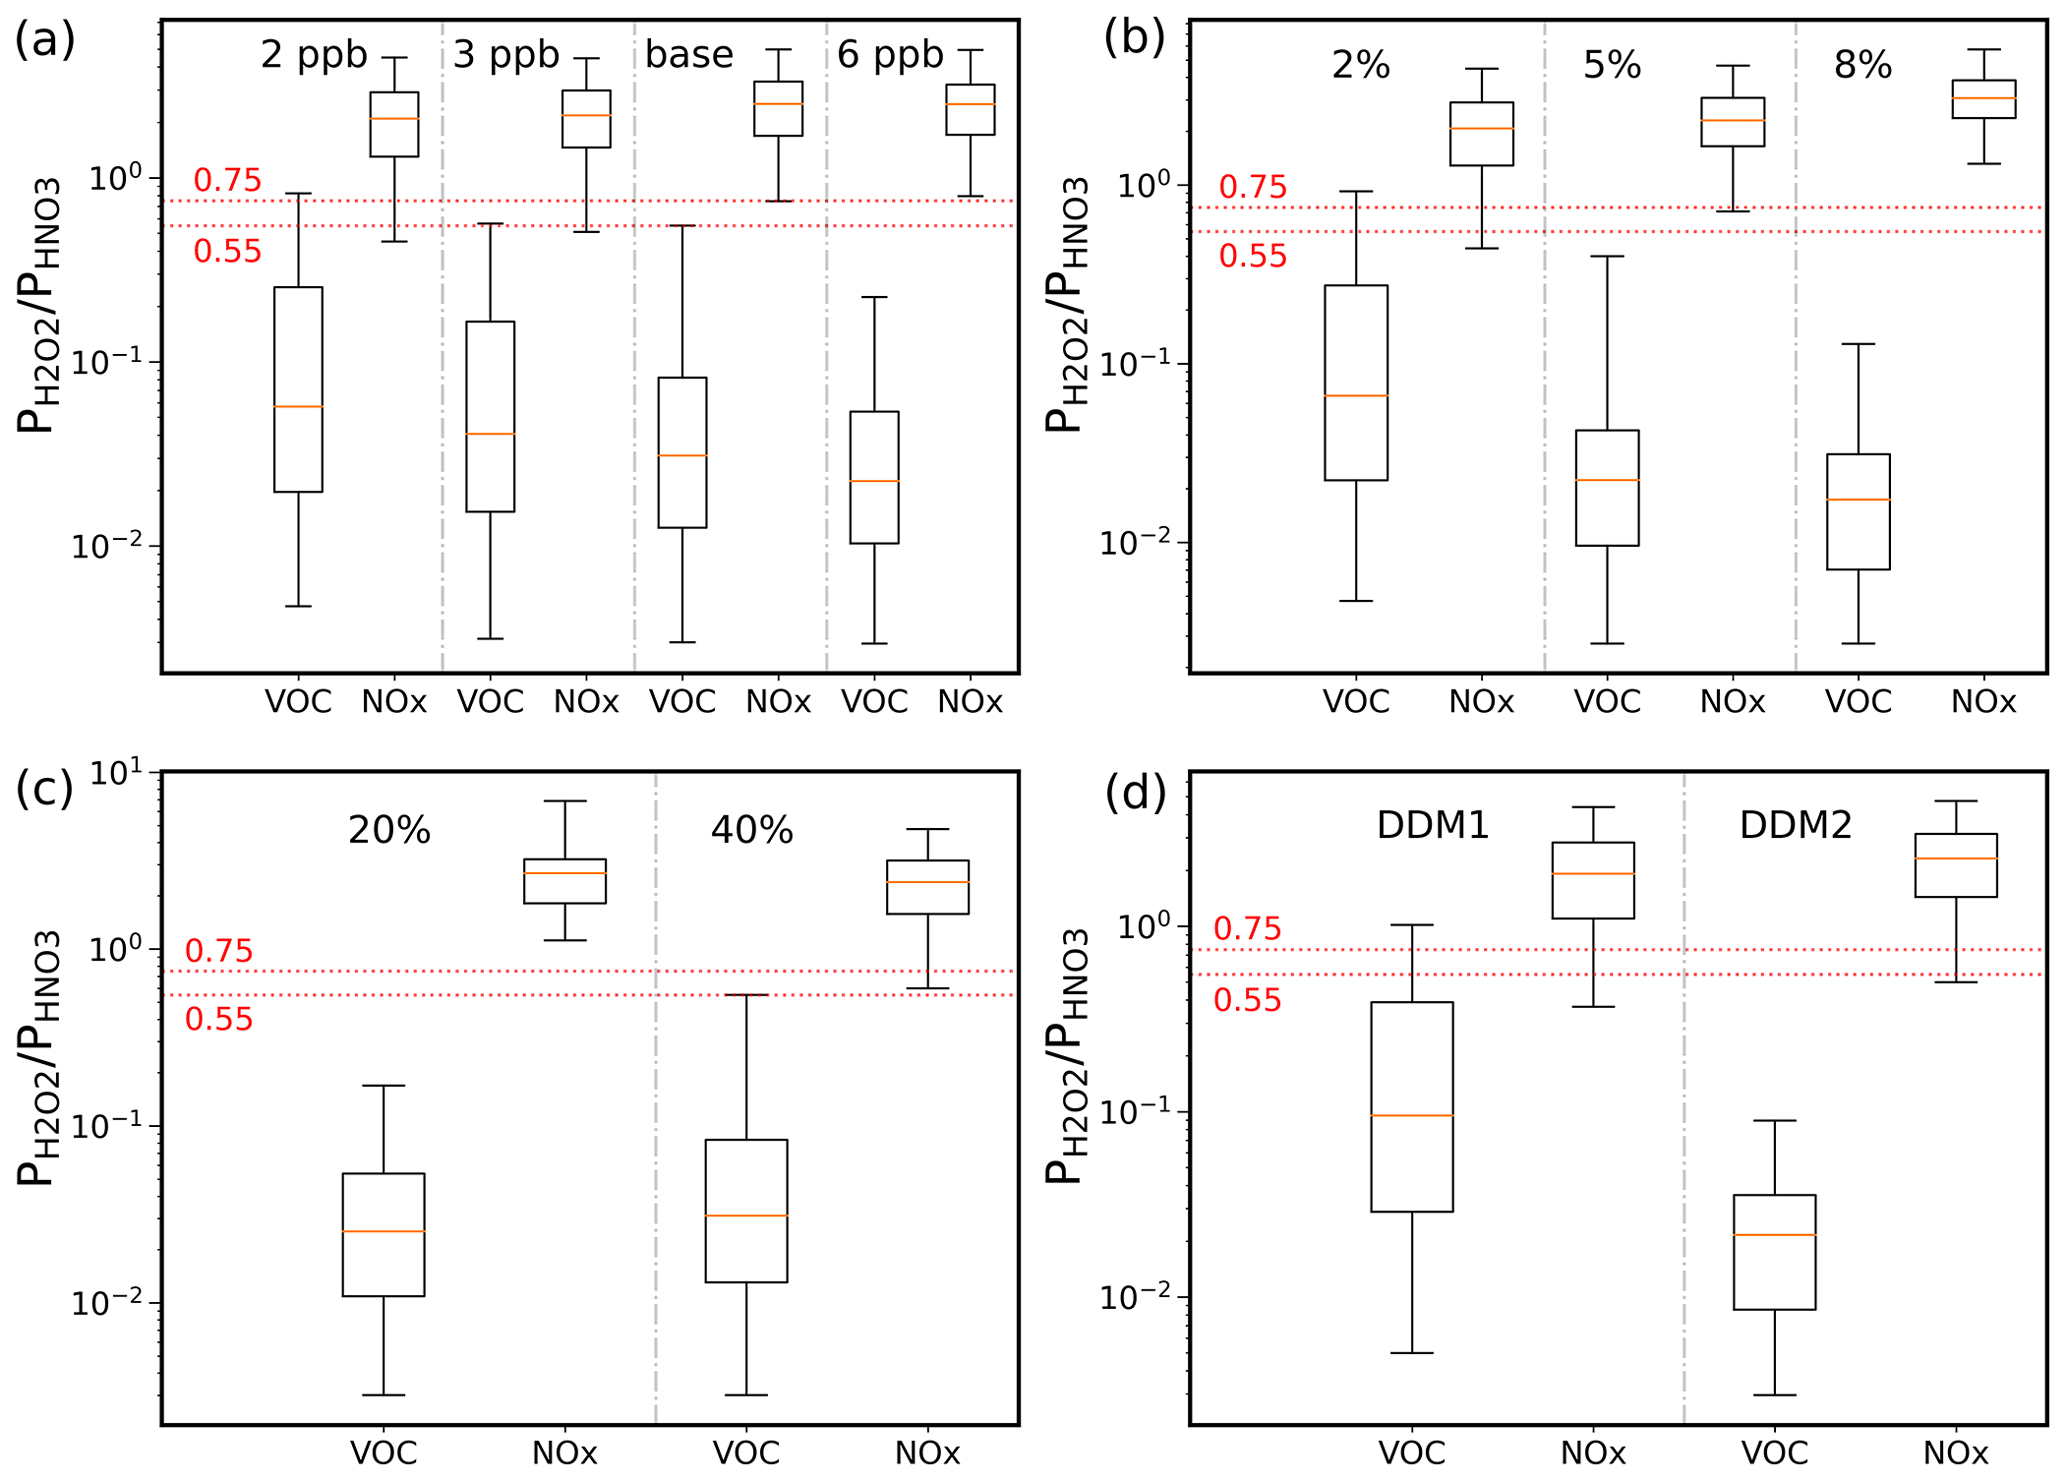
Figure 6The percentile distributions of the values at the VOC- or NOx-limited grid cells with different setups in methodology. The boxes indicate the 25th and 75th percentiles of the indicator values with the median values marked with horizontal red lines in the boxes, and the whiskers extend to the 5th and 95th percentiles. In each group, the upper whisker of the box in the VOCs column and the lower whisker of the box in the NOx column reflect the lower and upper values of the threshold intervals, respectively. The threshold intervals in Table 3 are indicated with dotted red lines.
First, the VOC-limited (NOx-limited) grid cells were defined as the locations where the reduction in O3 as a response to the VOC (NOx) reduction exceeded the O3 reduction associated with the reduced NOx (VOC) by more than 2, 3, and 6 ppb instead of the original 5 ppb (see Table 1). The threshold intervals are wider with higher criteria, e.g., the range of [0.3, 0.8] with sensitivity differences of >6 ppb versus [0.55, 0.75] with >5 ppb, leading to fewer VOC- or NOx-limited grid cells based on the indicator and more transitional grid cells with less chance of misclassification (Fig. 6a). However, the sensitivity differences of 2–3 ppb are too small to differentiate sensitivity types of the grid cells using the indicators, as the 95th percentile of the indicator values at the VOC-limited grids is higher than the 5th percentile of the values at the NOx-limited grids when determining the thresholds (see Sect. 2.3). Hence, the indicators are invalid. Similarly, if the relative changes in O3 were applied to quantify the O3–VOC–NOx sensitivity, such as using the differences of 2 %, 5 %, or 8 % as the criteria, the derived thresholds would be considerably different as well (Fig. 6b). The relative changes make more sense since O3 changes of ∼5 ppb due to a certain amount of VOC or NOx reduction are less likely to take place in locations with low O3 than in relatively polluted regions. As a result, the grid cells with low O3 are seemingly insensitive to precursors and were excluded from the VOC- or NOx-limited grids that were used to derive the thresholds. This can particularly affect the lower limits of the thresholds with much fewer VOC-limited grids, as in this study, and vice versa.
In Fig. 6c, the VOC and NOx emissions were individually reduced by 20 % or 40 % instead of 35 % but with a constant criterion of >5 ppb for the sensitivity differences. The lower reduction in emissions resulted in wider threshold intervals [0.18, 1.12] with a 20 % reduction versus [0.55, 0.75] with a 35 % reduction and [0.55, 0.60] with a 40 % reduction. This was similar to the case with higher criteria (Fig. 6a). In addition, if the VOC- or NOx-limited grids were defined based on the S1 VOCs and S1 NOx in the HDDM (see Table 1 and DDM1 in Fig. 6d), the indicator values for the VOC-limited grids and the NOx-limited grids would overlap to a large extent, with the 95th percentile of the indicator values at the VOC-limited grids of 1.0, and the 5th percentile of the values at the NOx-limited grids of 0.37. Therefore, the indicator could not be used. S1 VOCs and S1 NOx approximate the O3 changes with a 100 % reduction in the VOC and NOx emissions, respectively, without considering the nonlinearity (i.e., higher-order sensitivities) in O3 chemistry. This finding is consistent with Fig. 6c, which shows a quite narrow range of threshold intervals with more reduction in the precursor emissions. Additionally, the upper and lower thresholds derived with the DDM2 approach were 0.50 and 0.11, lower than 0.75 and 0.55, respectively. This was due to the lower O3 changes estimated with the second-order Taylor expansions than with the perturbed simulations (Fig. S5), similar to the case with a 20 % reduction in the VOC or NOx emissions and possibly reflecting the importance of higher-order terms in the HDDM as well. The results of , , and NOy (Figs. S6–S8) were similar. They all indicated that the thresholds of the photochemical indicators are dependent on the methods or parameters in the methodology. This could be one of the major uncertainties in the application of indicators to determine O3 chemical regimes.
This work revisited four photochemical indicators, including , , , and NOy, in implications for O3–NOx–VOC sensitivity and emission control strategies using a case study in the YRD. The threshold intervals for Jiangsu (one of the provinces in the YRD) were derived, [0.55, 0.75] for , [0.81, 1.35] for the surface ratio of , [0.38, 0.60] for , and [8.2, 17.6] for NOy, based on the relationship between the simulated indicator values and O3 changes resulting from a 35 % reduction in the VOC or NOx emissions. The indicators along with the localized thresholds were applied in other areas in the YRD, for a different simulation period, and with a combination of different locations and time to estimate the uncertainties related to the emissions and meteorology. The indicators displayed good performance in all cases, with OA values greater than 92 %, while and might have been susceptible to meteorological factors. However, and were the most consistent with the O3 isopleths among the four indicators and could be informative for policymakers. The ratio was less likely to attribute O3 formation to mixed sensitivity and tended to underestimate the positive sensitivity of O3 to NOx compared to the isopleths. In contrast, NOy, which was not constrained by the VOC abundance, overestimated the positive response of O3 to NOx and underestimated the O3–VOC sensitivity in some conditions.
Importantly, the intrinsic characteristics of the indicators as well as the methods used to obtain the thresholds affected the effectiveness of the indicators. A series of sensitivity tests were conducted to investigate the impacts with respect to the criteria for the definition of VOC- or NOx-limited grids; the number of VOC and NOx emission perturbations; and the method, i.e., the HDDM tool versus emission reduction, to estimate the O3–NOx–VOC sensitivity in the first place. The results showed that the more stringent the criteria were (i.e., with larger the O3 sensitivity differences or lower emission reductions using a given criterion), the wider the transition intervals were. This led to more attribution to the mixed O3 sensitivity and showed a preference for concurrent control of both precursors. However, the indicator values at the VOC- and NOx- limited grids could overlap in a large part and could not split the O3 sensitivity when the criteria were set too low. Finally, the first-order coefficients in the HDDM alone with a specified sensitivity difference could not be used to derive thresholds of indicators in this study, while Taylor expansions with first- and second-order sensitivity coefficients could result in lower and broader threshold intervals.
Photochemical indicators have the advantage of identifying O3 formation regimes promptly and are useful in policy implications. According to the case study in this work, we found that it was inappropriate to directly use the threshold of 0.35 for in the chemical transport models, as the value could be location-specific. More broadly, all of the indicators should be employed with specified thresholds that have been localized and thoroughly evaluated. In addition, the indicators could be different from each other. As such, it is necessary to understand the pros and cons of each indicator prior to their use.
The CMAQ outputs are currently available upon request. All Python codes used to create any of the figures are available upon request.
The supplement related to this article is available online at: https://doi.org/10.5194/acp-22-14799-2022-supplement.
XL, MQ, and JH conceived and designed the research. XL performed the simulations and analyzed the data. MQ, JH, HS, and JL contributed to result discussion. XL and MQ wrote the article with substantial contributions from all of the authors.
The contact author has declared that none of the authors has any competing interests.
Publisher's note: Copernicus Publications remains neutral with regard to jurisdictional claims in published maps and institutional affiliations.
This work was supported by the Natural Science Foundation of Jiangsu Province (BK20200815) and the National Natural Science Foundation of China (42107117, 42007187, 42021004).
This research has been supported by the Natural Science Foundation of Jiangsu Province (grant no. BK20200815) and the National Natural Science Foundation of China (grant nos. 42107117, 42007187, 42021004).
This paper was edited by Zhibin Wang and reviewed by two anonymous referees.
An, J., Huang, Y., Huang, C., Wang, X., Yan, R., Wang, Q., Wang, H., Jing, S., Zhang, Y., Liu, Y., Chen, Y., Xu, C., Qiao, L., Zhou, M., Zhu, S., Hu, Q., Lu, J., and Chen, C.: Emission inventory of air pollutants and chemical speciation for specific anthropogenic sources based on local measurements in the Yangtze River Delta region, China, Atmos. Chem. Phys., 21, 2003–2025, https://doi.org/10.5194/acp-21-2003-2021, 2021.
Castell, N., Stein, A. F., Mantilla, E., Salvador, R., and Millán, M.: Evaluation of the use of photochemical indicators to assess ozone-NOx-VOC sensitivity in the Southwestern Iberian Peninsula, J. Atmos. Chem., 63, 73–91, https://doi.org/10.1007/s10874-010-9158-x, 2009.
Chen, X., Jiang, Z., Shen, Y., Li, R., Fu, Y., Liu, J., Han, H., Liao, H., Cheng, X., and Jones, D. B.: Chinese regulations are working-why is surface ozone over industrialized areas still high? Applying lessons from northeast US air quality evolution, Geophys. Res. Lett., 48, e2021GL092816, https://doi.org/10.1029/2021GL092816, 2021.
Cohan, D. S., Hakami, A., Hu, Y., and Russell, A. G.: Nonlinear response of ozone to emissions: Source apportionment and sensitivity analysis, Environ. Sci. Technol., 39, 6739–6748, https://doi.org/10.1021/es048664m, 2005.
De Marco, A., Garcia-Gomez, H., Collalti, A., Khaniabadi, Y. O., Feng, Z., Proietti, C., Sicard, P., Vitale, M., Anav, A., and Paoletti, E.: Ozone modelling and mapping for risk assessment: An overview of different approaches for human and ecosystems health, Environ. Res., 211, 113048, https://doi.org/10.1016/j.envres.2022.113048, 2022.
Du, X., Tang, W., Cheng, M., Zhang, Z., Li, Y., Li, Y., and Meng, F.: Modeling of spatial and temporal variations of ozone-NOx-VOC sensitivity based on photochemical indicators in China, J. Environ. Sci., 114, 454–464, https://doi.org/10.1016/j.jes.2021.12.026, 2022.
Duncan, B. N., Yoshida, Y., Olson, J. R., Sillman, S., Martin, R. V., Lamsal, L., Hu, Y., Pickering, K. E., Retscher, C., and Allen, D. J.: Application of OMI observations to a space-based indicator of NOx and VOC controls on surface ozone formation, Atmos. Environ., 44, 2213–2223, https://doi.org/10.1016/j.atmosenv.2010.03.010, 2010.
Emery, C., Liu, Z., Russell, A. G., Odman, M. T., Yarwood, G., and Kumar, N.: Recommendations on statistics and benchmarks to assess photochemical model performance, J. Air Waste Manage., 67, 582–598, https://doi.org/10.1080/10962247.2016.1265027, 2017.
Feng, Z., Xu, Y., Kobayashi, K., Dai, L., Zhang, T., Agathokleous, E., Calatayud, V., Paoletti, E., Mukherjee, A., Agrawal, M., Park, R. J., Oak, Y. J., and Yue, X.: Ozone pollution threatens the production of major staple crops in East Asia, Nature Food, 3, 47–56, https://doi.org/10.1038/s43016-021-00422-6, 2022.
Gao, W., Tie, X., Xu, J., Huang, R., Mao, X., Zhou, G., and Chang, L.: Long-term trend of O3 in a mega City (Shanghai), China: Characteristics, causes, and interactions with precursors, Sci. Total Environ., 603–604, 425–433, https://doi.org/10.1016/j.scitotenv.2017.06.099, 2017.
Gipson, G. L. and Young, J.: Process analysis, Science Algorithms of the EPA Models-3 Community Multiscale Air Quality (CMAQ) Modeling System, government document, US Environmental Protection Agency, Washington DC, 1999.
Hu, J., Chen, J., Ying, Q., and Zhang, H.: One-year simulation of ozone and particulate matter in China using WRF/CMAQ modeling system, Atmos. Chem. Phys., 16, 10333–10350, https://doi.org/10.5194/acp-16-10333-2016, 2016.
Jiménez, P. and Baldasano, J. M.: Ozone response to precursor controls in very complex terrains: Use of photochemical indicators to assess O3-NOx-VOC sensitivity in the northeastern Iberian Peninsula, J. Geophys. Res.-Atmos., 109, D20309, https://doi.org/10.1029/2004JD004985, 2004.
Jin, X. and Holloway, T.: Spatial and temporal variability of ozone sensitivity over China observed from the Ozone Monitoring Instrument, J. Geophys. Res.-Atmos., 120, 7229–7246, https://doi.org/10.1002/2015JD023250, 2015.
Jin, X., Fiore, A. M., Murray, L. T., Valin, L. C., Lamsal, L. N., Duncan, B., Folkert Boersma, K., De Smedt, I., Abad, G. G., and Chance, K.: Evaluating a space-based indicator of surface ozone-NOx-VOC sensitivity over midlatitude source regions and application to decadal trends, J. Geophys. Res.-Atmos., 122, 10439–10461, https://doi.org/10.1002/2017JD026720, 2017.
Kwok, R. H. F., Baker, K. R., Napelenok, S. L., and Tonnesen, G. S.: Photochemical grid model implementation and application of VOC, NOx, and O3 source apportionment, Geosci. Model Dev., 8, 99–114, https://doi.org/10.5194/gmd-8-99-2015, 2015.
Li, K., Jacob, D. J., Shen, L., Lu, X., De Smedt, I., and Liao, H.: Increases in surface ozone pollution in China from 2013 to 2019: anthropogenic and meteorological influences, Atmos. Chem. Phys., 20, 11423–11433, https://doi.org/10.5194/acp-20-11423-2020, 2020.
Li, L., Hu, J., Li, J., Gong, K., Wang, X., Ying, Q., Qin, M., Liao, H., Guo, S., Hu, M., and Zhang, Y.: Modelling air quality during the EXPLORE-YRD campaign – Part II. Regional source apportionment of ozone and PM2.5, Atmos. Environ., 247, 118063, https://doi.org/10.1016/j.atmosenv.2020.118063, 2021.
Liang, J., Jackson, B., and Kaduwela, A.: Evaluation of the ability of indicator species ratios to determine the sensitivity of ozone to reductions in emissions of volatile organic compounds and oxides of nitrogen in northern California, Atmos. Environ., 40, 5156–5166, https://doi.org/10.1016/j.atmosenv.2006.03.060, 2006.
Liang, S., Li, X., Teng, Y., Fu, H., Chen, L., Mao, J., Zhang, H., Gao, S., Sun, Y., Ma, Z., and Azzi, M.: Estimation of health and economic benefits based on ozone exposure level with high spatial-temporal resolution by fusing satellite and station observations, Environ. Pollut., 255, 113267, https://doi.org/10.1016/j.envpol.2019.113267, 2019.
Liu, H., Wang, X. M., Pang, J. M., and He, K. B.: Feasibility and difficulties of China's new air quality standard compliance: PRD case of PM2.5 and ozone from 2010 to 2025, Atmos. Chem. Phys., 13, 12013–12027, https://doi.org/10.5194/acp-13-12013-2013, 2013.
Liu, J., Li, X., Tan, Z., Wang, W., Yang, Y., Zhu, Y., Yang, S., Song, M., Chen, S., Wang, H., Lu, K., Zeng, L., and Zhang, Y.: Assessing the ratios of formaldehyde and glyoxal to NO2 as Indicators of O3–NOx–VOC sensitivity, Environ. Sci. Technol., 55, 10935–10945, https://doi.org/10.1021/acs.est.0c07506, 2021.
Liu, X., Zhang, Y., Xing, J., Zhang, Q., Wang, K., Streets, D. G., Jang, C., Wang, W., and Hao, J.: Understanding of regional air pollution over China using CMAQ, part II. Process analysis and sensitivity of ozone and particulate matter to precursor emissions, Atmos. Environ., 44, 3719–3727, https://doi.org/10.1016/j.atmosenv.2010.03.036, 2010a.
Liu, X., Zhang, Y., Xing, J., Zhang, Q., Wang, K., Streets, D. G., Jang, C., Wang, W., and Hao, J.: Understanding of regional air pollution over China using CMAQ, part II. Process analysis and sensitivity of ozone and particulate matter to precursor emissions, Atmos. Environ., 44, 3719–3727, https://doi.org/10.1016/j.atmosenv.2010.03.036, 2010b.
Lu, C. H. and Chang, J. S.: On the indicator-based approach to assess ozone sensitivities and emissions features, J. Geophys. Res.-Atmos., 103, 3453–3462, https://doi.org/10.1029/97JD03128, 1998.
Lu, X., Hong, J., Zhang, L., Cooper, O. R., Schultz, M. G., Xu, X., Wang, T., Gao, M., Zhao, Y., and Zhang, Y.: Severe surface ozone pollution in China: A global perspective, Environ. Sci. Technol. Let., 5, 487–494, https://doi.org/10.1021/acs.estlett.8b00366, 2018.
Lu, X., Zhang, L., Wang, X., Gao, M., Li, K., Zhang, Y., Yue, X., and Zhang, Y.: Rapid increases in warm-season surface ozone and resulting health impact in China since 2013, Environ. Sci. Technol. Let., 7, 240–247, https://doi.org/10.1021/acs.estlett.0c00171, 2020.
Ma, M., Yao, G., Guo, J., and Bai, K.: Distinct spatiotemporal variation patterns of surface ozone in China due to diverse influential factors, J. Environ. Manage., 288, 112368, https://doi.org/10.1016/j.jenvman.2021.112368, 2021.
Martin, R. V., Fiore, A. M., and Van Donkelaar, A.: Space-based diagnosis of surface ozone sensitivity to anthropogenic emissions, Geophys. Res. Lett., 31, L06120, https://doi.org/10.1029/2004GL019416, 2004.
Murphy, J. G., Day, D. A., Cleary, P. A., Wooldridge, P. J., Millet, D. B., Goldstein, A. H., and Cohen, R. C.: The weekend effect within and downwind of Sacramento – Part 1: Observations of ozone, nitrogen oxides, and VOC reactivity, Atmos. Chem. Phys., 7, 5327–5339, https://doi.org/10.5194/acp-7-5327-2007, 2007.
Peng, Y.-P., Chen, K.-S., Wang, H.-K., Lai, C.-H., Lin, M.-H., and Lee, C.-H.: Applying model simulation and photochemical indicators to evaluate ozone sensitivity in southern Taiwan, J. Environ. Sci., 23, 790–797, https://doi.org/10.1016/s1001-0742(10)60479-2, 2011.
Qin, Y., Li, J., Gong, K., Wu, Z., Chen, M., Qin, M., Huang, L., and Hu, J.: Double high pollution events in the Yangtze River Delta from 2015 to 2019: Characteristics, trends, and meteorological situations, Sci. Total Environ., 792, 148349, https://doi.org/10.1016/j.scitotenv.2021.148349, 2021.
Shen, H., Sun, Z., Chen, Y., Russell, A. G., Hu, Y., Odman, M. T., Qian, Y., Archibald, A. T., and Tao, S.: Novel method for ozone isopleth construction and diagnosis for the ozone control strategy of Chinese cities, Environ. Sci. Technol., 55, 15625–15636, https://doi.org/10.1021/acs.est.1c01567, 2021.
Sheng, L., Qin, M., Li, L., Wang, C., Gong, K., Liu, T., Li, J., and Hu, J.: Impacts of emissions along the lower Yangtze River on air quality and public health in the Yangtze River delta, China, Atmos. Pollut. Res., 13, 101420, https://doi.org/10.1016/j.apr.2022.101420, 2022.
Sillman, S.: The use of NOy, H2O2, and HNO3 as indicators for ozone-NOx-hydrocarbon sensitivity in urban locations, J. Geophys. Res., 100, 14175–14188, https://doi.org/10.1029/94JD02953, 1995.
Sillman, S.: The relation between ozone, NOx and hydrocarbons in urban and polluted rural environments, Atmos. Environ., 33, 1821–1845, https://doi.org/10.1016/S1352-2310(98)00345-8, 1999.
Sillman, S.: Some theoretical results concerning O3-NOx-VOC chemistry and NOx-VOC indicators, J. Geophys. Res., 107, 4659, https://doi.org/10.1029/2001jd001123, 2002.
Sillman, S., He, D., Pippin, M. R., Daum, P. H., Imre, D. G., Kleinman, L. I., Lee, J. H., and Weinstein-Lloyd, J.: Model correlations for ozone, reactive nitrogen, and peroxides for Nashville in comparison with measurements: Implications for O3-NOx-hydrocarbon chemistry, J. Geophys. Res.-Atmos., 103, 22629–22644, https://doi.org/10.1029/98JD00349, 1998.
Skeie, R. B., Myhre, G., Hodnebrog, Ø., Cameron-Smith, P. J., Deushi, M., Hegglin, M. I., Horowitz, L. W., Kramer, R. J., Michou, M., Mills, M. J., Olivié, D. J. L., Connor, F. M. O., Paynter, D., Samset, B. H., Sellar, A., Shindell, D., Takemura, T., Tilmes, S., and Wu, T.: Historical total ozone radiative forcing derived from CMIP6 simulations, npj Clim. Atmos. Sci., 3, 32, https://doi.org/10.1038/s41612-020-00131-0, 2020.
Sun, J., Qin, M., Xie, X., Fu, W., Qin, Y., Sheng, L., Li, L., Li, J., Sulaymon, I. D., Jiang, L., Huang, L., Yu, X., and Hu, J.: Seasonal modeling analysis of nitrate formation pathways in Yangtze River Delta region, China, Atmos. Chem. Phys., 22, 12629–12646, https://doi.org/10.5194/acp-22-12629-2022, 2022.
Tan, Z., Lu, K., Jiang, M., Su, R., Dong, H., Zeng, L., Xie, S., Tan, Q., and Zhang, Y.: Exploring ozone pollution in Chengdu, southwestern China: A case study from radical chemistry to O3-VOC-NOx sensitivity, Sci. Total Environ., 636, 775–786, https://doi.org/10.1016/j.scitotenv.2018.04.286, 2018.
Tang, G., Wang, Y., Li, X., Ji, D., Hsu, S., and Gao, X.: Spatial-temporal variations in surface ozone in Northern China as observed during 2009–2010 and possible implications for future air quality control strategies, Atmos. Chem. Phys., 12, 2757–2776, https://doi.org/10.5194/acp-12-2757-2012, 2012.
Tonnesen, G. S. and Dennis, R. L.: Analysis of radical propagation efficiency to assess ozone sensitivity to hydrocarbons and NOx: 1. Local indicators of instantaneous odd oxygen production sensitivity, J. Geophys. Res.-Atmos., 105, 9213–9225, https://doi.org/10.1029/1999JD900371, 2000a.
Tonnesen, G. S. and Dennis, R. L.: Analysis of radical propagation efficiency to assess ozone sensitivity to hydrocarbons and NOx: 2. Long-lived species as indicators of ozone concentration sensitivity, J. Geophys. Res.-Atmos., 105, 9227–9241, https://doi.org/10.1029/1999JD900372, 2000b.
Torres-Jardon, R., García-Reynoso, J. A., Jazcilevich, A., Ruiz-Suárez, L. G., and Keener, T. C.: Assessment of the ozone-nitrogen oxide-volatile organic compound sensitivity of Mexico City through an indicator-based approach: measurements and numerical simulations comparison, J. Air Waste Manage., 59, 1155–1172, https://doi.org/10.3155/1047-3289.59.10.1155, 2009.
Vogel, B., Riemer, N., Vogel, H., and Fiedler, F.: Findings on NOy as an indicator for ozone sensitivity based on different numerical simulations, J. Geophys. Res.-Atmos., 104, 3605–3620, https://doi.org/10.1029/1998JD100075, 1999.
Wang, M., Chen, W., Zhang, L., Qin, W., Zhang, Y., Zhang, X., and Xie, X.: Ozone pollution characteristics and sensitivity analysis using an observation-based model in Nanjing, Yangtze River Delta Region of China, J. Environ. Sci., 93, 13–22, https://doi.org/10.1016/j.jes.2020.02.027, 2020.
Wang, N., Xu, J., Pei, C., Tang, R., Zhou, D., Chen, Y., Li, M., Deng, X., Deng, T., Huang, X., and Ding, A.: Air quality during COVID-19 lockdown in the Yangtze River Delta and the Pearl River Delta: Two different responsive mechanisms to emission reductions in China, Environ. Sci. Technol., 55, 5721–5730, https://doi.org/10.1021/acs.est.0c08383, 2021.
Wang, P., Guo, H., Hu, J., Kota, S. H., Ying, Q., and Zhang, H.: Responses of PM2.5 and O3 concentrations to changes of meteorology and emissions in China, Sci. Total Environ., 662, 297–306, https://doi.org/10.1016/j.scitotenv.2019.01.227, 2019.
Wang, X., Zhang, Y., Hu, Y., Zhou, W., Zeng, L., Hu, M., Cohan, D. S., and Russell, A. G.: Decoupled direct sensitivity analysis of regional ozone pollution over the Pearl River Delta during the PRIDE-PRD2004 campaign, Atmos. Environ., 45, 4941–4949, https://doi.org/10.1016/j.atmosenv.2011.06.006, 2011.
Wang, Y., Wild, O., Chen, X., Wu, Q., Gao, M., Chen, H., Qi, Y., and Wang, Z.: Health impacts of long-term ozone exposure in China over 2013–2017, Environ. Int., 144, 106030, https://doi.org/10.1016/j.envint.2020.106030, 2020.
Xie, M., Zhu, K., Wang, T., Yang, H., Zhuang, B., Li, S., Li, M., Zhu, X., and Ouyang, Y.: Application of photochemical indicators to evaluate ozone nonlinear chemistry and pollution control countermeasure in China, Atmos. Environ., 99, 466–473, https://doi.org/10.1016/j.atmosenv.2014.10.013, 2014.
Xu, J., Huang, X., Wang, N., Li, Y., and Ding, A.: Understanding ozone pollution in the Yangtze River Delta of eastern China from the perspective of diurnal cycles, Sci. Total Environ., 752, 141928, https://doi.org/10.1016/j.scitotenv.2020.141928, 2021.
Ye, C., Xue, C., Zhang, C., Ma, Z., Liu, P., Zhang, Y., Liu, C., Zhao, X., Zhang, W., and He, X.: Atmospheric hydrogen peroxide (H2O2) at the foot and summit of Mt. Tai: variations, sources and sinks, and implications for ozone formation chemistry, J. Geophys. Res.-Atmos., 126, e2020JD033975, https://doi.org/10.1029/2020JD033975, 2021.
Ye, L., Wang, X., Fan, S., Chen, W., Chang, M., Zhou, S., Wu, Z., and Fan, Q.: Photochemical indicators of ozone sensitivity: application in the Pearl River Delta, China, Front. Env. Sci. Eng., 10, 1–14, https://doi.org/10.1007/s11783-016-0887-1, 2016.
Zhang, Y., Zhao, Y., Li, J., Wu, Q., Wang, H., Du, H., Yang, W., Wang, Z., and Zhu, L.: Modeling ozone source apportionment and performing sensitivity analysis in summer on the North China Plain, Atmosphere, 11, 992–1011, https://doi.org/10.3390/atmos11090992, 2020.