the Creative Commons Attribution 4.0 License.
the Creative Commons Attribution 4.0 License.
 | 16 Nov 2022
Survival probability of new atmospheric particles: closure between theory and measurements from 1.4 to 100 nm
Runlong Cai
Chenjuan Deng
Dominik Stolzenburg
Chenxi Li
Junchen Guo
Veli-Matti Kerminen
Jingkun Jiang
Markku Kulmala
Juha Kangasluoma
The survival probability of freshly nucleated particles governs the influences of new particle formation (NPF) on atmospheric environments and the climate. It characterizes the probability of a particle avoiding being scavenged by the coagulation with pre-existing particles and other scavenging processes before the particle successfully grows up to a certain diameter. Despite its importance, measuring the survival probability has been challenging, which limits the knowledge of particle survival in the atmosphere and results in large uncertainties in predicting the influences of NPF. Here we report the proper methods to retrieve particle survival probability using the measured aerosol size distributions. Using diverse aerosol size distributions from urban Beijing, the Finnish boreal forest, a chamber experiment, and aerosol kinetic simulations, we demonstrate that each method is valid for a different type of aerosol size distribution, whereas misapplying the conventional methods to banana-type NPF events may underestimate the survival probability. Using these methods, we investigate the consistency between the measured survival probability of new particles and the theoretical survival probability against coagulation scavenging predicted using the measured growth rate and coagulation sink. With case-by-case and time- and size-resolved analysis of long-term measurement data from urban Beijing, we find that although both the measured and theoretical survival probabilities are sensitive to uncertainties and variations, they are, on average, consistent with each other for new particles growing from 1.4 (the cluster size) to 100 nm.
- Article
(6628 KB) - Full-text XML
- BibTeX
- EndNote


As one of the largest sources of uncertainties in climate prediction, atmospheric aerosol plays a key role in diverse environments. New particle formation (NPF) via vapor nucleation and subsequent growth (Kulmala et al., 2004, 2013; Zhang et al., 2012) is a key phenomenon associated with the atmospheric aerosol system, contributing majorly to the number concentrations of aerosols and cloud condensation nuclei (Kuang et al., 2009; Gordon et al., 2017). To reach a relatively long atmospheric residence time and exert significant influences on atmospheric environments, freshly nucleated particles need to grow fast beyond the smallest size range (e.g., sub-10 nm), in which they are most likely to be scavenged by pre-existing aerosols (McMurry, 1983; Kulmala et al., 2001). Hence, the fraction of freshly nucleated particles that survive the scavenging after a certain growth process, characterized by the survival probability, is a decisive factor for the influence of NPF on the atmosphere.
Although the formation rate (J) and growth rate (GR) of new particles have been often used to characterize NPF events (Kulmala et al., 2012; Kerminen et al., 2018), the survival probability is an important irreplaceable parameter in NPF studies. J and GR can connect the gaseous precursors and new particles, providing information on the formation and growth mechanisms. In terms of atmospheric influences, however, it is the total number of new particles formed during NPF and their survival probabilities that determine the contribution of NPF to the number of large particles. While the total number of new particles can be readily obtained by integrating J over time, predicting the survival probability requires information on the sink of particles in addition to GR. Although several studies computed the survival probability using the ratio of J at different particle sizes, we show below that this method may not be valid for every type of NPF event.
The knowledge of particle survival probability in the real atmosphere is rather limited despite its importance. On one hand, theoretical survival probabilities predicted using GR and the coagulation sink (CoagS) of new particles (Kerminen and Kulmala, 2002; Lehtinen et al., 2007; Pierce and Adams, 2007) have been widely used in regional and global models, bridging the gap between the size of freshly nucleated particles and the smallest size bin/mode in the model. On the other hand, however, there have been only a limited number of studies reporting the measured survival probabilities retrieved from aerosol size distributions (e.g., Weber et al., 1997; Kuang et al., 2009; Kulmala et al., 2017; Zhu et al., 2021; Sebastian et al., 2021). As summarized in the Appendix, only few studies have compared the measured and theoretical survival probabilities, and the reported results seem to indicate that the measured survival probability was sometimes higher than theoretical values. The limited information from measurements is the main obstacle for validating the modeling results and understanding particle survival. For instance, Kulmala et al. (2017) reported that for sub-3 nm particles in polluted megacities, the theoretically predicted survival probability could not explain the measured value with a deviation of several orders of magnitude, urging further investigations of the survival of freshly nucleated particles.
Retrieving the size-resolved survival probability from measured aerosol size distributions is the first step to address the consistency problem between measurements and theory, yet it has been challenging. The challenge mainly comes from the difficulty to track the growth and survival of individual particles or an aerosol population, as the measured particles are a sum of the surviving particles and other newly formed particles. Therefore, one has to retrieve survival probability from measurements based on other parameters instead of the total number of growing particles. Weber et al. (1997) used the concentration of gaseous sulfuric acid and the theoretical survival probability to estimate the total concentration (N) of particles larger than 3 nm, which essentially approximated the measured survival probability with the ratio of N at different times. Kerminen and Kulmala (2002) derived the theoretical survival probability of a strictly monodisperse aerosol population and concluded that the survival probability should be equal to the ratio of J at different sizes. Kuang et al. (2009) derived a semi-analytical formula for of an aerosol population with the influence of time-dependent source and sink terms, where n is the aerosol size distribution on the linear scale of particle size. The ratio of n at different sizes was taken as the survival probability. However, the derivations and validations of these formulae using J and n may need further discussion. Here we demonstrate that each formula is valid for only a certain type of NPF events, and it may report substantially biased survival probabilities for other events. These potential biases demand advances in the methods to retrieve the measured survival probability.
In this study, we report the proper formulae to retrieve the measured survival probability of new atmospheric particles. In addition to conventional formulae based on J and n, we propose a new formula based on to retrieve the measured survival probability from a growing aerosol population (e.g., in a banana-type NPF event). The performance of these formulae with different types of size distributions is tested using benchmark simulations based on aerosol kinetics and measurements from the real atmosphere, showing that these formulae are valid for their corresponding types of aerosol size distributions.
We then use the proper formulae to investigate the consistency between the measured and theoretical survival probabilities. Using data from long-term measurements in urban Beijing, a case study measured from a Finnish boreal forest site, and a chamber experiment, we perform case-by-case and time- and size-resolved analysis of particle survival probabilities. The results show that despite the large variations and high sensitivity in the survival probability, especially for sub-5 nm particles, the measured survival probability of new particles growing from 1.4 (electrical mobility diameter) to 100 nm can on average be explained by theory.
2.1 Definition of survival probability
The survival probability of a growing individual particle is the probability that the particle at an initial diameter (dp1, nm) will grow to a specified diameter (dp2) before it is scavenged (Weber et al., 1997; Pierce and Adams, 2007). For a growing monodisperse aerosol population containing a large number of particles in a steady environment, the survival probability is equal to the fraction of particles successfully growing from dp1 to dp2 against the scavenging, i.e.,
where P (–) is the survival probability, N (cm−3) is the total number concentration of particles in the monodisperse population, t (s) is time, and the subscript indicates the particle size and number concentration of the aerosol population corresponding to a certain time. Equation (1) emphasizes that the survival probability is defined for the same aerosol population and that the aerosol concentration is not affected by atmospheric processes of transport, mixing, dilution, etc.
2.2 Theoretical survival probability
The theoretical survival probability, referred to as Ptheo below, can be predicted using time- and size-dependent scavenging losses. For freshly nucleated atmospheric particles, scavenging losses are usually governed by Brownian coagulation (Kulmala et al., 2001). With a reasonable approximation that particles in the growing population share the same time- and size-dependent coagulation sink, the theoretical probability against coagulation scavenging can be computed by integrating CoagS as a function of particle size and time, i.e.,
where N is the total concentration of particles in the growing population. Further assuming that particles share the same time- and size-dependent GR (nm s−1) and substituting dGR and into the derivative of Eq. (2), one can obtain . Integrating this differential formula yields Eq. (3), in which P is expressed as a function of dp,
Equation (3) can be further simplified with predetermined size dependencies of CoagS (s−1) and GR, as have been given in previous studies (Weber et al., 1997; Kerminen and Kulmala, 2002; Lehtinen et al., 2007; Korhonen et al., 2014). These simplified formulae can be readily applied to compute Ptheo without CoagS and GR for each dp, yet in this study we use Eqs. (2) and (3) for better accuracy.
2.3 Measured survival probability
Different from the theoretical survival probability predicted using CoagS and GR (Eqs. 2 and 3), the measured survival probability is retrieved from the size distribution of growing new particles. Because of the challenges in tracking the same growing aerosol population against other freshly nucleated or pre-existing particles, it is practically difficult to use the definition of the survival probability in Eq. (1) for atmospheric measurements. As previously mentioned, particle formation rate J (cm−3 s−1; Kerminen and Kulmala, 2002) and linear size-scale distribution (cm−3 nm−1; Kuang et al., 2009) have been used as the parameters to retrieve particle survival probability from a growing aerosol population. In this study, however, we find that J and n are valid for steady-state and quasi-steady-state size distributions but may not be for a growing aerosol population, whereas the logarithmic size-scale is a promising empirical parameter for a growing aerosol population. The corresponding formulae for retrieving the measured survival probability are given in Eqs. (4)–(6):
where subscripts 1 and 2 indicate the diameters dp1 and dp2, respectively, at which J, n, and nlog are evaluated. For the convenience of illustration, we refer to the survival probabilities retrieved using J, n, and nlog as PJ, Pn, and , respectively.
2.4 Theoretical analysis of the measured survival probability
Here we present a theoretical analysis of the validity of Eqs. (4)–(6) using two ideal types of aerosol size distributions. First, for a growing aerosol population, which is assumed to follow a lognormal distribution, the survival probability can be expressed as Eq. (7) according to the definition in Eq. (1).
where nlog is the value at the distribution peak, and σg is the geometric standard deviation of aerosol size distribution.
For a growing aerosol population in the atmosphere, it is an empirical conclusion that σg usually stays at a relatively constant level (e.g., Hussein et al., 2004). Figure 1 shows an example of banana-type NPF events with a clear growth pattern of new particles from 5 to 60 nm. Although there were minor variations in σg, the maximum nlog was relatively constant after normalizing the change in N. This indicates that neglecting the ln(ln(σg,1) term in Eq. (7) for these events would introduce only a minor uncertainty, and hence in Eq. (6) could provide a good estimate of the survival probability of particles in this growing population. In contrast, n was significantly broadened as dp increased, and the maximum n decreased due to this broadening. This indicates that Pn in Eq. (5) would underestimate the survival probability of the growing aerosol population. Since GR, PJ in Eq. (4) would also underestimate the survival probability.
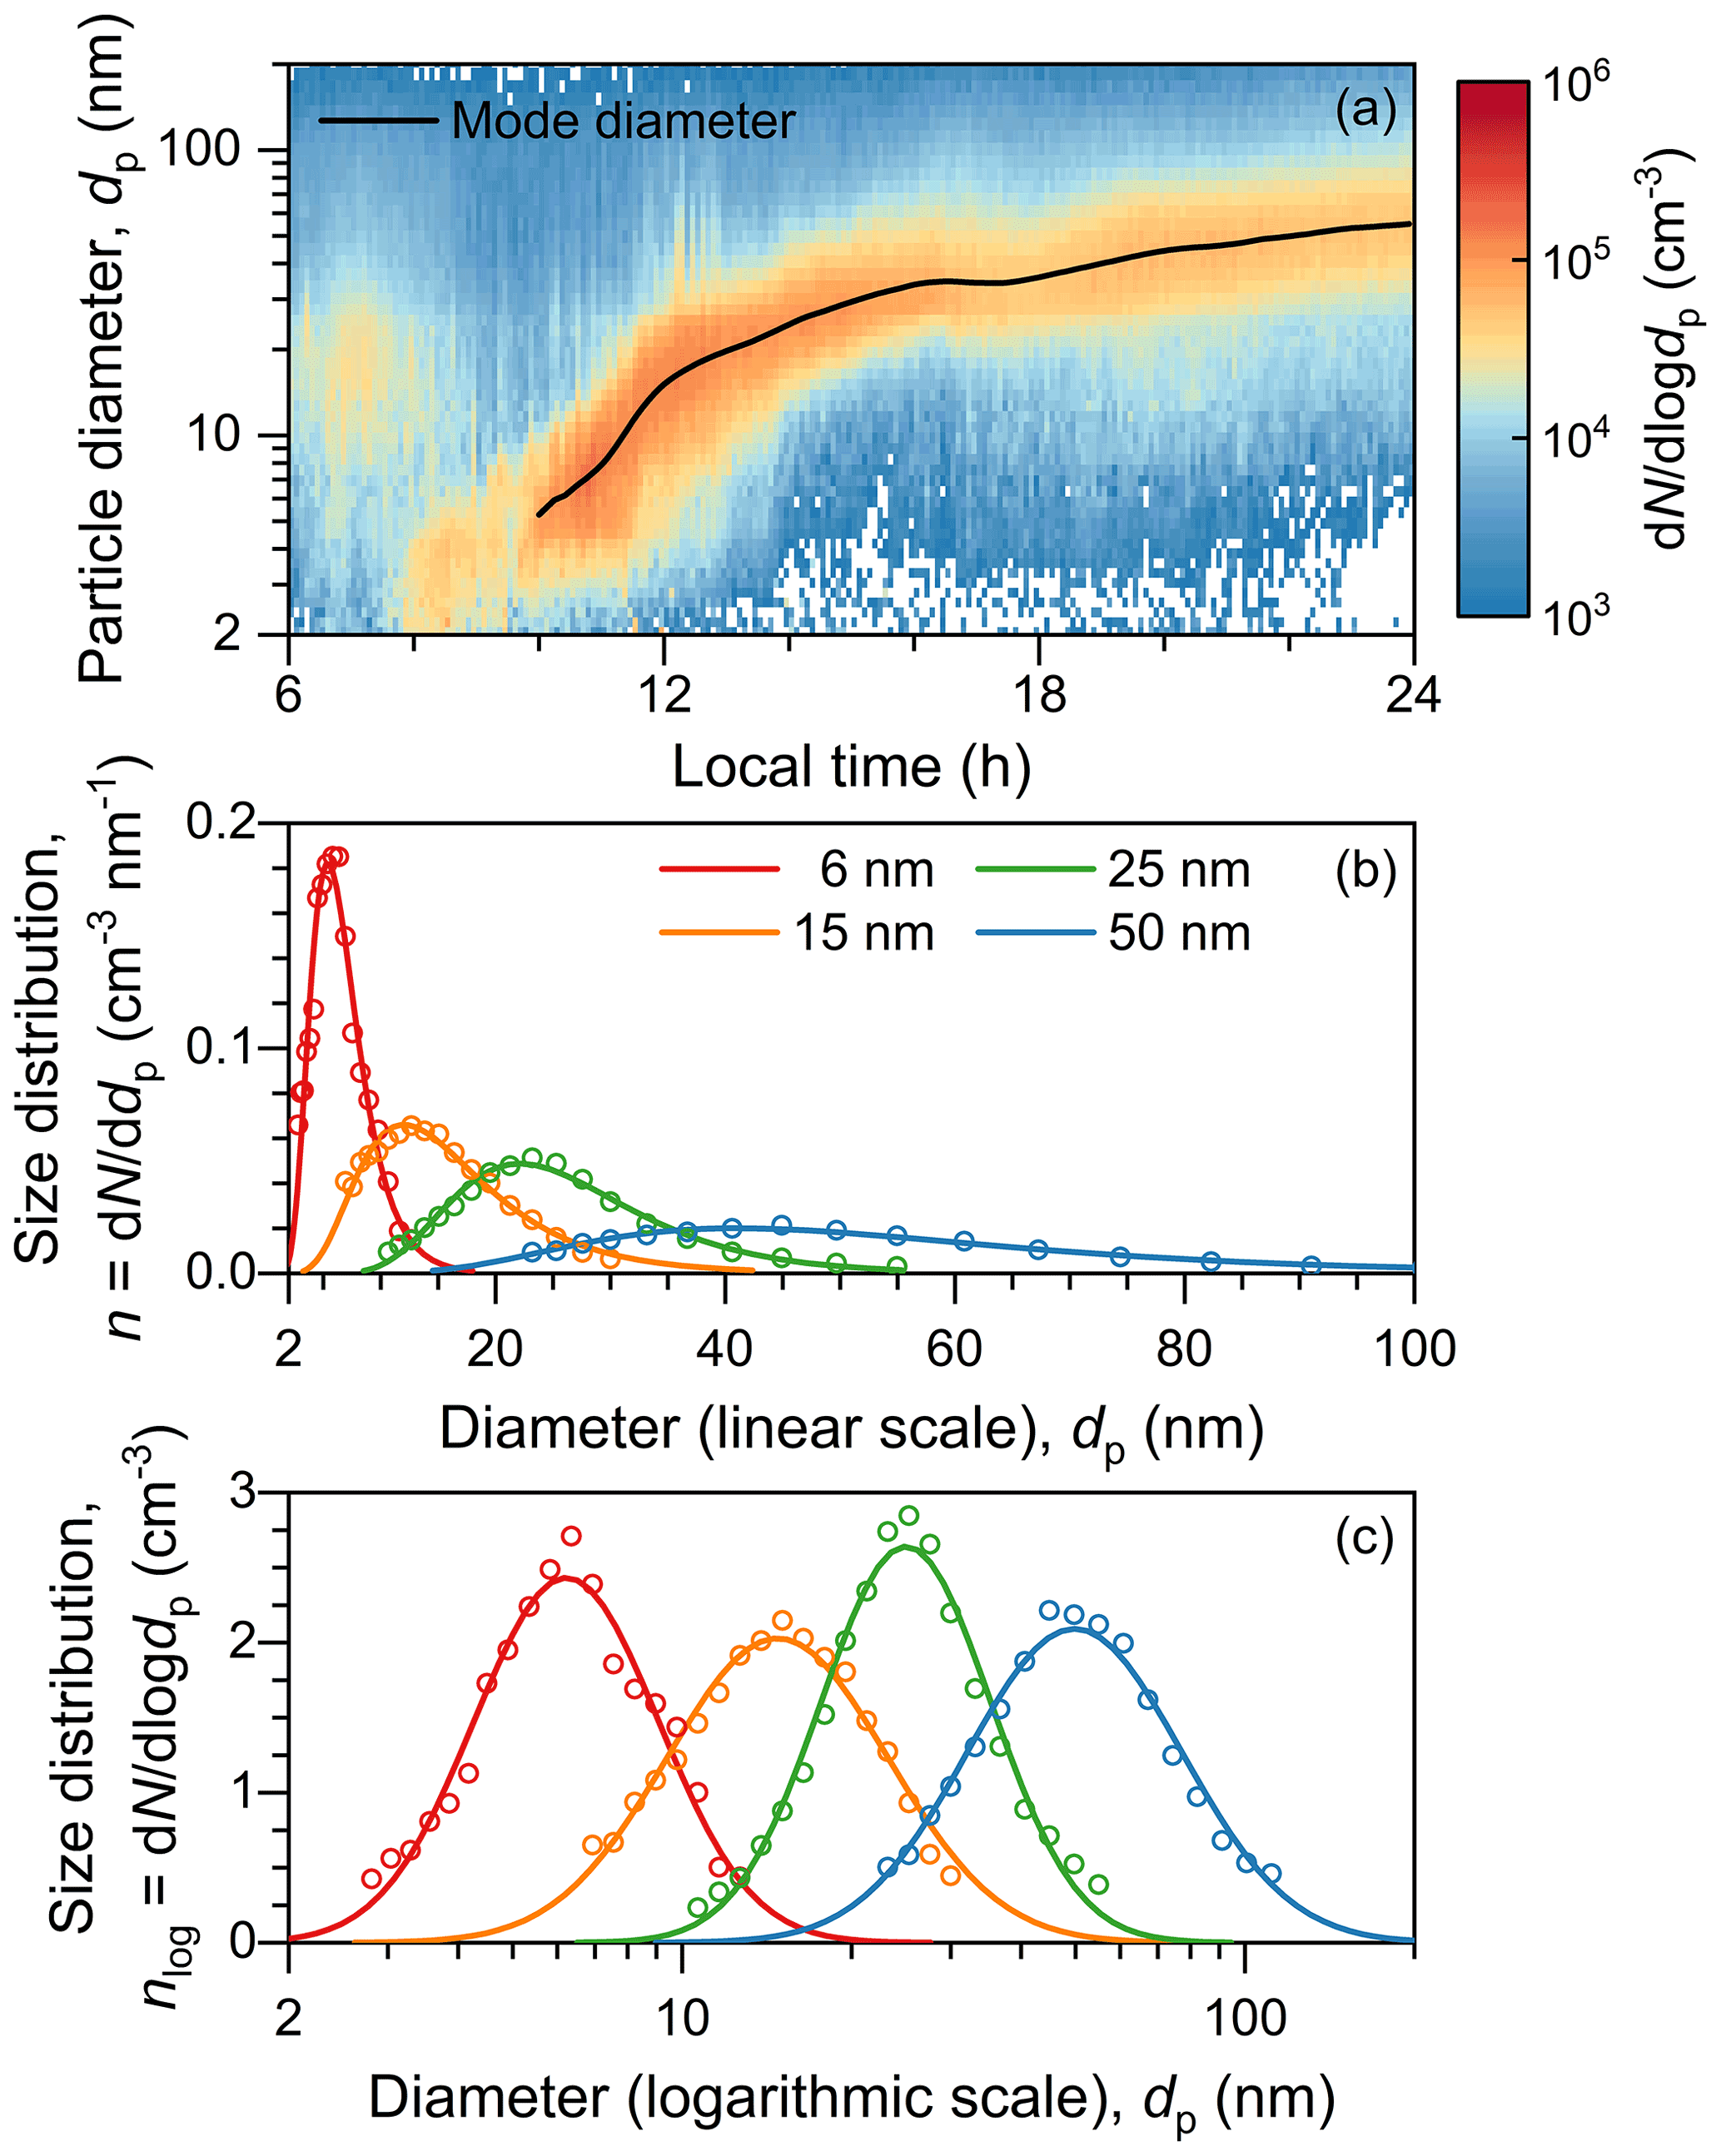
Figure 1Evolution of aerosol size distribution in urban Beijing during an NPF event. Panel (a) shows the whole growth pattern, and panels (b) and (c) show the dd dp and dd logdp, respectively, when growing new particles reached certain sizes. In panels (b) and (c), the size distribution is normalized by dividing it by the fitted number concentration so that the area of every peak is equal to unity. The markers and lines are the measured and fitted distributions, respectively. The size distributions in panels (b) and (c) are identical to each other, though they are shown on different vertical axes and horizontal scales.
It is worth clarifying that σg may have a strong size dependency during some growth processes. For instance, if particle growth is only driven by the condensation of non-volatile vapors, σg tends to decrease as particles grow in size (see the Appendix). For those kinds of situations, Eq. (7) should be used instead of Eq. (6) for better accuracy.
We then consider another type of ideal aerosol size distribution, for which the n of freshly nucleated particles is at a steady state. The steady state refers to a condition under which the time derivative of n is negligible, i.e.,
where the ∂J(dp) term characterizes the flux of growing particles through dp.
The formulae for the measured survival probability of particles with this steady-state distribution can be theoretically derived. Substituting GR into Eq. (8) and integrating from dp1 to dp2 yields the relationship between J and CoagS/GR,
Comparing Eqs. (3) and (9), one can readily conclude that is equal to the survival probability of particles with a steady-state size distribution. With a size-independent GR, is also equal to the survival probability, i.e.,
It is worth emphasizing that although Eqs. (10) and (11) look very similar to Eqs. (4) and (5), there is a conceptual difference between them. This difference lies in the view of the two ideal aerosol size distributions. For the growing aerosol population, we track the time evolution of the aerosol size distribution from a Lagrangian point of view in the particle size space (Eqs. 4–6). For the steady-state aerosol size distribution, the measured size distribution is the sum of particles formed at different times. Instead of tracking the temporal evolution, we focus on the particle growth fluxes through certain size bins at the same moment and then derive the relationship between the measured size distribution and the survival probability (Eqs. 10 and 11).
Summarizing the analysis above, is expected to be valid for a growing aerosol population, whereas PJ and Pn are expected to be valid for a steady-state distribution.
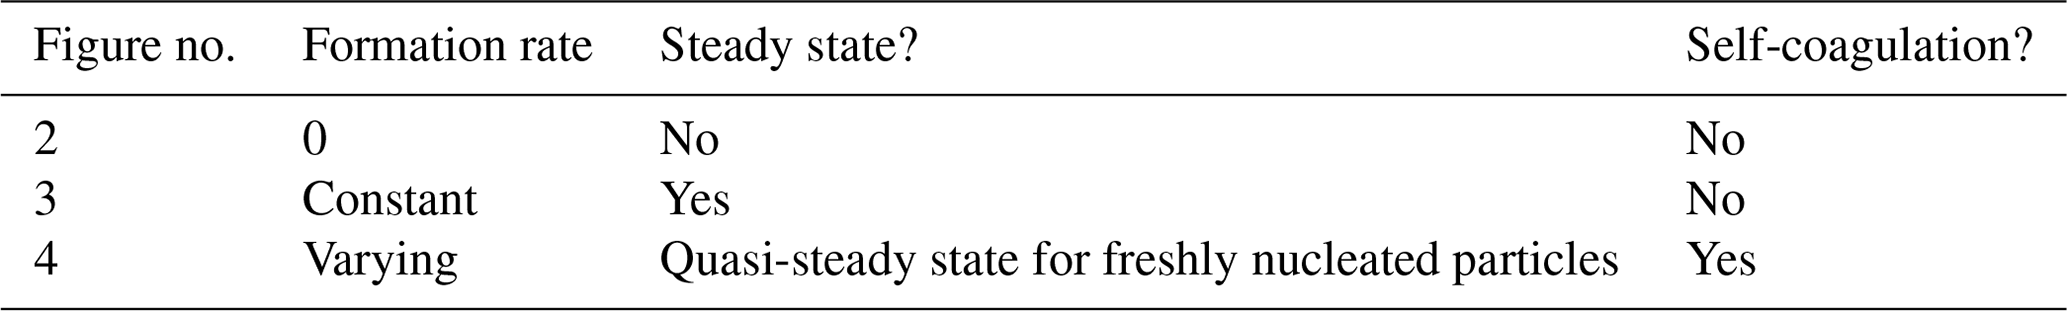
3.1 Simulation
A sectional model based on aerosol kinetics was used as a benchmark to generate aerosol size distributions and test the formulae for survival probability computation. The evolving aerosol size distribution was simulated by numerically solving aerosol population balance equations, which account for new particle formation, particle condensational growth, the coagulation sink of particles, and self-coagulation of new particles. Detailed information on this model has been described previously (Li and Cai, 2020). We validated the accuracy of the sectional model using a discrete model, ensuring that numerical diffusion did not affect the conclusions based on simulation results. For the convenience of discussion, we used time-independent external coagulation sinks for particles in these simulations. A size-dependent growth enhancement factor for particle growth (Kuang et al., 2010) was used as an input parameter to generate size-dependent growth rates. The simulation conditions are summarized in Table 1.
3.2 Measurements
We investigated the survival probability of new particles and the validity of different methods for survival probability computation using data measured from urban Beijing and a Finnish boreal forest site. The long-term NPF data for urban Beijing was measured at the BUCT (Beijing University of Chemical Technology) site (Liu et al., 2020), which is located on the west campus of Beijing University of Chemical Technology and close to the west 3rd Ring Road of Beijing. Despite the high coagulation sink of new particles in urban Beijing (Cai et al., 2017b), intensive NPF events have been frequently observed. We used the data measured from 16 January to 26 December 2018 in Beijing to represent NPF events in polluted megacities and analyzed a total of 65 NPF event days with clear patterns of new particle formation and growth. The NPF event measured on 11 April 2020 from a relatively clean environment at the SMEAR II station at Hyytiälä, Finland (Hari and Kulmala, 2005) was analyzed as a case study. We also analyzed an NPF experiment measured in the Cosmics Leaving OUtdoor Droplets (CLOUD) chamber at the European Center for Nuclear Research (CERN; Kirkby et al., 2011; Duplissy et al., 2016). In that experiment, gaseous precursor (α-pinene, isoprene, and ozone) concentrations were kept constant, and NPF was initiated by a sudden increase in ion concentrations in the chamber (Heinritzi et al., 2020), yielding a steady-state aerosol size distribution during NPF.
The aerosol number size distributions in the Beijing atmosphere were measured using a diethylene glycol scanning mobility particle spectrometer (DEG-SMPS; Jiang et al., 2011) and a particle size distribution system (PSD; Liu et al., 2016). The DEG-SMPS covered the size range of 1–6.5 nm (electrical mobility diameter, same below), and it was deployed with a core sampling device (Fu et al., 2019) and a miniature cylindrical differential mobility analyzer (Cai et al., 2017a) to improve the sampling and classification of particles in this size range. The PSD was used to measure particles with diameters ranging from 3 nm to 10 µm. The aerosol size distributions at Hyytiälä were measured using a differential mobility analyzer train (DMA train; Stolzenburg et al., 2017) and a twin differential mobility particle spectrometer (Aalto et al., 2001), covering the diameter ranges of 1.8–8 and 3–1000 nm, respectively. At CLOUD, the aerosol size distributions were measured by the DMA train (1.8–8 nm) and a TSI nano-scanning mobility particle sizer (nano-SMPS; Model 3982, 2–64 nm). All these instruments obtained the size information of aerosols based on the electrical mobility classification, which could provide a relatively good sizing accuracy, especially for freshly nucleated particles.
3.3 Data analysis
The formation rate J, CoagS, and GR along the growth trajectories of new particles were determined to compute the survival probability of new atmospheric particles. For simulated NPF events, the growth trajectory was obtained using a monodisperse aerosol model. For measured NPF events, the growth trajectory is approximated using the evolution of particle mode diameters or the maximum concentration method, though particle growth does not exactly follow the increasing diameters due to the influences of coagulation (Stolzenburg et al., 2005; Leppä et al., 2011). J was retrieved using a population balance method with improved accuracy for NPF in polluted environments (Cai et al., 2017a). Time- and size-dependent CoagS was computed using the measured particle size distribution (Kulmala et al., 2001).
We tested the performance of different methods in different environments in order to minimize the uncertainties in the retrieved GR. For urban Beijing, we found a systematic difference between the GR estimated using the appearance time method (Lehtipalo et al., 2014; Cai et al., 2021) and the mode-fitting method (Kulmala et al., 2012; Deng et al., 2020) for sub-5 nm particles, which has been reported previously (Qiao et al., 2021; Deng et al., 2021). Such a difference is likely due to the influences of the continuous formation of freshly nucleated particles and primary emissions of particles. The mode-fitting method tracks the growth of the peak diameter of a new particle mode by fitting lognormal distributions to the measured nlog. However, the fitted mode is a sum of the growing particles and freshly nucleated particles, and hence the apparent growth of the fitted mode is slower than the growing mode. Consequently, the mode-fitting method tends to underestimate the GR for sub-5 nm particles (Cai et al., 2022). Hence, we used the 50 % appearance time method to calculate the GR for sub-5 nm particles and applied a GR-based correction when computing Ptheo, which tracks the time that particle concentration for each size bin reached 50 % of the daily maximum. For Hyytiälä, the GR was retrieved using the maximum concentration method (Kulmala et al., 2012), which finds the time corresponding to the maximum particle concentration in each size bin, and the concentration was smoothed with a span of 12 min. The GR retrieved using the maximum concentration method was consistent with that retrieved using the 50 % appearance time method. We did not use the appearance method directly because it does not track the growth trajectory of new particles.
The measured survival probabilities of particles were computed using Eqs. (4)–(6). According to our simulation results, we determined n and nlog for each particle size in Eqs. (5) and (6) along smoothed growth trajectories and the J in Eq. (4) as the maximum J during an NPF event as a function of particle size.
The Ptheo for new atmospheric particles was computed using Eq. (2), with the CoagS determined along the mode diameters and the concentration of new particles numerically solved by iteration. This approach is equivalent to using Eq. (3) with time- and size-dependent CoagS and GR.
To compare the theoretical and measured survival probabilities from long-term measurements in urban Beijing, we first computed their values for each NPF event. Considering the fact that the validity of the formulae to retrieve the measured survival probability in Eqs. (4)–(6) is based on the homogeneity of the system, we compared the medians of the theoretical and measured values. The medians were first computed for each size bin, and the overall median survival probabilities were then reconstructed by integrating the size-resolved values from 1.4 to 100 nm. In this way, we minimized the influences of atmospheric variations and preserved the non-linearity of the survival probability as a function of GR and CoagS.
4.1 Validity of PJ, Pn, and P for different types of NPF events
We first test the methods to retrieve the survival probability of particles in a growing aerosol population against coagulation scavenging. Vapor concentration is constant during particle growth, and the growth rate for 10–50 nm particles shows only a weak size dependency. For a simulated system without particle sources from nucleation, primary emissions, etc. (Fig. 2a), the “true” survival probability can be retrieved with N using the definition in Eq. (1) since all the particles are from the same population. Ptheo can be predicted using Eqs. (2) and (3) with an approximation that the particles in this growing population share the same size-dependent CoagS and GR. As shown in Fig. 2b, the accuracy of Ptheo is evidenced by its consistency with the “true” values. Accordingly, we use Ptheo below as a benchmark for the survival probability retrieved from every simulation result.

Figure 2Survival probabilities of new particles in simulated and measured growing aerosol populations. (a) A growing size distribution of an aerosol population. There is no formation of new particles after the initial state. (b) The survival probability of new particles in the simulated aerosol population retrieved using different methods. (c) A banana-type NPF event measured from the boreal environment at Hyytiälä. A growth trajectory is retrieved using the maximum concentration method (Kulmala et al., 2012). (d) The survival probability of new particles in the measured NPF event. The theoretical lines in panels (b) and (d) are retrieved from the growth rate and the coagulation sink using Eqs. (2) and (3). The shaded area in panel (b) indicates the particle growth rate. The markers show the survival probabilities retrieved from the size distribution using Eqs. (1) and (4)–(6). Briefly, the retrieved survival probability is equal to X(), where X is N, dd dp, J, or dd log dp.
The measured survival probability of particles in a growing population can be estimated using . Figure 2b shows that for a growing aerosol population with a relatively constant σg, the decrease in nlog along the growth trajectory is consistent with the decreasing theoretical survival probability, as the decrease in the maximum nlog is mainly caused by the coagulation scavenging. In contrast, PJ and Pn underestimate the survival probability because they neglect the broadening of particle size distribution in the linear size scale. These underestimations can be estimated according to . For instance, for a population of particles growing from 2 to 20 nm, PJ and Pn are expected to report survival probabilities that are approximately 1 order of magnitude (0.1=2 nm20 nm) lower than .
The validity of for an ideal growing aerosol population can be generalized to the growth of new atmospheric particles, e.g., in a banana-type NPF event. Figure 2c shows a typical banana-type NPF event measured at Hyytiälä, with the formation of new particles around noon and a clean pattern of subsequent particle growth. The growth trajectory of new particles is indicated using the maximum concentration of particles measured in each size bin, with the maximum concentration mainly contributed by particles formed with the maximum formation rate (at noon; Kulmala et al., 2012). For this NPF event, is consistent with the Ptheo predicted using the measured CoagS and GR, whereas PJ and Pn substantially underestimate particle survival probability (Fig. 2d).
We then test the methods to retrieve the survival probability of particles from steady-state distributions. As shown in Fig. 3a, new particles in the simulated system are generated with a constant formation rate, and they grow with a time-independent GR. The size distribution of freshly nucleated particles reaches a steady state shortly after the initial state, though the whole system is at a pseudo-steady state with net production of large particles. Due to the continuous particle formation, it is difficult to apply the definition of survival probability in Eq. (1) to the simulated NPF. Misapplying Eq. (1) by taking all the measured particles as surviving particles would result in survival probability values larger than unity (Fig. 3b).
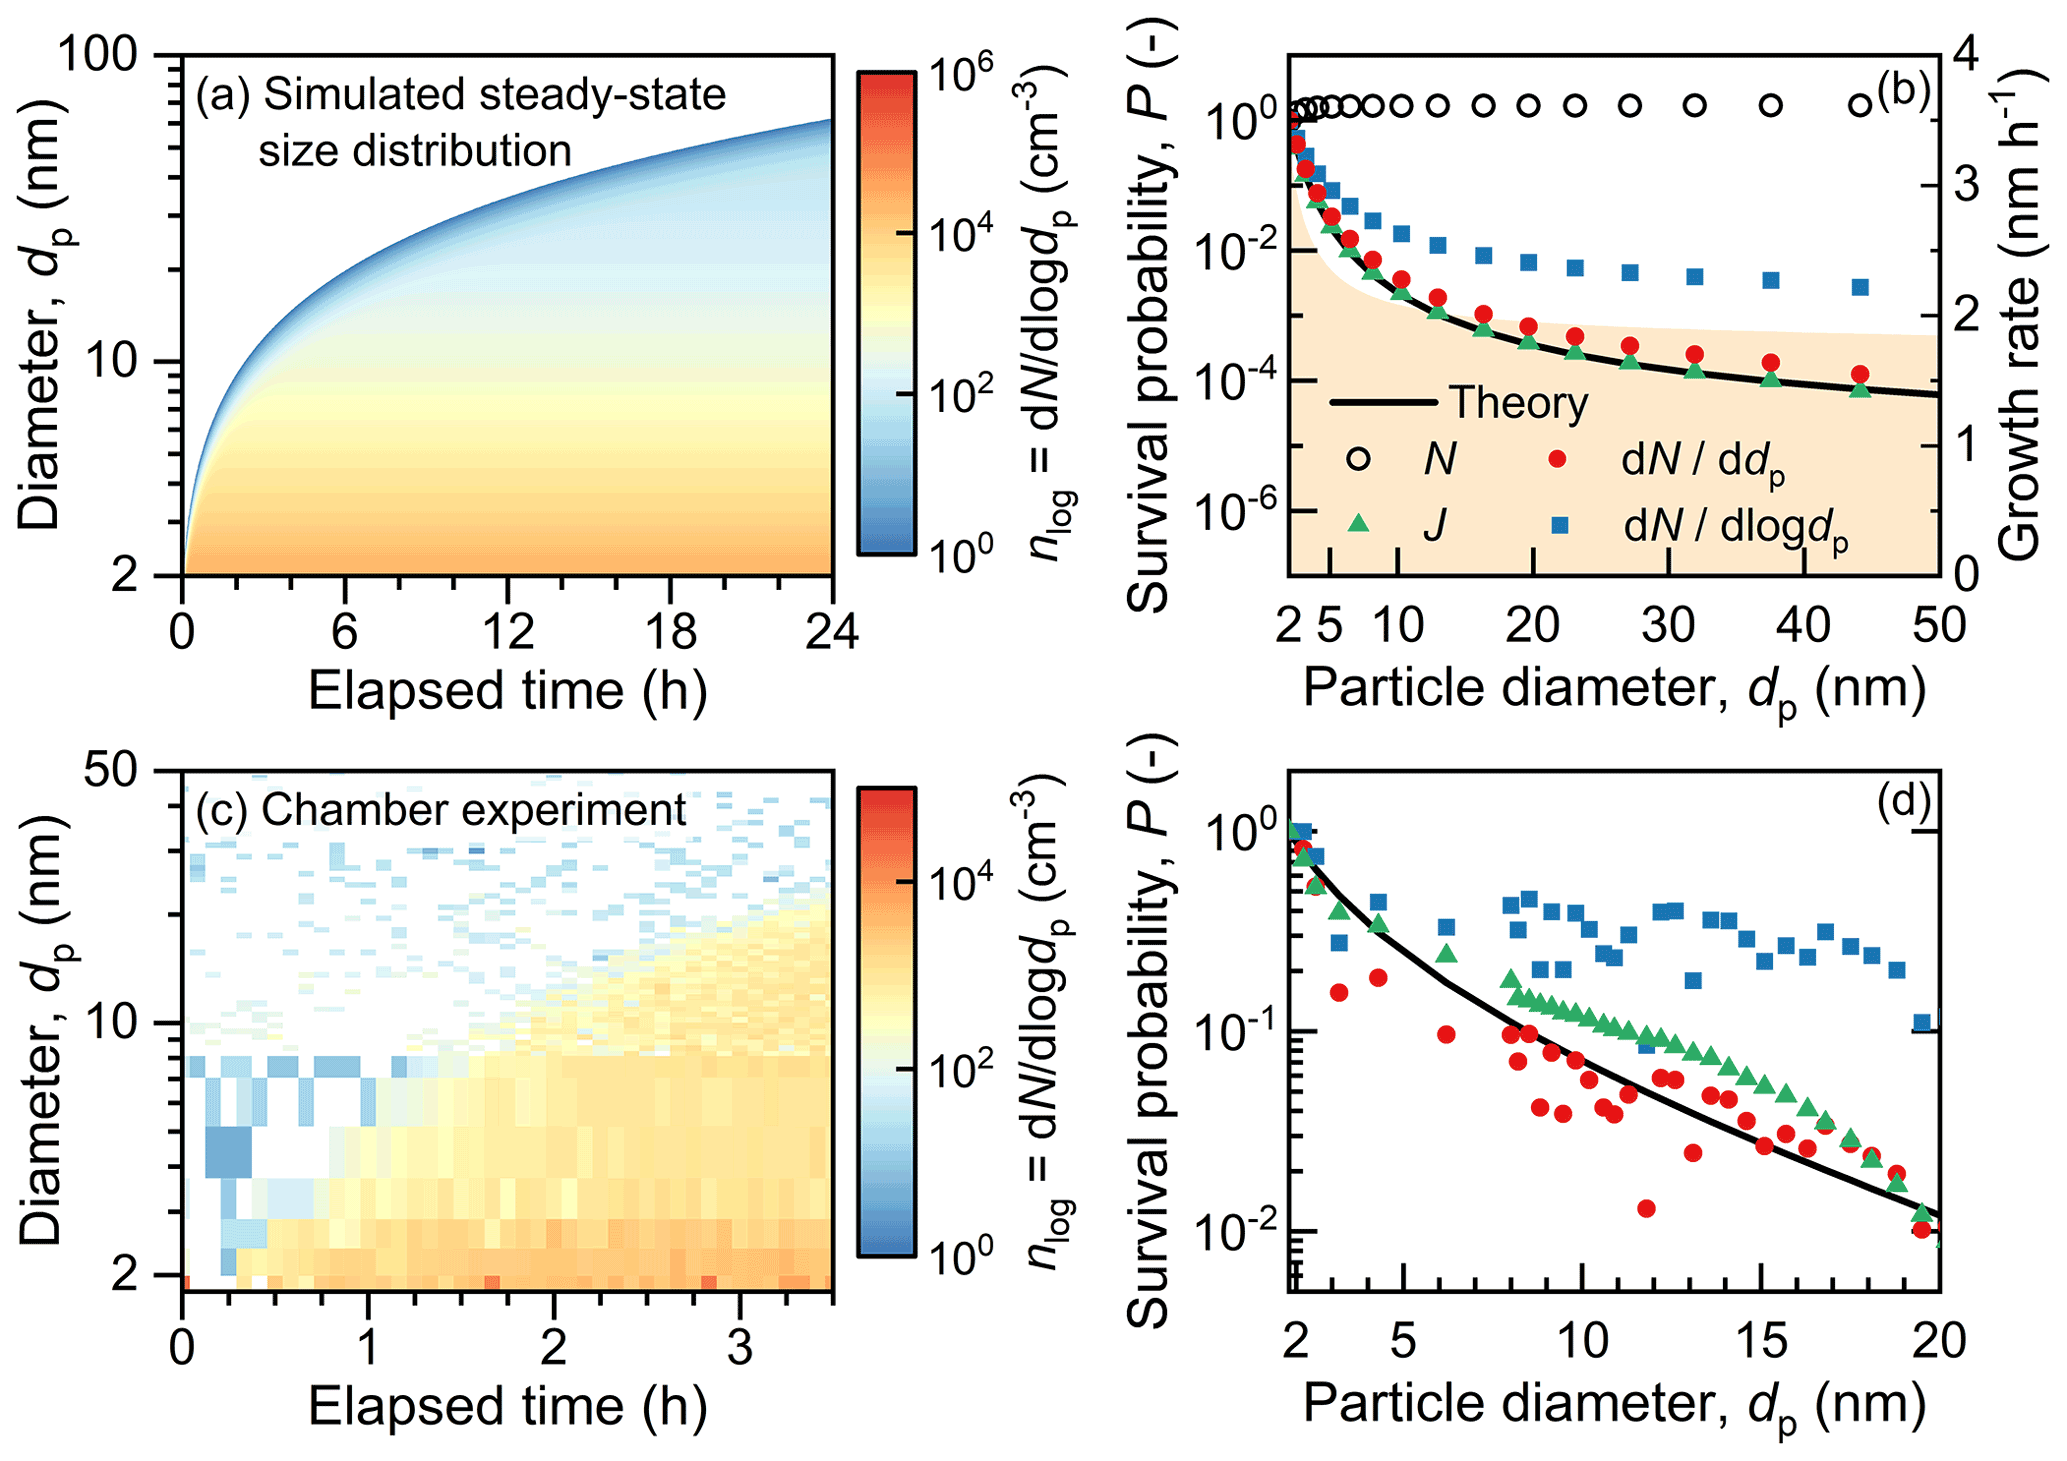
Figure 3Survival probabilities of new particles with steady-state size distributions. (a) Simulated size distribution of new particles. The formation rate and size-dependent growth rate of particles are maintained time-independent during the simulation. (b) The survival probability of new particles in the simulated new-particle-formation event retrieved using different methods. N is herein the total number concentration of particles. (c) An NPF event measured in the CLOUD chamber. (d) The survival probability of new particles in the measured NPF event evaluated at 3.5 h elapsed time.
PJ and Pn are valid for particles with steady-state concentrations. For the simulated NPF in Fig. 3a, we compute PJ and Pn using the measured aerosol size distribution at the end of the simulation (t=24 h) instead of following a growth trajectory (see Eqs. 10 and 11). Consistent with the derivations in theory, PJ can reproduce Ptheo well with negligible uncertainties, and Pn is also a good estimate with minor uncertainties originating from the size-dependent GR. Accordingly, PJ and Pn in Eqs. (10) and (11) can be used for NPF with constant formation and growth rates, as well as freshly nucleated particles whose concentration is at a steady state.
The validity of PJ and Pn for steady-state size distributions is verified using an NPF event measured in the CLOUD chamber. As shown in Fig. 3c, with a constant formation rate of freshly nucleated particles, the measured size distribution of sub-20 nm particles reached a steady state after an elapsed time of ∼3 h. We took the size distribution measured at 3.5 h and computed PJ and Pn using Eqs. (10) and (11). was also computed using the same size distribution. Ptheo was computed using the measured GR and the total sink of particles. Instead of the CoagS, the sink of new particles in the CLOUD chamber was governed by dilution and size-dependent wall losses (Stolzenburg et al., 2020). For this NPF event, PJ and Pn are consistent with Ptheo, while overestimates the survival probability as it is expected (Fig. 3d).
Atmospheric NPF events are usually driven by precursors with varying concentrations. The growth of freshly nucleated particles usually takes hours, whereas the particle formation rate usually varies significantly during such a long period, indicating that the steady-state assumption may not be valid for all particle sizes. As shown in Fig. 4a, freshly nucleated particles are formed between 0–5 h in a simulated system, and the nucleation rate as a function of time peaks at 2.5 h. These nucleated particles grow with a time- and size-independent GR. Figure 4b shows the PJ in Eq. (10) with the steady-state assumption evaluated at t=2, 3, and 4 h. Due to the varying GR, Ptheo also varies with time. Comparing PJ and the corresponding Ptheo shows that the steady-state assumption is only valid for sub-5 nm particles in the simulated NPF, and the size range for this validity is even narrower at the beginning of NPF (e.g., t=2 h).
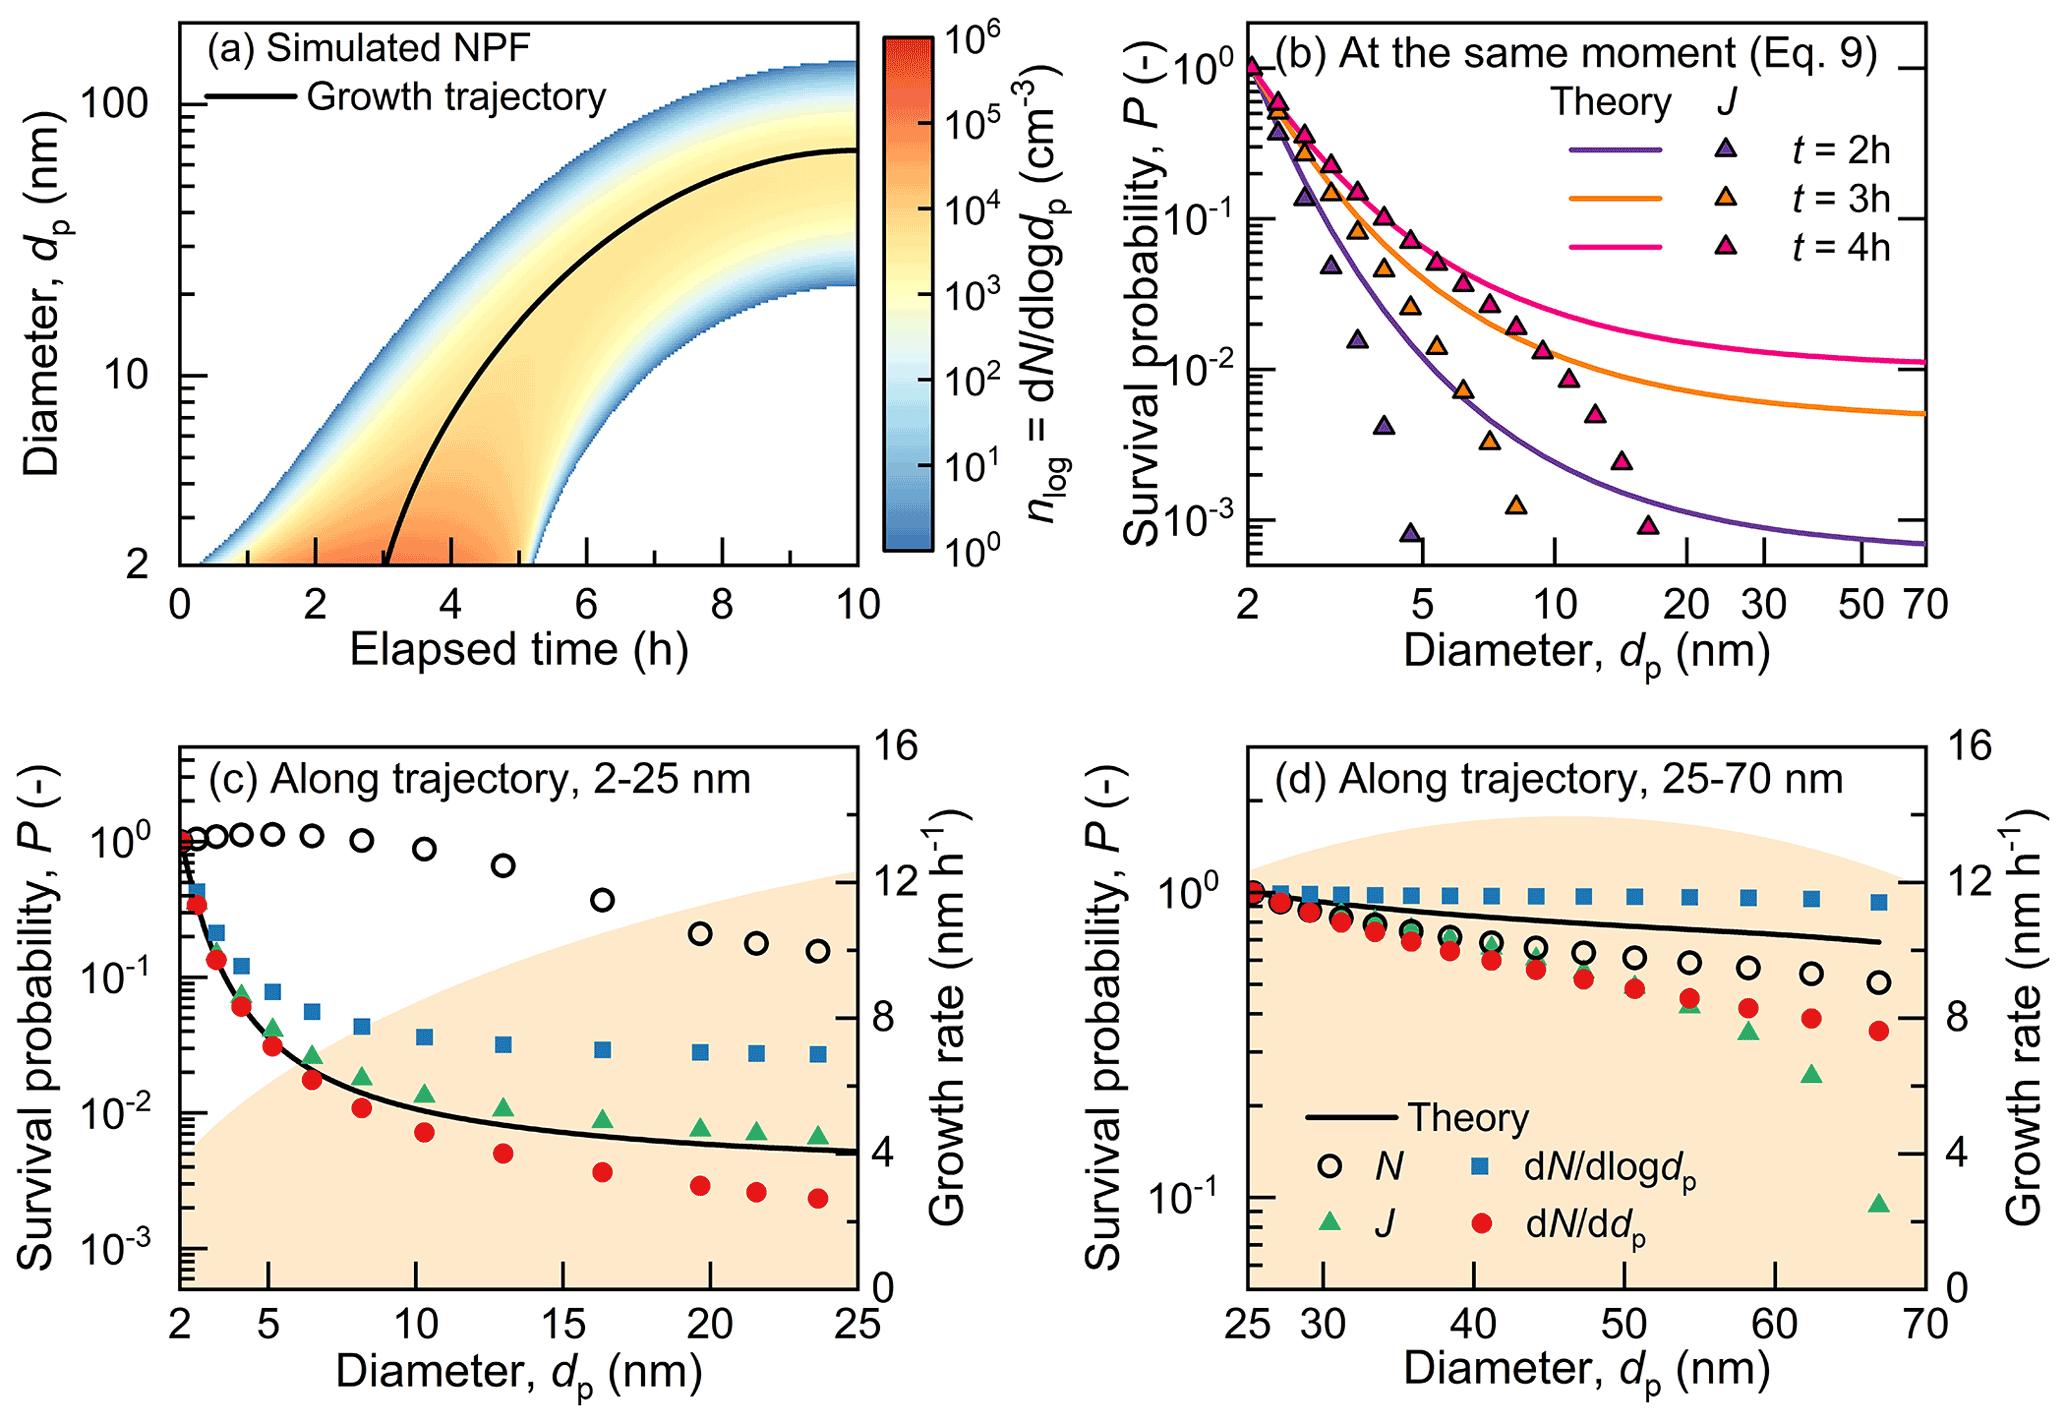
Figure 4Survival probabilities of new particles in an NPF event with varying formation and growth rates. (a) Simulated evolution of size distribution of new particles. (b) The survival probabilities of new particles retrieved using Eq. (10) for steady-state size distributions at 2, 3, and 4 h elapsed time (t). Theoretical survival probabilities evaluated at the corresponding time are also shown. (c) The survival probability of 2–25 nm particles following the growth trajectory. N is the total number of particles. (d) The survival probability of 25–70 nm particles following the growth trajectory. The growth rate is time- and size-dependent for this simulation. Panels (c) and (d) show the growth rate along the growth trajectory.
We find that after considering the evolution of particle size distribution along the growth trajectory, PJ and Pn can provide good estimates of particle survival probability for the quasi-steady-state size distributions in Fig. 4a. Different from the results in Fig. 4b, we compute the PJ and Pn along the growth trajectory (using Eqs. 4 and 5, respectively) to account for the variation in J and n. As shown in Fig. 4c, the PJ and Pn along the growth trajectory are consistent with Ptheo for sub-25 nm particles. When the quasi-steady state is no longer valid as particles on the trajectory grow above 25 nm, the growth of particles is similar to the case in Fig. 2a, and hence follows Ptheo better than PJ and Pn in Fig. 4d.
The above analysis based on the simulated NPF is applicable to atmospheric NPF events measured in urban Beijing. As the example shown in Fig. 5a, intensive NPF was measured between 09:00 and 15:00 LT (UTC+8) on an NPF day, forming a high concentration of new particles that grew subsequently to ∼70 nm within the same day. A growth trajectory of new particles was obtained by tracking the fitted mode diameter of new particles. Ptheo was predicted using the measured CoagS and GR, with the GR for sub-5 nm particles corrected with the appearance time method (see “Methods” section). With the high formation rate and high CoagS, it could be approximated that the size distribution of sub-10 nm particles was at a quasi-steady state. Accordingly, the PJ and Pn retrieved along the growth trajectory are consistent with Ptheo in the sub-10 nm size range (Fig. 5d). For the growth of particles from 25 nm to larger sizes, Ptheo is more consistent with than Pn since the measured growing size distribution was mainly contributed by the same population of new particles formed before 18:00 LT (UTC+8).
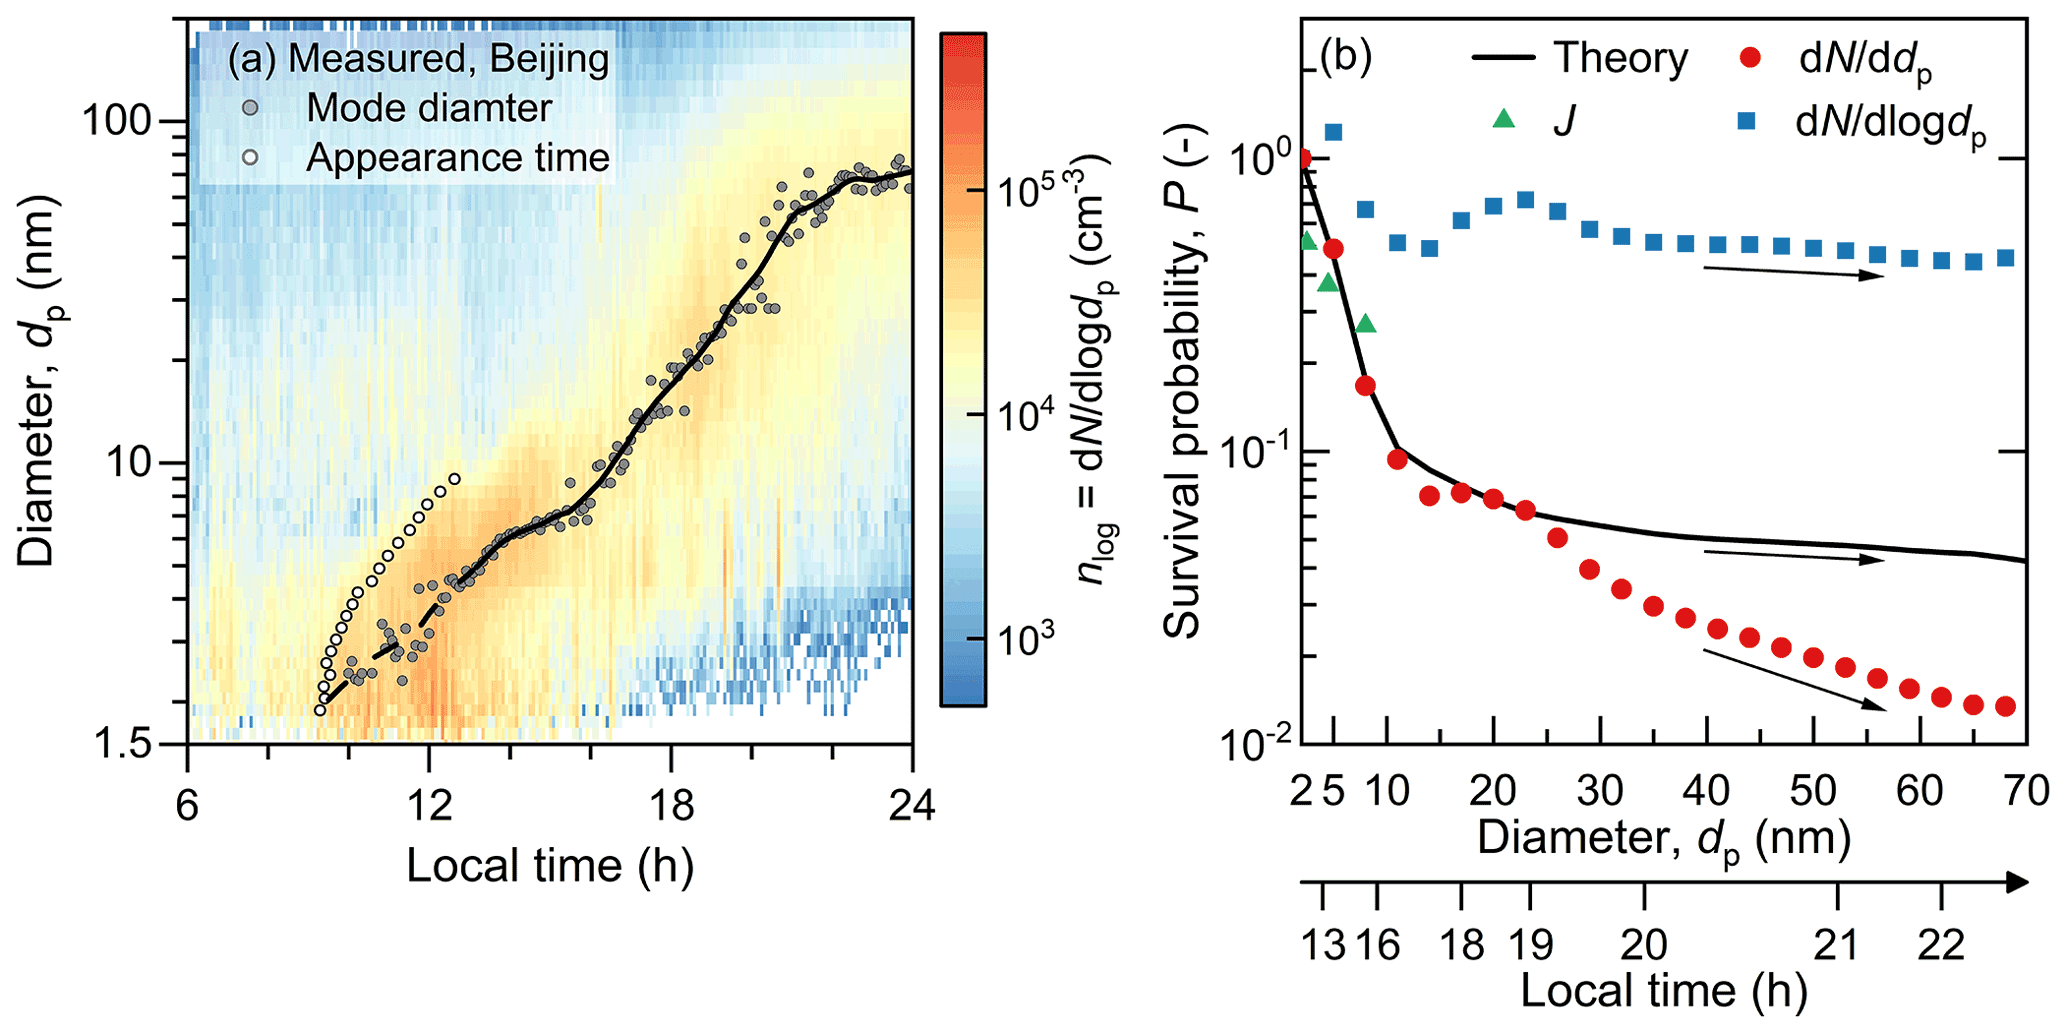
Figure 5Survival probabilities of new particles in a measured new-particle-formation event in urban Beijing. (a) Measured size distribution of new particles. The growth rate is determined using the mode-fitting method (Kulmala et al., 2012). For sub-5 nm particles, the mode-fitting method is likely to underestimate the growth rate (see “Methods” section), as indicated by its different slope from the trajectory retrieved using the appearance time method (Lehtipalo et al., 2014). (b) The measured and theoretical survival probabilities of new particles along the trajectory. The theoretical survival probability of sub-5 nm particles has been corrected using the growth rate reported by the appearance time method. The arrows indicate the trend of the survival probability of 25–70 nm particles. A non-linear axis shows the local time corresponding to the growing particle size, indicating potential atmospheric variations during the growth of new particles.
To summarize, the survival probability of particles in a growing population can be retrieved using the measured nlog (Eq. 6), and the evolution of σg can be accounted for using Eq. (7). For quasi-steady-state size distributions with the continuous formation of new particles, the survival probability can be retrieved using J and n. Some atmospheric NPF events may be composed of quasi-steady-state size distributions with continuous particle formation and subsequent growth of the new particle population; hence the survival probability can be estimated using a combination of Pn or PJ for small particles and for large particles.
4.2 Consistency between measured and theoretical survival probabilities based on long-term measurements in Beijing
With the formulae to retrieve particle survival probability as presented above, we investigate particle survival based on long-term measurements in urban Beijing. The measured survival probabilities of particles growing from 1.4 to 25 nm and from 25 to 100 nm were approximated by Pn and , respectively. PJ of sub-10 nm particles was also computed. We combine different formulae because, for most NPF events in urban Beijing, the size distribution of freshly nucleated particles is at a quasi-steady state, whereas the formation rate of freshly nucleated particles is negligible when the growing particles are larger than 25 nm.
With case-by-case and time- and size-resolved analysis, we find that the measured survival probability is on average consistent with the theoretical prediction. Figure 6 shows the reconstructed median survival probabilities, for which the measured values characterized by Pn and are consistent with Ptheo for the whole size range from 1.4 to 100 nm. This consistency is also supported by the measured PJ of sub-10 nm particles, which is comparable to Ptheo.
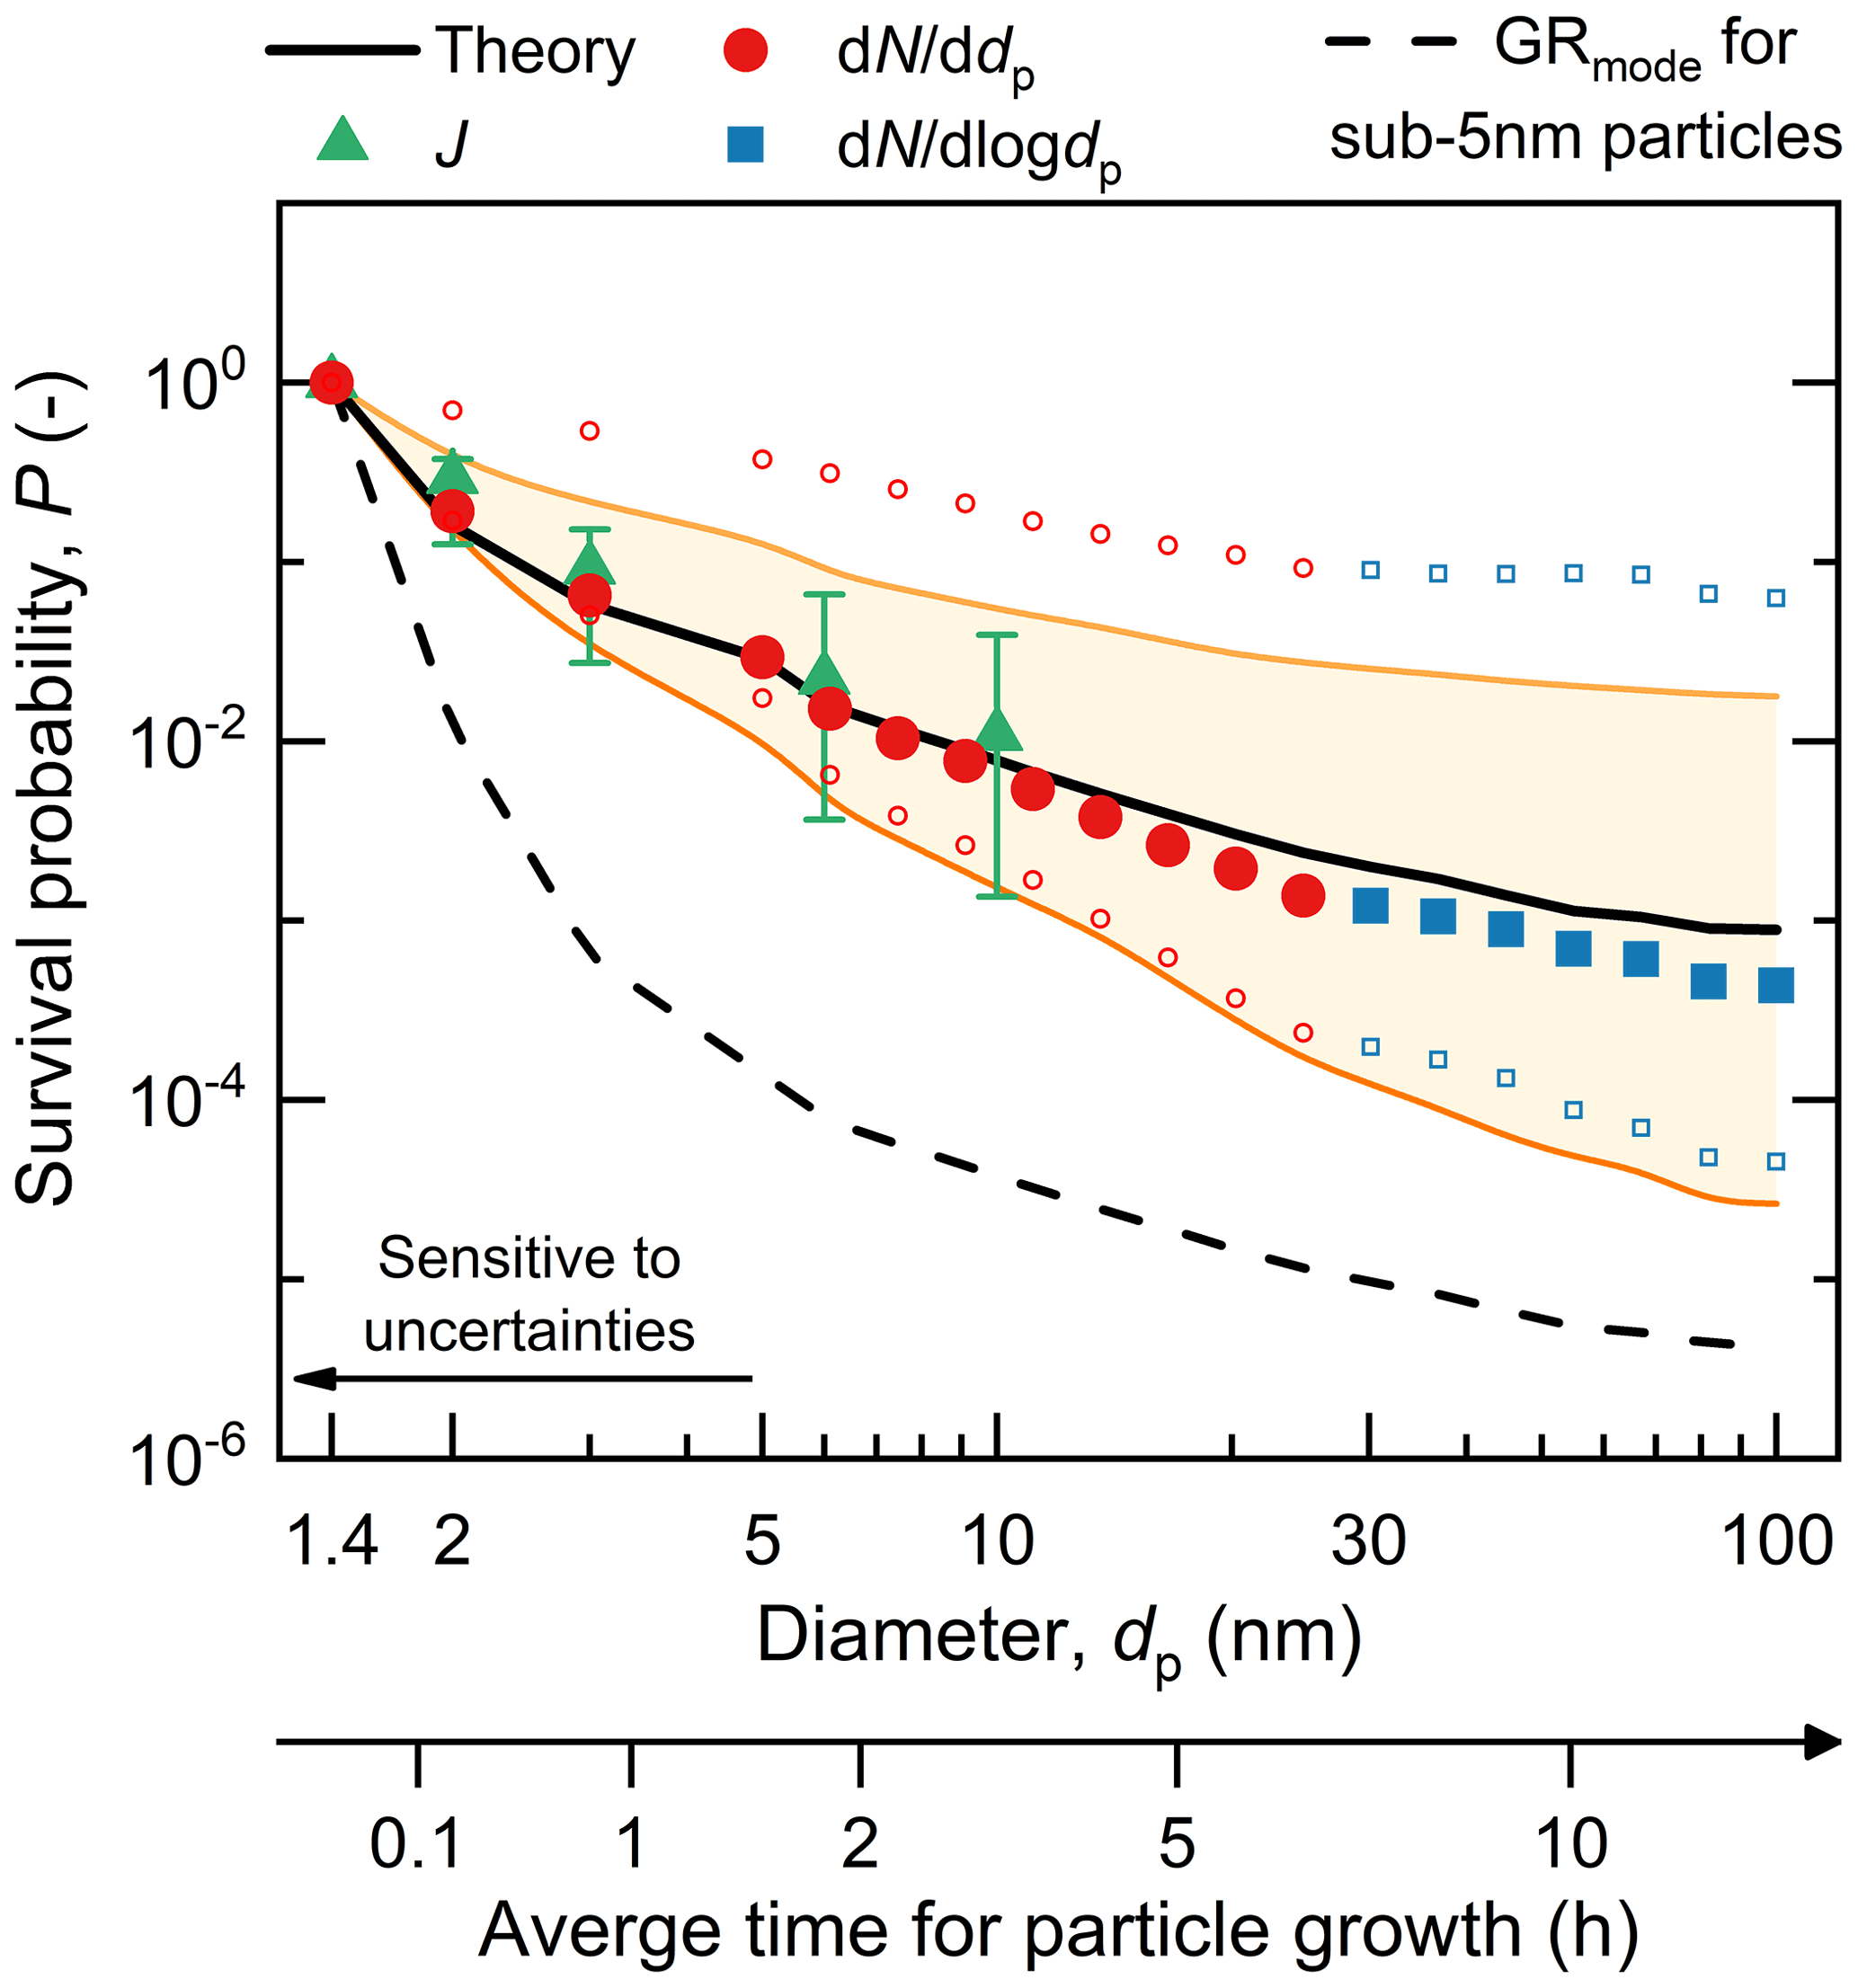
Figure 6Measured and theoretical survival probabilities of new particles in urban Beijing. The markers and lines show the median survival probability obtained from 65 NPF events. The variation bars, open markers, and the shaded area indicate the 25 %–75 % variation range of the survival probabilities computed using J, dd dp or dd logdp, and theory, respectively. The difference between the solid and dashed lines for theoretical survival probabilities is caused by the difference between the sub-5 nm particle growth rate retrieved using the appearance time method and the mode-fitting method. A non-linear horizontal axis shows the local time corresponding to the growing particle size, indicating atmospheric variations during the measured new particle formation and growth.
How new particles could survive against the high CoagS in polluted megacities (e.g., Kulmala et al., 2017) has been a puzzle, as the CoagS therein was thought to be so high that it would scavenge nearly all the freshly nucleated particles. In order to explain the observed frequent NPF events, the CoagS has been hypothesized to be ineffective such that the sticking probability between a new particle and a large particle (i.e., scavenger) would be significantly below unity (Kulmala et al., 2017). Alternatively, it has been hypothesized that the GR of freshly nucleated particles could be extremely high (>100 nm h−1) such that these particles could grow rapidly through the smallest sizes and become less vulnerable to coagulation scavenging (Wang et al., 2020). However, here we address this puzzle by showing the good consistency between the theoretical and measured median survival probabilities of new particles from the cluster size (∼1.4 nm) to the cloud condensation nucleus size (∼100 nm). Note that PJ is used for sub-10 nm particles, which is consistent with the method in previous studies. This closure evidences that assuming an effective CoagS, the survival of new particles in urban Beijing can on average be explained by theory with a GR similar to that in clean environments (<10 nm h−1). This consistency is also consistent with our previous finding that NPF in urban Beijing tends to occur on days with low CoagS (Cai et al., 2017b), as particle survival probability on these days is expected to be orders of magnitude higher than the probability on haze days. For instance, Kulmala et al. (2022) have shown that the survival probability decreases sharply as the CoagS increases above 0.01 s−1. However, NPF events can occasionally be observed under high CoagS, and there are deviations between the PJ and Ptheo of sub-3 nm particles during these events (Tuovinen et al., 2022).
4.3 Uncertainties in particle survival probabilities
Despite the consistency in terms of median values, large deviations are sometimes observed between the measured and theoretical survival probabilities (Fig. 6). These deviations are most significant for sub-5 nm particles. We herein report the reasons associated with the sensitivity of survival probability to uncertainties, although there might be other causes for these deviations that have been discussed in the literature (Kulmala et al., 2017; Wang et al., 2020). Equation (3) shows that the survival probability is a non-linear function of GR and CS, indicating that a small perturbation in GR or CS will propagate into a large variation in the survival probability. For example, the GR of sub-5 nm particles retrieved using the mode-fitting method is systematically lower than the GR retrieved using the appearance time method with an average ratio of 1:3. This difference is most likely due to the underestimation of the mode-fitting GR (see “Methods” section), and hence we compute the Ptheo of sub-5 nm particles using the appearance time GR. As shown in Fig. 6, this systematic difference in GR with a factor of 3 corresponds to a difference in the median Ptheo of >2 orders of magnitude.
To further quantify the sensitivity of the survival probability to uncertainties, we plot the size-segregated survival probability as a function of CoagS and GR. The size-dependent CoagS is characterized by the condensation sink (CS) of sulfuric acid. As shown in Fig. 7, the survival probability is most sensitive to uncertainties at small particle sizes and high CS/GR values, under which conditions particles are mostly vulnerable to coagulation scavenging. The sensitivity is herein defined as −d log(CS/GR), and it can be readily computed using Eq. (3). The value of the sensitivity indicates the order of magnitude of the uncertainty in Ptheo. For instance, for a 1.4 nm particle with CS/GR =20 nm−1, the sensitivity per nanometer growth is ∼1.6, indicating that a ±10 % uncertainty in CS/GR will lead to an uncertainty factor of (equivalent to −31 % or +45 % relative uncertainty) in the Ptheo for particle growth from 1 to 2 nm. Similarly, the same ±10 % uncertainty in CS/GR will lead to an uncertainty factor of 3.0 (equivalent to −67 % or +200 % relative uncertainty) in the overall Ptheo for particle growth from 1.4 to 100 nm. For urban Beijing, NPF is usually observed with high CS/GR (Fig. 7a); hence the survival probability can be very sensitive to uncertainties, especially for freshly nucleated particles in the sub-5 nm size range under a high CS/GR value. For example, the sensitivity of Ptheo for particle growth from 1.4 to 100 nm is 12.0 for CS/GR =50 nm−1, indicating that with a typical 100 % uncertainty in the measured GR, the uncertainty in Ptheo can be as high as 12 orders of magnitude. Further discussions on the uncertainties in the CoagS and survival probability can be found in Tuovinen et al. (2020, 2022).
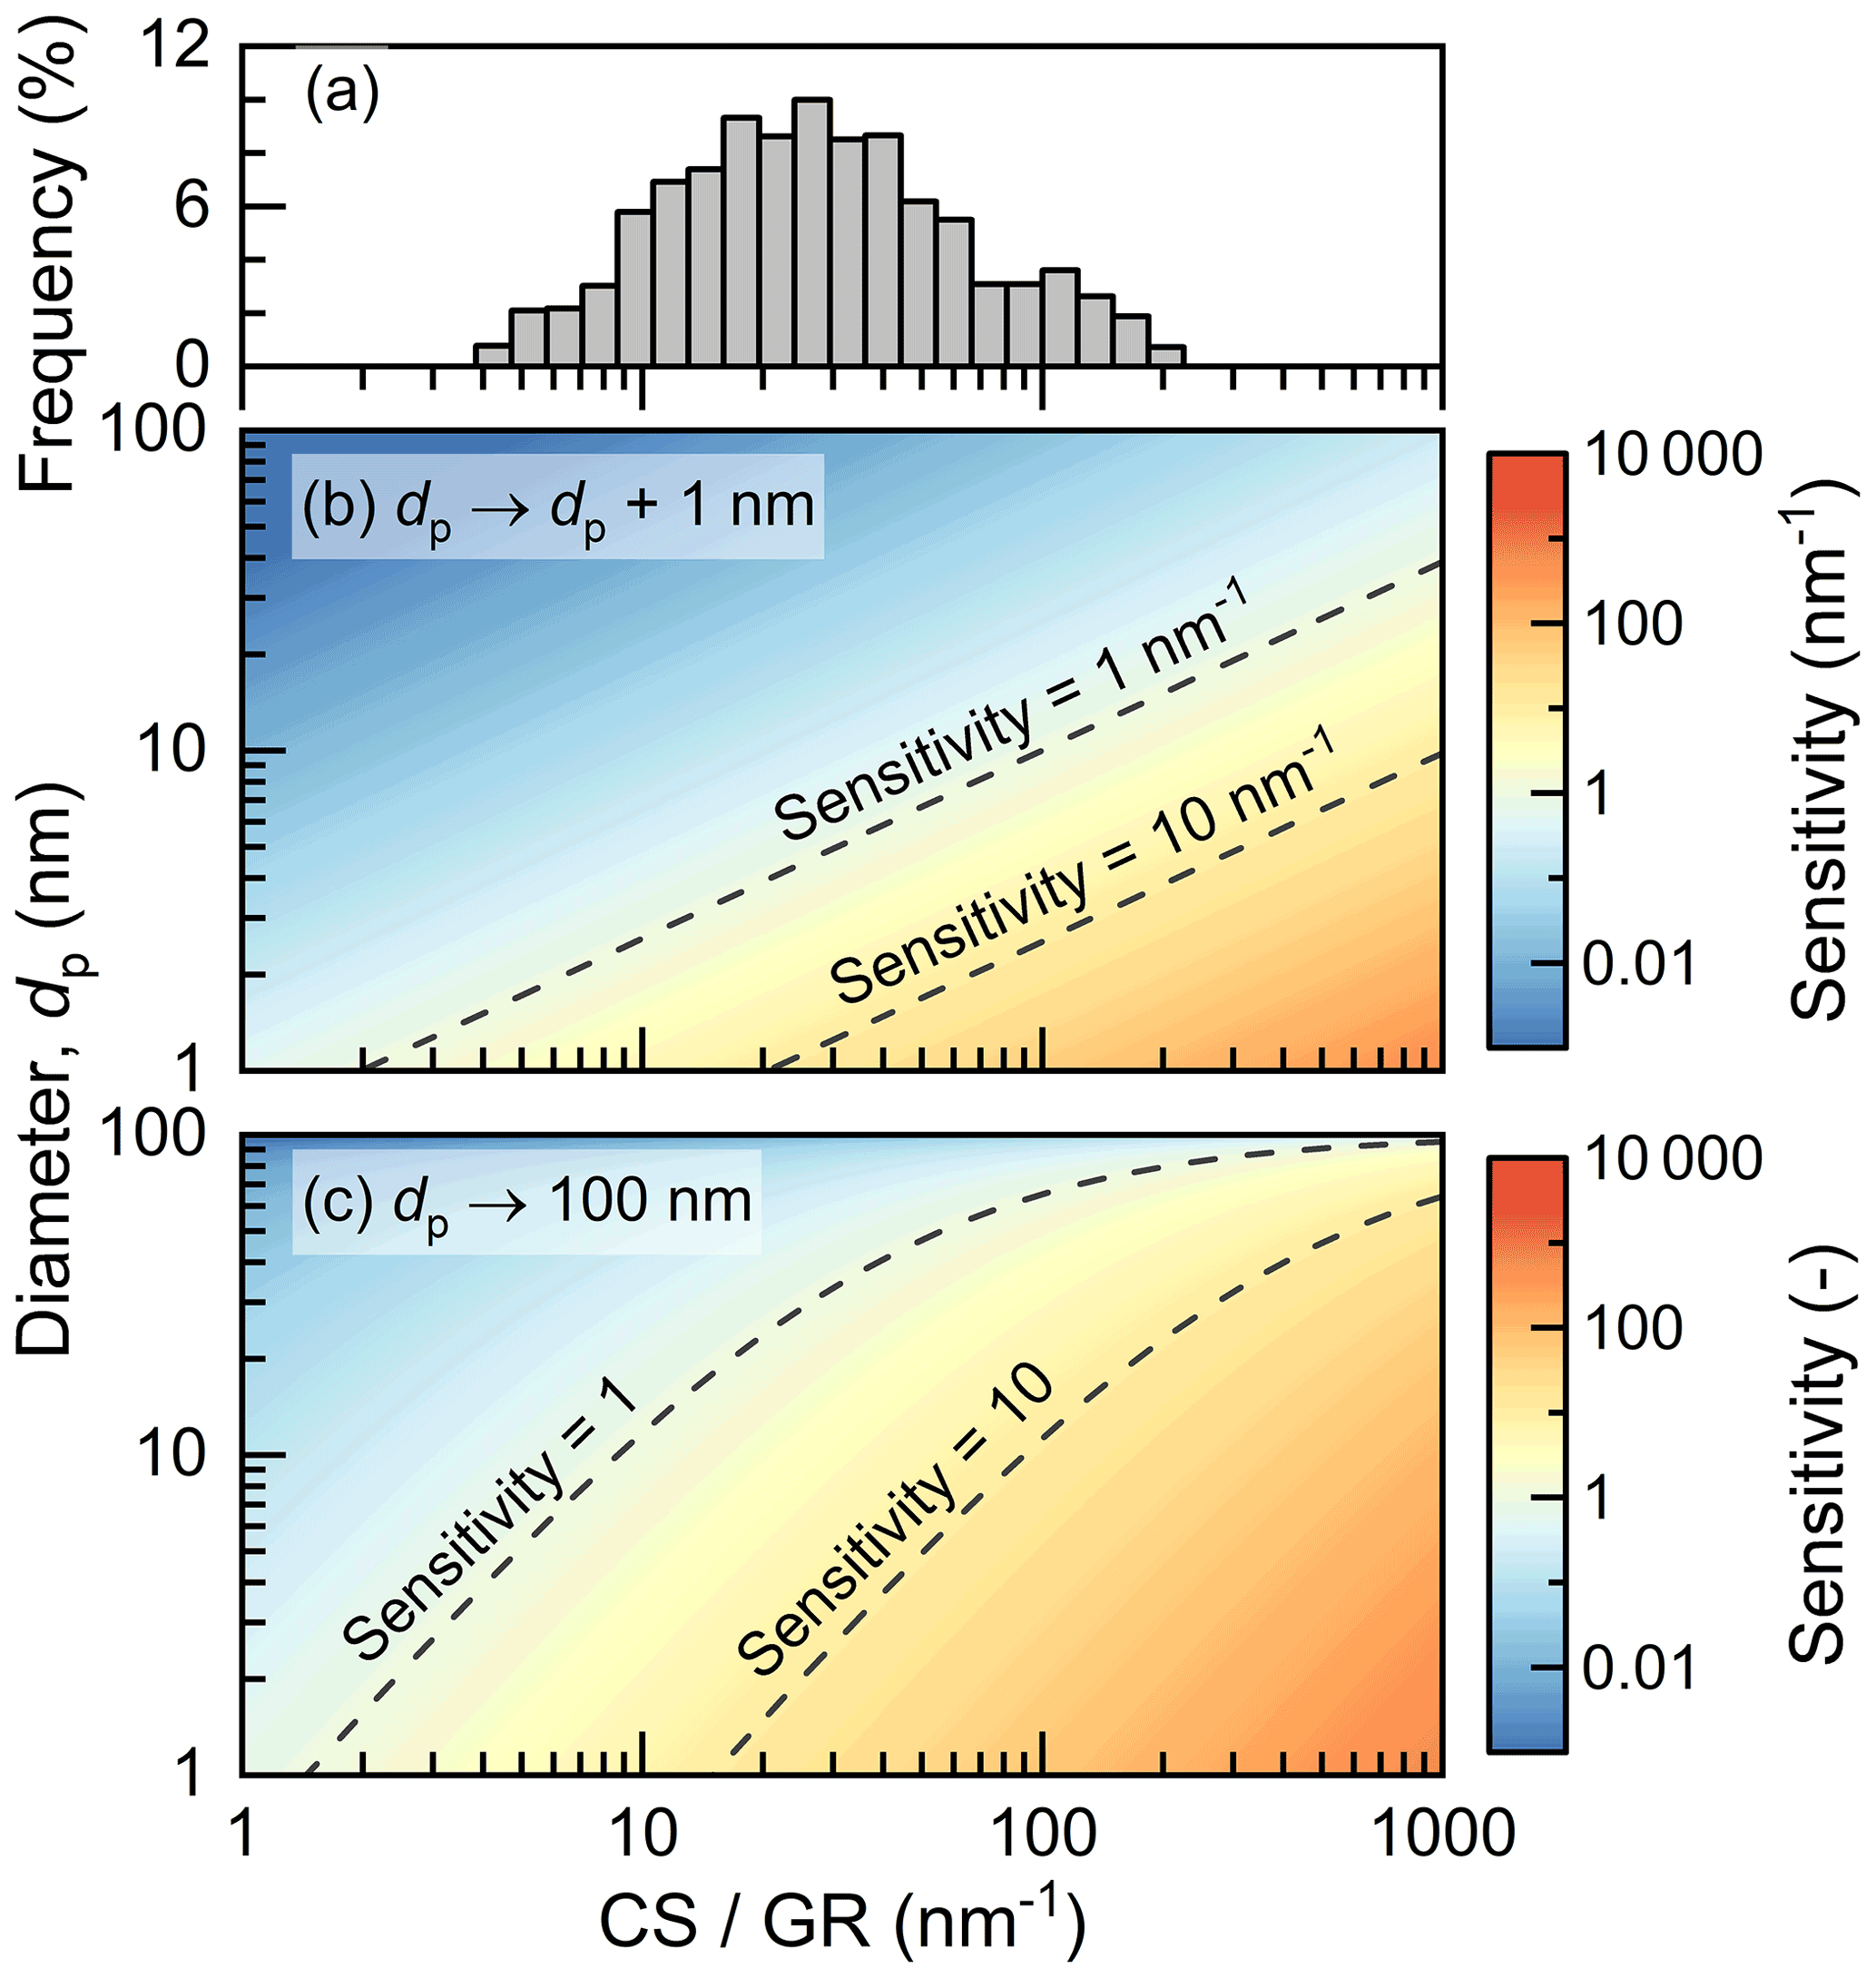
Figure 7Sensitivity of the survival probability to the particle growth rate (GR) and the coagulation sink. The size-dependent coagulation sink is characterized using the condensation sink (CS) of the sulfuric acid. The sensitivity is defined as −d logd(CS/GR), and it characterizes the relative change in survival probability per relative change in CS/GR. OM is short for order of magnitude. For instance, sensitivity =1 indicates that a 100 % relative change in CS/GR will result in a 1 order of magnitude change in the survival probability. (a) The frequency distribution of CS/GR in the measured NPF events in urban Beijing, with the frequency indicated by the height of each bar. (b) The sensitivity of the survival probability of particles growing by 1 nm. (c) The sensitivity of the survival probability of particles growing to 100 nm.
In addition to the uncertainties in Ptheo, there may be variations in the measured survival probability due to the complex inhomogeneous atmosphere. The homogeneity approximation as required by Eqs. (4)–(6) (see “Methods” section) seems to be on average valid for regional NPF events in urban Beijing, as indicated by the consistency of median measured and theoretical survival probabilities. However, the growth of new atmospheric particles from the cluster size to 100 nm takes hours (Fig. 6), during which period the measured aerosol size distribution may be significantly affected by transport. For some NPF events in urban Beijing, significant influences of transport on the measured survival probability are sometimes observed, which can be readily identified according to the abrupt changes in the measured aerosol size distributions. Besides atmospheric inhomogeneity, traffic emissions and other sources may add to the uncertainties in the measured survival probabilities.
Figure A4 shows an NPF event measured at Hyytiälä as a case study for the significant influence of NPF on the measured aerosol size distributions. The measured mode dd logdp increased with a growing particle size until ∼11:00 LT (UTC+2), showing a high dd logdp region of new particles at ∼10 nm. Consequently, and Pn for 7–12 nm particles were larger than 1.0. Particle accumulation in a certain size range due to size-dependent particle growth rate was not the main cause of the high dd logdp region, as a clear pattern of rapid particle growth can be seen from the growing mode. The wind direction was relatively stable, though there was an increase in the wind speed at ∼10:00 LT (UTC+2). According to the analysis in Lampilahti et al. (2021), the high dd logdp region and therefore the unphysical values of and Pn were likely to be caused by vertical transport of new particles. This vertical transport as an external source of particles is supported by the increasing total concentration of particles in the growing mode before 11:00 LT (UTC+2). Interestingly, PJ coincides with Ptheo, though the value J computed using 25 nm as an upper size limit did not necessarily characterize the particle formation rate. For particles larger than 12 nm, the trend of followed that of Ptheo, though there was still the influence of transport on the measured aerosol size distributions. This case study shows that for a certain NPF event, the measured survival probability may be heavily influenced by the inhomogeneity of the atmosphere. Analyses based on air homogeneity (e.g., backward trajectory), as well as statistical analyses based on long-term measurements, may help us to reduce the uncertainties in measured survival probabilities.
4.4 Implications on particle survival probability in measurements and models
The above analysis has shown that can be used to approximate the survival probability of particles in a growing population and that Pn and PJ can be used for quasi-steady-state size distributions. Compared to PJ, which is retrieved from particle formation rates, and Pn can be readily obtained from the measured aerosol size distributions. Further, the validity of PJ in atmospheric NPF is usually limited to sub-10 nm particles, as the population balance assumption for calculating the formation rate of large new particles (e.g., >25 nm) is challenged by transport and emissions. In contrast, and Pn can provide the measured survival probabilities of large particles (e.g., up to 100 nm). However, for the sub-5 nm size range, PJ seems to be less sensitive to atmospheric variations than and Pn (see Fig. 6).
The validity of , Pn, and PJ in different types of NPF events calls for attention to retrieving the survival probability from measurements and applying the survival probability in models. As we show in Fig. 2, applying Pn or PJ to a growing aerosol population would significantly underestimate the survival probability. Alternatively, improperly relating the formation rate and the survival probability might significantly underestimate the formation rates of large particles and cloud condensation nuclei. For example, Kerminen and Kulmala (2002) proposed that the formation rate of critical clusters (e.g., 1 nm) can be derived using the formation rate of the detected smallest particles (e.g., 3 nm) and the theoretical survival probability. Assuming an accurateness of the CoagS and GR for Ptheo evaluation, the derived formation rate of critical clusters is expected to be relatively accurate since the size distribution of freshly nucleated particles is usually at a quasi-steady state. The maximum systematic uncertainty in this derivation associated with the type of NPF events is no more than 3 nm1 nm =3. However, if one predicts the formation rate of cloud condensation nuclei using Ptheo and the formation rate of critical clusters, the predicted formation rate may be underestimated by 1–2 orders of magnitude as the size distributions of large particles may not be at a steady state.
The sensitivity of Ptheo to measurement uncertainties also calls for accurate assessments of GR. We have shown that with carefully computed GR as well as CoagS, the Ptheo in urban Beijing is, on average, consistent with the measured survival probability. However, if the GR was underestimated by a factor of 3, the Ptheo could be off by several orders of magnitude (e.g., in Fig. 6), largely affecting the estimated influences of NPF on the atmospheric environment. The consistency between the measured median theoretical and measured survival probability also provides a potential method to retrieve the median GR of new particles in different atmospheric environments. Practically, it may be challenging to accurately retrieve the GR from the measured aerosol size distributions or gaseous precursors, while the median GR retrieved from the measured survival probability may be used as a reference.
We reported methods to retrieve the survival probability of new atmospheric particles from different types of new-particle-formation events and investigated the consistency between the measured survival probability and theoretical predictions. One new method based on the logarithmic size-scale distribution function d logdp and two conventional methods based on the new-particle-formation rate J and the linear size-scale distribution function d logdp were tested. A sectional aerosol kinetic model was used to generate simulated aerosol size distributions for testing these methods. The theoretical survival probability against coagulation scavenging predicted using the size-dependent coagulation sink and growth rate was first validated using the definition of the survival probability, and it was then used as a benchmark.
Based on the simulation results and theoretical analysis, we found that nlog can be used to retrieve the measured survival probability from a growing aerosol population with a relatively constant geometric standard deviation. The influences of a size-dependent geometric standard deviation can be readily accounted for using Eq. (7). J or n can be used for quasi-steady-state size distributions that are significantly affected by the continuous formation of new particles. Misapplying J or n to a growing aerosol population will underestimate the survival probability. The above findings were supported by measured new-particle-formation events in urban Beijing, the Finnish boreal forest, and the CLOUD chamber. The size distribution of sub-10 nm particles during NPF in urban Beijing was usually at a quasi-steady state; hence the survival probability could be retrieved using n and J. The validity of n and J for survival probability computation was also found to be valid for the steady-state size distribution measured in a CLOUD chamber experiment. For a test NPF event in the Finnish boreal forest and the growth of particles larger than 25 nm for 65 NPF events in urban Beijing, the survival probability could be retrieved using nlog. Compared to the method based on J, the methods based on n and nlog have advantages in their convenience in terms of computation, less sensitivity to uncertainties, and the applicability to particles up to the cloud condensation nucleus size (e.g., 100 nm).
We finally compared the measured survival probability in urban Beijing retrieved properly using the above methods and the theoretical survival probability against coagulation scavenging. For 65 NPF events obtained from long-term measurements, the measured and theoretical survival probabilities are on average consistent with each other in the 1.4–100 nm size range, though both are sensitive to measurement uncertainties and atmospheric variations.
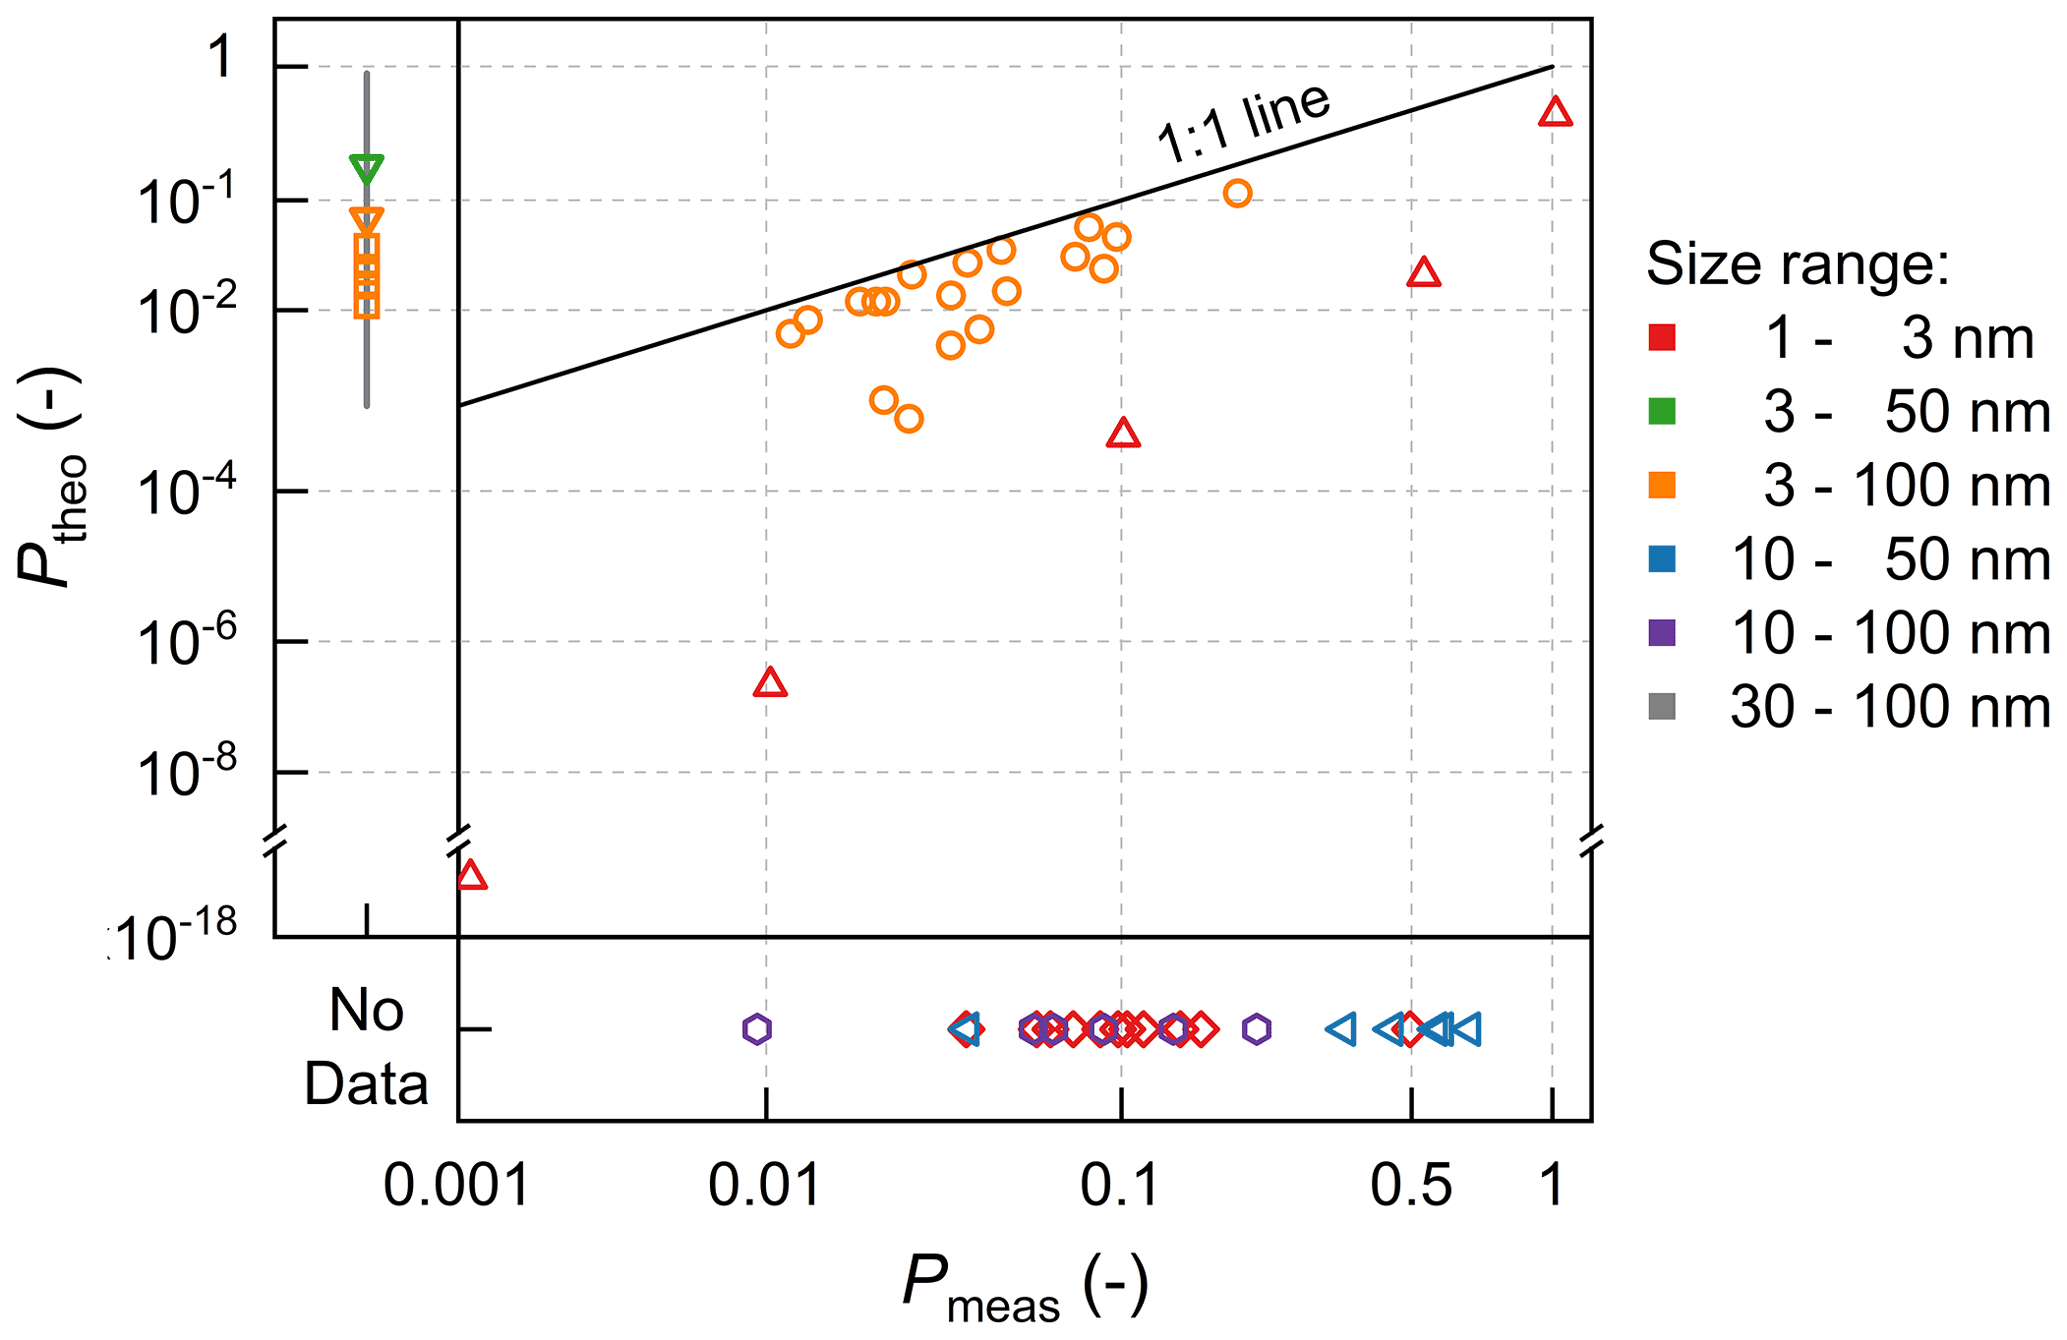
Figure A1Particle survival probability in diverse environments. Data in this figure are collected from Weber et al. (1997), Pierce and Adams (2007), Kuang et al. (2009), Westervelt et al. (2013), Pierce et al. (2014), Kulmala et al. (2017), Zhu et al. (2021), and Sebastian et al. (2021). Data from different studies are shown in markers with different shapes. Note that the axes are not on linear scales.
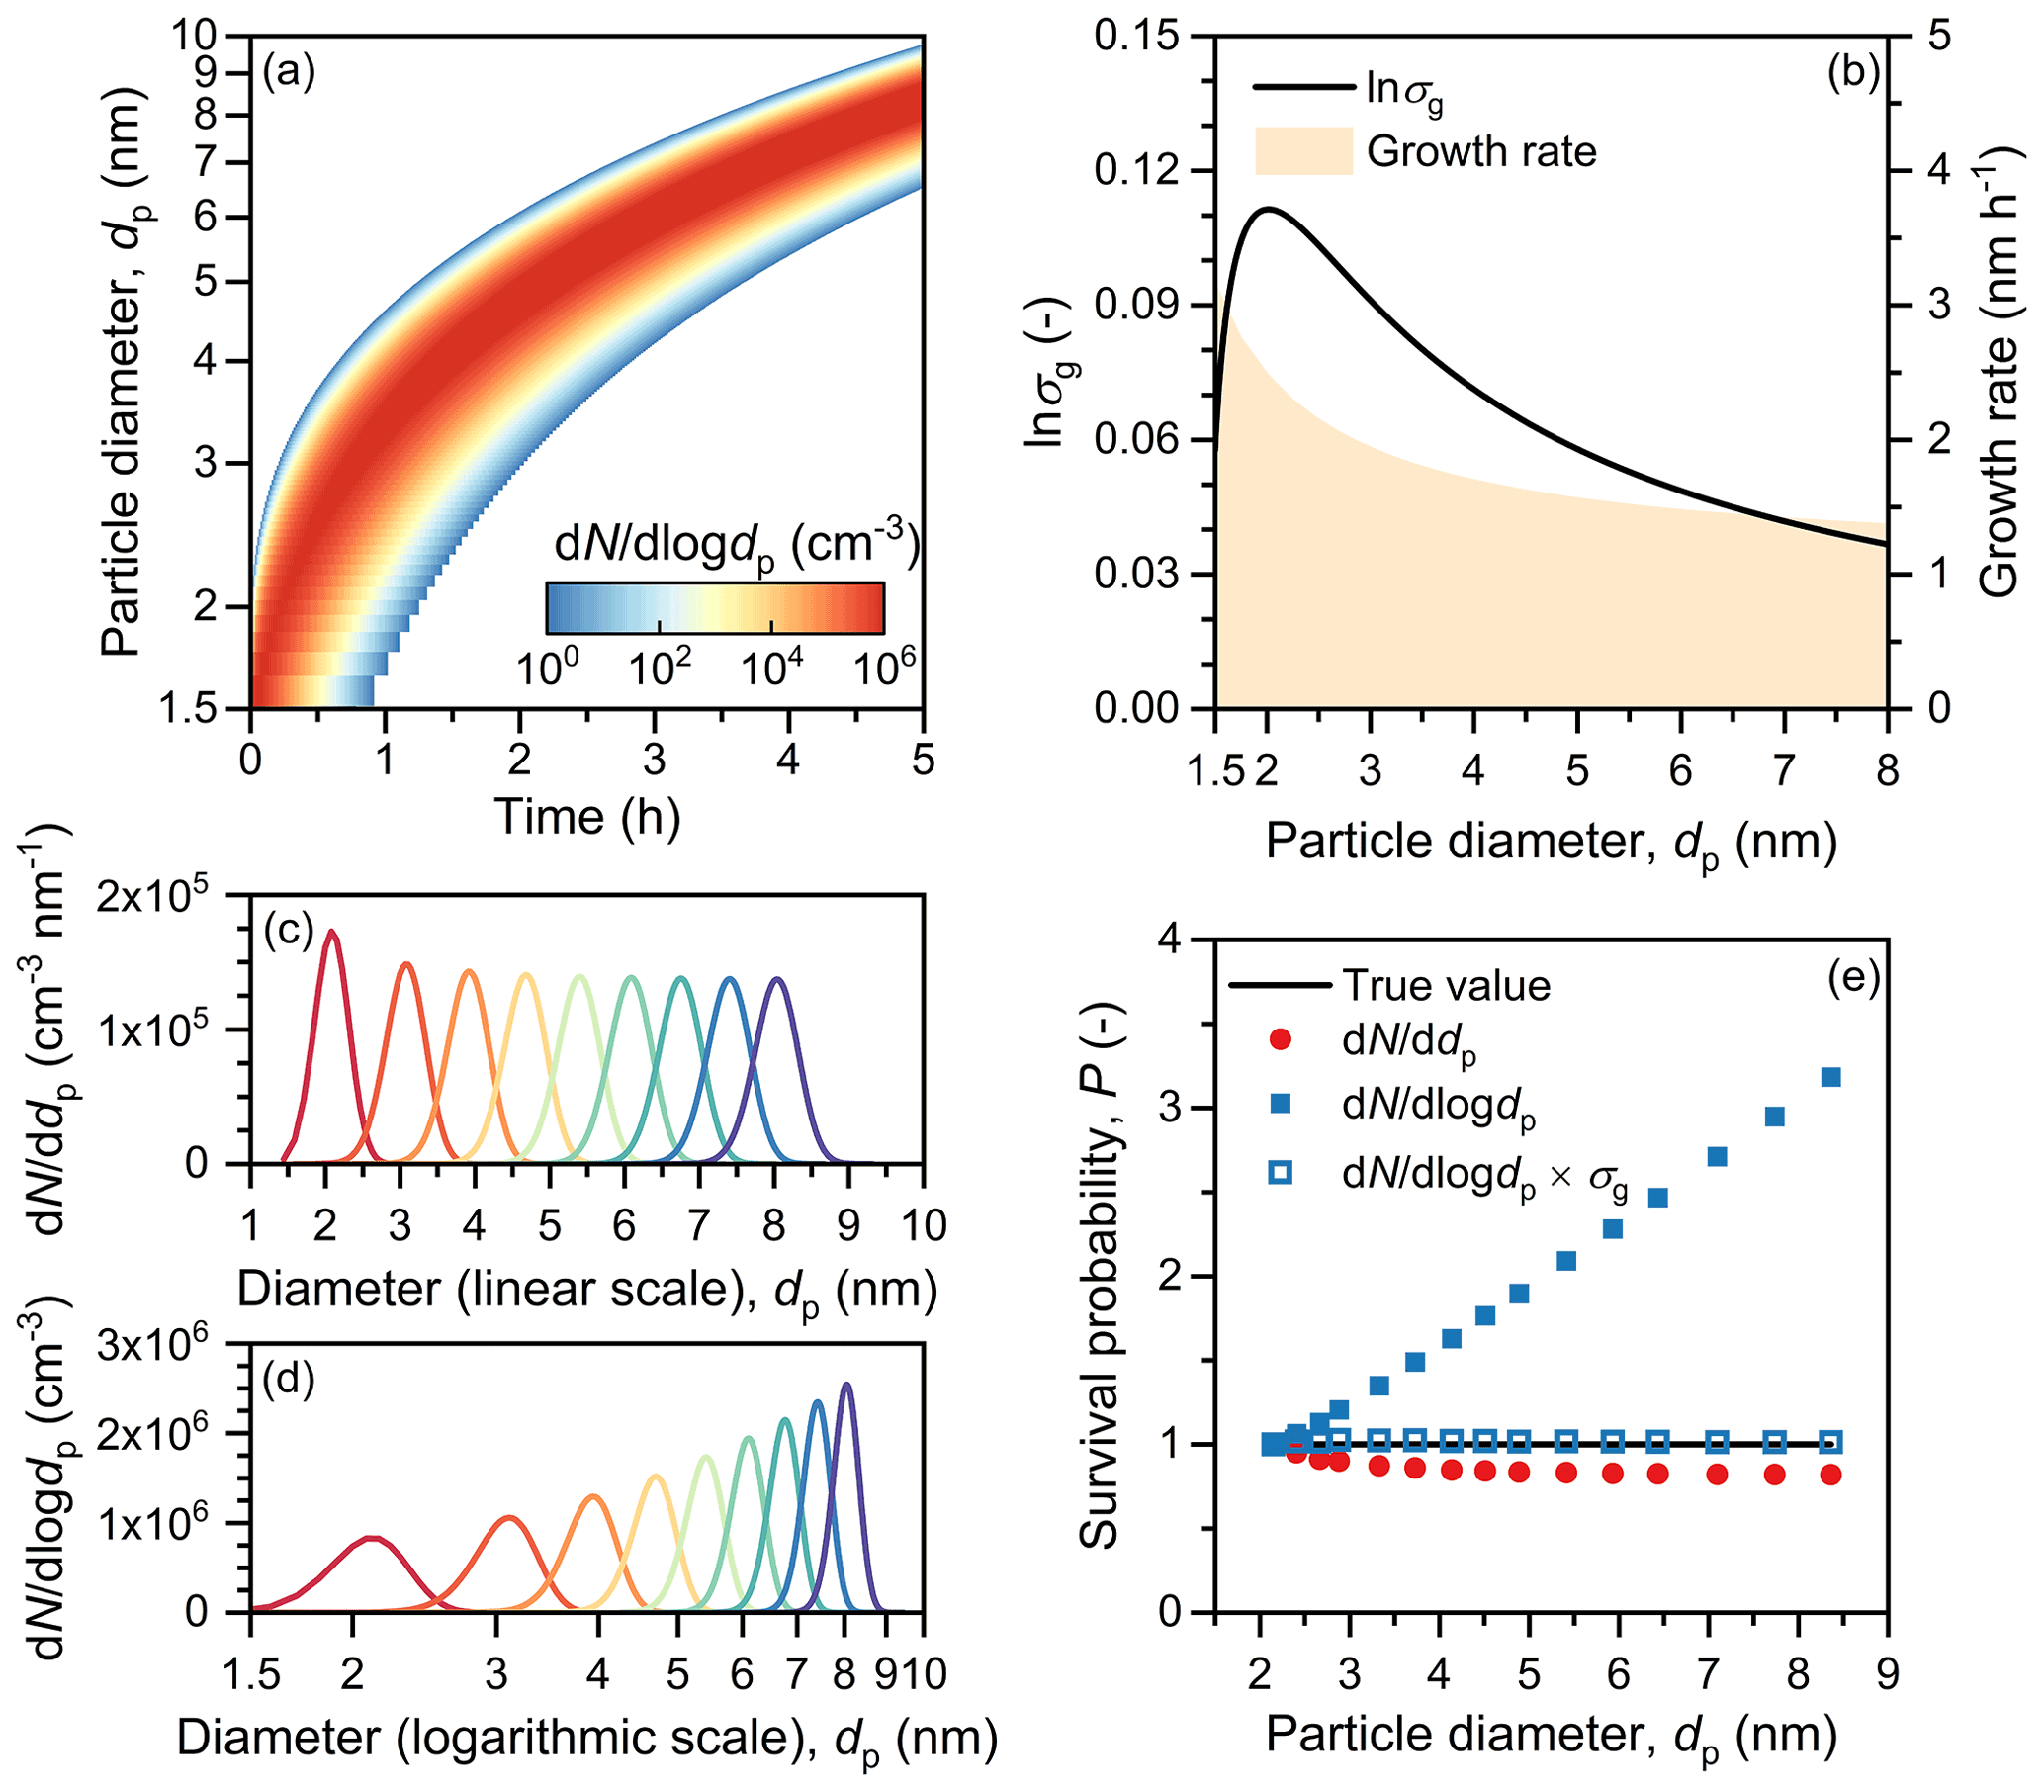
Figure A2The growth of particles driven by the condensation of a non-volatile vapor. (a) Evolution of particle size distribution. (b) Geometric standard deviation (σg) and the growth rate of new particles. (c) Particle size distribution on the linear scale. (d) Particle size distribution in the logarithmic scale. (e) Survival probability of new particles computed using Eqs. (5)–(7). The results are simulated using a discrete model to avoid the influence of numerical diffusion. Particles are assumed to be strictly monodisperse (σg=1.0). The coagulation between particles is not accounted for in this simulation. This figure shows that for particle growth driven only by the condensation of non-volatile vapors, dd dp tends to stay at a relatively constant level, and σg tends to decrease as particles grow. For such a case, the dd logdp method in Eq. (6) significantly overestimates the survival probability, and the dd logdp method with σg correction in Eq. (7) should be used instead.

Figure A3The growth of particles driven by the condensation of a volatile vapor and particle coagulation. The simulation inputs are the same as those in Fig. A2 except that the vapor dissociation rate is assumed to be 50 % of the association rate, and particle coagulation is accounted for in this simulation. This figure shows that evaporation and coagulation can lead to a broadening in dd dp on the linear scale. Although σg is relatively constant for this simulation, it can have a strong size dependency for other simulation conditions. Hence, it is important to check σg before using Eq. (6) to compute the survival probability.

Figure A4A case study of the influence of atmospheric inhomogeneity on the measured survival probability of new particles. (a) Measured size distribution of new particles. The representative diameter of the growing mode is obtained using the mode-fitting method. (b) Wind direction and speed measured at 16.8 m height. (c) The measured and theoretical survival probability along the mode diameters; dp1 is the initial size for survival probability computation as defined in Eq. (1).
Data are available via the link https://doi.org/10.5281/zenodo.6704909 (Cai, 2022). The code for simulating NPF is available in Li and Cai (2020).
RC designed the research; CD and JJ collected the Beijing data; DS, JK, and MK collected the Hyytiälä data; DS collected the CLOUD data; RC and CL prepared the model and performed the simulations; RC, JK, JG, VMK, and MK analyzed the data; RC wrote the paper with input from all co-authors.
The contact author has declared that none of the authors has any competing interests.
Publisher's note: Copernicus Publications remains neutral with regard to jurisdictional claims in published maps and institutional affiliations.
Technical and scientific staff in BUCT/AHL are acknowledged.
This research has been supported by the Academy of Finland (grant nos. 337549, 302958, 1325656, 311932, 316114, 332547, 325647, and 346370), the National Natural Science Foundation of China (grant nos. 22188102 and 92044301), the H2020 European Research Council (grant nos. 772206, 895875, and 764991), the Jane and Aatos Erkko Foundation (“Quantifying carbon sink, CarbonSink+ and their interaction with air quality”), Samsung PM2.5 SRP, and the Hungarian Research, Development and Innovation Office (grant no. K132254).
Open-access funding was provided by the HelsinkiUniversity Library.
This paper was edited by Markus Petters and reviewed by Vijay Kanawade and one anonymous referee.
Aalto, P., Hämeri, K., Becker, E., Weber, R., Salm, J., Mäkelä, J. M., Hoell, C., O'dowd, C. D., Hansson, H.-C., Väkevä, M., Koponen, I. K., Buzorius, G., and Kulmala, M.: Physical characterization of aerosol particles during nucleation events, Tellus B, 53, 344–358, https://doi.org/10.3402/tellusb.v53i4.17127, 2001.
Cai, R.: Data for the manuscript entitled Survival probability of atmospheric new particles: closure between theory and measurements from 1.4 to 100 nm, Zenodo [data set], https://doi.org/10.5281/zenodo.6704909, 2022.
Cai, R., Chen, D.-R., Hao, J., and Jiang, J.: A miniature cylindrical differential mobility analyzer for sub-3 nm particle sizing, J. Aerosol Sci., 106, 111–119, https://doi.org/10.1016/j.jaerosci.2017.01.004, 2017a.
Cai, R., Yang, D., Fu, Y., Wang, X., Li, X., Ma, Y., Hao, J., Zheng, J., and Jiang, J.: Aerosol surface area concentration: a governing factor in new particle formation in Beijing, Atmos. Chem. Phys., 17, 12327–12340, https://doi.org/10.5194/acp-17-12327-2017, 2017b.
Cai, R., Li, C., He, X.-C., Deng, C., Lu, Y., Yin, R., Yan, C., Wang, L., Jiang, J., Kulmala, M., and Kangasluoma, J.: Impacts of coagulation on the appearance time method for new particle growth rate evaluation and their corrections, Atmos. Chem. Phys., 21, 2287–2304, https://doi.org/10.5194/acp-21-2287-2021, 2021.
Cai, R., Häkkinen, E., Yan, C., Jiang, J., Kulmala, M., and Kangasluoma, J.: The effectiveness of the coagulation sink of 3–10 nm atmospheric particles, Atmos. Chem. Phys., 22, 11529–11541, https://doi.org/10.5194/acp-22-11529-2022, 2022.
Deng, C., Fu, Y., Dada, L., Yan, C., Cai, R., Yang, D., Zhou, Y., Yin, R., Lu, Y., Li, X., Qiao, X., Fan, X., Nie, W., Kontkanen, J., Kangasluoma, J., Chu, B., Ding, A., Kerminen, V., Paasonen, P., Worsnop, R. D., Bianchi, F., Liu, Y., Zheng, J., Wang, L., Kulmala, M., and Jiang, J.: Seasonal characteristics of new particle formation and growth in urban Beijing, Environ. Sci. Tech., 54, 8547–8557, https://doi.org/10.1021/acs.est.0c00808, 2020.
Deng, C., Cai, R., Yan, C., Zheng, J., and Jiang, J.: Formation and growth of sub-3 nm particles in megacities: impacts of background aerosols, Faraday Discuss., 226, 348–363, https://doi.org/10.1039/d0fd00083c, 2021.
Duplissy, J., Merikanto, J., Franchin, A., Tsagkogeorgas, G., Kangasluoma, J., Wimmer, D., Vuollekoski, H., Schobesberger, S., Lehtinen, K. E., Flagan, R. C., Brus, D., Donahue, N. M., Vehkamäki, H., Almeida, J., Amorim, A., Barmet, P., Bianchi, F., Breitenlechner, M., Dunne, E. M., Guida, R., Henschel, H., Junninen, H., Kirkby, J., Kürten, A., Kupc, A., Määttänen, A., Makhmutov, V., Mathot, S., Nieminen, T., Onnela, A., Praplan, A. P., Riccobono, F., Rondo, L., Steiner, G., Tome, A., Walther, H., Baltensperger, U., Carslaw, K. S., Dommen, J., Hansel, A., Petäjä, T., Sipilä, M., Stratmann, F., Vrtala, A., Wagner, P. E., Worsnop, D. R., Curtius, J., and Kulmala, M.: Effect of ions on sulfuric acid-water binary particle formation: 2. Experimental data and comparison with QC-normalized classical nucleation theory, J. Geophys. Res.-Atmos., 121, 1752–1775, https://doi.org/10.1002/2015JD023539, 2016.
Fu, Y., Xue, M., Cai, R., Kangasluoma, J., and Jiang, J.: Theoretical and experimental analysis of the core sampling method: Reducing diffusional losses in aerosol sampling line, Aerosol Sci. Tech., 53, 793–801, https://doi.org/10.1080/02786826.2019.1608354, 2019.
Gordon, H., Kirkby, J., Baltensperger, U., Bianchi, F., Breitenlechner, M., Curtius, J., Dias, A., Dommen, J., Donahue, N. M., Dunne, E. M., Duplissy, J., Ehrhart, S., Flagan, R. C., Frege, C., Fuchs, C., Hansel, A., Hoyle, C. R., Kulmala, M., Kürten, A., Lehtipalo, K., Makhmutov, V., Molteni, U., Rissanen, M. P., Stozkhov, Y., Tröstl, J., Tsagkogeorgas, G., Wagner, R., Williamson, C., Wimmer, D., Winkler, P. M., Yan, C., and Carslaw, K. S.: Causes and importance of new particle formation in the present-day and preindustrial atmospheres, J. Geophys. Res.-Atmos., 122, 8739–8760, https://doi.org/10.1002/2017jd026844, 2017.
Hari, P. and Kulmala, M.: Station for Measuring Ecosystem–Atmosphere Relations (SMEAR II), Boreal Environ. Res., 10, 315–322, 2005.
Heinritzi, M., Dada, L., Simon, M., Stolzenburg, D., Wagner, A. C., Fischer, L., Ahonen, L. R., Amanatidis, S., Baalbaki, R., Baccarini, A., Bauer, P. S., Baumgartner, B., Bianchi, F., Brilke, S., Chen, D., Chiu, R., Dias, A., Dommen, J., Duplissy, J., Finkenzeller, H., Frege, C., Fuchs, C., Garmash, O., Gordon, H., Granzin, M., El Haddad, I., He, X., Helm, J., Hofbauer, V., Hoyle, C. R., Kangasluoma, J., Keber, T., Kim, C., Kürten, A., Lamkaddam, H., Laurila, T. M., Lampilahti, J., Lee, C. P., Lehtipalo, K., Leiminger, M., Mai, H., Makhmutov, V., Manninen, H. E., Marten, R., Mathot, S., Mauldin, R. L., Mentler, B., Molteni, U., Müller, T., Nie, W., Nieminen, T., Onnela, A., Partoll, E., Passananti, M., Petäjä, T., Pfeifer, J., Pospisilova, V., Quéléver, L. L. J., Rissanen, M. P., Rose, C., Schobesberger, S., Scholz, W., Scholze, K., Sipilä, M., Steiner, G., Stozhkov, Y., Tauber, C., Tham, Y. J., Vazquez-Pufleau, M., Virtanen, A., Vogel, A. L., Volkamer, R., Wagner, R., Wang, M., Weitz, L., Wimmer, D., Xiao, M., Yan, C., Ye, P., Zha, Q., Zhou, X., Amorim, A., Baltensperger, U., Hansel, A., Kulmala, M., Tomé, A., Winkler, P. M., Worsnop, D. R., Donahue, N. M., Kirkby, J., and Curtius, J.: Molecular understanding of the suppression of new-particle formation by isoprene, Atmos. Chem. Phys., 20, 11809–11821, https://doi.org/10.5194/acp-20-11809-2020, 2020.
Hussein, T., Puustinen, A., Aalto, P. P., Mäkelä, J. M., Hämeri, K., and Kulmala, M.: Urban aerosol number size distributions, Atmos. Chem. Phys., 4, 391–411, https://doi.org/10.5194/acp-4-391-2004, 2004.
Jiang, J., Chen, M., Kuang, C., Attoui, M., and McMurry, P. H.: Electrical Mobility Spectrometer Using a Diethylene Glycol Condensation Particle Counter for Measurement of Aerosol Size Distributions Down to 1 nm, Aerosol Sci. Tech., 45, 510–521, https://doi.org/10.1080/02786826.2010.547538, 2011.
Kerminen, V. M., and Kulmala, M.: Analytical formulae connecting the “real” and the “apparent” nucleation rate and the nuclei number concentration for atmospheric nucleation events, J. Aerosol Sci., 33, 609–622, 2002.
Kerminen, V.-M., Chen, X., Vakkari, V., Petäjä, T., Kulmala, M., and Bianchi, F.: Atmospheric new particle formation and growth: review of field observations, Environ. Res. Lett., 13, 103003, https://doi.org/10.1088/1748-9326/aadf3c, 2018.
Kirkby, J., Curtius, J., Almeida, J., Dunne, E., Duplissy, J., Ehrhart, S., Franchin, A., Gagne, S., Ickes, L., Kurten, A., Kupc, A., Metzger, A., Riccobono, F., Rondo, L., Schobesberger, S., Tsagkogeorgas, G., Wimmer, D., Amorim, A., Bianchi, F., Breitenlechner, M., David, A., Dommen, J., Downard, A., Ehn, M., Flagan, R. C., Haider, S., Hansel, A., Hauser, D., Jud, W., Junninen, H., Kreissl, F., Kvashin, A., Laaksonen, A., Lehtipalo, K., Lima, J., Lovejoy, E. R., Makhmutov, V., Mathot, S., Mikkila, J., Minginette, P., Mogo, S., Nieminen, T., Onnela, A., Pereira, P., Petaja, T., Schnitzhofer, R., Seinfeld, J. H., Sipila, M., Stozhkov, Y., Stratmann, F., Tome, A., Vanhanen, J., Viisanen, Y., Vrtala, A., Wagner, P. E., Walther, H., Weingartner, E., Wex, H., Winkler, P. M., Carslaw, K. S., Worsnop, D. R., Baltensperger, U., and Kulmala, M.: Role of sulphuric acid, ammonia and galactic cosmic rays in atmospheric aerosol nucleation, Nature, 476, 429–433, https://doi.org/10.1038/nature10343, 2011.
Korhonen, H., Kerminen, V.-M., Kokkola, H., and Lehtinen, K. E. J.: Estimating atmospheric nucleation rates from size distribution measurements: Analytical equations for the case of size dependent growth rates, J. Aerosol Sci., 69, 13–20, https://doi.org/10.1016/j.jaerosci.2013.11.006, 2014.
Kuang, C., McMurry, P. H., and McCormick, A. V.: Determination of cloud condensation nuclei production from measured new particle formation events, Geophys. Res. Lett., 36, L09822, https://doi.org/10.1029/2009gl037584, 2009.
Kuang, C., Riipinen, I., Sihto, S.-L., Kulmala, M., McCormick, A. V., and McMurry, P. H.: An improved criterion for new particle formation in diverse atmospheric environments, Atmos. Chem. Phys., 10, 8469–8480, https://doi.org/10.5194/acp-10-8469-2010, 2010.
Kulmala, M., Dal Maso, M., Mäkelä, J. M., Pirjola, L., Väkevä, M., Aalto, P., Miikkulainen, P., Hämeri, K., and O'Dowd, C. D.: On the formation, growth and composition of nucleation mode particles, Tellus, 53, 479–490, 2001.
Kulmala, M., Vehkamäki, H., Petäjä, T., Dal Maso, M., Lauri, A., Kerminen, V.-M., Birmili, W., and McMurry, P. H.: Formation and growth rates of ultrafine atmospheric particles: a review of observations, J. Aerosol Sci., 35, 143–176, https://doi.org/10.1016/j.jaerosci.2003.10.003, 2004.
Kulmala, M., Petäjä, T., Nieminen, T., Sipilä, M., Manninen, H. E., Lehtipalo, K., Dal Maso, M., Aalto, P. P., Junninen, H., Paasonen, P., Riipinen, I., Lehtinen, K. E., Laaksonen, A., and Kerminen, V. M.: Measurement of the nucleation of atmospheric aerosol particles, Nat. Protoc., 7, 1651–1667, https://doi.org/10.1038/nprot.2012.091, 2012.
Kulmala, M., Kontkanen, J., Junninen, H., Lehtipalo, K., Manninen, H. E., Nieminen, T., Petäjä, T., Sipilä, M., Schobesberger, S., Rantala, P., Franchin, A., Jokinen, T., Jarvinen, E., Äijälä, M., Kangasluoma, J., Hakala, J., Aalto, P. P., Paasonen, P., Mikkilä, J., Vanhanen, J., Aalto, J., Hakola, H., Makkonen, U., Ruuskanen, T., Mauldin, R. L., 3rd, Duplissy, J., Vehkamäki, H., Bäck, J., Kortelainen, A., Riipinen, I., Kurtén, T., Johnston, M. V., Smith, J. N., Ehn, M., Mentel, T. F., Lehtinen, K. E., Laaksonen, A., Kerminen, V.-M., and Worsnop, D. R.: Direct observations of atmospheric aerosol nucleation, Science, 339, 943–946, https://doi.org/10.1126/science.1227385, 2013.
Kulmala, M., Kerminen, V. M., Petaja, T., Ding, A. J., and Wang, L.: Atmospheric gas-to-particle conversion: why NPF events are observed in megacities?, Faraday Discuss., 200, 271–288, https://doi.org/10.1039/c6fd00257a, 2017.
Kulmala, M., Cai, R., Stolzenburg, D., Zhou, Y., Dada, L., Guo, Y., Yan, C., Petaja, T., Jiang, J., and Kerminen, V. M.: The contribution of new particle formation and subsequent growth to haze formation, Environ. Sci. Atmos., 2, 352–361, https://doi.org/10.1039/d1ea00096a, 2022.
Lampilahti, J., Leino, K., Manninen, A., Poutanen, P., Franck, A., Peltola, M., Hietala, P., Beck, L., Dada, L., Quéléver, L., Öhrnberg, R., Zhou, Y., Ekblom, M., Vakkari, V., Zilitinkevich, S., Kerminen, V.-M., Petäjä, T., and Kulmala, M.: Aerosol particle formation in the upper residual layer, Atmos. Chem. Phys., 21, 7901–7915, https://doi.org/10.5194/acp-21-7901-2021, 2021.
Lehtinen, K. E. J., Dal Maso, M., Kulmala, M., and Kerminen, V.-M.: Estimating nucleation rates from apparent particle formation rates and vice versa: Revised formulation of the Kerminen–Kulmala equation, J. Aerosol Sci., 38, 988–994, https://doi.org/10.1016/j.jaerosci.2007.06.009, 2007.
Lehtipalo, K., Leppä, J., Kontkanen, J., Kangasluoma, J., Franchin, A., Wimmer, D., Schobesberger, S., Junninen, H., Petäjä, T., Sipilä, M., Mikkilä, J., Vanhanen, J., Worsnop, D. R., and Kulmala, M.: Methods for determining particle size distribution and growth rates between 1 and 3 nm using the Particle Size Magnifier, Boreal Environ. Res., 19, 215–236, 2014.
Leppä, J., Anttila, T., Kerminen, V.-M., Kulmala, M., and Lehtinen, K. E. J.: Atmospheric new particle formation: real and apparent growth of neutral and charged particles, Atmos. Chem. Phys., 11, 4939–4955, https://doi.org/10.5194/acp-11-4939-2011, 2011.
Li, C. and Cai, R.: Tutorial: The discrete-sectional method to simulate an evolving aerosol, J. Aerosol Sci., 150, 105615, https://doi.org/10.1016/j.jaerosci.2020.105615, 2020.
Liu, J., Jiang, J., Zhang, Q., Deng, J., and Hao, J.: A spectrometer for measuring particle size distributions in the range of 3 nm to 10 µm, Front. Env. Sci. Eng., 10, 63–72, https://doi.org/10.1007/s11783-014-0754-x, 2016.
Liu, Y., Yan, C., Feng, Z., Zheng, F., Fan, X., Zhang, Y., Li, C., Zhou, Y., Lin, Z., Guo, Y., Zhang, Y., Ma, L., Zhou, W., Liu, Z., Dada, L., Dällenbach, K., Kontkanen, J., Cai, R., Chan, T., Chu, B., Du, W., Yao, L., Wang, Y., Cai, J., Kangasluoma, J., Kokkonen, T., Kujansuu, J., Rusanen, A., Deng, C., Fu, Y., Yin, R., Li, X., Lu, Y., Liu, Y., Lian, C., Yang, D., Wang, W., Ge, M., Wang, Y., Worsnop, D. R., Junninen, H., He, H., Kerminen, V.-M., Zheng, J., Wang, L., Jiang, J., Petäjä, T., Bianchi, F., and Kulmala, M.: Continuous and comprehensive atmospheric observations in Beijing: a station to understand the complex urban atmospheric environment, Big Earth Data, 4, 295–321, https://doi.org/10.1080/20964471.2020.1798707, 2020.
McMurry, P. H.: New particle formation in the presence of an aerosol: rates, time scales, and sub-0.01 µm size distributions, J. Colloid. Interf. Sci., 95, 72–80, 1983.
Pierce, J. R. and Adams, P. J.: Efficiency of cloud condensation nuclei formation from ultrafine particles, Atmos. Chem. Phys., 7, 1367–1379, https://doi.org/10.5194/acp-7-1367-2007, 2007.
Pierce, J. R., Westervelt, D. M., Atwood, S. A., Barnes, E. A., and Leaitch, W. R.: New-particle formation, growth and climate-relevant particle production in Egbert, Canada: analysis from 1 year of size-distribution observations, Atmos. Chem. Phys., 14, 8647–8663, https://doi.org/10.5194/acp-14-8647-2014, 2014.
Qiao, X., Yan, C., Li, X., Guo, Y., Yin, R., Deng, C., Li, C., Nie, W., Wang, M., Cai, R., Huang, D., Wang, Z., Yao, L., Worsnop, D. R., Bianchi, F., Liu, Y., Donahue, N. M., Kulmala, M., and Jiang, J.: Contribution of Atmospheric Oxygenated Organic Compounds to Particle Growth in an Urban Environment, Environ. Sci. Tech., 55, 13646–13656, https://doi.org/10.1021/acs.est.1c02095, 2021.
Sebastian, M., Kanawade, V. P., Soni, V. K., Asmi, E., Westervelt, D. M., Vakkari, V., Hyvärinen, A. P., Pierce, J. R., and Hooda, R. K.: New Particle Formation and Growth to Climate-Relevant Aerosols at a Background Remote Site in the Western Himalaya, J. Geophys. Res.-Atmos., 126, e2020JD033267, https://doi.org/10.1029/2020jd033267, 2021.
Stolzenburg, D., Steiner, G., and Winkler, P. M.: A DMA-train for precision measurement of sub-10 nm aerosol dynamics, Atmos. Meas. Tech., 10, 1639–1651, https://doi.org/10.5194/amt-10-1639-2017, 2017.
Stolzenburg, D., Simon, M., Ranjithkumar, A., Kürten, A., Lehtipalo, K., Gordon, H., Ehrhart, S., Finkenzeller, H., Pichelstorfer, L., Nieminen, T., He, X.-C., Brilke, S., Xiao, M., Amorim, A., Baalbaki, R., Baccarini, A., Beck, L., Bräkling, S., Caudillo Murillo, L., Chen, D., Chu, B., Dada, L., Dias, A., Dommen, J., Duplissy, J., El Haddad, I., Fischer, L., Gonzalez Carracedo, L., Heinritzi, M., Kim, C., Koenig, T. K., Kong, W., Lamkaddam, H., Lee, C. P., Leiminger, M., Li, Z., Makhmutov, V., Manninen, H. E., Marie, G., Marten, R., Müller, T., Nie, W., Partoll, E., Petäjä, T., Pfeifer, J., Philippov, M., Rissanen, M. P., Rörup, B., Schobesberger, S., Schuchmann, S., Shen, J., Sipilä, M., Steiner, G., Stozhkov, Y., Tauber, C., Tham, Y. J., Tomé, A., Vazquez-Pufleau, M., Wagner, A. C., Wang, M., Wang, Y., Weber, S. K., Wimmer, D., Wlasits, P. J., Wu, Y., Ye, Q., Zauner-Wieczorek, M., Baltensperger, U., Carslaw, K. S., Curtius, J., Donahue, N. M., Flagan, R. C., Hansel, A., Kulmala, M., Lelieveld, J., Volkamer, R., Kirkby, J., and Winkler, P. M.: Enhanced growth rate of atmospheric particles from sulfuric acid, Atmos. Chem. Phys., 20, 7359–7372, https://doi.org/10.5194/acp-20-7359-2020, 2020.
Stolzenburg, M. R., McMurry, P. H., Sakurai, H., Smith, J. N., Mauldin, R. L., Eisele, F. L., and Clement, C. F.: Growth rates of freshly nucleated atmospheric particles in Atlanta, J. Geophys. Res., 110, D22S05, https://doi.org/10.1029/2005jd005935, 2005.
Tuovinen, S., Kontkanen, J., Jiang, J., and Kulmala, M.: Investigating the effectiveness of condensation sink based on heterogeneous nucleation theory, J. Aerosol Sci., 149, 105613, https://doi.org/10.1016/j.jaerosci.2020.105613, 2020.
Tuovinen, S., Cai, R., Kerminen, V.-M., Kulmala, M., Jiang, J., Yan, C., and Kontkanen, J.: Survival probabilities of atmospheric particles: comparison based on theory, cluster population simulations, and observations in Beijing, Atmos. Chem. Phys. Discuss. [preprint], https://doi.org/10.5194/acp-2022-484, in review, 2022.
Wang, M., Kong, W., Marten, R., He, X. C., Chen, D., Pfeifer, J., Heitto, A., Kontkanen, J., Dada, L., Kurten, A., Yli-Juuti, T., Manninen, H. E., Amanatidis, S., Amorim, A., Baalbaki, R., Baccarini, A., Bell, D. M., Bertozzi, B., Brakling, S., Brilke, S., Murillo, L. C., Chiu, R., Chu, B., De Menezes, L. P., Duplissy, J., Finkenzeller, H., Carracedo, L. G., Granzin, M., Guida, R., Hansel, A., Hofbauer, V., Krechmer, J., Lehtipalo, K., Lamkaddam, H., Lampimaki, M., Lee, C. P., Makhmutov, V., Marie, G., Mathot, S., Mauldin, R. L., Mentler, B., Muller, T., Onnela, A., Partoll, E., Petaja, T., Philippov, M., Pospisilova, V., Ranjithkumar, A., Rissanen, M., Rorup, B., Scholz, W., Shen, J., Simon, M., Sipila, M., Steiner, G., Stolzenburg, D., Tham, Y. J., Tome, A., Wagner, A. C., Wang, D. S., Wang, Y., Weber, S. K., Winkler, P. M., Wlasits, P. J., Wu, Y., Xiao, M., Ye, Q., Zauner-Wieczorek, M., Zhou, X., Volkamer, R., Riipinen, I., Dommen, J., Curtius, J., Baltensperger, U., Kulmala, M., Worsnop, D. R., Kirkby, J., Seinfeld, J. H., El-Haddad, I., Flagan, R. C., and Donahue, N. M.: Rapid growth of new atmospheric particles by nitric acid and ammonia condensation, Nature, 581, 184–189, https://doi.org/10.1038/s41586-020-2270-4, 2020.
Weber, R. J., Marti, J. J., McMurry, P. H., Eisele, F. L., Tanner, D. J., and Jefferson, A.: Measurements of new particle formation and ultrafine particle growth rates at a clean continental site, J. Geophys. Res.-Atmos., 102, 4375–4385, https://doi.org/10.1029/96jd03656, 1997.
Westervelt, D. M., Pierce, J. R., Riipinen, I., Trivitayanurak, W., Hamed, A., Kulmala, M., Laaksonen, A., Decesari, S., and Adams, P. J.: Formation and growth of nucleated particles into cloud condensation nuclei: model–measurement comparison, Atmos. Chem. Phys., 13, 7645–7663, https://doi.org/10.5194/acp-13-7645-2013, 2013.
Zhang, R., Khalizov, A., Wang, L., Hu, M., and Xu, W.: Nucleation and growth of nanoparticles in the atmosphere, Chem. Rev., 112, 1957–2011, 10.1021/cr2001756, 2012.
Zhu, Y., Xue, L., Gao, J., Chen, J., Li, H., Zhao, Y., Guo, Z., Chen, T., Wen, L., Zheng, P., Shan, Y., Wang, X., Wang, T., Yao, X., and Wang, W.: Increased new particle yields with largely decreased probability of survival to CCN size at the summit of Mt. Tai under reduced SO2 emissions, Atmos. Chem. Phys., 21, 1305–1323, https://doi.org/10.5194/acp-21-1305-2021, 2021.