the Creative Commons Attribution 4.0 License.
the Creative Commons Attribution 4.0 License.
 | 15 Nov 2022
Dust pollution in China affected by different spatial and temporal types of El Niño
Liangying Zeng
Hailong Wang
Pinya Wang
Hong Liao
Dust is an important aerosol affecting air quality in China in the winter and spring seasons. Dust in China is potentially influenced by the interannual climate variability associated with El Niño. Here, the impacts of El Niño with different temporal and spatial types on dust pollution in boreal winter and spring in China and the potential mechanisms are investigated using a state-of-the-art Earth system model (E3SMv1). We find that the eastern Pacific (EP) and central Pacific (CP) El Niño both increase wintertime dust concentrations by 5–50 µg m−3 over central-eastern China. Due to a stronger wind and lower relative humidity, which favor dust emissions near sources, and a strengthened northwesterly and reduced precipitation, which are conducive to dust transport, dust concentrations during the CP El Niño are 5–20 µg m−3 higher in northern China than during the EP El Niño, although the changes are mostly insignificant. El Niño with a short duration (SD) increases boreal winter dust concentrations by 20–100 µg m−3 over northern China relative to the climatological mean, while there is a decrease of 5–50 µg m−3 during the long-duration (LD) El Niño, which is also related to the El Niño-induced changes in atmospheric circulation, precipitation, and relative humidity. In the following spring season, all types of El Niño events enhance dust over northern China, but only the increase during the LD El Niño is statistically significant, suggesting that the weaker intensity but longer duration of the LD El Niño events can significantly affect spring dust in China. Our results contribute to the current knowledge of the influence of El Niño on dust pollution, which has profound implications for air pollution control and dust storm prediction.
- Article
(14357 KB) - Full-text XML
-
Supplement
(6957 KB) - BibTeX
- EndNote


Dust, one of the most important types of natural aerosols, has significant impacts on Earth's radiative balance (Seinfeld et al., 2004), regional and global climate (Kok et al., 2018; Yang et al.,2017), the hydrological cycle (Huang et al., 2014), agricultural production (Sivakumar, 2005), and public health and transportation activities (Goudie, 2014). The Gobi Desert and the Taklamakan Desert in northwestern China are important contributors to dust concentrations in East Asia and even globally, and about 30 % of the dust from the sources in China can be transported to the downwind areas over long distances (Chen et al., 2017). Despite China's vigorous efforts to combat desertification since the beginning of the 21st century, strong and widespread dust storms have still occurred in China in recent years (Yin et al., 2021). Therefore, a deeper and more scientific comprehension of the factors affecting dust aerosols in China is urgently needed for the early warning and mitigation of dust pollution.
In recent years, the influence of meteorological conditions on dust pollution in China has attracted considerable attention (Guo et al., 2019; Li et al., 2020; Lou et al., 2016; Shi et al., 2021; Yin et al., 2021; Zhu et al., 2008). Under global warming in recent decades, dust emissions and the frequency of dust storms in northern China decreased (Shi et al., 2021), which was attributed to the reduced frequency and intensity of Mongolian cyclones, related to the weakened westerly jet stream and atmospheric pressure in northern China and Mongolia, in a warming climate (Zhu et al., 2008). Due to a combination of changes in disruptive temperature anomalies in the Mongolian dust source region, the occurrence of super Mongolian cyclones, and the anomalies of sea ice in the Barents Sea and Kara Sea and sea surface temperature (SST) in the eastern Pacific and northwestern Atlantic, China experienced the strongest dust pollution in spring 2021 (Yin et al., 2021). Lou et al. (2016) pointed out that springtime dust concentrations exhibited a significant negative correlation with the East Asian Monsoon index over most of China, with a correlation coefficient of −0.64 in their model simulations, and they found that anomalous northwesterly winds in weak-East-Asian-Monsoon years led to a strong dust transport from Mongolia to China. Mao et al. (2011) illustrated that the negative (positive) phase of Arctic Oscillation (AO) can lead to an increase (decrease) in the frequency of dust storms in northern China due to the increase (decrease) in the frequency of cold air outbreaks over Mongolia.
El Niño–Southern Oscillation (ENSO) is a well-known mode of climate variability generated by coupled ocean–atmosphere interactions that can exert a far-reaching impact on global climate despite its origin in the tropical Pacific Ocean (Trenberth, 1997; Yang et al., 2016a, b; Zeng et al., 2021). Numerous studies have demonstrated that El Niño can affect dust emission, concentration, and transport by modulating large-scale atmospheric circulation, precipitation, and temperature (Le and Bae, 2022; Lee et al., 2015; Li et al., 2021). Using observational data over 1961–2002, Lee et al. (2015) found that under the negative AO phase, frequency of spring dust events in northern China during El Niño was 30 % higher than that during La Niña years. Li et al. (2021) used dust surface concentration data (1982–2019) from MERRA-2 reanalysis to study the impacts of ENSO events on global atmospheric dust loading and found that dust concentrations were positively correlated with Southern Oscillation index (SOI; a consistently negative SOI is El Niño, and the opposite is La Niña) over northwestern China, which suggests that El Niño was associated with a decrease in dust concentrations. Modeling studies driven by reanalysis data also revealed a relatively weak positive relationship between SOI and dust emissions over the Gobi Desert, although this correlation has a large spatiotemporal variation (Gong et al., 2006; Hara et al., 2006). These numerical studies used regional models driven by or nudged to reanalysis meteorological fields, which could be influenced by factors other than El Niño. Recent studies have indicated that the El Niño impact on air pollutants can be better represented by the superposed SST perturbation method (Yu et al., 2019; Zhao et al., 2018; Zeng et al., 2021), considering the influence of ENSO alone. To the best of our knowledge, no study has yet used this approach to investigate the relationship between El Niño and dust pollution in China.
Additionally, previous studies mainly focused on the influences of general El Niño on dust over China, while El Niño can be classified into different temporal types (e.g., short-duration (SD) and long-duration (LD) El Niño; Guo and Tan, 2018) and spatial types (e.g., eastern Pacific (EP) and central Pacific (CP) El Niño; Kao and Yu, 2009). During different spatial and temporal types of El Niño, patterns of precipitation and atmospheric circulation are also different in China (Yu et al., 2019; Zeng et al., 2021), and they could have distinct effects on wintertime and springtime dust pollution in China. Nevertheless, most of the existing studies have focused on the effects of various spatial and temporal types of El Niño events on anthropogenic aerosols, while few studies have examined their effects on natural aerosols, such as dust, and their associated mechanisms, which are crucial for predicting and combating dust pollution in the near future.
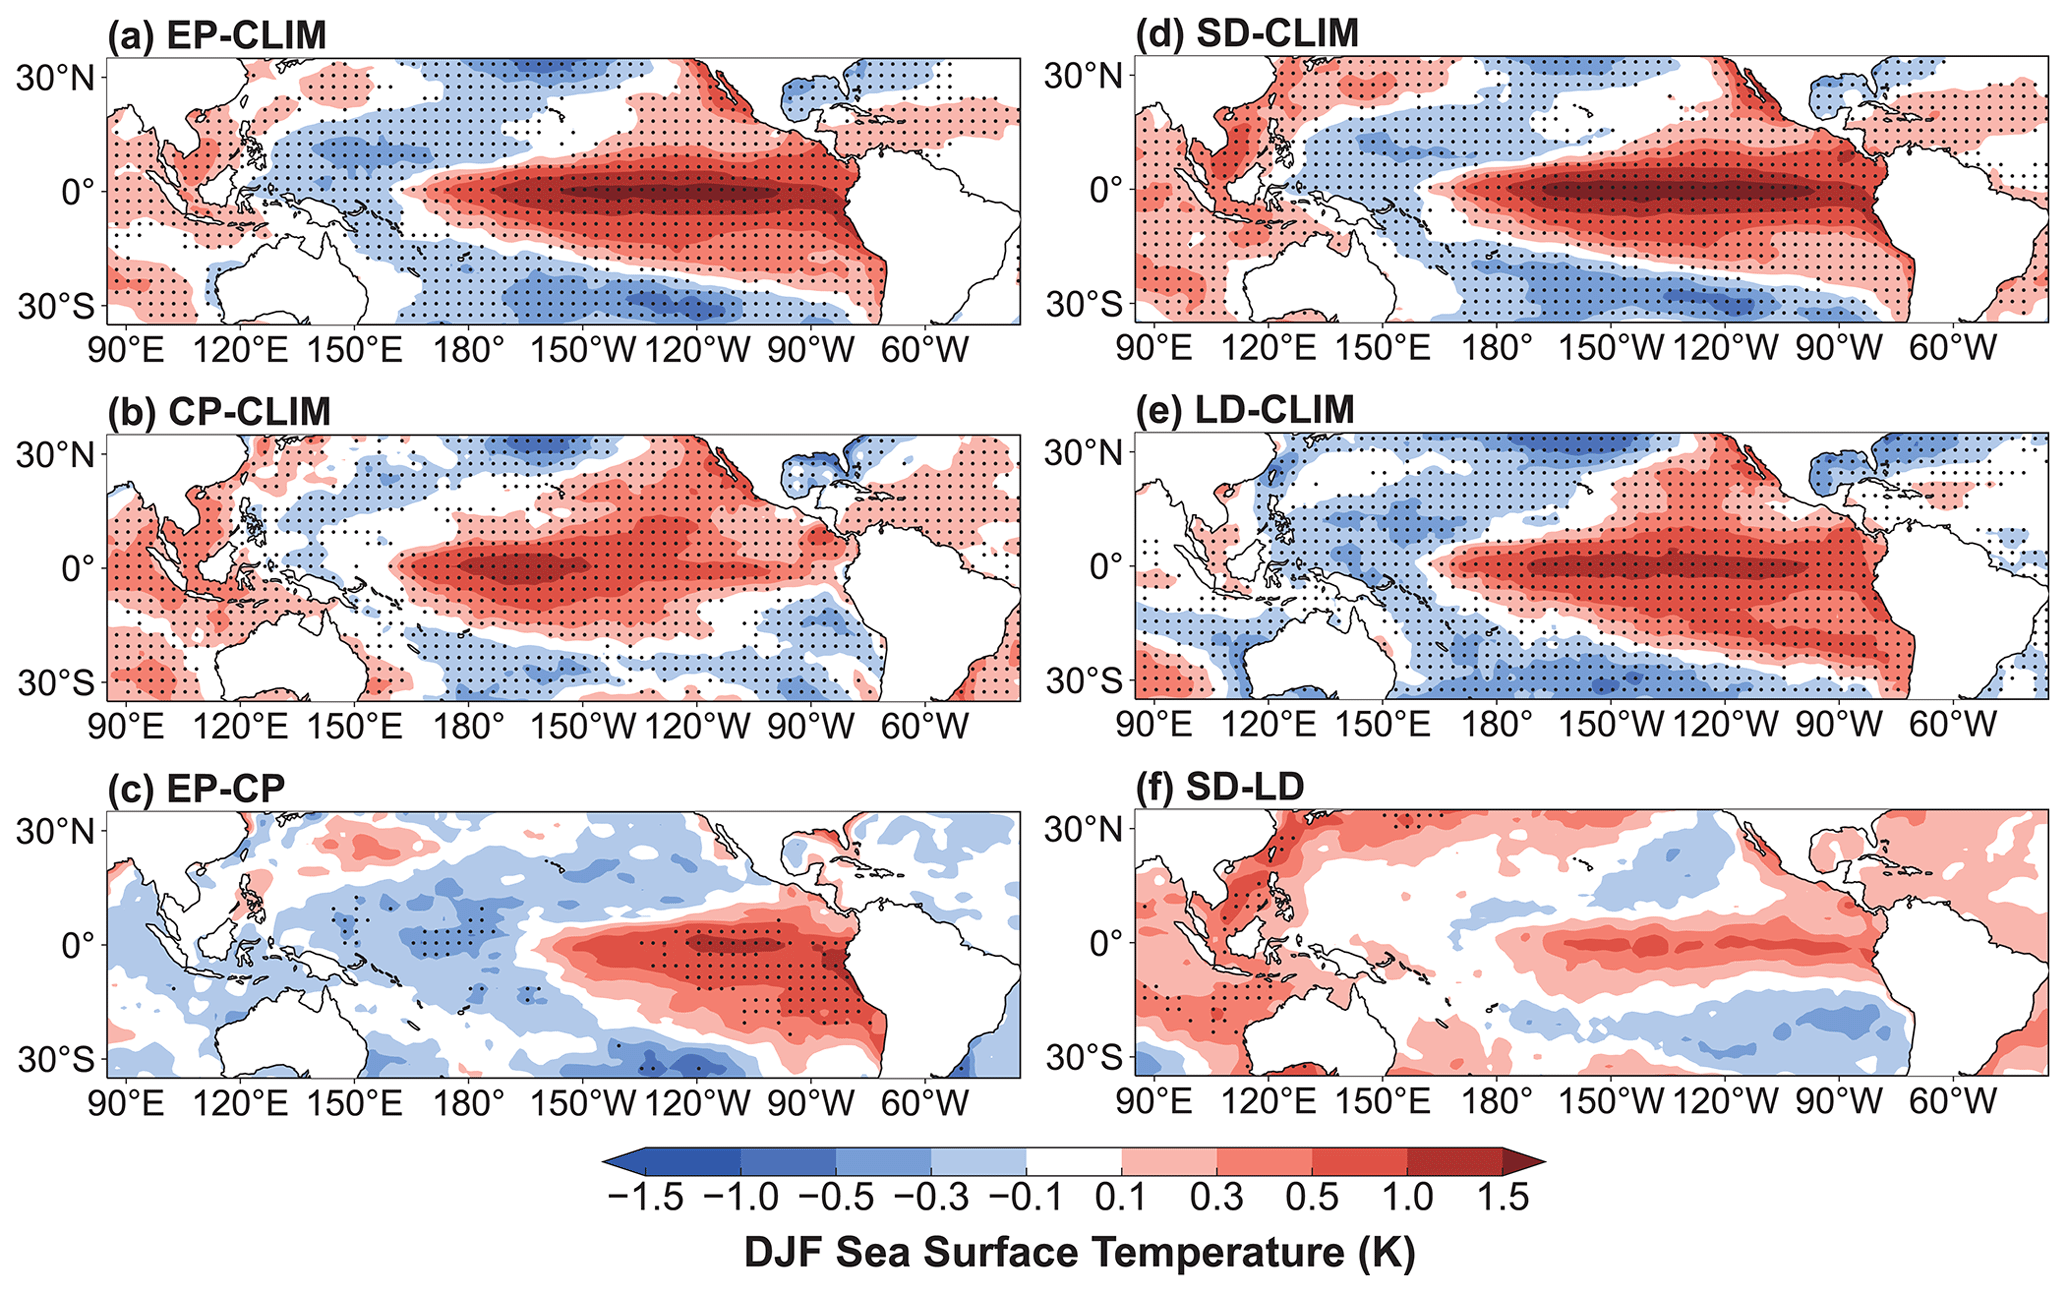
Figure 1Composite differences in DJF mean SST (∘) between (a) EP, (b) CP, (d) SD, and (e) LD El Niño events and climatological mean over 1870–2017, (c) between EP and CP, and (f) between SD and LD El Niño events. Statistically significant differences at 99 % from a two-tailed t test are stippled.
In this work, the effects of different spatial and temporal types of El Niño on boreal winter and spring dust pollution in China and the mechanisms behind the impacts are examined using the Energy Exascale Earth System Model version 1 (E3SMv1). The methods and model description are described in Sect. 2. The quantitative impacts of various temporal and spatial types of El Niño events on wintertime and springtime dust concentrations in China and the associated mechanisms are elaborated in Sect. 3. Section 4 summarizes the key results and conclusions of the study.
2.1 Data
Global SST patterns and SST anomalies during El Niño events of different temporal and spatial types are constructed using the merged Hadley–NOAA/OI dataset, which has a horizontal resolution of from 1870 to 2017 (Hurrell et al., 2008). The monthly ERA5 reanalysis data (Hersbach et al., 2020) are applied to evaluate the simulated meteorological parameters during El Niño events.
Hourly observations of PM10 (particulate matter less than 10 µm in diameter) concentrations in China from 2015 to 2021 derived from the China National Environmental Monitoring Centre (CNEMC) and the Deep Blue aerosol products (Platnick et al., 2015) from the Moderate Resolution Imaging Spectroradiometer (MODIS) on the Terra satellite, including monthly aerosol optical depth (AOD) at 550 nm and the Ångström exponent (α) from 2001–2020, are applied to evaluate the performance of dust simulation in the model. The satellite dust optical depth (DOD) is calculated following Yu et al. (2021).
2.2 El Niño events identified as different spatial and temporal types
We first clarify the definition of different temporal and spatial types of El Niño events here. The notation of year0 is used to denote the first year of El Niño development, and Jan0, Feb0,…, and Dec0 indicate the individual months of that year, while year and Jan, Feb, …, and Dec, respectively, denote the following years and months therein. The Niño 3.4 index is defined as area-mean anomalies of detrended SST in the Niño 3.4 region (5 ∘ S–5 ∘ N, 170–120 ∘ W). The Niño index ( is the same as the Niño 3.4 index, but in the Niño region (5 ∘ S–5 ∘ N, 150–90 ∘ W; 5 ∘ S–5 ∘ N, 160 ∘ E–150 ∘ W).
For the classification of different temporal types, following Wu et al. (2019), El Niño events are firstly selected if any of the 3-month running average Niño 3.4 index during Oct0–Feb1 is greater than 0.75 ∘C. Then the LD El Niño event is identified once any of the Niño 3.4 index during Oct1–Feb2 is higher than 0.5 ∘C; otherwise, it is a SD El Niño event.
Following Yu et al. (2019), the El Niño events, selected with 3-month running average Niño 3.4 indices higher than 0.5 ∘C for five consecutive months, are classified into different spatial types based on the EP El Niño index (IEP) and the CP El Niño index (ICP). The definition of these indices is given below.
If the mean IEP is greater than the ICP during Oct0–Feb1 of an El Niño, then it is an EP El Niño event; otherwise, it is a CP El Niño event. Note that mixed El Niño events that are not considered separately in this study also exist.
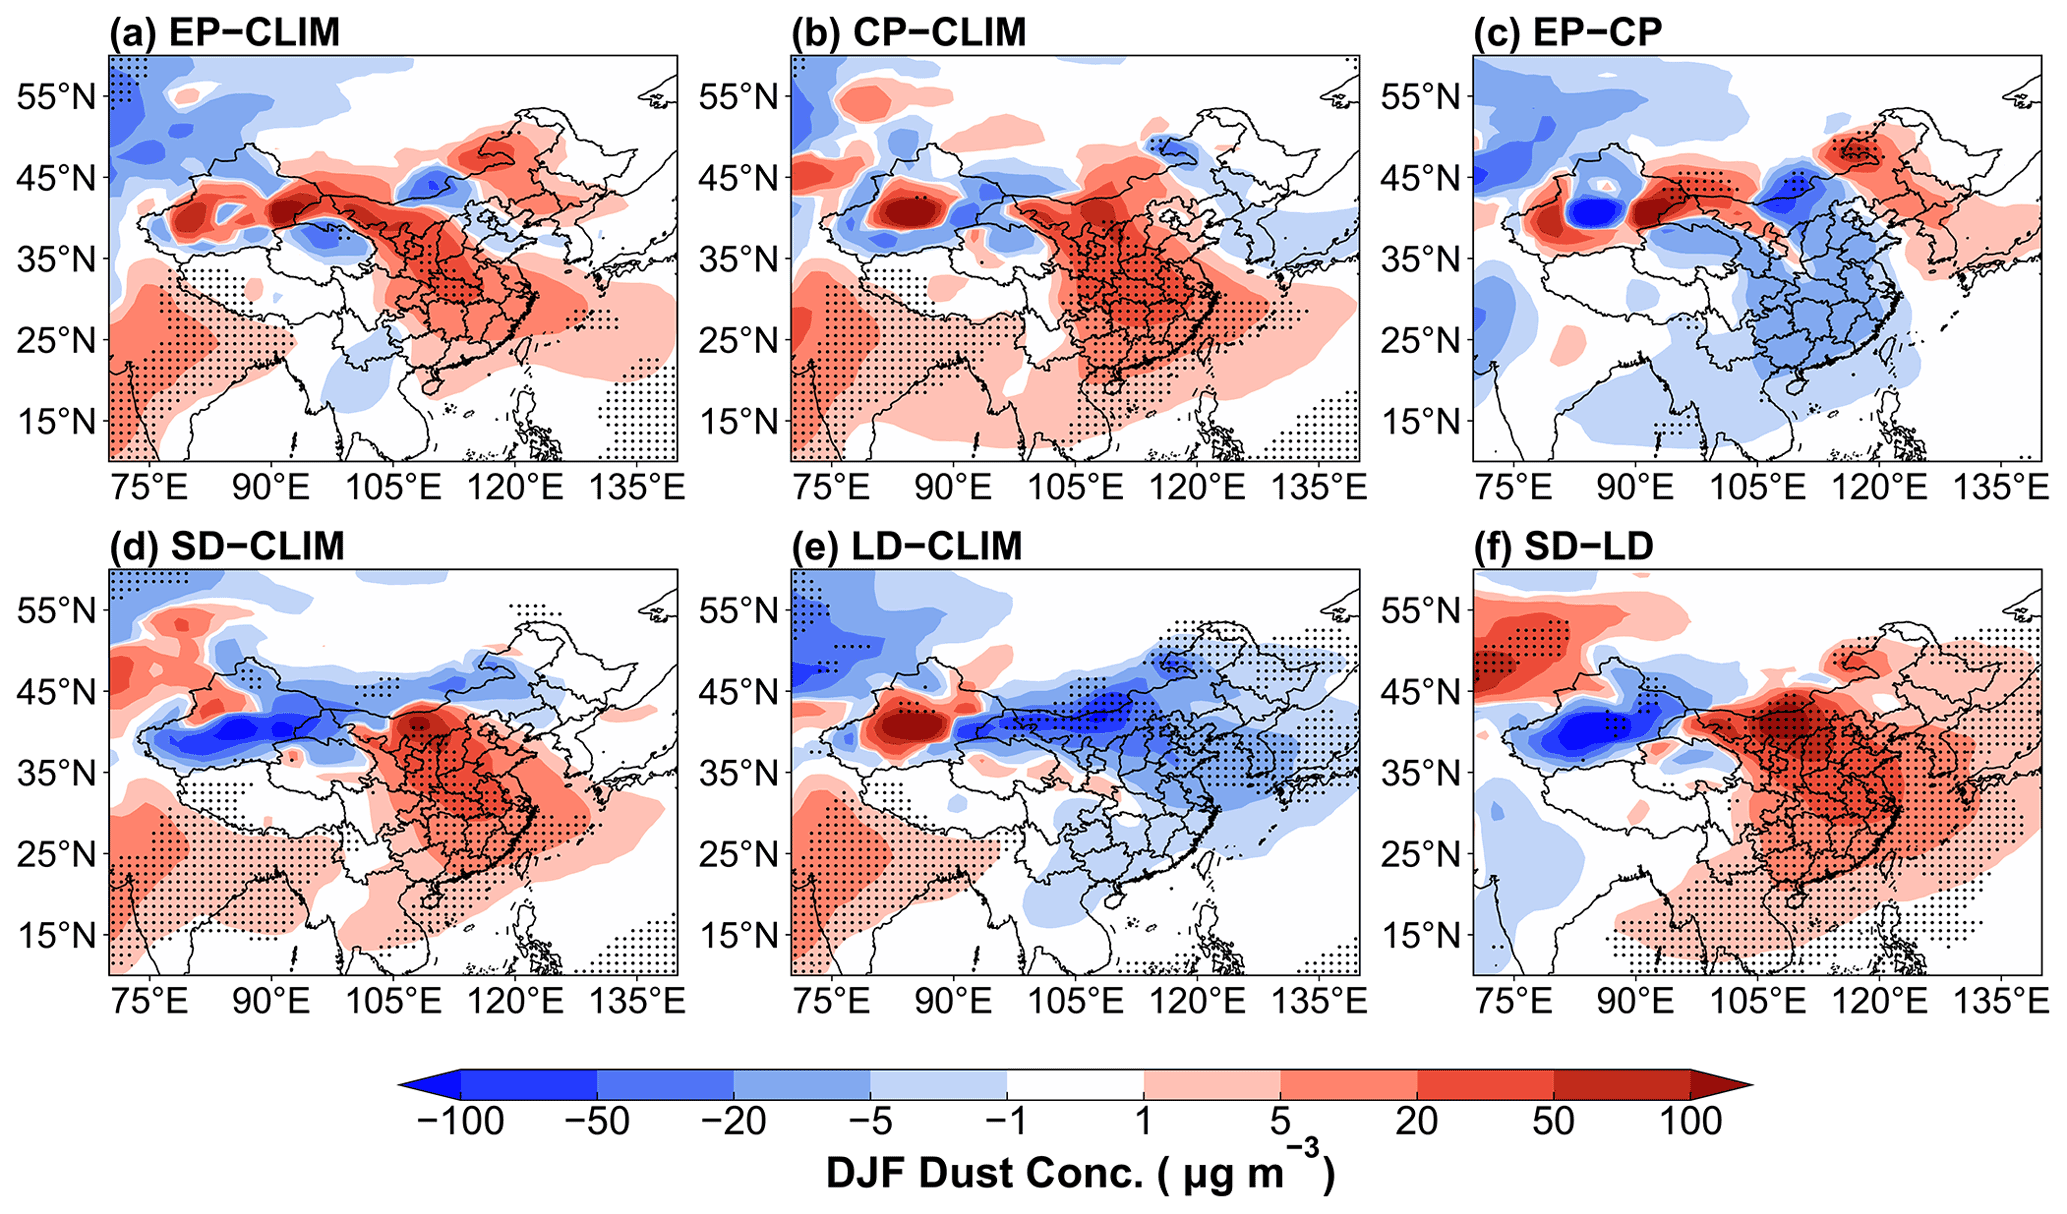
Figure 2Composite differences in DJF mean near-surface dust concentrations (µg m−3) between EP and CLIM in (a), CP and CLIM in (b), EP and CP in (c), SD and CLIM in (d), LD and CLIM in (e), and SD and LD in (f). The stippled areas indicate statistical significance with 90 % confidence from a two-tailed t test.
The time series of the Niño 3.4 index derived from Hadley–NOAA/OI 1870–2017 data is shown in Fig. S1 in the Supplement. Using the definitions described above, for El Niño with different temporal types, 22 SD El Niño events and 8 LD ones are extracted during this time period; for El Niño with different spatial types, 26 EP El Niño events and 8 CP ones are extracted. The mechanisms leading to different types of El Niño are given in Sect. S1 in the Supplement.
2.3 Model description and experimental design
To investigate the impacts of El Niño of different spatial and temporal types on dust aerosol in China, this study utilizes the US Department of Energy (DOE) E3SMv1 (Golaz et al., 2019). As a model developed from the well-known CESM1 (Community Earth System Model version 1), E3SMv1 provides significant improvements to the atmospheric component, including processes associated with aerosol, cloud, turbulence, and chemistry (Rasch et al., 2019). We choose the horizontal resolution of about 1∘ and 30 vertical layers. E3SMv1 predicts aerosols including mineral dust, sea salt, sulfate, primary and secondary organic aerosols, and black carbon in the four-mode Modal Aerosol Module (MAM4) (Wang et al., 2020). E3SMv1 represents dust-related processes in the atmosphere and land model components (Feng et al., 2022). Dust emissions are calculated at each model time step according to the wind erosion dust scheme proposed by Zender et al. (2003), which is related to 10 m wind speed, surface soil moisture content, soil erodibility, vegetation cover, and threshold friction velocity.
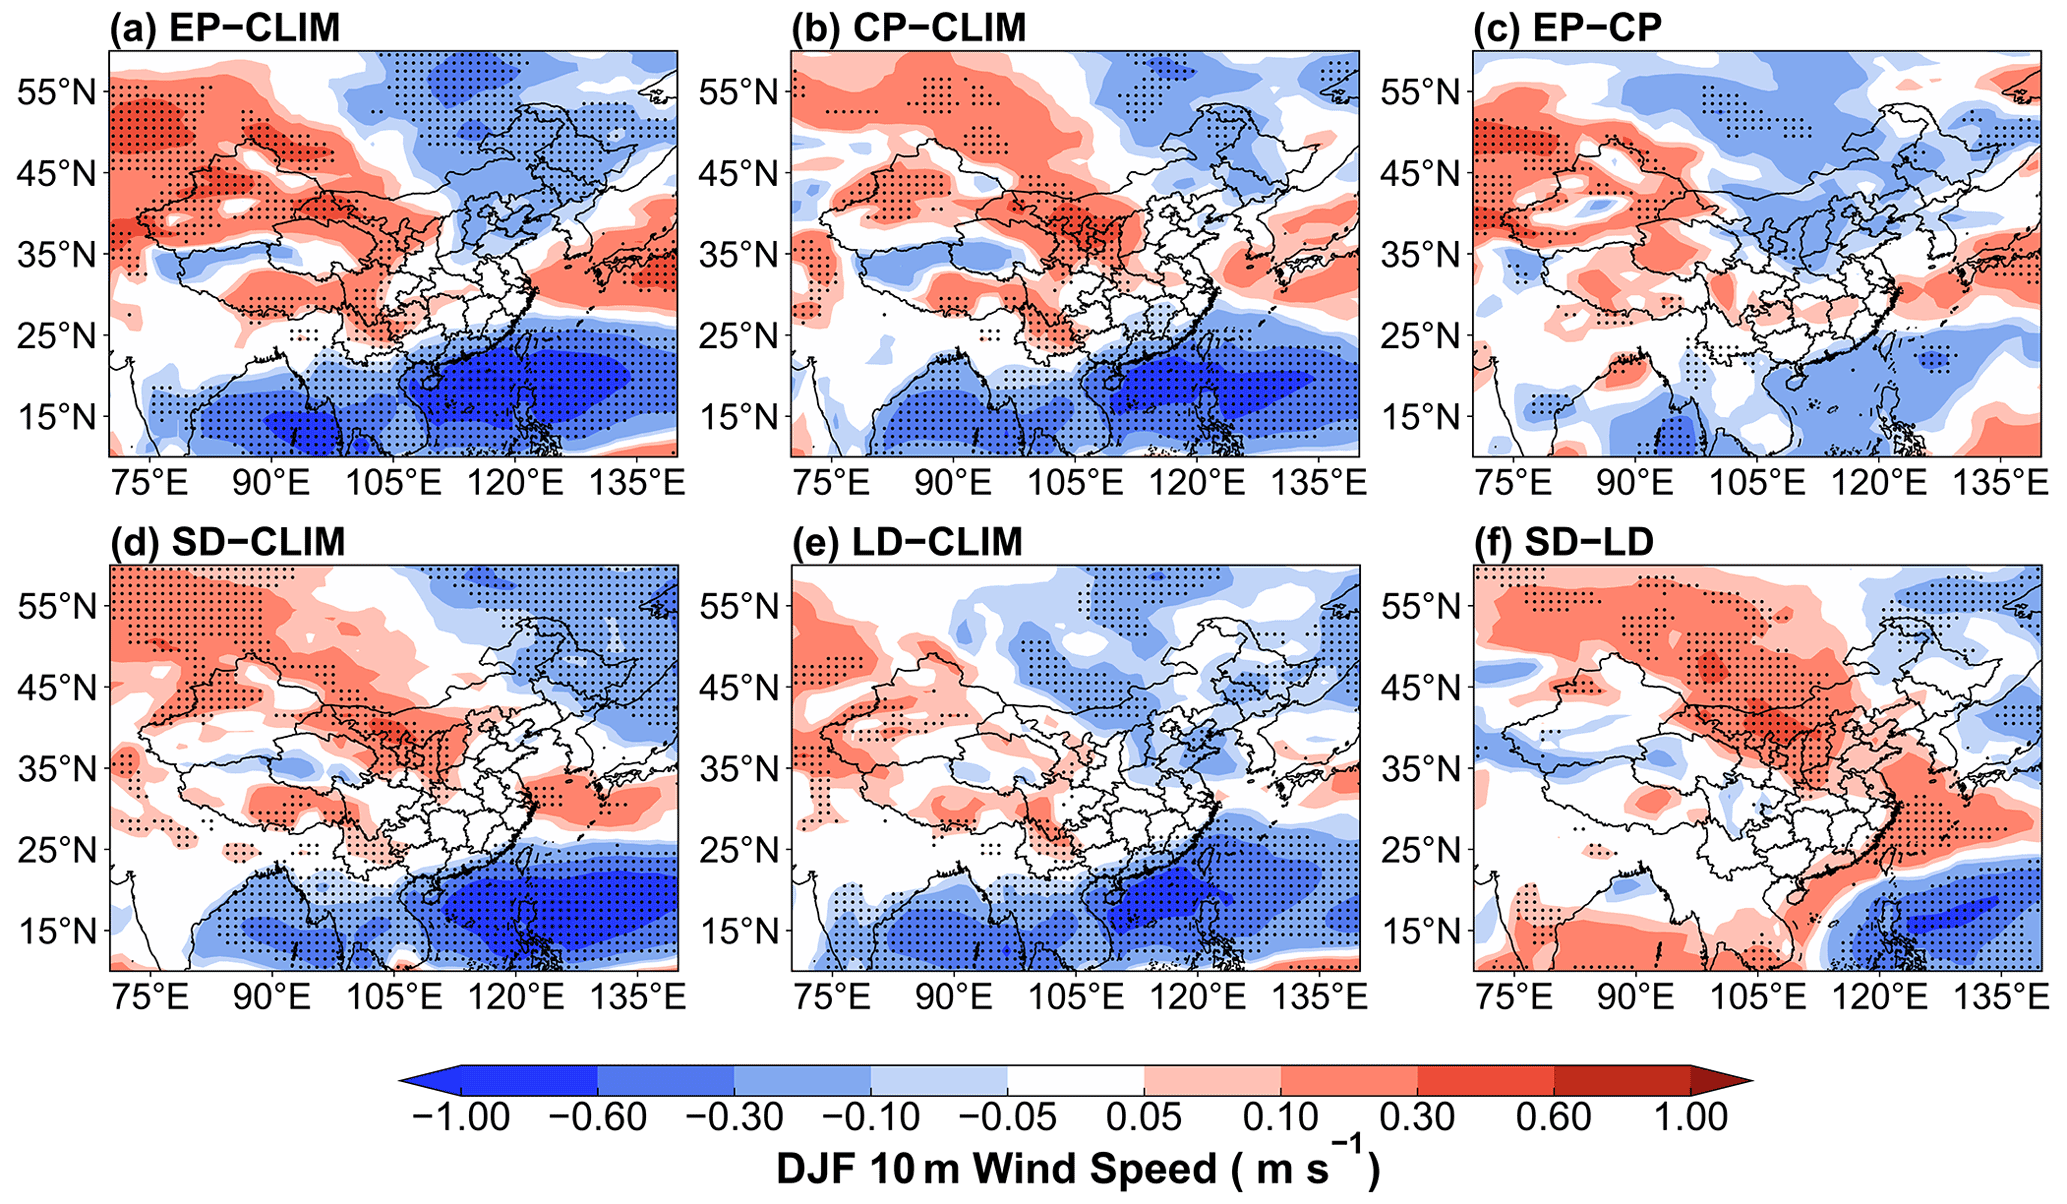
Figure 3Composite differences in DJF mean 10 m wind speed (m s−1) between EP and CLIM in (a), CP and CLIM in (b), EP and CP in (c), SD and CLIM in (d), LD and CLIM in (e), and SD and LD in (f). The stippled areas indicate statistical significance with 90 % confidence from a two-tailed t test.
The following simulations are performed. A “CLIM” experiment applying the prescribed climatological mean of monthly SST during 1870–2017 is integrated for 30 years. Four sets of sensitivity simulations, “SD”, “LD”, “EP”, and “CP”, are driven by the monthly SST representing the composite of SD, LD, EP, and CP El Niño events, respectively, which is generated by adding the mean monthly SST anomalies from Jul0 to Jun1 of the SD, LD, EP, and CP El Niño events (Fig. S1), respectively, to the climatological SST between 60 ∘ S and 60 ∘ N. All the sensitivity experiments have three ensemble members with diverse initial conditions branched from different years of the CLIM simulation, and the results are based on the ensemble mean. All sensitivity experiments are run for 13 years, with the first 3 years as model spin-up and the last 10 years used for analysis. The differences in model fields between the sensitivity simulations and CLIM represent the influences of El Niño events with different spatial and temporal types on dust aerosols. All other external factors such as greenhouse gas concentrations, insolation, anthropogenic aerosols, and their precursor emissions are held at present-day conditions (year 2014). The SST anomalies relative to the 1870–2017 climatology during SD, LD, EP, and CP El Niño events are shown in Fig. 1.
2.4 Model evaluation
To evaluate the model performance in dust simulation, we compare the simulated near-surface dust concentration and dust optical depth (DOD) over China with observed PM10 concentrations and satellite-retrieved DOD, respectively. The model can reproduce the spatial distribution of springtime dust in China, with high dust concentrations in northwestern China and low dust concentrations in southern and northeastern China (Fig. S2). The spatial correlation coefficient between the simulated dust concentrations in E3SMv1 and observed near-surface PM10 concentrations is +0.55. However, the model strongly overestimates dust concentrations over the source regions, which were also reported in many previous studies using the E3SMv1 and CESM (the predecessor of E3SMv1) (Wang et al., 2020; Wu et al., 2019). The high model bias near the sources is also confirmed by comparing DOD between model simulation and satellite retrieval. It suggests that the dust emissions are overestimated in northwestern China in the model. The high bias is partly related to the dust treatment in the model that dust is emitted into a shallow model bottom layer in E3SMv1 for increased model vertical resolution (Wang et al., 2020). In addition, stronger 10 m wind speed simulated by the model compared to the observation (Fig. S3) also contributes to the higher dust loading. However, we also note that the E3SMv1 underestimates the transport of dust from source regions (Wu et al., 2020; Feng et al., 2022); thus the dust over eastern China is comparable to observations.
3.1 Impacts of different El Niño types on winter dust pollution
The simulated effects of the four types of El Niño with different spatial positions (EP and CP) and durations (SD and LD) on the DJF ground-level dust concentrations are shown in Fig. 2. As for different spatial types of El Niño events, the effects on DJF dust concentrations in China are similar, with an increase in dust concentrations of 5–50 µg m−3 over central-eastern China during EP and CP El Niño compared to the climatological means. The spatial pattern of dust changes is consistent with previous modeling studies (Lee et al., 2015; Li et al., 2021). Although the influences of EP and CP El Niño on the DJF dust concentrations resemble each other in the spatial patterns over China, the magnitudes of the influences are different. During CP El Niño relative to the climatological mean, dust concentrations increase more significantly over central-eastern China, with values of 20–50 µg m−3, which is 5–20 µg m−3 higher than those during EP El Niño relative to the climatological mean. The large increase during CP El Niño relative to the climatological mean is also more widespread than that during EP El Niño relative to the climatological mean. Compared to CP El Niño, dust concentration over central-eastern China decreased slightly during the EP El Niño, but the changes are mostly insignificant.
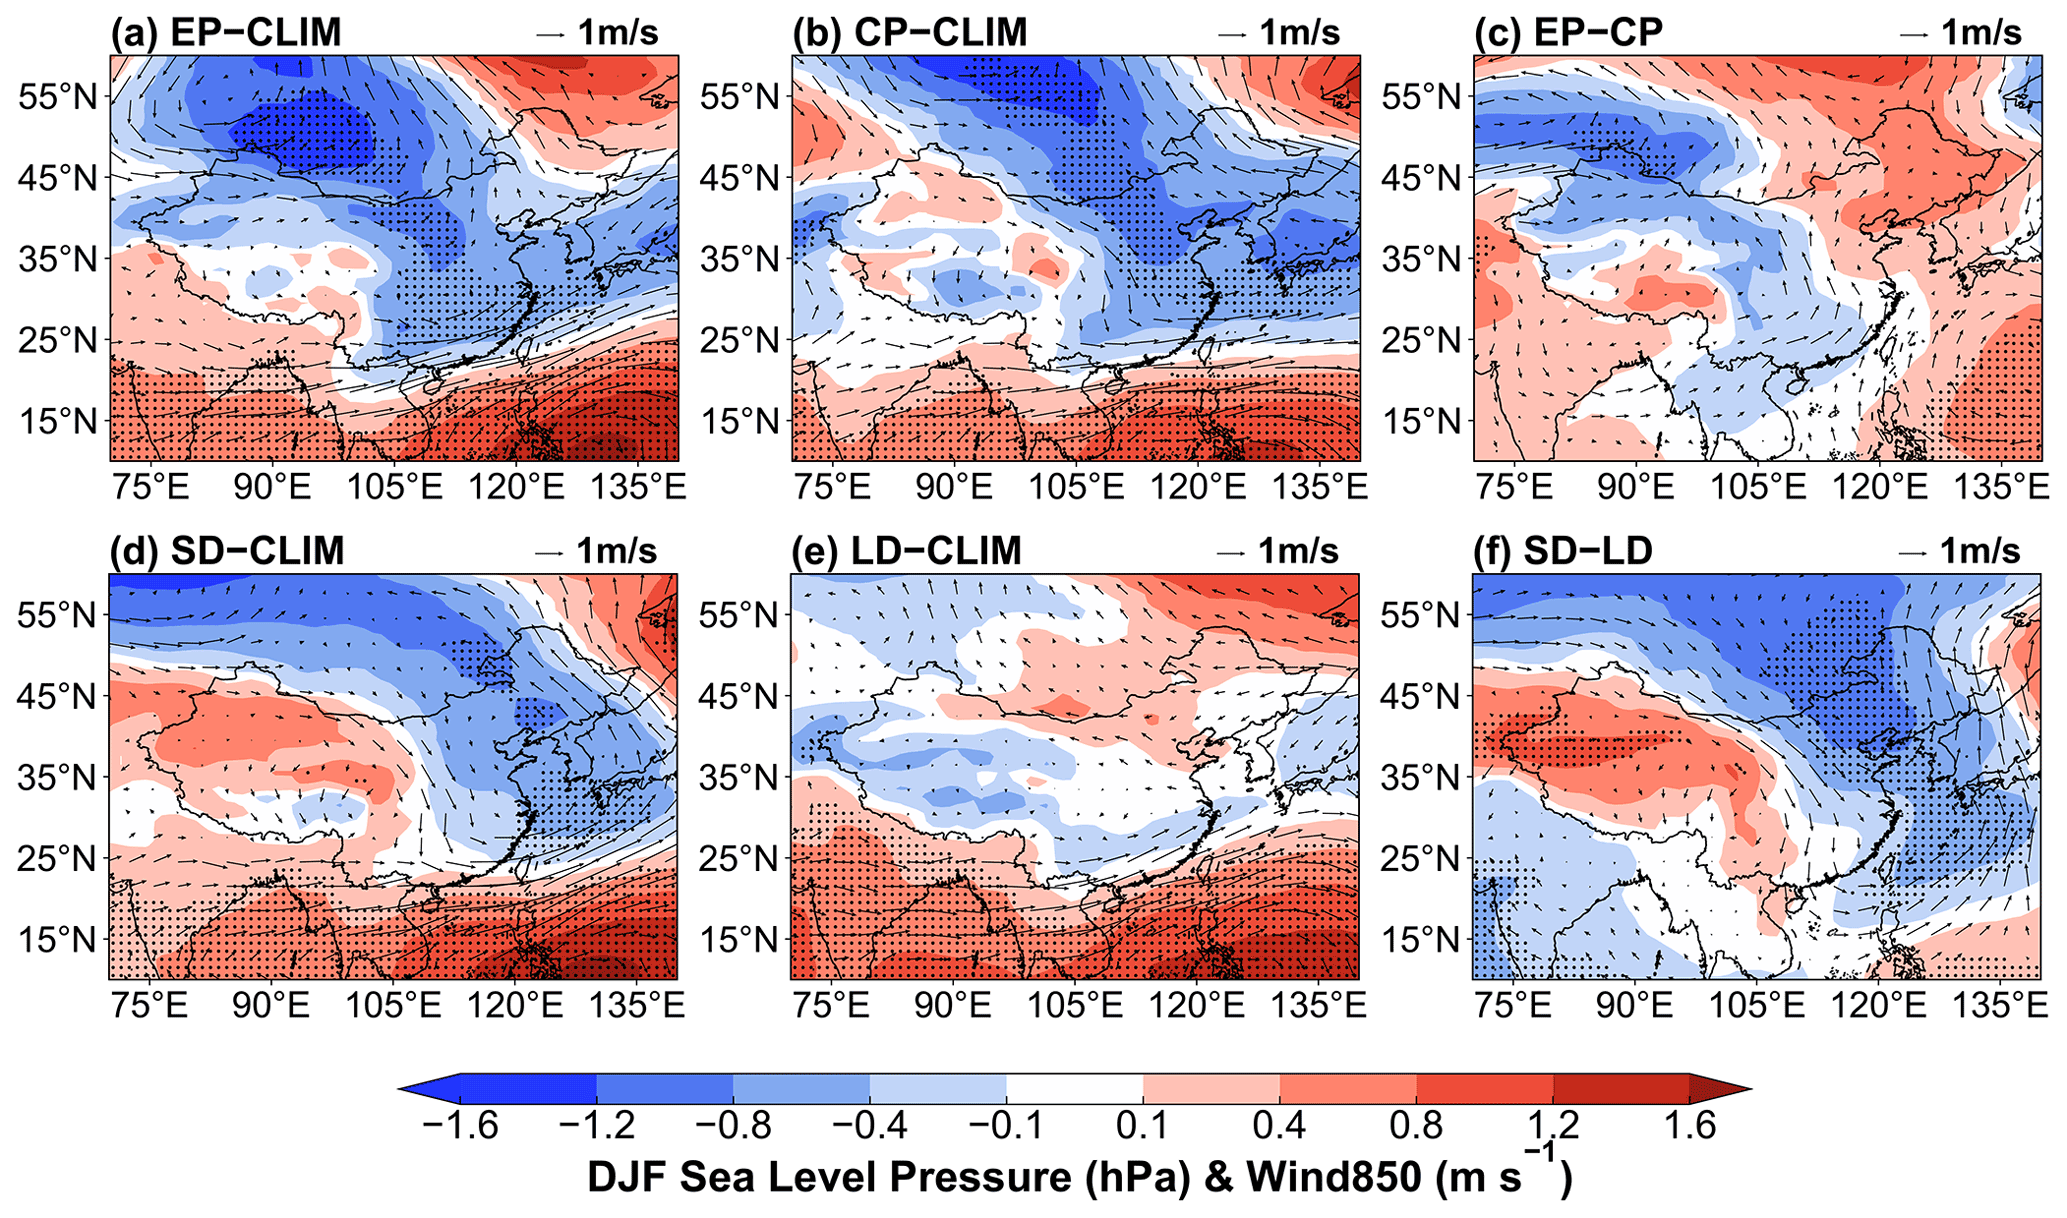
Figure 4Composite differences in DJF mean sea level pressure (SLP; shaded; units: hPa) and winds at 850 hPa (WIND850; vector; units: m s−1) between EP and CLIM in (a), CP and CLIM in (b), EP and CP in (c), SD and CLIM in (d), LD and CLIM in (e), and SD and LD in (f). The stippled areas indicate statistical significance with 90 % confidence from a two-tailed t test.
As for different temporal types of El Niño events, their effects on DJF dust concentrations over China are quite different. SD El Niño events cause an increase in DJF near-surface dust concentrations of 20–100 µg m−3 in northern China and about 5–20 µg m−3 in southern China, whereas during LD El Niño events, winter dust concentrations have a decrease of about 5–50 µg m−3 in northern and northeastern China relative to the climatology, and no significant change is shown in southern China. In contrast to LD El Niño events, SD El Niño events have positive DJF dust concentration anomalies of 5–20 µg m−3 in southern China and a maximum over 100 µg m−3 in northern China and the Gobi Desert. Furthermore, DJF dust concentrations over the Taklamakan Desert, one of the largest dust sources in China, have an increase during LD El Niño events and an insignificant decrease during SD El Niño events.
Overall, these changes in dust concentrations indicate that CP El Niño events have stronger and more widespread impacts on DJF dust concentrations than EP El Niño relative to the climatological mean, and the SD and LD El Niño events exert opposite impacts on DJF dust in China.
3.2 Mechanisms of the different El Niño impacts on winter dust
Meteorological factors such as 10 m wind speed, relative humidity, and atmospheric circulation play a dominant role in altering dust concentrations by altering emissions, atmospheric transport, and wet scavenging of dust (Csavina et al., 2014). Dust changes are also controlled by the El Niño-related changes in atmospheric circulation and precipitation (Gong et al., 2006; Hara et al., 2006). The 10 m wind speed, atmospheric circulation, relative humidity, precipitation anomalies, and related processes during EP, CP, SD, and LD El Niño are investigated here to reveal the mechanisms of the influence of the four types of El Niño on dust over China.

Figure 5Composite differences in DJF mean 10 m wind speed (m s−1) (a–c) and sea level pressure (SLP; shaded; units: hPa) and wind at 850 hPa (WIND850; vector; units: m s−1) (d–f) between 2006/07 EP El Niño and climatological mean (1950–2017) in (a) and (d), 2014/15 CP El Niño and climatological mean in (b) and (e), and 2006/07 EP El Niño and 2014/15 CP El Niño in (c) and (f) from the EAR5 reanalysis data. The data were detrended over 1950–2017.
During the CP, EP, and SD El Niño, DJF mean 10 m wind speed increases in the Gobi Desert and northwestern China compared to the climatological mean (Fig. 3), which favors the local dust emission over these regions, whereas for the LD El Niño event, the positive 10 m wind speed anomaly is greatly weakened compared to the other three types of El Niño events, and negative 10 m wind speed anomalies are triggered in the Gobi Desert and northern China (Fig. 3e), which is not conducive to dust emission during the LD El Niño events. The CP El Niño events trigger stronger positive 10 m wind speed anomalies (0.1–0.3 m s−1) than the EP El Niño events over the Gobi Desert and northern China (Fig. 3c), which could lead to a greater local dust emission. Compared to the LD El Niño, SD El Niño events produce significant positive 10 m wind speed anomalies of approximately 0.3 m s−1 in the Gobi Desert and northern China (Fig. 3f), which is consistent with the increase (decrease) in local DJF dust concentrations during the SD (LD) El Niño (Fig. 2). This suggests the importance of 10 m wind speed in the dust changes during the El Niño events in China.
Figure 4 shows the atmospheric circulation anomalies for the four El Niño events. All types of El Niño have negative anomalies of sea level pressure (SLP) in central-eastern China, except the LD El Niño, which shows a negligible SLP change in winter. Meanwhile, during the EP, CP, and SD El Niño events, anomalous Mongolian cyclones can strengthen the local ascending flow to lift more dust particles into the free atmosphere. The anomalous northwesterly during CP and SD El Niño (Fig. 3b and d) can transport these dust aerosols to central-eastern China, leading to the strong increases in dust concentrations there (Fig. 2b and d), while during the LD El Niño, the lower atmosphere in the Gobi Desert and northern China is controlled by a weak anomalous high pressure accompanied by an anomalous southeasterly that weakens the prevailing northwesterly in winter and hinders the vertical lifting and southward transport of dust.
Our previous work has confirmed the ability of E3SM in capturing the atmospheric circulation over central-eastern China in El Niño with different durations (Zeng et al., 2021). Here we further evaluate the circulations in E3SM simulations during EP and CP El Niño events by using ERA5 reanalysis data. The anomalous DJF mean 10 m wind speed and 850 hPa wind fields in the typical EP El Niño (2006/07) and CP El Niño (2014/15) relative to the climatology (1950–2017) from ERA5 are presented in Fig. 5. Although the increase in 10 m wind speed over northwestern China in the EP El Niño simulated in the model is inconsistent with the ERA5 results, E3SM does capture the large increase in wind speed over the Gobi Desert during the CP El Niño relative to the climatological mean and EP El Niño. Moreover, the anomalies in wind fields during EP and CP El Niño (i.e., anomalous southerly during EP El Niño and anomalous northwesterly during CP El Niño) can be simulated by E3SM. It suggests that the atmospheric circulation features over central-eastern China during different types of El Niño are roughly captured by the model. However, we note that there are notable differences in atmospheric circulation over many regions of East Asia. It can be partly attributed to the model bias in reproducing the atmospheric responses to El Niño. The observations can also be induced by other climate factors besides El Niño, leading to a potential inconsistency in El Niño impact between model and observation.
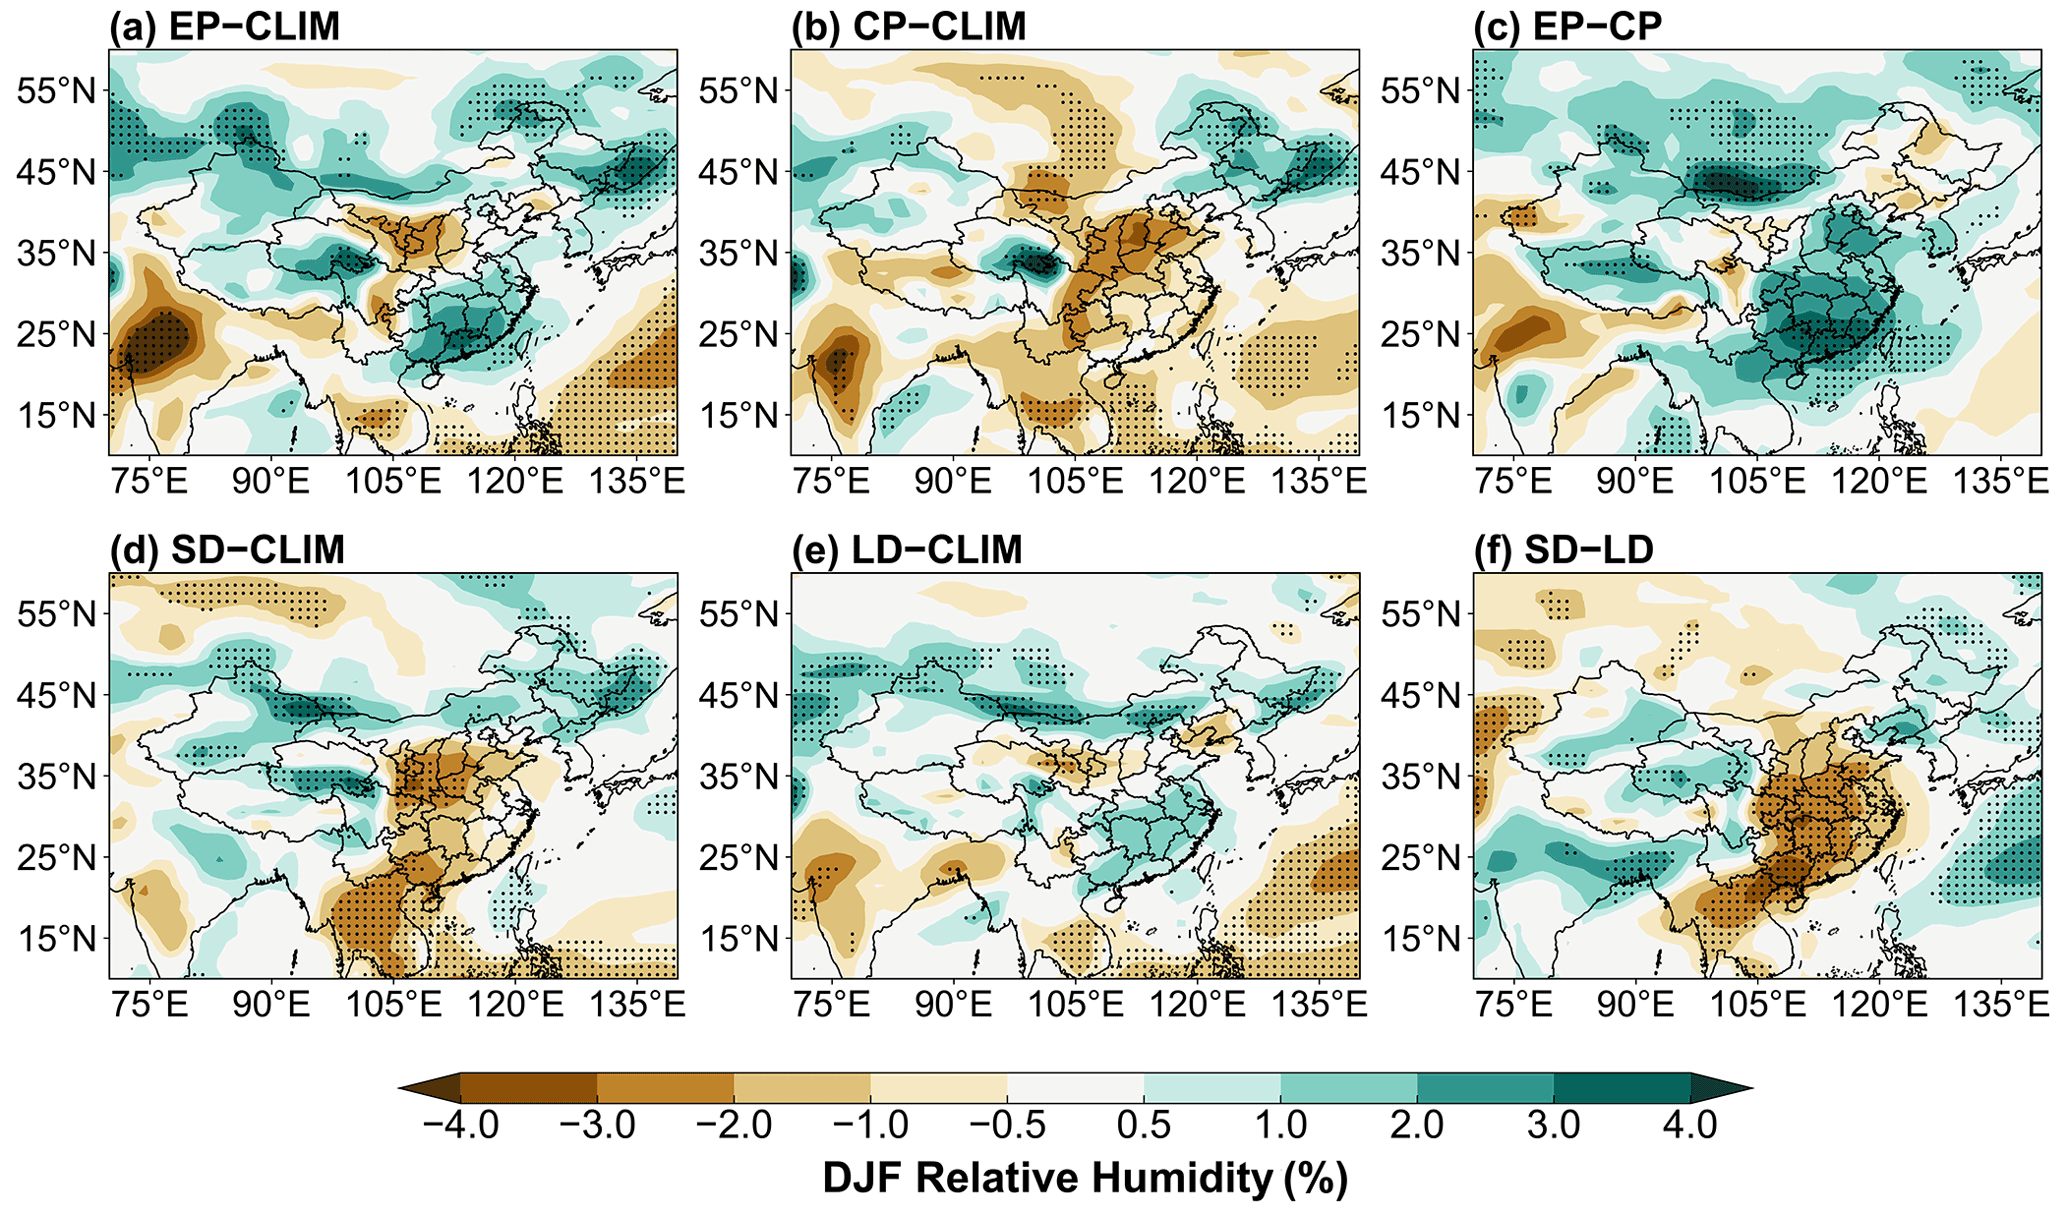
Figure 6Composite differences in DJF mean relative humidity (%) between EP and CLIM in (a), CP and CLIM in (b), EP and CP in (c), SD and CLIM in (d), LD and CLIM in (e), and SD and LD in (f). The stippled areas indicate statistical significance with 90 % confidence from a two-tailed t test.
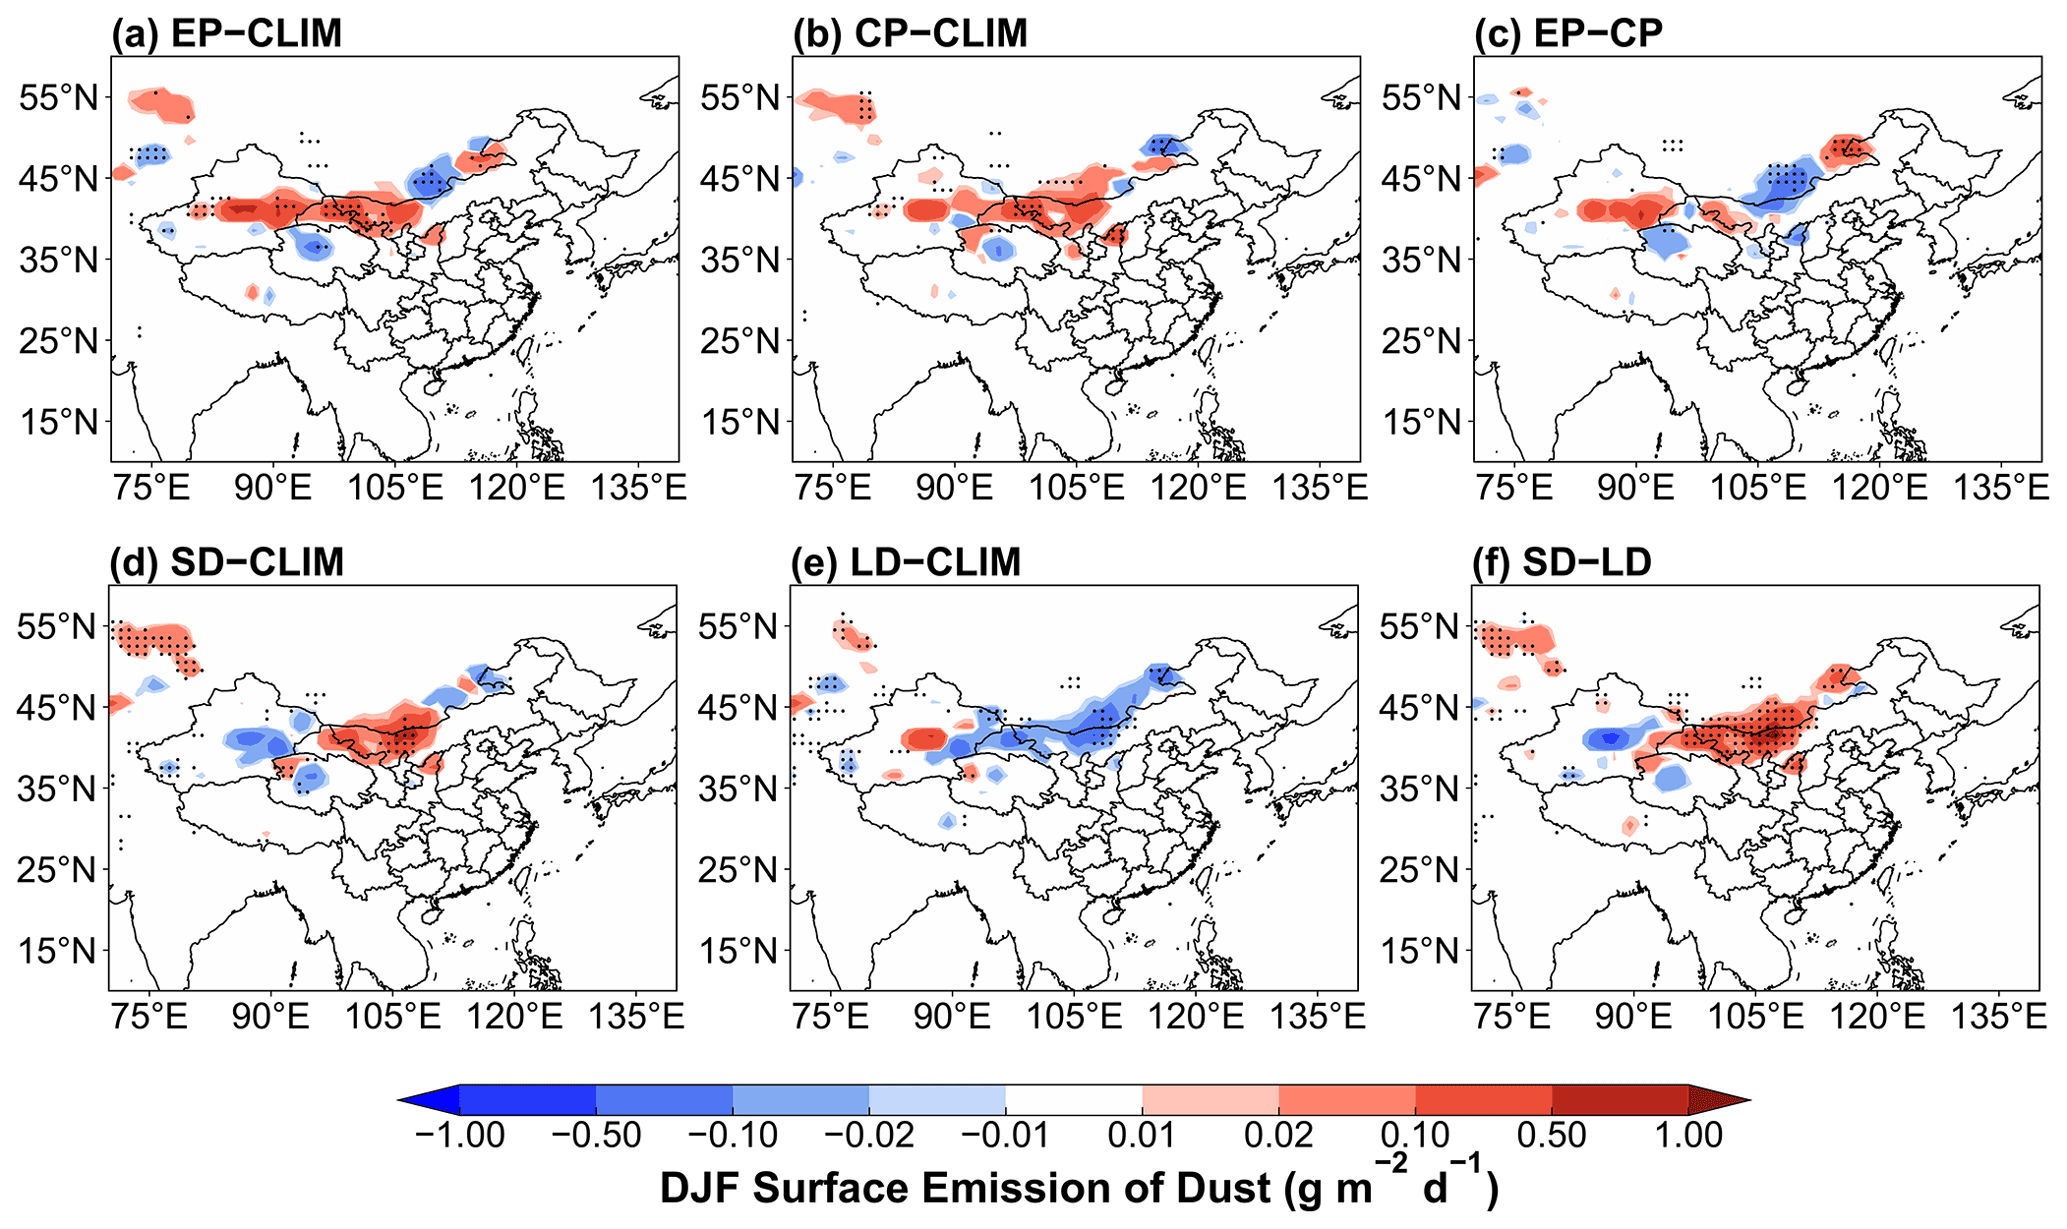
Figure 7Composite differences in DJF mean dust emissions (g m−2 d−1) between EP and CLIM in (a), CP and CLIM in (b), EP and CP in (c), SD and CLIM in (d), LD and CLIM in (e), and SD and LD in (f). The stippled areas indicate statistical significance with 90 % confidence from a two-tailed t test.
The effect of relative humidity (RH) on dust concentration is also essential, considering that a decrease in RH leads to a decrease in the threshold friction velocity at high RHs (>40 %), which further enhances dust emission flux and atmospheric concentration (Csavina et al., 2014). Both EP and CP El Niño events have negative anomalies in DJF RH in the Gobi Desert (Fig. 6a and b). The decrease in RH reduces the dust threshold friction velocity and favors dust emission from the Gobi Desert. The CP El Niño produces more pronounced and widespread negative RH anomalies in the Gobi Desert and northwestern China than the EP El Niño. It gives approximately 3 % stronger negative RH anomalies (Fig. 6c), resulting in stronger and more widespread increases in DJF dust concentrations during the CP El Niño event (Fig. 2c). As for El Niño with different duration, the SD El Niño leads to significant decreases in DJF RH of about 3 % near the southern part of the Gobi Desert, while increases in RH are located over the northern part of the Gobi Desert during the LD El Niño (Fig. 6g and j), likely resulting in opposite changes in dust emissions. The ERA5 reanalysis data also show the same RH variations during the different spatial and temporal types of El Niño as the E3SM simulations described above (Fig. S4). Among all four types of El Niño events, RH anomalies are consistent with the distribution of dust concentration anomalies, which indicates that RH plays an important role in affecting variations in dust emissions and concentrations in China during El Niño.
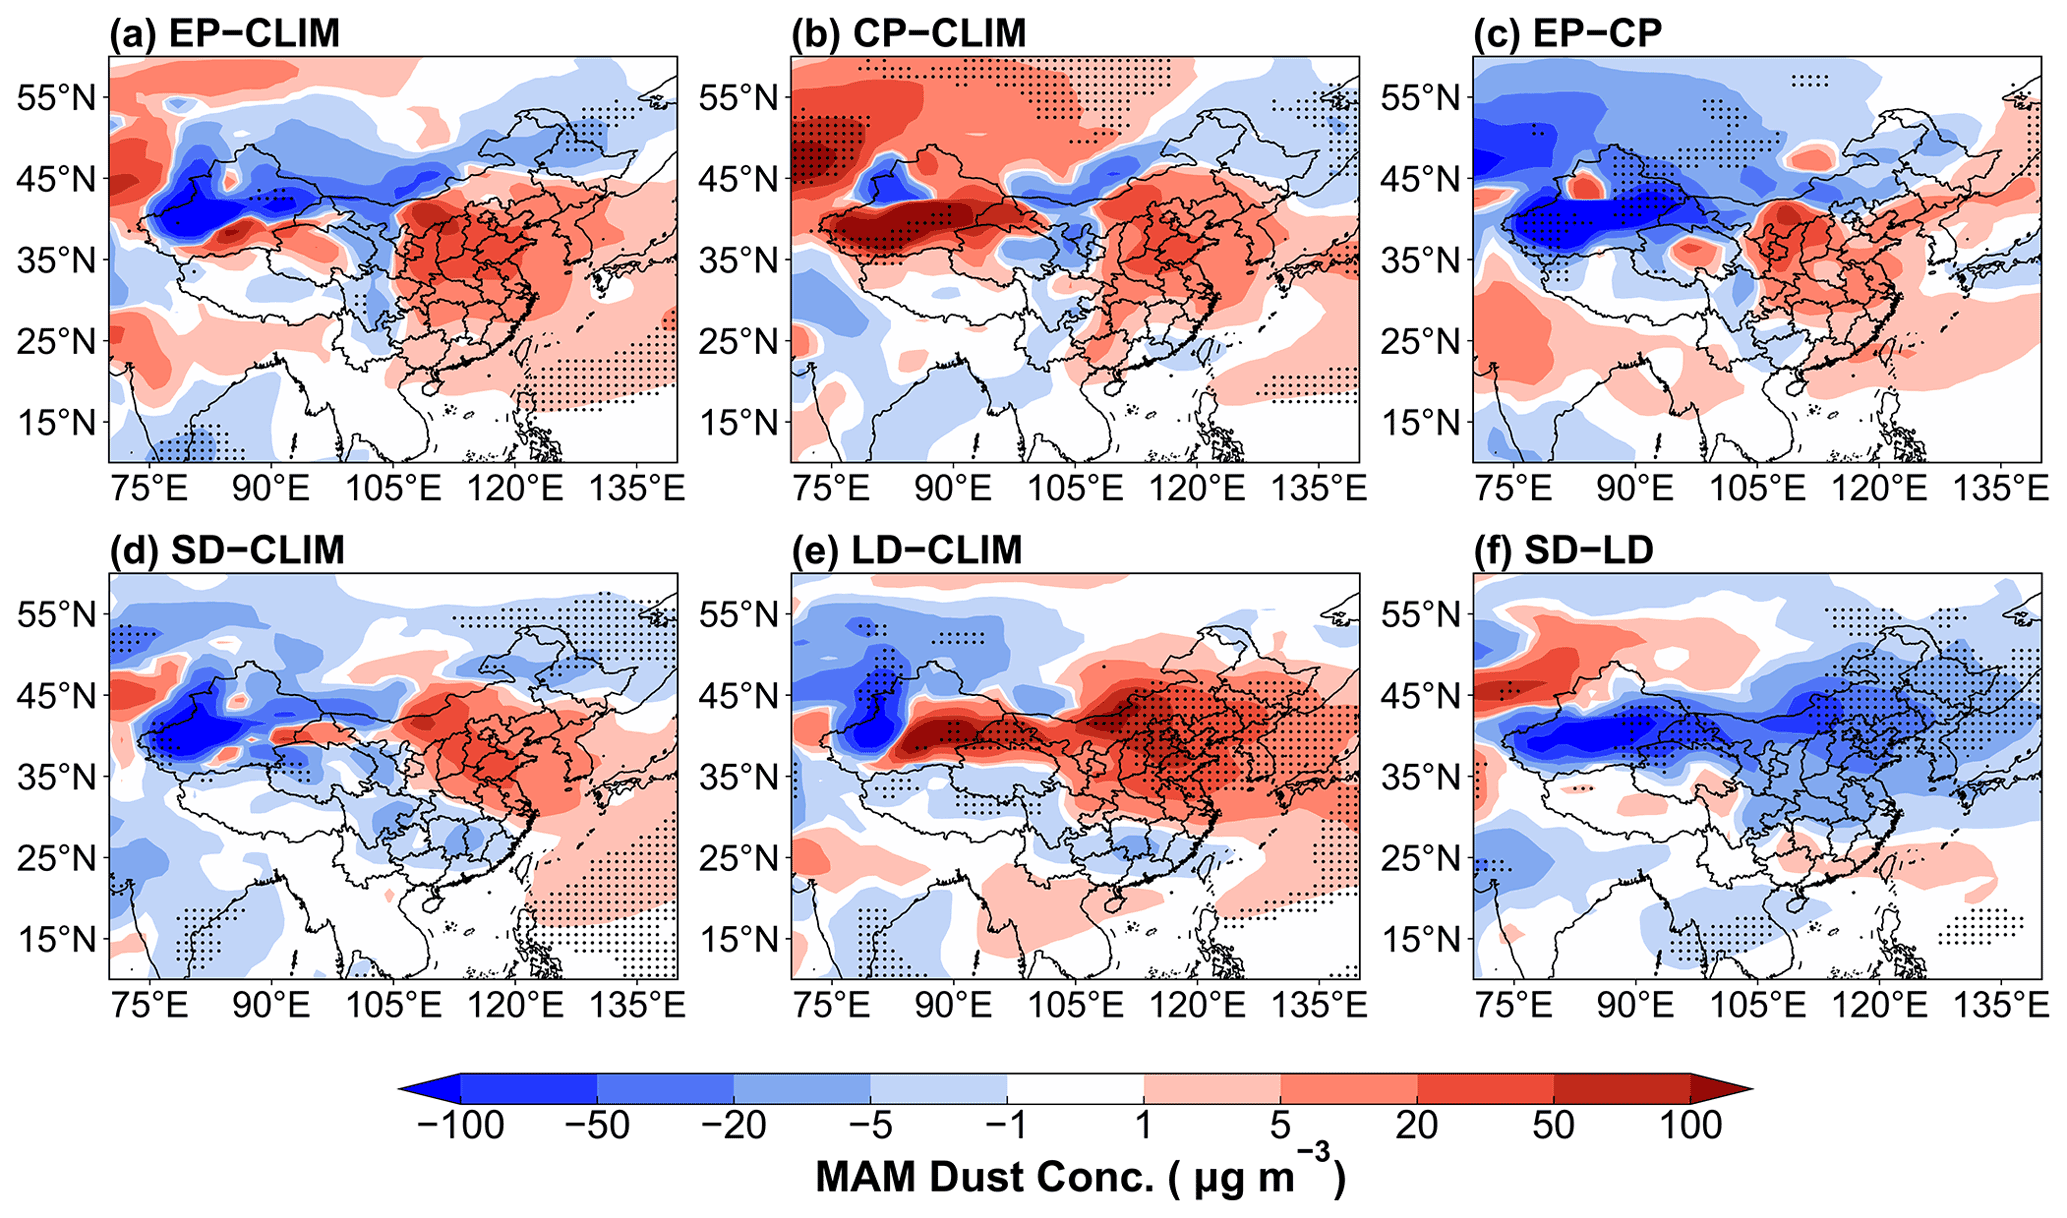
Figure 8Composite differences in MAM mean near-surface dust concentrations (µg m−3) between EP and CLIM in (a), CP and CLIM in (b), EP and CP in (c), SD and CLIM in (d), LD and CLIM in (e), and SD and LD in (f). The stippled areas indicate statistical significance with 90 % confidence from a two-tailed t test.
Figure 7 shows the simulated changes in DJF dust emissions during different El Niño events. During the EP and CP El Niño, DJF dust emissions are enhanced in the Gobi Desert and northwestern China relative to the climatological average. The dust emission increase is larger during the CP El Niño than the EP El Niño, which is consistent with the higher positive DJF dust concentration anomalies during the CP El Niño. Furthermore, the SD El Niño causes a significant increase in dust emissions of about 0.5 g m−2 d−1 in the Gobi Desert compared to CLIM, while the LD El Niño causes a decrease in dust emissions. These suggest that different types of El Niño events alter the DJF dust emissions in China by changing the 10 m wind speed and RH, which is an important cause of the variation in DJF dust concentrations in China.
Furthermore, a reduced DJF precipitation during both EP and CP El Niño events (Fig. S5) should weaken the wet removal of dust from the atmosphere in northern China. However, only insignificant decreases in wet deposition appear in part of northern China, and significant increases in wet deposition are located in central and southern China related to increases in dust loading during EP and CP El Niño events (Fig. S6). It suggests that El Niño impact on dust concentrations is mainly through changing the emission and transport of dust rather than the scavenging in winter.
3.3 Spring dust pollution affected by El Niño events
The changes in near-surface dust concentrations over China in the following spring during the decaying phase for different spatial and temporal types of El Niño are also examined (Fig. 8). During the following spring, all El Niño events trigger large positive anomalies of March–April–May (MAM) dust concentrations in northern China. However, the increases in dust concentrations during the EP, CP, and SD El Niño relative to the climatological average fail the 90 % significance test, indicating that the effects of these types of El Niño events on the dust pollution in northern China in the following spring are uncertain, likely related to the large internal variability in the climate system. In contrast to the strong reduction in dust concentrations over the Gobi Desert and northern China during the LD El Niño in DJF, the effect in MAM reverses to a significant increase in dust concentrations over these regions by 50–100 µg m−3 (Fig. 8e). It suggests that the weaker intensity but longer duration of LD El Niño than the SD El Niño can significantly affect spring dust aerosols in China.
During LD El Niño events, MAM 10 m wind speed significantly increases over the Gobi Desert (Fig. S7), which facilitates the local dust emissions, although RH only shows an insignificant decrease over the dust source region (Fig. S8). It can be confirmed by the significant increases in MAM dust emissions by about 0.5 g m−2 d−1 over the Gobi Desert and northwestern China during LD El Niño events (Fig. 9). Then the strengthened northwesterly brings more dust to northern China during LD El Niño events (Fig. S9). Along the transport pathway, the weakened precipitation (Fig. S10) partly reduces the dust wet removal (Fig. S11), leading to the strong increase in MAM dust concentration over northern China during the LD El Niño. However, this effect is largely overwhelmed by the increased dust wet removal due to the emission-induced increase in dust concentrations.
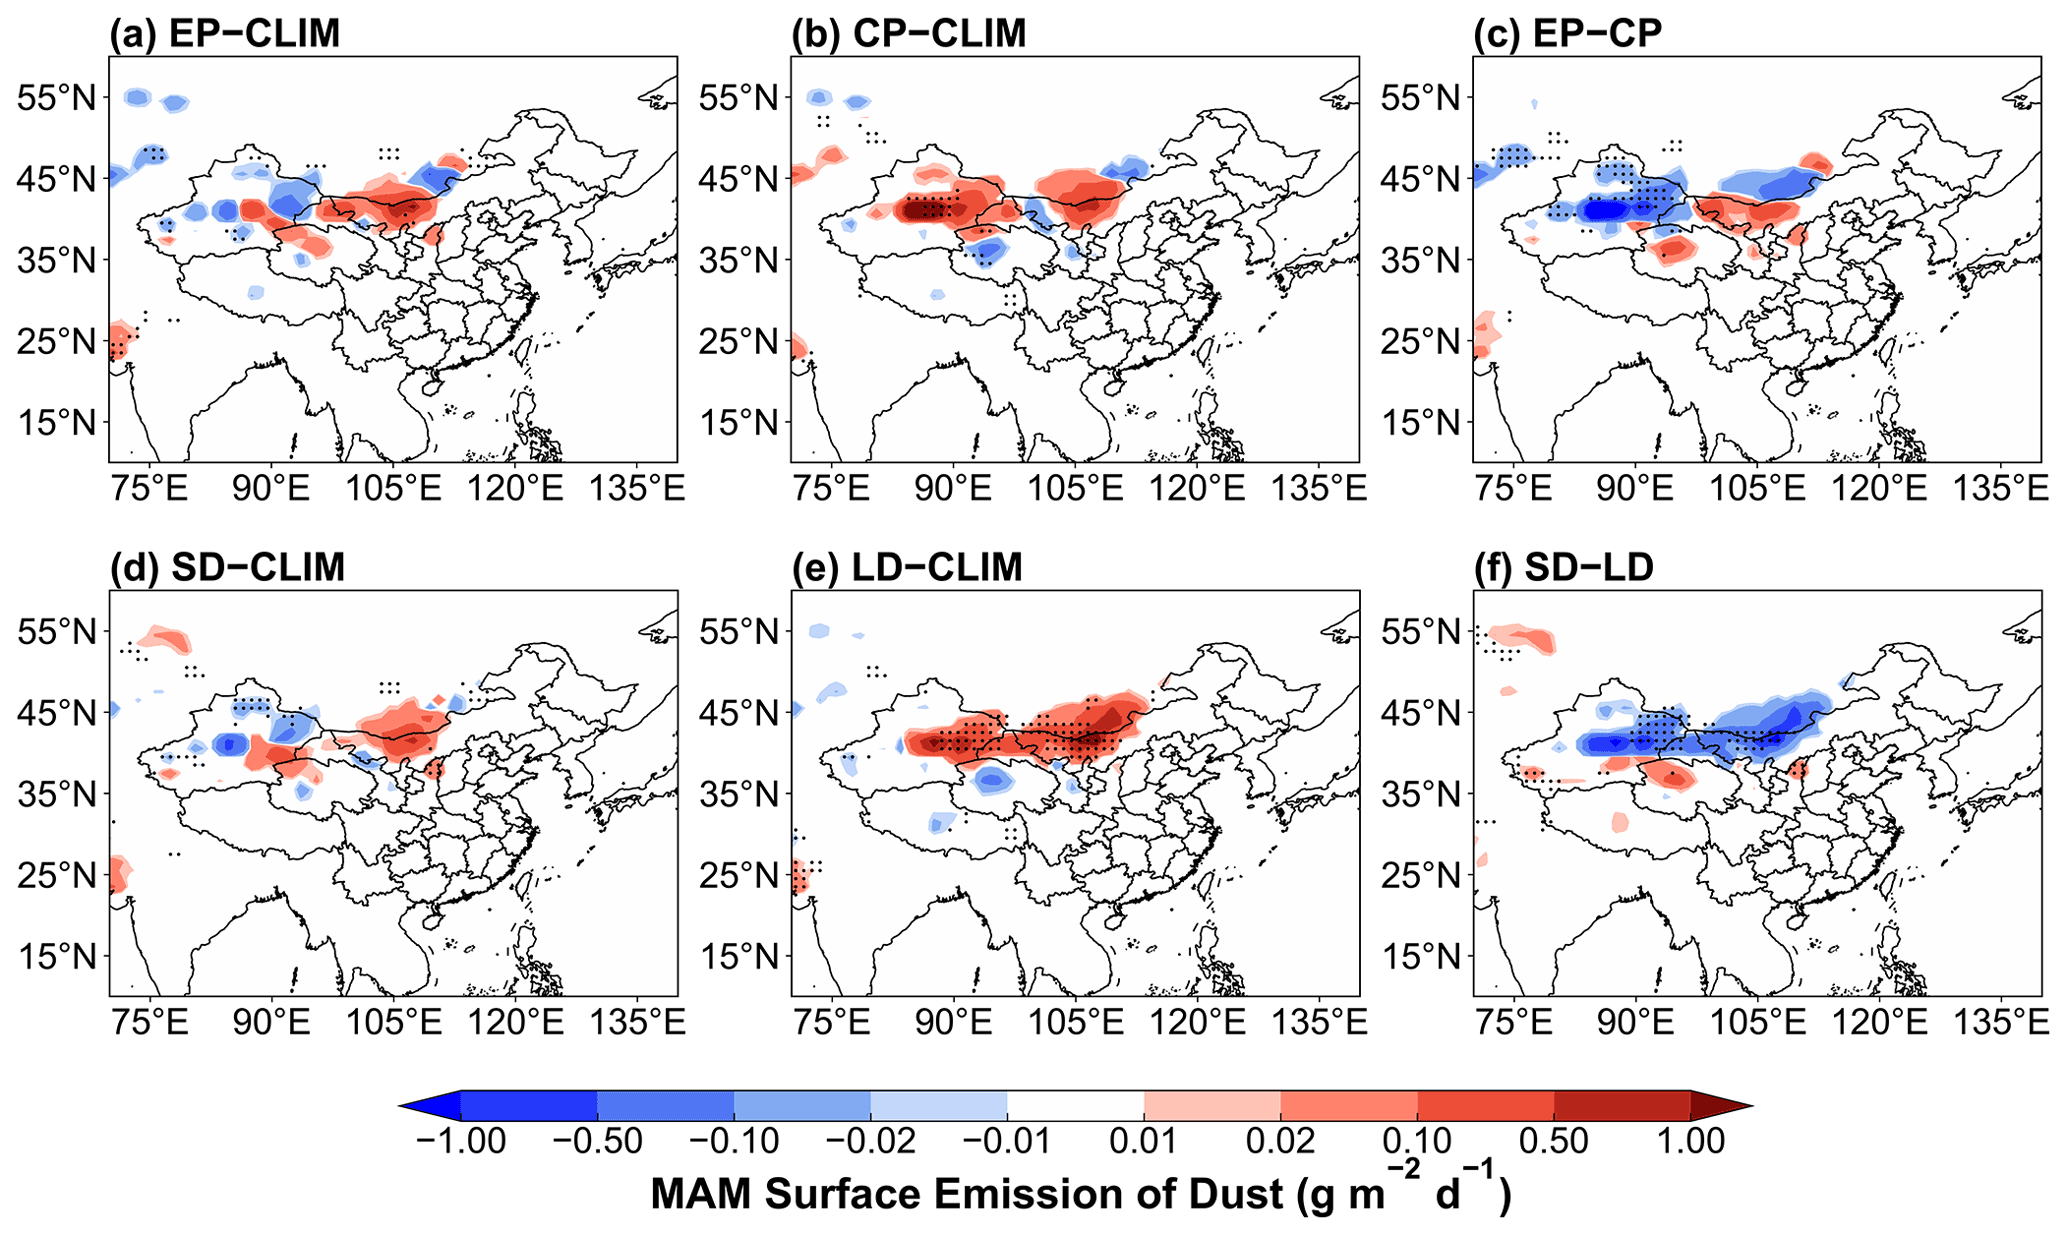
Figure 9Composite differences in MAM mean dust emissions (g m−2 d−1) between EP and CLIM in (a), CP and CLIM in (b), EP and CP in (c), SD and CLIM in (d), LD and CLIM in (e), and SD and LD in (f). The stippled areas indicate statistical significance with 90 % confidence from a two-tailed t test.
Dust, as an important air pollutant affecting air quality in China in winter and spring, can be modulated by the interannual variations in El Niño-induced atmospheric circulation and precipitation anomalies. In this study, the state-of-the-art E3SM model is used to simulate the effects of different temporal types of El Niño events with short (SD) and long duration (LD) and different spatial locations of El Niño events with sea surface temperature anomalies located in the central Pacific (CP) and eastern Pacific (EP) on dust concentrations in China.
Both CP and EP El Niño events cause 5–50 µg m−3 positive anomalies in winter (DJF months) surface dust concentrations in central-eastern China. Compared to the EP El Niño, the CP El Niño triggers a stronger wind and negative RH anomalies that lead to greater local dust emissions. Then the anomalous northwesterly transports the dust aerosols to central-eastern China during the CP El Niño, resulting in 5–20 µg m−3 higher dust concentrations and more widespread DJF dust concentration increases in northern China, although the changes are mostly statistically insignificant. For the different temporal types of El Niño events, wind speed significantly increases over the Gobi Desert and northern China during the SD El Niño, favoring dust emissions. Meanwhile, the anomalous northwesterly can increase the transport of dust aerosols to central-eastern China, leading to an increase in DJF near-surface dust concentrations of 20–100 µg m−3 in northern China and 5–20 µg m−3 in southern China relative to the climatological mean. In contrast, the LD El Niño reduces wind speed over the Gobi Desert and northern China, which weakens dust emissions, accompanied by the atmospheric circulation anomalies unfavorable for dust transport, leading to the DJF dust concentration decrease by 5–50 µg m−3 in northern and northeastern China relative to the climatological mean.
In the following spring season, the four types of El Niño events with different durations and spatial positions all cause positive dust concentration anomalies in northern China. However, only the changes during the LD El Niño are statistically significant. This is mainly due to an increase in 10 m wind speed over the Gobi Desert during the LD El Niño, which enhances the local dust emissions, and then the strengthened northwesterly brings more dust to northern China. It suggests that the weaker intensity but longer duration of LD El Niño events than SD El Niño can significantly affect dust aerosols in China in spring.
The mechanisms for the differences in the atmospheric anomalies between different types of El Niño have been illustrated in many studies. Western North Pacific anomalous anticyclones (WNPACs), which occur during both EP and CP El Niño events, have been proven to be a crucial system that links El Niño and East Asian climate (Li et al., 2017). The anomalous southwesterlies in the north of WNPACs transport moisture to southern China, which can block the prevailing northerlies over central-eastern China in winter and weaken the East Asian winter monsoon (Yuan and Yang, 2012). EP El Niño exerts larger meteorological changes over southern China than CP El Niño due to a stronger WNPAC (Jiang and Li, 2022; Kim et al., 2021). Therefore, the anomalous northerlies over the Gobi Desert and central China are hindered and weaker during EP El Niño than CP El Niño (Fig. 4). SD El Niño has a relatively deeper thermocline during its mature phase than LD El Niño, and a vast amount of ocean heat can be transported from the eastern Pacific to the South China Sea and the western Philippine Sea during SD El Niño (Guo and Tan, 2018). The transmitted ocean heat leads to anomalous warming of the North Pacific SST, a smaller-than-normal tilt of the East Asian trough, a weakening of the mid-latitude westerly flow in front of the trough, and anomalous northerly winds along the trough line of the subtropical trough, along with reduced precipitation (Wang et al., 2009). These favor dust emission and transport from north to south during SD El Niño.
In this study, the dust concentrations are evaluated by comparing modeled concentrations with MAM PM10 concentrations, and the dust loading is also evaluated by comparing modeled DOD with that derived from satellite data. However, the anomalies of dust concentrations were not compared with observations. This is because that dust is jointly influenced by many factors in the observation other than El Niño, such as Mongolian cyclones, sea ice in the Barents Sea, sea surface temperature in Atlantic Ocean, Arctic Oscillation, and human activities (Fan et al., 2016, 2018; Mao et al., 2011; Wang et al., 2021; Xiao et al., 2015; Yin et al., 2021), while this study presents the “pure” effects of El Niño on dust using an Earth system model. In addition, PM10 is strongly influenced by other anthropogenic aerosols over eastern China, especially in hazy winter. The comprehensive understanding of the impacts from different types of El Niño events on dust in China requires a longer-term observation with sufficient spatial coverage.
Our results contribute to the current knowledge of the vital influence of different types of El Niño on dust pollution in winter and spring over China, which have profound implications for air pollution control and dust storm prediction in China. Notwithstanding, we also note that the E3SMv1 overestimates dust emissions from the source regions and underestimates the long-range transport of dust (Wu et al., 2020; Feng et al., 2022). This high bias of dust loading near the dust source regions is related to the dust treatment in the model, dust parameterization, and stronger winds in the model than in the observations. The low bias of long-range transport of dust is due to the strong dust deposition considering that dust is emitted in the shallow bottom layer in the model. Therefore, the estimate of El Niño impact on dust emissions and concentrations is likely to be overestimated near the source regions, but the impact from changes in large-scale circulation related to El Niño on dust transport is possibly underestimated. Also, results from a single model with relatively short simulations may not be representative and may not remove the internal atmospheric variability very well (Deser et al., 2014), which can be further investigated by conducting large-ensemble and longer simulations using multi-models. In future studies, the influences of different types of La Niña, the cooling phase of ENSO, on dust pollution in China warrant further investigation. Besides, other natural aerosols, such as sea salt, are also influenced by El Niño events, which is not taken into account in this study. In addition to natural sources, dust in China can also be from anthropogenic emissions (Chen et al., 2019; Xia et al., 2022), and their relations with El Niño require further study.
The E3SMv1 model is available at https://github.com/E3SM-Project/E3SM (last access: 1 October 2022) (https://doi.org/10.11578/E3SM/dc.20180418.36; E3SM Project, 2018). Our results can be made available upon request.
The supplement related to this article is available online at: https://doi.org/10.5194/acp-22-14489-2022-supplement.
YY designed the research and analyzed the data. LZ performed the model simulations. All the authors including HW, PW, and HL discussed the results and wrote the paper.
At least one of the (co-)authors is a member of the editorial board of Atmospheric Chemistry and Physics. The peer-review process was guided by an independent editor, and the authors also have no other competing interests to declare.
Publisher's note: Copernicus Publications remains neutral with regard to jurisdictional claims in published maps and institutional affiliations.
Hailong Wang acknowledges the support by the US Department of Energy (DOE), Office of Science, Office of Biological and Environmental Research (BER), as part of the Earth and Environmental System Modeling program. The Pacific Northwest National Laboratory (PNNL) is operated for the DOE by the Battelle Memorial Institute under contract DE-AC05-76RLO1830.
This study was supported by the National Natural Science Foundation of China (grant no. 41975159), the National Key Research and Development Program of China (grant nos. 2020YFA0607803 and 2019YFA0606800), and the Jiangsu Science Fund for Distinguished Young Scholars (grant no. BK20211541).
This paper was edited by Matthias Tesche and reviewed by two anonymous referees.
Chen, S. Y., Huang, J. P., Li, J. X., Jia, R., Jiang, N. X., Kang, L. T., Ma, X. J., and Xie, T. T.: Comparison of dust emissions, transport, and deposition between the Taklimakan Desert and Gobi Desert from 2007 to 2011, Sci. China Earth Sci., 60, 1338–1355, https://doi.org/10.1007/s11430-016-9051-0, 2017.
Chen, S., Zhang, X., Lin, J., Huang, J., Zhao, D., Yuan, T., Huang, K., Luo, Y., Jia, Z., and Zang, Z.: Fugitive Road Dust PM2.5 Emissions and Their Potential Health Impacts, Environ. Sci. Technol., 53, 8455–8465, https://doi.org/10.1021/acs.est.9b00666, 2019.
Csavina, J., Field, J., Felix, O., Corral-Avitia, A. Y., Saez, A. E., and Betterton, E. A.: Effect of wind speed and relative humidity on atmospheric dust concentrations in semi-arid climates, Sci. Total Environ., 487, 82–90, https://doi.org/10.1016/j.scitotenv.2014.03.138, 2014.
Deser, C., Phillips, A. S., Alexander, M. A., and Smoliak, B. V.: Projecting North American climate over the next 50 years: uncertainty due to internal variability, J. Climate, 27, 2271–2296, https://doi.org/10.1175/JCLI-D-13-00451.1, 2014.
E3SM Project: Energy Exascale Earth System Model v1.0: Computer Software, DOE [data set], https://doi.org/10.11578/E3SM/dc.20180418.36, 2018.
Fan, K., Xie, Z., and Xu, Z.: Two different periods of high dust weather frequency in northern China, Atmos. Ocean. Sci. Lett., 9, 263–269, https://doi.org/10.1080/16742834.2016.1176300, 2016.
Fan, K., Xie, Z., Wang, H., Xu, Z., and Liu, J.: Frequency of spring dust weather in North China linked to sea ice variability in the Barents Sea, Clim. Dynam, 51, 4439–4450, https://doi.org/10.1007/s00382-016-3515-7, 2018.
Feng, Y., Wang, H., Rasch, P. J., Zhang, K., Lin, W., Tang, Q., Xie, S., Hamilton, D. S., Mahowald, N., and Yu, H.: Global dust cycle and direct radiative effect in the E3SM version 1: Impact of increasing model resolution, J. Adv. Model. Earth Sys., 14, e2021MS002909, https://doi.org/10.1029/2021MS002909, 2022.
Golaz, J. C., Caldwell, P. M., Van Roekel, L. P., Petersen, M. R., Tang, Q., Wolfe, J. D., Abeshu, G., Anantharaj, V., Asay, X. S., Bader, D. C., Baldwin, S. A., Bisht, G., Bogenschutz, P. A., Branstetter, M., Brunke, M. A., Brus, S. R., Burrows, S. M., Cameron, P. J., Donahue, A. S., Deakin, M., Easter, R. C., Evans, K. J., Feng, Y., Flanner, M., Foucar, J. G., Fyke, J. G., Griffin, B. M., Hannay, C., Harrop, B. E., Hoffman, M. J., Hunke, E. C., Jacob, R. L., Jacobsen, D. W., Jeffery, N., Jones, P. W., Keen, N. D., Klein, S. A., Larson, V. E., Leung, L. R., Li, H. Y., Lin, W., Lipscomb, W. H., Ma, P. L., Mahajan, S., Maltrud, M. E., Mametjanov, A., McClean, J. L., McCoy, R. B., Neale, R. B., Price, S. F., Qian, Y., Rasch, P. J., Reeves Eyre, J. E. J., Riley, W. J., Ringler, T. D., Roberts, A. F., Roesler, E. L., Salinger, A. G., Shaheen, Z., Shi, X., Singh, B., Tang, J., Taylor, M. A., Thornton, P. E., Turner, A. K., Veneziani, M., Wan, H., Wang, H., Wang, S., Williams, D. N., Wolfram, P. J., Worley, P. H., Xie, S., Yang, Y., Yoon, J. H., Zelinka, M. D., Zender, C. S., Zeng, X., Zhang, C., Zhang, K., Zhang, Y., Zheng, X., Zhou, T., and Zhu, Q.: The DOE E3SM Coupled Model Version 1: Overview and Evaluation at Standard Resolution, J. Adv. Model. Earth Sys., 11, 2089–2129, https://doi.org/10.1029/2018MS001603, 2019.
Gong, S. L., Zhang, X. Y., Zhao, T. L., Zhang, X. B., Barrie, L. A., McKendry, I. G., and Zhao, C. S.: A Simulated Climatology of Asian Dust Aerosol and Its Trans-Pacific Transport, Part I: Interannual Variability and Climate, J. Climate, 19, 104–122, https://doi.org/10.1175/JCLI3606.1, 2006.
Goudie, A. S.: Desert dust and human health disorders, Environ. Int., 63, 101–113, https://doi.org/10.1016/j.envint.2013.10.011, 2014.
Guo, J., Xu, H., Liu, L., Chen, D., Peng, Y., Yim, S. H.-L., Yang, Y., Li, J., Zhao, C., and Zhai, P.: The trend reversal of dust aerosol over East Asia and the North Pacific Ocean attributed to large-scale meteorology, deposition, and soil moisture. J. Geophys. Res. Atmos., 124, 10450–10466. https://doi.org/10.1029/2019JD030654, 2019.
Guo, Y. and Tan, Z.: Westward migration of tropical cyclone rapid-intensification over the Northwestern Pacific during short duration El Nino, Nat. Commun., 9, 1507, https://doi.org/10.1038/s41467-018-03945-y, 2018.
Hara, Y., Uno, I., and Wang, Z.: Long-term variation of Asian dust and related climate factors, Atmos. Environ. 40, 6730–6740, https://doi.org/10.1016/j.atmosenv.2006.05.080, 2006.
Hersbach, H., Bell, B., Berrisford, P., Hirahara, S., Horányi, A., Muñoz-Sabater, J., Nicolas, J., Peubey, C., Radu, R., Schepers, D., Simmons, A., Soci, C., Abdalla, S., Abellan, X., Balsamo, G., Bechtold, P., Biavati, G., Bidlot, J., Bonavita, M., Chiara, G. D., Dahlgren, P., Dee, D., Diamantakis, M., Dragani, R., Flemming, J., Forbes, R., Fuentes, M., Geer, A., Haimberger, L., Healy, S., Hogan, R. J., Hólm, E., Janisková, M., Keeley, S., Laloyaux, P., Lopez, P., Lupu, C., Radnoti, G., Rosnay, P. de, Rozum, I., Vamborg, F., Villaume, S., and Thépaut, J.-N.: The ERA5 Global Reanalysis, Q. J. Roy. Meteor. Soc., 146, 1999–2049, https://doi.org/10.1002/qj.3803, 2020.
Huang, J., Wang, T., Wang, W., Li, Z., and Yan, H.: Climate effects of dust aerosols over East Asian arid and semiarid regions, J. Geophys. Res.-Atmos., 119, 11398–11416, https://doi.org/10.1002/2014JD021796, 2014.
Hurrell, J. W., Hack, J. J., Shea, D., Caron, J. M., and Rosinski, J.: A new sea surface temperature and sea ice boundary dataset for the Community Atmosphere Model, J. Climate, 21, 5145–5153, https://doi.org/10.1175/2008jcli2292.1, 2008.
Jiang, Z. and Li, J.: Impact of eastern and central Pacific El Niño on lower tropospheric ozone in China, Atmos. Chem. Phys., 22, 7273–7285, https://doi.org/10.5194/acp-22-7273-2022, 2022.
Kao, H.-Y. and Yu, J.-Y.: Contrasting Eastern-Pacific and Central-Pacific Types of ENSO, J. Climate, 22, 615–632, https://doi.org/10.1175/2008jcli2309.1, 2009.
Kim, J., Chang, T., Lee, C., and Yu, J.: On the Varying Responses of East Asian Winter Monsoon to Three Types of El Niño: Observations and Model Hindcasts, J. Climate, 34, 4089–4101, https://doi.org/10.1175/JCLI-D-20-0784.1, 2021.
Kok, J. F., Ward, D. S., Mahowald, N. M., and Evan, A. T.: Global and regional importance of the direct dust-climate feedback, Nat. Commun., 9, 241, https://doi.org/10.1038/s41467-017-02620-y, 2018.
Le, T. and Bae, D.-H.: Causal influences of El Niño–Southern Oscillation on global dust activities, Atmos. Chem. Phys., 22, 5253–5263, https://doi.org/10.5194/acp-22-5253-2022, 2022.
Lee, Y. G., Kim, J., Ho, C.-H., An, S.-I., Cho, H.-K., Mao, R., Tian, B., Wu, D., Lee, J. N., Kalashnikova, O., Choi, Y., and Yeh, S.-W.: The effects of ENSO under negative AO phase on spring dust activity over northern China: an observational investigation, Int. J. Climatol., 35, 935–947, https://doi.org/10.1002/joc.4028, 2015.
Li, J., Garshick, E., Al-Hemoud, A., Huang, S., and Koutrakis, P.: Impacts of meteorology and vegetation on surface dust concentrations in Middle Eastern countries, Sci. Total Environ., 712, 136597, https://doi.org/10.1016/j.scitotenv.2020.136597, 2020.
Li, J., Garshick, E., Huang, S., and Koutrakis, P.: Impacts of El Nino-Southern Oscillation on surface dust levels across the world during 1982–2019, Sci. Total Environ., 769, 144566, https://doi.org/10.1016/j.scitotenv.2020.144566, 2021.
Li, T., Wang, B., Wu, B., Zhou, T., Chang, C. P., and Zhang, R.: Theories on formation of an anomalous anticyclone in western North Pacific during El Niño: A review, J. Meteorol. Res., 31, 987–1006, https://doi.org/10.1007/s13351-017-7147-6, 2017.
Lou, S., Russell, L. M., Yang, Y., Xu, L., Lamjiri, M. A., DeFlorio, M. J., Miller, A. J., Ghan, S. J., Liu, Y., and Singh, B.: Impacts of the East Asian Monsoon on springtime dust concentrations over China, J. Geophys. Res.-Atmos., 121, 8137–8152, https://doi.org/10.1002/2016JD024758, 2016.
Mao, R., Gong, D., Bao, J., and Fan, Y.: Possible influence of Arctic Oscillation on dust storm frequency in North China, J. Geogr. Sci., 21, 207–218, https://doi.org/10.1007/s11442-011-0839-4, 2011.
Platnick, S., Hubanks, P., Meyer, K., and King, M. D.: MODIS Atmosphere L3 Monthly Product (08_L3), NASA MODIS Adaptive Processing System, Goddard Space Flight Center, https://doi.org/10.5067/MODIS/MOD08_M3.006, 2015.
Rasch, P. J., Xie, S., Ma, P. L., Lin, W., Wang, H., Tang, Q., Burrows, S. M., Caldwell, P., Zhang, K., Easter, R. C., Cameron-Smith, P., Singh, B., Wan, H., Golaz, J. C., Harrop, B. E., Roesler, E., Bacmeister, J., Larson, V. E., Evans, K. J., Qian, Y., Taylor, M., Leung, L. R., Zhang, Y., Brent, L., Branstetter, M., Hannay, C., Mahajan, S., Mametjanov, A., Neale, R., Richter, J. H., Yoon, J. H., Zender, C. S., Bader, D., Flanner, M., Foucar, J. G., Jacob, R., Keen, N., Klein, S. A., Liu, X., Salinger, A. G., Shrivastava, M., and Yang, Y.: An Overview of the Atmospheric Component of the Energy Exascale Earth System Model, J. Adv. Model Earth Sy., 11, 2377–2411, https://doi.org/10.1029/2019MS001629, 2019.
Seinfeld, J. H., Carmichael, G. R., Arimoto, R., Conant, W. C., Brechtel, F. J., Bates, T. S., Cahill, T. A., Clarke, A. D., Doherty, S. J., Flatau, P. J., Huebert, B. J., Kim, J., Markowicz, K. M., Quinn, P. K., Russell, L. M., Russell, P. B., Shimizu, A., Shinozuka, Y., Song, C. H., Tang, Y., Uno, I., Vogelmann, A. M., Weber, R. J., Woo, J.-H., and Zhang, X. Y.: ACE-ASIA: Regional Climatic and Atmospheric Chemical Effects of Asian Dust and Pollution, B. Am. Meteorol. Soc., 85, 367–380, https://doi.org/10.1175/BAMS-85-3-367, 2004.
Shi, L., Zhang, J., Yao, F., Zhang, D., and Guo, H.: Drivers to dust emissions over dust belt from 1980 to 2018 and their variation in two global warming phases, Sci. Total Environ., 767, 144806, https://doi.org/10.1016/j.scitotenv.2020.144860, 2021.
Sivakumar M. V.: Impacts of Sand Storms/Dust Storms on Agriculture, in: Natural Disasters and Extreme Events in Agriculture, edited by: Sivakumar, M. V., Motha, R. P., and Das, H. P., Springer, Berlin, Heidelberg, 159–177, https://doi.org/10.1007/3-540-28307-2_10, 2005.
Trenberth, K. E.: The definition of El Niño, B. Am. Meteorol. Soc., 78, 2771–2778, https://doi.org/10.1175/1520-0477(1997)078<2771:TDOENO> 2.0.CO;2, 1997.
Wang, L., Chen, W., Zhou, W., and Huang, R.: Interannual Variations of East Asian Trough Axis at 500 hPa and its Association with the East Asian Winter Monsoon Pathway, J. Climate, 22, 600–614, https://doi.org/10.1175/2008JCLI2295.1, 2009.
Wang, H., Easter, R. C., Zhang, R., Ma, P.-L., Singh, B., Zhang, K., Ganguly, D., Rasch, P. J., Burrows, S. M., Ghan, S. J., Lou, S., Qian, Y., Yang, Y., Feng, Y., Flanner, M., Leung, L. R., Liu, X., Shrivastava, M., Sun, J., Tang, Q., Xie, S., and Yoon, J.-H.: Aerosols in the E3SM Version 1: New developments and their impacts on radiative forcing, J. Adv. Model. Earth Sy., 12, e2019MS001851, https://doi.org/10.1029/2019MS001851, 2020.
Wang, S., Yu, Y., Zhang, X., Lu, H., Zhang, X., and Xu, Z.: Weakened dust activity over China and Mongolia from 2001 to 2020 associated with climate change and land-use management, Environ. Res. Lett., 16, 124056, https://doi.org/10.1088/1748-9326/ac3b79, 2021.
Wu, M., Liu, X., Yang, K., Luo, T., Wang, Z., Wu, C., Zhang, K., Yu, H., and Darmenov, A.: Modeling Dust in East Asia by CESM and Sources of Biases, J. Geophys. Res.-Atmos., 124, 8043–8064; https://doi.org/10.1029/2019JD030799, 2019.
Wu, M., Liu, X., Yu, H., Wang, H., Shi, Y., Yang, K., Darmenov, A., Wu, C., Wang, Z., Luo, T., Feng, Y., and Ke, Z.: Understanding processes that control dust spatial distributions with global climate models and satellite observations, Atmos. Chem. Phys., 20, 13835–13855, https://doi.org/10.5194/acp-20-13835-2020, 2020.
Wu, X., Okumura, Y. M., and Dinezio, P. N.: What Controls the Duration of El Niño and La Niña Events?, J. Climate, 32, 5941–5965, https://doi.org/10.1175/jcli-d-18-0681.1, 2019.
Xia, W., Wang, Y., Chen, S., Huang, J., Wang, B., Zhang, G. J., Zhang, Y., Liu, X., Ma, J., Gong, P., Jiang, Y., Wu, M., Xue, J., Wei, L., and Zhang, T.: Double Trouble of Air Pollution by Anthropogenic Dust, Environ. Sci. Technol., 56, 761–769, https://doi.org/10.1021/acs.est.1c04779, 2022.
Xiao, D., Li, Y., Fan, S., Zhang, R., Sun, J., and Wang, Y.: Plausible influence of Atlantic Ocean SST anomalies on winter haze in China, Theor. Appl. Clim., 122, 249-257, https://doi.org/10.1007/s00704-014-1297-6, 2015.
Yang, Y., Russell, L. M., Xu, L., Lou, S., Lamjiri, M. A., Somerville, R. C. J., Miller, A. J., Cayan, D. R., DeFlorio, M. J., Ghan, S. J., Liu, Y., Singh, B., Wang, H., Yoon, J.-H., and Rasch, P. J.: Impacts of ENSO events on cloud radiative effects in preindustrial conditions: Changes in cloud fraction and their dependence on interactive aerosol emissions and concentrations, J. Geophys. Res.-Atmos., 121, 6321–6335, https://doi.org/10.1002/2015jd024503, 2016a.
Yang, Y., Russell, L. M., Lou, S., Liu, Y., Singh, B., and Ghan, S. J.: Rain-aerosol relationships influenced by wind speed, Geophys. Res. Lett., 43, 2267–2274, https://doi.org/10.1002/2016GL067770, 2016b.
Yang, Y., Russell, L. M., Lou, S., Liao, H., Guo, J., Liu, Y., Singh, B., and Ghan, S. J.: Dust-wind interactions can intensify aerosol pollution over eastern China, Nat. Commun., 8, 15333, https://doi.org/10.1038/ncomms15333, 2017.
Yin, Z., Wan, Y., Zhang, Y., and Wang, H.: Why super sandstorm 2021 in North China?, Natl. Sci. Rev., 9, nwab165, https://doi.org/10.1093/nsr/nwab165, 2021.
Yu, X., Wang, Z., Zhang, H., and Zhao, S.: Impacts of different types and intensities of El Nino events on winter aerosols over China, Sci. Total Environ., 655, 766–780, https://doi.org/10.1016/j.scitotenv.2018.11.090, 2019.
Yu, Y. and Ginoux, P.: Assessing the contribution of the ENSO and MJO to Australian dust activity based on satellite- and ground-based observations, Atmos. Chem. Phys., 21, 8511–8530, https://doi.org/10.5194/acp-21-8511-2021, 2021.
Yuan, Y. and Yang, S.: Impacts of Different Types of El Niño on the East Asian Climate: Focus on ENSO Cycles, J. Climate, 25, 7702–7722, https://doi.org/10.1175/JCLI-D-11-00576.1, 2012.
Zender, C. S., Bian, H., and Newman, D.: Mineral Dust Entrainment and Deposition (DEAD) model: Description and 1990s dust climatology, J. Geophys. Res., 108, 4416, https://doi.org/10.1029/2002JD002775, 2003.
Zeng, L., Yang, Y., Wang, H., Wang, J., Li, J., Ren, L., Li, H., Zhou, Y., Wang, P., and Liao, H.: Intensified modulation of winter aerosol pollution in China by El Niño with short duration, Atmos. Chem. Phys., 21, 10745–10761, https://doi.org/10.5194/acp-21-10745-2021, 2021.
Zhao, S., Zhang, H., and Xie, B.: The effects of El Niño–Southern Oscillation on the winter haze pollution of China, Atmos. Chem. Phys., 18, 1863–1877, https://doi.org/10.5194/acp-18-1863-2018, 2018.
Zhu, C., Wang, B., and Qian, W.: Why do dust storms decrease in northern China concurrently with the recent global warming?, Geophys. Res. Lett., 35, L18702, https://doi.org/10.1029/2008GL034886, 2008.