the Creative Commons Attribution 4.0 License.
the Creative Commons Attribution 4.0 License.
 | 11 Nov 2022
Predicting atmospheric background number concentration of ice-nucleating particles in the Arctic
Julie T. Pasquier
Jan Henneberger
Mixed-phase clouds (MPCs) can have a net warming or cooling radiative effect on Earth's climate influenced by the phase and concentration of cloud particles. They have received considerable attention due to high spatial coverage and occurrence frequency in the Arctic. To initiate ice formation in MPCs at temperatures above −38 ∘C, ice-nucleating particles (INPs) are required, which therefore have important implications on the radiative properties of MPCs by altering the ice-to-liquid ratio of hydrometeors. As a result, constraining ambient INP concentrations could promote accurate representation of cloud microphysical processes and reduce the uncertainties in estimating the cloud-phase-related climate feedback in climate models. Currently, INP parameterizations are lacking for remote Arctic environments. Here we present INP number concentrations and their variability measured in Ny-Ålesund (Svalbard) at temperatures between 0 and −30 ∘C. No distinguishable seasonal difference was observed from 12 weeks of field measurements during October and November 2019 and March and April 2020. Compared to existing studies, the absence of a seasonal difference is not surprising, as most seasonal differences are reported for summer versus winter time INP concentrations. In addition, correlating INP concentrations to aerosol physical properties was not successful. Therefore, we propose a lognormal-distribution-based parameterization to predict Arctic INP concentration solely as a function of temperature, specifically for the transition seasons autumn and spring to fill in the data gap in the literature pertaining to these seasons. In practice, the parameterized variables allow for (i) the prediction of the most likely INP concentrations and (ii) the retrieval of the governing distribution of INP concentrations at given temperatures in the Arctic.
- Article
(6606 KB) - Full-text XML
-
Supplement
(8615 KB) - BibTeX
- EndNote


The Arctic region is extremely sensitive to climate change. During the past several decades, this region has undergone accelerated warming more than twice the rate of the global average (Serreze and Barry, 2011) – a phenomenon termed Arctic amplification. Many feedback mechanisms are considered to contribute to the rapid warming of the Arctic environment. For instance, the phase partitioning in mixed-phase clouds (MPCs), i.e., the ratio of supercooled liquid droplets and ice crystals, markedly determines the cloud optical depth and therefore impacts the radiative budget of the Arctic boundary layer (Pithan and Mauritsen, 2014).
In Arctic MPCs, primary ice formation is facilitated via heterogeneous ice nucleation aided by ice-nucleating particles (INPs) (Vali et al., 2015). Despite the scarcity of approximately only 1 out of 106 total aerosol particles acting as an INP (at −20 ∘C) in the free troposphere (DeMott et al., 2010; Kanji et al., 2017), the variation of INP concentration can indirectly affect the climate by modifying cloud microphysical and optical properties and producing precipitation (Lohmann, 2002; Mason et al., 2015). Therefore, global and regional climate models require accurate representations of complex cloud microphysical processes and INP feedback. So far, knowledge gaps still exist concerning the spatial and seasonal variations, chemical compositions, and source origins of INPs, particularly in remote Arctic regions (Hartmann et al., 2020).
Mineral dust and soil particles are effective INPs at temperatures lower than approximately −15 ∘C (Hoose and Möhler, 2012; Murray et al., 2012; Kanji et al., 2017), but the number is proportionally low in the Arctic due to reduced sources. In addition, recent studies (Wilson et al., 2015; DeMott et al., 2016; Irish et al., 2017; McCluskey et al., 2018; Twohy et al., 2021) present evidence that the emission of sea spray aerosols via the bubble-bursting mechanism at the ocean surface (Gantt and Meskhidze, 2013) can be a dominant INP source in remote regions, e.g., the Southern Ocean, where other active INP sources (e.g., mineral dust) are rare. Many recent studies attempted to quantify INP concentrations in diverse environments and develop deterministic parameterizations to represent cloud microphysical processes in climate models. For instance, DeMott et al. (2010) (referred to as D10) incorporate the global average INP observations and improved INP parameterization by relating the dependence of INP concentrations on temperature and number concentrations of aerosol particles with diameters above 0.5 µm. From where biological aerosols dominate the INP population, Tobo et al. (2013) developed INP parameterization based on fluorescent biological particle concentrations during the measurement campaign in pine forest ecosystems in the Rocky Mountains region, and Schneider et al. (2021) predicted INP concentrations as a function of ambient temperature (a proxy for the seasonality) by investigating the year-long observations in the boreal forest environment in southern Finland. In addition, many INP parameterization studies based on surface site density (ns) focused on prevailing INP sources in different environments, e.g., mineral dust (Niemand et al., 2012, N12; DeMott et al., 2015, D15) and pristine sea spray aerosols (McCluskey et al., 2018, M18). The dominant aerosol compositions define the major differences in these INP parameterizations, i.e., the slope of INP number concentrations as a function of temperature. Due to the strong temperature dependence, the slope of an INP parameterization was reported to alter the amount of outgoing radiation by reforming the vertical distribution of cloud microphysical processes in modeling studies (Hawker et al., 2021). However, the community still lacks an INP parameterization capable of predicting the INP number concentrations in pristine regions such as the Arctic. In particular, the previously mentioned parameterizations are not suitable for remote pristine conditions (see Sect. 3.2).
Apart from the contribution of localized INP sources, remote effects cannot be ruled out (Schmale et al., 2021), such that the changing aerosol emissions at low-latitudes and midlatitudes will also impact the Arctic region (Najafi et al., 2015; Lewinschal et al., 2019). Igel et al. (2017) suggested that long-range transport can be an increasing aerosol source within the framework of climate change and can impact the low-level Arctic cloud cover where the local aerosol loading is less prevalent. Additionally, Schrod et al. (2020) revealed that the dominant INP species vary temporally and geographically, which complicates the realistic representativeness of atmospheric INPs in the Arctic. As a result, the Arctic INP population is considered to have a well-mixed composition from marine and terrestrial origin (Murray et al., 2021), and remote and local effects cannot be easily distinguished (Schmale et al., 2021).
Welti et al. (2018) observed that INP concentrations follow the log-normal frequency distribution at investigated temperatures, explained by the successive random dilution model (Ott, 1990). Ott (1990) suggested that in many atmospheric processes, a substance of interest, e.g., aerosol or INP, undergoes random dilution and mixing during atmospheric transport. The resulting frequency of INP concentrations at the destination, e.g., the Arctic, in this case converges to a log-normal distribution after successive random dilutions in the absence of dominating local sources.
INP-related measurements in the remote Arctic are scarce and therefore of extreme value where the ambient aerosols are in near-pristine conditions in some seasons. In this study, we conducted continuous measurements over 12 weeks in the Arctic, gathering an extensive INP-related measurement data set, a broader INP–temperature spectrum down to −30 ∘C, and higher temporal resolutions. By quantifying the distribution of INP concentrations, we developed an INP parameterization representative of atmospheric background air masses. This parameterization will help evaluate the role of cloud-phase interactions in Arctic MPCs and contribute to the progress of accurately estimating cloud influenced climate predictions in the Arctic (Tan and Storelvmo, 2019), particularly for the transition seasons (autumn and spring).
2.1 Overview of field campaign and experimental setup
Under the framework of the NASCENT campaign (Pasquier et al., 2022), ambient INP measurements and aerosol characterization took place at the Arctic field site in Ny-Ålesund, Svalbard (78.9∘ N, 11.9∘ E) during October–November 2019 and March–April 2020. Ny-Ålesund is located on the southern coast of the Kongsfjorden in western Svalbard, and it is a well-established international site in the Arctic for scientific research. We configured ambient INP and aerosol measurements in a container used as the temporary observatory, which was placed at the southern end of the Ny-Ålesund town (see Fig. 1a). In addition to the minor anthropogenic emissions from the town, the container was approximately 600 m from the coast of Kongsfjorden and was surrounded by mountains and glaciers.
The experimental setup is shown in Fig. 1b. Ambient aerosol was sampled through a custom-built total aerosol inlet of 4.5 m vertical length, which was kept at a maximal temperature of 40 ∘C. During cold periods with strong winds (e.g., ambient temperature of −30 ∘C with wind chill below −50 ∘C in March 2020) the temperature of the inlet temporarily dropped but never went below 0 ∘C. Downstream of the inlet, a flow splitter (custom-built) directs the aerosol inflow into INP and aerosol instruments. For INP measurements, as shown in Fig. 1b, the first sampling branch was regulated with a steady total flow of 300 L min−1 through the inlet to the high-flow-rate impinger (Coriolis® µ, Bertin Instruments, France). The inlet diameter was 50 mm, which was tapered to 25 mm (KF-25 pipe standard) after the flow splitter. A detailed sketch of the applied setup has previously been used in Fig. 1e of Wieder et al. (2022b). Secondary sampling lines that branched off the flow splitter had a diameter of 6 mm and were used by different instruments operating at flow rates between 0.283 std L min−1 and 1 L min−1. The INP sampling and auxiliary aerosol measurements are explained in more detail below.

Figure 1On-site instrumental setup in Ny-Ålesund. (a) Location of container for ambient INP and aerosol measurement (Photo CC-BY Radovan Krejci). (b) In-container setup. The ambient aerosol flow was directed into CCNC (cloud condensation nuclei counter), HINC (horizontal ice nucleation chamber, Lacher et al., 2017), Coriolis impinger, DRINCZ (DRoplet Ice Nuclei Counter Zurich, David et al., 2019), SMPS (scanning mobility particle sizer), APS (aerodynamic particle sizer), and WIBS (wideband integrated bioaerosol sensor).
2.1.1 INP sampling and measurements
INPs were monitored using an offline method and an online method as follows. Using the Coriolis impinger with the cut-off size of 0.5 µm (lower limit for aerodynamic diameter), ambient aerosol samples were collected into pure water. To compensate the evaporation loss of the sampling liquid (W4502-1L, Sigma-Aldrich, US) during the operation of the impinger, additional sampling liquid was fed into the sampling cone at a constant feed rate, which varied according to the ambient conditions and ranged between 0.6 and 1.0 mL min−1. Between 6 October and 15 November 2019 and from 16 March to 22 April 2020, 137 and 133 samples, respectively, were collected and analyzed for INP concentration. The INP analysis was performed on site immediately after sample collection using the DRoplet Ice Nuclei Counter Zurich (DRINCZ, David et al., 2019). From each collected sample, 96 aliquots of 50 µL were pipetted into polymerase chain reaction (PCR) trays and cooled down in the ethanol bath of a thermostat (Fig. 1b). During cooling, a camera mounted above the bath took pictures of the tray, and the corresponding temperature of the bath was recorded. From the optical intensity difference of an aliquot between the two pictures, its freezing (temperature) was derived. From the impinger flow rate and aliquot volumes, INP concentrations can be derived. For further details, we refer the reader to David et al. (2019). The INP concentration (NINP) was calculated at every integer temperature according to Vali (1971, 2019) as follows:
where Nfro(T) is the number of frozen aliquots at temperature T, Ntot is the total number of aliquots (Ntot=96), and Va is the volume of an individual aliquot (Va=50 µL). C is the normalization factor in order to calculate the INP concentration per standard liter of sampled air (std L−1) and is defined as follows:
where FCoriolis is the flow rate of the impinger (300 L min−1), tsample is the sampling time (60 min), VCoriolis is the end volume within the sampling cone (15 mL), pambient and pstd (1013.25 hPa) are the ambient and standard-condition pressure, and Tambient and Tstd (273.15 K) are the ambient and standard-condition temperature. The retrieved INP concentrations were corrected for the background of blank samples according to David et al. (2019) as follows. Blank samples were taken by installing an unused sampling cone in the impinger and filling it with water (15 mL) entirely primed from the refilling system to account for contamination originating from the refilling system and any impurities in the water. The cone was removed, capped, and manually shaken for 1 min to account for contamination from the cone surface. A blank sample was taken every 3 d during the campaigns. For each season, a fit of the backgrounds of the season was used to correct the INP samples of the corresponding season. Following Vali (2019), INP samples were background corrected by subtracting the differential INP spectrum of the blank fit from an INP sample's differential INP spectrum. An overview of the raw frozen fractions of INP samples and background blanks as input for the calculation of the differential INP spectrum are presented in Fig. S3 (Supplement). From the analysis by DRINCZ, the highest temperature at which the INP concentration could be measured was approximately −5 ∘C, while the coldest temperature where ice nucleation activity was reliably observed was approximately −22 ∘C.
In order to extend the INP temperature spectrum, we utilized the online continuous flow diffusion chamber HINC (Lacher et al., 2017) to measure INP concentrations at ∘C (±0.4 ∘C uncertainty) at a relative humidity with respect to water RHw=104 % (±1.5 % uncertainty), representing the immersion/condensation freezing mode. The ice crystals and water droplets were distinguished by a pre-determined size threshold (5 µm) of an optical particle counter (OPC) downstream of the chamber (see Fig. 2), considering the operation temperature and particle residence time. The ice detection threshold of 5 µm is unaffected by inactivated large ambient particles given HINC’s upper cut-off size of approximately 2.5 µm (D50, i.e., 50 % loss for particles with a diameter of 2.5 µm) due to the horizontal orientation of the chamber. To account for the false-positive ice count originating from the internal chamber, e.g., the falling frost from the warmer plate that can be misclassified as INPs, a motorized valve (see Fig. 2) was applied to switch from sample flow to filtered air measurements regularly (5 min) before and after each sampling period (15 min) to determine the background ice particle concentrations. The INP concentrations are further derived by subtracting the background interference from sample measurements. Moreover, the limit of detection (LOD) of the instrument was also determined from the concentrations and standard deviations of the background interference measurements following Poisson statistics (detailed description in Lacher et al., 2017). Overall, 348 and 594 total 15 min samples were collected using HINC during the campaign in 2019 and 2020, respectively. At ∘C, only measured INP concentrations larger than the LOD are presented and used in developing the parameterization, given the 68.3 % confidence interval of significance according to the Poisson statistics. For autumn 2019 and spring 2020, the number of reported INP observations at ∘C that above the LOD (1.06 and 1.12 std L−1, respectively) were 135 and 323, respectively.
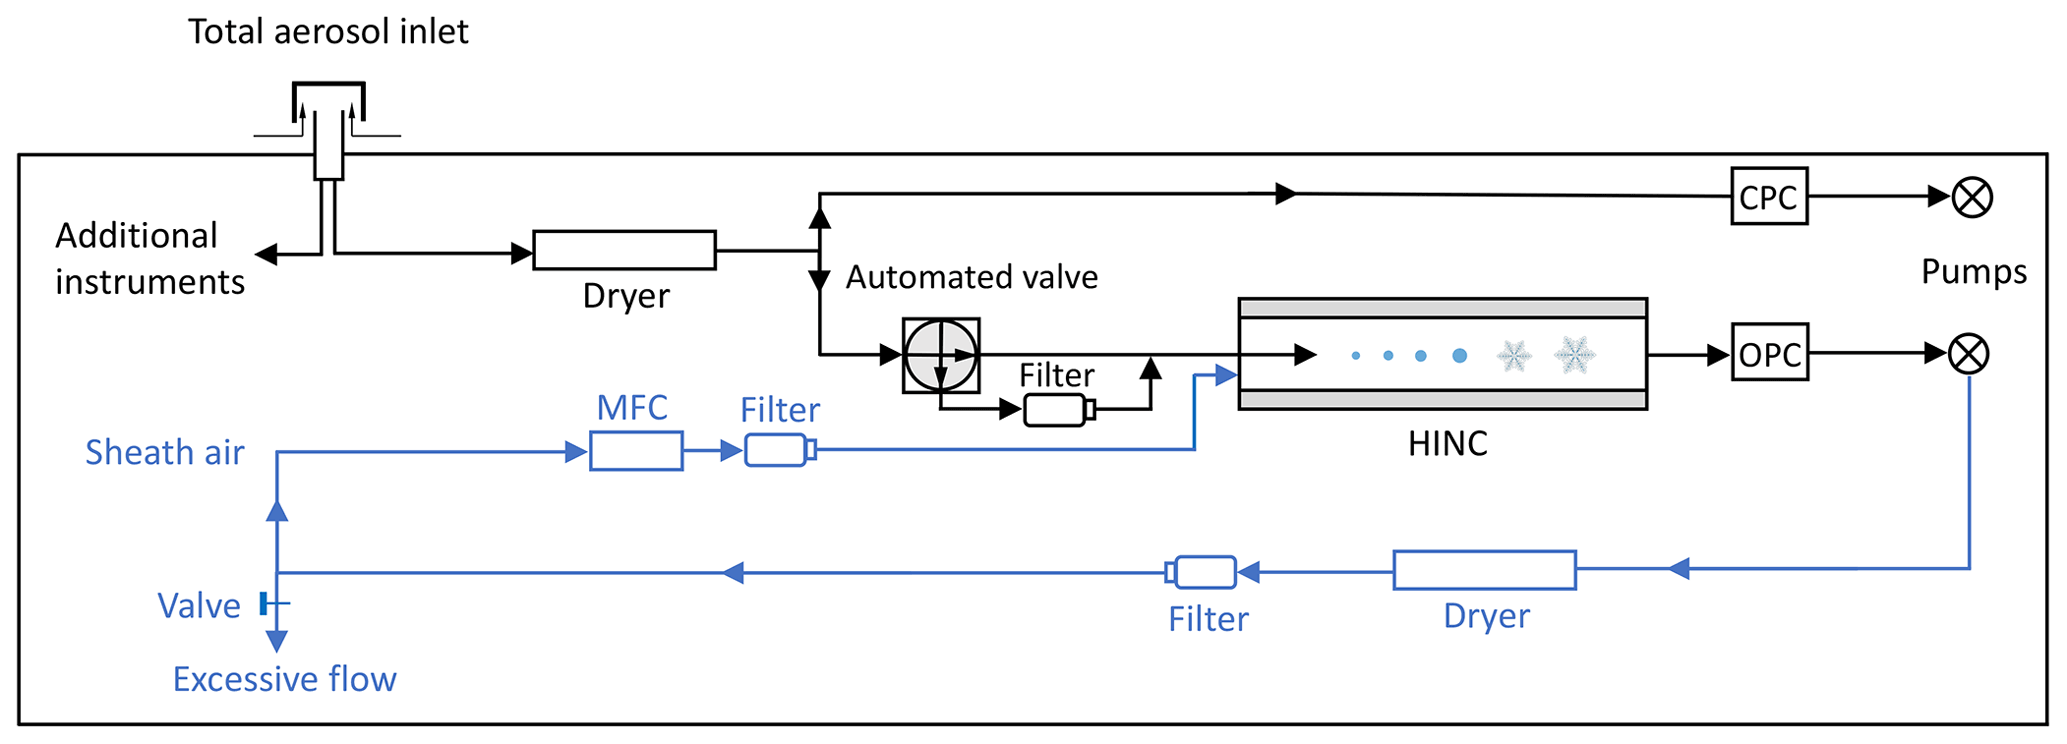
Figure 2Flow diagram of HINC as setup inside the container during field measurements in Ny-Ålesund (figure adapted from Lacher et al., 2017). The blue part indicates modifications from Lacher et al. (2017) to adapt the recirculation of sheath air. MFC, CPC, and OPC represent the mass flow controller, condensation particle counter, and optical particle counter, respectively.
2.1.2 Aerosol physical property measurements
Particle size distributions were recorded by two commercial particle sizer spectrometers connected to the total inlet splitter. Coarse particles (approximately 0.5–20 µm) were detected using an aerodynamic particle sizer (APS, Model 3321, TSI Corp., US). Fine particles (Aitken and accumulation mode, approximately ranging from 15 to 600 nm) were detected using a scanning mobility particle sizer (SMPS, Model 3938, TSI Corp., US). Electrical mobility diameters of the SMPS and aerodynamic diameters of the APS were converted to volume-equivalent physical diameter assuming an average particle density of 2.0 g cm−3 (Tobo et al., 2019) and a shape factor of 1.2 (Thomas and Charvet, 2017). The concentration of fluorescent particles was observed using a wideband integrated bioaerosol sensor (WIBS-5/NEO, DMT, US). Note that WIBS measurements were only available during the autumn campaign in 2019.
2.2 Parameterization approach
In this study, we aimed to predict the INP concentrations solely as a function of the observed nucleation temperatures (explained in Sect. 3.2). Using linear regression to fit the relationship between the logarithmic space of INP concentrations and nucleation temperature requires the ordinary least-squares technique to estimate the regression coefficients. A critical assumption behind this method is homoscedasticity, i.e., constant variance of errors for all observations regardless of the value of regressors. However, in reality, this is hardly achieved, in particular for real-time observational data in the field, since INP concentrations naturally vary several orders of magnitude at a given temperature. In addition, the INP concentrations at each measured temperature are not evenly distributed, which are limited by inter-instrumental differences and available sample sizes. As a result, we observed a non-constant variance in the errors (i.e., heteroscedasticity) of INP concentrations over the investigated temperatures (see Fig. S1 in the Supplement). We therefore applied weighted factors in fitting our parameterization to obtain unbiased regression coefficients. The details are given in Sect. S1 of the Supplement.

Figure 3Box plot of observed INP concentrations as a function of nucleation temperature during the measurement campaigns in autumn 2019 (violet) and spring 2020 (green) in Ny-Ålesund, Svalbard. The orange line indicates a log-linear fit to all data combined.
3.1 Overview of Arctic ambient INP concentrations
An overview of the observed INP number concentrations as a function of nucleation temperature at Ny-Ålesund (Svalbard, Norway) within the framework of the Ny-Ålesund AeroSol Cloud ExperimeNT (NASCENT) campaign (Pasquier et al., 2022) for autumn 2019 and spring 2020 is shown in Fig. 3. INP concentrations at −30 ∘C were measured using the horizontal ice nucleation chamber (HINC, Lacher et al., 2017). INP spectra above −22 ∘C were measured with the DRoplet Ice Nuclei Counter Zurich (DRINCZ, David et al., 2019) using the liquid samples collected by a high-flow-rate impinger (further details given in Sect. 2.1.1). The INP measurements at ∘C were lacking because all droplets froze in most cases, hindering the calculation of INP concentrations. While concerning observations at ∘C, most INP concentrations were below the limit of detection (LOD) of the instrument due to the volume of air sampled, and thus could not be reliably derived. Overall, in Fig. 3 the INP concentrations were found to increase in a log-linear pattern with decreasing temperature for both observing periods (orange line). For INP concentrations observed in autumn 2019 and spring 2020, we performed unpaired t tests to infer if there is a significant seasonal difference at the 95 % confidence interval level (p<0.05). Overall seasonal variation of INP concentrations at the investigated nucleation temperatures is unidentifiable for the months during which we sampled INP concentrations.
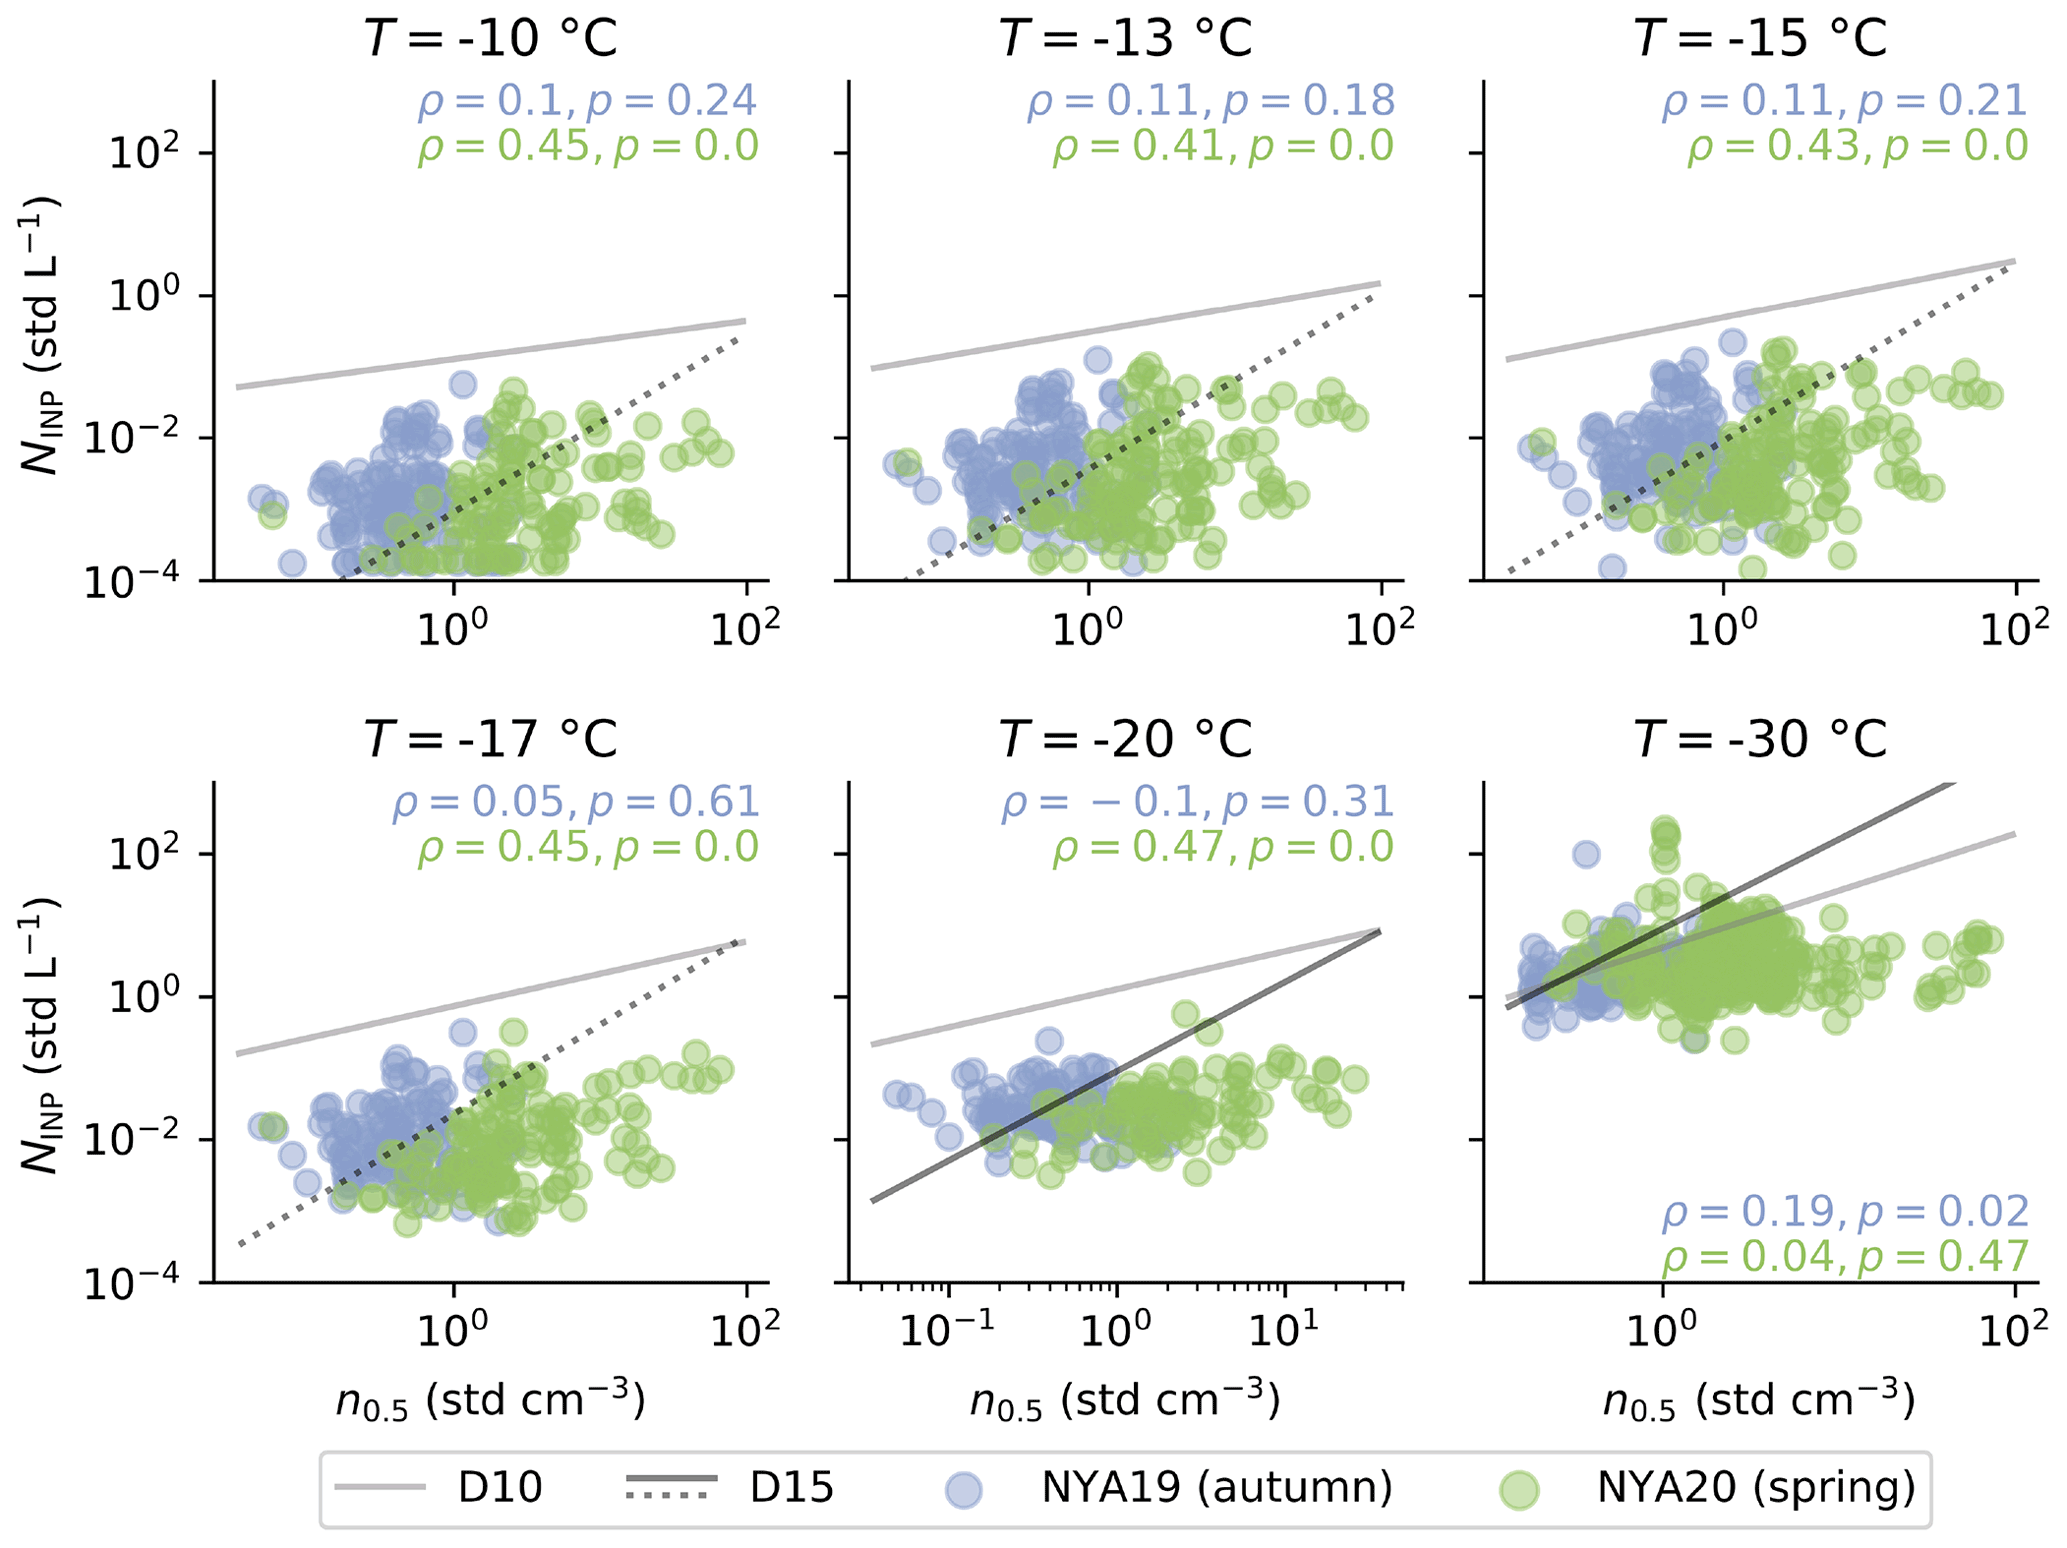
Figure 4Observed INP concentration at selected temperatures as a function of particle number concentrations for particles larger than 0.5 µm (n0.5) during sampling in the autumn (violet) and spring (green) campaign. The Spearman's rank coefficient (ρ) and p value are given for each plot. Predicted INP concentration by DeMott et al. (2010) (D10) and DeMott et al. (2015) (D15) are presented in solid gray and black, respectively. Predictions of the D15 parameterization outside of the applicable temperature range ( ∘C) are indicated as dashed lines.
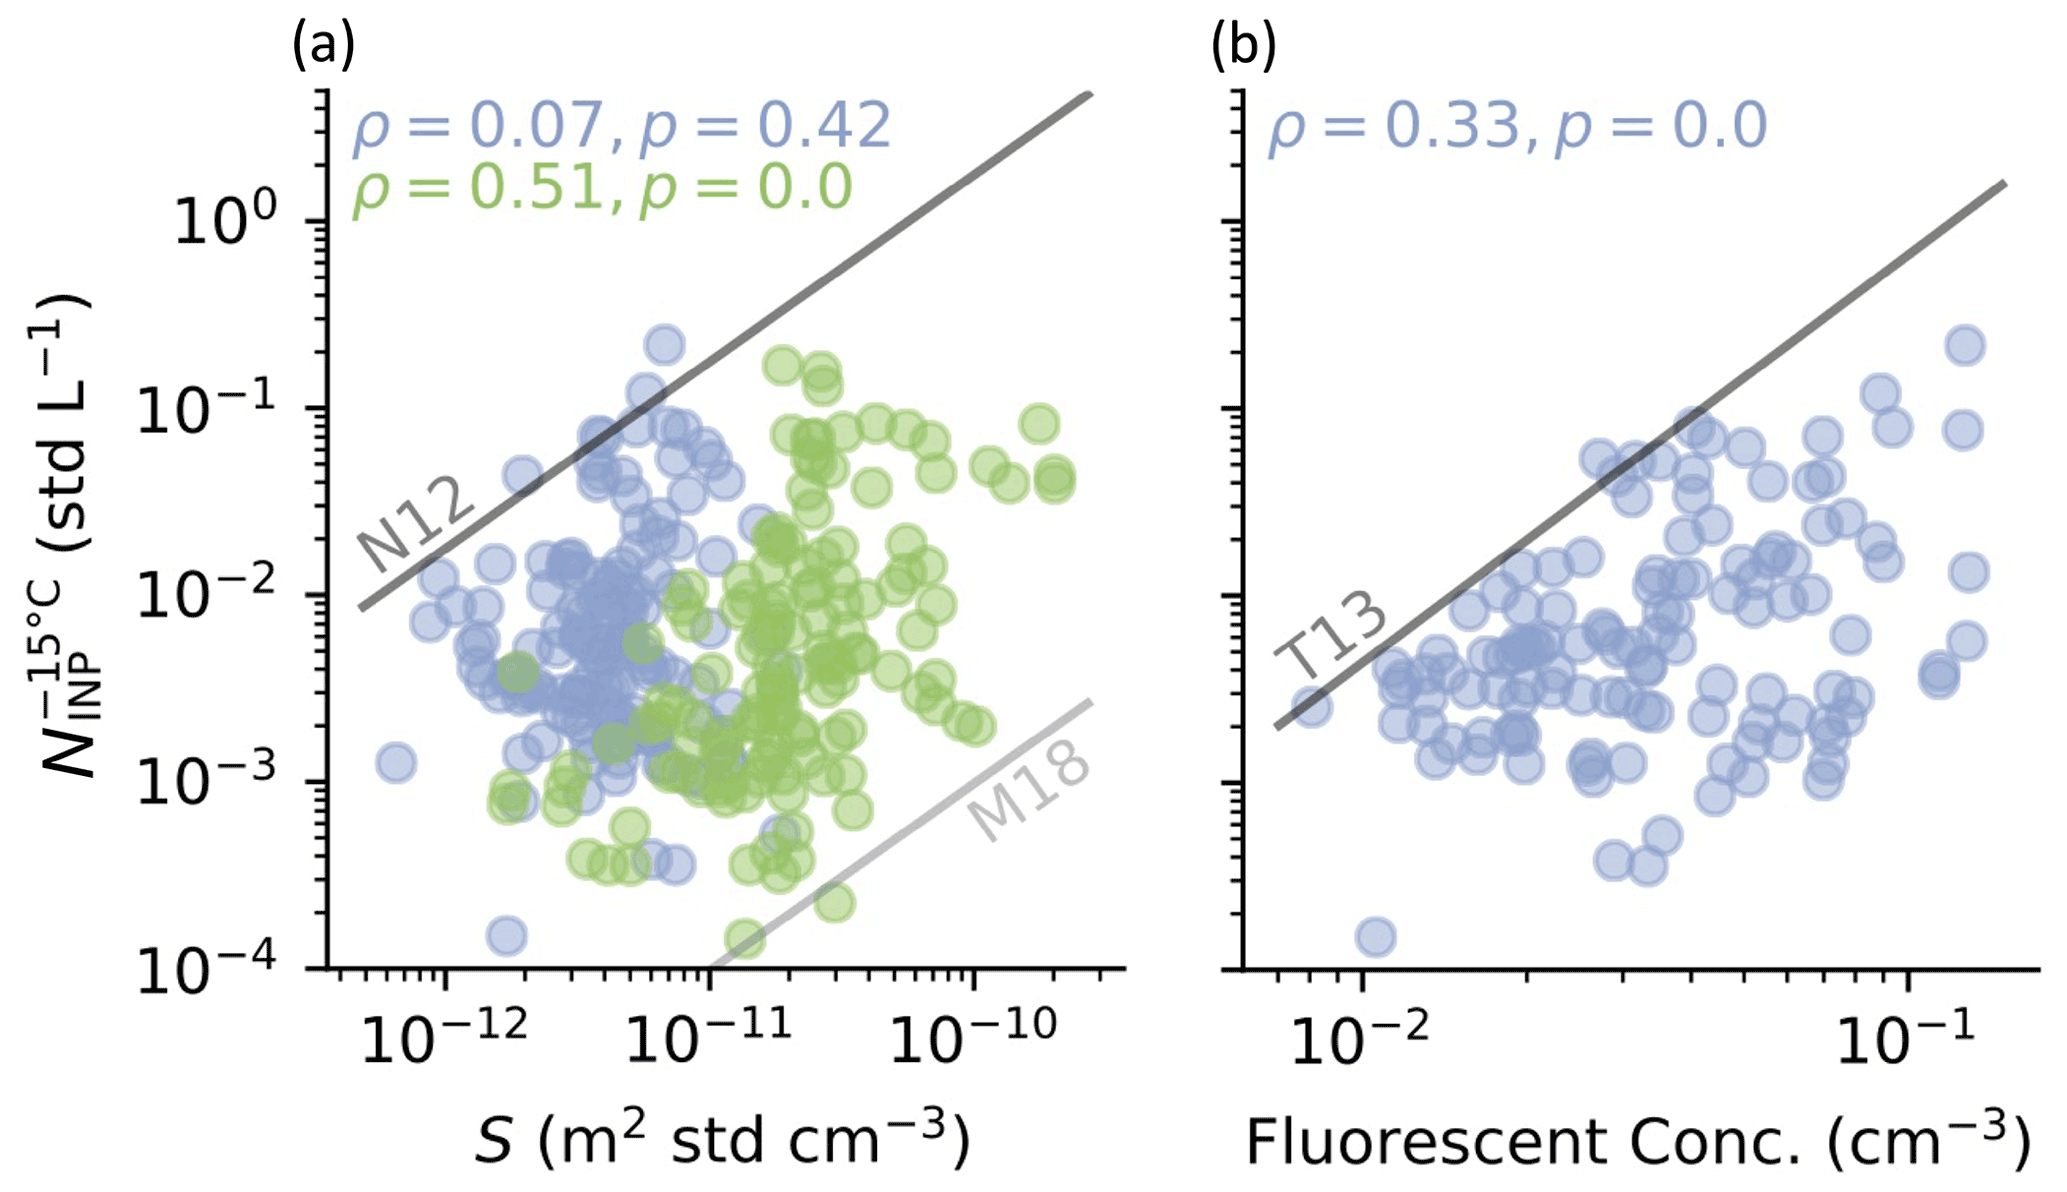
Figure 5Observed INP concentration at a nucleation temperature of −15 ∘C () as a function of (a) the ambient aerosol surface area concentration (S) and (b) the ambient number concentration of fluorescent particles during sampling in the autumn (violet) and spring (green) campaign. The green points are absent in (b) because the fluorescence measurements were only conducted in the autumn campaign. The Spearman's rank coefficient (ρ) and p value are given for each season in each plot (the correlation for both seasons combined is presented in Table S1 in the Supplement). Further indicated are predicted INP concentrations by Niemand et al. (2012) (N12), McCluskey et al. (2018) (M18), and Tobo et al. (2013) (T13).
3.2 Relationship of INP concentrations to aerosol and meteorological parameters
State-of-the-art parameterizations predict INP concentration based on an aerosol property such as number and surface area concentration (e.g., D10, N12, T13, D15, M18) or meteorological properties such as ambient temperature (e.g., Schneider et al., 2021, S21). We investigated the effectiveness of aerosol and meteorological properties as predictors for INP concentration at different temperatures. Figure 4 shows the observed INP concentrations at different investigated temperatures for both seasons as a function of the concentration of particles with a diameter larger than 0.5 µm (n0.5). Similarly, Fig. 5 shows an example of the observed INP concentrations with a nucleation temperature of −15 ∘C for both seasons as a function of (Fig. 5a) surface area concentration (S) and (Fig. 5b) fluorescent particle concentrations (additional temperatures are presented in Figs. S4 and S5 in the Supplement). Moreover, predictions based on a selection of existing INP parameterizations using the three presented aerosol properties (n0.5, S, and fluorescent particle concentrations) are shown in the corresponding panel as a reference (Figs. 4 and 5, and more temperatures are shown in Figs. S4 and S5 in the Supplement). Note that the mentioned parameterizations represent air masses dominated by specific aerosol types, which are likely different from our observations in the Arctic region. Therefore, it is unsurprising that the three parameterizations (D10, N12, T13) overestimate and one parameterization (M18) underestimates the INP concentrations (Figs. 4, 5 and S4). Wieder et al. (2022a) recently proposed a multiplicative calibration factor of about 0.02 for D10 predictions of INP applicable to the remote region of the Alps, which reduces the predicted concentrations by nearly 2 orders of magnitude, moving the predictions near the center of the scattered data. A special case is given by D15 (for ∘C), which underestimates INP concentrations in autumn and overestimates INP concentrations in spring at all the temperatures shown in Fig. 4. However, despite the predictions of D15 lying within the observed data, the parameterization was designed for dust-dominated air masses, and it remains weakly constrained at temperatures warmer than −20 ∘C (shown in dashed black lines in Fig. 4).
From Figs. 4 and 5a, the difference in aerosol loading between the observed seasons is non-negligible. Indeed, ambient aerosol number concentrations were on average 6 times higher in spring 2020 than in autumn 2019 (see Fig. S2 in the Supplement). Such an enhancement in INP concentration was not observed between the seasons (Fig. 3), although from Figs. 4 and 5a, a stronger correlation between INP concentration and aerosol properties was observed for spring 2020. The Spearman's rank correlation coefficients increased from 0.11 and 0.07 in autumn 2019 to 0.43 and 0.51 in spring 2020 for INP concentrations measured at −15 ∘C versus n0.5 and S, respectively. As a result, no strong correlation between the INP concentration and aerosol properties is expressed for the data of both seasons combined (Table S1 in the Supplement). It is important to mention that for our INP observations, any INP parameterization using a season-dependent variable, such as aerosol number concentration or surface area concentration, could induce a bias in the INP prediction (e.g., higher INP concentrations with higher aerosol loading).
Aside from aerosol properties, meteorological variables were explored to predict INP concentration (Table S1). Schneider et al. (2021) showed the usability of the ambient temperature in the prediction of INP concentration, representative of season-dependent INP sources. For our observations, such a dependence of INP concentration on ambient temperature was absent (see Table S1). As argued above for the particle concentration, the absence of a strong relationship can be explained as the mean ambient temperature differed between seasons while the INP concentration did not. We investigated the usability of other temperature quantities such as virtual temperature, potential temperature, and equivalent potential temperature (Table S1). However, the correlation behavior did not differ substantially from the coefficients found for the ambient temperature. Lastly, weakly season-dependent variables such as relative humidity, pressure and wind were investigated. No relation of INP concentration to ground-measured relative humidity, pressure, and wind direction could be found (Table S1). In turn, a weak correlation was found between INP concentrations and ground wind speed. Reasons behind these observations could potentially be increased transport and advection of INPs with the associated synoptic wind system or local source enhancement. For the latter, e.g., enhanced aerosolization of local soil dust (cf. Tobo et al., 2019) or stronger activity of bubble-bursting-induced sea spray aerosol enrichment (Wilson et al., 2015), are conceivable reasons.
In this section, we investigated the potential of different aerosol and meteorological properties as predictors of ambient INP concentrations. No parameters with a consistently moderate or strong relationship to INP concentration could be identified. Furthermore, it was illustrated that any season-dependent variable (e.g., aerosol concentration, or ambient temperature) would induce a seasonal bias in INP concentration that was not observed. Given these obstacles to the inclusion of an additional property in the prediction of the ambient INP concentration in the Arctic, we aimed to develop an INP parameterization insensitive to abruptly changing atmospheric aerosols (e.g., peak events or seasonality) that can be implemented for long-span predictions. In Sect. 3.3, we investigate the prediction of INP concentrations solely based on ice nucleation temperature.
3.3 Log-normal distribution based INP parameterization
The improved accuracy of advanced INP parameterizations relies on a robust relationship between INP concentration and aerosol or meteorological properties – which was not evident in our in-situ observations (Sect. 3.2). Alternatively, average INP concentrations can be predicted solely by a nucleation-temperature-dependent parameterization. For a few decades, it has been known that the temperature dependence of INP parameterizations is critical to represent cloud properties accurately (Fletcher, 1962; Cooper, 1986; Meyers et al., 1992). We present a methodology to optimally fit the slope of INP concentration frequency distributions as a function of investigated nucleation temperature.
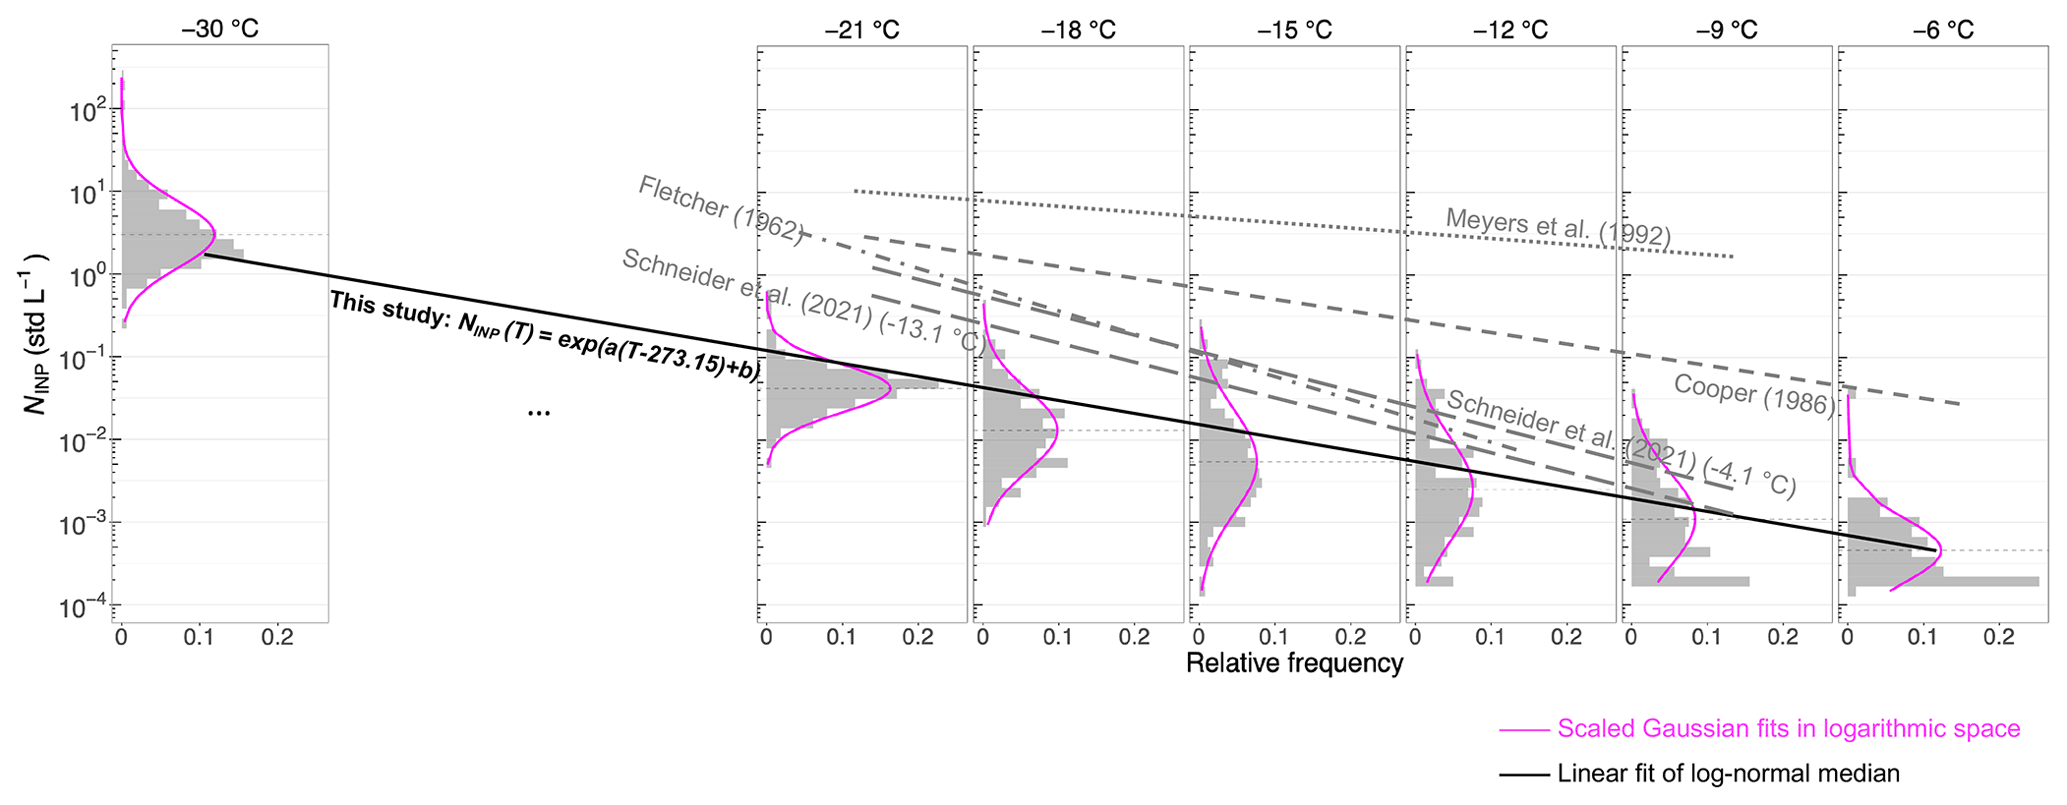
Figure 6Relative frequency distribution of observed INP concentrations (gray histograms) for selected nucleation temperatures. Log-normal fit curves are presented for each histogram in magenta. The fit of all INP data in this study is presented as a solid black line (fitting parameters given in Table 1). Predictions from existing parameterizations are indicated by the gray lines. For Schneider et al. (2021), the temperature value in parentheses represents the mean ambient temperature during the observations in autumn 2019 and spring 2020, respectively, which were used to obtain the INP predictions.
Table 1List of parameters for the proposed INP concentration parameterization (Eq. 3). Median and lower and upper 95 % CI represent the parameters in Eq. (3) for the median and lower and upper bound of 95 % confidence interval, respectively, of the linear fit for the log-normal distribution.
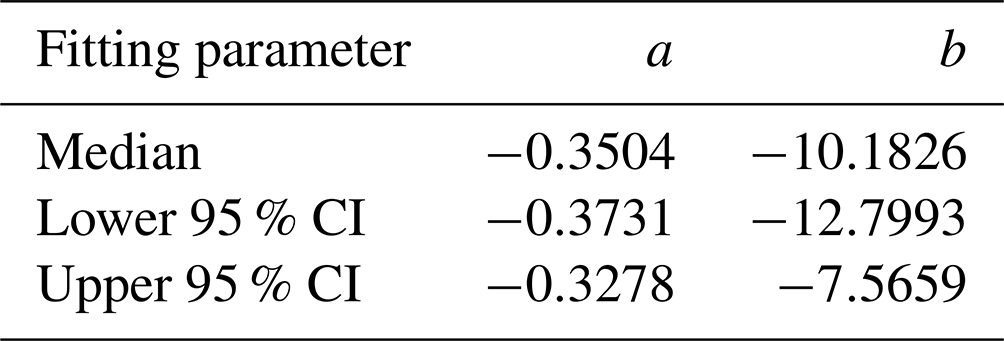
Figure 6 shows the relative frequency distribution of our observed INP concentrations at different measured temperatures for the two campaigns in autumn and spring combined. The adequate log-normal fits of the observed distributions of INP concentrations per temperature support the hypothesis of Ott (1990) (see Sect. 1). Figure S7 (see Supplement) provides more evidence based on the approximate linearity between the observational and theoretical quantiles of the log-normal distribution, particularly at lower temperatures ( ∘C), where the closeness of data to the red line assesses the likelihood that the data set follows the theoretically log-normal distribution (see more details in Sect. S5 in the Supplement). The nature of log-normal INP distributions has been previously reported from the long-term INP monitoring in Svalbard (Schrod et al., 2020) and the subtropical maritime boundary layer (Welti et al., 2018). Thus, we propose an INP parameterization that fits the median value of the log-normal distribution and investigated nucleation temperatures, represented as follows:
where NINP is the INP number concentrations in std L−1, T is the temperature in kelvin, and a and b are fit parameters with the value given in Table 1. Note that instead of using an linear regression based on ordinary least-squares (OLS), we applied a weighted least-squares (WLS) approach (see Sect. S1 in the Supplement) to address the heteroscedasticity of frequency distributions of INP concentrations over different temperatures. In addition, we also report the dominant INP concentration distributions within the 95 % confidence interval (i.e., median standard deviation), based on the WLS fit of log-normal distributions. The fitting parameters for the lower and upper bounds of the predicted INP concentration distribution are also given in Table 1.
In Fig. 6, we compare to previous INP parameterizations that are only dependent on temperature (Fletcher, 1962; Cooper, 1986; Meyers et al., 1992). Our fit predicts at least 1 or 2 orders of magnitude lower INP concentrations than these parameterizations. Note that these three parameterizations were derived from the observations in different environments (not during the seasonal transition months in the Arctic). The INP concentration predicted by Schneider et al. (2021) is closer to our parameterization but still slightly overestimates our values.

Figure 7Locations of the previous Arctic field observations of INP concentrations used for evaluating the INP parameterization. More details of the observations of the individual campaigns are presented in Table S3 in the Supplement.

Figure 8Comparison of Arctic INP concentration measurements in different studies. The INP parameterization developed from this study is presented as a solid black line, with the gray-shaded area representing the log-normal INP concentration distribution within the 95 % confidence intervals. The area between the two red lines is a compilation of INP concentrations determined from precipitation samples from the midlatitudes (Petters and Wright, 2015). The dotted (M92), dashed (C86), dotted–dashed (F62), and long-dashed (S21) lines indicate the INP parameterization from Meyers et al. (1992), Cooper (1986), Fletcher (1962), and Schneider et al. (2021), respectively. The S21 (autumn) and S21 (spring) for Schneider et al. (2021) parameterization represent INP concentrations predicted during our autumn 2019 and spring 2020 campaign, given the average ambient temperature of −4.1 and −13.1 ∘C, respectively.
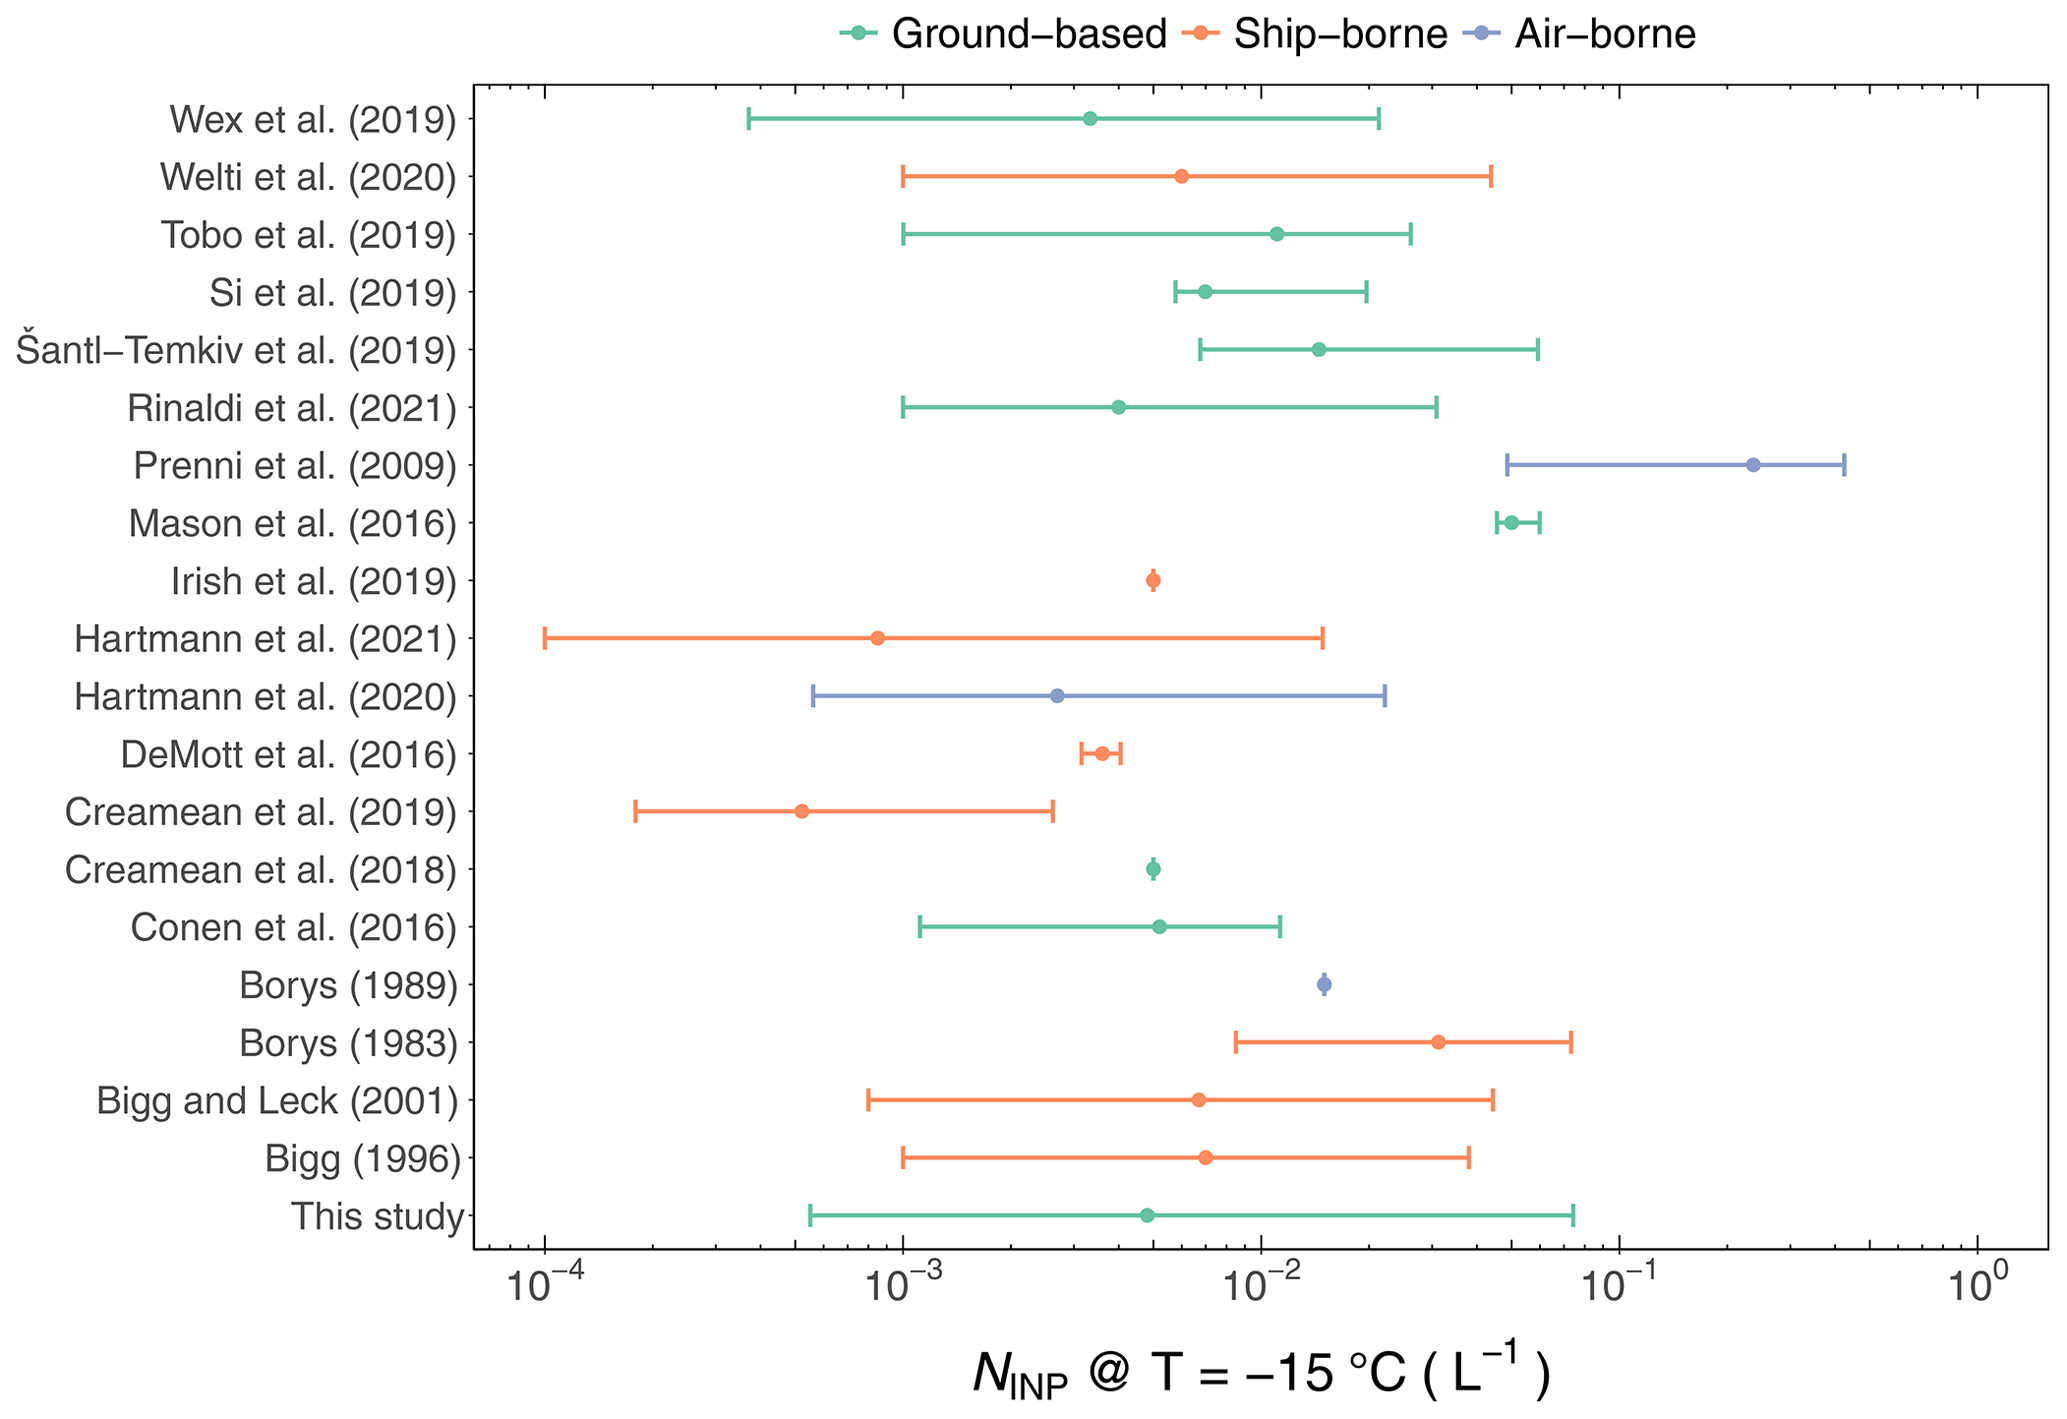
Figure 9Comparison of INP concentrations at −15 ∘C from this study to selected Arctic field campaigns as a function of measurement platform. The median NINP is given in colored dots, and the colored error bars indicate the 5 %–95 % quantile of the corresponding data set.
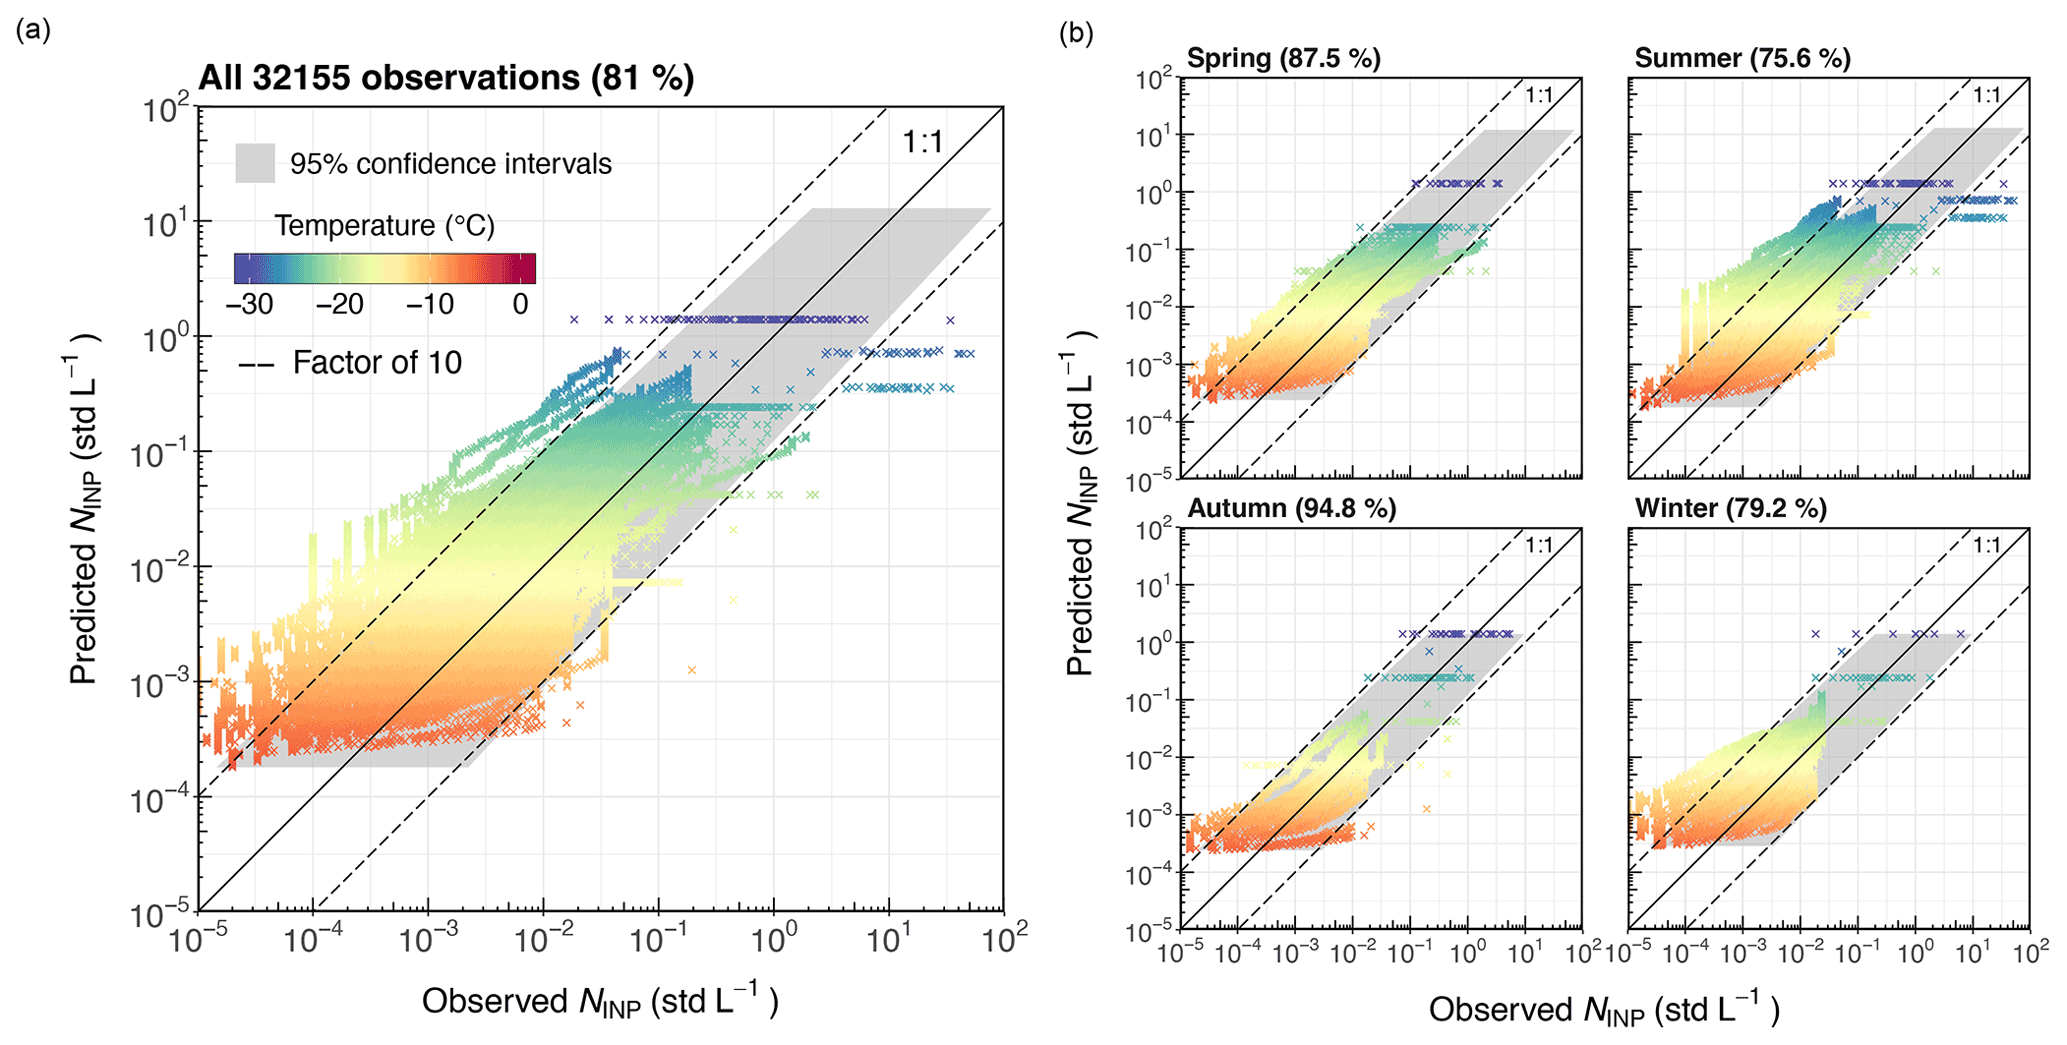
Figure 10Predicted INP concentrations from the proposed fit (Eq. 3) compared to observations from previous Arctic field campaigns. An overview of the data used is given in Table S3 (see Supplement). (a) All 32 155 observational data. (b) Data per season (season classification: spring (March–May), summer (June–August), autumn (September–November), and winter (December–February)). The 1:1 line and a deviation of factor 10 are given in solid black and dashed black, respectively. The nucleation temperature of the corresponding INP concentration is given in color. The 95 % confidence interval of the fit is given in gray. The values in the parentheses represent the percentages of predicted data falling within the 95 % confidence intervals.
3.4 Comparison to previous Arctic INP field observations
We gathered observations of INP concentrations from previous field measurements in the Arctic from 1976 to the latest 2021 as a reference data set to test the parameterization developed for background INP concentration in this study. Generally, INP data that was clearly archived at locations further north than 66∘34′ were considered in this study (see positional information in Fig. 7 and detailed data features in Table S3 in the Supplement). Overall, 32 155 observations of INP concentration as a function of nucleation temperature were applied to evaluate the background INP parameterization developed from the Ny-Ålesund campaign data in this study. Figure 8 compares the measured INP concentrations in this study and the selected reference Arctic measurements. In general, our probed INP concentration range was in agreement with that reported in previous Arctic studies, with this study being one of the few to measure the INP concentrations in the Arctic at temperatures as low as −30 ∘C. However, a few studies (e.g., Wex et al., 2019; Tobo et al., 2019; Creamean et al., 2018) observed consistently higher INP concentrations in the summer, indicating enhanced sources of local emissions due to the decreased ice and snow cover. We note that the parameterization herein was derived from the measurements during transition seasons (autumn and spring), aiming to predict the background level of INP concentrations in the Arctic. Therefore, applying it to generate INP concentrations, particularly in the Arctic summer, could introduce a low bias. On the other hand, the log-normal-distribution-based parameterization developed from high-frequency INP measurements (over 4000 observations in 12 weeks) is insensitive to peak events, i.e., local INP enhancement from instantaneous cases. It is therefore recommended to be implemented for longer-span predictions.
In addition to the seasonal differences, we summarized the INP concentrations at −15 ∘C by classifying the Arctic INP concentration data by measurement platform (Fig. 9). The measured INP concentration ranges overlap between different measuring platforms, except for Prenni et al. (2009), which observed systematically higher INP concentrations (air-borne) compared to other studies, possibly due to the presence of mineral or soil dust. The overall level of ground-based measured INP concentrations was slightly higher than the shipborne measurements at this temperature, indicating a relative enhancement from terrestrial INP sources. Besides, only two studies (Prenni et al., 2009; Hartmann et al., 2020) measured INP concentrations from flight campaigns, challenging the comparison with the other two categories (i.e., ground-based and shipborne).
To evaluate our parameterization, we compared the predicted INP concentrations to observations from previous Arctic field measurements in Fig. 10. From a total of 32 155 comparison observations, 81 % of the INP concentrations are predicted within the 95 % confidence interval, revealing notable predictability of the proposed Arctic parameterization, given that approximately 2 to 3 orders of magnitude of the variation of INP concentrations are naturally observed. However, the INP concentrations tend to be overestimated, particularly towards warm temperatures ( ∘C), because the INP concentrations are highly variable and rather low at these temperatures. More interestingly, the predictions of INP concentrations retain their performance when the evaluation is categorized for seasons (see Fig. 10b). Particularly in spring and autumn, a higher percentage of observations from other studies fall into the 95 % confidence interval of the proposed parameterization. However, more INP concentrations are overpredicted in winter (Fig. 10b, e.g., data from Wex et al., 2019), particularly towards warmer temperatures, likely due to decreasing INP loading from regional emissions when the surface was covered with more ice and snow. This finding agrees with our previous discussion that the LOD of DRINCZ imposed limitations fitting the low INP concentrations at warm temperatures, notably when overall INP loading declines and the log-normal distributions become biased towards the higher INP concentrations that were observed above the LOD. Based on this explanation, the performance of the parameterization should improve in the summer when overall INP concentrations increase due to the increasing local emissions (Tobo et al., 2019; Creamean et al., 2019), which is, however, contradictory to what is shown in Fig. 10b. The predicted INP concentrations are still overestimated, mainly due to the inclusion of 11 804 data points from the filter samples by Hartmann et al. (2021), who observed universally lower INP concentrations during a ship-based campaign in the Arctic Ocean around Svalbard compared to the provided distribution-based (i.e., 95 % confidence interval) predictions. They potentially measured in a region where comparably lower INP concentrations were prevailing, i.e., when measured within the sea ice pack, INP concentrations were systematically lower compared to the ice-free ocean. Another possibility could be the degradation of the filter samples during transport and storage, supported by the fact that the INPs measured by SPIN (an online instrument based on the same measurement principle as HINC) were consistently higher than filter samples measured by their drop freezing method, LINA (see Fig. 8). The above reasons could explain why the filter data from Hartmann et al. (2021) are substantially lower than previous measurements. If Hartmann et al. (2021) data are removed from the evaluation, we achieve approximately 97 % of the data falling within the confidence interval for the summer (not shown). However, our parameterization underestimates the INP concentrations measured in SPIN's temperature range (Hartmann et al., 2021) during summer, which could be explained by the increased local terrestrial source (e.g., mineral dust) in the season when the surface is free of ice and snow.
A 12-week field measurement campaign on ambient INP number concentrations and aerosol properties was undertaken in autumn 2019 and spring 2020 in the Norwegian Arctic in this study. Based on a random dilution model (Ott, 1990), the measured INP concentrations naturally converge to a log-normal frequency distribution if the INP originated from a mix of local and long-ranged sources. During the measurement periods, no significant relationship was observed between the INP concentrations and physical aerosol parameters. Therefore, we developed a log-normal-distribution-based parameterization to predict the median and variation (95 % confidence interval) of atmospheric background INP concentrations dependent solely on nucleation temperature. An advantage of our parameterization is no additional measurements (e.g., aerosol property parameters) are required to retrieve the INP concentrations. Therefore, it is simple to implement in modeling studies. The new parameterization was compared to INP concentrations observed by previous Arctic field measurements, and in general it demonstrated promising predictability within the 95 % confidence interval that covers approximately 2 orders of magnitude, although deviations are larger towards warm temperatures. Note that the presented INP parameterization specified for the Arctic environment is particularly relevant for the autumn and spring transition seasons where no particular aerosol type dominates the INP concentrations. The absence of a dominating aerosol species contributing to the INP concentration is further supported by the low predictive capability of INP concentrations by aerosol parameters and previous aerosol-based INP parameterizations poorly capturing the observed INP concentration in this study. We hope future modeling studies will test the sensitivity of the given parameterization and its effects on cloud properties. The new INP parameterization can be applied to research related to cloud properties as modeling results showed that the Arctic MPCs respond actively to the INP perturbations (Eirund et al., 2019), and Arctic amplification was enhanced given large and fewer ice particles in Arctic MPCs (Tan and Storelvmo, 2019). We hope our INP parameterization promotes future modeling studies via a more simplistic prediction of INP concentrations in the Arctic environment as a function of temperature, particularly during the transition seasons of fall and spring, thus improving the representation of MPCs and Arctic climate.
The data presented in this study are available at https://doi.org/10.3929/ethz-b-000579558 (Li et al., 2022).
The supplement related to this article is available online at: https://doi.org/10.5194/acp-22-14441-2022-supplement.
GL and JW contributed equally to this study. GL and JW performed the INP and aerosol measurements, analyzed the data, and prepared the figures. ZAK conceived the idea of the parameterization. GL, JW, and ZAK interpreted the data. GL and JW drafted the manuscript with contributions from ZAK. JTP and JH were involved in conceiving and organizing the field study. All authors reviewed and commented on the manuscript.
The contact author has declared that none of the authors has any competing interests.
Publisher's note: Copernicus Publications remains neutral with regard to jurisdictional claims in published maps and institutional affiliations.
Guangyu Li and Zamin A. Kanji acknowledge that this project has been made possible by a grant of the Swiss Polar Institute and Frederik Paulsen. Jörg Wieder, Julie T. Pasquier, and Jan Henneberger acknowledge the Swiss Polar Institute (Exploratory Grants 2018) for funding. We acknowledge all those involved in the fieldwork associated with the NASCENT project, including technical support from Michael Rösch, Robert O. David, and from the AWIPEV and Norwegian Polar Institute. We would like to thank Keith Bigg and André Welti for sharing their research data. We want to express our deepest gratitude to Maxim Samarin for the invaluable discussions regarding the temperature fit.
This research has been supported by the Swiss Polar Institute (GLACE 2019 project no. 9), the Schweizerischer Nationalfonds zur Förderung der Wissenschaftlichen Forschung (grant no. 200021_175824), and the European Commission, H2020 Research Infrastructure (FORCeS; grant no. 821205).
This paper was edited by Martina Krämer and reviewed by two anonymous referees.
Cooper, W. A.: Ice initiation in natural clouds, in: Precipitation enhancement – A scientific challenge, American Meteorological Society, Boston, MA, 29–32, https://doi.org/10.1007/978-1-935704-17-1_4, 1986. a, b, c
Creamean, J. M., Cross, J. N., Pickart, R., McRaven, L., Lin, P., Pacini, A., Hanlon, R., Schmale, D. G., Ceniceros, J., Aydell, T., Colombi, N., Bolger, E., and DeMott, P. J.: Ice nucleating particles carried from below a phytoplankton bloom to the Arctic atmosphere, Geophys. Res. Lett., 46, 8572–8581, https://doi.org/10.1029/2019GL083039, 2019. a
Creamean, J. M., Kirpes, R. M., Pratt, K. A., Spada, N. J., Maahn, M., de Boer, G., Schnell, R. C., and China, S.: Marine and terrestrial influences on ice nucleating particles during continuous springtime measurements in an Arctic oilfield location, Atmos. Chem. Phys., 18, 18023–18042, https://doi.org/10.5194/acp-18-18023-2018, 2018. a
David, R. O., Cascajo-Castresana, M., Brennan, K. P., Rösch, M., Els, N., Werz, J., Weichlinger, V., Boynton, L. S., Bogler, S., Borduas-Dedekind, N., Marcolli, C., and Kanji, Z. A.: Development of the DRoplet Ice Nuclei Counter Zurich (DRINCZ): validation and application to field-collected snow samples, Atmos. Meas. Tech., 12, 6865–6888, https://doi.org/10.5194/amt-12-6865-2019, 2019. a, b, c, d, e
DeMott, P. J., Prenni, A. J., Liu, X., Kreidenweis, S. M., Petters, M. D., Twohy, C. H., Richardson, M. S., Eidhammer, T., and Rogers, D. C.: Predicting global atmospheric ice nuclei distributions and their impacts on climate, P. Natl. Acad. Sci. USA, 107, 11217–11222, https://doi.org/10.1073/pnas.0910818107, 2010. a, b, c
DeMott, P. J., Prenni, A. J., McMeeking, G. R., Sullivan, R. C., Petters, M. D., Tobo, Y., Niemand, M., Möhler, O., Snider, J. R., Wang, Z., and Kreidenweis, S. M.: Integrating laboratory and field data to quantify the immersion freezing ice nucleation activity of mineral dust particles, Atmos. Chem. Phys., 15, 393–409, https://doi.org/10.5194/acp-15-393-2015, 2015. a, b
DeMott, P. J., Hill, T. C. J., McCluskey, C. S., Prather, K. A., Collins, D. B., Sullivan, R. C., Ruppel, M. J., Mason, R. H., Irish, V. E., Lee, T., Hwang, C. Y., Rhee, T. S., Snider, J. R., McMeeking, G. R., Dhaniyala, S., Lewis, E. R., Wentzell, J. J. B., Abbatt, J., Lee, C., Sultana, C. M., Ault, A. P., Axson, J. L., Diaz Martinez, M., Venero, I., Santos-Figueroa, G., Dale Stokes, M., Deane, G. B., Mayol-Bracero, O. L., Grassian, V. H., Bertram, T. H., Bertram, A. K., Moffett, B. F., and Franc, G. D.: Sea spray aerosol as a unique source of ice nucleating particles, P. Natl. Acad. Sci. USA, 113, 5797–5803, https://doi.org/10.1073/pnas.1514034112, 2016. a
Eirund, G. K., Possner, A., and Lohmann, U.: Response of Arctic mixed-phase clouds to aerosol perturbations under different surface forcings, Atmos. Chem. Phys., 19, 9847–9864, https://doi.org/10.5194/acp-19-9847-2019, 2019. a
Fletcher, N. H.: The physics of rainclouds/NH Fletcher; with an introductory chapter by P. Squires and a foreword by E. G. Bowen, Cambridge University Press, 1962. a, b, c
Gantt, B. and Meskhidze, N.: The physical and chemical characteristics of marine primary organic aerosol: a review, Atmos. Chem. Phys., 13, 3979–3996, https://doi.org/10.5194/acp-13-3979-2013, 2013. a
Hartmann, M., Adachi, K., Eppers, O., Haas, C., Herber, A., Holzinger, R., Hünerbein, A., Jäkel, E., Jentzsch, C., van Pinxteren, M., Wex, H., Willmes, S., and Stratmann, F.: Wintertime airborne measurements of ice nucleating particles in the high Arctic: A hint to a marine, biogenic source for ice nucleating particles, Geophys. Res. Lett., 47, e2020GL087770, https://doi.org/10.1029/2020GL087770, 2020. a, b
Hartmann, M., Gong, X., Kecorius, S., van Pinxteren, M., Vogl, T., Welti, A., Wex, H., Zeppenfeld, S., Herrmann, H., Wiedensohler, A., and Stratmann, F.: Terrestrial or marine – indications towards the origin of ice-nucleating particles during melt season in the European Arctic up to 83.7∘ N, Atmos. Chem. Phys., 21, 11613–11636, https://doi.org/10.5194/acp-21-11613-2021, 2021. a, b, c, d
Hawker, R. E., Miltenberger, A. K., Wilkinson, J. M., Hill, A. A., Shipway, B. J., Cui, Z., Cotton, R. J., Carslaw, K. S., Field, P. R., and Murray, B. J.: The temperature dependence of ice-nucleating particle concentrations affects the radiative properties of tropical convective cloud systems, Atmos. Chem. Phys., 21, 5439–5461, https://doi.org/10.5194/acp-21-5439-2021, 2021. a
Hoose, C. and Möhler, O.: Heterogeneous ice nucleation on atmospheric aerosols: a review of results from laboratory experiments, Atmos. Chem. Phys., 12, 9817–9854, https://doi.org/10.5194/acp-12-9817-2012, 2012. a
Igel, A. L., Ekman, A. M., Leck, C., Tjernström, M., Savre, J., and Sedlar, J.: The free troposphere as a potential source of arctic boundary layer aerosol particles, Geophys. Res. Lett., 44, 7053–7060, https://doi.org/10.1002/2017GL073808, 2017. a
Irish, V. E., Elizondo, P., Chen, J., Chou, C., Charette, J., Lizotte, M., Ladino, L. A., Wilson, T. W., Gosselin, M., Murray, B. J., Polishchuk, E., Abbatt, J. P. D., Miller, L. A., and Bertram, A. K.: Ice-nucleating particles in Canadian Arctic sea-surface microlayer and bulk seawater, Atmos. Chem. Phys., 17, 10583–10595, https://doi.org/10.5194/acp-17-10583-2017, 2017. a
Kanji, Z. A., Ladino, L. A., Wex, H., Boose, Y., Burkert-Kohn, M., Cziczo, D. J., and Krämer, M.: Overview of ice nucleating particles, Meteorol. Monogr., 58, 1–1, https://doi.org/10.1175/AMSMONOGRAPHS-D-16-0006.1, 2017. a, b
Lacher, L., Lohmann, U., Boose, Y., Zipori, A., Herrmann, E., Bukowiecki, N., Steinbacher, M., and Kanji, Z. A.: The Horizontal Ice Nucleation Chamber (HINC): INP measurements at conditions relevant for mixed-phase clouds at the High Altitude Research Station Jungfraujoch, Atmos. Chem. Phys., 17, 15199–15224, https://doi.org/10.5194/acp-17-15199-2017, 2017. a, b, c, d, e, f
Lewinschal, A., Ekman, A. M. L., Hansson, H.-C., Sand, M., Berntsen, T. K., and Langner, J.: Local and remote temperature response of regional SO2 emissions, Atmos. Chem. Phys., 19, 2385–2403, https://doi.org/10.5194/acp-19-2385-2019, 2019. a
Li, G., Wieder, J., Pasquier, J., Henneberger, J., and Kanji, Z. A.: Predicting atmospheric background number concentration of ice-nucleating particles in the Arctic, ETH Zurich [data set], https://doi.org/10.3929/ethz-b-000579558, 2022. a
Lohmann, U.: A glaciation indirect aerosol effect caused by soot aerosols, Geophys. Res. Lett., 29, 11–1, https://doi.org/10.1029/2001GL014357, 2002. a
Mason, R. H., Si, M., Li, J., Chou, C., Dickie, R., Toom-Sauntry, D., Pöhlker, C., Yakobi-Hancock, J. D., Ladino, L. A., Jones, K., Leaitch, W. R., Schiller, C. L., Abbatt, J. P. D., Huffman, J. A., and Bertram, A. K.: Ice nucleating particles at a coastal marine boundary layer site: correlations with aerosol type and meteorological conditions, Atmos. Chem. Phys., 15, 12547–12566, https://doi.org/10.5194/acp-15-12547-2015, 2015. a
McCluskey, C. S., Ovadnevaite, J., Rinaldi, M., Atkinson, J., Belosi, F., Ceburnis, D., Marullo, S., Hill, T. C., Lohmann, U., Kanji, Z. A., O'Dowd, C., Kreidenweis, S. M., and DeMott, P. J.: Marine and Terrestrial Organic Ice-Nucleating Particles in Pristine Marine to Continentally Influenced Northeast Atlantic Air Masses, J. Geophys. Res.-Atmos., 123, 6196–6212, https://doi.org/10.1029/2017JD028033, 2018. a, b, c
Meyers, M. P., DeMott, P. J., and Cotton, W. R.: New primary ice-nucleation parameterizations in an explicit cloud model, J. Appl. Meteorol. Climatol., 31, 708–721, https://doi.org/10.1175/1520-0450(1992)031<0708:NPINPI>2.0.CO;2, 1992. a, b, c
Murray, B., O'sullivan, D., Atkinson, J., and Webb, M.: Ice nucleation by particles immersed in supercooled cloud droplets, Chem, Soc, Rev,, 41, 6519–6554, https://doi.org/10.1039/C2CS35200A, 2012. a
Murray, B. J., Carslaw, K. S., and Field, P. R.: Opinion: Cloud-phase climate feedback and the importance of ice-nucleating particles, Atmos. Chem. Phys., 21, 665–679, https://doi.org/10.5194/acp-21-665-2021, 2021. a
Najafi, M. R., Zwiers, F. W., and Gillett, N. P.: Attribution of Arctic temperature change to greenhouse-gas and aerosol influences, Nat. Clim. Change, 5, 246–249, https://doi.org/10.1038/nclimate2524, 2015. a
Niemand, M., Möhler, O., Vogel, B., Vogel, H., Hoose, C., Connolly, P., Klein, H., Bingemer, H., Demott, P., Skrotzki, J., and Leisner, T.: A particle-surface-area-based parameterization of immersion freezing on desert dust particles, J. Atmos. Sci., 69, 3077–3092, https://doi.org/10.1175/JAS-D-11-0249.1, 2012. a, b
Ott, W. R.: A physical explanation of the lognormality of pollutant concentrations, J. Air Waste Manag. Assoc., 40, 1378–1383, https://doi.org/10.1080/10473289.1990.10466789, 1990. a, b, c, d
Pasquier, J. T., David, R. O., Freitas, G., Gierens, R., Gramlich, Y., Haslett, S., Li, G., Schäfer, B., Siegel, K., Wieder, J., Adachi, K., Belosi, F., Carlsen, T., Decesari, S., Ebell, K., Gilardoni, S., Gysel-Beer, M., Henneberger, J., Inoue, J., Kanji, Z. A., Koike, M., Kondo, Y., Krejci, R., Lohmann, U., Maturilli, M., Mazzolla, M., Modini, R., Mohr, C., Motos, G., Nenes, A., Nicosia, A., Ohata, S., Paglione, M., Park, S., Pileci, R. E., Ramelli, F., Rinaldi, M., Ritter, C., Sato, K., Storelvmo, T., Tobo, Y., Traversi, R., Viola, A., and Zieger, P.: The Ny-Ålesund Aerosol Cloud Experiment (NASCENT): Overview and First Results, B. Am. Meteorol. Soc., accepted, https://doi.org/10.1175/BAMS-D-21-0034.1, 2022. a, b
Petters, M. and Wright, T.: Revisiting ice nucleation from precipitation samples, Geophys. Res. Lett., 42, 8758–8766, https://doi.org/10.1002/2015GL065733, 2015. a
Pithan, F. and Mauritsen, T.: Arctic amplification dominated by temperature feedbacks in contemporary climate models, Nat. Geosci., 7, 181, https://doi.org/10.1038/ngeo2071, 2014. a
Prenni, A. J., Demott, P. J., Rogers, D. C., Kreidenweis, S. M., Mcfarquhar, G. M., Zhang, G., and Poellot, M. R.: Ice nuclei characteristics from M-PACE and their relation to ice formation in clouds, Tellus B, 61, 436–448, https://doi.org/10.1111/j.1600-0889.2009.00415.x, 2009. a, b
Schmale, J., Zieger, P., and Ekman, A. M.: Aerosols in current and future Arctic climate, Nat. Clim. Change, 11, 95–105, https://doi.org/10.1038/s41558-020-00969-5, 2021. a, b
Schneider, J., Höhler, K., Heikkilä, P., Keskinen, J., Bertozzi, B., Bogert, P., Schorr, T., Umo, N. S., Vogel, F., Brasseur, Z., Wu, Y., Hakala, S., Duplissy, J., Moisseev, D., Kulmala, M., Adams, M. P., Murray, B. J., Korhonen, K., Hao, L., Thomson, E. S., Castarède, D., Leisner, T., Petäjä, T., and Möhler, O.: The seasonal cycle of ice-nucleating particles linked to the abundance of biogenic aerosol in boreal forests, Atmos. Chem. Phys., 21, 3899–3918, https://doi.org/10.5194/acp-21-3899-2021, 2021. a, b, c, d, e, f, g
Schrod, J., Thomson, E. S., Weber, D., Kossmann, J., Pöhlker, C., Saturno, J., Ditas, F., Artaxo, P., Clouard, V., Saurel, J.-M., Ebert, M., Curtius, J., and Bingemer, H. G.: Long-term deposition and condensation ice-nucleating particle measurements from four stations across the globe, Atmos. Chem. Phys., 20, 15983–16006, https://doi.org/10.5194/acp-20-15983-2020, 2020. a, b
Serreze, M. C. and Barry, R. G.: Processes and impacts of Arctic amplification: A research synthesis, Global Planet. Change, 77, 85–96, https://doi.org/10.1016/j.gloplacha.2011.03.004, 2011. a
Tan, I. and Storelvmo, T.: Evidence of strong contributions from mixed-phase clouds to Arctic climate change, Geophys. Res. Lett., 46, 2894–2902, https://doi.org/10.1029/2018GL081871, 2019. a, b
Thomas, D. and Charvet, A.: An Introduction to Aerosols, Aerosol Filtration, Aerosol Fi., 1–30, https://doi.org/10.1016/B978-1-78548-215-1.50001-9, 2017. a
Tobo, Y., Prenni, A. J., DeMott, P. J., Huffman, J. A., McCluskey, C. S., Tian, G., Pöhlker, C., Pöschl, U., and Kreidenweis, S. M.: Biological aerosol particles as a key determinant of ice nuclei populations in a forest ecosystem, J. Geophys. Res.-Atmos., 118, 10–100, https://doi.org/10.1002/jgrd.50801, 2013. a, b
Tobo, Y., Adachi, K., DeMott, P. J., Hill, T. C., Hamilton, D. S., Mahowald, N. M., Nagatsuka, N., Ohata, S., Uetake, J., Kondo, Y., and Koike, M.: Glacially sourced dust as a potentially significant source of ice nucleating particles, Nat. Geosci., 12, 253–258, https://doi.org/10.1038/s41561-019-0314-x, 2019. a, b, c, d
Twohy, C. H., DeMott, P. J., Russell, L. M., Toohey, D. W., Rainwater, B., Geiss, R., Sanchez, K. J., Lewis, S., Roberts, G. C., Humphries, R. S., McCluskey, C. S., Moore, K. A., Selleck, P. W., Keywood, M. D., Ward, J. P., and McRobert, I. M.: Cloud-Nucleating Particles Over the Southern Ocean in a Changing Climate, Earth's Future, 9, e2020EF001673, https://doi.org/10.1029/2020EF001673, 2021. a
Vali, G.: Quantitative Evaluation of Experimental Results an the Heterogeneous Freezing Nucleation of Supercooled Liquids, J. Atmos. Sci., 28, 402–409, https://doi.org/10.1175/1520-0469(1971)028<0402:QEOERA>2.0.CO;2, 1971. a
Vali, G.: Revisiting the differential freezing nucleus spectra derived from drop-freezing experiments: methods of calculation, applications, and confidence limits, Atmos. Meas. Tech., 12, 1219–1231, https://doi.org/10.5194/amt-12-1219-2019, 2019. a, b
Vali, G., DeMott, P. J., Möhler, O., and Whale, T. F.: Technical Note: A proposal for ice nucleation terminology, Atmos. Chem. Phys., 15, 10263–10270, https://doi.org/10.5194/acp-15-10263-2015, 2015. a
Welti, A., Müller, K., Fleming, Z. L., and Stratmann, F.: Concentration and variability of ice nuclei in the subtropical maritime boundary layer, Atmos. Chem. Phys., 18, 5307–5320, https://doi.org/10.5194/acp-18-5307-2018, 2018. a, b
Wex, H., Huang, L., Zhang, W., Hung, H., Traversi, R., Becagli, S., Sheesley, R. J., Moffett, C. E., Barrett, T. E., Bossi, R., Skov, H., Hünerbein, A., Lubitz, J., Löffler, M., Linke, O., Hartmann, M., Herenz, P., and Stratmann, F.: Annual variability of ice-nucleating particle concentrations at different Arctic locations, Atmos. Chem. Phys., 19, 5293–5311, https://doi.org/10.5194/acp-19-5293-2019, 2019. a, b
Wieder, J., Ihn, N., Mignani, C., Haarig, M., Bühl, J., Seifert, P., Engelmann, R., Ramelli, F., Kanji, Z. A., Lohmann, U., and Henneberger, J.: Retrieving ice-nucleating particle concentration and ice multiplication factors using active remote sensing validated by in situ observations, Atmos. Chem. Phys., 22, 9767–9797, https://doi.org/10.5194/acp-22-9767-2022, 2022a. a
Wieder, J., Mignani, C., Schär, M., Roth, L., Sprenger, M., Henneberger, J., Lohmann, U., Brunner, C., and Kanji, Z. A.: Unveiling atmospheric transport and mixing mechanisms of ice-nucleating particles over the Alps, Atmos. Chem. Phys., 22, 3111–3130, https://doi.org/10.5194/acp-22-3111-2022, 2022b. a
Wilson, T. W., Ladino, L. A., Alpert, P. A., Breckels, M. N., Brooks, I. M., Browse, J., Burrows, S. M., Carslaw, K. S., Huffman, J. A., Judd, C., Kilthau, W. P., Mason, R. H., McFiggans, G., Miller, L. A., Nájera, J. J., Polishchuk, E., Rae, S., Schiller, C. L., Si, M., Temprado, J. V., Whale, T. F., Wong, J. P. S., Wurl, O., Yakobi-Hancock, J. D., Abbatt, J. P. D., Aller, J. Y., Bertram, A. K., Knopf, D. A., and Murray, B. J.: A marine biogenic source of atmospheric ice-nucleating particles, Nature, 525, 234, https://doi.org/10.1038/nature14986, 2015. a, b