the Creative Commons Attribution 4.0 License.
the Creative Commons Attribution 4.0 License.
 | 03 Nov 2022
Measurement report: Evolution and distribution of NH3 over Mexico City from ground-based and satellite infrared spectroscopic measurements
Beatriz Herrera
Alejandro Bezanilla
Thomas Blumenstock
Enrico Dammers
Frank Hase
Lieven Clarisse
Adolfo Magaldi
Claudia Rivera
Wolfgang Stremme
Kimberly Strong
Camille Viatte
Martin Van Damme
Michel Grutter
Ammonia (NH3) is the most abundant alkaline compound in the atmosphere, with consequences for the environment, human health, and radiative forcing. In urban environments, it is known to play a key role in the formation of secondary aerosols through its reactions with nitric and sulfuric acids. However, there are only a few studies about NH3 in Mexico City. In this work, atmospheric NH3 was measured over Mexico City between 2012 and 2020 by means of ground-based solar absorption spectroscopy using Fourier transform infrared (FTIR) spectrometers at two sites (urban and remote). Total columns of NH3 were retrieved from the FTIR spectra and compared with data obtained from the Infrared Atmospheric Sounding Interferometer (IASI) satellite instrument. The diurnal variability of NH3 differs between the two FTIR stations and is strongly influenced by the urban sources. Most of the NH3 measured at the urban station is from local sources, while the NH3 observed at the remote site is most likely transported from the city and surrounding areas. The evolution of the boundary layer and the temperature play a significant role in the recorded seasonal and diurnal patterns of NH3. Although the vertical columns of NH3 are much larger at the urban station, the observed annual cycles are similar for both stations, with the largest values in the warm months, such as April and May. The IASI measurements underestimate the FTIR NH3 total columns by an average of 32.2±27.5 % but exhibit similar temporal variability. The NH3 spatial distribution from IASI shows the largest columns in the northeast part of the city. In general, NH3 total columns over Mexico City measured at the FTIR stations exhibited an average annual increase of molecules cm−2 yr−1 (urban, from 2012 to 2019) and molecules cm−2 yr−1 (remote, from 2012 to 2020), while IASI data within 20 km of the urban station exhibited an average annual increase of molecules cm−2 yr−1 from 2008 to 2018.
- Article
(6173 KB) - Full-text XML
- BibTeX
- EndNote


Atmospheric ammonia (NH3) is the most abundant basic gas in ambient air (Behera et al., 2013). It predominantly reacts with sulfuric acid (H2SO4) and nitric acid (HNO3) vapour to neutralize a significant fraction of the atmospheric acidity and form ammonium sulfate and ammonium nitrate salts (Seinfeld and Pandis, 2006). Rich NH3 environments thus promote the formation of secondary inorganic aerosols, which can account for up to 50 % of the mass in the total particular matter (PM) (Behera et al., 2013). PM2.5 (PM with an aerodynamic diameter <2.5 µm) is associated with premature human mortality (Paulot and Jacob, 2014; Giannakis et al., 2019), highlighting the importance of taking action to reduce the health impacts due to air pollution, particularly in densely populated environments.
NH3 has a short lifetime, on the order of hours to a few days (Dammers et al., 2016, 2019; Nair and Yu, 2020; Evangeliou et al., 2021), and exhibits a strong temporal and spatial variability that ranges over three orders of magnitude near the surface (Shephard et al., 2011). NH3 emissions and deposition strongly depend on environmental conditions. The primary sources of atmospheric NH3 are related to agricultural activities (mainly livestock and fertilizers), as well as natural sources, biomass burning, vehicular emissions, humans, and pets (Bouwman et al., 1997; Sutton et al., 2008, 2013). Human NH3 emissions strongly depend on temperature and skin exposure, for example, one adult can emit 0.4 mg of NH3 per hour at 25 ∘C but 1.4 of NH3 per hour at 29 ∘C (Li et al., 2020). In countries with intensive livestock production, NH3 is the main contributor to nitrogen fluxes. Emitted NH3 can be transported by winds and removed from the atmosphere by wet and dry deposition (Neirynck and Ceulemans, 2008; Behera et al., 2013). NH3 deposition also has an important role in the acidification and eutrophication of ecosystems (Krupa, 2003; Sutton et al., 2008), with multiple effects on water, air, soil, climate, and biodiversity (Sutton et al., 2013).
NH3 accounts for almost half of all reactive nitrogen released in the atmosphere, with total NH3 emissions doubling from 1860 to 1993 and possibly doubling again by 2050 (Krupa, 2003; Galloway et al., 2004; Clarisse et al., 2009) mainly driven by the increasing use of fertilizers. Recent advances in satellite remote sensing have resulted in a better knowledge of global NH3 concentrations, however, uncertainties in the total NH3 budget, along with the specific emission sources across different spatial scales, remain high mainly due to the lack of observations on land (Clarisse et al., 2009; Behera et al., 2013; Sutton et al., 2013).
The number and size of the world's cities is increasing, with some of them becoming megacities, hosting more than 10 million inhabitants. The urban population worldwide is expected to continue this increase in the coming years, adding about 10 more megacities by 2030 (United Nations, 2018). These massive concentrations of people and their activities present significant challenges for the global environment, especially in terms of air pollution, climate, and human health. One of the largest metropolitan areas in the world, and the largest in North America, is the Mexico City metropolitan area (MCMA), a megacity of >21 million inhabitants that presents poor air quality during many days of the year. It is located in a basin surrounded by mountains and volcanoes, complicating the ventilation of the polluted air (Molina et al., 2020) that is dominated by the dynamics of the boundary layer (Stremme et al., 2013; Dammers et al., 2016). The Mexico City Emissions Inventory (SEDEMA, 2021) reports that the MCMA hosts almost 6 million vehicles and 1900 regulated industries, and emits a total of 46 931 t of NH3 yr−1 in the MCMA, including part of the Estado de Mexico. According to the inventory, 0.3 % of NH3 emissions in Mexico City come from “point sources” such as industry, 5.5 % from “mobile sources” such as vehicles, and 94.2 % from “area sources” including urban waste (1.09 %), agriculture (9.44 %), livestock (13.92 %), and other (69.75 %); within the other category are domestic emissions (69.73 %) and forest fires (0.01 %). The inventory strongly attributes domestic emissions of NH3 to feces from domesticated animals; in Mexico, the estimated number of dogs and cats is around 23 million with 70 % of them being homeless (GACETA, 2022). Despite the frequent pollution episodes due to PM, the local government has not implemented policies regulating NH3 emissions.
A few studies have investigated atmospheric NH3 in the Mexico City area. Surface NH3 concentrations between 10 and 40 ppbv were measured using an open-path Fourier transform infrared (FTIR) spectrometer, with the highest mixing ratios observed in the morning hours during a 2-month period (Moya et al., 2004). FTIR-NH3 time series between 2012 and 2015 contributed to a validation study of Infrared Atmospheric Sounding Interferometer (IASI) (Dammers et al., 2016) and Cross-track Infrared Sounder (CrIS) (Dammers et al., 2017) NH3 satellite products. In terms of NH3 emissions in Mexico City, Yokelson et al. (2007) reported NH3 emission factors from forest fires in the mountains surrounding Mexico City in 2006, and Christian et al. (2010) reported emission factors from garbage burning and domestic and industrial biofuel use in central Mexico. A more recent study by Cady-Pereira et al. (2017) investigated the impact of biomass burning events on pollution over the MCMA using trace gas data, including NH3, from the Tropospheric Emission Spectrometer (TES) instrument onboard the Aura satellite. That study concluded that biomass burning events can impact pollution levels in Mexico City, specifically the south part of the MCMA and particularly during the March–April–May period. Recently, Clarisse et al. (2019) and Viatte et al. (2022) reported NH3 hotspots near Mexico City at Tochtepec (18.84∘ N, 97.80∘ W), Ezequiel Montes (20.68∘ N, 99.93∘ W), and Tehuacan (18.45∘ N, 97.31∘ W), all of which are classified as agricultural sources. Finally, Van Damme et al. (2021) reported an increasing trend of NH3 over Mexico of (2.5±1.5) ×1013 molecules cm−2 yr−1 using 11 years of IASI satellite data (2008–2018).
In this work, the diurnal and seasonal variability of NH3 over Mexico City is investigated using datasets from two ground-based FTIR spectrometers, including an extension of the FTIR-NH3 total column time series of the station in Mexico City used in Dammers et al. (2016), and of the FTIR-NH3 total columns measured at Altzomoni, a remote high-altitude station close to Mexico City, that are retrieved for the first time. The locations of these two sites are shown in Fig. 1. The analysis is complemented with IASI satellite observations over the region, and back-trajectories that were constructed for anomalous NH3 columns detected at the urban site to assess the influence of local and remote sources.
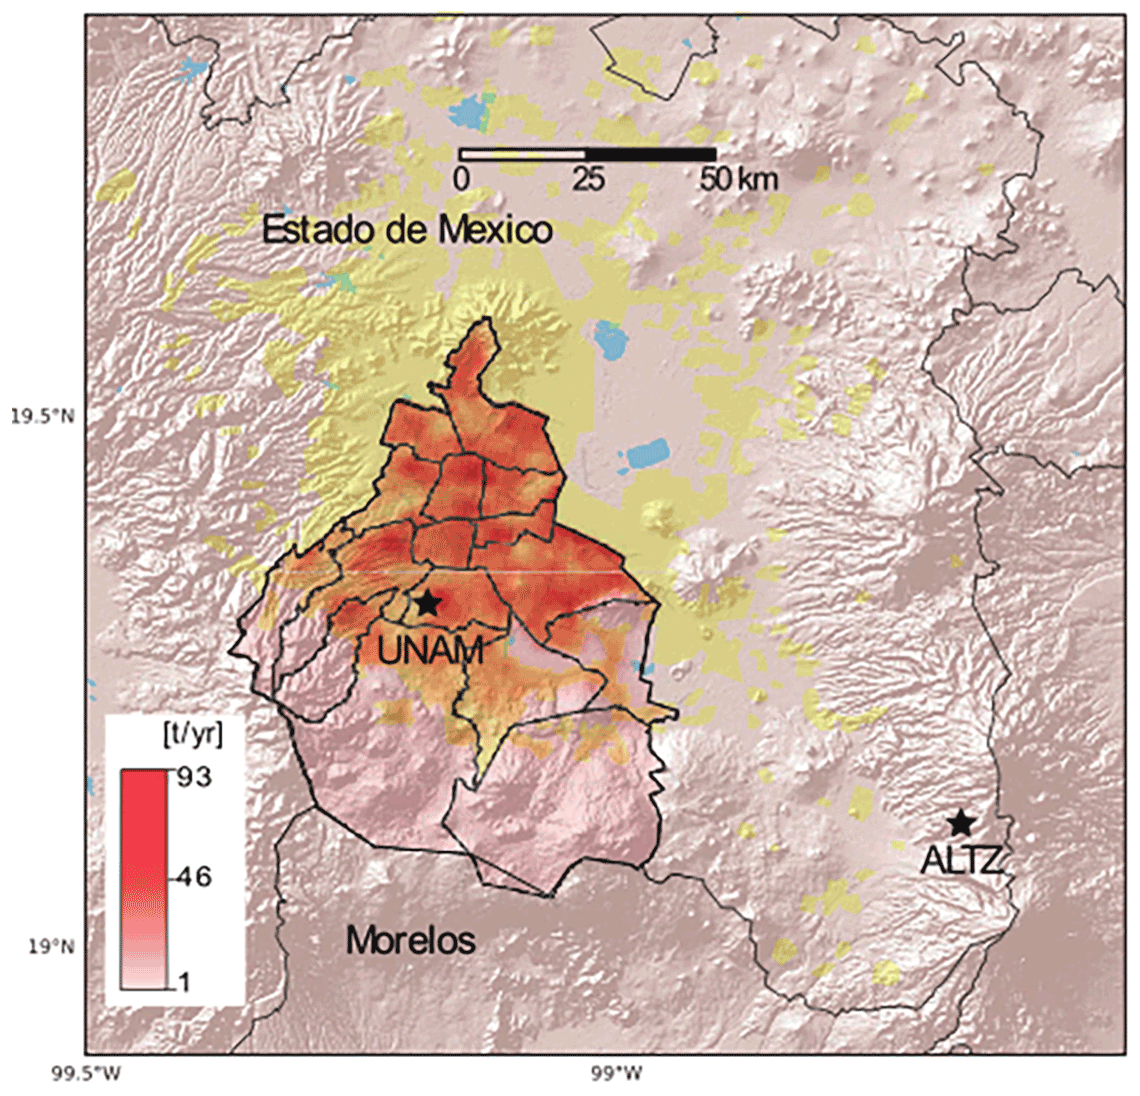
Figure 1Study area in central Mexico. Mexico City is shown in the middle, with the red shading corresponding to NH3 emissions reported in the Mexico City Emissions Inventory 2016 (SEDEMA, 2018) in tonnes per year. The stars indicate the location of the Universidad Nacional Autónoma de Mexico (UNAM) and Altzomoni (ALTZ) stations and the yellow shading indicates the extension of the Mexico City metropolitan area (MCMA).
2.1 Ground-based FTIR stations and retrieval of NH3 total columns
This study utilizes NH3 total columns retrieved from solar absorption spectra measured with ground-based FTIR spectrometers at two sites in and around the MCMA. The urban FTIR station is located at the south of Mexico City within the campus of the Universidad Nacional Autónoma de Mexico on the rooftop of the Instituto de Ciencias de la Atmósfera y Cambio Climático (UNAM, 19.33∘ N, 99.18∘ W, 2280 m a.s.l.). A custom-built solar tracker directs solar radiation to the entrance of a FTIR spectrometer (Bruker Optik GmbH model Vertex 80) that has a maximum unapodized resolution of 0.06 cm−1. The instrument is equipped with a KBr beamsplitter and two detectors (HgCdTe and InGaAs). The HgCdTe detector is cooled with liquid nitrogen. For more details about this system, see Bezanilla et al. (2014). Measurements from the remote FTIR site were made at the Altzomoni Atmospheric Observatory (ALTZ, 19.12∘ N, 98.66∘ W, 3985 m.a.s.l.), a high-altitude station located 60 km from the UNAM urban site and within the Izta-Popo National Park surrounded by nature. This site is part of the Network for the Detection of Atmospheric Composition Change (NDACC) (De Mazière et al., 2018) contributing data from a high-resolution FTIR spectrometer since 2012. This instrument (Bruker Optik GmbH model IFS 120/125 HR) can record solar spectra with a maximum spectral resolution of 0.0035 cm−1, and is equipped with KBr and CaF2 beamsplitters and HgCdTe, InSb, and InGaAs detectors. For details of the site and the instrument, see Baylon et al. (2017). The first study presenting and validating the combined usage of trace gas products obtained from dedicated retrievals with FTIR spectra measured at UNAM and ALTZ was that of Plaza-Medina et al. (2017).
The FTIR spectra used for the retrieval of NH3 were collected with the HgCdTe detector at both sites with a spectral resolution of 0.005 cm−1 at Altzomoni, and 0.1 cm−1 (prior to 2014) and 0.075 cm−1 at UNAM, using an optical band pass filter to enhance the region between 700 and 1400 cm−1. In this study, we extend the UNAM time series used in a previous 2012–2015 comparison between IASI and FTIR (Dammers et al., 2016) with improvements to the retrieval, and we present for the first time Altzomoni FTIR-NH3 retrievals for the period between April 2012 and May 2020. The analysis presented here focuses on the region around the MCMA, also using the IASI satellite product and a back-trajectory evaluation, as described below.
For both sites, the solar FTIR spectra were analysed using PROFFIT version 9.6 for the retrievals (Hase et al., 2004) to obtain the NH3 total columns. A retrieval strategy based on that reported by Dammers et al. (2015) was used, comprising two microwindows (929.1–931.8 and 963.7–970.0 cm−1) to cover the NH3 absorption lines from the υ2 vibrational band in the mid-IR region. The trace gases H2O, CO2, O3, CO, and N2O were taken into account as interfering species for the retrieval for both stations, and the temperature and pressure profiles were obtained from the US National Centers for Environmental Prediction (NCEP). Spectroscopic parameters were obtained from the high-resolution transmission molecular absorption database HITRAN 2008 Rothman et al., 2009), and the a priori profile information about the interfering gases was obtained from 40-year averages of simulations from the Whole Atmosphere Community Climate Model (WACCM) (Eyring et al., 2007; Marsh et al., 2013). Since NH3 profiles from WACCM are only representative of remote regions, scaled a priori profiles derived from 5 years of averaged NH3 simulations from the global chemical transport model GEOS-Chem v11 were used instead. Constructed scaled a priori profiles have been used previously from GEOS-Chem simulations for the retrieval of trace gases (Shephard et al., 2011; Shephard and Cady-Pereira, 2015; Bader et al., 2017). A total of 7992 NH3 columns were retrieved for the UNAM station and 4031 for ALTZ. The resulting uncertainties obtained with PROFFIT averaged over the entire time series in molecules cm−2 at UNAM were 1.25×10¹⁵ (random), 8.40×10¹⁴ (systematic), and 1.52×10¹⁵ or 11.50 % (total); and 3.09×10¹⁴ (random), 3.14×10¹⁴ (systematic), and 4.42×10¹⁴ or 51.37 % (total) at ALTZ. The average degrees of freedom for signal (DOFS) averaged over the entire time series were 2.03 for UNAM and 1.04 for ALTZ.
2.2 IASI-NH3 data product and comparison methodology
IASI measures the infrared thermal radiation emitted by the Earth's surface and the atmosphere from a Sun-synchronous orbit on board the MetOp platform. Spectra are recorded in the 645–2760 cm−1 spectral range at a spectral resolution of 0.5 cm−1 (Clerbaux et al., 2009). The instrument crosses the Equator at mean local solar times of 09:30 LT and 21:30 LT providing global coverage of the Earth twice a day. IASI has a field-of-view composed of four circular footprints each with a diameter of 12 km at the nadir view and up to 20 km×39 km elliptical pixels outside the nadir depending on the satellite viewing angle, complemented by scanning along a swath width of 2200 km off-nadir perpendicular to the ground track (Clarisse et al., 2009; Van Damme et al., 2014, 2015). The IASI-NH3 retrieval products are based on artificial neural networks (ANNs) that link the hyperspectral range index (HRI), a calculated dimensionless index that represents the amount of NH3 in the column, to other input parameters such as temperature, pressure, water vapour profiles, and parameterized vertical profiles of NH3 to derive the NH3 total column. The algorithm maps the HRI to the NH3 total column using a trained neural network; the uncertainty of each NH3 column can be estimated by the propagation of the input parameters' uncertainties. However, large HRI values (more than 3σ) are associated to a confident detection of NH3 (Van Damme et al., 2014, 2017 Whitburn et al., 2016). The current spectral range for the retrieval process is set to 812–1126 cm−1 to increase the sensitivity of NH3 and reduce interferences (Van Damme et al., 2021). The retrieval scheme does not produce averaging kernels, however previous studies comparing the IASI-NH3 product with ground-based FTIR measurements have demonstrated good agreement (e.g. Dammers et al., 2016, 2017; Lutsch et al., 2019; Tournadre et al., 2020; Yamanouchi et al., 2021). In addition, under conditions of high NH3 and when the thermal contrast is large, IASI has maximum sensitivity to NH3 in the boundary layer (Clarisse et al., 2010). An error estimate is provided with each individual IASI observation; for this work IASI observations with errors less than 100 % were used. IASI's average detection limit for NH3 under large thermal contrast is about 3 ppbv, and can be as low as 1 ppbv under conditions of well-mixed NH3 throughout a thick boundary layer (Clarisse et al., 2010).
For this study, 11 years of the IASI-A NH3 total columns (ANNs for IASI (ANNI)-NH3-v3) between 2008–2018 were used; details of this version 3 can be found in Appendix A of Van Damme et al. (2021), and was also used by Yamanouchi et al. (2021) and Viatte et al. (2022). The spatial distribution of NH3 over Mexico City was obtained by averaging all the IASI-A morning observations between January 2008 and December 2018 over this region. The FTIR-NH3 total columns at UNAM were compared against the IASI-NH3 total columns over Mexico City to assess the agreement between both data sets. Due to the high spatiotemporal variability of NH3, the temporal and spatial coincidence criteria were tested and assessed using the correlations (both R and slope). In addition, as suggested in Dammers et al. (2016), an elevation filter (FTIR station altitude minus IASI observation <300 m) was applied. The criteria resulting in the best correlations were elevation filter <300 m, spatial sampling difference <20 km, maximum temporal sampling difference ±40 min, and maximum IASI-NH3 retrieval error of 100 %. The seasonal variability comparison and annual averages were performed using only FTIR-NH3 retrievals between 09:00 LT and 10:59 LT, corresponding to the IASI overpass time over Mexico City, and the <20 km spatial criterion for IASI-NH3 total columns. Altzomoni correlation plots with IASI-NH3 data were not included due to the few coincidences between the FTIR and IASI.
2.3 Back-trajectory analysis
To determine the primary sources of NH3 measured at the UNAM station and to assess the dominant atmospheric transport pathways during the events with the largest hourly means of the NH3 columns in the time series, trajectory cluster analysis (Reizer and Orza, 2018) was applied. Back-trajectories of 8 h were selected to capture the air masses passing over the MCMA. Using the UNAM station as the receptor, back-trajectories were calculated using the Hybrid Single-Particle Lagrangian Integrated Trajectory (HYSPLIT) model (Stein et al., 2015; Draxler et al., 1997) at different altitudes above the UNAM station level (2280 m a.s.l.). The HYSPLIT model can be run online at the following link https://www.ready.noaa.gov/HYSPLIT.php (last access: 21 October 2022). The wind data used for the back-trajectories were derived from the NCEP North American Mesoscale (NAM) analysis product at 12 km and 1 h of spatial and temporal resolution, respectively (NCEPT NAM, 2015). The cluster analysis is an embedded routine in HYSPLIT and is based on the Ward's agglomerative hierarchical clustering algorithm (Ward, 1963). Finally, the total spatial variance (TSV) method (Draxler et al., 2021), included in HYSPLIT, was used to fit the number of clusters that represent the data.
3.1 FTIR-NH3 time series and temporal variability
The NH3 total column time series retrieved at both FTIR stations are shown in Fig. 2. The urban UNAM columns, shown in the top panel, are about one order of magnitude larger than the high-altitude Altzomoni columns. The average NH3 total columns for the entire period ( at UNAM and molecules cm−2 at Altzomoni) are listed and compared to values reported for stations in other parts of the world in Table 1. The Mexico City NH3 total columns are comparable with those reported in Bremen, while they are about twice as large as those measured at Toronto (Canada), Paris (France), and Lauder (New Zealand). Jungfraujoch, a remote high-altitude station in Switzerland with similar characteristics to Altzomoni, presents a significantly lower average NH3 column and also has much lower variability. The reason for this might be that Altzomoni is impacted more frequently by biomass burning events in the dry season and also by the regional boundary layer, receiving polluted air from Mexico City and other large urban centres in the afternoon (Baumgardner et al., 2009).
Table 1Mean NH3 total columns reported from ground-based FTIR stations.
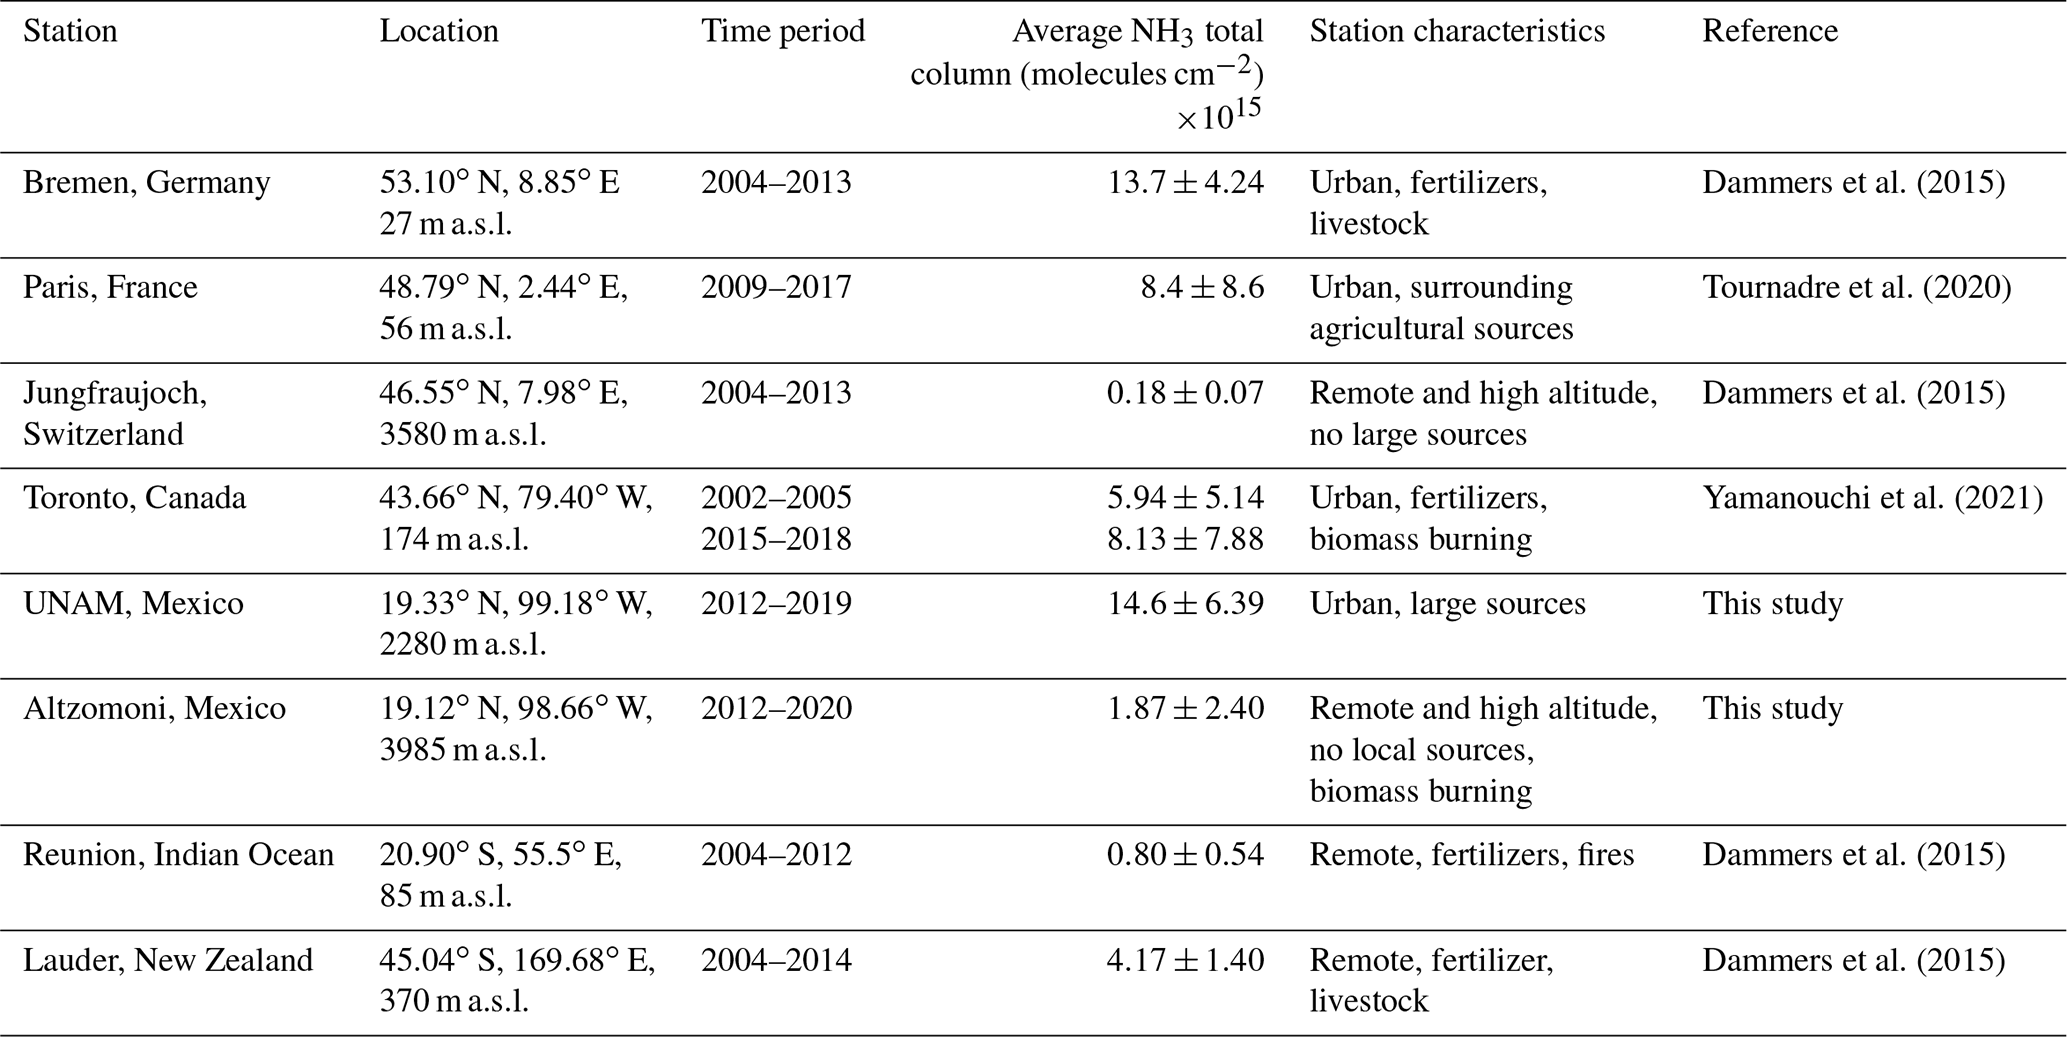
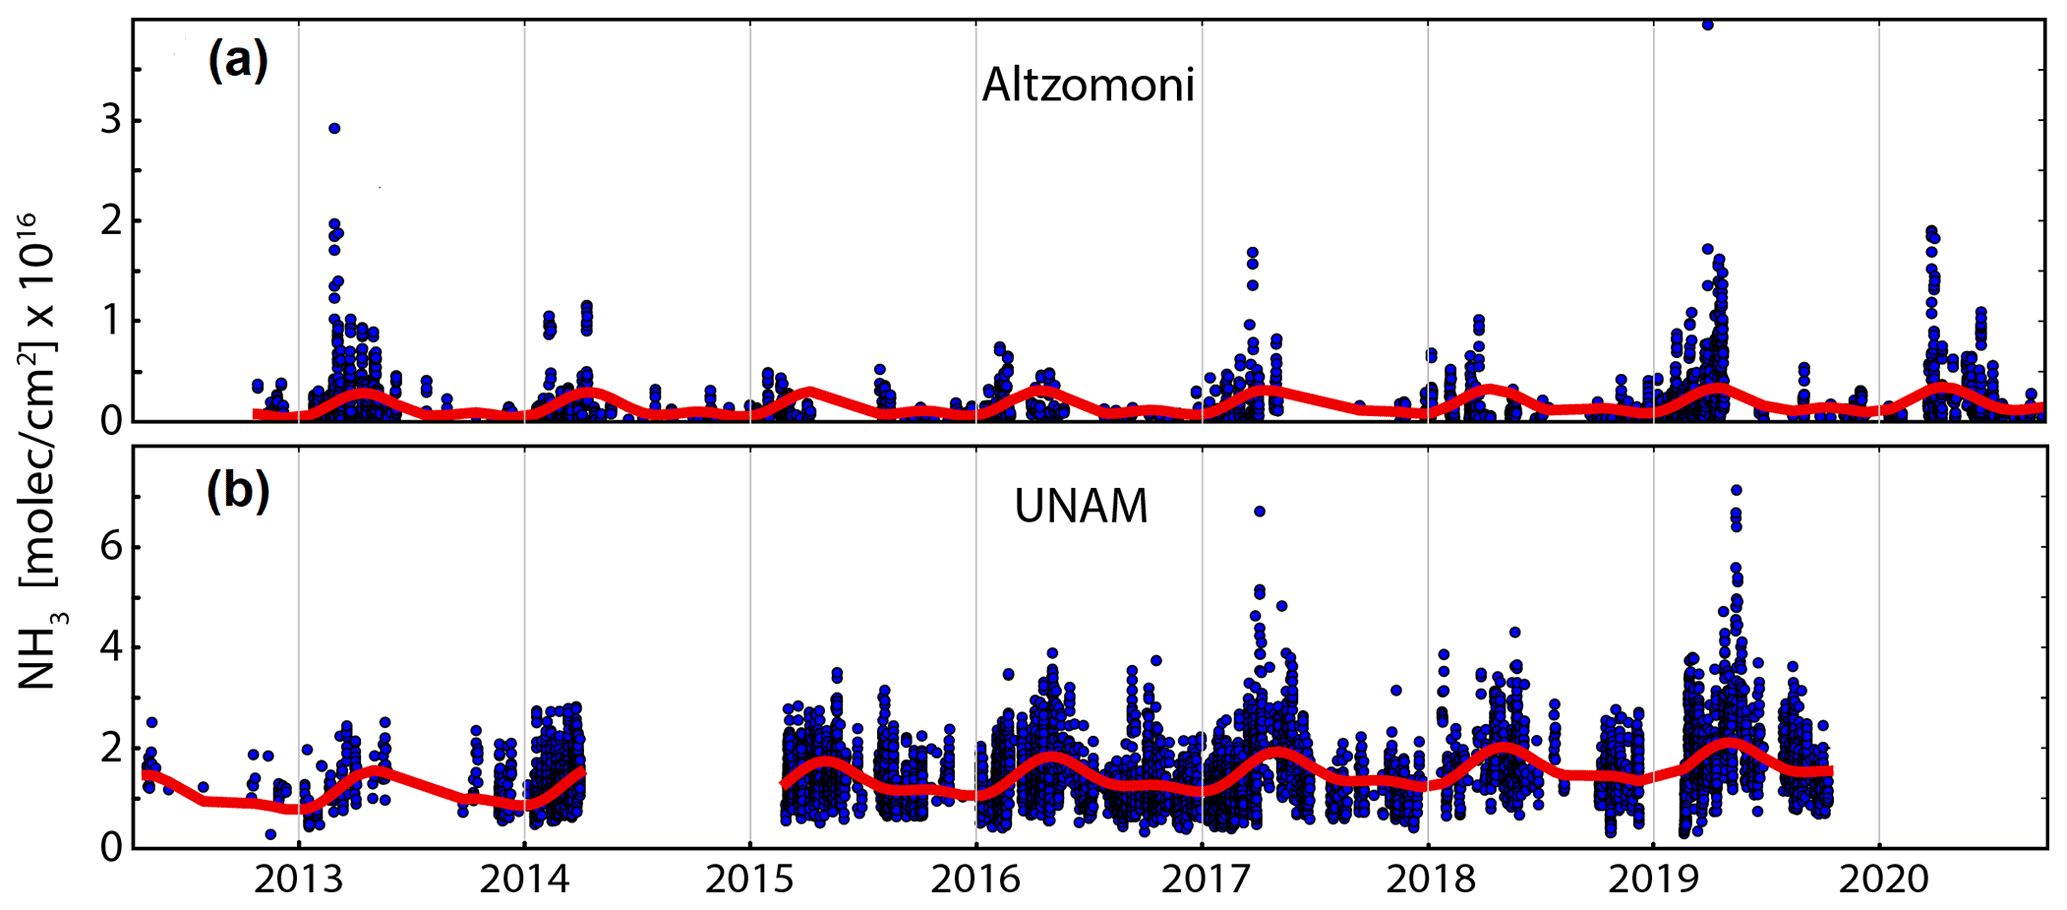
Figure 2Time series of retrieved FTIR-NH3 data over (a) Altzomoni and (b) UNAM, with a fitted Fourier series (red) to reproduce seasonality. Note the differences in magnitude.
Figure 2 also shows the fit of a Fourier series (Baylon et al., 2017) to reproduce seasonality in both stations. A clear cycle is seen at both stations, with a maximum between mid- and late April, and a minimum in late December. However, the difference between the minimum and the maximum is larger at Altzomoni, with UNAM having greater NH3 background concentrations. The average annual increase in the NH3 columns obtained from the Fourier fit are at UNAM (from 2012 to 2019) and molecules cm−2 yr−1 at Altzomoni (from 2012 to 2020). Van Damme et al. (2021) reported a trend from 2008 to 2018 of molecules cm−2 yr−1 for all of Mexico, which is closer to the Altzomoni value. The difference in magnitude can be attributed to the datasets and methodology as the present study uses ground-based FTIR measurements from two sites with higher values in 2019 and 2020, while Van Damme et al. (2021) used IASI satellite data over a wider region between 2008 to 2018.
The average diurnal variability of the FTIR NH3 total columns at both stations is displayed in Fig. 3. The largest average NH3 columns at the urban station are on the order of 1.50×10¹⁶ molecules cm−2 and were observed during the morning and the evening. Although the diurnal pattern is not as evident as in other cities where motor vehicles have been found to be a dominant source of urban NH3 (e.g., Osada et al., 2019; Kotnala et al., 2020), traffic emissions in Mexico City still might play a role in conjunction with other urban sources of atmospheric NH3. The average NH3 columns at UNAM have a minimum of 1.35×10¹⁶ molecules cm−2 at 13 h, which can be attributed to the conversion to ammonium, as was observed by Moya et al. (2004) when describing the evolution of the surface gas phase NH3 and PM NH at an urban site in Mexico City.
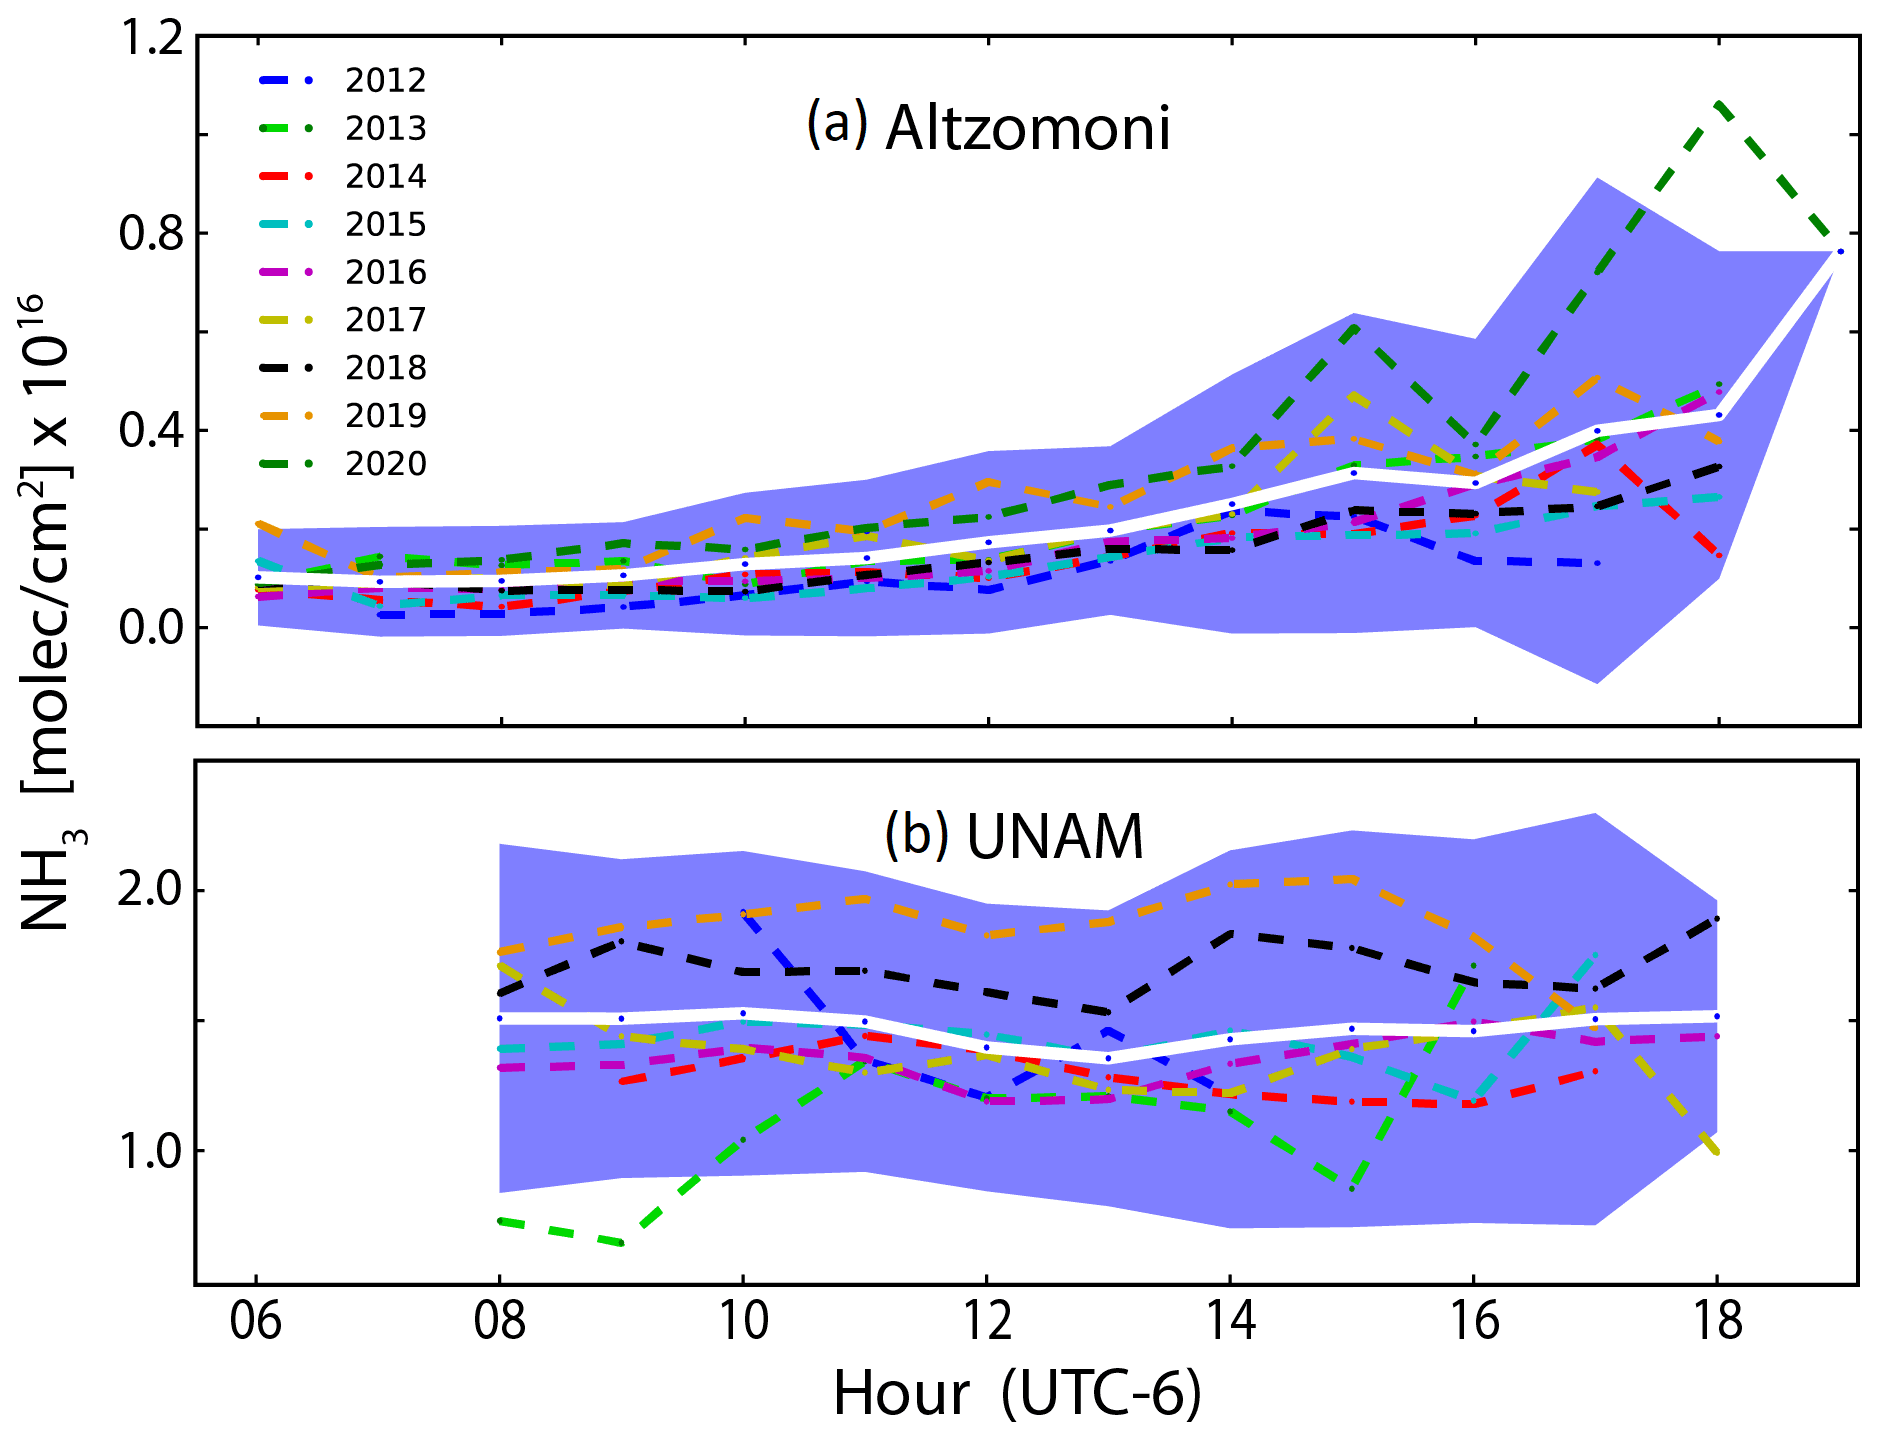
Figure 3Average diurnal evolution of NH3 total columns over Mexico City at (a) Altzomoni and (b) UNAM. Different years are shown in different colours, the thick white line is the average for all years, and the blue shading indicates ±1σ.
The diurnal cycle at the remote station (Fig. 3a) is noticeably different, with NH3 columns that increase systematically as the day progresses, with the largest variability in the afternoon hours. Altzomoni is located within a natural protected area with few local sources of NH3, and even less so during the morning hours when values are around 0.10×10¹⁶ molecules cm−2, when cooler temperatures do not favour the volatilization of NH3. The columns increase throughout the day, having the largest average values of 0.76×10¹⁶ molecules cm−2 in the evening, probably transported from lower altitudes by the dynamics of the regional boundary layer (Baumgardner et al., 2009). This is supported by the large variability observed in the afternoon, since the probability that NH3 is transported >1700 m a.g.l. (above ground level) up to this site strongly depends on the meteorological conditions, which vary from day to day. Comparisons between daily average NH3 columns and the daily averages of some meteorological variables from the RUOA Network (Red Universitaria de Observatorios Atmosféricos), such as temperature, relative humidity (RH), precipitation, and solar radiation, resulted in weak correlations. These correlations were positive with temperature and solar radiation (r between 0.1 and 0.3), and negative with RH and precipitation (r between −0.1 and −0.3). The average wind speed for Altzomoni is 4.5 m s−1, with dominant winds from the east-southeast and west-northwest, while the average wind speed for UNAM is 1.6 m s−1, with dominant winds from the north and the north-northwest.
The seasonal variability of the FTIR NH3 total columns is shown in Fig. 4. In general, the pattern is similar at both stations, showing the NH3 temperature dependence with larger NH3 columns in the months of March, April, and May which correspond to the warm–dry season; this season usually has days with clear skies, weak winds, high pressure systems, and biomass burning events (Molina et al., 2020), and also corresponds to the most critical part of the fire season in Mexico City (CENAPRED, 2021; Yokelson et al., 2007). In addition, there are two agricultural seasons in the country, the first one from April to September and the second one from October to March. The fertilizer application combined with meteorological conditions could favour NH3 volatilization from the agricultural sources contributing to the higher NH3 spring columns observed in Fig. 4. Smaller columns are clearly observed during the wet season (June to October), due to the increase in wet deposition, and during the cold–dry season from November to February, due to less favourable conditions for NH3 volatilization. This is in agreement with Viatte et al. (2022). The annual cycle of NH3 columns at the urban UNAM station is similar to that observed at the background Altzomoni station but has a larger amplitude. A study by Sun et al. (2017) observed that the growing efficiency of three-way catalysts in motor vehicles is responsible for large NH3 emissions detected in urban locations in the USA and China. These emissions are strongly dependent on traffic volume and thus should not have a strong seasonality. On the other hand, emissions originating from agricultural activity usually have a distinct seasonality that depends on the fertilizer application and temperature (Sun et al., 2017; Van Damme et al., 2015, Viatte et al., 2022). In the current study, the annual cycles follow the pattern of temperature (Fig. 4c), indicating that emissions from other sources, such as fires, waste treatment, human or pets emissions, may be contributing significantly to the NH3 detected over the MCMA.
There are more features to note in Fig. 4. While Altzomoni and UNAM NH3 columns have similar annual cycles, those at Altzomoni have greater variability throughout the different years during the warm–dry season than during the rest of the year. This might be due to the strong relationship between pollutants reaching the high-altitude station and the boundary layer dynamics and wind conditions, which are more variable during the warm–dry season. However, another contribution to this variability may be biomass burning activity, which has a maximum during the warm–dry months as has been shown by Cady-Pereira et al. (2017). The 2013 pollution events presented by Cady-Pereira et al. (2017) are seen on 23 April, 9 May, and 25 May in Fig. 2, with 9 May having the largest enhancements at Altzomoni; unfortunately, there are no coincident measurements for UNAM. At Altzomoni, the average NH3 column for 9 May 2013 was molecules cm−2, which is 28 % greater than the average column for the entire period (Table 1). However, in 2013, the largest NH3 column measured at Altzomoni was on the evening of 27 February with an average value of molecules cm−2, almost 10 times higher than the average column presented in Table 1. This enhancement on 27 February 2013 seems to be local and of short duration, most likely due to a nearby biomass burning event. This is supported by the detection of active fires northwest of the site on that date by the MODIS instrument on Aqua as shown in Fig. 5. With its high altitude and few local sources, Altzomoni seems to be more sensitive for the detection of pollution events than UNAM. Even if the fires are not occurring nearby, the increased lifetimes of emitted pollutants at these altitudes may favour transport over longer distances to Altzomoni.
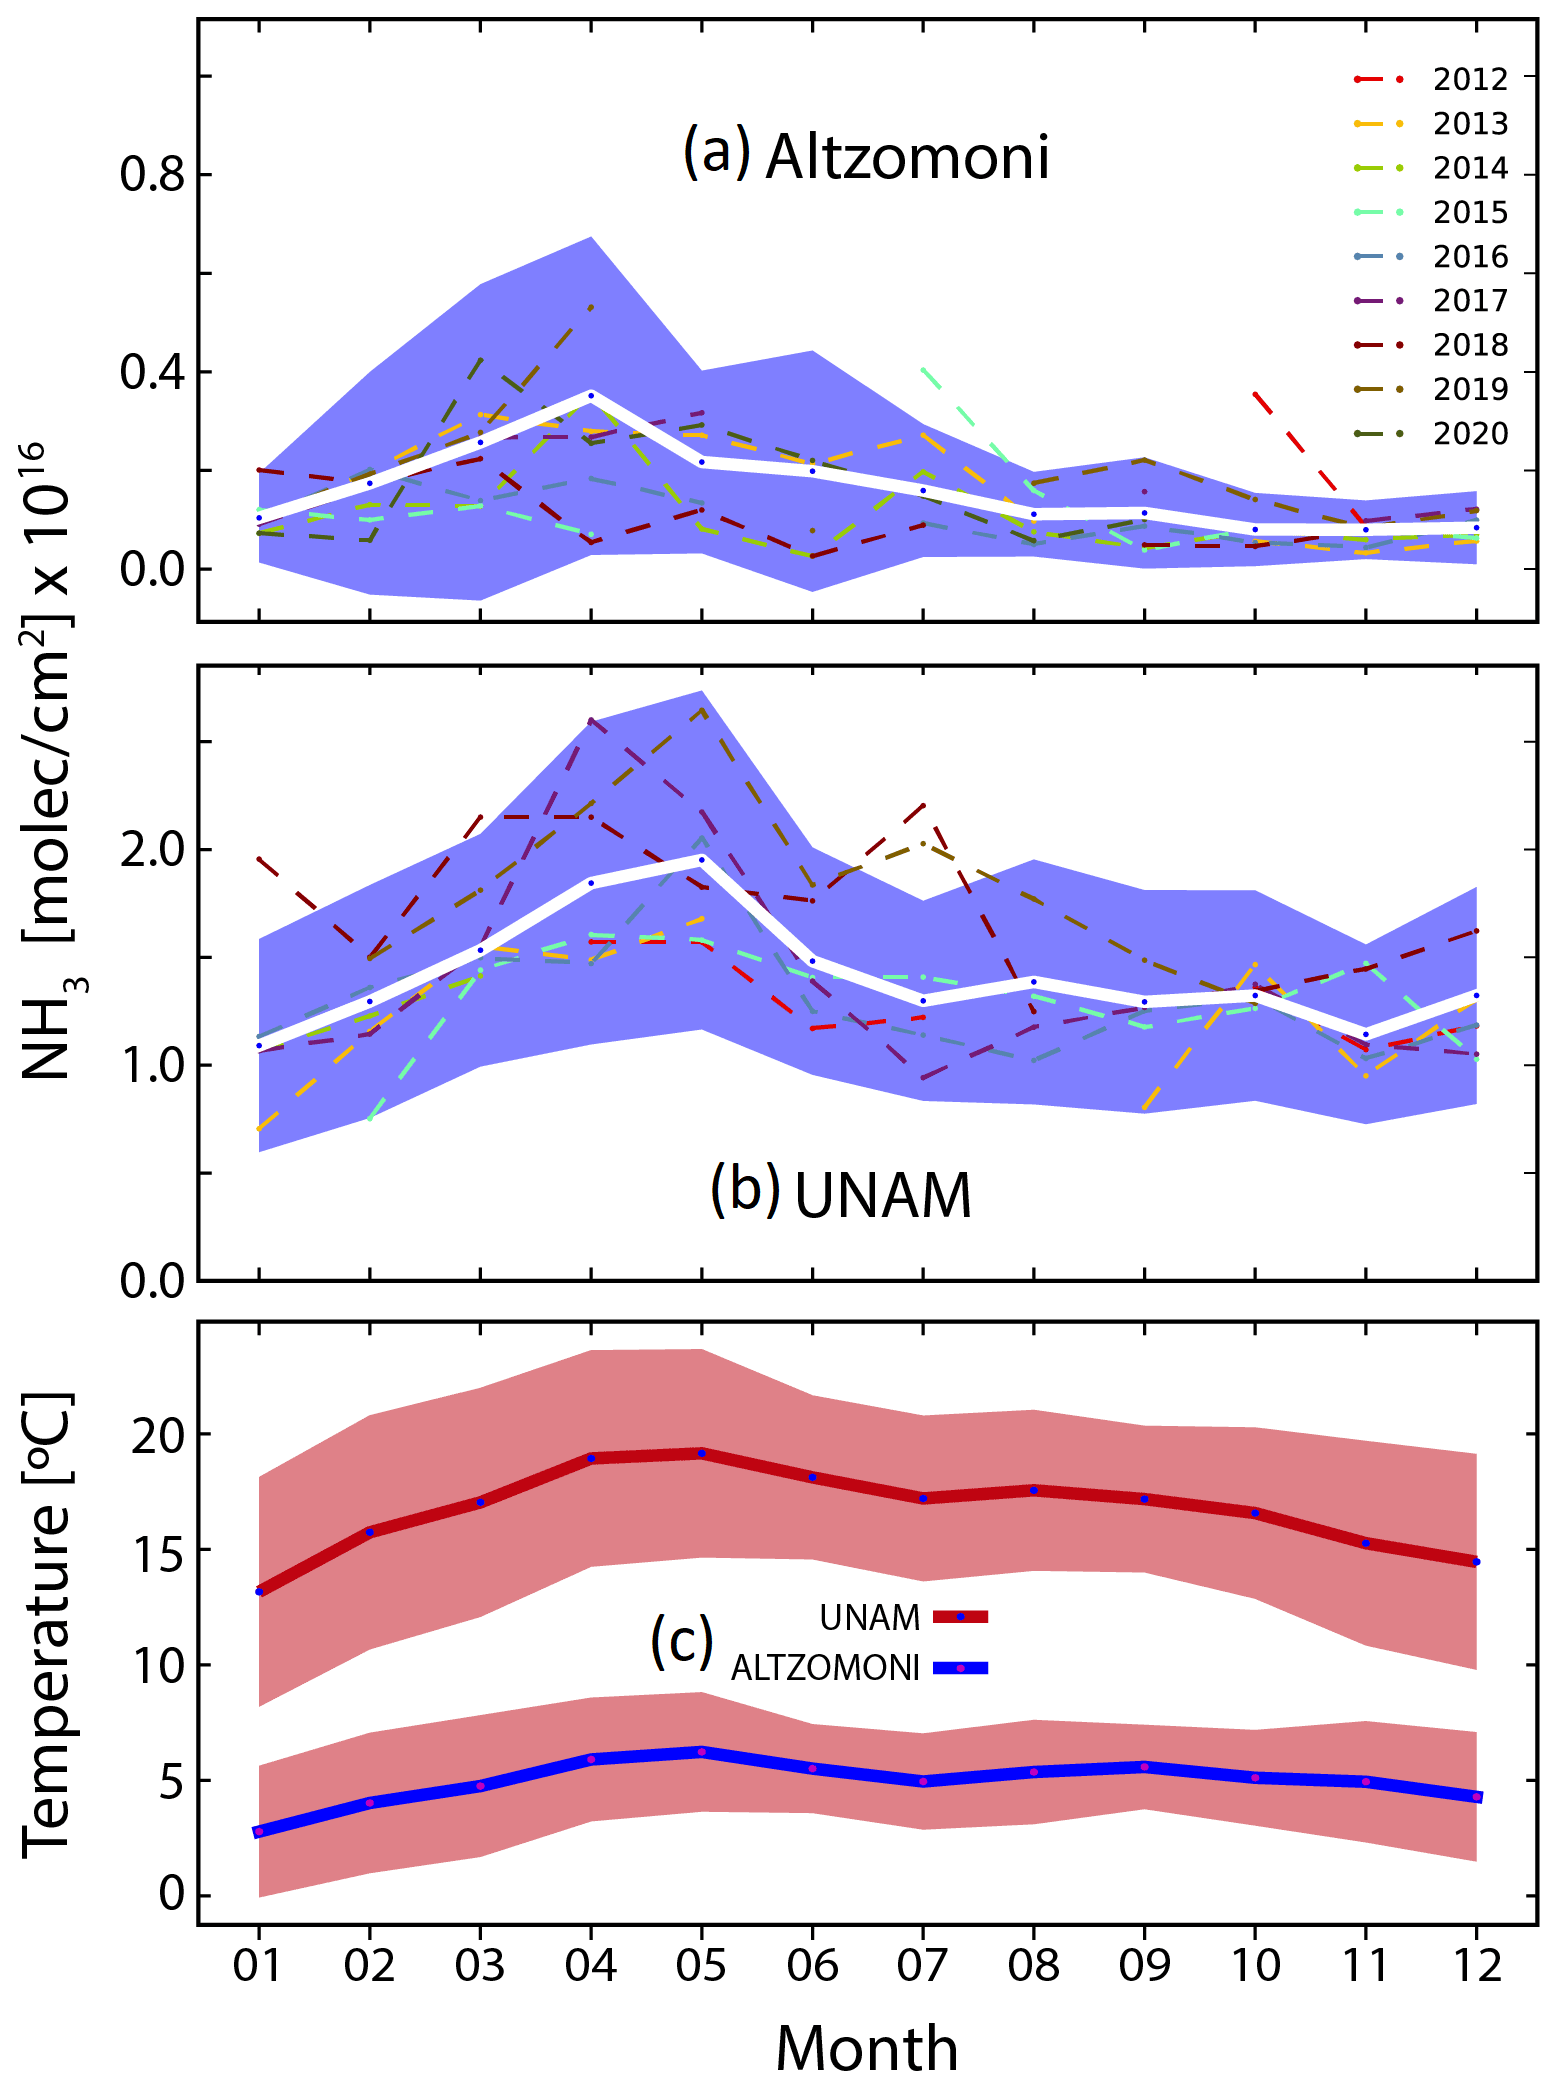
Figure 4Monthly averages showing annual cycle of NH3 over Mexico City at (a) Altzomoni and (b) UNAM. The thick white line is the average for all years and the shading indicates ±1σ. (c) Monthly averages of temperature at both stations between 2014–2018 for Altzomoni and 2012–2018 for UNAM. The shaded area indicates ±1σ.

Figure 5Snapshot of Mexico City's fire events on 27 February 2013, from the Aqua MODIS instrument with true colour-corrected reflectance and resolution of 25 m, obtained from NASA Worldview Snapshots (https://earthdata.nasa.gov, last access: 21 October 2022). The red dots show the fire events. The stars indicate the location of the UNAM and Altzomoni stations.
3.2 Satellite observations: comparison with ground-based measurements and spatial distribution
The correlation between IASI-NH3 and the ground-based FTIR-NH3 total columns at UNAM from November 2013 to December 2018 is shown in Fig. 6. The coincidence criteria are described in Sect. 2.2, and are based on values used in previous validations of IASI products using ground-based FTIR data (Dammers et al., 2016), including an elevation correction using the Space Shuttle Radar Topography Mission Global Product at 3 arcsec resolution over Mexico City (SRTMGL3, Farr et al., 2007). A total of 64 coincident data pairs were found, from which a correlation coefficient R=0.72 and a mean relative difference (MRD) of % were obtained (±1σ). These results are consistent with R=0.64 and MRD % reported by Dammers et al. (2016) for this region using an older version of the IASI-NH3 product. The correlation is also similar to that of Tournadre et al. (2020), who obtained R=0.79, when comparing IASI-NH3 to FTIR-NH3 columns using a similar instrument (Vertex 80) in Paris, and to the R=0.80 and MRD % reported for 547 coincidences from several ground-based FTIR stations and IASI-NH3 (Dammers et al., 2016). The ANNI-NH3-v3 product is thus in agreement with the ground-based data and even presents an improved correlation compared to the previous result. However, an underestimation in the IASI-NH3 total columns of approximately 32 % over Mexico City persists. Dammers et al. (2017), using an older version of the ANNI-NH3 product, attributed these differences to a combination of more randomly distributed error sources and large systematic errors, however these reasons need to be investigated further.
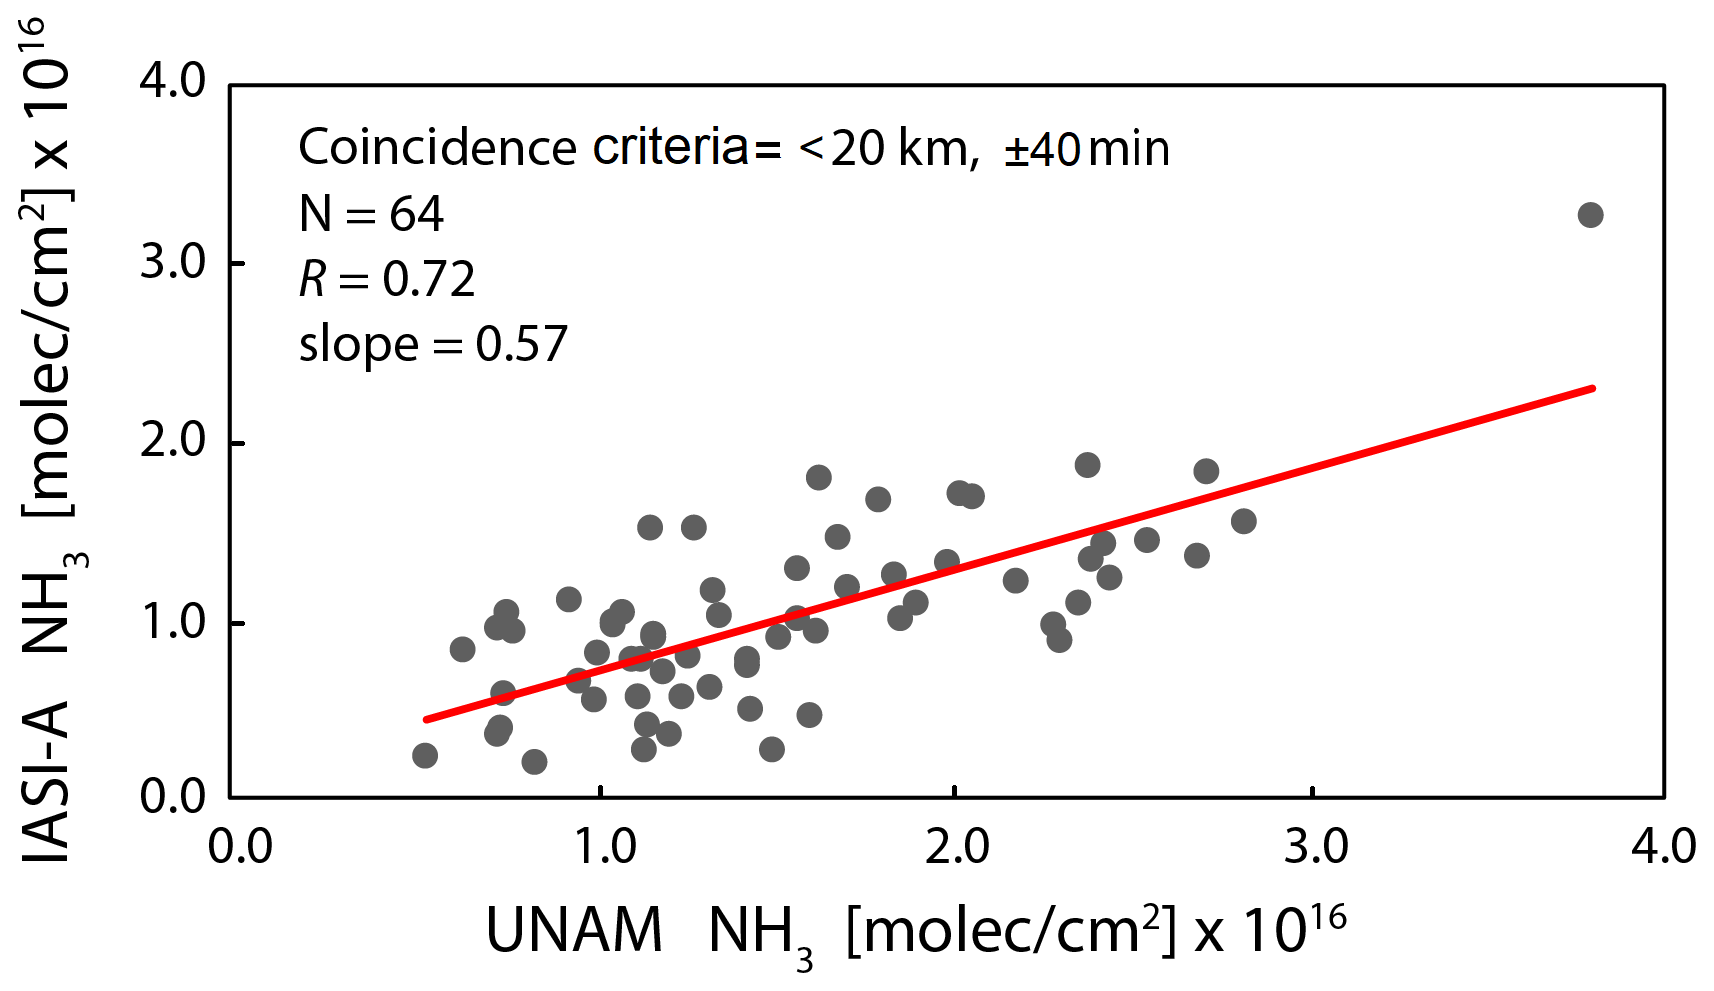
Figure 6Correlation plot for IASI-A NH3 vs. UNAM FTIR-NH3 total columns, with coincidence criteria of <20 km, ±40 min, elevation (FTIR station – IASI observation) <300 m, IASI-NH3 retrieval error <100 % between November 2013 and December 2018.
The spatial distribution of NH3 over MCMA as observed by IASI is presented in Fig. 7. The distribution shows a clear NH3 enhancement in the northeast section of Mexico City and in part of the Estado de México region. There are several potentially important sources located in this area: Mexico City International Airport, an area of continuous traffic emissions; the Bordo Poniente compost plant, which treats around 1500 t of daily organic waste from the city; wastewater discharge and treatment bodies with nearby bird colonies such as the regulation lagoon Cola de Pato; and the agricultural area at Texcoco. The combination of these factors, along with the high population density of this area, are likely to be cause of the NH3 enhancements observed in this part of the city. This enhancement is partially in agreement with the location of the larger NH3 emissions reported in the Mexico City Emissions Inventory (SEDEMA, 2018, 2021) shown in Fig. 1 in the northern part of the city, which is mainly associated with population activities and domestic animals' excreta. Figure 7d will be discussed in Sect. 3.3.
Figure 7a–c shows the variations of NH3 over the year, with the largest columns measured during the warm–dry season and to the northeast of UNAM. In contrast, the NH3 columns are reduced in the wet season when wet deposition can occur, and are smallest during the cold–dry season, when there are lower temperatures and less NH3 volatilization. To investigate the influence of local topography on the NH3 distribution, Fig. 8 compares the average IASI-NH3 total column spatial distribution (a) with altitude (b). The figure illustrates that the highest columns are located at the lowest altitudes while the lowest columns are at higher altitudes, reflecting the source locations and the boundary layer dynamics. The figure shows that the main NH3 sources in MCMA are located in the most urbanized areas in Mexico City and Estado de Mexico at an altitude of around 2250 m. These urban emissions agree with the statement of Li et al. (2020) that human NH3 emissions contribute significantly to the total NH3 emissions in hot and highly populated urban areas such as Mexico City. A rough estimation using 25 ∘C as an average diurnal temperature for Mexico City and the 0.4 mg of NH3 per hour at 25 ∘C from Li et al. (2020) resulted in an estimate of 34 t of NH3 per year, a contribution of the same order of magnitude as all the “point sources” and “urban waste” combined according to the Mexico City Emissions Inventory (SEDEMA, 2018, 2021).
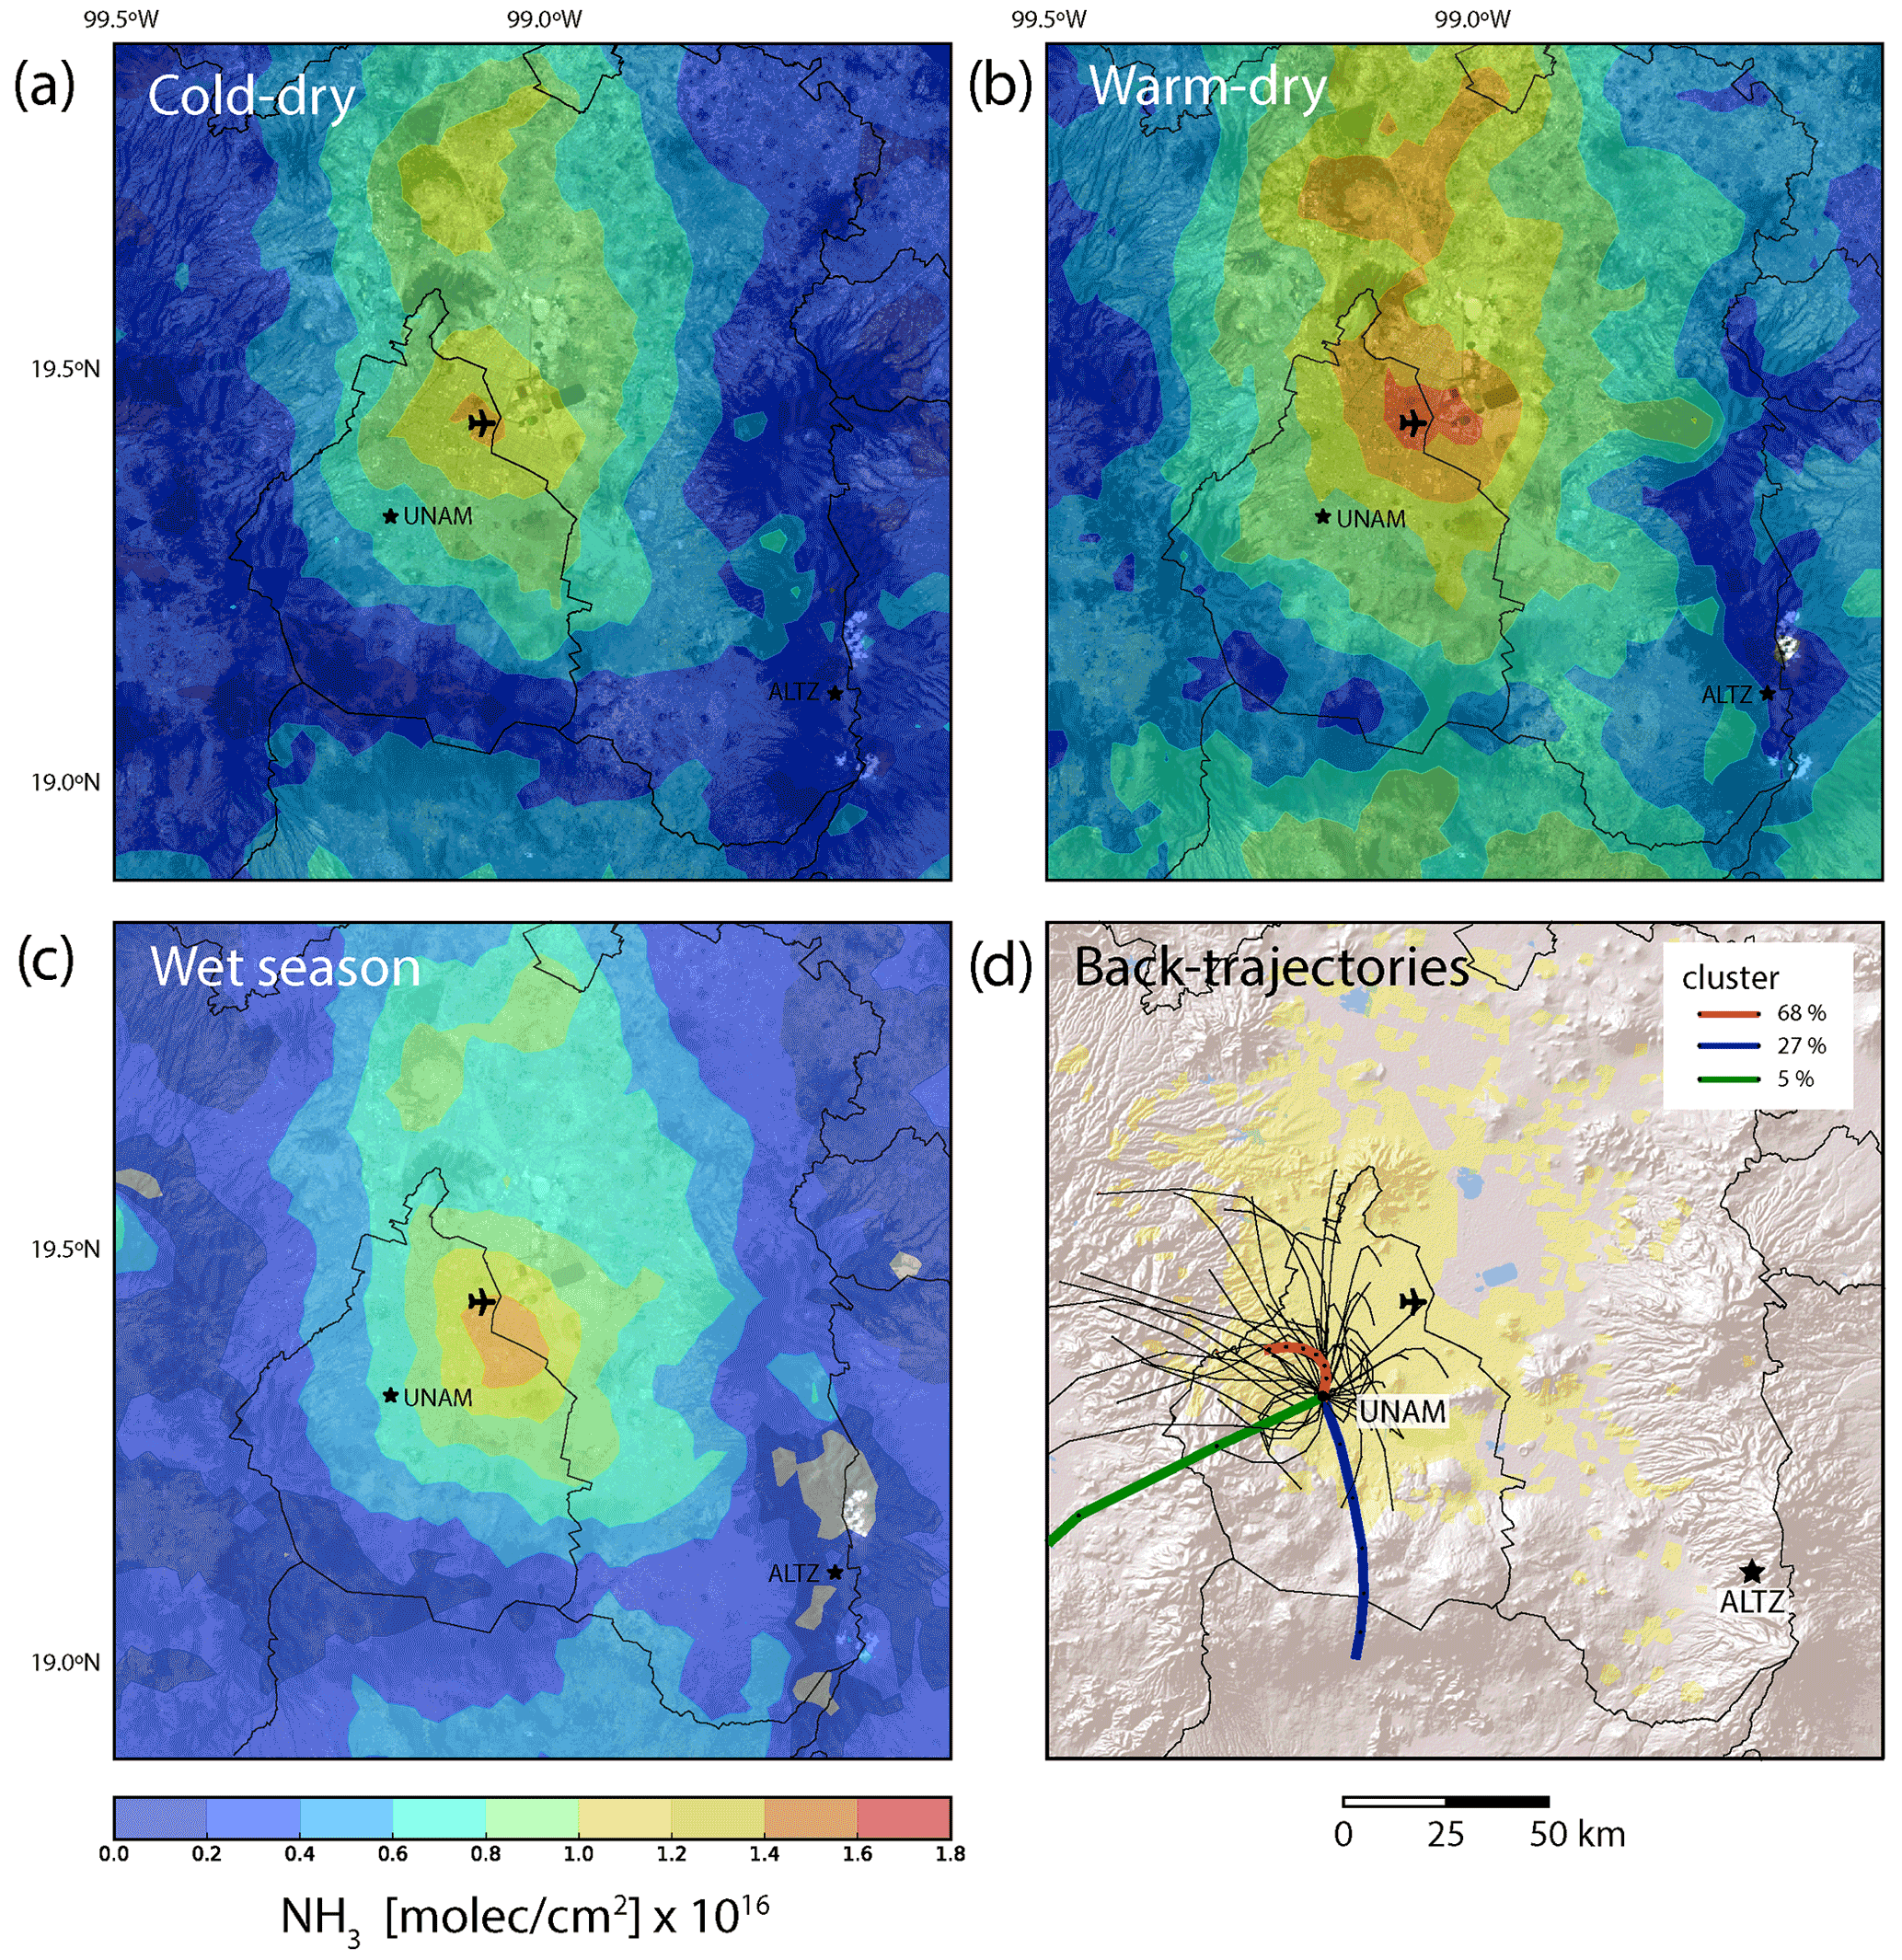
Figure 7Spatial distribution of IASI-A NH3 total columns for the morning overpass of MetOp-A over Mexico City, averaged over 2008–2018 for (a) the cold–dry season (November–February), (b) the warm–dry season (March–May), and (c) the wet season (June–October). HYSPLIT back-trajectories for the UNAM site are shown in panel (d). The black stars indicate the locations of both stations, and Mexico City International Airport is shown for reference.
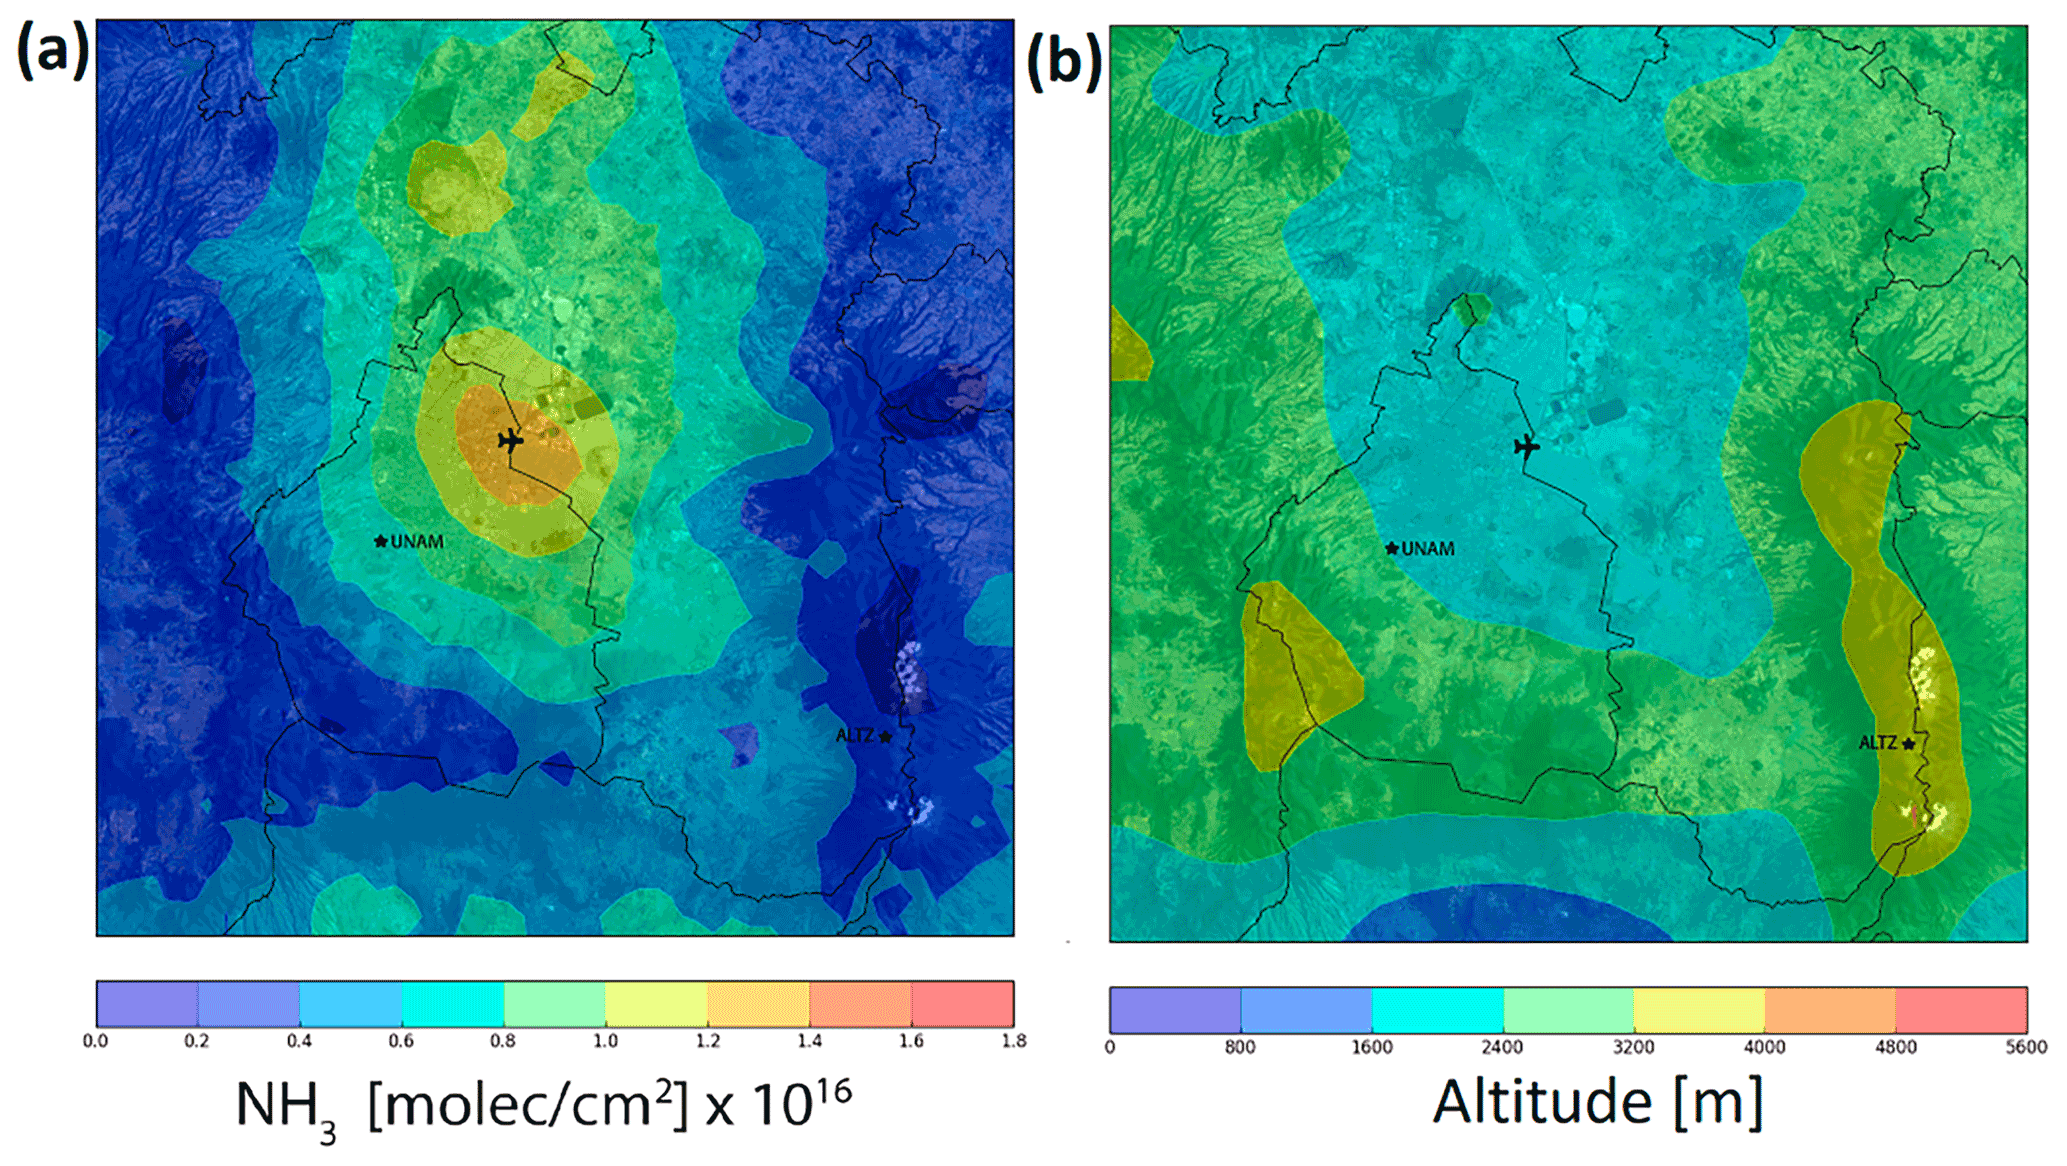
Figure 8Spatial distribution of (a) IASI-A NH3 total columns for the morning overpass of MetOp-A over Mexico City, averaged over 2008–2018 (b) altitudes in Mexico City from the Space Shuttle Radar Topography Mission Global product City (SRTMGL3, Farr et al., 2007). The black stars indicate the location of ground-based stations, and Mexico City International Airport is shown for reference.
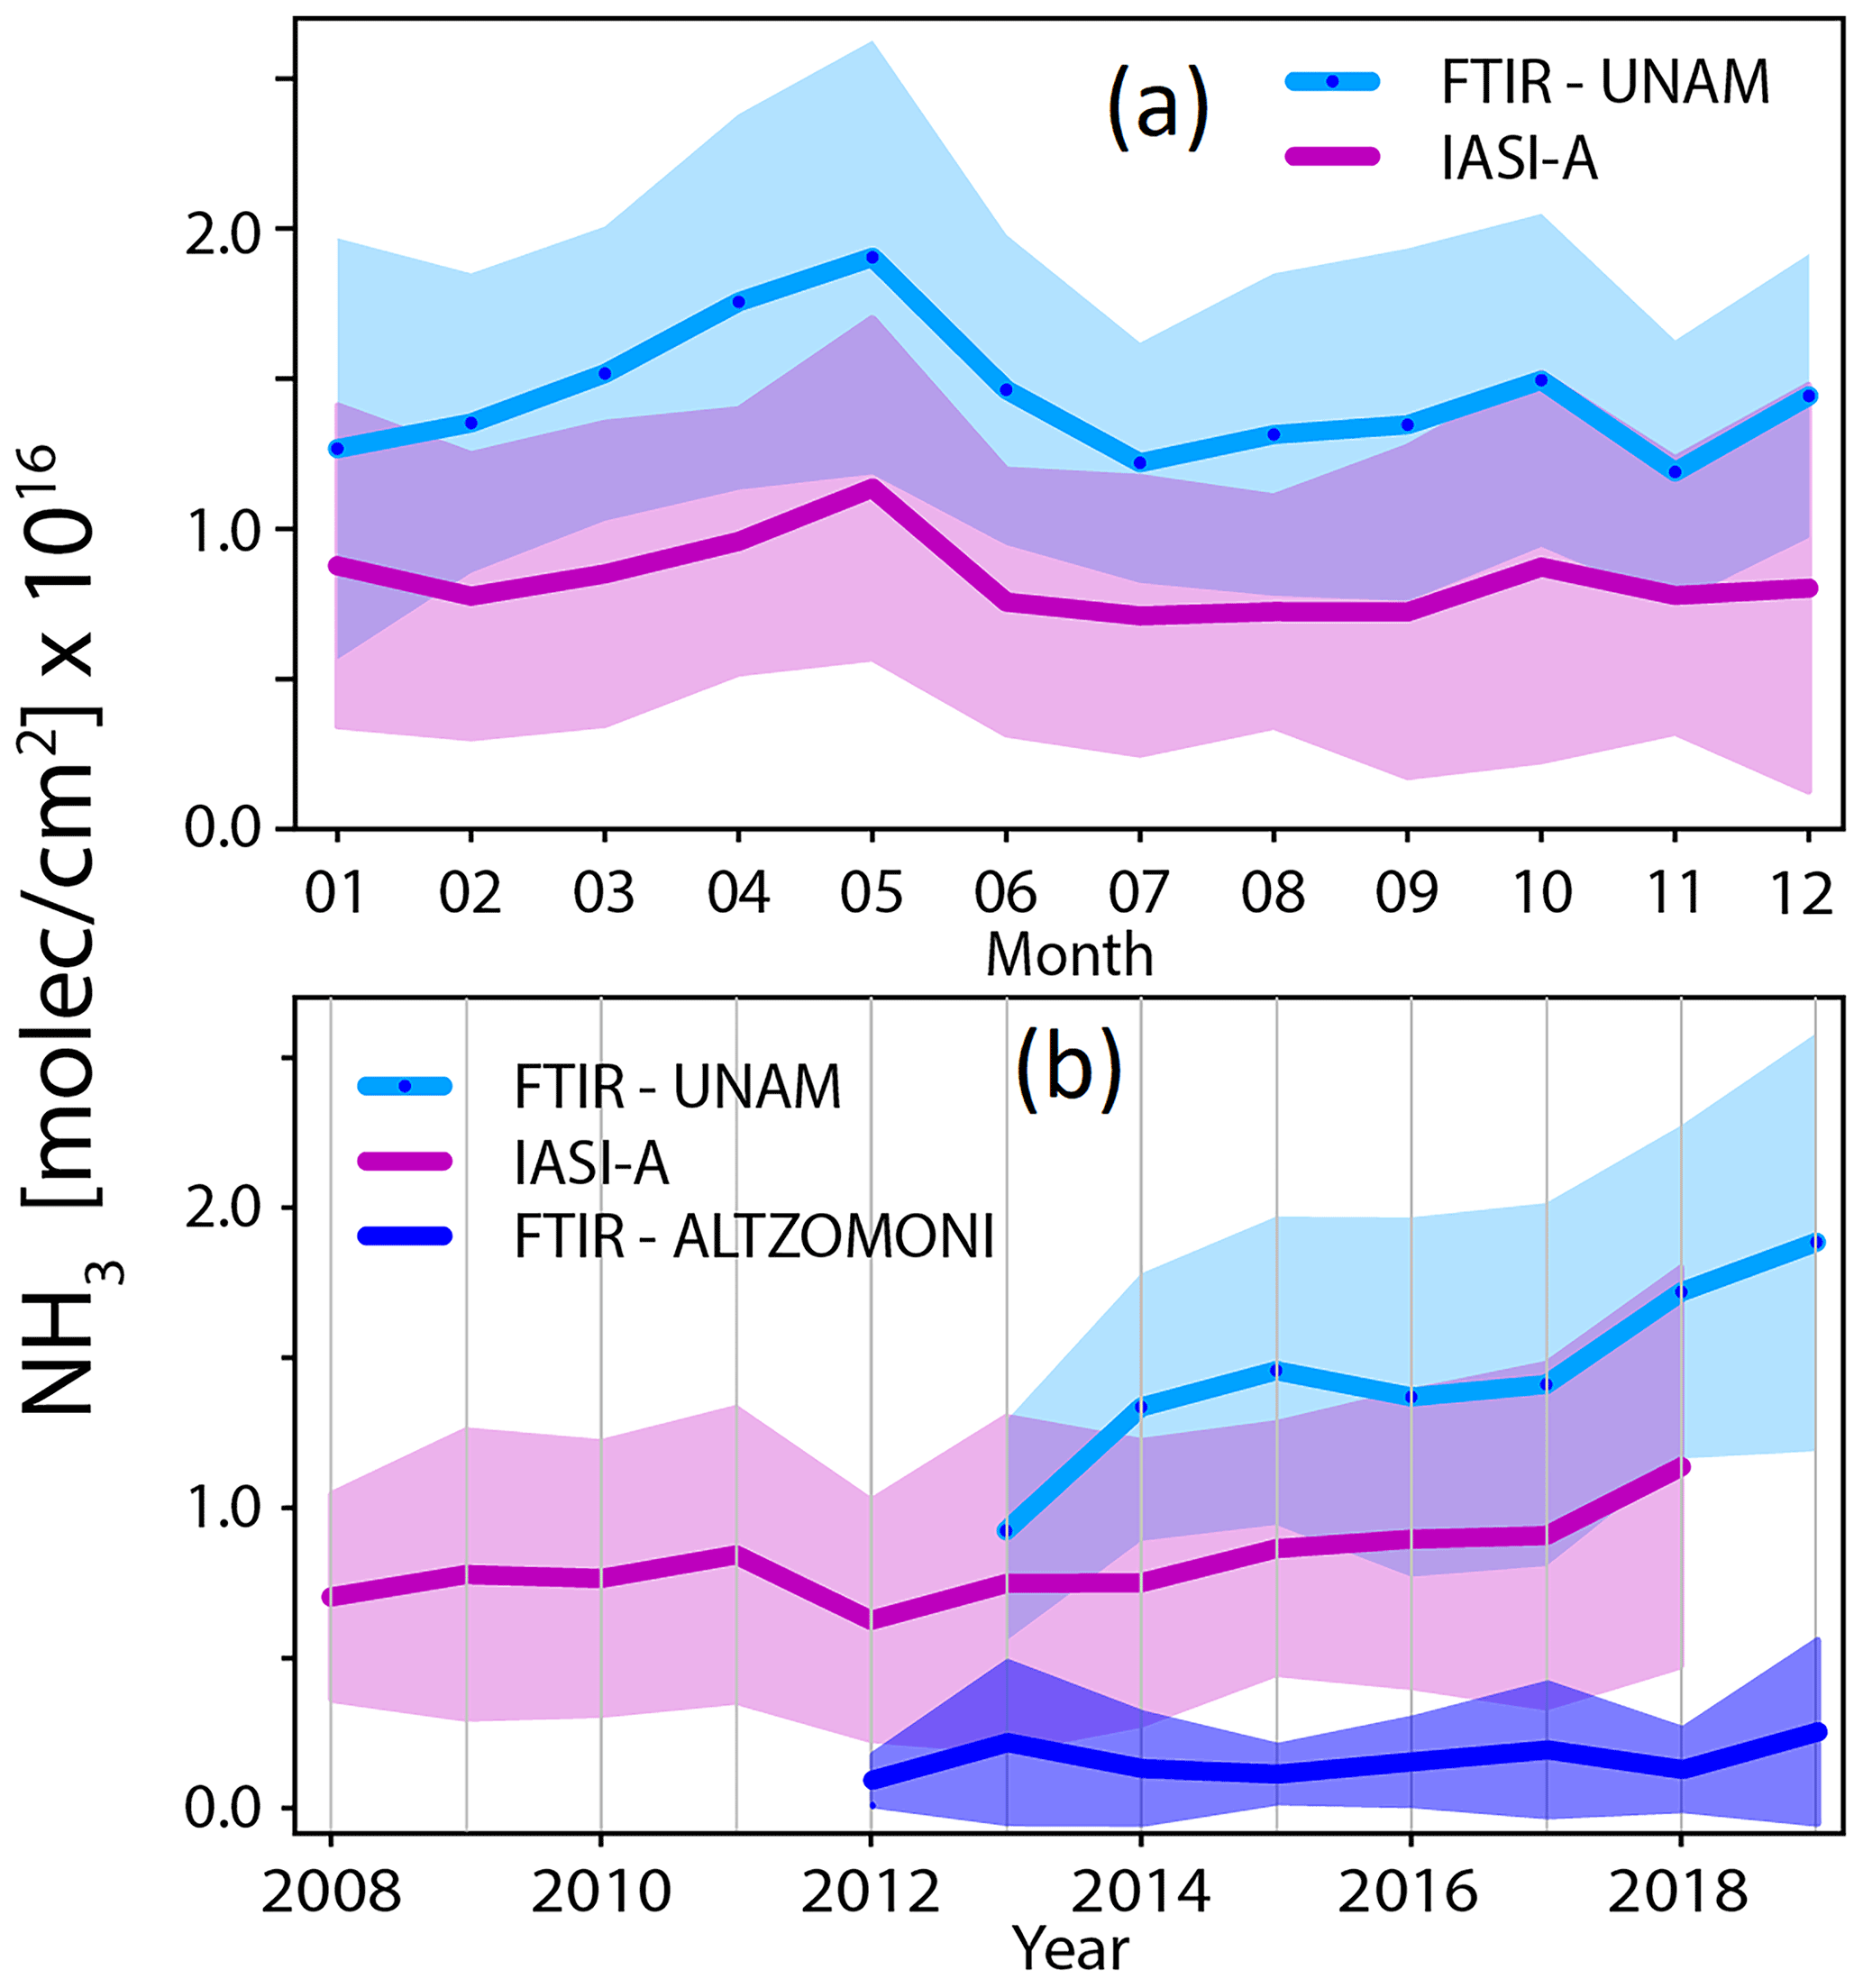
Figure 9IASI and FTIR NH3 total columns with coincidence criteria of <20 km and <2 h: (a) monthly averages at UNAM, (b) annual averages at UNAM and Altzomoni. The shaded area indicates ±1σ.
Comparisons between the seasonal and temporal variability of NH3 over the UNAM station in Mexico City were performed using morning (9–11 h) FTIR-NH3 columns and IASI-NH3 columns with a spatial criterion of <20 km from the UNAM station (Fig. 9a). The NH3 seasonal variability over Mexico City in Fig. 9a is similar for both the IASI and ground-based FTIR NH3 columns and is in agreement with Fig. 4. However, IASI-NH3 shows a consistent negative bias. The evolution with time is represented by the IASI-NH3 and FTIR-NH3 annual averages in Fig. 9b. The datasets suggest an increasing trend in the annual averages of the NH3 total columns, with larger columns observed in the most recent years, even in Altzomoni, except for 2013 which was affected by the 27 February event as discussed previously. The average annual increase of the IASI-NH3 columns between 2008 and 2018 (using the <20 km spatial criterion and the same Fourier fit as for the FTIR data) is molecules cm−2 yr−1 for Mexico City. This is a larger positive trend than that of molecules cm2 yr−1 reported by Van Damme et al. (2021) for all of Mexico over the same period, but lies between the values obtained for the remote and urban FTIR measurements.
3.3 Back-trajectory analysis and origin of observed NH3 in Mexico City
A cluster analysis was applied using 8 h back-trajectories 100 m above UNAM station to identify the main transport pathways for air masses arriving at this station that correspond to the highest average hourly NH3 total columns (Fig. 7d). The 100 m cluster was considered the most representative because NH3 is mostly concentrated near the surface. The TSV method was able to represent the primary trajectories at 100 m above UNAM with only three clusters. It was found that 68 % of the trajectories originate from the north (red line with black dots), 27 % from the west-southwest (green line), and 5 % from the south (blue line). However, the individual back-trajectories that comprise the red cluster (the thin black lines in Fig. 7d) indicate that most of the NH3 detected at UNAM comes from a variety of local sources and does not originate exclusively from NH3-enriched air masses transported from the enhancement region to the northeast observed in Fig. 7a–c. This is in agreement with Viatte et al. (2022). The relationship between the back-trajectories and measured NH3 columns can be explained by the fact that Mexico City is located in a basin; the wind fields are constricted in this basin and in general they are breeze winds (6 km h−1). Under these conditions, small locally distributed NH3 urban emissions seem to be the main cause of the high column values of this pollutant measured at the UNAM station, this agrees with Fig. 8 which shows that the main NH3 sources in MCMA seem to be urban.
This work presented the temporal and spatial distribution of NH3 total columns over the Mexico City metropolitan area derived from two ground-based FTIR spectrometers and IASI satellite observations. The average NH3 total column at the urban UNAM site ( molecules cm−2) is considerably higher than that at the remote station Altzomoni ( molecules cm−2), with a clear difference in the diurnal cycle but similar seasonal variability. NH3 spatial distribution from IASI shows the highest NH3 columns in the northeast part of the city, an area surrounded by water bodies, a landfill, a compost plant for the treatment of the organic waste, and the airport. The IASI ANNI-NH3-v3 data product underestimates the NH3 total columns over Mexico City, with a mean relative difference of 32 %, over the period 2008–2018 but showed a similar temporal variability and a good correlation with FTIR measurements (R=0.72). The analysis of back-trajectories for the largest NH3 enhancement events suggests that most of the NH3 measured at the urban station is coming from local sources. The NH3 observed at the remote site is most likely transported from the surroundings and it is influenced by biomass burning events. These results present evidence that sources other than from agriculture, such as motor vehicles, fires, human emissions, domestic animals, water discharge, and waste, have a significant contribution to the total NH3 budget in the city. In general, an average annual increase is observed in Mexico City from both ground-based stations ( molecules cm−2 yr−1 at UNAM, molecules cm−2 yr−1 at Altzomoni) and IASI ( molecules cm−2 yr−1). A complementary study using surface NH3 and PM concentrations from passive samplers and microsensors around this region is in progress. These observations, together with model data, will examine the role of reactive nitrogen in the pollution of Mexico City. A revaluation of NH3 emission sources contribution in the Mexico City inventory is suggested. Measures to mitigate NH3 emissions and reduce these positive trends are important, given that NH3 is closely linked to secondary aerosol formation and the deterioration of ecosystems.
The UNAM and Altzomoni FTIR data used in this study are available at https://doi.org/10.5281/zenodo.7199948 (Herrera et al., 2022). The meteorological data for both FTIR stations are available at https://www.ruoa.unam.mx/csv_data/unam/minuto.php (RUOA, 2022a) and https://www.ruoa.unam.mx/csv_data/altz/minuto.php (RUOA, 2022b). The IASI ANNI-NH3-v3 L2 data are freely available and can be accessed through the AERIS database at https://iasi.aeris-data.fr/NH3/ (AERIS, 2022). MODIS active fire snapshots are available at https://wvs.earthdata.nasa.gov/ (NASA, 2022). The code of the HYSPLIT model can be obtained from https://www.arl.noaa.gov/hysplit/getrun-hysplit/ (NOAA, 2022). Last access to all URLs: 14 October 2022.
BH is the main author of the paper, analysed the data, made most of the figures, and wrote the text. WS contributed to the data analysis. MG contributed to create some figures. AM contributed with the back-trajectory analysis. MG, KS, CR, FH, TB, CV, ED, LC, and MVD contributed to the paper writing and provided support. AB provided technical support. ED provided the Space Shuttle Radar Topography Mission Global product and support with the NH3 retrievals. LC and MVD developed the IASI-NH3 product. CV and MVD provided the IASI data. All authors reviewed the paper.
The contact author has declared that none of the authors has any competing interests.
Publisher's note: Copernicus Publications remains neutral with regard to jurisdictional claims in published maps and institutional affiliations.
We acknowledge the use of imagery from the Worldview Snapshots application (https://wvs.earthdata.nasa.gov, last access: 14 October 2022), part of the Earth Observing System Data and Information System (EOSDIS). Beatriz Herrera acknowledges CONACYT for the scholarship granted. The RUOA Network (https://www.ruoa.unam.mx, last access: 14 October 2022) is acknowledged for making the meteorological measurements available. IASI is a joint mission of EUMETSAT and the Centre National d'Etudes Spatiales (CNES, France). The authors acknowledge the ULB-LATMOS team for providing the IASI data and for the development of the retrieval algorithms. We thank Miguel Ángel Robles Roldan for building the solar tracker at UNAM and his technical assistance.
This research has been supported by the Consejo Nacional de Ciencia y Tecnología (CONACYT) (PhD grant no. 665043).
This paper was edited by Jayanarayanan Kuttippurath and reviewed by two anonymous referees.
AERIS: NH3 total column from IASI (Level 2), https://iasi.aeris-data.fr/NH3/, last access: 14 October 2022.
Bader, W., Bovy, B., Conway, S., Strong, K., Smale, D., Turner, A. J., Blumenstock, T., Boone, C., Collaud Coen, M., Coulon, A., Garcia, O., Griffith, D. W. T., Hase, F., Hausmann, P., Jones, N., Krummel, P., Murata, I., Morino, I., Nakajima, H., O'Doherty, S., Paton-Walsh, C., Robinson, J., Sandrin, R., Schneider, M., Servais, C., Sussmann, R., and Mahieu, E.: The recent increase of atmospheric methane from 10 years of ground-based NDACC FTIR observations since 2005, Atmos. Chem. Phys., 17, 2255–2277, https://doi.org/10.5194/acp-17-2255-2017, 2017.
Baumgardner, D., Grutter, M., Allan, J., Ochoa, C., Rappenglueck, B., Russell, L. M., and Arnott, P.: Physical and chemical properties of the regional mixed layer of Mexico's Megapolis, Atmos. Chem. Phys., 9, 5711–5727, https://doi.org/10.5194/acp-9-5711-2009, 2009.
Baylon, J. L., Stremme, W., Grutter, M., Hase, F., and Blumenstock, T.: Background CO2 levels and error analysis from ground-based solar absorption IR measurements in central Mexico, Atmos. Meas. Tech., 10, 2425–2434, https://doi.org/10.5194/amt-10-2425-2017, 2017.
Behera, S. N., Sharma, M., Aneja, V. P., and Balasubramanian, R.: Ammonia in the atmosphere: A review on emission sources, atmospheric chemistry and deposition on terrestrial bodies, Environ. Sci. Pollut. R., 20, 8092–8131, https://doi.org/10.1007/s11356-013-2051-9, 2013.
Bezanilla, A., Krüger, A., Stremme, W., and Grutter, M.: Solar absorption infrared spectroscopic measurements over Mexico City: Methane enhancements, Atmósfera, 27, 173–183, https://doi.org/10.1016/S0187-6236(14)71108-7, 2014.
Bouwman, A F, Lee, D. S., Asman, W. A. H., Dentener, F. J., Van Der Hoek, K. W., and Olivier, J. G. J.: A global high-resolution emission inventory for ammonia, Global Biogeochem. Cy., 11, 561–587, 1997.
Cady-Pereira, K. E., Payne, V. H., Neu, J. L., Bowman, K. W., Miyazaki, K., Marais, E. A., Kulawik, S., Tzompa-Sosa, Z. A., and Hegarty, J. D.: Seasonal and spatial changes in trace gases over megacities from Aura TES observations: two case studies, Atmos. Chem. Phys., 17, 9379–9398, https://doi.org/10.5194/acp-17-9379-2017, 2017.
CENAPRED Centro Nacional de prevención de Desastres: Incendios Forestales, http://www.cenapred.gob.mx/es/Publicaciones/archivos/159-FASCCULOINCENDIOSFORESTALES.PDF (last access: 21 October 2022), 2021.
Christian, T. J., Yokelson, R. J., Cárdenas, B., Molina, L. T., Engling, G., and Hsu, S.-C.: Trace gas and particle emissions from domestic and industrial biofuel use and garbage burning in central Mexico, Atmos. Chem. Phys., 10, 565–584, https://doi.org/10.5194/acp-10-565-2010, 2010.
Clarisse, L., Clerbaux, C., Dentener, F., Hurtmans, D., and Coheur, P. F.: Global ammonia distribution derived from infrared satellite observations, Nat. Geosci., 2, 479–483, https://doi.org/10.1038/ngeo551, 2009.
Clarisse, L., Shephard, M. W., Dentener, F., Hurtmans, D., Cady-Pereira, K., Karagulian, F., Van Damme, M., Clerbaux, C., and Coheur, P. F.: Satellite monitoring of ammonia: A case study of the San Joaquin Valley, J. Geophys. Res.-Atmos., 115, 1–15, https://doi.org/10.1029/2009JD013291, 2010.
Clarisse, L., Van Damme, M., Clerbaux, C., and Coheur, P.-F.: Tracking down global NH3 point sources with wind-adjusted superresolution, Atmos. Meas. Tech., 12, 5457–5473, https://doi.org/10.5194/amt-12-5457-2019, 2019.
Clerbaux, C., Boynard, A., Clarisse, L., George, M., Hadji-Lazaro, J., Herbin, H., Hurtmans, D., Pommier, M., Razavi, A., Turquety, S., Wespes, C., and Coheur, P.-F.: Monitoring of atmospheric composition using the thermal infrared IASI/MetOp sounder, Atmos. Chem. Phys., 9, 6041–6054, https://doi.org/10.5194/acp-9-6041-2009, 2009.
Dammers, E., Vigouroux, C., Palm, M., Mahieu, E., Warneke, T., Smale, D., Langerock, B., Franco, B., Van Damme, M., Schaap, M., Notholt, J., and Erisman, J. W.: Retrieval of ammonia from ground-based FTIR solar spectra, Atmos. Chem. Phys., 15, 12789–12803, https://doi.org/10.5194/acp-15-12789-2015, 2015.
Dammers, E., Palm, M., Van Damme, M., Vigouroux, C., Smale, D., Conway, S., Toon, G. C., Jones, N., Nussbaumer, E., Warneke, T., Petri, C., Clarisse, L., Clerbaux, C., Hermans, C., Lutsch, E., Strong, K., Hannigan, J. W., Nakajima, H., Morino, I., Herrera, B., Stremme, W., Grutter, M., Schaap, M., Wichink Kruit, R. J., Notholt, J., Coheur, P.-F., and Erisman, J. W.: An evaluation of IASI-NH3 with ground-based Fourier transform infrared spectroscopy measurements, Atmos. Chem. Phys., 16, 10351–10368, https://doi.org/10.5194/acp-16-10351-2016, 2016.
Dammers, E., Shephard, M. W., Palm, M., Cady-Pereira, K., Capps, S., Lutsch, E., Strong, K., Hannigan, J. W., Ortega, I., Toon, G. C., Stremme, W., Grutter, M., Jones, N., Smale, D., Siemons, J., Hrpcek, K., Tremblay, D., Schaap, M., Notholt, J., and Erisman, J. W.: Validation of the CrIS fast physical NH3 retrieval with ground-based FTIR, Atmos. Meas. Tech., 10, 2645–2667, https://doi.org/10.5194/amt-10-2645-2017, 2017.
Dammers, E., McLinden, C. A., Griffin, D., Shephard, M. W., Van Der Graaf, S., Lutsch, E., Schaap, M., Gainairu-Matz, Y., Fioletov, V., Van Damme, M., Whitburn, S., Clarisse, L., Cady-Pereira, K., Clerbaux, C., Coheur, P. F., and Erisman, J. W.: NH3 emissions from large point sources derived from CrIS and IASI satellite observations, Atmos. Chem. Phys., 19, 12261–12293, https://doi.org/10.5194/acp-19-12261-2019, 2019.
De Mazière, M., Thompson, A. M., Kurylo, M. J., Wild, J. D., Bernhard, G., Blumenstock, T., Braathen, G. O., Hannigan, J. W., Lambert, J.-C., Leblanc, T., McGee, T. J., Nedoluha, G., Petropavlovskikh, I., Seckmeyer, G., Simon, P. C., Steinbrecht, W., and Strahan, S. E.: The Network for the Detection of Atmospheric Composition Change (NDACC): history, status and perspectives, Atmos. Chem. Phys., 18, 4935–4964, https://doi.org/10.5194/acp-18-4935-2018, 2018.
Draxler, R. R. and Hess, G. D.: Description of the HYSPLIT_4 modeling system. NOAA Tech. Memo. ERL ARL-224, NOAA Air Resources Laboratory, Silver Spring, MD, 24 pp., https://www.arl.noaa.gov/wp_arl/wp-content/uploads/documents/reports/arl-224.pdf (last access:21 October 2022), 1997.
Draxler, R. R., Stunder, B., Rolph, G., Stein, A., and Taylor, A.: HYSPLIT User's Guide. Silver Spring, Maryland, USA, NOAA Air Resources Laboratory, http://www.arl.noaa.gov/documents/reports/hysplit_user_guide.pdf (last access: 21 October 2022), 2021.
Evangeliou, N., Balkanski, Y., Eckhardt, S., Cozic, A., Van Damme, M., Coheur, P.-F., Clarisse, L., Shephard, M. W., Cady-Pereira, K. E., and Hauglustaine, D.: 10-year satellite-constrained fluxes of ammonia improve performance of chemistry transport models, Atmos. Chem. Phys., 21, 4431–4451, https://doi.org/10.5194/acp-21-4431-2021, 2021.
Eyring, V., Waugh, D. W., Bodeker, G. E., Cordero, E., Akiyoshi, H., Austin, J., Beagley, S. R., Boville, B. A., Braesicke, P., Brühl, C., Butchart, N., Chipperfield, M. P., Dameris, M., Deckert, R., Deushi, M., Frith, S. M., Garcia, R. R., Gettelman, A., Giorgetta, M. A., Kinnison, D. E., Mancini, E., Manzini, E., Marsh, D. R., Matthes, S., Nagashima, T., Newman, P. A., Nielsen, J. E., Pawson, S., Pitari, G., Plummer, D. A., Rozanov, E., Schraner, M., Scinocca, J. F., Semeniuk, K., Shepherd, T. G., Shibata, K., Steil, B., Stolarski, R. S., Tian, W., and Yoshiki, M.: Multimodel projections of stratospheric ozone in the 21st century, J. Geophys. Res.-Atmos., 112, D16303, https://doi.org/10.1029/2006JD008332, 2007.
Farr, T. G., Rosen, P. A., Caro, E., and Crippen, R.: The Shuttle Radar Topography Mission, Rev. Geophys., 45, RG2004, https://doi.org/10.1029/2005RG000183, 2007.
GACETA: LXIV/1PPO-56/86584, https://www.senado.gob.mx/64/gaceta_del_senado/documento/86584, last access: 2 September 2022.
Galloway, J. N., Dentener, F. J., Capone, D. G., Boyer, E. W., Howarth, R. W., Seitzinger, S. P., Asner, G. P., Cleveland, C. C., Green, P. A., Holland, E. A., Karl, D. M., Michaels, A. F., Porter, J. H., Townsend, A. R., and Vörösmarty, C. J.: Nitrogen cycles: past, present, and future, Biogeochemistry, 70, 153–226, https://doi.org/10.1007/s10533-004-0370-0, 2004.
Giannakis, E., Kushta, J., Bruggeman, A., and Lelieveld, J.: Costs and benefits of agricultural ammonia emission abatement options for compliance with European air quality regulations, Environ. Sci. Eur., 31, 93, https://doi.org/10.1186/s12302-019-0275-0, 2019.
Hase, F., Hannigan, J. W., Coffey, M. T., Goldman, A., Höpfner, M., Jones, N. B., Rinsland, C. P., and Wood, S. W.: Intercomparison of retrieval codes used for the analysis of high-resolution, ground-based FTIR measurements, J. Quant. Spectrosc. Ra., 87, 25–52, https://doi.org/10.1016/j.jqsrt.2003.12.008, 2004.
Herrera, B., Bezanilla, A., Blumenstock, T., Dammers, E., Hase, F., Clarisse, L., Magaldi, A., Rivera, C., Stremme, W., Strong, K., Viatte, C., Van Damme, M., and Grutter, M.: Replication data for Measurement report: Evolution and distribution of NH3 over Mexico City from ground-based and satellite infrared spectroscopic measurements, Zenodo [data set], https://doi.org/10.5281/zenodo.7199948, 2022.
Kotnala, G., Sharma, S. K., and Mandal, T. K.: Influence of Vehicular Emissions (NO, NO2, CO and NMHCs) on the Mixing Ratio of Atmospheric Ammonia (NH3) in Delhi, India, Arch. Environ. Con. Tox., 78, 79–85, https://doi.org/10.1007/s00244-019-00689-8, 2020.
Krupa, S. V.: Effects of atmospheric ammonia (NH3) on terrestrial vegetation: A review, Environ. Pollut., 124, 179–221, https://doi.org/10.1016/S0269-7491(02)00434-7, 2003.
Li, M., Weschler, C. J., Bekö, G., Wargocki, P., Lucic, G., and Williams, J.: Human Ammonia Emission Rates under Various Indoor Environmental Conditions, Environ. Sci. Technol., 54, 5419–5428, https://doi.org/10.1021/acs.est.0c00094, 2020.
Lutsch, E., Strong, K., Jones, D. B. A., Ortega, I., Hannigan, J. W., Dammers, E., Shephard, M. W., Morris, E., Murphy, K., Evans, M. J., Parrington, M., Whitburn, S., Van Damme, M., Clarisse, L., Coheur, P. F., Clerbaux, C., Croft, B., Martin, R. V., Pierce, J. R., and Fisher, J. A.: Unprecedented Atmospheric Ammonia Concentrations Detected in the High Arctic From the 2017 Canadian Wildfires, J. Geophys. Res.-Atmos., 124, 8178–8202, https://doi.org/10.1029/2019JD030419, 2019.
Marsh, D. R., Mills, M. J., Kinnison, D. E., Lamarque, J. F., Calvo, N., and Polvani, L. M.: Climate change from 1850 to 2005 simulated in CESM1(WACCM), J. Climate, 26, 7372–7391, https://doi.org/10.1175/JCLI-D-12-00558.1, 2013.
Molina, L. T., Lei, W., Zavala, M., Almanza, V., Garcia, A., Saide, P., and Mena-Carrasco, M.: Atmospheric Pollution: Experience from Mexico City and Santiago de Chile, in: Air Pollution Modeling and its Application XXVI, 127–138, https://doi.org/10.1007/978-3-030-22055-6_21, 2020.
Moya, M., Grutter, M., and Báez, A.: Diurnal variability of size-differentiated inorganic aerosols and their gas-phase precursors during January and February of 2003 near downtown Mexico City, Atmos. Environ., 38, 5651–5661, https://doi.org/10.1016/j.atmosenv.2004.05.045, 2004.
Nair, A. A. and Yu, F.: Quantification of Atmospheric Ammonia Concentrations: A Review of Its Measurement and Modeling, Atmosphere, 11, 1092, https://doi.org/10.3390/atmos11101092, 2020.
NASA: Worldview Snapshots, https://wvs.earthdata.nasa.gov/, last access: 14 October 2022.
NCEP NAM: National Centers for Environmental Prediction/National Weather Service/NOAA/U.S. Department of Commerce. NCEP North American Mesoscale (NAM) 12 km Analysis. Research Data Archive at the National Center for Atmospheric Research, Computational and Information Systems Laboratory [data set], https://doi.org/10.5065/G4RC-1N91, 2015.
Neirynck, J. and Ceulemans, R.: Bidirectional ammonia exchange above a mixed coniferous forest, Environ. Pollut., 154, 424–438, https://doi.org/10.1016/j.envpol.2007.11.030, 2008.
NOAA: Get & Run HYSPLIT, https://www.arl.noaa.gov/hysplit/getrun-hysplit/, last access: 14 October 2022.
Osada, K., Saito, S., Tsurumaru, H., and Hoshi, J.: Vehicular exhaust contributions to high NH3 and PM2.5 concentrations during winter in Tokyo, Japan, Atmos. Environ., 206, 218–224, https://doi.org/10.1016/j.atmosenv.2019.03.008, 2019.
Paulot, F. and Jacob, D. J.: Hidden cost of U.S. agricultural exports: Particulate matter from ammonia emissions, Environ. Sci. Technol., 48, 903–908, https://doi.org/10.1021/es4034793, 2014.
Plaza-Medina, E. F., Stremme, W., Bezanilla, A., Grutter, M., Schneider, M., Hase, F., and Blumenstock, T.: Ground-based remote sensing of O3 by high- and medium-resolution FTIR spectrometers over the Mexico City basin, Atmos. Meas. Tech., 10, 2703–2725, https://doi.org/10.5194/amt-10-2703-2017, 2017.
Red Universitaria de Observatorios Atmosféricos (RUOA): Datos de cada minuto para el observatorio atmosferico UNAM, https://www.ruoa.unam.mx/csv_data/unam/minuto.php, last access: 14 October 2022a.
Red Universitaria de Observatorios Atmosféricos (RUOA): Datos de cada minuto para el observatorio atmosferico Altzomoni, https://www.ruoa.unam.mx/csv_data/altz/minuto.php, last access: 14 October 2022b.
Reizer, M. and Orza, J. A. G.: Identification of PM10 air pollution origins at a rural background site, E3S Web Conf., 28, 1–7, https://doi.org/10.1051/e3sconf/20182801031, 2018.
Rothman, L. S., Gordon, I. E., Barbe, A., Benner, D. C., Bernath, P. F., Birk, M., Boudon, V., Brown, L. R., Campargue, A., Champion, J. P., Chance, K., Coudert, L. H., Dana, V., Devi, V. M., Fally, S., Flaud, J. M., Gamache, R. R., Goldman, A., Jacquemart, D., Kleiner, I., Lacome, N., Lafferty, W. J., Mandin, J. Y., Massie, S. T., Mikhailenko, S. N., Miller, C. E., Moazzen-Ahmadi, N., Naumenko, O. V., Nikitin, A. V., Orphal, J., Perevalov, V. I., Perrin, A., Predoi-Cross, A., Rinsland, C. P., Rotger, M., Šimečková, M., Smith, M. A. H., Sung, K., Tashkun, S. A., Tennyson, J., Toth, R. A., Vandaele, A. C., and Vander Auwera, J.: The HITRAN 2008 molecular spectroscopic database, J. Quant. Spectrosc. Ra., 110, 533–572, https://doi.org/10.1016/j.jqsrt.2009.02.013, 2009.
SEDEMA Secretaría del Medio Ambiente de la Ciudad de México: Inventario de Emisiones de la Ciudad de México 2016, Dirección General de Gestión de la Calidad del Aire, Dirección de Programas de Calidad del Aire e Inventario de Emisiones, Ciudad de México, http://www.aire.cdmx.gob.mx/descargas/publicaciones/flippingbook/inventario-emisiones-2016/mobile/inventario-emisiones-2016.pdf (last access: 21 October 2022), 2018.
SEDEMA Secretaría del Medio Ambiente de la Ciudad de México: Inventario de Emisiones de la Zona Metropolitana del Valle de México 2018, Dirección General de Gestión de la Calidad del Aire, Dirección de Proyectos de Calidad del Aire, Ciudad de México, http://www.aire.cdmx.gob.mx/descargas/publicaciones/flippingbook/memoria-inventario-emisiones-2018/memoria_inventario_emisiones_2018.pdf (last access: 21 October 2022), 2021.
Seinfeld, J. H. and Pandis, S. N.: Atmospheric Chemistry and Physics: From Air Pollution to Climate Change, 2nd Edn., John Wiley, New York, 2006.
Shephard, M. W. and Cady-Pereira, K. E.: Cross-track Infrared Sounder (CrIS) satellite observations of tropospheric ammonia, Atmos. Meas. Tech., 8, 1323–1336, https://doi.org/10.5194/amt-8-1323-2015, 2015.
Shephard, M. W., Cady-Pereira, K. E., Luo, M., Henze, D. K., Pinder, R. W., Walker, J. T., Rinsland, C. P., Bash, J. O., Zhu, L., Payne, V. H., and Clarisse, L.: TES ammonia retrieval strategy and global observations of the spatial and seasonal variability of ammonia, Atmos. Chem. Phys., 11, 10743–10763, https://doi.org/10.5194/acp-11-10743-2011, 2011.
Stein, A. F., Draxler, R. R., Rolph, G. D., Stunder, B. J. B., Cohen, M. D., and Ngan, F.: NOAA's HYSPLIT atmospheric transport and dispersion modeling system, B. Am. Meteorol. Soc., 96, 2059–2077, https://doi.org/10.1175/BAMS-D-14-00110.1, 2015.
Stremme, W., Grutter, M., Rivera, C., Bezanilla, A., Garcia, A. R., Ortega, I., George, M., Clerbaux, C., Coheur, P. F., Hurtmans, D., Hannigan, J. W., and Coffey, M. T.: Top-down estimation of carbon monoxide emissions from the Mexico Megacity based on FTIR measurements from ground and space, Atmos. Chem. Phys., 13, 1357–1376, https://doi.org/10.5194/acp-13-1357-2013, 2013.
Sun, K., Tao, L., Miller, D. J., Pan, D., Golston, L. M., Zondlo, M. A., Griffin, R. J., Wallace, H. W., Leong, Y. J., Yang, M. M., Zhang, Y., Mauzerall, D. L., and Zhu, T.: Vehicle Emissions as an Important Urban Ammonia Source in the United States and China, Environ. Sci. Technol., 51, 2472–2481, https://doi.org/10.1021/acs.est.6b02805, 2017.
Sutton, M. A., Erisman, J. W., Dentener, F., and Möller, D.: Ammonia in the environment: From ancient times to the present, Environ. Pollut., 156, 583–604, https://doi.org/10.1016/j.envpol.2008.03.013, 2008.
Sutton, M. A., Reis, S., Riddick, S. N., Dragosits, U., Nemitz, E., Theobald, M. R., Tang, Y. S., Braban, C. F., Vieno, M., Dore, A. J., Mitchell, R. F., Wanless, S., Daunt, F., Fowler, D., Blackall, T. D., Milford, C., Flechard, C. R., Loubet, B., Massad, R., Cellier, P., Personne, E., Coheur, P. F., Clarisse, L., Van Damme, M., Ngadi, Y., Clerbaux, C., Skjøth, C. A., Geels, C., Hertel, O., Kruit, R. J. W., Pinder, R. W., Bash, J. O., Walker, J. T., Simpson, D., Horváth, L., Misselbrook, T. H., Bleeker, A., Dentener, F., and de Vries, W.: Towards a climate-dependent paradigm of ammonia emission and deposition, Philos. T. Roy. Soc. B, 368, 20130166, https://doi.org/10.1098/rstb.2013.0166, 2013.
Tournadre, B., Chelin, P., Ray, M., Cuesta, J., Kutzner, R. D., Landsheere, X., Fortems-Cheiney, A., Flaud, J.-M., Hase, F., Blumenstock, T., Orphal, J., Viatte, C., and Camy-Peyret, C.: Atmospheric ammonia (NH3) over the Paris megacity: 9 years of total column observations from ground-based infrared remote sensing, Atmos. Meas. Tech., 13, 3923–3937, https://doi.org/10.5194/amt-13-3923-2020, 2020.
United Nations: The World 's Cities in 2018, World's Cities 2018 – Data Bookl. (ST/ESA/ SER.A/417), 34, https://www.un.org/en/development/desa/population/publications/pdf/urbanization/the_worlds_cities_in_2018_data_booklet.pdf (last access: 21 October 2022), 2018.
Van Damme, M., Wichink Kruit, R. J., Schaap, M., Clarisse, L., Clerbaux, C., Coheur, P. F., Dammers, E., Dolman, A. J., and Erisman, J. W.: Evaluating 4 years of atmospheric ammonia (NH3) over Europe using IASI satellite observations and LOTOS-EUROS model results, J. Geophys. Res., 119, 9549–9566, https://doi.org/10.1002/2014JD021911, 2014.
Van Damme, M., Erisman, J. W., Clarisse, L., Dammers, E., Whitburn, S., Clerbaux, C., Dolman, A. J., and Coheur, P.: Worldwide spatiotemporal atmospheric ammonia (NH3), Geophys. Res. Lett., 42, 1–9, https://doi.org/10.1002/2015GL065496, 2015.
Van Damme, M., Whitburn, S., Clarisse, L., Clerbaux, C., Hurtmans, D., and Coheur, P. F.: Version 2 of the IASI NH3 neural network retrieval algorithm: Near-real-time and reanalysed datasets, Atmos. Meas. Tech., 10, 4905–4914, https://doi.org/10.5194/amt-10-4905-2017, 2017.
Van Damme, M., Clarisse, L., Franco, B., Sutton, M. A., Erisman, J. W., Wichink Kruit, R., Van Zanten, M., Whitburn, S., Hadji-Lazaro, J., Hurtmans, D., Clerbaux, C., and Coheur, P. F.: Global, regional and national trends of atmospheric ammonia derived from a decadal (2008–2018) satellite record, Environ. Res. Lett., 16, 055017, https://doi.org/10.1088/1748-9326/abd5e0, 2021.
Viatte, C., Abeed, R., Yamanouchi, S., Porter, W., Safieddine, S., Van Damme, M., Clarisse, L., Herrera, B., Grutter, M., Coheur, P.-F., Strong, K., and Clerbaux, C.: NH3 spatio-temporal variability over Paris, Mexico and Toronto and its link to PM2.5 during pollution events, EGUsphere [preprint], https://doi.org/10.5194/egusphere-2022-413, 2022.
Ward, J: Hierarchical Grouping to Optimize an Objective Function, J. Am. Stat. Assoc., 58, 236–244, https://doi.org/10.1080/01621459.1963.10500845, 1963.
Whitburn, S., Van Damme, M., Clarisse, L., Bauduin, S., Heald, C. L., Hadji-Lazaro, J., Hurtmans, D., Zondlo, M. A., Clerbaux, C., and Coheur, P. F.: A flexible and robust neural network IASI-NH3 retrieval algorithm, J. Geophys. Res., 121, 6581–6599, https://doi.org/10.1002/2016JD024828, 2016.
Yamanouchi, S., Viatte, C., Strong, K., Lutsch, E., Jones, D. B. A., Clerbaux, C., Van Damme, M., Clarisse, L., and Coheur, P.-F.: Multiscale observations of NH3 around Toronto, Canada, Atmos. Meas. Tech., 14, 905–921, https://doi.org/10.5194/amt-14-905-2021, 2021.
Yokelson, R. J., Urbanski, S. P., Atlas, E. L., Toohey, D. W., Alvarado, E. C., Crounse, J. D., Wennberg, P. O., Fisher, M. E., Wold, C. E., Campos, T. L., Adachi, K., Buseck, P. R., and Hao, W. M.: Emissions from forest fires near Mexico City, Atmos. Chem. Phys., 7, 5569–5584, https://doi.org/10.5194/acp-7-5569-2007, 2007.